Vellore - District Agricultural Plan Wrapper Project team Foreword
254
Vellore - District Agricultural Plan Wrapper Project team Foreword Preface Executive Summary Chapter I Chapter II Chapter III Chapter IV Chapter V Chapter VI Meeting Proceedings Photos
Transcript of Vellore - District Agricultural Plan Wrapper Project team Foreword
Vellore - District Agricultural Plan
Wrapper
Project team
Foreword
Preface
Executive Summary
Chapter I
Chapter II
Chapter III
Chapter IV
Chapter V
Chapter VI
Meeting Proceedings
Photos
NATIONAL AGRICULTURAL
DEVELOPMENT PROGRAMME (NADP)
DISTRICT AGRICULTURE PLAN
VELLORE DISTRICT
Centre for Agricultural and Rural Development Studies
(CARDS) Tamil Nadu Agricultural University
Coimbatore – 641 003
2008
NATIONAL AGRICULTURAL DEVELOPMENT PROJECT – DISTRICT AGRICULTURE PLAN
PROJECT TEAM
Overall Coordination : Dr.K.Palanisami, Director, CARDS and Nodal Officer (NADP)
Dr.R.Venkatram, Professor and Principal Coordinator (NADP)
District Level Coordination : Dr.K.Mani Professor Department of Agrl.Economics TNAU, Coimbatore
Dr.V.Ravichandran, Program Coordinator KVK, Virinjipuram
Dr.S.Kalaiarasan Professor (Entomology) KVK, Virinjipuram
Mr.Madhesan Joint Director of Agriculture Vellore
Tamil Nadu Agricultural University
Prof. C.RAMASAMY COIMBATORE-641 003 Vice-Chancellor TAMIL NADU
INDIA.
FOREWORD Date ...........................
The National Development Council resolved that Agricultural Development strategies must be reoriented to meet the needs of farmers and called upon the Central and State governments to evolve a strategy to rejuvenate agriculture with a commitment to achieve four per cent annual growth in the agricultural sector during the 11th
The task of preparing the District Agriculture Plan has been given to Tamil Nadu Agricultural University by Government of Tamil Nadu. Thus 29 Districts level Plans, excluding Chennai and Nilgris, were prepared by the Centre for Agricultural and Rural Development Studies, Tamil Nadu Agricultural University. Several meetings were held at TNAU during the last few months. Steering committee, district planning unit and plan finalizing team were putting their efforts in shaping up the District Agriculture Plans. All the District Collectors representing the 29 districts have actively participated in the sensitizing meeting organized by TNAU and officials of line departments in the respective districts. The plan documents have identified the major thrust areas in agriculture and allied sectors for achieving the envisioned growth in the district and also in Tamil Nadu state. I appreciate the team work of TNAU scientists and the officials from line departments for bringing out the valuable action plans for each district. I am sure that these plans would also lead to more fruitful exercises like formulation of State level plans and project proposals for funding through NADP.
plan. The council also recommended special Additional Central Assistance Scheme named National Agriculture Development Programme (NADP) be launched. To implement this, formulation of District level action plans is the pre-requisite and thus District Agriculture Plan of various districts in Tamil Nadu has been prepared with the financial assistance of Government of India.
I solicit the cooperation of the line department officials in implementing these action plans and commit to achieve a better growth in agriculture and allied sectors in each and every district of Tamil Nadu during the 11th plan.
(C. RAM AS AMY)
Coimbatore June 30, 2008
Tel : Off.:+91-422 2431788 • Res.:+91-422 2430887 • Fax:+91-422 2431672 Email : [email protected] / [email protected]
Dr. K. Palanisami Tamil Nadu Agricultural University Director, CARDS Coimbatore-3
PREFACE
The District Agriculture Plan is brought out based on the details provided by the line department
officials of the respective districts. The District Agriculture Plan thus identifies the problems, needed
interventions and the financial requirement for the developments in Agriculture and allied sectors of
Agriculture viz. Horticulture, Agricultural Engineering, Animal husbandry, Fisheries, Sericulture, Agricultural
marketing and Agricultural business and Public Works Department.. The Government sponsored various
on-going schemes and programmes in the development of agriculture have also been dovetailed in the
preparation of plan. Besides, the plan would also help in formulating the State Agriculture Plan and the
project proposals under Stream I and Stream II to be funded by Government of India for the remaining four
year plan periods viz. 2008-2012.
My sincere thanks to District Collectors of the respective districts in Tamil Nadu who have been
instrumental in providing the felt needs of the farmers and other stakeholders. The help and full cooperation
rendered by the line department officials in each district is highly appreciable. Without their assistances, the
formulation of the plan will be a mere academic exercise.
My sincere thanks to Shri. Surjit K. Chaudhary I.A.S., Agricultural Production Commissioner and
Principal Secretary to Government of Tamil Nadu who is instrumental in integrating the multi-level
functionaries and providing valuable guidance in bringing out this plan document.
My sincere thanks to Dr. C. Ramasamy, Vice-Chancellor, Dr. P. Santhana Krishnan, Registrar of
Tamil Nadu Agricultural University, for their full administrative and technical support without which the time
schedule in preparing the document could not have been adhered to. Special thanks to Dr.S. Natarajan,
Director, Soil and Crop Management Studies and Dr. E. Vadivel, Director of Extension Education, for their
sustained support in the preparation of the district plans. All the Principal Investigators of the NADP I Phase
projects also provided the needed inputs.
I take this opportunity to express my deep sense of gratitude to Commissioner of Agriculture,
Commissioner of Horticulture and Plantation crops, Chief Engineer (Agricultural Engineering), Executive
Director, Tamil Nadu Watershed Development Agency, Commissioner of Animal Husbandry and Veterinary
Services, Commissioner of Fisheries, Commissioner for Milk Production and Dairy Development,
Commissioner of Agricultural Marketing and Agri Business, Director of Seed Certification, and Director of
Sericulture for providing constructive support and guidance in preparing the document.
I also place on record my sincere thanks to Vice-Chancellor of TANUVAS and his colleagues for
providing the action plans for Animal Husbandry and Fisheries in Tamil Nadu.
Sincere thanks to Deans, Heads of Research Stations/KVK’s and scientists of TNAU representing
different districts and scientists of Directorate of CARDS for helping in collection of data, organising district
level workshops and group meetings with stakeholders and preparation of this document.
Date: 30.06.2008 K. Palanisami Director, CARDS & Nodal Officer (NADP)
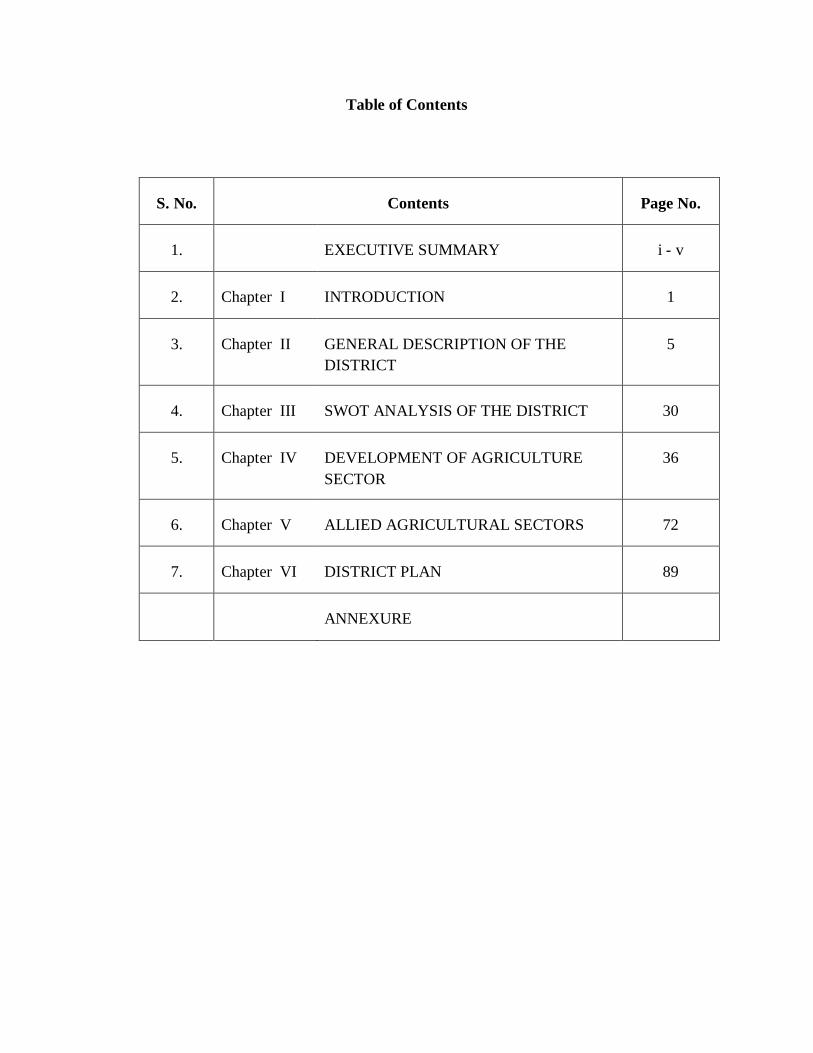
Table of Contents
S. No. Contents Page No.
1. EXECUTIVE SUMMARY i - v
2. Chapter I INTRODUCTION 1
3. Chapter II GENERAL DESCRIPTION OF THE DISTRICT
5
4. Chapter III SWOT ANALYSIS OF THE DISTRICT 30
5. Chapter IV DEVELOPMENT OF AGRICULTURE SECTOR
36
6. Chapter V ALLIED AGRICULTURAL SECTORS 72
7. Chapter VI DISTRICT PLAN 89
ANNEXURE
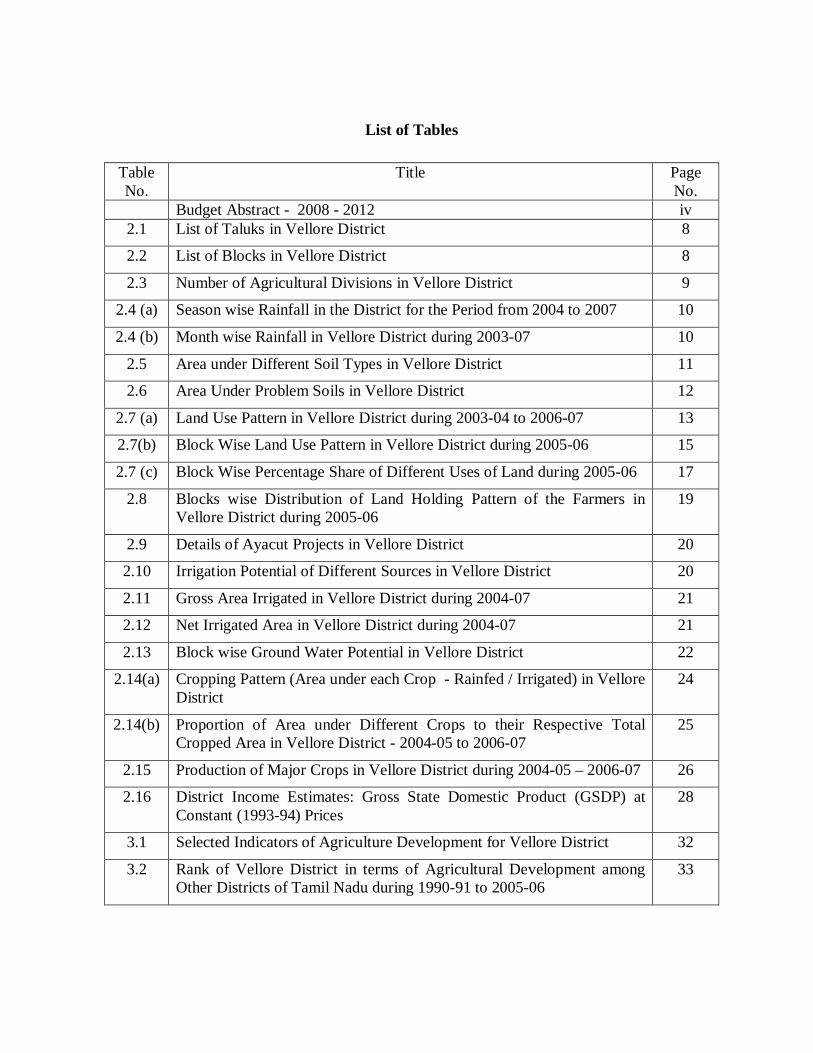
List of Tables
Table No.
Title Page No.
Budget Abstract - 2008 - 2012 iv 2.1 List of Taluks in Vellore District 8
2.2 List of Blocks in Vellore District 8
2.3 Number of Agricultural Divisions in Vellore District 9
2.4 (a) Season wise Rainfall in the District for the Period from 2004 to 2007 10
2.4 (b) Month wise Rainfall in Vellore District during 2003-07 10
2.5 Area under Different Soil Types in Vellore District 11
2.6 Area Under Problem Soils in Vellore District 12
2.7 (a) Land Use Pattern in Vellore District during 2003-04 to 2006-07 13
2.7(b) Block Wise Land Use Pattern in Vellore District during 2005-06 15
2.7 (c) Block Wise Percentage Share of Different Uses of Land during 2005-06 17
2.8 Blocks wise Distribution of Land Holding Pattern of the Farmers in Vellore District during 2005-06
19
2.9 Details of Ayacut Projects in Vellore District 20
2.10 Irrigation Potential of Different Sources in Vellore District 20
2.11 Gross Area Irrigated in Vellore District during 2004-07 21
2.12 Net Irrigated Area in Vellore District during 2004-07 21
2.13 Block wise Ground Water Potential in Vellore District 22
2.14(a) Cropping Pattern (Area under each Crop - Rainfed / Irrigated) in Vellore District
24
2.14(b) Proportion of Area under Different Crops to their Respective Total Cropped Area in Vellore District - 2004-05 to 2006-07
25
2.15 Production of Major Crops in Vellore District during 2004-05 – 2006-07 26
2.16 District Income Estimates: Gross State Domestic Product (GSDP) at Constant (1993-94) Prices
28
3.1 Selected Indicators of Agriculture Development for Vellore District 32
3.2 Rank of Vellore District in terms of Agricultural Development among Other Districts of Tamil Nadu during 1990-91 to 2005-06
33
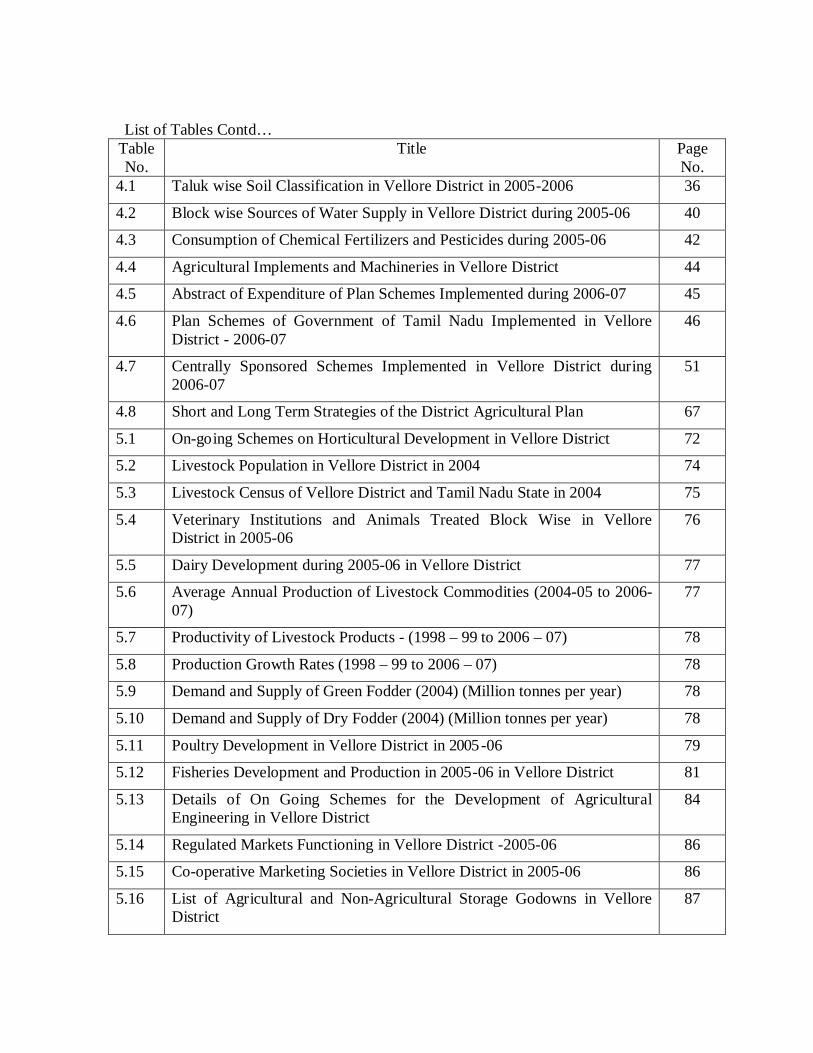
List of Tables Contd… Table No.
Title Page No.
4.1 Taluk wise Soil Classification in Vellore District in 2005-2006 36
4.2 Block wise Sources of Water Supply in Vellore District during 2005-06 40
4.3 Consumption of Chemical Fertilizers and Pesticides during 2005-06 42
4.4 Agricultural Implements and Machineries in Vellore District 44
4.5 Abstract of Expenditure of Plan Schemes Implemented during 2006-07 45
4.6 Plan Schemes of Government of Tamil Nadu Implemented in Vellore District - 2006-07
46
4.7 Centrally Sponsored Schemes Implemented in Vellore District during 2006-07
51
4.8 Short and Long Term Strategies of the District Agricultural Plan 67
5.1 On-going Schemes on Horticultural Development in Vellore District 72
5.2 Livestock Population in Vellore District in 2004 74
5.3 Livestock Census of Vellore District and Tamil Nadu State in 2004 75
5.4 Veterinary Institutions and Animals Treated Block Wise in Vellore District in 2005-06
76
5.5 Dairy Development during 2005-06 in Vellore District 77
5.6 Average Annual Production of Livestock Commodities (2004-05 to 2006-07)
77
5.7 Productivity of Livestock Products - (1998 – 99 to 2006 – 07) 78
5.8 Production Growth Rates (1998 – 99 to 2006 – 07) 78
5.9 Demand and Supply of Green Fodder (2004) (Million tonnes per year) 78
5.10 Demand and Supply of Dry Fodder (2004) (Million tonnes per year) 78
5.11 Poultry Development in Vellore District in 2005-06 79
5.12 Fisheries Development and Production in 2005-06 in Vellore District 81
5.13 Details of On Going Schemes for the Development of Agricultural Engineering in Vellore District
84
5.14 Regulated Markets Functioning in Vellore District -2005-06 86
5.15 Co-operative Marketing Societies in Vellore District in 2005-06 86
5.16 List of Agricultural and Non-Agricultural Storage Godowns in Vellore District
87
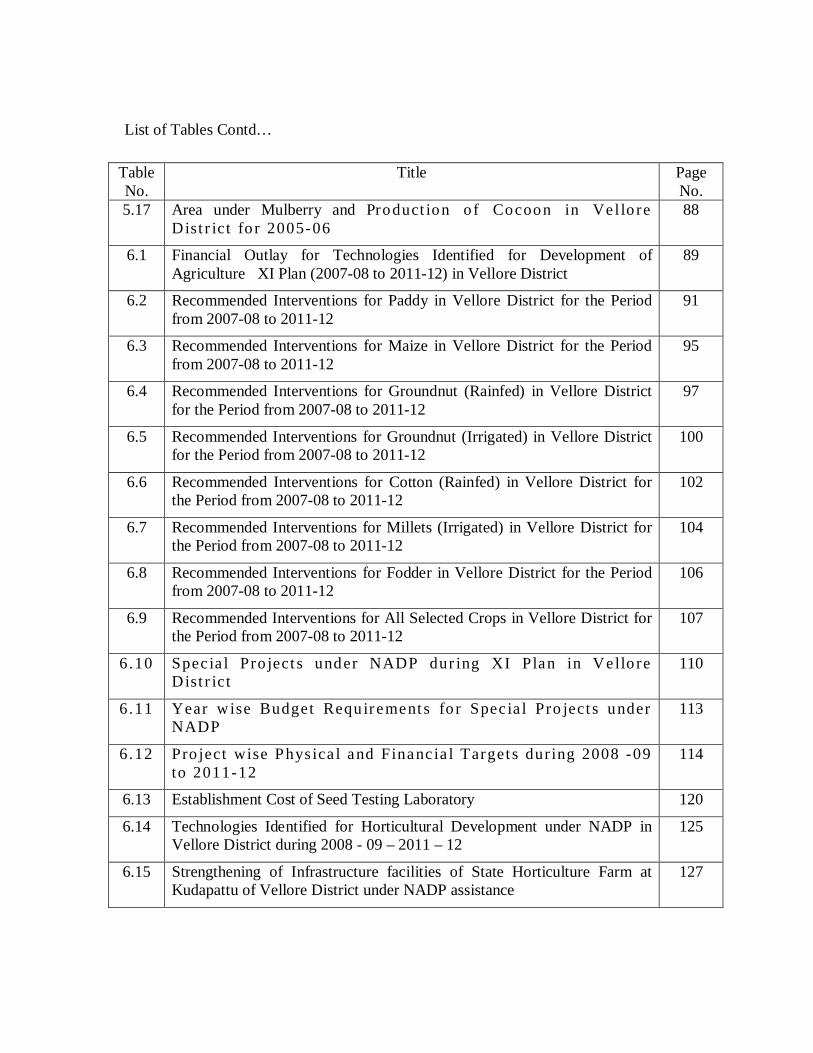
List of Tables Contd…
Table No.
Title Page No.
5.17 Area under Mulberry and Product ion o f Cocoon in Ve l lo re Dist r ict fo r 2005-06
88
6.1 Financial Outlay for Technologies Identified for Development of Agriculture XI Plan (2007-08 to 2011-12) in Vellore District
89
6.2 Recommended Interventions for Paddy in Vellore District for the Period from 2007-08 to 2011-12
91
6.3 Recommended Interventions for Maize in Vellore District for the Period from 2007-08 to 2011-12
95
6.4 Recommended Interventions for Groundnut (Rainfed) in Vellore District for the Period from 2007-08 to 2011-12
97
6.5 Recommended Interventions for Groundnut (Irrigated) in Vellore District for the Period from 2007-08 to 2011-12
100
6.6 Recommended Interventions for Cotton (Rainfed) in Vellore District for the Period from 2007-08 to 2011-12
102
6.7 Recommended Interventions for Millets (Irrigated) in Vellore District for the Period from 2007-08 to 2011-12
104
6.8 Recommended Interventions for Fodder in Vellore District for the Period from 2007-08 to 2011-12
106
6.9 Recommended Interventions for All Selected Crops in Vellore District for the Period from 2007-08 to 2011-12
107
6.10 Spec ia l Pro ject s under NADP dur ing XI Plan in Ve llo re Dist r ict
110
6.11 Year wise Budget Requ ir ement s fo r Spec ia l Pro ject s under NADP
113
6.12 Pro ject wise Phys ica l and Financ ia l Target s dur ing 2008 -09 to 2011-12
114
6.13 Establishment Cost of Seed Testing Laboratory 120
6.14 Technologies Identified for Horticultural Development under NADP in Vellore District during 2008 - 09 – 2011 – 12
125
6.15 Strengthening of Infrastructure facilities of State Horticulture Farm at Kudapattu of Vellore District under NADP assistance
127
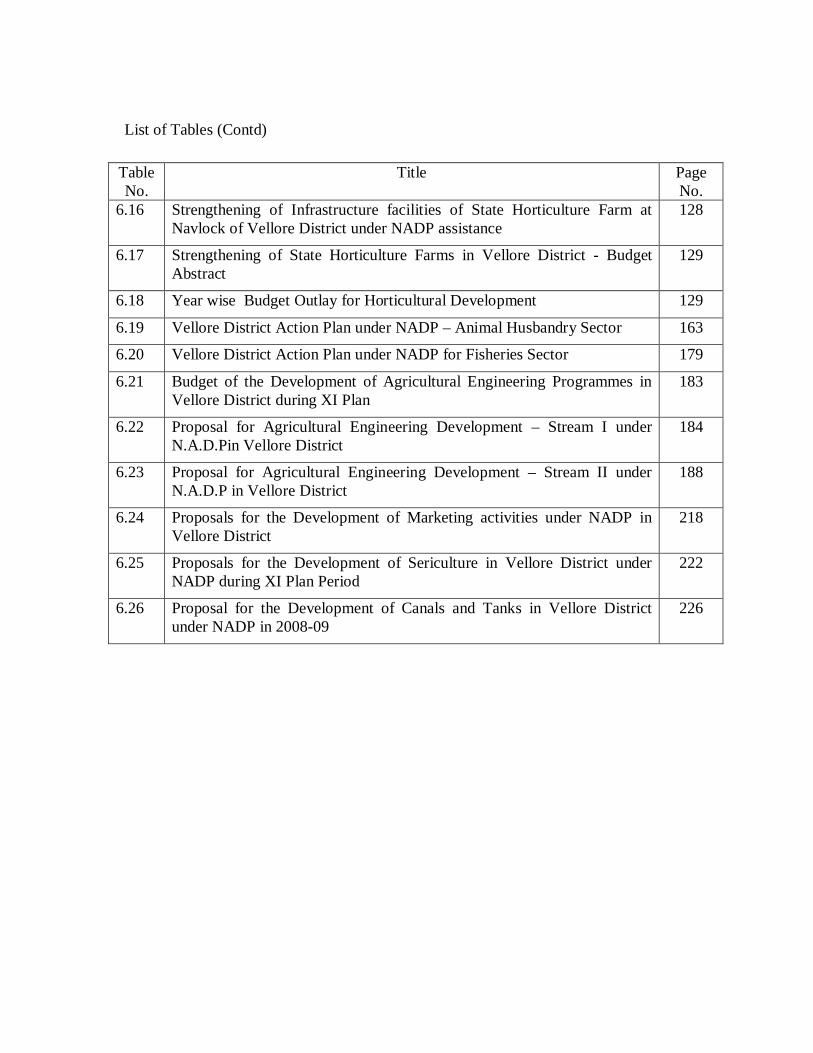
List of Tables (Contd)
Table No.
Title Page No.
6.16 Strengthening of Infrastructure facilities of State Horticulture Farm at Navlock of Vellore District under NADP assistance
128
6.17 Strengthening of State Horticulture Farms in Vellore District - Budget Abstract
129
6.18 Year wise Budget Outlay for Horticultural Development 129
6.19 Vellore District Action Plan under NADP – Animal Husbandry Sector 163
6.20 Vellore District Action Plan under NADP for Fisheries Sector 179
6.21 Budget of the Development of Agricultural Engineering Programmes in Vellore District during XI Plan
183
6.22 Proposal for Agricultural Engineering Development – Stream I under N.A.D.Pin Vellore District
184
6.23 Proposal for Agricultural Engineering Development – Stream II under N.A.D.P in Vellore District
188
6.24 Proposals for the Development of Marketing activities under NADP in Vellore District
218
6.25 Proposals for the Development of Sericulture in Vellore District under NADP during XI Plan Period
222
6.26 Proposal for the Development of Canals and Tanks in Vellore District under NADP in 2008-09
226
List Figures and Photographs
Figure. Title Page No.
2.1 Vellore District in Tamil Nadu State 6
2.2 Vellore District Map 6
4.1 Vellore Soil Map 37
Executive Summary i
EXECUTIVE SUMMARY
Concerned by the slow growth in the agriculture and allied sectors, the National
Development Council (NDC) resolved that a special Additional Central Assistance
Scheme, named National Agriculture Development Programme (NADP) or Rashtriya
Krishi Vikas Yojana (RKVY) be launched. To implement this, formulation of action
plans by means of developing District Agriculture Plans (DAP) is recommended.
Subsequently, a comprehensive State Agriculture Plan (SAP) would be prepared by
integrating these DAPs.
The major areas of focus were integrated development of major food crops like
paddy, coarse cereals, minor millets, pulses and oilseeds; Agriculture mechanization;
Strengthening of Market Infrastructure and Marketing Development; Activities relating
to enhancement of Horticultural Production and Popularization of Micro Irrigation
Systems; Sericulture Development; and Animal Husbandry and Fisheries Development
activities.
A meeting was held at Vellore to discuss the various components of the District
Agriculture Plan in the presence of line department officials and panchayat leaders. The
feedback received in the District Collector’s Meeting was incorporated before finalization
of the District Agriculture Plan.
District Agriculture Plan for Vellore District
Vellore district is located in northern part of Tamil Nadu and it fa l ls under t he
North East ern Agro Climat ic Zone o f Tamil Nadu. The district is bound on
the north by Karnataka State and Chithoor district of Andhra Pradesh State, on the east by
Thiruvallur and Kancheepuram districts, on the south by Thiruvannamalai district and on
the west by Krishnagiri district. There were eight taluks and 20 blocks. Also, there were
seven agricultural divisions in the district.
Executive Summary ii
Average rainfall in Vellore district (967.3 mm) during 2007 was slightly lesser
than the normal rainfall. Almost one – fifth of the total geographical area (19 per cent)
was under problem soils in the district. The degraded and fallow lands like cultural waste,
and current and other fallow lands accounted for 21.7 per cent of the total geographical
area.
The cropping pattern in the district indicated that ground nut was the predominant
crop with 28.4 per cent of the total cropped area and it was followed by paddy (22.8 per
cent), red gram (7.2 per cent), sugar cane (5.9 per cent), ragi (5.8 per cent) in that order
during 2006-07. Food grains like cereals and pulses together accounted for 64 per cent of
the total cropped area.
As regards animal husbandry, five per cent of the cattle and buffalo population of
the State was in the district. Sheep and goat population in Vellore district accounted for
about four per cent of the sheep and goat population of the State. As Vellore district was
a land locked district, only inland fisheries development was taking place. Inland fish
catchments in the district accounted for 10 per cent of the State’s inland fish catchments.
Strategies to Achieve the Objectives of DAP for Vellore District
• Development of suitable technologies such as varietal improvement, input management supported by a strong institutional arrangements for the supply of inputs like seed, fertilizers, plant protection chemicals, credit, etc, price support system favourable to farmers and market infrastructure for major crops like paddy, sorghum, maize, red gram, sugarcane, ground nut, gingelly, banana, vegetables, cotton and fodder crops.
• Encouraging maize as an a lt ernat e crop fo r paddy through cont ract far ming.
• Development of minor irrigation with drip irrigation system. • Mechanization of farms with tractor operated – combined harvester, paddy
transplanter, ground nut decorticator, etc. • Strengthening water harvesting structures like farm ponds and check dams. • Reclamation of fallow and degraded lands. • Formation of Commodity Groups for major crops like ground nut, maize, coconut
and pulses.
Executive Summary iii
• Training and exposure visit to the farmers, traders, and other stakeholders on grading, post harvest technologies, value addition and market intelligence.
• Strengthening the extension machinery for effective dissemination of technology. • Establishment of food parks to create necessary infrastructure for value addition in
agricultural products. • Strengthening of rural markets with storage facilities. • Strengthening of farmers’ market with additional storage facilities. • Establishment of cool chains for better distribution of milk. • Establishment of cattle feed units. • Inland fisheries development in major tanks and reservoirs and • Development of sericulture.
District Agricultural Plan
In order to dovetail the components and magnitude of the ongoing schemes
implemented by the line departments in the proposed schemes under NADP, a brief
review of ongoing schemes was made. As far as agriculture was concerned, in Part I
scheme, schemes like Procurement of Paddy and Millet seeds, Pulses, Green manure
seeds, Biological Control in Groundnut and Coconut, Integrated Cotton Development,
Increasing the Production of Oilseeds, Production and distribution of Micro Nutrient
mixtures and Bio-fertilizers were taken up. Under Part II Schemes, schemes like
conducting Crop Cutting Experiment, kits for Block level, strengthening of six Pesticide
Testing Laboratories, Development of Infrastructure facilities in State Seed Farms, and
strengthening of infrastructure at government coconut nurseries were taken up. Under
centrally sponsored schemes, purchase of breeder seeds, subsidizing foundation and
certified seeds, conducting demonstration and farmers’ training, distribution of bio
fertilizers and bio control agents and Seed Village Programme were taken up. Totally, Rs.
4.70 crores worth of agricultural development programmes were taken up in the district
during 2006-07.
As regards Horticulture, Rs. 5.07 crores worth of developmental works were taken
up in Vellore district in 2006-07. Agricultural Engineering development works were
carried out to the tune of Rs. 4.03 crores in 2007-08.
Executive Summary iv
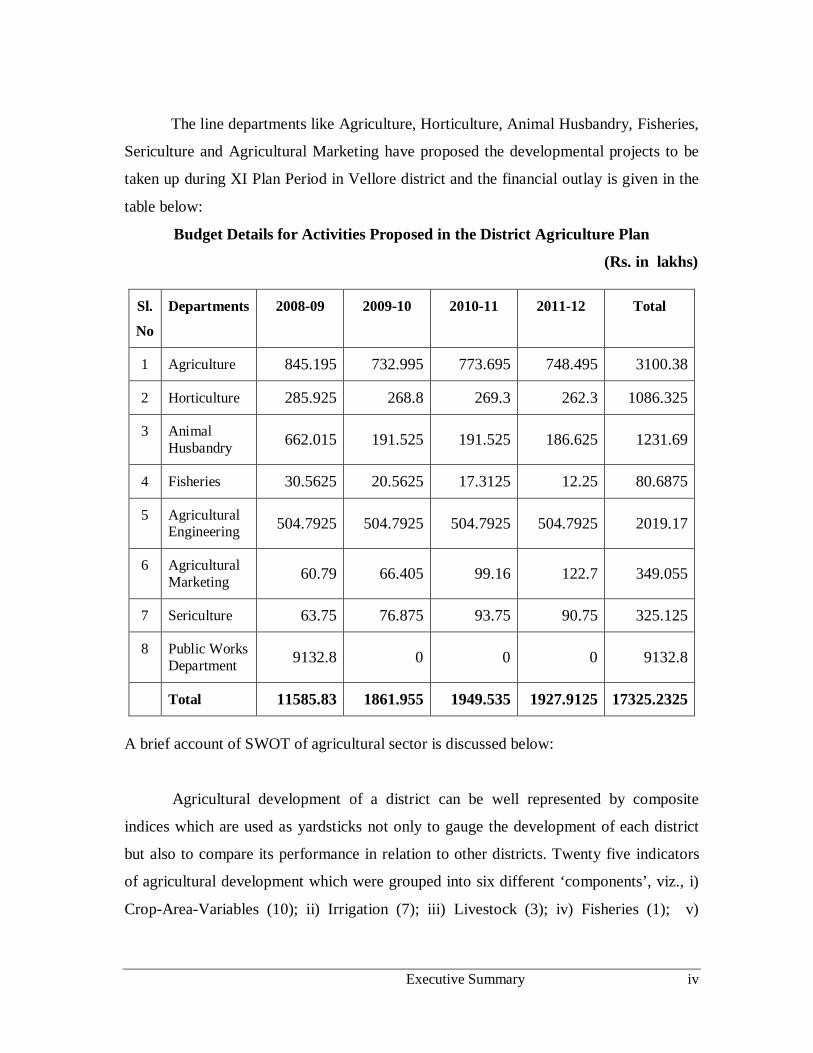
The line departments like Agriculture, Horticulture, Animal Husbandry, Fisheries,
Sericulture and Agricultural Marketing have proposed the developmental projects to be
taken up during XI Plan Period in Vellore district and the financial outlay is given in the
table below:
Budget Details for Activities Proposed in the District Agriculture Plan
(Rs. in lakhs)
Sl.
No
Departments 2008-09 2009-10 2010-11 2011-12 Total
1 Agriculture 845.195 732.995 773.695 748.495 3100.38
2 Horticulture 285.925 268.8 269.3 262.3 1086.325
3 Animal Husbandry 662.015 191.525 191.525 186.625 1231.69
4 Fisheries 30.5625 20.5625 17.3125 12.25 80.6875
5 Agricultural Engineering 504.7925 504.7925 504.7925 504.7925 2019.17
6 Agricultural Marketing 60.79 66.405 99.16 122.7 349.055
7 Sericulture 63.75 76.875 93.75 90.75 325.125
8 Public Works Department 9132.8 0 0 0 9132.8
Total 11585.83 1861.955 1949.535 1927.9125 17325.2325
A brief account of SWOT of agricultural sector is discussed below:
Agricultural development of a district can be well represented by composite
indices which are used as yardsticks not only to gauge the development of each district
but also to compare its performance in relation to other districts. Twenty five indicators
of agricultural development which were grouped into six different ‘components’, viz., i)
Crop-Area-Variables (10); ii) Irrigation (7); iii) Livestock (3); iv) Fisheries (1); v)
Executive Summary v
Fertilizer (3) and vi) Cultivators and Labourers (2) were used for estimating the
composite index of development for the district. The analysis showed that Vellore district
which was classified as ‘developing’ in agricultural development during 1990-91 became
‘developed’ in agriculture during 1995-96 to 2005-06. In terms of overall agricultural
development, its rank among the 29 districts of Tamil Nadu varied from 9 to 16 between
1990-91 and 2005-06.
Vellore, the Head-Quarters of Vellore District, is well connected by rail and bus
routes to major towns of the neighbouring states like Andhra Pradesh, Karnataka
and Kerala. A vast area under forest with a large number of sandalwood trees is there in
Javvadhu hills. As well irrigation is predominant in the district, a variety of agricultural
and horticultural crops are grown round the year. Vellore district is known for the
presence of leather and leather based industries.
Vellore district is a drought prone district with erratic and less than normal
rainfall recorded during the past several years. Most of the rivers in this district are dry
for years together, and the major irrigation tanks which are mostly system tanks which
are also dry for the most part of the year. This has resulted in over exploitation of ground
water through open wells and deep bore wells. The area under the waste and fallow lands
in the district also was around one – fifth of the total geographical area.
As there is a heavy demand for construction materials like sand and crushed stone
from Chennai, sand quarrying from Palar and stone quarrying are carried out in a large
scale in the district. As there is a heavy demand for fruits, vegetables and flowers from
the nearby Chennai city, farmers who cultivate these crops are much benefited. Surplus
milk produced in this district is also being transported daily to Chennai from Vellore
dairy unit.
Vellore District is very near to Chennai and Bangalore cities and this has resulted
in the large scale migration of farm labourers and in turn has resulted in a great demand
for agricultural labourers.
District Agriculture Plan – Vellore District 1
CHAPTER I
INTRODUCTION
Concerned by the slow growth in the agriculture and allied sectors, the National
Development Council (NDC) resolved that a special Additional Central Assistance
Scheme, named National Agriculture Development Programme (NADP) or Rashtriya
Krishi Vikas Yojana (RKVY) be launched. The NDC also felt that Agriculture
Development strategies must be reoriented to meet the needs of farmers and called upon
the Central and State governments to evolve a strategy to rejuvenate agriculture with a
commitment to achieve four per cent annual growth in the agricultural sector during the
11th plan. To implement this, formulation of action plans by means of developing
District Agriculture Plans (DAP) is recommended. It is of the view that such plans would
also reflect the felt needs of the farmers and stakeholders. Such District Agriculture Plans
aim at moving towards projecting the requirements for development of Agriculture and
allied sectors of the district including animal husbandry and fishery, minor irrigation
projects, rural development works, agricultural marketing schemes and schemes for water
harvesting and conservation, etc. keeping in view the natural resources and technological
possibilities in each district. These plans thus, present the vision for the development of
agriculture and allied sectors within the overall development perspective of the district
apart from the financial requirement and the sources of financing the agriculture
development plans in a comprehensive way.
Once the preparation of district level agriculture planning exercise is completed,
the operationalization of such plan is essential. This follows the preparation of a
comprehensive State Agricultural Plan (SAP) by integrating the above district level
agriculture plans. The DAP therefore could integrate multiple programmes that are in
operation in the district concerned, include the resources and activities indicated by the
state, combine the resources available from the other programmes and finalize the plan.
With this in mind, the District Agriculture Plan for each district of Tamil Nadu is
prepared.
District Agriculture Plan – Vellore District 2
Methodology Adopted for Preparation of District Agriculture Plan
The preparation of the District Agriculture Plan (DAP) is an elaborate, exhaustive
and iterative process and therefore every care is taken to ensure that the DAPs are
properly and comprehensively made. The task of preparing such District Agriculture
Plan is given to Tamil Nadu Agricultural University, Coimbatore. In coordination with
scientists from TANUVAS and officials from Department of Agriculture, Horticulture,
Agricultural Engineering, Marketing, Animal Husbandry and Fisheries, Seed
certification, PWD, etc. the task is fulfilled. In what follows, the procedure adopted to
prepare the plan is discussed.
Major Areas of Focus
(a) Integrated development of major food crops like paddy, coarse cereals, minor
millets, pulses and oilseeds;
(b) Agriculture mechanization;
(c) Activities related to enhancement of soil health;
(d) Development of rain fed farming systems in and outside watershed areas, as also
Integrated Development of Watershed Areas, Wastelands and River valleys;
(e) Integrated Pest Management schemes;
(f) Strengthening of Market Infrastructure and Marketing Development;
(g) Strengthening of Infrastructure to promote Extension Services;
(h) Activities relating to enhancement of horticultural production and popularization
of micro irrigation systems;
(i) Animal husbandry and fisheries development activities;
(j) Study tours of farmers;
(k) Organic and bio-fertilizers;
(l) Innovative schemes.
District Agriculture Plan – Vellore District 3
Collection of Data
The preparation of district level plan involved basically collection of base line and
bench mark details. So a template is developed to collect these particulars from the
different districts (29 districts) of Tamil Nadu. In order to dovetail the ongoing schemes,
with the action plans, the current ongoing agriculture programs were listed with their
physical and financial performance and finally converged as the plan under National
Agriculture Development Programme.
Formulation of District Planning Unit
To facilitate the involvement of local representatives in the preparation of plans,
planning units in each district was formulated. The composition of the district planning
units is as follows:
a) Deans of other campuses / Heads of Krishi Vigyan Kendra or Research Station in the respective district and one scientist from each campus
b) Co-ordinating staff from Directorate of Centre for Agricultural and Rural Development Studies to represent each district.
c) Officials of Line Departments from Agriculture, Horticulture, Agricultural Engineering, Marketing, Animal Husbandry and Fisheries, Seed certification, Public Works Department, etc.
With the coordination of members of the District Planning Unit, the tasks for the
preparation of District Agriculture Plan are fulfilled.
Sensitization Workshop
A series of Sensitization Workshop was conducted from 4.3.08 to 18.3.08 at
TNAU Campus. The TNAU Staff from Krishi Vigyan Kendras and Research Stations,
officials from line Departments viz., Agriculture, Horticulture, Agricultural Engineering
and Tamil Nadu Veterinary and Animal Sciences University attended the workshop.
Also, several meetings were held in Chennai for the National Agriculture Development
District Agriculture Plan – Vellore District 4
Programme under the Chairmanship of Agriculture Production Commissioner and
Secretary to Government of Tamil Nadu.
The objectives of National Agriculture Development Programme, preparation of
District Agriculture Plans, State Agriculture Plan and Formulation of Project proposals
under stream - I and stream - II were discussed in the workshop.
Preparation of Draft Action Plan and Presentation in District Collector’s Meeting
Based on the baseline information and proposals, draft action plan was prepared
and this was presented in the District Collector’s Meeting held on May 10, 2008 under
the chairmanship of the Project Officer, District Rural Development Agency, Vellore
District. This meeting was attended by the scientists from TNAU, officials from line
departments and the representatives of local bodies and wide coverage about this meeting
was given in the media also. Participants suggested several modifications in the draft plan
such as strengthening of storage facilities for fruits and vegetables, additional transport
facilities to transport fruits and vegetables to Chennai so as to reach Chennai at right
time, strengthening of weekly shandies and so on.
Finalization
A meeting was held at Vellore to discuss the various components of the District
Agriculture Plan in the presence of line department officials and panchayat leaders. The
feedback received in the District Collector’s Meeting was incorporated before finalization
of the District Agriculture Plan. The Strategic Research Extension Plan and Agriculture
Technology Management Agency reports were also reviewed and relevant details have
been incorporated in the draft report.
District Agriculture Plan – Vellore District 5
CHAPTER II
GENERAL DESCRIPTION OF VELLORE DISTRICT
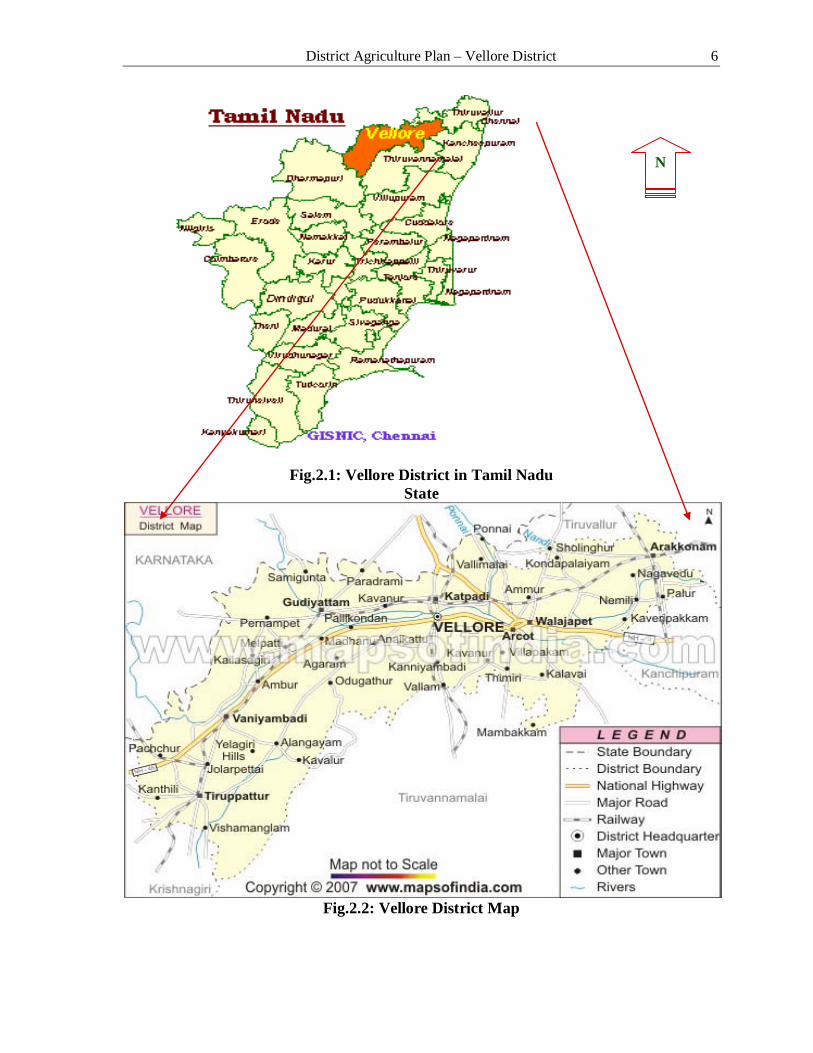
2.1.1 Map of the District
Vellore district is located in northern part of Tamil Nadu and it fa l ls under t he
North East ern Agro Climat ic Zone o f Tamil Nadu. The location of Vellore
district is depicted in the maps (Fig. 2.1 and Fig.2.2). The district is bound on the north by
Karnataka State and Chithoor district of Andhra Pradesh State, on the east by Thiruvallur
and Kancheepuram districts, on the south by Thiruvannamalai district and on the west by
Krishnagiri district.
2.1.2 General Statistics
The geographical area of this district is 5,920.18 sq. km. Agriculture is the major
activity in the district. However, industries like Bharat Heavy Electricals Limited, Ranipet,
Tamil Nadu Explosives Limited, Katpadi and so on have been set up. Besides, there had
been marked growth of small scale industries and tanneries in the district. There were
24,329 industrial units in the district, of which there were 2,448 metal and metal products
units, 1,004 tannery units, 818 food products units, 281 textile units, 130 machineries and
equipments units, 70 rubber products units and 66 chemical units. There were also 168
granite and stone quarrying units. Also, some of the handicrafts for which the Vellore
district is renowned, are still flourishing. Mats making in Walajapet, silk weaving in Arni
and the traditional art of pot making in Vellore and places around were some
of the handicrafts which successfully withstood challenges through ages.
Vellore district has a strong infrastructure with a road length of 2,984 kms. The
district has a railway net work with a broad gauge route length of 152.4 kms and 28 railway
stations.
2.1.3 Agriculture and Allied Activities
Paddy, sorghum, red gram, horse gram, ground nut, gingelly, sugarcane, cotton and
brinjal are the major crops grown in the district. There are two agricultural research stations
of Tamil Nadu Agricultural University at Virinjipuram and Melalathur.
District Agriculture Plan – Vellore District 6
Fig.2.1: Vellore District in Tamil Nadu
State
Fig.2.2: Vellore District Map
N
District Agriculture Plan – Vellore District 7
There is also one Agricultural College at Kalavai, one Veterinary University
Training and Research Centre at Vellore and one Kavaloor Observatory at Thirupathur to
carry out planetary research.
As regards animal husbandry, five per cent of the cattle and buffalo population of the
State was in the district. Sheep and goat population in Vellore district accounted for about
four per cent of the sheep and goat population of the State. As Vellore district was a land
locked district, only inland fisheries development was taking place. Inland fish catchments
in the district accounted for 10 per cent of the State’s inland fish catchments.
2.2 District at a Glance
2.2.1 Location and Geographical Units
Vellore district lies between 12° 15’ to 13° 15’ North latitudes and 78° 20’
to 79° 50’ East longitudes in Tamil Nadu State. The geographical area of this district is
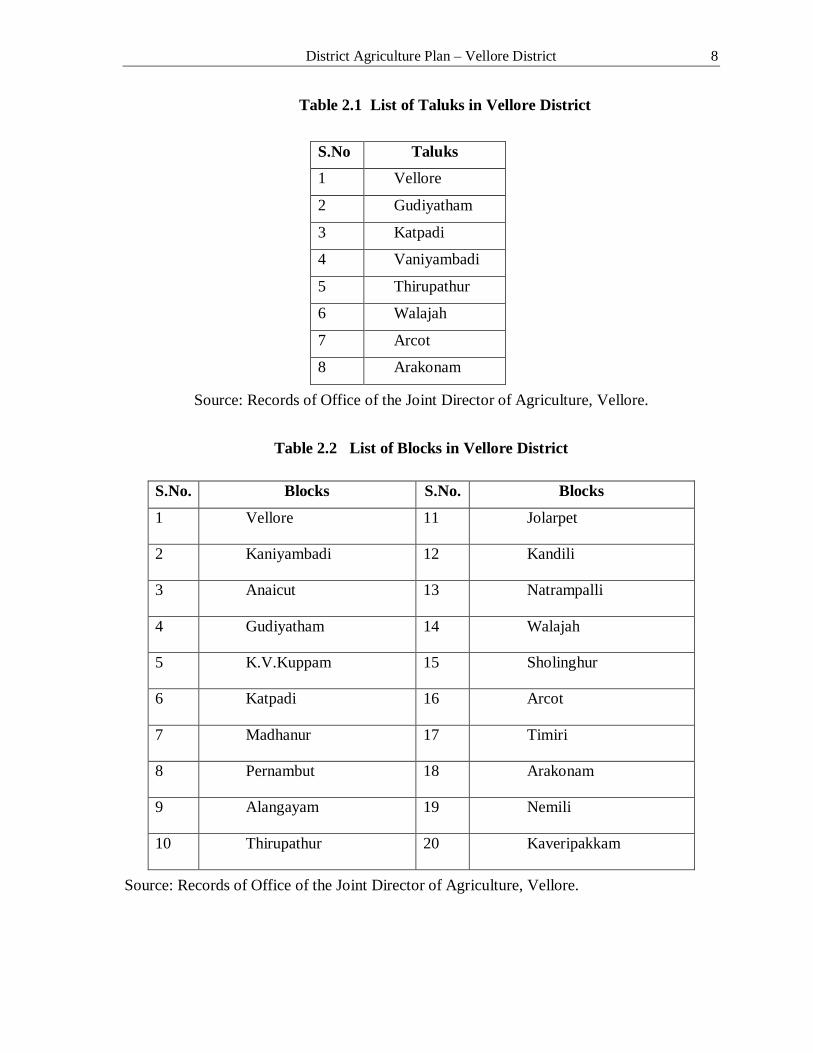
5920.18 sq. k.m. There were eight taluks and 20 blocks as listed in Tables 2.1 and 2.2
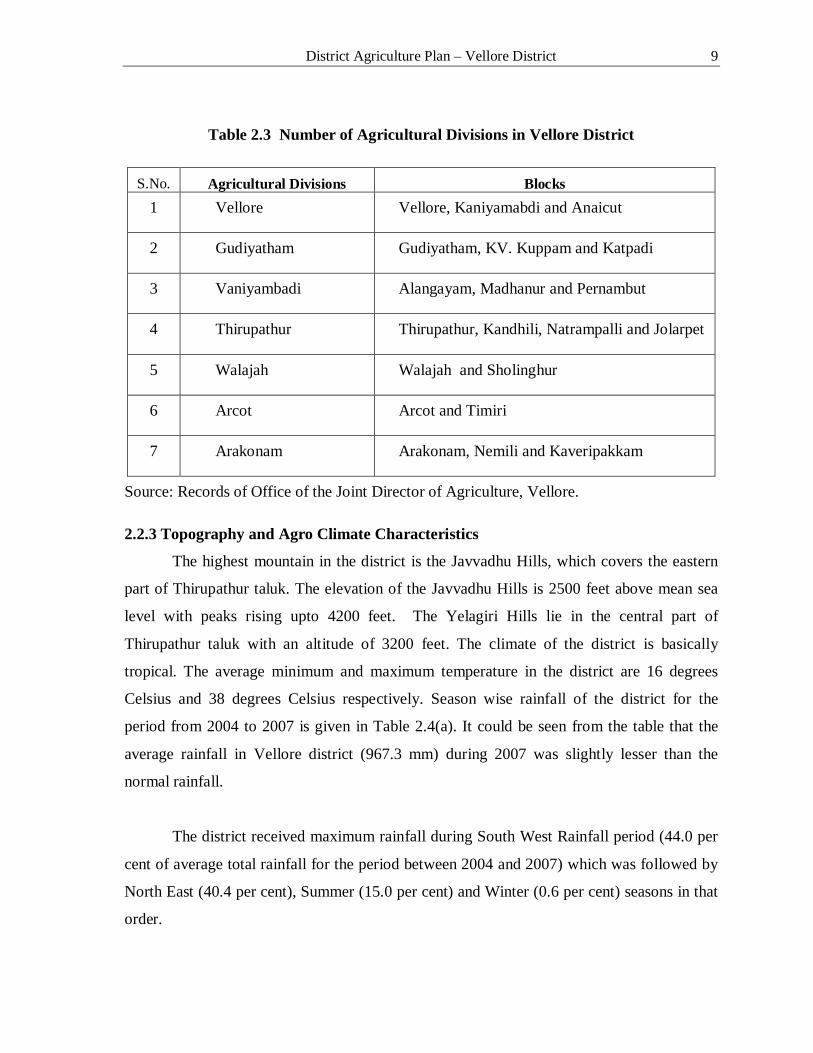
respectively. Also, there were seven agricultural divisions in the district (vide Table 2.3).
The other administrative details of the district are given below.
i) Header quarters : Vellore ii) No. of Taluks : 8 iii) No. of Revenue Divisions : 3 iv) No. of Community Divisional Blocks : 20 v) No. of Municipal Towns : 14 vi) No. of Town Panchayats : 22 vii) No. of Village Panchayats : 763 vii) No. of Revenue Villages : 842
2.2.2 Demographic Profile
The total population, as per 2001 Census, was 34,77,317 comprising of 17,41,083
male (50.1 per cent of the total population) and 17,36,234 female populations. The decennial
population growth of the district between the years 1991 and 2001 was 14.90 per cent. The
density of population per square km was 813 and the number of females per 1000 male
population was 997. A striking feature of the social change is that the district achieved cent
percent literacy owing to the effective implementation of the Arivoli Movement. Cultivators
and agricultural labourers accounted for 19.86 and 19.85 per cent of the total workers
respectively.
District Agriculture Plan – Vellore District 8
Table 2.1 List of Taluks in Vellore District
S.No Taluks
1 Vellore
2 Gudiyatham
3 Katpadi
4 Vaniyambadi
5 Thirupathur
6 Walajah
7 Arcot
8 Arakonam
Source: Records of Office of the Joint Director of Agriculture, Vellore.
Table 2.2 List of Blocks in Vellore District
S.No. Blocks S.No. Blocks
1 Vellore 11 Jolarpet
2 Kaniyambadi 12 Kandili
3 Anaicut 13 Natrampalli
4 Gudiyatham 14 Walajah
5 K.V.Kuppam 15 Sholinghur
6 Katpadi 16 Arcot
7 Madhanur 17 Timiri
8 Pernambut 18 Arakonam
9 Alangayam 19 Nemili
10 Thirupathur 20 Kaveripakkam
Source: Records of Office of the Joint Director of Agriculture, Vellore.
District Agriculture Plan – Vellore District 9
Table 2.3 Number of Agricultural Divisions in Vellore District
S.No. Agricultural Divisions Blocks 1 Vellore Vellore, Kaniyamabdi and Anaicut
2 Gudiyatham Gudiyatham, KV. Kuppam and Katpadi
3 Vaniyambadi Alangayam, Madhanur and Pernambut
4 Thirupathur Thirupathur, Kandhili, Natrampalli and Jolarpet
5 Walajah Walajah and Sholinghur
6 Arcot Arcot and Timiri
7 Arakonam Arakonam, Nemili and Kaveripakkam
Source: Records of Office of the Joint Director of Agriculture, Vellore. 2.2.3 Topography and Agro Climate Characteristics
The highest mountain in the district is the Javvadhu Hills, which covers the eastern
part of Thirupathur taluk. The elevation of the Javvadhu Hills is 2500 feet above mean sea
level with peaks rising upto 4200 feet. The Yelagiri Hills lie in the central part of
Thirupathur taluk with an altitude of 3200 feet. The climate of the district is basically
tropical. The average minimum and maximum temperature in the district are 16 degrees
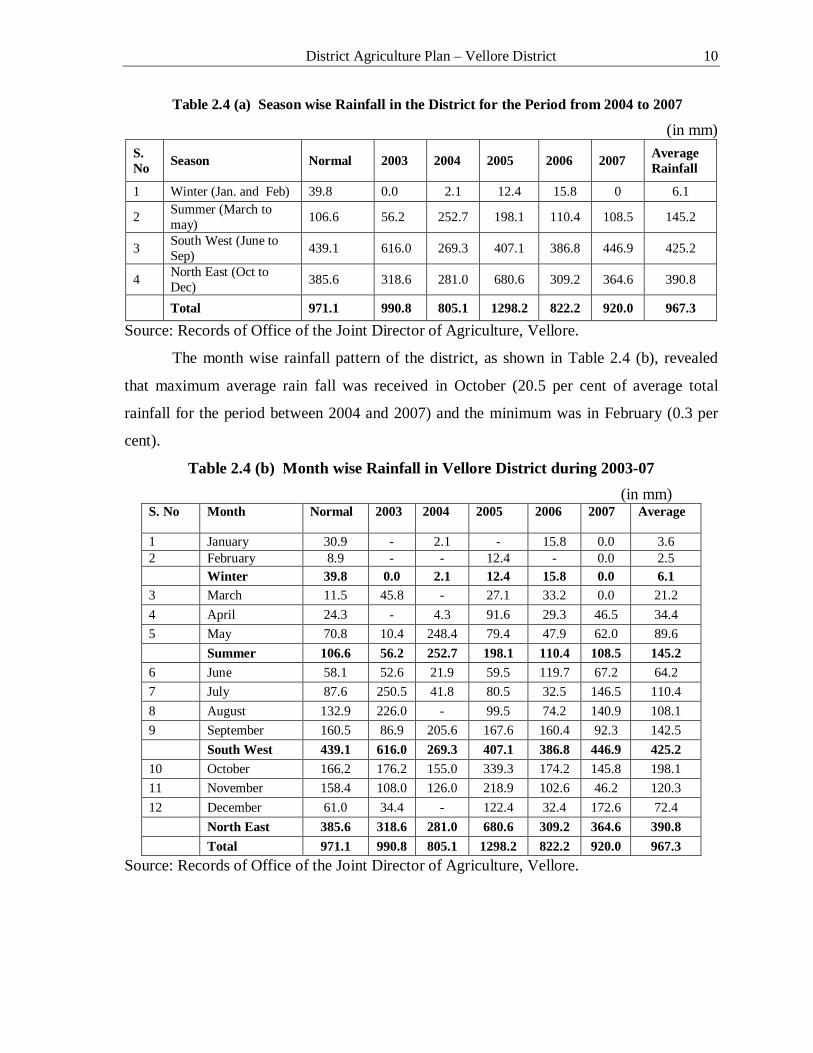
Celsius and 38 degrees Celsius respectively. Season wise rainfall of the district for the
period from 2004 to 2007 is given in Table 2.4(a). It could be seen from the table that the
average rainfall in Vellore district (967.3 mm) during 2007 was slightly lesser than the
normal rainfall.
The district received maximum rainfall during South West Rainfall period (44.0 per
cent of average total rainfall for the period between 2004 and 2007) which was followed by
North East (40.4 per cent), Summer (15.0 per cent) and Winter (0.6 per cent) seasons in that
order.
District Agriculture Plan – Vellore District 10
Table 2.4 (a) Season wise Rainfall in the District for the Period from 2004 to 2007
(in mm) S. No Season Normal 2003 2004 2005 2006 2007 Average
Rainfall
1 Winter (Jan. and Feb) 39.8 0.0 2.1 12.4 15.8 0 6.1
2 Summer (March to may) 106.6 56.2 252.7 198.1 110.4 108.5 145.2
3 South West (June to Sep) 439.1 616.0 269.3 407.1 386.8 446.9 425.2
4 North East (Oct to Dec) 385.6 318.6 281.0 680.6 309.2 364.6 390.8
Total 971.1 990.8 805.1 1298.2 822.2 920.0 967.3
Source: Records of Office of the Joint Director of Agriculture, Vellore.
The month wise rainfall pattern of the district, as shown in Table 2.4 (b), revealed
that maximum average rain fall was received in October (20.5 per cent of average total
rainfall for the period between 2004 and 2007) and the minimum was in February (0.3 per
cent).
Table 2.4 (b) Month wise Rainfall in Vellore District during 2003-07
(in mm) S. No Month Normal 2003 2004 2005 2006 2007 Average
1 January 30.9 - 2.1 - 15.8 0.0 3.6 2 February 8.9 - - 12.4 - 0.0 2.5 Winter 39.8 0.0 2.1 12.4 15.8 0.0 6.1 3 March 11.5 45.8 - 27.1 33.2 0.0 21.2 4 April 24.3 - 4.3 91.6 29.3 46.5 34.4 5 May 70.8 10.4 248.4 79.4 47.9 62.0 89.6 Summer 106.6 56.2 252.7 198.1 110.4 108.5 145.2 6 June 58.1 52.6 21.9 59.5 119.7 67.2 64.2 7 July 87.6 250.5 41.8 80.5 32.5 146.5 110.4 8 August 132.9 226.0 - 99.5 74.2 140.9 108.1 9 September 160.5 86.9 205.6 167.6 160.4 92.3 142.5 South West 439.1 616.0 269.3 407.1 386.8 446.9 425.2 10 October 166.2 176.2 155.0 339.3 174.2 145.8 198.1 11 November 158.4 108.0 126.0 218.9 102.6 46.2 120.3 12 December 61.0 34.4 - 122.4 32.4 172.6 72.4 North East 385.6 318.6 281.0 680.6 309.2 364.6 390.8 Total 971.1 990.8 805.1 1298.2 822.2 920.0 967.3
Source: Records of Office of the Joint Director of Agriculture, Vellore.
District Agriculture Plan – Vellore District 11
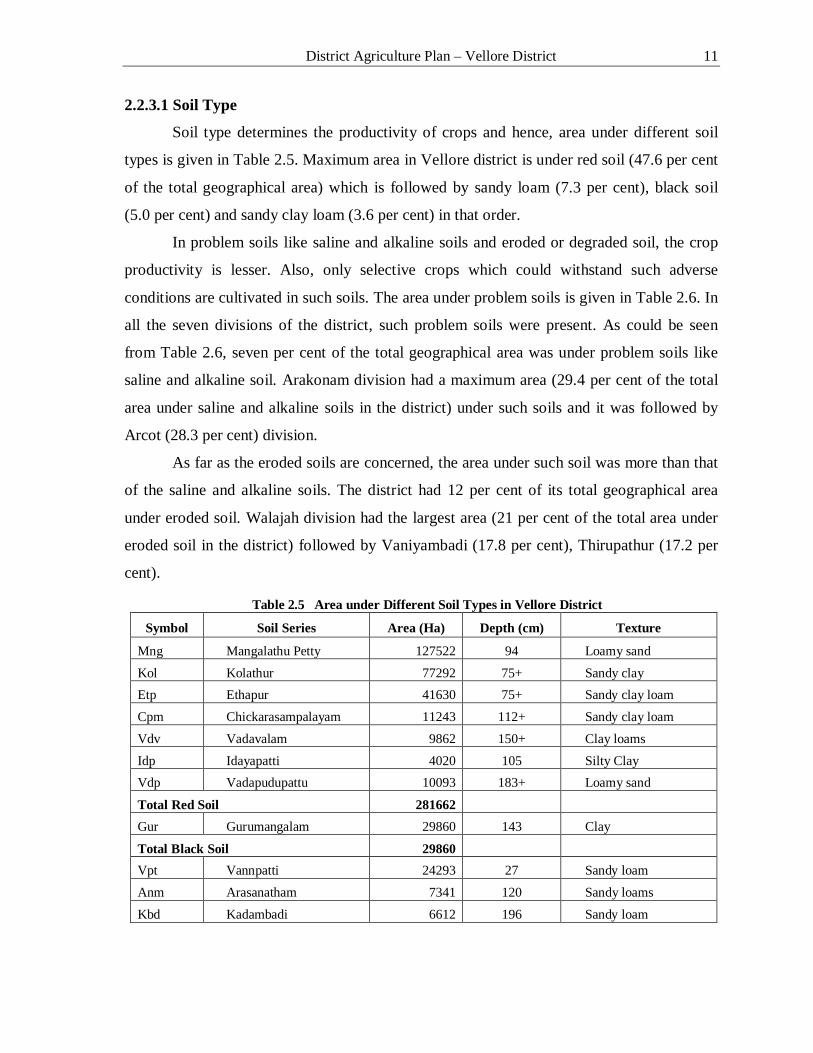
2.2.3.1 Soil Type
Soil type determines the productivity of crops and hence, area under different soil
types is given in Table 2.5. Maximum area in Vellore district is under red soil (47.6 per cent
of the total geographical area) which is followed by sandy loam (7.3 per cent), black soil
(5.0 per cent) and sandy clay loam (3.6 per cent) in that order.
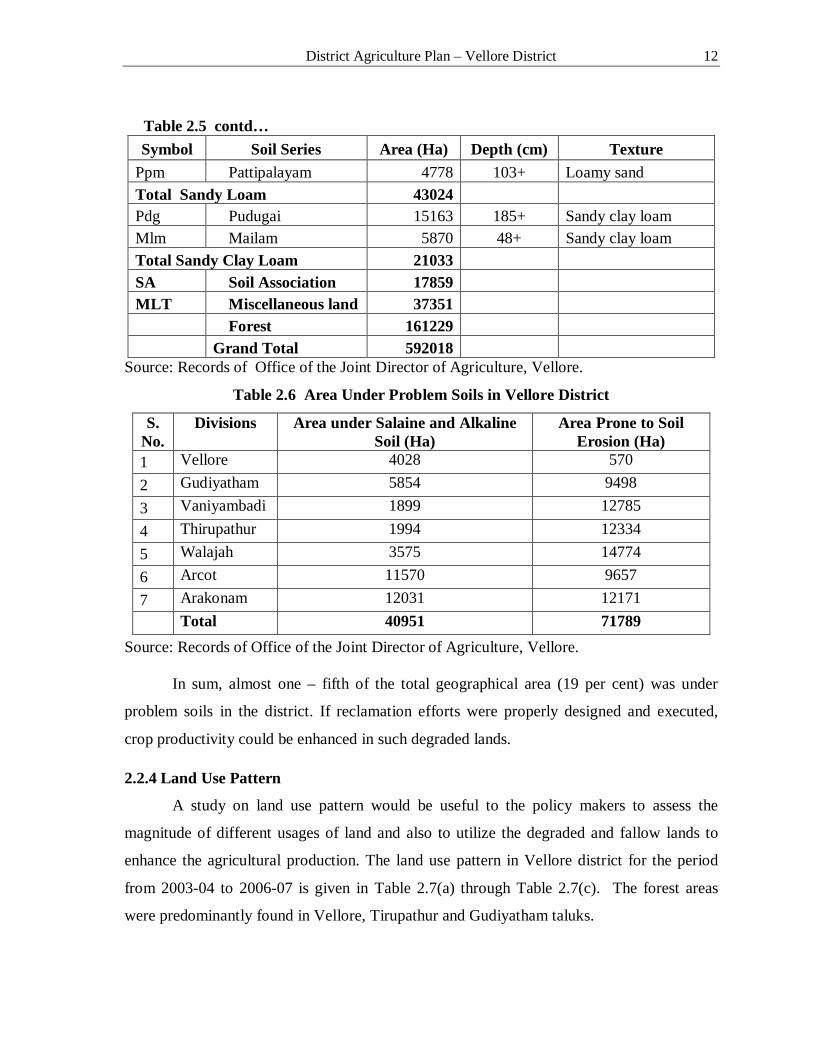
In problem soils like saline and alkaline soils and eroded or degraded soil, the crop
productivity is lesser. Also, only selective crops which could withstand such adverse
conditions are cultivated in such soils. The area under problem soils is given in Table 2.6. In
all the seven divisions of the district, such problem soils were present. As could be seen
from Table 2.6, seven per cent of the total geographical area was under problem soils like
saline and alkaline soil. Arakonam division had a maximum area (29.4 per cent of the total
area under saline and alkaline soils in the district) under such soils and it was followed by
Arcot (28.3 per cent) division.
As far as the eroded soils are concerned, the area under such soil was more than that
of the saline and alkaline soils. The district had 12 per cent of its total geographical area
under eroded soil. Walajah division had the largest area (21 per cent of the total area under
eroded soil in the district) followed by Vaniyambadi (17.8 per cent), Thirupathur (17.2 per
cent).
Table 2.5 Area under Different Soil Types in Vellore District
Symbol Soil Series Area (Ha) Depth (cm) Texture
Mng Mangalathu Petty 127522 94 Loamy sand
Kol Kolathur 77292 75+ Sandy clay Etp Ethapur 41630 75+ Sandy clay loam
Cpm Chickarasampalayam 11243 112+ Sandy clay loam
Vdv Vadavalam 9862 150+ Clay loams
Idp Idayapatti 4020 105 Silty Clay Vdp Vadapudupattu 10093 183+ Loamy sand
Total Red Soil 281662 Gur Gurumangalam 29860 143 Clay
Total Black Soil 29860 Vpt Vannpatti 24293 27 Sandy loam
Anm Arasanatham 7341 120 Sandy loams
Kbd Kadambadi 6612 196 Sandy loam
District Agriculture Plan – Vellore District 12
Table 2.5 contd… Symbol Soil Series Area (Ha) Depth (cm) Texture
Ppm Pattipalayam 4778 103+ Loamy sand Total Sandy Loam 43024 Pdg Pudugai 15163 185+ Sandy clay loam Mlm Mailam 5870 48+ Sandy clay loam Total Sandy Clay Loam 21033 SA Soil Association 17859 MLT Miscellaneous land 37351 Forest 161229 Grand Total 592018
Source: Records of Office of the Joint Director of Agriculture, Vellore.
Table 2.6 Area Under Problem Soils in Vellore District
S. No.
Divisions Area under Salaine and Alkaline Soil (Ha)
Area Prone to Soil Erosion (Ha)
1 Vellore 4028 570 2 Gudiyatham 5854 9498 3 Vaniyambadi 1899 12785 4 Thirupathur 1994 12334 5 Walajah 3575 14774 6 Arcot 11570 9657 7 Arakonam 12031 12171 Total 40951 71789
Source: Records of Office of the Joint Director of Agriculture, Vellore.
In sum, almost one – fifth of the total geographical area (19 per cent) was under
problem soils in the district. If reclamation efforts were properly designed and executed,
crop productivity could be enhanced in such degraded lands.
2.2.4 Land Use Pattern
A study on land use pattern would be useful to the policy makers to assess the
magnitude of different usages of land and also to utilize the degraded and fallow lands to
enhance the agricultural production. The land use pattern in Vellore district for the period
from 2003-04 to 2006-07 is given in Table 2.7(a) through Table 2.7(c). The forest areas
were predominantly found in Vellore, Tirupathur and Gudiyatham taluks.
District Agriculture Plan – Vellore District 13
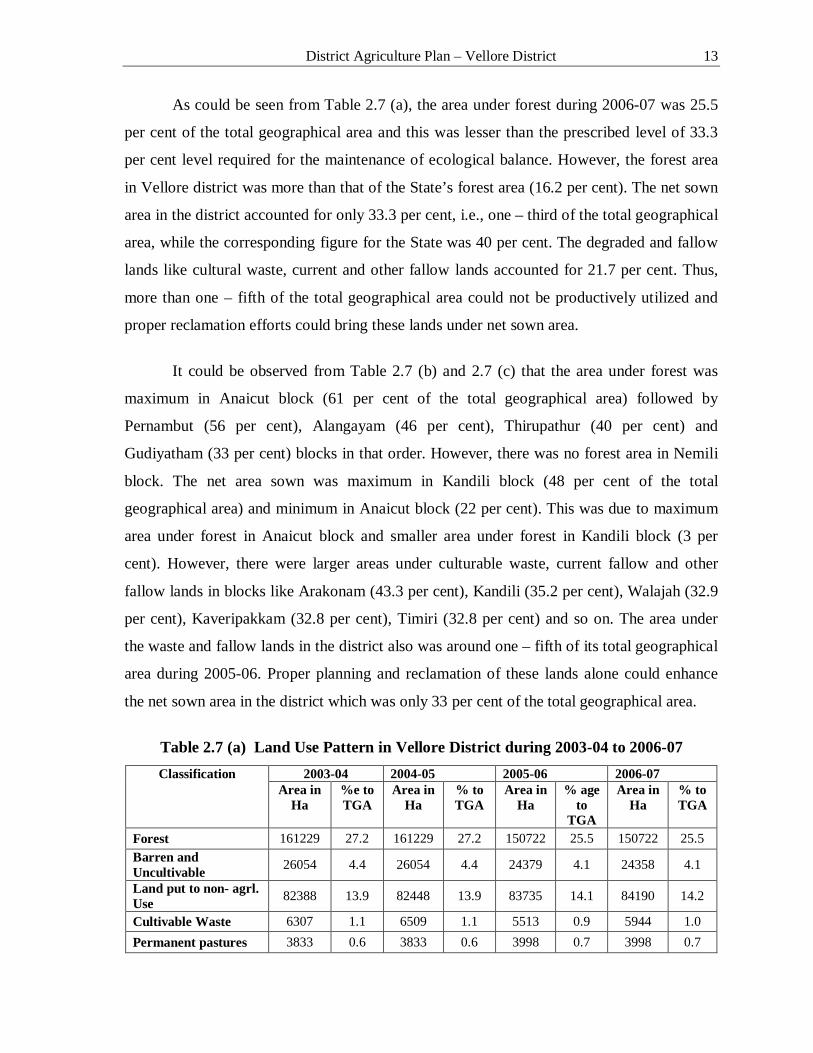
As could be seen from Table 2.7 (a), the area under forest during 2006-07 was 25.5
per cent of the total geographical area and this was lesser than the prescribed level of 33.3
per cent level required for the maintenance of ecological balance. However, the forest area
in Vellore district was more than that of the State’s forest area (16.2 per cent). The net sown
area in the district accounted for only 33.3 per cent, i.e., one – third of the total geographical
area, while the corresponding figure for the State was 40 per cent. The degraded and fallow
lands like cultural waste, current and other fallow lands accounted for 21.7 per cent. Thus,
more than one – fifth of the total geographical area could not be productively utilized and
proper reclamation efforts could bring these lands under net sown area.
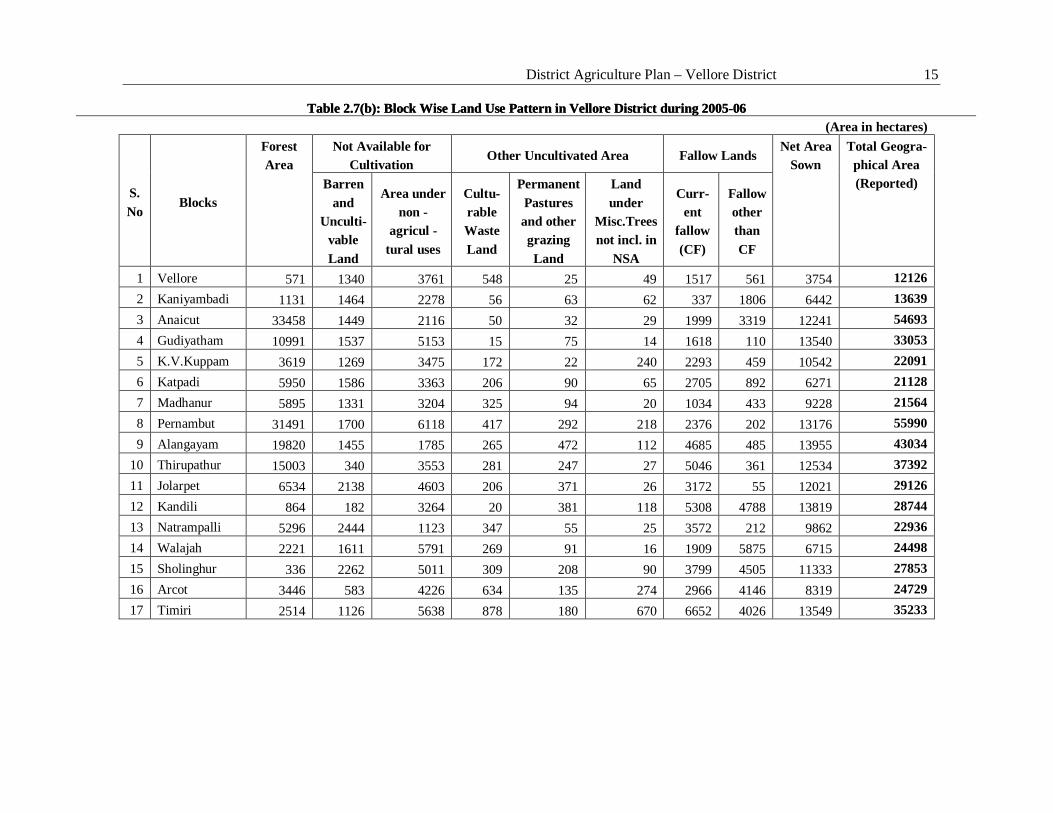
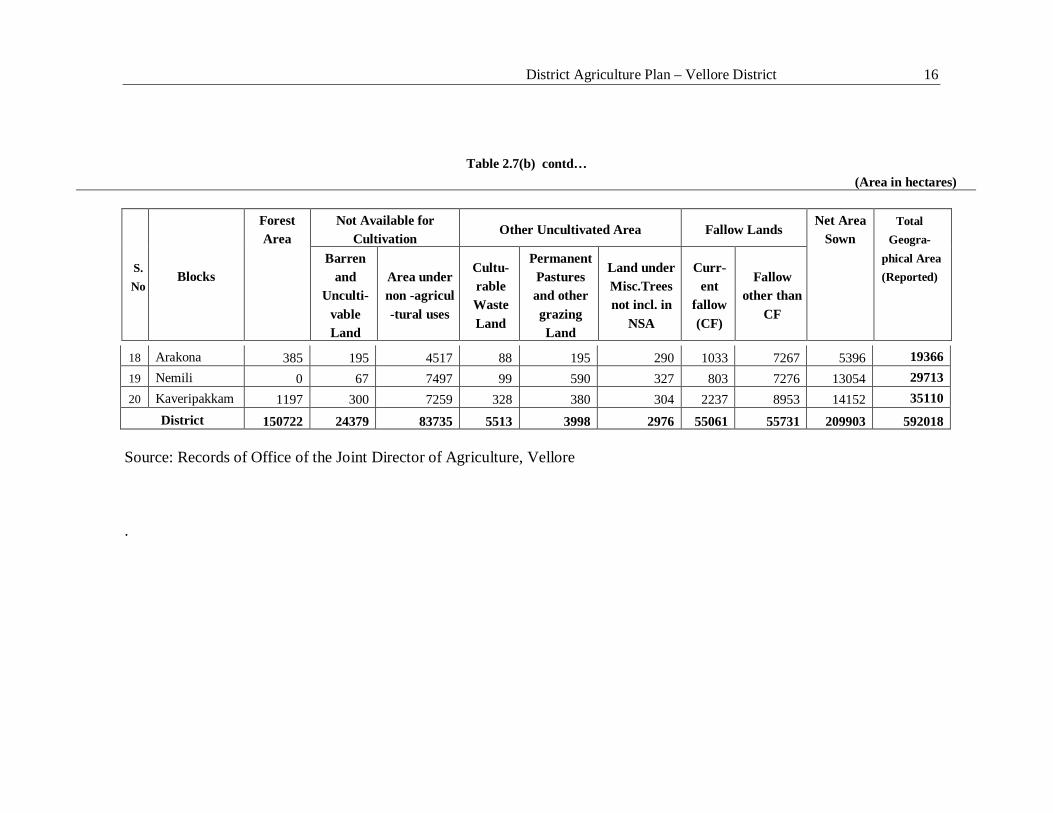
It could be observed from Table 2.7 (b) and 2.7 (c) that the area under forest was
maximum in Anaicut block (61 per cent of the total geographical area) followed by
Pernambut (56 per cent), Alangayam (46 per cent), Thirupathur (40 per cent) and
Gudiyatham (33 per cent) blocks in that order. However, there was no forest area in Nemili
block. The net area sown was maximum in Kandili block (48 per cent of the total
geographical area) and minimum in Anaicut block (22 per cent). This was due to maximum
area under forest in Anaicut block and smaller area under forest in Kandili block (3 per
cent). However, there were larger areas under culturable waste, current fallow and other
fallow lands in blocks like Arakonam (43.3 per cent), Kandili (35.2 per cent), Walajah (32.9
per cent), Kaveripakkam (32.8 per cent), Timiri (32.8 per cent) and so on. The area under
the waste and fallow lands in the district also was around one – fifth of its total geographical
area during 2005-06. Proper planning and reclamation of these lands alone could enhance
the net sown area in the district which was only 33 per cent of the total geographical area.
Table 2.7 (a) Land Use Pattern in Vellore District during 2003-04 to 2006-07 Classification 2003-04 2004-05 2005-06 2006-07
Area in Ha
%e to TGA
Area in Ha
% to TGA
Area in Ha
% age to
TGA
Area in Ha
% to TGA
Forest 161229 27.2 161229 27.2 150722 25.5 150722 25.5 Barren and Uncultivable 26054 4.4 26054 4.4 24379 4.1 24358 4.1
Land put to non- agrl. Use 82388 13.9 82448 13.9 83735 14.1 84190 14.2
Cultivable Waste 6307 1.1 6509 1.1 5513 0.9 5944 1.0 Permanent pastures 3833 0.6 3833 0.6 3998 0.7 3998 0.7
District Agriculture Plan – Vellore District 14
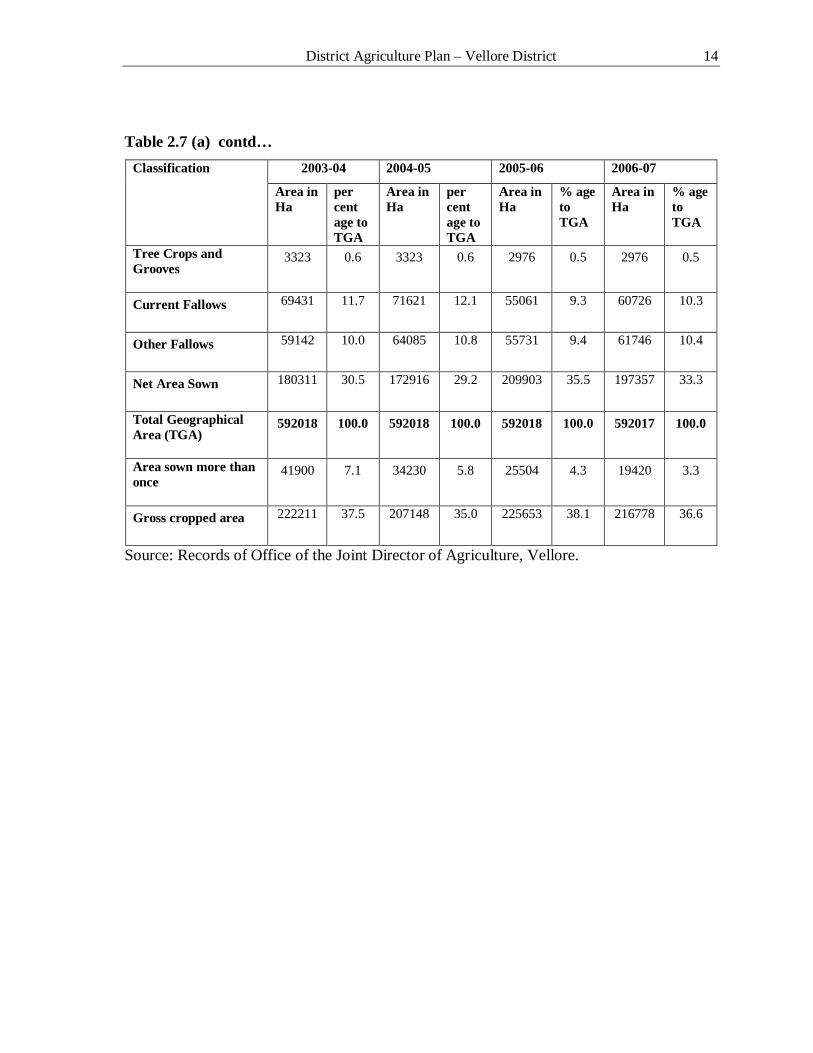
Table 2.7 (a) contd…
Classification 2003-04 2004-05 2005-06 2006-07
Area in Ha
per cent age to TGA
Area in Ha
per cent age to TGA
Area in Ha
% age to TGA
Area in Ha
% age to TGA
Tree Crops and Grooves
3323 0.6 3323 0.6 2976 0.5 2976 0.5
Current Fallows 69431 11.7 71621 12.1 55061 9.3 60726 10.3
Other Fallows 59142 10.0 64085 10.8 55731 9.4 61746 10.4
Net Area Sown 180311 30.5 172916 29.2 209903 35.5 197357 33.3
Total Geographical Area (TGA)
592018 100.0 592018 100.0 592018 100.0 592017 100.0
Area sown more than once
41900 7.1 34230 5.8 25504 4.3 19420 3.3
Gross cropped area 222211 37.5 207148 35.0 225653 38.1 216778 36.6
Source: Records of Office of the Joint Director of Agriculture, Vellore.
District Agriculture Plan – Vellore District 15
Table 2.7(b): Block Wise Land Use Pattern in Vellore District during 2005-06 (Area in hectares)
S. No
Blocks
Forest Area
Not Available for Cultivation
Other Uncultivated Area Fallow Lands Net Area
Sown Total Geogra-phical Area (Reported) Barren
and Unculti-
vable Land
Area under non -
agricul -tural uses
Cultu-rable Waste Land
Permanent Pastures and other grazing Land
Land under
Misc.Trees not incl. in
NSA
Curr-ent
fallow (CF)
Fallow other than CF
1 Vellore 571 1340 3761 548 25 49 1517 561 3754 12126 2 Kaniyambadi 1131 1464 2278 56 63 62 337 1806 6442 13639 3 Anaicut 33458 1449 2116 50 32 29 1999 3319 12241 54693 4 Gudiyatham 10991 1537 5153 15 75 14 1618 110 13540 33053 5 K.V.Kuppam 3619 1269 3475 172 22 240 2293 459 10542 22091 6 Katpadi 5950 1586 3363 206 90 65 2705 892 6271 21128 7 Madhanur 5895 1331 3204 325 94 20 1034 433 9228 21564 8 Pernambut 31491 1700 6118 417 292 218 2376 202 13176 55990 9 Alangayam 19820 1455 1785 265 472 112 4685 485 13955 43034
10 Thirupathur 15003 340 3553 281 247 27 5046 361 12534 37392 11 Jolarpet 6534 2138 4603 206 371 26 3172 55 12021 29126 12 Kandili 864 182 3264 20 381 118 5308 4788 13819 28744 13 Natrampalli 5296 2444 1123 347 55 25 3572 212 9862 22936 14 Walajah 2221 1611 5791 269 91 16 1909 5875 6715 24498 15 Sholinghur 336 2262 5011 309 208 90 3799 4505 11333 27853 16 Arcot 3446 583 4226 634 135 274 2966 4146 8319 24729 17 Timiri 2514 1126 5638 878 180 670 6652 4026 13549 35233
Table 2.7(b): Block Wise Land Use Pattern in Vellore District during 2005-06
District Agriculture Plan – Vellore District 16
Source: Records of Office of the Joint Director of Agriculture, Vellore .
Table 2.7(b) contd… (Area in hectares)
18 Arakona 385 195 4517 88 195 290 1033 7267 5396 19366 19 Nemili 0 67 7497 99 590 327 803 7276 13054 29713 20 Kaveripakkam 1197 300 7259 328 380 304 2237 8953 14152 35110
District 150722 24379 83735 5513 3998 2976 55061 55731 209903 592018
S. No
Blocks
Forest Area
Not Available for Cultivation
Other Uncultivated Area Fallow Lands Net Area
Sown Total
Geogra- phical Area (Reported)
Barren and
Unculti- vable Land
Area under non -agricul -tural uses
Cultu-rable Waste Land
Permanent Pastures and other grazing Land
Land under Misc.Trees not incl. in
NSA
Curr-ent
fallow (CF)
Fallow other than
CF
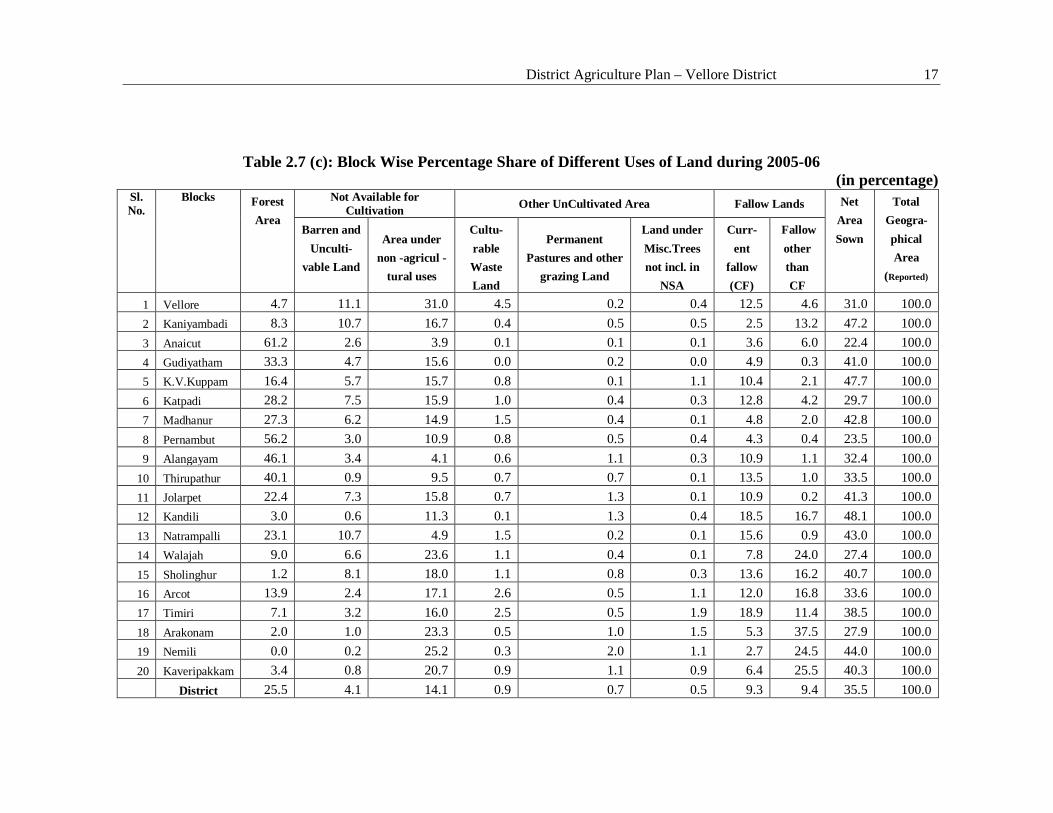
District Agriculture Plan – Vellore District 17
Table 2.7 (c): Block Wise Percentage Share of Different Uses of Land during 2005-06 (in percentage)
Sl. No.
Blocks Forest Area
Not Available for Cultivation Other UnCultivated Area Fallow Lands Net
Area Sown
Total Geogra-phical Area
(Reported)
Barren and Unculti-
vable Land
Area under non -agricul -
tural uses
Cultu-rable Waste Land
Permanent Pastures and other
grazing Land
Land under Misc.Trees not incl. in
NSA
Curr-ent
fallow (CF)
Fallow other than CF
1 Vellore 4.7 11.1 31.0 4.5 0.2 0.4 12.5 4.6 31.0 100.0 2 Kaniyambadi 8.3 10.7 16.7 0.4 0.5 0.5 2.5 13.2 47.2 100.0 3 Anaicut 61.2 2.6 3.9 0.1 0.1 0.1 3.6 6.0 22.4 100.0 4 Gudiyatham 33.3 4.7 15.6 0.0 0.2 0.0 4.9 0.3 41.0 100.0 5 K.V.Kuppam 16.4 5.7 15.7 0.8 0.1 1.1 10.4 2.1 47.7 100.0 6 Katpadi 28.2 7.5 15.9 1.0 0.4 0.3 12.8 4.2 29.7 100.0 7 Madhanur 27.3 6.2 14.9 1.5 0.4 0.1 4.8 2.0 42.8 100.0 8 Pernambut 56.2 3.0 10.9 0.8 0.5 0.4 4.3 0.4 23.5 100.0 9 Alangayam 46.1 3.4 4.1 0.6 1.1 0.3 10.9 1.1 32.4 100.0
10 Thirupathur 40.1 0.9 9.5 0.7 0.7 0.1 13.5 1.0 33.5 100.0 11 Jolarpet 22.4 7.3 15.8 0.7 1.3 0.1 10.9 0.2 41.3 100.0 12 Kandili 3.0 0.6 11.3 0.1 1.3 0.4 18.5 16.7 48.1 100.0 13 Natrampalli 23.1 10.7 4.9 1.5 0.2 0.1 15.6 0.9 43.0 100.0 14 Walajah 9.0 6.6 23.6 1.1 0.4 0.1 7.8 24.0 27.4 100.0 15 Sholinghur 1.2 8.1 18.0 1.1 0.8 0.3 13.6 16.2 40.7 100.0 16 Arcot 13.9 2.4 17.1 2.6 0.5 1.1 12.0 16.8 33.6 100.0 17 Timiri 7.1 3.2 16.0 2.5 0.5 1.9 18.9 11.4 38.5 100.0 18 Arakonam 2.0 1.0 23.3 0.5 1.0 1.5 5.3 37.5 27.9 100.0 19 Nemili 0.0 0.2 25.2 0.3 2.0 1.1 2.7 24.5 44.0 100.0 20 Kaveripakkam 3.4 0.8 20.7 0.9 1.1 0.9 6.4 25.5 40.3 100.0 District 25.5 4.1 14.1 0.9 0.7 0.5 9.3 9.4 35.5 100.0
District Agriculture Plan – Vellore District 18
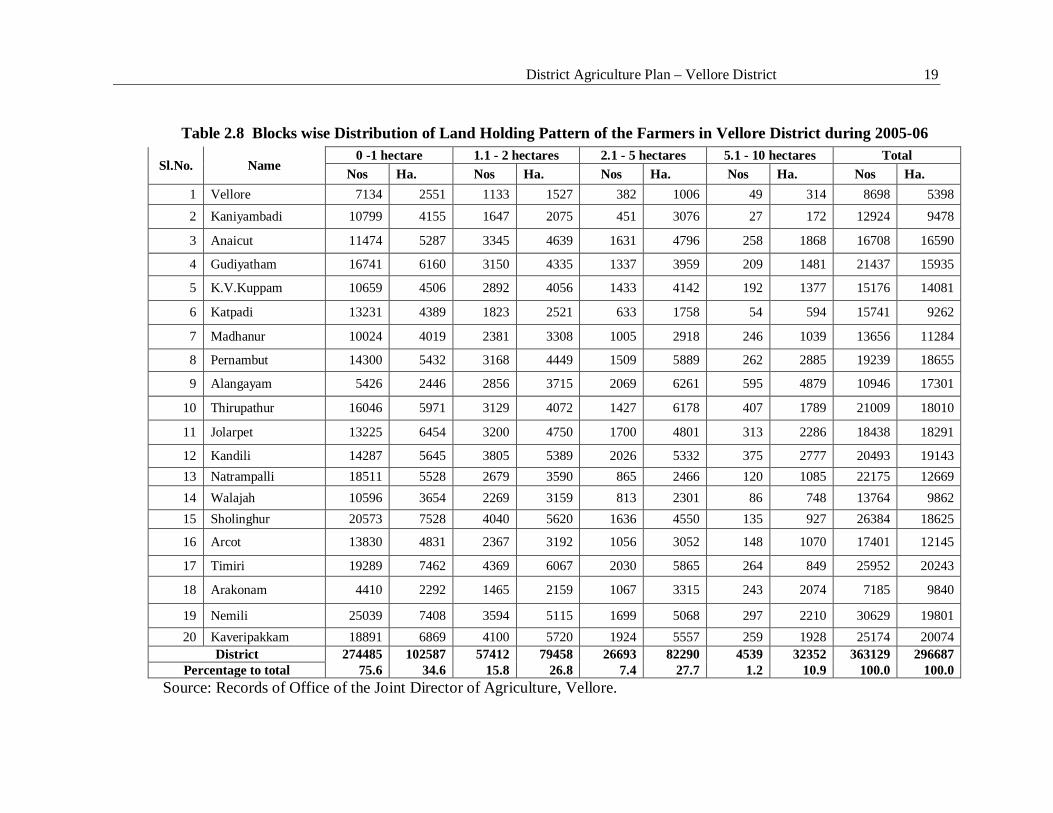
The cropping intensity in the district for the triennium ending 2006-07 was 112 per cent.
So, there is an urgent need to increase the area under irrigation so as to increase the area sown
more than once which would in turn increase the cropping intensity.
The land holdings distribution pattern in Vellore district was highly skewed as could be
seen from Table 2.8. More than 90 per cent of the total number of farmers in the district were
marginal and small farmers who were holding less than two hectares of land and they operated
61 per cent of the total arable land, while 1.2 per cent of the farmers having five to 10 hectares of
land were operating 11 per cent of the area. The average size of the holding in the district was
only 0.82 hectare.
2.2.5 Irrigation and Ground Water
Area under irrigation would determine the area under long duration commercial crops and
thereby the agricultural output. Palar and Ponnai are the major rivers flowing through the district.
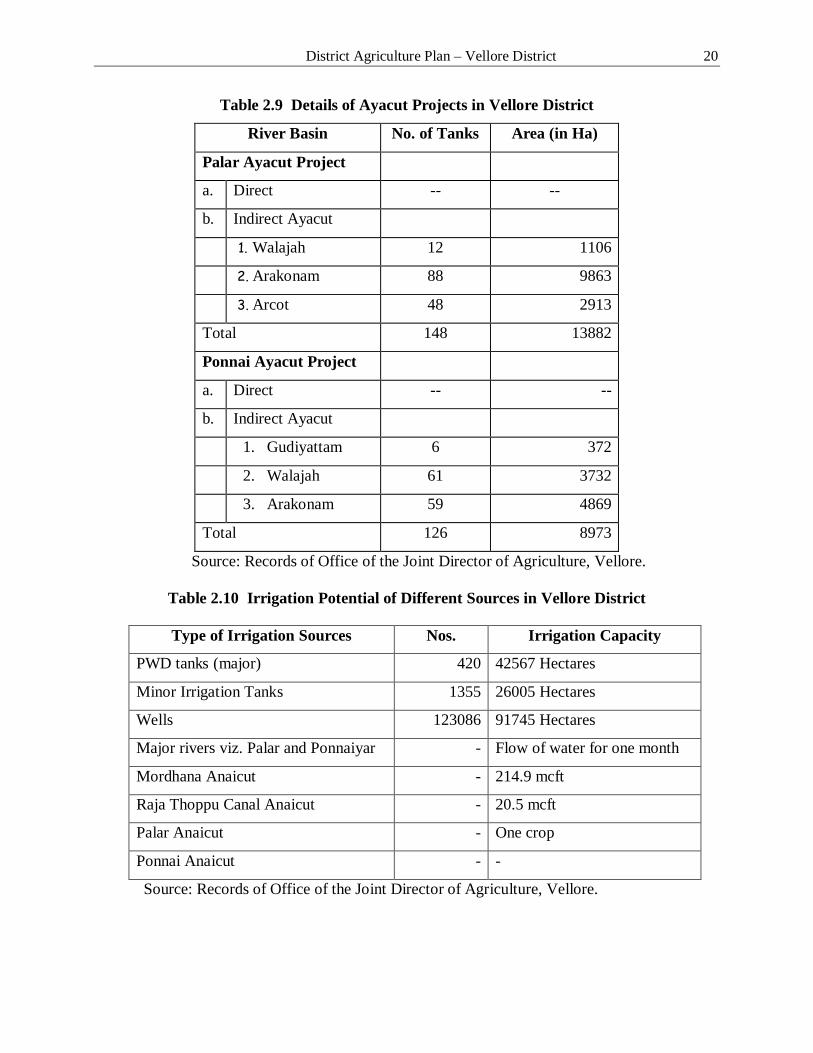
However they remain dry for most part of the year. The details of Ayacut projects with area and
number of tanks benefited are given in Table 2.9. Palar Ayacut Project supported 148 tanks in
Vellore district indirectly with an ayacut area of 13,882 hectares while Ponnai Ayacut Project
indirectly supported 126 tanks with an ayacut area of 8,973 hectares. Table 2.10 would indicate
the predominance of well irrigation in Vellore district.
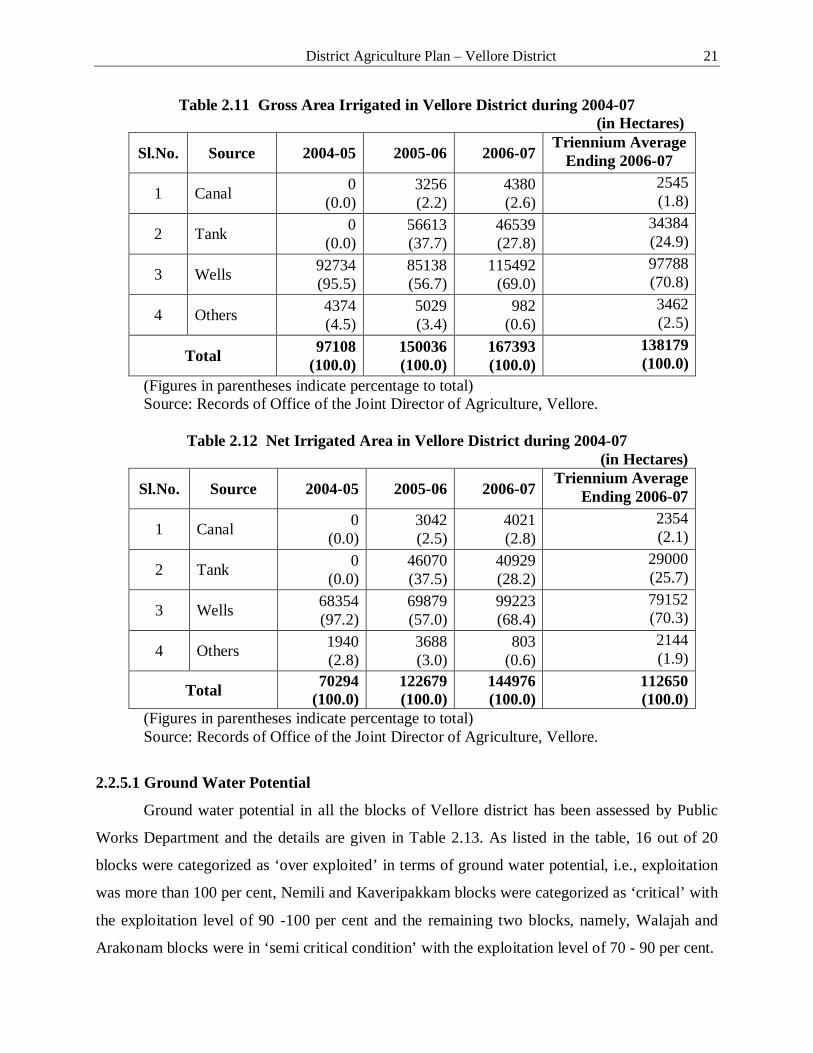
Gross and net irrigated areas in Vellore district are given in Table 2.11 and 2.12
respectively. Contributions of well irrigation which was a major source irrigation, to gross and
net irrigated areas by all sources were 70.8 and 70.3 per cent respectively and the next major
source of irrigation was tanks with their shares in gross and net irrigated areas by all sources
were 24.9 and 25.7 per cent respectively. Canal irrigation was insignificant as there was no
perennial river in Vellore district.
The irrigation intensity in the district was only 123 per cent. The percentage of net
irrigated area to net sown area was only 58 per cent for the triennium ending 2006-07. The
percentage share of gross irrigated area to gross cropped area was 64 per cent for the same
period. However, there was an increase in both net and gross irrigated areas in the district
between 2004-05 and 2006-06.
District Agriculture Plan – Vellore District 19
Table 2.8 Blocks wise Distribution of Land Holding Pattern of the Farmers in Vellore District during 2005-06
Sl.No. Name 0 -1 hectare 1.1 - 2 hectares 2.1 - 5 hectares 5.1 - 10 hectares Total
Nos Ha. Nos Ha. Nos Ha. Nos Ha. Nos Ha. 1 Vellore 7134 2551 1133 1527 382 1006 49 314 8698 5398
2 Kaniyambadi 10799 4155 1647 2075 451 3076 27 172 12924 9478
3 Anaicut 11474 5287 3345 4639 1631 4796 258 1868 16708 16590
4 Gudiyatham 16741 6160 3150 4335 1337 3959 209 1481 21437 15935
5 K.V.Kuppam 10659 4506 2892 4056 1433 4142 192 1377 15176 14081
6 Katpadi 13231 4389 1823 2521 633 1758 54 594 15741 9262
7 Madhanur 10024 4019 2381 3308 1005 2918 246 1039 13656 11284
8 Pernambut 14300 5432 3168 4449 1509 5889 262 2885 19239 18655
9 Alangayam 5426 2446 2856 3715 2069 6261 595 4879 10946 17301
10 Thirupathur 16046 5971 3129 4072 1427 6178 407 1789 21009 18010
11 Jolarpet 13225 6454 3200 4750 1700 4801 313 2286 18438 18291
12 Kandili 14287 5645 3805 5389 2026 5332 375 2777 20493 19143 13 Natrampalli 18511 5528 2679 3590 865 2466 120 1085 22175 12669 14 Walajah 10596 3654 2269 3159 813 2301 86 748 13764 9862 15 Sholinghur 20573 7528 4040 5620 1636 4550 135 927 26384 18625
16 Arcot 13830 4831 2367 3192 1056 3052 148 1070 17401 12145
17 Timiri 19289 7462 4369 6067 2030 5865 264 849 25952 20243
18 Arakonam 4410 2292 1465 2159 1067 3315 243 2074 7185 9840
19 Nemili 25039 7408 3594 5115 1699 5068 297 2210 30629 19801 20 Kaveripakkam 18891 6869 4100 5720 1924 5557 259 1928 25174 20074
District 274485 102587 57412 79458 26693 82290 4539 32352 363129 296687 Percentage to total 75.6 34.6 15.8 26.8 7.4 27.7 1.2 10.9 100.0 100.0
Source: Records of Office of the Joint Director of Agriculture, Vellore.
District Agriculture Plan – Vellore District 20
Table 2.9 Details of Ayacut Projects in Vellore District
River Basin No. of Tanks Area (in Ha)
Palar Ayacut Project
a. Direct -- --
b. Indirect Ayacut
1. Walajah 12 1106
2. Arakonam 88 9863
3. Arcot 48 2913
Total 148 13882
Ponnai Ayacut Project
a. Direct -- --
b. Indirect Ayacut
1. Gudiyattam 6 372
2. Walajah 61 3732
3. Arakonam 59 4869
Total 126 8973
Source: Records of Office of the Joint Director of Agriculture, Vellore.
Table 2.10 Irrigation Potential of Different Sources in Vellore District
Type of Irrigation Sources Nos. Irrigation Capacity
PWD tanks (major) 420 42567 Hectares
Minor Irrigation Tanks 1355 26005 Hectares
Wells 123086 91745 Hectares
Major rivers viz. Palar and Ponnaiyar - Flow of water for one month
Mordhana Anaicut - 214.9 mcft
Raja Thoppu Canal Anaicut - 20.5 mcft
Palar Anaicut - One crop
Ponnai Anaicut - -
Source: Records of Office of the Joint Director of Agriculture, Vellore.
District Agriculture Plan – Vellore District 21
Table 2.11 Gross Area Irrigated in Vellore District during 2004-07 (in Hectares)
Sl.No. Source 2004-05 2005-06 2006-07 Triennium Average
Ending 2006-07
1 Canal 0 (0.0)
3256 (2.2)
4380 (2.6)
2545 (1.8)
2 Tank 0 (0.0)
56613 (37.7)
46539 (27.8)
34384 (24.9)
3 Wells 92734 (95.5)
85138 (56.7)
115492 (69.0)
97788 (70.8)
4 Others 4374 (4.5)
5029 (3.4)
982 (0.6)
3462 (2.5)
Total 97108 (100.0)
150036 (100.0)
167393 (100.0)
138179 (100.0)
(Figures in parentheses indicate percentage to total) Source: Records of Office of the Joint Director of Agriculture, Vellore.
Table 2.12 Net Irrigated Area in Vellore District during 2004-07
(in Hectares)
Sl.No. Source 2004-05 2005-06 2006-07 Triennium Average
Ending 2006-07
1 Canal 0 (0.0)
3042 (2.5)
4021 (2.8)
2354 (2.1)
2 Tank 0 (0.0)
46070 (37.5)
40929 (28.2)
29000 (25.7)
3 Wells 68354 (97.2)
69879 (57.0)
99223 (68.4)
79152 (70.3)
4 Others 1940 (2.8)
3688 (3.0)
803 (0.6)
2144 (1.9)
Total 70294 (100.0)
122679 (100.0)
144976 (100.0)
112650 (100.0)
(Figures in parentheses indicate percentage to total) Source: Records of Office of the Joint Director of Agriculture, Vellore.
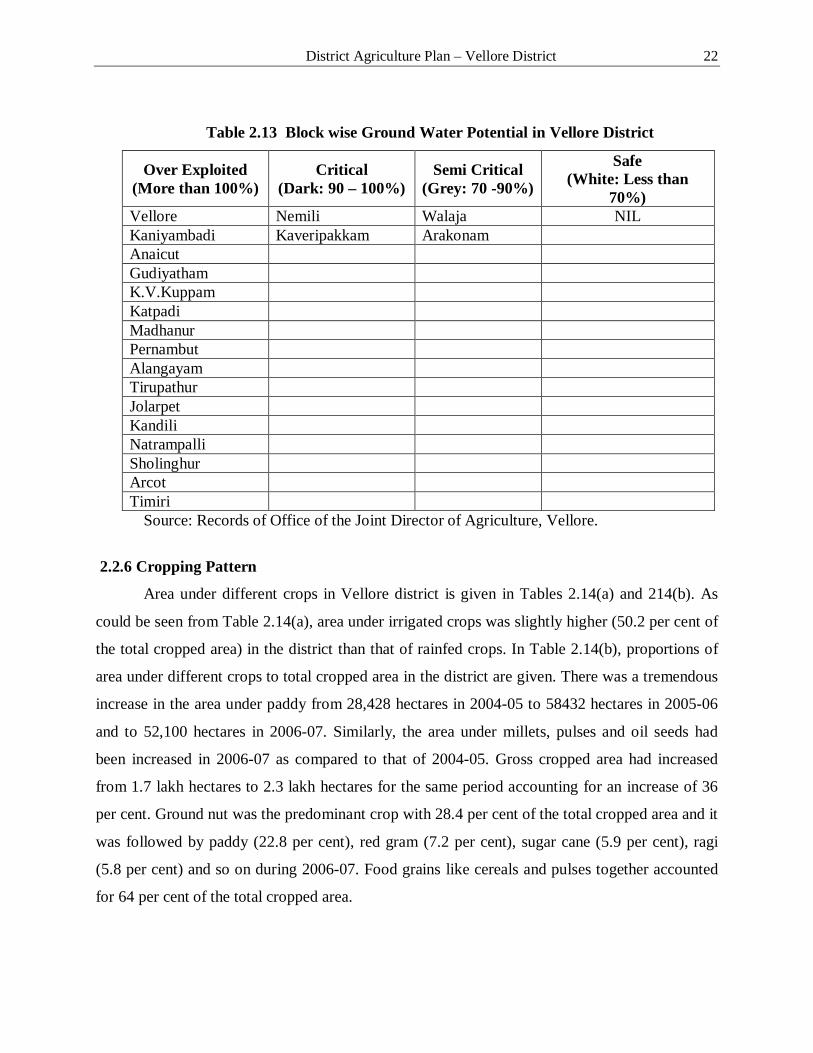
2.2.5.1 Ground Water Potential
Ground water potential in all the blocks of Vellore district has been assessed by Public
Works Department and the details are given in Table 2.13. As listed in the table, 16 out of 20
blocks were categorized as ‘over exploited’ in terms of ground water potential, i.e., exploitation
was more than 100 per cent, Nemili and Kaveripakkam blocks were categorized as ‘critical’ with
the exploitation level of 90 -100 per cent and the remaining two blocks, namely, Walajah and
Arakonam blocks were in ‘semi critical condition’ with the exploitation level of 70 - 90 per cent.
District Agriculture Plan – Vellore District 22
Table 2.13 Block wise Ground Water Potential in Vellore District
Over Exploited (More than 100%)
Critical (Dark: 90 – 100%)
Semi Critical (Grey: 70 -90%)
Safe (White: Less than
70%) Vellore Nemili Walaja NIL Kaniyambadi Kaveripakkam Arakonam Anaicut Gudiyatham K.V.Kuppam Katpadi Madhanur Pernambut Alangayam Tirupathur Jolarpet Kandili Natrampalli Sholinghur Arcot Timiri
Source: Records of Office of the Joint Director of Agriculture, Vellore.
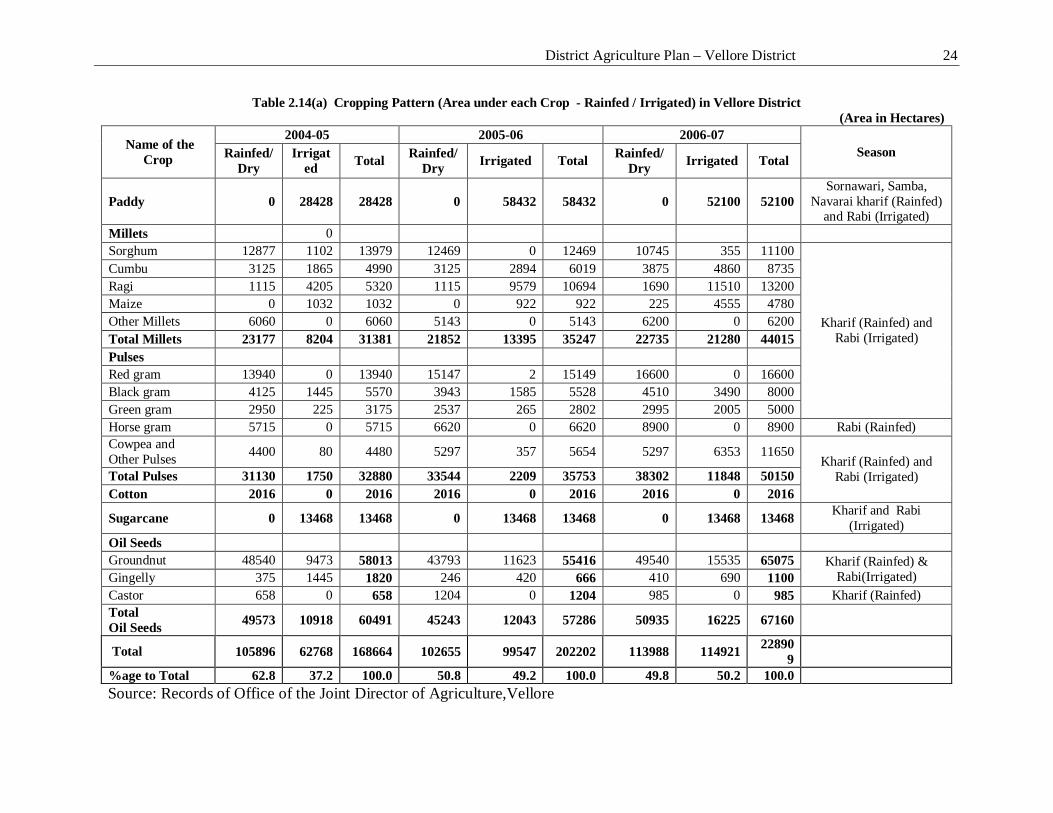
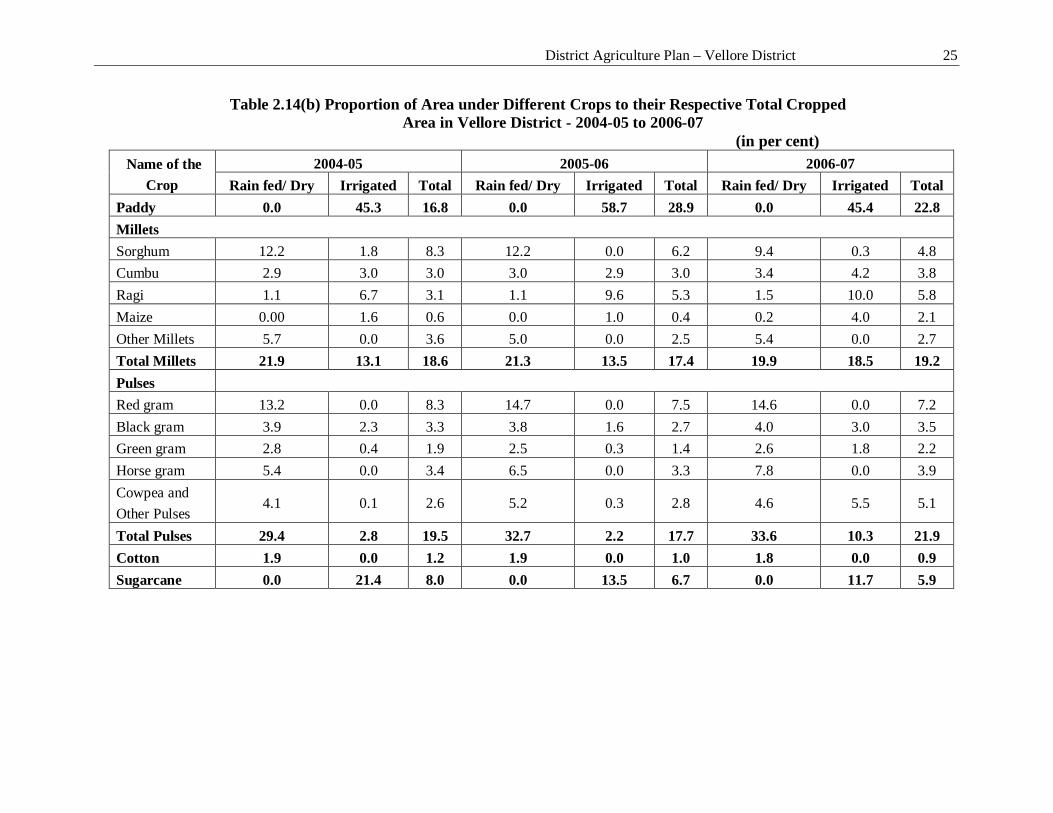
2.2.6 Cropping Pattern
Area under different crops in Vellore district is given in Tables 2.14(a) and 214(b). As
could be seen from Table 2.14(a), area under irrigated crops was slightly higher (50.2 per cent of
the total cropped area) in the district than that of rainfed crops. In Table 2.14(b), proportions of
area under different crops to total cropped area in the district are given. There was a tremendous
increase in the area under paddy from 28,428 hectares in 2004-05 to 58432 hectares in 2005-06
and to 52,100 hectares in 2006-07. Similarly, the area under millets, pulses and oil seeds had
been increased in 2006-07 as compared to that of 2004-05. Gross cropped area had increased
from 1.7 lakh hectares to 2.3 lakh hectares for the same period accounting for an increase of 36
per cent. Ground nut was the predominant crop with 28.4 per cent of the total cropped area and it
was followed by paddy (22.8 per cent), red gram (7.2 per cent), sugar cane (5.9 per cent), ragi
(5.8 per cent) and so on during 2006-07. Food grains like cereals and pulses together accounted
for 64 per cent of the total cropped area.
District Agriculture Plan – Vellore District 23
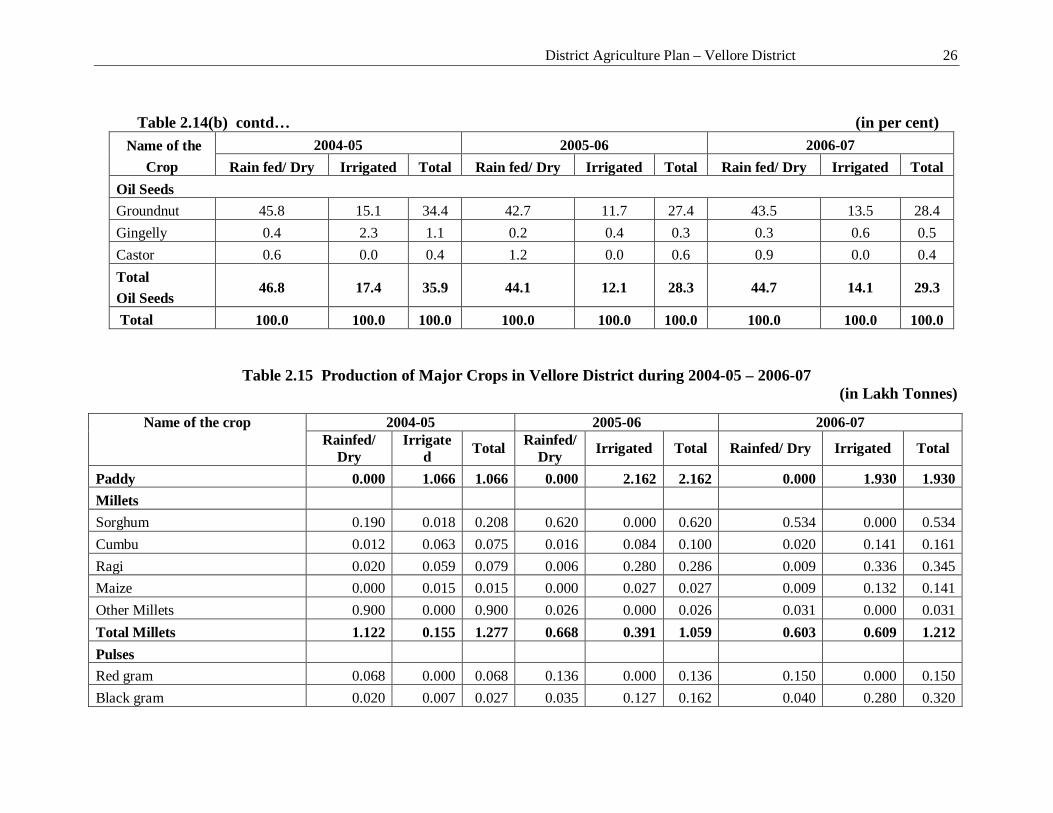
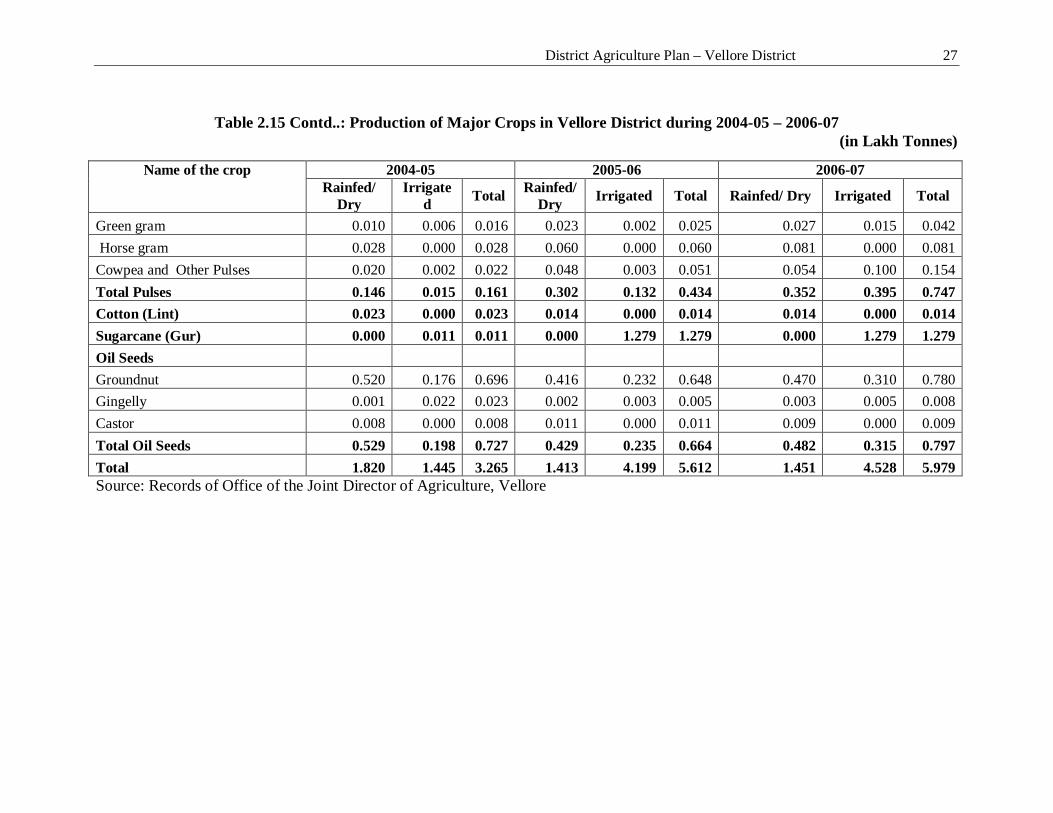
Production details of different crops are given in Table 2.15. Paddy production had
increased from 1.1 lakh tonnes in 2004-05 to 1.9 lakh tonnes in 2006-07 accounting for an
increase of 81 per cent. The increase in production of paddy was more than that of its area
obviously because of increase in the productivity. The productivity of paddy was 3500 kgs per
hectares in 2004-05 and it increased to 3704 kgs per hectares in 2006-07. Similarly, production
of select crops in Vellore district showed increase in 2006-07 as compared to that of 2004-05.
Production of all the select crops was 3.3 lakh tonnes in 2004-05 and it rose to 6.0 lakh tonnes in
2006-07. However, the production of rainfed crops was almost static between 2004-05 and 2006-
07 and the increase in overall production was due to increase in the production of irrigated crops,
i.e., from 3.3 to 4.5 lakh tonnes for the same period accounting for an increase of 39 per cent.
Therefore, it requires greater efforts to increase the production of rainfed crops which occupied
about forty per cent of the net sown area.
District Agriculture Plan – Vellore District 24
Table 2.14(a) Cropping Pattern (Area under each Crop - Rainfed / Irrigated) in Vellore District (Area in Hectares)
Name of the Crop
2004-05 2005-06 2006-07 Season Rainfed/
Dry Irrigat
ed Total Rainfed/ Dry Irrigated Total Rainfed/
Dry Irrigated Total
Paddy 0 28428 28428 0 58432 58432 0 52100 52100 Sornawari, Samba,
Navarai kharif (Rainfed) and Rabi (Irrigated)
Millets 0 Sorghum 12877 1102 13979 12469 0 12469 10745 355 11100
Kharif (Rainfed) and Rabi (Irrigated)
Cumbu 3125 1865 4990 3125 2894 6019 3875 4860 8735 Ragi 1115 4205 5320 1115 9579 10694 1690 11510 13200 Maize 0 1032 1032 0 922 922 225 4555 4780 Other Millets 6060 0 6060 5143 0 5143 6200 0 6200 Total Millets 23177 8204 31381 21852 13395 35247 22735 21280 44015 Pulses Red gram 13940 0 13940 15147 2 15149 16600 0 16600 Black gram 4125 1445 5570 3943 1585 5528 4510 3490 8000 Green gram 2950 225 3175 2537 265 2802 2995 2005 5000 Horse gram 5715 0 5715 6620 0 6620 8900 0 8900 Rabi (Rainfed) Cowpea and Other Pulses 4400 80 4480 5297 357 5654 5297 6353 11650
Kharif (Rainfed) and Rabi (Irrigated) Total Pulses 31130 1750 32880 33544 2209 35753 38302 11848 50150
Cotton 2016 0 2016 2016 0 2016 2016 0 2016
Sugarcane 0 13468 13468 0 13468 13468 0 13468 13468 Kharif and Rabi (Irrigated)
Oil Seeds Groundnut 48540 9473 58013 43793 11623 55416 49540 15535 65075 Kharif (Rainfed) &
Rabi(Irrigated) Gingelly 375 1445 1820 246 420 666 410 690 1100 Castor 658 0 658 1204 0 1204 985 0 985 Kharif (Rainfed) Total Oil Seeds 49573 10918 60491 45243 12043 57286 50935 16225 67160
Total 105896 62768 168664 102655 99547 202202 113988 114921 228909
%age to Total 62.8 37.2 100.0 50.8 49.2 100.0 49.8 50.2 100.0 Source: Records of Office of the Joint Director of Agriculture,Vellore
District Agriculture Plan – Vellore District 25
Table 2.14(b) Proportion of Area under Different Crops to their Respective Total Cropped Area in Vellore District - 2004-05 to 2006-07
(in per cent) Name of the
Crop 2004-05 2005-06 2006-07
Rain fed/ Dry Irrigated Total Rain fed/ Dry Irrigated Total Rain fed/ Dry Irrigated Total Paddy 0.0 45.3 16.8 0.0 58.7 28.9 0.0 45.4 22.8 Millets Sorghum 12.2 1.8 8.3 12.2 0.0 6.2 9.4 0.3 4.8 Cumbu 2.9 3.0 3.0 3.0 2.9 3.0 3.4 4.2 3.8 Ragi 1.1 6.7 3.1 1.1 9.6 5.3 1.5 10.0 5.8 Maize 0.00 1.6 0.6 0.0 1.0 0.4 0.2 4.0 2.1 Other Millets 5.7 0.0 3.6 5.0 0.0 2.5 5.4 0.0 2.7 Total Millets 21.9 13.1 18.6 21.3 13.5 17.4 19.9 18.5 19.2 Pulses Red gram 13.2 0.0 8.3 14.7 0.0 7.5 14.6 0.0 7.2 Black gram 3.9 2.3 3.3 3.8 1.6 2.7 4.0 3.0 3.5 Green gram 2.8 0.4 1.9 2.5 0.3 1.4 2.6 1.8 2.2 Horse gram 5.4 0.0 3.4 6.5 0.0 3.3 7.8 0.0 3.9 Cowpea and Other Pulses
4.1 0.1 2.6 5.2 0.3 2.8 4.6 5.5 5.1
Total Pulses 29.4 2.8 19.5 32.7 2.2 17.7 33.6 10.3 21.9 Cotton 1.9 0.0 1.2 1.9 0.0 1.0 1.8 0.0 0.9 Sugarcane 0.0 21.4 8.0 0.0 13.5 6.7 0.0 11.7 5.9
District Agriculture Plan – Vellore District 26
Table 2.14(b) contd… (in per cent)
Name of the Crop
2004-05 2005-06 2006-07 Rain fed/ Dry Irrigated Total Rain fed/ Dry Irrigated Total Rain fed/ Dry Irrigated Total
Oil Seeds Groundnut 45.8 15.1 34.4 42.7 11.7 27.4 43.5 13.5 28.4 Gingelly 0.4 2.3 1.1 0.2 0.4 0.3 0.3 0.6 0.5 Castor 0.6 0.0 0.4 1.2 0.0 0.6 0.9 0.0 0.4 Total Oil Seeds
46.8 17.4 35.9 44.1 12.1 28.3 44.7 14.1 29.3
Total 100.0 100.0 100.0 100.0 100.0 100.0 100.0 100.0 100.0
Table 2.15 Production of Major Crops in Vellore District during 2004-05 – 2006-07 (in Lakh Tonnes)
Name of the crop 2004-05 2005-06 2006-07 Rainfed/
Dry Irrigate
d Total Rainfed/ Dry Irrigated Total Rainfed/ Dry Irrigated Total
Paddy 0.000 1.066 1.066 0.000 2.162 2.162 0.000 1.930 1.930 Millets Sorghum 0.190 0.018 0.208 0.620 0.000 0.620 0.534 0.000 0.534 Cumbu 0.012 0.063 0.075 0.016 0.084 0.100 0.020 0.141 0.161 Ragi 0.020 0.059 0.079 0.006 0.280 0.286 0.009 0.336 0.345 Maize 0.000 0.015 0.015 0.000 0.027 0.027 0.009 0.132 0.141 Other Millets 0.900 0.000 0.900 0.026 0.000 0.026 0.031 0.000 0.031 Total Millets 1.122 0.155 1.277 0.668 0.391 1.059 0.603 0.609 1.212 Pulses Red gram 0.068 0.000 0.068 0.136 0.000 0.136 0.150 0.000 0.150 Black gram 0.020 0.007 0.027 0.035 0.127 0.162 0.040 0.280 0.320
District Agriculture Plan – Vellore District 27
Table 2.15 Contd..: Production of Major Crops in Vellore District during 2004-05 – 2006-07
(in Lakh Tonnes)
Name of the crop 2004-05 2005-06 2006-07 Rainfed/
Dry Irrigate
d Total Rainfed/ Dry Irrigated Total Rainfed/ Dry Irrigated Total
Green gram 0.010 0.006 0.016 0.023 0.002 0.025 0.027 0.015 0.042 Horse gram 0.028 0.000 0.028 0.060 0.000 0.060 0.081 0.000 0.081 Cowpea and Other Pulses 0.020 0.002 0.022 0.048 0.003 0.051 0.054 0.100 0.154 Total Pulses 0.146 0.015 0.161 0.302 0.132 0.434 0.352 0.395 0.747 Cotton (Lint) 0.023 0.000 0.023 0.014 0.000 0.014 0.014 0.000 0.014 Sugarcane (Gur) 0.000 0.011 0.011 0.000 1.279 1.279 0.000 1.279 1.279 Oil Seeds Groundnut 0.520 0.176 0.696 0.416 0.232 0.648 0.470 0.310 0.780 Gingelly 0.001 0.022 0.023 0.002 0.003 0.005 0.003 0.005 0.008 Castor 0.008 0.000 0.008 0.011 0.000 0.011 0.009 0.000 0.009 Total Oil Seeds 0.529 0.198 0.727 0.429 0.235 0.664 0.482 0.315 0.797 Total 1.820 1.445 3.265 1.413 4.199 5.612 1.451 4.528 5.979 Source: Records of Office of the Joint Director of Agriculture, Vellore
District Agriculture Plan – Vellore District 28
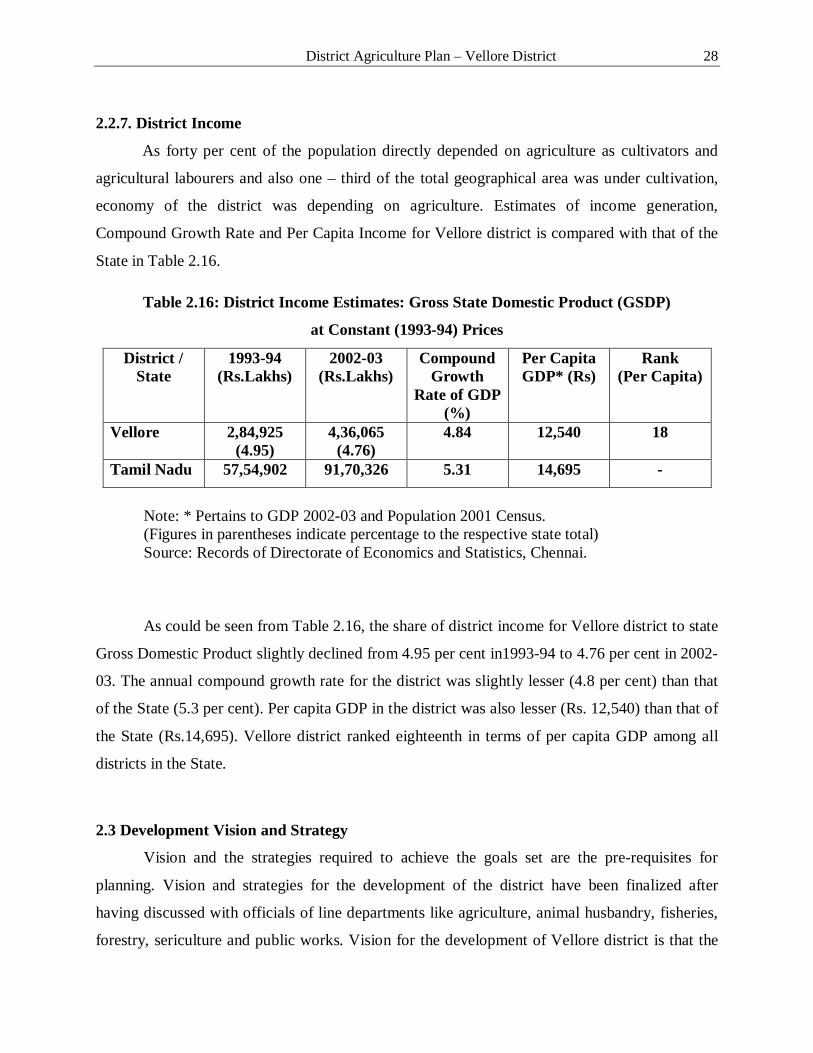
2.2.7. District Income
As forty per cent of the population directly depended on agriculture as cultivators and
agricultural labourers and also one – third of the total geographical area was under cultivation,
economy of the district was depending on agriculture. Estimates of income generation,
Compound Growth Rate and Per Capita Income for Vellore district is compared with that of the
State in Table 2.16.
Table 2.16: District Income Estimates: Gross State Domestic Product (GSDP)
at Constant (1993-94) Prices
District / State
1993-94 (Rs.Lakhs)
2002-03 (Rs.Lakhs)
Compound Growth
Rate of GDP (%)
Per Capita GDP* (Rs)
Rank (Per Capita)
Vellore 2,84,925 (4.95)
4,36,065 (4.76)
4.84
12,540 18
Tamil Nadu 57,54,902 91,70,326 5.31 14,695 -
Note: * Pertains to GDP 2002-03 and Population 2001 Census. (Figures in parentheses indicate percentage to the respective state total) Source: Records of Directorate of Economics and Statistics, Chennai.
As could be seen from Table 2.16, the share of district income for Vellore district to state
Gross Domestic Product slightly declined from 4.95 per cent in1993-94 to 4.76 per cent in 2002-
03. The annual compound growth rate for the district was slightly lesser (4.8 per cent) than that
of the State (5.3 per cent). Per capita GDP in the district was also lesser (Rs. 12,540) than that of
the State (Rs.14,695). Vellore district ranked eighteenth in terms of per capita GDP among all
districts in the State.
2.3 Development Vision and Strategy
Vision and the strategies required to achieve the goals set are the pre-requisites for
planning. Vision and strategies for the development of the district have been finalized after
having discussed with officials of line departments like agriculture, animal husbandry, fisheries,
forestry, sericulture and public works. Vision for the development of Vellore district is that the
District Agriculture Plan – Vellore District 29
holistic development of the district could be achieved through the development of agricultural
activities supported by allied activities such as animal husbandry, fisheries, forestry and
sericulture activities. Major objectives of the Vellore District Agriculture Plan are :
To generat e addit iona l inco me to far ming communit y. To deve lop ent repreneurship among far mers. To generat e emplo yment opportunit ies. To make va lue add it ion to agr icu ltura l p roduct s.
The strategies required to achieve these objectives are:
• Development of suitable technologies such as varietal improvement, input management supported by a strong institutional arrangements for the supply of inputs like seed, fertilizers, plant protection chemicals, credit, etc, price support system favourable to farmers, and market infrastructure for major crops like paddy, sorghum, maize, red gram, sugarcane, ground nut, gingelly, banana, vegetables, cotton and fodder crops.
• Encouraging Maize as an a lt er nat e crop fo r paddy through cont ract far ming.
• Development of minor irrigation with drip irrigation system.
• Mechanization of farms with tractor operated – combined harvester, paddy transplanter, ground nut decorticator, etc.
• Strengthening water harvesting structures like farm ponds and check dams. • Reclamation of fallow and degraded lands. • Formation of Commodity Groups for major crops like ground nut, maize, coconut
and pulses. • Training and exposure visit to the farmers, traders, and other stakeholders on
grading, post harvest technologies, value addition and market intelligence. • Strengthening the extension machinery for effective dissemination of technology.
• Establishment of food parks to create necessary infrastructure for value addition in agricultural products.
• Strengthening of rural markets with storage facilities. • Strengthening of farmers’ market with additional storage facilities. • Establishment of cool chains for better distribution of milk. • Establishment of cattle feed units. • Inland fisheries development in major tanks and reservoirs. • Development of Sericulture.
District Agriculture Plan – Vellore District 30
CHAPTER - III
SWOT ANALYSIS
3.1 Introduction
SWOT analysis helps in assessment and utilization of resources accurately. It also
provides details on unfavourable aspects of a plan and offers a coping mechanism to
overcome the problems in the execution of the plan.
3.2 Composite Index of Agricultural Development of Vellore District
Agricultural Development of a district is a comprehensive multi-dimensional
process involving large number of related indicators. Hence, it can be well represented by
composite indices which are used as yardsticks not only to gauge the development of
each district but also to compare its performance in relation to other districts. These
indices help to classify the sub-regions based on a set of large multivariate data. The
information contained in the large set is transformed into a small set of indices which
would provide a convenient method for classification. There are many methods of
classification based on multivariate data. Among them, one method which is statistically
sound is that developed by Iyengar and Sudarshan (1982). This method is simple and
easy to apply and it helps to classify the districts into various stages of development, viz.,
‘highly developed’, ‘developed’, ‘developing’, ‘backward’ and ‘very backward’. In this
method, for each district a ‘composite index’ is constructed. The index lies between 0 and
1 with 1 representing 100 per cent development and 0 representing no development at all.
It is assumed that there are ‘n’ districts and ‘m’ development indicators and that
idX is the observed value of thi development indicator for the thd district (i = 1,2,3 … m,
and d = 1,2,3…n). First, these values of development indicators for each district are to
be standardized. When the observed values are related positively to the development (as
in the case of cropping intensity), the standardization is achieved by employing the
formula:
( ) / ( )id id id id idy X Min X Max X Min X= - -

District Agriculture Plan – Vellore District 31
where idMin X and idMax X are the minimum and maximum of 1 2( , ,.... )i i inX X X
respectively. When the values of idX are negatively related to the development (as in the
case of area under wastelands, problem soils etc.,) the standardized values have been
computed by the formula:
( ) / ( )id id id id idy Max X X Max X Min X= - -
Obviously the standardized indices lie between 0 and 1. These indices are then
used to determine the weights of individual variable and then they are subjected to further
statistical analysis by fitting suitable probability distribution to determine the cut-off
points for classification of the districts into five categories as mentioned above. The
detailed methodology can be found in Iyengar and Sudarshan (1982).
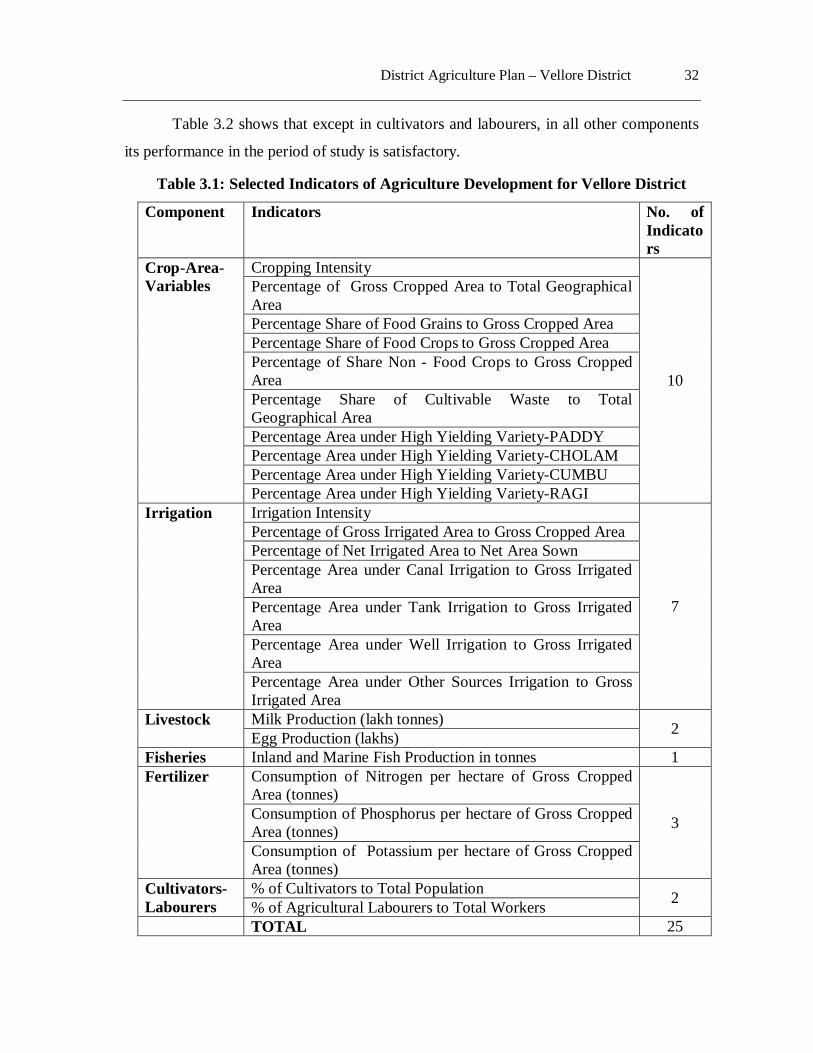
The data base for the current study on Vellore district is taken from various
government publications like Season and Crops Report and Economic Appraisal of Tamil
Nadu for the four periods 1990-91, 1995-96, 2000-01 and 2005-06. In all, 25 indicators
of agricultural development as given in Table 3.1 were used for estimating the composite
index of development for the district. The 25 indicators were grouped into six different
‘components’, viz., i) Crop-Area-Variables (10); ii) Irrigation (7); iii) Livestock (3); iv)
Fisheries (1); v) Fertilizer (3) and vi) Cultivators and Labourers (2).
The analysis showed that Vellore district which was classified as ‘developing’ in
agricultural development during 1990-91 became ‘developed’ in agriculture during 1995-
96 to 2005-06. In terms of overall agricultural development, its rank among the 29
districts of Tamil Nadu varied from 9 to 16 between 1990-91 and 2005-06. As far as the
individual components of agricultural development are concerned, its ranks in the above
periods are summarized in Table 3.2.
District Agriculture Plan – Vellore District 32
Table 3.2 shows that except in cultivators and labourers, in all other components
its performance in the period of study is satisfactory.
Table 3.1: Selected Indicators of Agriculture Development for Vellore District
Component Indicators No. of Indicators
Crop-Area-Variables
Cropping Intensity
10
Percentage of Gross Cropped Area to Total Geographical Area Percentage Share of Food Grains to Gross Cropped Area Percentage Share of Food Crops to Gross Cropped Area Percentage of Share Non - Food Crops to Gross Cropped Area Percentage Share of Cultivable Waste to Total Geographical Area Percentage Area under High Yielding Variety-PADDY Percentage Area under High Yielding Variety-CHOLAM Percentage Area under High Yielding Variety-CUMBU Percentage Area under High Yielding Variety-RAGI
Irrigation Irrigation Intensity
7
Percentage of Gross Irrigated Area to Gross Cropped Area Percentage of Net Irrigated Area to Net Area Sown Percentage Area under Canal Irrigation to Gross Irrigated Area Percentage Area under Tank Irrigation to Gross Irrigated Area Percentage Area under Well Irrigation to Gross Irrigated Area Percentage Area under Other Sources Irrigation to Gross Irrigated Area
Livestock Milk Production (lakh tonnes) 2 Egg Production (lakhs) Fisheries Inland and Marine Fish Production in tonnes 1 Fertilizer Consumption of Nitrogen per hectare of Gross Cropped
Area (tonnes)
3 Consumption of Phosphorus per hectare of Gross Cropped Area (tonnes) Consumption of Potassium per hectare of Gross Cropped Area (tonnes)
Cultivators-Labourers
% of Cultivators to Total Population 2 % of Agricultural Labourers to Total Workers TOTAL 25
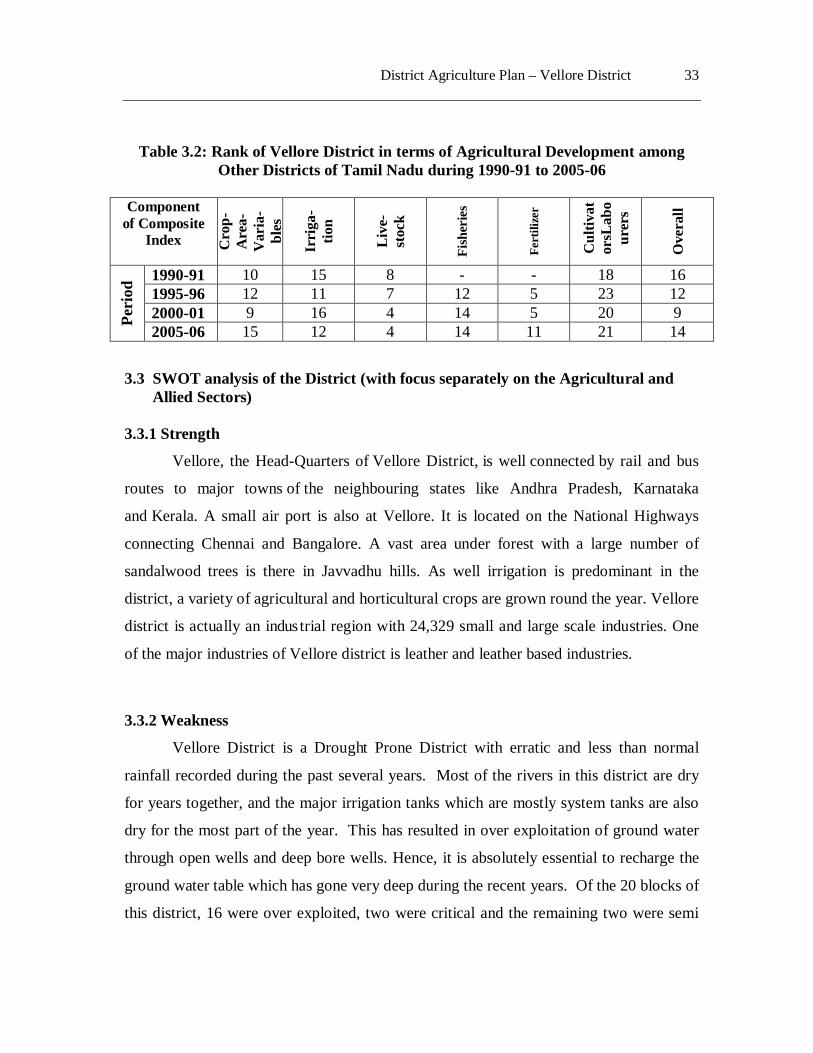
District Agriculture Plan – Vellore District 33
Table 3.2: Rank of Vellore District in terms of Agricultural Development among Other Districts of Tamil Nadu during 1990-91 to 2005-06
Component
of Composite Index C
rop-
Are
a-V
aria
-bl
es
Irri
ga-
tion
Liv
e-
stoc
k
Fish
erie
s
Fert
ilize
r
Cul
tivat
orsL
abo
urer
s
Ove
rall
Peri
od 1990-91 10 15 8 - - 18 16
1995-96 12 11 7 12 5 23 12 2000-01 9 16 4 14 5 20 9 2005-06 15 12 4 14 11 21 14
3.3 SWOT analysis of the District (with focus separately on the Agricultural and Allied Sectors) 3.3.1 Strength
Vellore, the Head-Quarters of Vellore District, is well connected by rail and bus
routes to major towns of the neighbouring states like Andhra Pradesh, Karnataka
and Kerala. A small air port is also at Vellore. It is located on the National Highways
connecting Chennai and Bangalore. A vast area under forest with a large number of
sandalwood trees is there in Javvadhu hills. As well irrigation is predominant in the
district, a variety of agricultural and horticultural crops are grown round the year. Vellore
district is actually an industrial region with 24,329 small and large scale industries. One
of the major industries of Vellore district is leather and leather based industries.
3.3.2 Weakness
Vellore District is a Drought Prone District with erratic and less than normal
rainfall recorded during the past several years. Most of the rivers in this district are dry
for years together, and the major irrigation tanks which are mostly system tanks are also
dry for the most part of the year. This has resulted in over exploitation of ground water
through open wells and deep bore wells. Hence, it is absolutely essential to recharge the
ground water table which has gone very deep during the recent years. Of the 20 blocks of
this district, 16 were over exploited, two were critical and the remaining two were semi
District Agriculture Plan – Vellore District 34
critical in terms of exploitation of ground water potential. In Arakonam block, 43.3 per
cent of the total geographical area was under cultivable waste and current and other
fallow lands, and it was followed by Kandili (35.2 per cent), Walajah (32.9 per cent),
Kaveripakkam (32.8 per cent), Timiri (32.8 per cent) blocks and so on. The area under
the waste and fallow lands in the district also was around one – fifth of the total
geographical area during 2005-06. Proper planning and reclamation of these lands alone
could enhance the net sown area in the district which was only 33 per cent of the total
geographical area.
3.3.3 Opportunities
The industrial development is tremendous in the major towns of this district like
Arakonam, Ranipet, Vellore and Thiruppathur, as there is a four lane National Highways
and double line electrified rail track connectivity linking these towns with Chennai and
Bangalore. As there is a heavy demand for construction materials like sand and crushed
stone from Chennai, sand quarrying from Palar and stone quarrying are carried out in a
large scale in the district. As there is a heavy demand for fruits, vegetables and flowers
from the nearby Chennai city, farmers who cultivate these crops are much benefited.
Surplus milk produced in this district is also being transported daily to Chennai from
Vellore dairy unit.
3.3.4 Threats
Vellore District is very near to Chennai and Bangalore cities and this has resulted
in the large scale migration of farm labourers. This has resulted in a great demand for
agricultural labourers and the farmers in this district face a lot of problems in getting farm
labourers.
Already Karnataka state has built a dam in Palar River and Andhra Pradesh is also
taking steps to construct a dam across Palar. Hence, the irrigated lands of Vellore district
depending on Palar water during monsoon season may totally become dry.As leather
District Agriculture Plan – Vellore District 35
industries earn huge foreign exchange through the export of leather and leather products,
they may flourish more. At the same time, if the effluents produced are not properly
treated and let out by them, then it would cause a wide spread soil and water pollution in
the district. This in turn, would not only drastically reduce the crop productivity, but also
create problems like scarcity of drinking water and skin diseases to those who live in
areas polluted by the tannery effluents.
3.4 Sectoral / Regional Growth Drivers of the District
i) Formation of commodity groups.
ii) Training the farmers, traders, and other stakeholders on grading, post harvest technologies, value addition and market intelligence.
iii) Establishment of rural godowns with drying yards.
iv) Providing cold storage facility.
v) Encouraging contract farming and
vi) Establishment of "Food Park with basic infrastructure facilities".
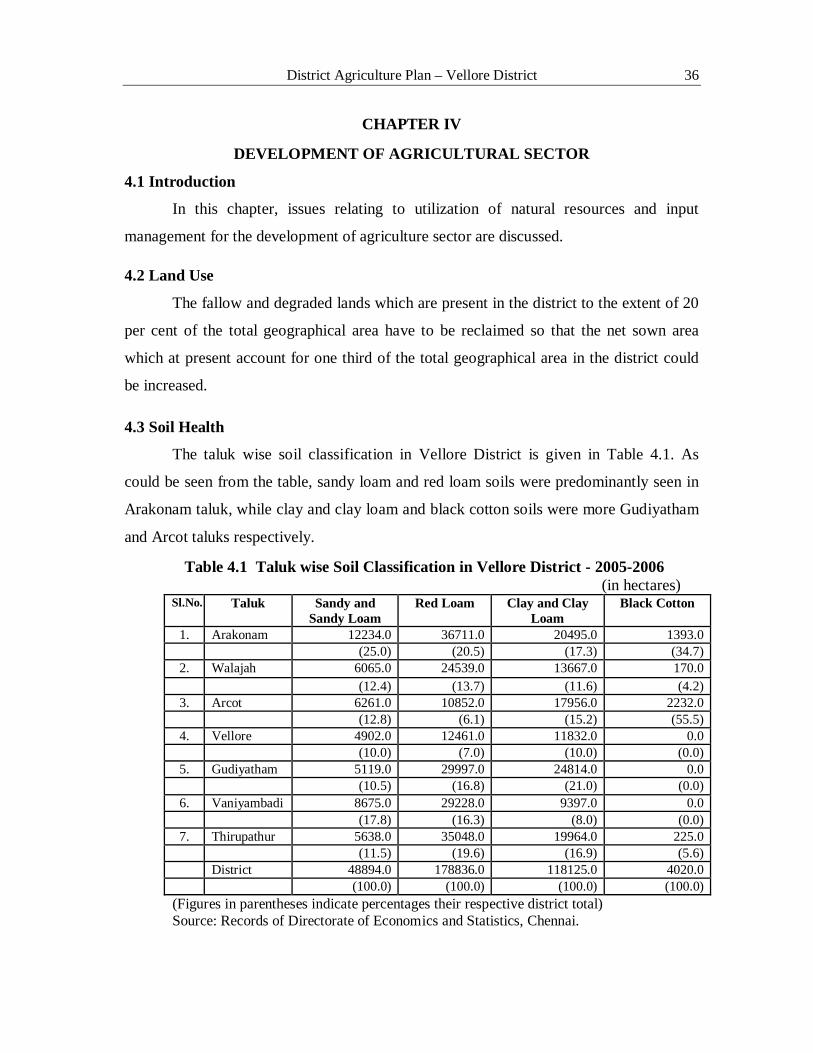
District Agriculture Plan – Vellore District 36
CHAPTER IV
DEVELOPMENT OF AGRICULTURAL SECTOR
4.1 Introduction
In this chapter, issues relating to utilization of natural resources and input
management for the development of agriculture sector are discussed.
4.2 Land Use
The fallow and degraded lands which are present in the district to the extent of 20
per cent of the total geographical area have to be reclaimed so that the net sown area
which at present account for one third of the total geographical area in the district could
be increased.
4.3 Soil Health
The taluk wise soil classification in Vellore District is given in Table 4.1. As
could be seen from the table, sandy loam and red loam soils were predominantly seen in
Arakonam taluk, while clay and clay loam and black cotton soils were more Gudiyatham
and Arcot taluks respectively.
Table 4.1 Taluk wise Soil Classification in Vellore District - 2005-2006 (in hectares)
Sl.No. Taluk Sandy and Sandy Loam
Red Loam Clay and Clay Loam
Black Cotton
1. Arakonam 12234.0 36711.0 20495.0 1393.0 (25.0) (20.5) (17.3) (34.7)
2. Walajah 6065.0 24539.0 13667.0 170.0 (12.4) (13.7) (11.6) (4.2)
3. Arcot 6261.0 10852.0 17956.0 2232.0 (12.8) (6.1) (15.2) (55.5)
4. Vellore 4902.0 12461.0 11832.0 0.0 (10.0) (7.0) (10.0) (0.0)
5. Gudiyatham 5119.0 29997.0 24814.0 0.0 (10.5) (16.8) (21.0) (0.0)
6. Vaniyambadi 8675.0 29228.0 9397.0 0.0 (17.8) (16.3) (8.0) (0.0)
7. Thirupathur 5638.0 35048.0 19964.0 225.0 (11.5) (19.6) (16.9) (5.6) District 48894.0 178836.0 118125.0 4020.0 (100.0) (100.0) (100.0) (100.0)
(Figures in parentheses indicate percentages their respective district total) Source: Records of Directorate of Economics and Statistics, Chennai.

District Agriculture Plan – Vellore District 37

District Agriculture Plan – Vellore District 38
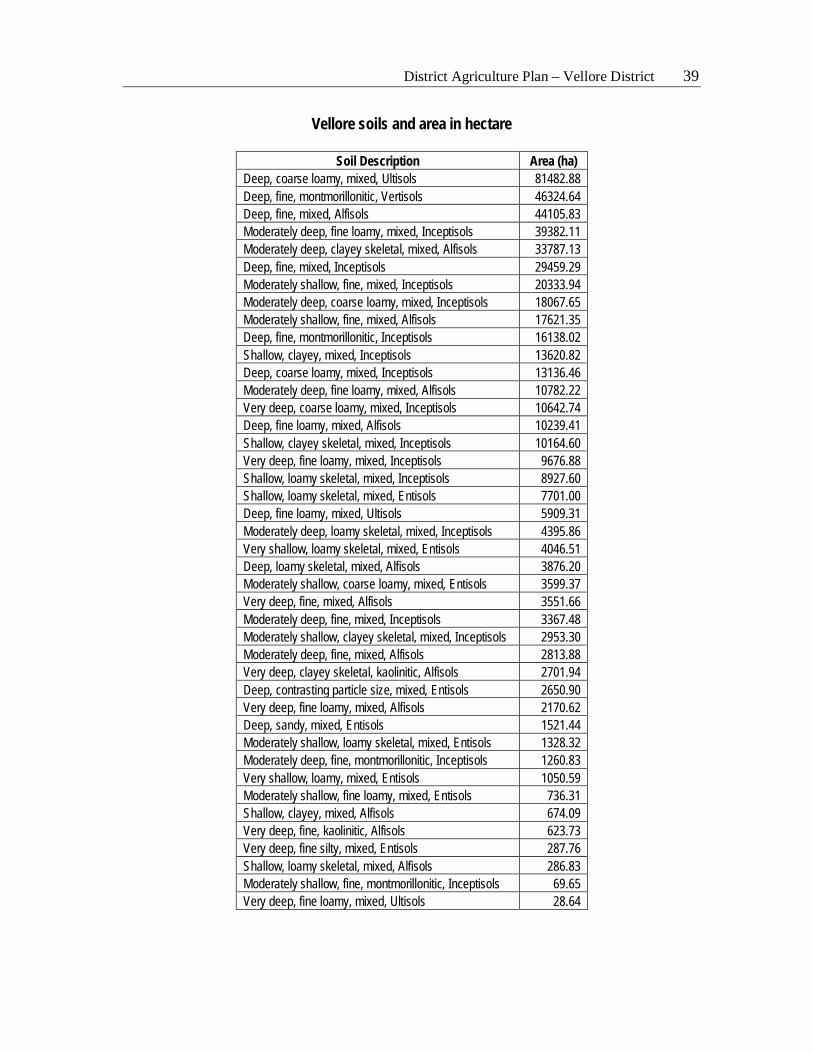
District Agriculture Plan – Vellore District 39
Vellore soils and area in hectare
Soil Description Area (ha) Deep, coarse loamy, mixed, Ultisols 81482.88 Deep, fine, montmorillonitic, Vertisols 46324.64 Deep, fine, mixed, Alfisols 44105.83 Moderately deep, fine loamy, mixed, Inceptisols 39382.11 Moderately deep, clayey skeletal, mixed, Alfisols 33787.13 Deep, fine, mixed, Inceptisols 29459.29 Moderately shallow, fine, mixed, Inceptisols 20333.94 Moderately deep, coarse loamy, mixed, Inceptisols 18067.65 Moderately shallow, fine, mixed, Alfisols 17621.35 Deep, fine, montmorillonitic, Inceptisols 16138.02 Shallow, clayey, mixed, Inceptisols 13620.82 Deep, coarse loamy, mixed, Inceptisols 13136.46 Moderately deep, fine loamy, mixed, Alfisols 10782.22 Very deep, coarse loamy, mixed, Inceptisols 10642.74 Deep, fine loamy, mixed, Alfisols 10239.41 Shallow, clayey skeletal, mixed, Inceptisols 10164.60 Very deep, fine loamy, mixed, Inceptisols 9676.88 Shallow, loamy skeletal, mixed, Inceptisols 8927.60 Shallow, loamy skeletal, mixed, Entisols 7701.00 Deep, fine loamy, mixed, Ultisols 5909.31 Moderately deep, loamy skeletal, mixed, Inceptisols 4395.86 Very shallow, loamy skeletal, mixed, Entisols 4046.51 Deep, loamy skeletal, mixed, Alfisols 3876.20 Moderately shallow, coarse loamy, mixed, Entisols 3599.37 Very deep, fine, mixed, Alfisols 3551.66 Moderately deep, fine, mixed, Inceptisols 3367.48 Moderately shallow, clayey skeletal, mixed, Inceptisols 2953.30 Moderately deep, fine, mixed, Alfisols 2813.88 Very deep, clayey skeletal, kaolinitic, Alfisols 2701.94 Deep, contrasting particle size, mixed, Entisols 2650.90 Very deep, fine loamy, mixed, Alfisols 2170.62 Deep, sandy, mixed, Entisols 1521.44 Moderately shallow, loamy skeletal, mixed, Entisols 1328.32 Moderately deep, fine, montmorillonitic, Inceptisols 1260.83 Very shallow, loamy, mixed, Entisols 1050.59 Moderately shallow, fine loamy, mixed, Entisols 736.31 Shallow, clayey, mixed, Alfisols 674.09 Very deep, fine, kaolinitic, Alfisols 623.73 Very deep, fine silty, mixed, Entisols 287.76 Shallow, loamy skeletal, mixed, Alfisols 286.83 Moderately shallow, fine, montmorillonitic, Inceptisols 69.65 Very deep, fine loamy, mixed, Ultisols 28.64
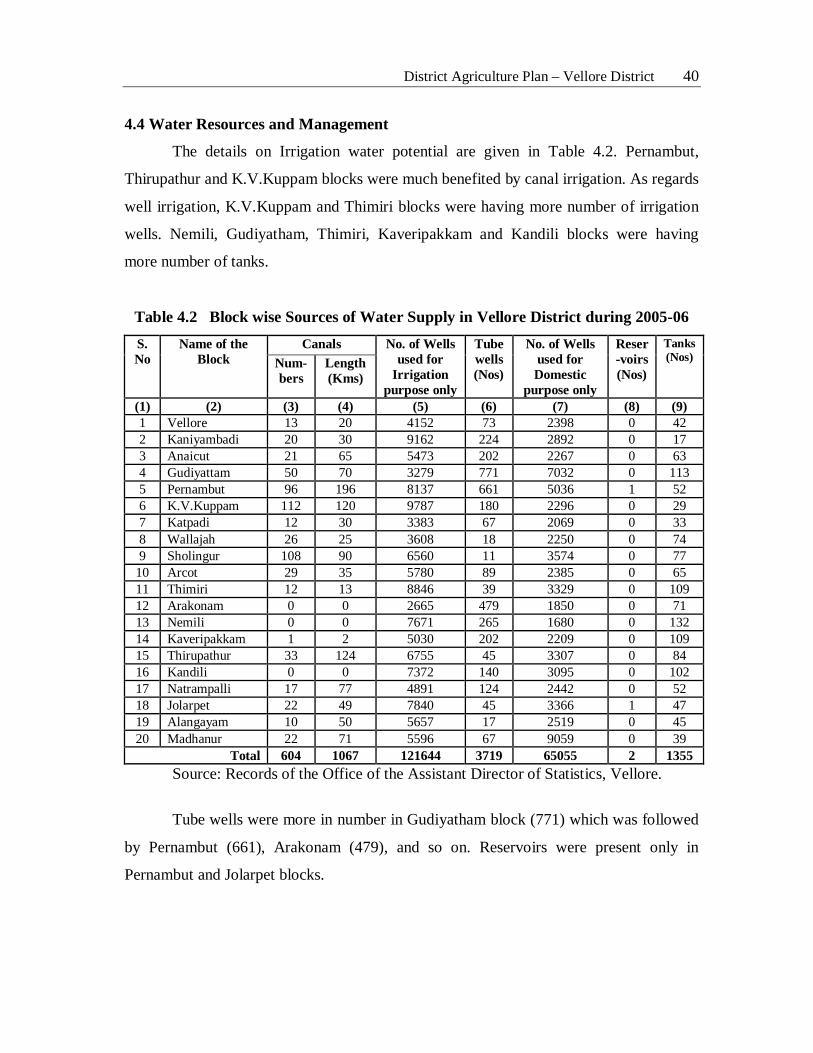
District Agriculture Plan – Vellore District 40
4.4 Water Resources and Management
The details on Irrigation water potential are given in Table 4.2. Pernambut,
Thirupathur and K.V.Kuppam blocks were much benefited by canal irrigation. As regards
well irrigation, K.V.Kuppam and Thimiri blocks were having more number of irrigation
wells. Nemili, Gudiyatham, Thimiri, Kaveripakkam and Kandili blocks were having
more number of tanks.
Table 4.2 Block wise Sources of Water Supply in Vellore District during 2005-06 S. No
Name of the Block
Canals No. of Wells used for
Irrigation purpose only
Tube wells (Nos)
No. of Wells used for Domestic
purpose only
Reser-voirs (Nos)
Tanks (Nos) Num-
bers Length (Kms)
(1) (2) (3) (4) (5) (6) (7) (8) (9) 1 Vellore 13 20 4152 73 2398 0 42 2 Kaniyambadi 20 30 9162 224 2892 0 17 3 Anaicut 21 65 5473 202 2267 0 63 4 Gudiyattam 50 70 3279 771 7032 0 113 5 Pernambut 96 196 8137 661 5036 1 52 6 K.V.Kuppam 112 120 9787 180 2296 0 29 7 Katpadi 12 30 3383 67 2069 0 33 8 Wallajah 26 25 3608 18 2250 0 74 9 Sholingur 108 90 6560 11 3574 0 77
10 Arcot 29 35 5780 89 2385 0 65 11 Thimiri 12 13 8846 39 3329 0 109 12 Arakonam 0 0 2665 479 1850 0 71 13 Nemili 0 0 7671 265 1680 0 132 14 Kaveripakkam 1 2 5030 202 2209 0 109 15 Thirupathur 33 124 6755 45 3307 0 84 16 Kandili 0 0 7372 140 3095 0 102 17 Natrampalli 17 77 4891 124 2442 0 52 18 Jolarpet 22 49 7840 45 3366 1 47 19 Alangayam 10 50 5657 17 2519 0 45 20 Madhanur 22 71 5596 67 9059 0 39
Total 604 1067 121644 3719 65055 2 1355 Source: Records of the Office of the Assistant Director of Statistics, Vellore.
Tube wells were more in number in Gudiyatham block (771) which was followed
by Pernambut (661), Arakonam (479), and so on. Reservoirs were present only in
Pernambut and Jolarpet blocks.
District Agriculture Plan – Vellore District 41
4.5 Major Crops and Varieties in the District
4.5.1 Common Varieties
Common varieties of major crops grown in Vellore district are given below:
i) Paddy ADT 43, ADT 37, IR50, ADT 36 and White Ponni ii) Sorghum Co19 iii) Ragi GPU 28, Co13 iv) Cumbu ICMV 221 v) Red Gram SA 1 and VVN 2 vi) Black Gram - T9, TMV 1, VVN 3 and VVN4 vii) Green Gram VRM-GG-1 and VVN 2
viii) Cow pea Co 6 and Co 7 ix) Horse Gram PYR 1 x) Gingelly TMV 3 and TMV5 xi) Groundnut TMV 7 and JL 24 xii) Tomato PKM 1and US 618
xiii) Brinjal Local (Mullu), Pusa Purple Cluster and Ravayya xiv) Bhendi Arka Anamica, US 7109 and Mahyco 10 xv) Chillies K1, PKM 1, US 635 and Namdhari
xvi) Sugarcane Co-C 6704, Co-C 771, Co-C 93003, Co– C 85061, Co– C 6304, Co-G 94077 and Co-G 93076.
xvii) Banana Robusta, Karpuravalli, Rasthali, Poovan and Tissue Culture – Grand 9
xviii) Mango Neelam, Bangalora, Sendura, Alphonsa and Kalappad xix) Sapota PKM 1, Kalipathi, Cricket Ball and Oval xx) Cotton Bramma, Punny, RCH 2 and DCH 32
xxi) Jasmine Sambac and Pitchi.
4.5.2 Cropping pattern
Cropping pattern in vogue in the district is given below:
a) Wet lands
i) Paddy - Paddy – Pulses ii) Paddy - Paddy – Gingelly iii) Paddy-Paddy-Maize iv) Maize – Paddy - Pulses v) Pulses-Paddy-Maize vi) Sugarcane with Pulses as intercrop vii) Banana with Pulses as inter crop
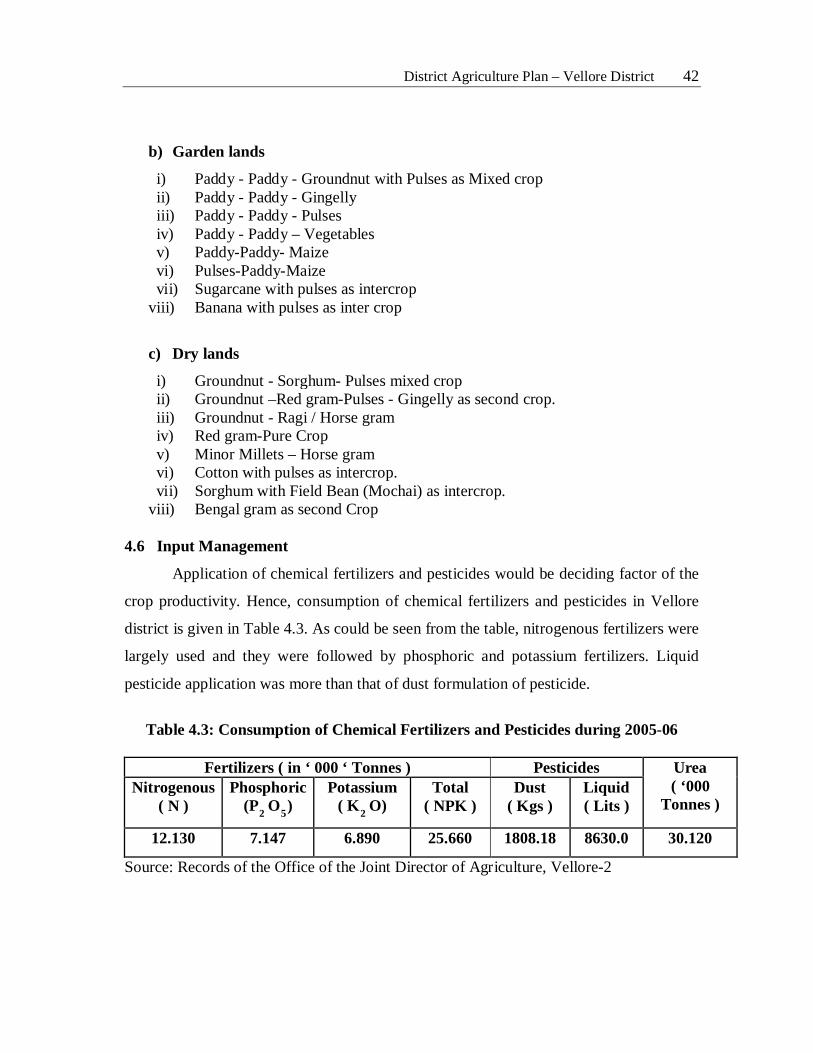
District Agriculture Plan – Vellore District 42
b) Garden lands
i) Paddy - Paddy - Groundnut with Pulses as Mixed crop ii) Paddy - Paddy - Gingelly iii) Paddy - Paddy - Pulses iv) Paddy - Paddy – Vegetables v) Paddy-Paddy- Maize vi) Pulses-Paddy-Maize vii) Sugarcane with pulses as intercrop
viii) Banana with pulses as inter crop
c) Dry lands
i) Groundnut - Sorghum- Pulses mixed crop ii) Groundnut –Red gram-Pulses - Gingelly as second crop. iii) Groundnut - Ragi / Horse gram iv) Red gram-Pure Crop v) Minor Millets – Horse gram vi) Cotton with pulses as intercrop. vii) Sorghum with Field Bean (Mochai) as intercrop.
viii) Bengal gram as second Crop 4.6 Input Management
Application of chemical fertilizers and pesticides would be deciding factor of the
crop productivity. Hence, consumption of chemical fertilizers and pesticides in Vellore
district is given in Table 4.3. As could be seen from the table, nitrogenous fertilizers were
largely used and they were followed by phosphoric and potassium fertilizers. Liquid
pesticide application was more than that of dust formulation of pesticide.
Table 4.3: Consumption of Chemical Fertilizers and Pesticides during 2005-06
Fertilizers ( in ‘ 000 ‘ Tonnes ) Pesticides Urea
( ‘000 Tonnes )
Nitrogenous ( N )
Phosphoric (P2 O5
Potassium ( K) 2
Total ( NPK ) O)
Dust ( Kgs )
Liquid ( Lits )
12.130 7.147 6.890 25.660 1808.18 8630.0 30.120
Source: Records of the Office of the Joint Director of Agriculture, Vellore-2
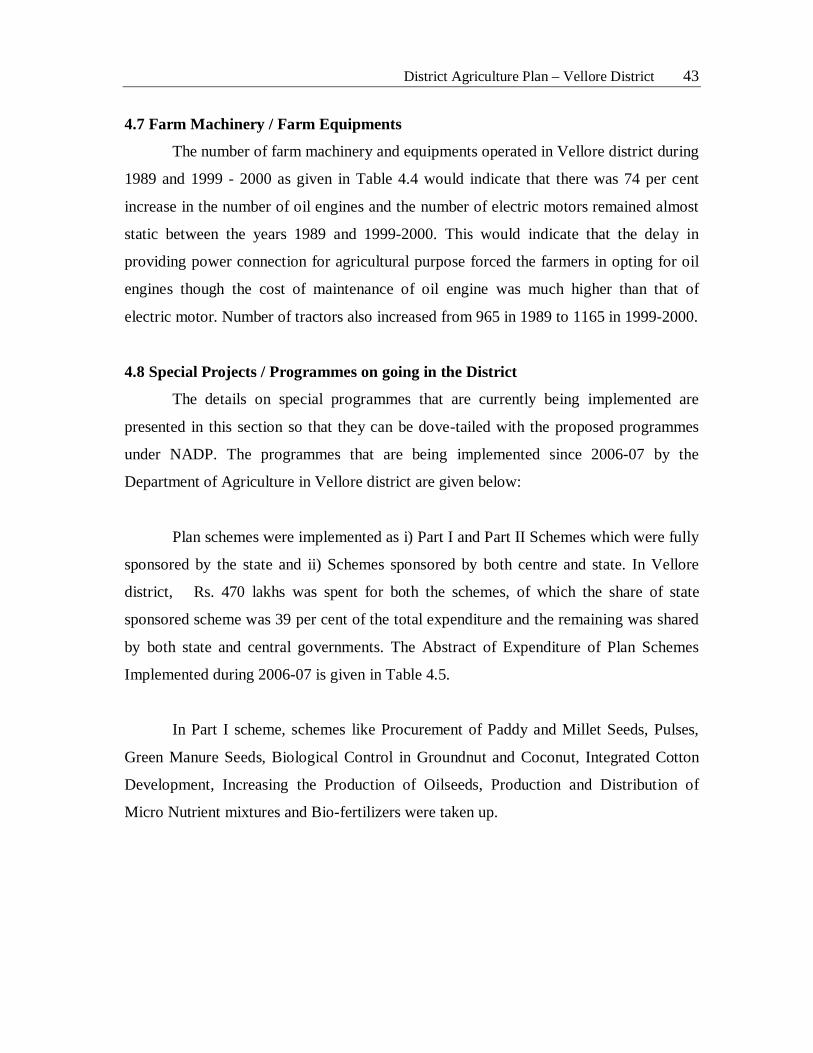
District Agriculture Plan – Vellore District 43
4.7 Farm Machinery / Farm Equipments
The number of farm machinery and equipments operated in Vellore district during
1989 and 1999 - 2000 as given in Table 4.4 would indicate that there was 74 per cent
increase in the number of oil engines and the number of electric motors remained almost
static between the years 1989 and 1999-2000. This would indicate that the delay in
providing power connection for agricultural purpose forced the farmers in opting for oil
engines though the cost of maintenance of oil engine was much higher than that of
electric motor. Number of tractors also increased from 965 in 1989 to 1165 in 1999-2000.
4.8 Special Projects / Programmes on going in the District
The details on special programmes that are currently being implemented are
presented in this section so that they can be dove-tailed with the proposed programmes
under NADP. The programmes that are being implemented since 2006-07 by the
Department of Agriculture in Vellore district are given below:
Plan schemes were implemented as i) Part I and Part II Schemes which were fully
sponsored by the state and ii) Schemes sponsored by both centre and state. In Vellore
district, Rs. 470 lakhs was spent for both the schemes, of which the share of state
sponsored scheme was 39 per cent of the total expenditure and the remaining was shared
by both state and central governments. The Abstract of Expenditure of Plan Schemes
Implemented during 2006-07 is given in Table 4.5.
In Part I scheme, schemes like Procurement of Paddy and Millet Seeds, Pulses,
Green Manure Seeds, Biological Control in Groundnut and Coconut, Integrated Cotton
Development, Increasing the Production of Oilseeds, Production and Distribution of
Micro Nutrient mixtures and Bio-fertilizers were taken up.
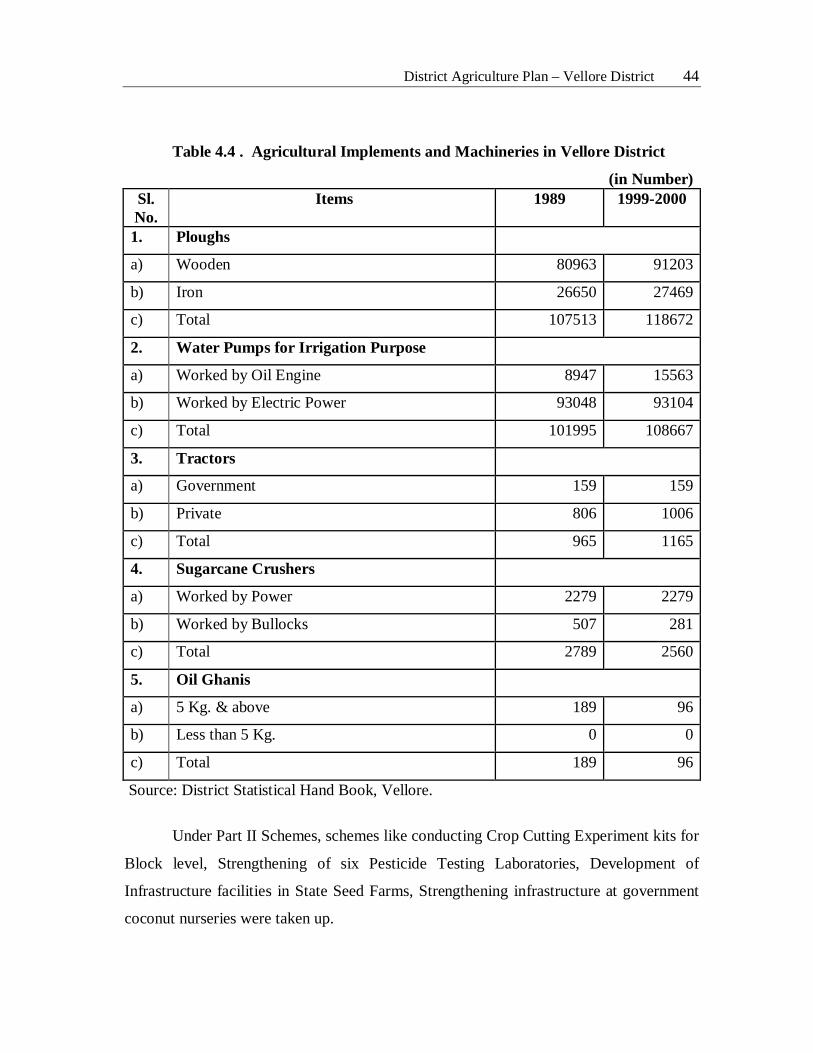
District Agriculture Plan – Vellore District 44
Table 4.4 . Agricultural Implements and Machineries in Vellore District
(in Number) Sl. No.
Items 1989
1999-2000
1. Ploughs
a) Wooden 80963 91203
b) Iron 26650 27469
c) Total 107513 118672
2. Water Pumps for Irrigation Purpose
a) Worked by Oil Engine 8947 15563
b) Worked by Electric Power 93048 93104
c) Total 101995 108667
3. Tractors
a) Government 159 159
b) Private 806 1006
c) Total 965 1165
4. Sugarcane Crushers
a) Worked by Power 2279 2279
b) Worked by Bullocks 507 281
c) Total 2789 2560
5. Oil Ghanis
a) 5 Kg. & above 189 96
b) Less than 5 Kg. 0 0
c) Total 189 96
Source: District Statistical Hand Book, Vellore.
Under Part II Schemes, schemes like conducting Crop Cutting Experiment kits for
Block level, Strengthening of six Pesticide Testing Laboratories, Development of
Infrastructure facilities in State Seed Farms, Strengthening infrastructure at government
coconut nurseries were taken up.
District Agriculture Plan – Vellore District 45
Table 4.5 Abstract of Expenditure of Plan Schemes Implemented during 2006-07
(Rs. in lakhs)
Sl. No Schemes
Budget Estimate
(BE)
Sanc tioned
Amount
Expendi ture
Achieve ment upto 31/03/07
% of Achieve-
ment to BE
% of Achievement to
sanctioned Amount
State Schemes A I. Part I Schemes 173.7 173.7 174.9 101 101 II. Part II Schemes 10.2 10.2 10.2 100 100
Total 183.9 (39.1)
183.9 (39.2)
185.1 (39.3) 101 101
B. Schemes Shared between Centre and State
1
Integrated Scheme for Oilseeds, Pulses, Oil palm and Maize (ISOPOM) (75:25)
120.6 120.4 118.0 98 98
Under ISOPOM -Oilseeds Rs.2.612 lakhs is unspent under staff component (Pay and allowances) as existing vacancies.
2 Technology Mission Mode Scheme (75:25)
3.4 3.4 3.4 100 100
3 Macro Management Mode Schemes (90:10)
80.0 80.0 80.0 100 100
4 Innovative Schemes 38.2 38.2 38.2 100 100
5
Coconut Development Board Schemes (50:50)
19.8 19.5 21.5 108 110
6 Centrally Sponsored Schemes (100%)
24.2 24.2 24.2 100 100
Total 286.2 (60.9)
285.7 (60.8)
285.3 (60.7) 100 100
Grand Total (A + B)
470.1 (100.0)
469.6 (100.0)
470.4 (100.0) 100 100
Source: Records of Office of the Joint Director of Agriculture, Vellore.
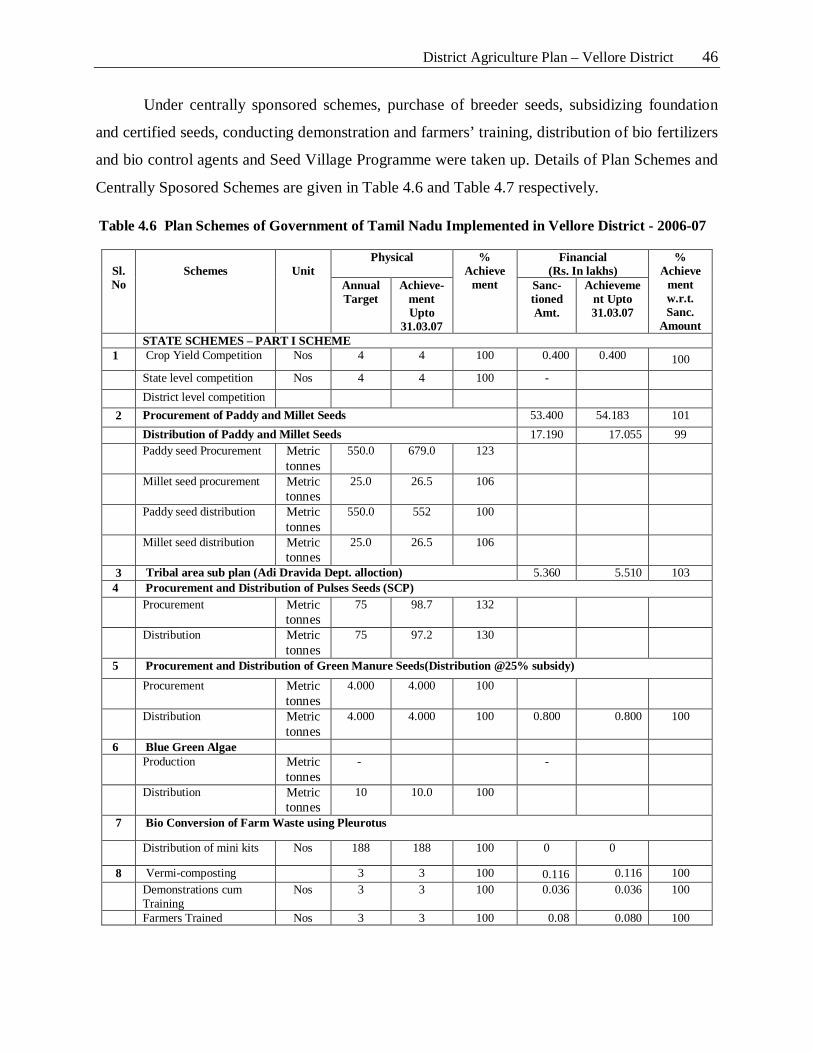
District Agriculture Plan – Vellore District 46
Under centrally sponsored schemes, purchase of breeder seeds, subsidizing foundation
and certified seeds, conducting demonstration and farmers’ training, distribution of bio fertilizers
and bio control agents and Seed Village Programme were taken up. Details of Plan Schemes and
Centrally Sposored Schemes are given in Table 4.6 and Table 4.7 respectively.
Table 4.6 Plan Schemes of Government of Tamil Nadu Implemented in Vellore District - 2006-07
Sl. No
Schemes
Unit
Physical % Achieve
ment
Financial (Rs. In lakhs)
% Achieve
ment w.r.t. Sanc.
Amount
Annual Target
Achieve-ment Upto
31.03.07
Sanc-tioned Amt.
Achievement Upto 31.03.07
STATE SCHEMES – PART I SCHEME 1 Crop Yield Competition Nos 4 4 100 0.400 0.400 100
State level competition Nos 4 4 100 - District level competition
2 Procurement of Paddy and Millet Seeds 53.400 54.183 101 Distribution of Paddy and Millet Seeds 17.190 17.055 99 Paddy seed Procurement Metric
tonnes 550.0 679.0 123
Millet seed procurement Metric tonnes
25.0 26.5 106
Paddy seed distribution Metric tonnes
550.0 552 100
Millet seed distribution Metric tonnes
25.0 26.5 106
3 Tribal area sub plan (Adi Dravida Dept. alloction) 5.360 5.510 103 4 Procurement and Distribution of Pulses Seeds (SCP)
Procurement Metric tonnes
75 98.7 132
Distribution Metric tonnes
75 97.2 130
5 Procurement and Distribution of Green Manure Seeds(Distribution @25% subsidy)
Procurement Metric tonnes
4.000 4.000 100
Distribution Metric tonnes
4.000 4.000 100 0.800 0.800 100
6 Blue Green Algae Production Metric
tonnes - -
Distribution Metric tonnes
10 10.0 100
7 Bio Conversion of Farm Waste using Pleurotus
Distribution of mini kits Nos 188 188 100 0 0
8 Vermi-composting 3 3 100 0.116 0.116 100 Demonstrations cum
Training Nos 3 3 100 0.036 0.036 100
Farmers Trained Nos 3 3 100 0.08 0.080 100
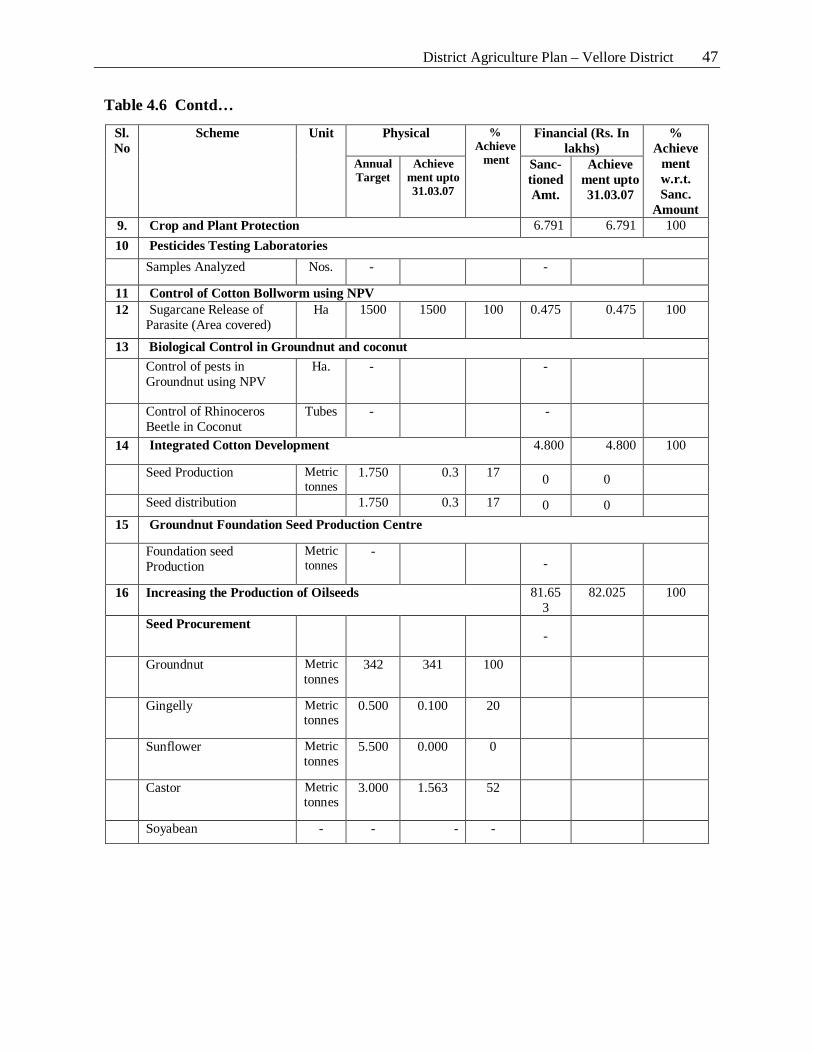
District Agriculture Plan – Vellore District 47
Table 4.6 Contd…
Sl. No
Scheme Unit Physical % Achieve
ment
Financial (Rs. In lakhs)
% Achieve
ment w.r.t. Sanc.
Amount
Annual Target
Achieve ment upto 31.03.07
Sanc-tioned Amt.
Achieve ment upto 31.03.07
9. Crop and Plant Protection 6.791 6.791 100 10 Pesticides Testing Laboratories
Samples Analyzed Nos. - -
11 Control of Cotton Bollworm using NPV 12 Sugarcane Release of
Parasite (Area covered) Ha 1500 1500 100 0.475 0.475 100
13 Biological Control in Groundnut and coconut Control of pests in
Groundnut using NPV Ha. - -
Control of Rhinoceros Beetle in Coconut
Tubes - -
14 Integrated Cotton Development 4.800 4.800 100
Seed Production Metric tonnes
1.750 0.3 17 0 0
Seed distribution 1.750 0.3 17 0 0
15 Groundnut Foundation Seed Production Centre
Foundation seed Production
Metric tonnes
- -
16 Increasing the Production of Oilseeds 81.653
82.025 100
Seed Procurement -
Groundnut Metric tonnes
342 341 100
Gingelly Metric tonnes
0.500 0.100 20
Sunflower Metric tonnes
5.500 0.000 0
Castor Metric tonnes
3.000 1.563 52
Soyabean - - - -
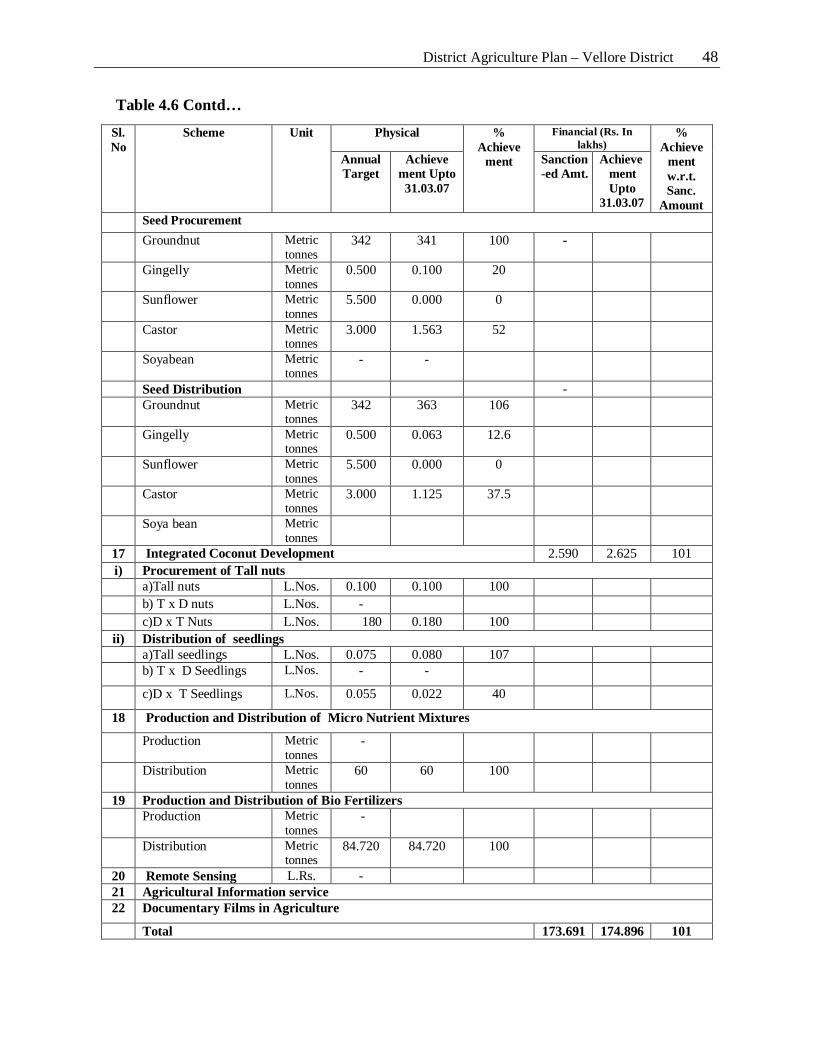
District Agriculture Plan – Vellore District 48
Table 4.6 Contd…
Sl. No
Scheme Unit Physical % Achieve
ment
Financial (Rs. In lakhs)
% Achieve
ment w.r.t. Sanc.
Amount
Annual Target
Achieve ment Upto 31.03.07
Sanction -ed Amt.
Achieve ment Upto 31.03.07
Seed Procurement Groundnut Metric
tonnes 342 341 100 -
Gingelly Metric tonnes
0.500 0.100 20
Sunflower Metric tonnes
5.500 0.000 0
Castor Metric tonnes
3.000 1.563 52
Soyabean Metric tonnes
- -
Seed Distribution - Groundnut Metric
tonnes 342 363 106
Gingelly Metric tonnes
0.500 0.063 12.6
Sunflower Metric tonnes
5.500 0.000 0
Castor Metric tonnes
3.000 1.125 37.5
Soya bean Metric tonnes
17 Integrated Coconut Development 2.590 2.625 101 i) Procurement of Tall nuts a)Tall nuts L.Nos. 0.100 0.100 100 b) T x D nuts L.Nos. - c)D x T Nuts L.Nos. 180 0.180 100
ii) Distribution of seedlings a)Tall seedlings L.Nos. 0.075 0.080 107 b) T x D Seedlings L.Nos. - -
c)D x T Seedlings L.Nos. 0.055 0.022 40
18 Production and Distribution of Micro Nutrient Mixtures
Production Metric tonnes
-
Distribution Metric tonnes
60 60 100
19 Production and Distribution of Bio Fertilizers Production Metric
tonnes -
Distribution Metric tonnes
84.720 84.720 100
20 Remote Sensing L.Rs. - 21 Agricultural Information service 22 Documentary Films in Agriculture
Total 173.691 174.896 101
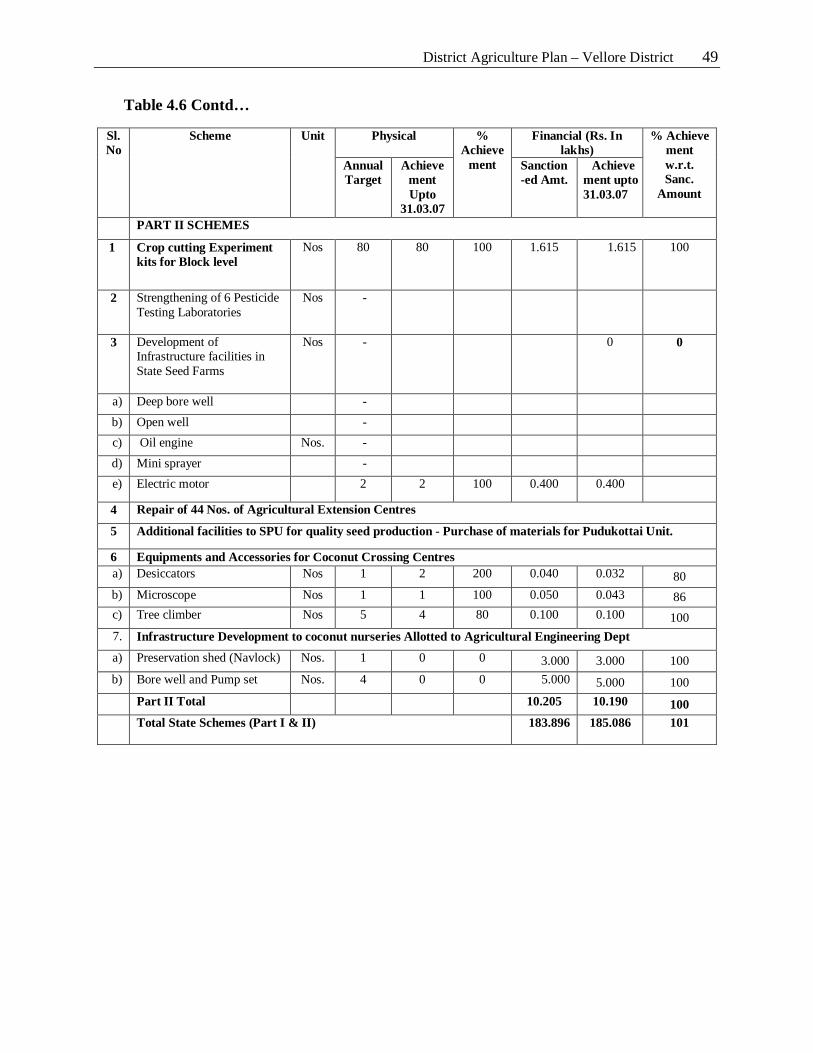
District Agriculture Plan – Vellore District 49
Table 4.6 Contd…
Sl. No
Scheme Unit Physical % Achieve
ment
Financial (Rs. In lakhs)
% Achieve ment w.r.t. Sanc.
Amount
Annual Target
Achieve ment Upto
31.03.07
Sanction -ed Amt.
Achieve ment upto 31.03.07
PART II SCHEMES
1 Crop cutting Experiment kits for Block level
Nos 80 80 100 1.615 1.615 100
2 Strengthening of 6 Pesticide Testing Laboratories
Nos -
3 Development of Infrastructure facilities in State Seed Farms
Nos - 0 0
a) Deep bore well - b) Open well - c) Oil engine Nos. - d) Mini sprayer - e) Electric motor 2 2 100 0.400 0.400
4 Repair of 44 Nos. of Agricultural Extension Centres
5 Additional facilities to SPU for quality seed production - Purchase of materials for Pudukottai Unit.
6 Equipments and Accessories for Coconut Crossing Centres a) Desiccators Nos 1 2 200 0.040 0.032 80 b) Microscope Nos 1 1 100 0.050 0.043 86 c) Tree climber Nos 5 4 80 0.100 0.100 100 7. Infrastructure Development to coconut nurseries Allotted to Agricultural Engineering Dept a) Preservation shed (Navlock) Nos. 1 0 0 3.000 3.000 100 b) Bore well and Pump set Nos. 4 0 0 5.000 5.000 100 Part II Total 10.205 10.190 100 Total State Schemes (Part I & II)
183.896 185.086
101
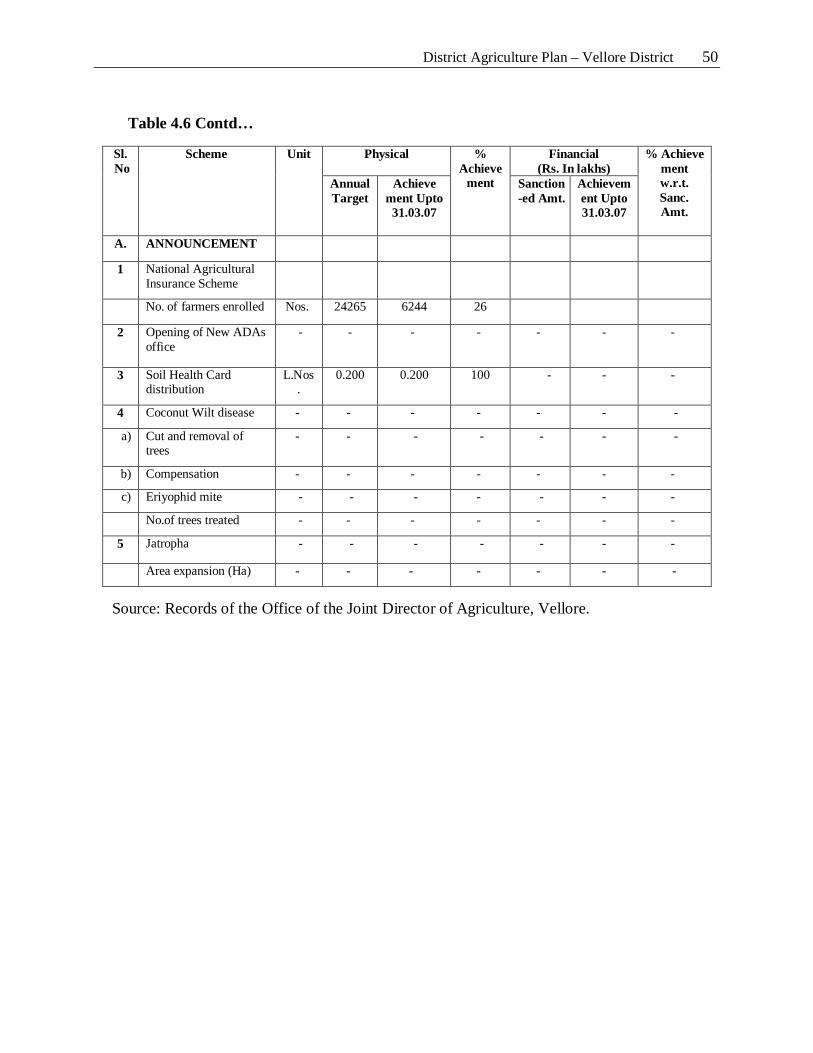
District Agriculture Plan – Vellore District 50
Table 4.6 Contd…
Sl. No
Scheme Unit Physical % Achieve
ment
Financial (Rs. In lakhs)
% Achieve ment w.r.t. Sanc. Amt.
Annual Target
Achieve ment Upto 31.03.07
Sanction -ed Amt.
Achievement Upto 31.03.07
A. ANNOUNCEMENT
1 National Agricultural Insurance Scheme
No. of farmers enrolled Nos. 24265 6244 26
2 Opening of New ADAs office
- - - - - - -
3 Soil Health Card distribution
L.Nos.
0.200 0.200 100 -
- -
4 Coconut Wilt disease - - - - - - -
a) Cut and removal of trees
- - - - - - -
b) Compensation - - - - - - -
c) Eriyophid mite - - - - - - -
No.of trees treated - - - - - - -
5 Jatropha - - - - - - -
Area expansion (Ha) - - - - - - -
Source: Records of the Office of the Joint Director of Agriculture, Vellore.
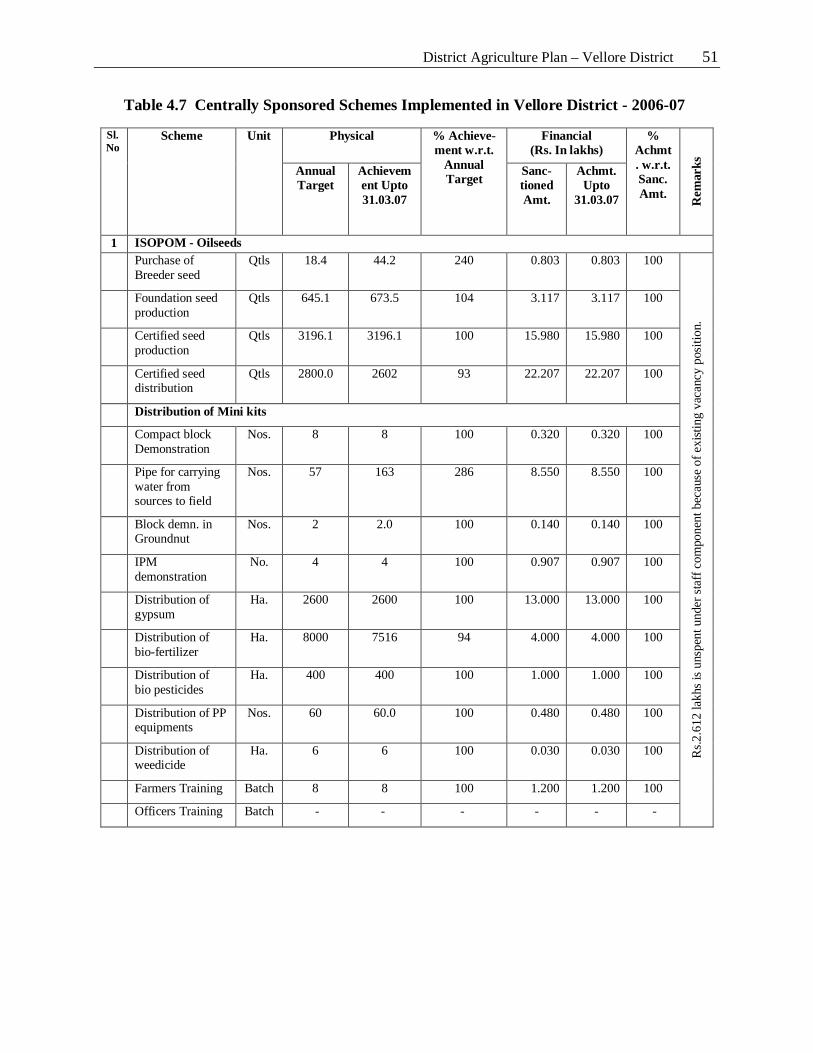
District Agriculture Plan – Vellore District 51
Table 4.7 Centrally Sponsored Schemes Implemented in Vellore District - 2006-07
Sl. No
Scheme Unit Physical % Achieve-ment w.r.t.
Annual Target
Financial (Rs. In lakhs)
% Achmt. w.r.t. Sanc. Amt. R
emar
ks
Annual Target
Achievement Upto 31.03.07
Sanc- tioned Amt.
Achmt. Upto
31.03.07
1 ISOPOM - Oilseeds Purchase of
Breeder seed Qtls 18.4 44.2 240 0.803 0.803 100
Rs.2
.612
lakh
s is u
nspe
nt u
nder
staf
f com
pone
nt b
ecau
se o
f exi
sting
vac
ancy
pos
ition
.
Foundation seed production
Qtls 645.1 673.5 104 3.117 3.117 100
Certified seed production
Qtls 3196.1 3196.1 100 15.980 15.980 100
Certified seed distribution
Qtls 2800.0 2602 93 22.207 22.207 100
Distribution of Mini kits
Compact block Demonstration
Nos. 8 8 100 0.320 0.320 100
Pipe for carrying water from sources to field
Nos. 57 163 286 8.550 8.550 100
Block demn. in Groundnut
Nos. 2 2.0 100 0.140 0.140 100
IPM demonstration
No. 4 4 100 0.907 0.907 100
Distribution of gypsum
Ha. 2600 2600 100 13.000 13.000 100
Distribution of bio-fertilizer
Ha. 8000 7516 94 4.000 4.000 100
Distribution of bio pesticides
Ha. 400 400 100 1.000 1.000 100
Distribution of PP equipments
Nos. 60 60.0 100 0.480 0.480 100
Distribution of weedicide
Ha. 6 6 100 0.030 0.030 100
Farmers Training Batch 8 8 100 1.200 1.200 100
Officers Training Batch - - - - - -
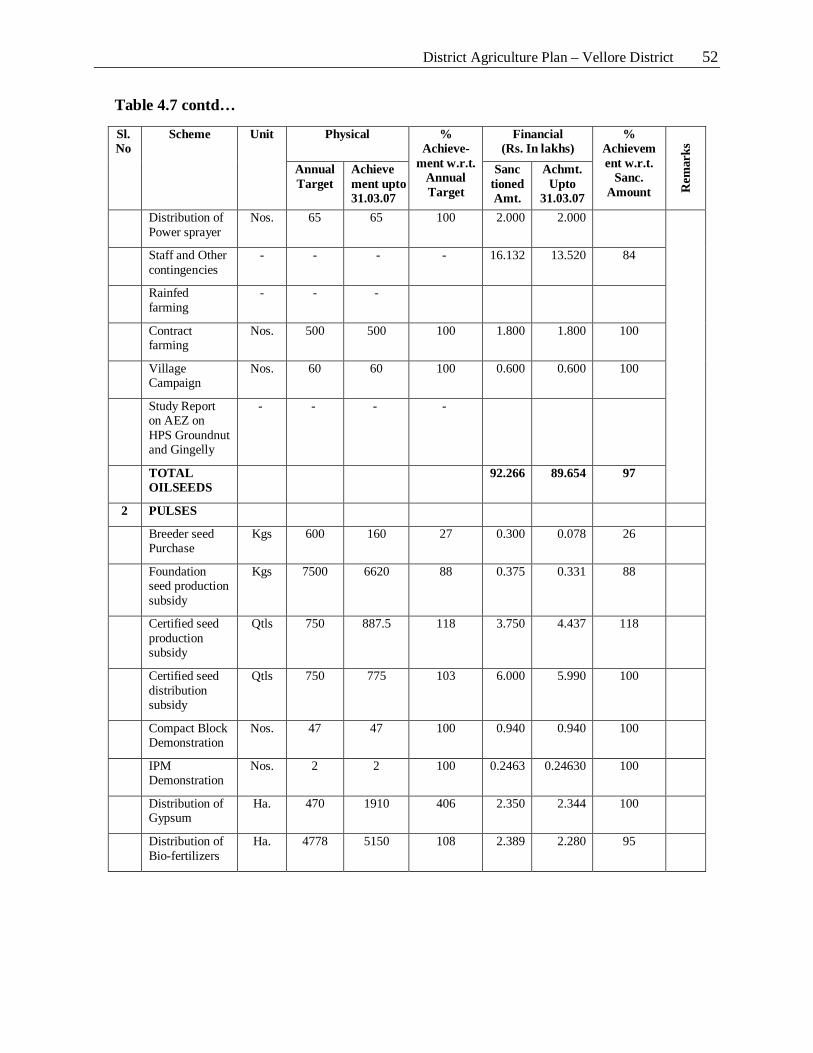
District Agriculture Plan – Vellore District 52
Table 4.7 contd…
Sl. No
Scheme Unit Physical % Achieve-
ment w.r.t. Annual Target
Financial (Rs. In lakhs)
% Achievement w.r.t.
Sanc. Amount R
emar
ks
Annual Target
Achieve ment upto 31.03.07
Sanc tioned Amt.
Achmt. Upto
31.03.07 Distribution of
Power sprayer Nos. 65 65 100 2.000 2.000
Staff and Other contingencies
- - - - 16.132 13.520 84
Rainfed farming
- - -
Contract farming
Nos. 500 500 100 1.800 1.800 100
Village Campaign
Nos. 60 60 100 0.600 0.600 100
Study Report on AEZ on HPS Groundnut and Gingelly
- - - -
TOTAL OILSEEDS
92.266 89.654 97
2 PULSES
Breeder seed Purchase
Kgs 600 160 27 0.300 0.078 26
Foundation seed production subsidy
Kgs 7500 6620 88 0.375 0.331 88
Certified seed production subsidy
Qtls 750 887.5 118 3.750 4.437 118
Certified seed distribution subsidy
Qtls 750 775 103 6.000 5.990 100
Compact Block Demonstration
Nos. 47 47 100 0.940 0.940 100
IPM Demonstration
Nos. 2 2 100 0.2463 0.24630 100
Distribution of Gypsum
Ha. 470 1910 406 2.350 2.344 100
Distribution of Bio-fertilizers
Ha. 4778 5150 108 2.389 2.280 95
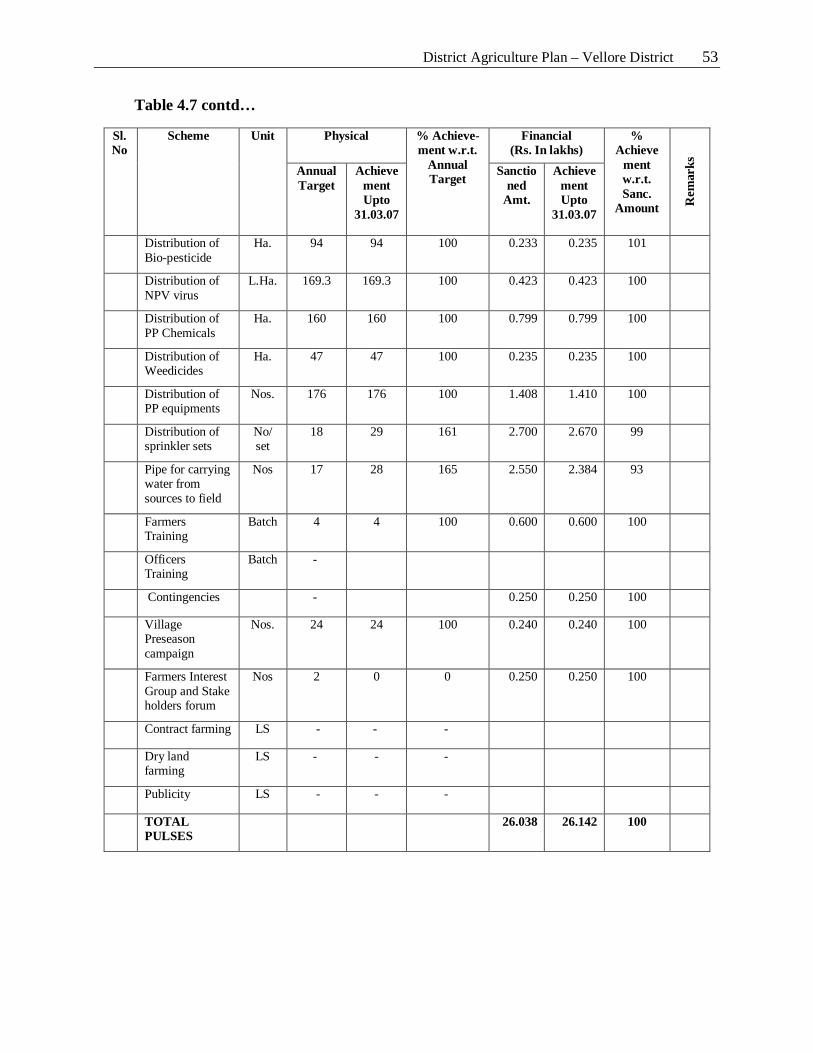
District Agriculture Plan – Vellore District 53
Table 4.7 contd…
Sl. No
Scheme Unit Physical % Achieve-ment w.r.t.
Annual Target
Financial (Rs. In lakhs)
% Achieve
ment w.r.t. Sanc.
Amount Rem
arks
Annual Target
Achieve ment Upto
31.03.07
Sanctioned
Amt.
Achieve ment Upto
31.03.07
Distribution of Bio-pesticide
Ha. 94 94 100 0.233 0.235 101
Distribution of NPV virus
L.Ha. 169.3 169.3 100 0.423 0.423 100
Distribution of PP Chemicals
Ha. 160 160 100 0.799 0.799 100
Distribution of Weedicides
Ha. 47 47 100 0.235 0.235 100
Distribution of PP equipments
Nos. 176 176 100 1.408 1.410 100
Distribution of sprinkler sets
No/ set
18 29 161 2.700 2.670 99
Pipe for carrying water from sources to field
Nos 17 28 165 2.550 2.384 93
Farmers Training
Batch 4 4 100 0.600 0.600 100
Officers Training
Batch -
Contingencies - 0.250 0.250 100
Village Preseason campaign
Nos. 24 24 100 0.240 0.240 100
Farmers Interest Group and Stake holders forum
Nos 2 0 0 0.250 0.250 100
Contract farming LS - - -
Dry land farming
LS - - -
Publicity LS - - -
TOTAL PULSES
26.038 26.142 100
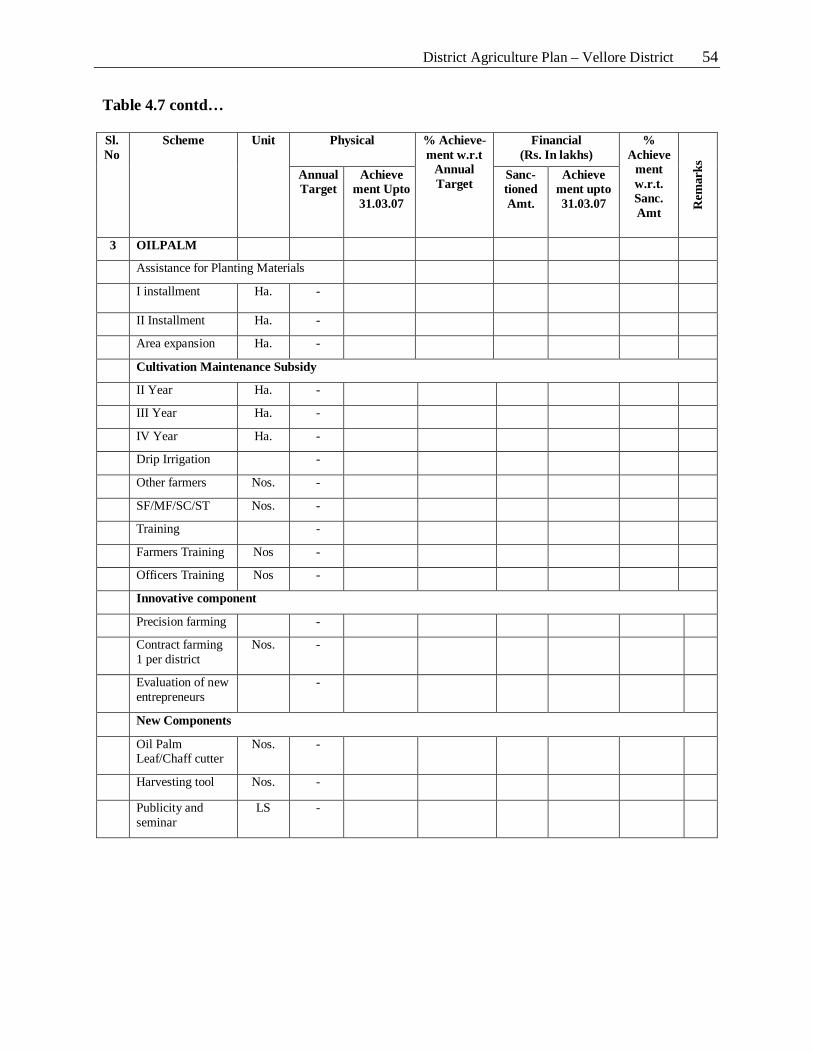
District Agriculture Plan – Vellore District 54
Table 4.7 contd…
Sl. No
Scheme Unit Physical % Achieve-ment w.r.t
Annual Target
Financial (Rs. In lakhs)
% Achieve
ment w.r.t. Sanc. Amt R
emar
ks
Annual Target
Achieve ment Upto 31.03.07
Sanc- tioned Amt.
Achieve ment upto 31.03.07
3 OILPALM
Assistance for Planting Materials
I installment Ha. -
II Installment Ha. - Area expansion Ha. - Cultivation Maintenance Subsidy
II Year Ha. - III Year Ha. - IV Year Ha. - Drip Irrigation - Other farmers Nos. - SF/MF/SC/ST Nos. - Training - Farmers Training Nos - Officers Training Nos - Innovative component
Precision farming - Contract farming
1 per district Nos. -
Evaluation of new entrepreneurs
-
New Components
Oil Palm Leaf/Chaff cutter
Nos. -
Harvesting tool Nos. - Publicity and
seminar LS -
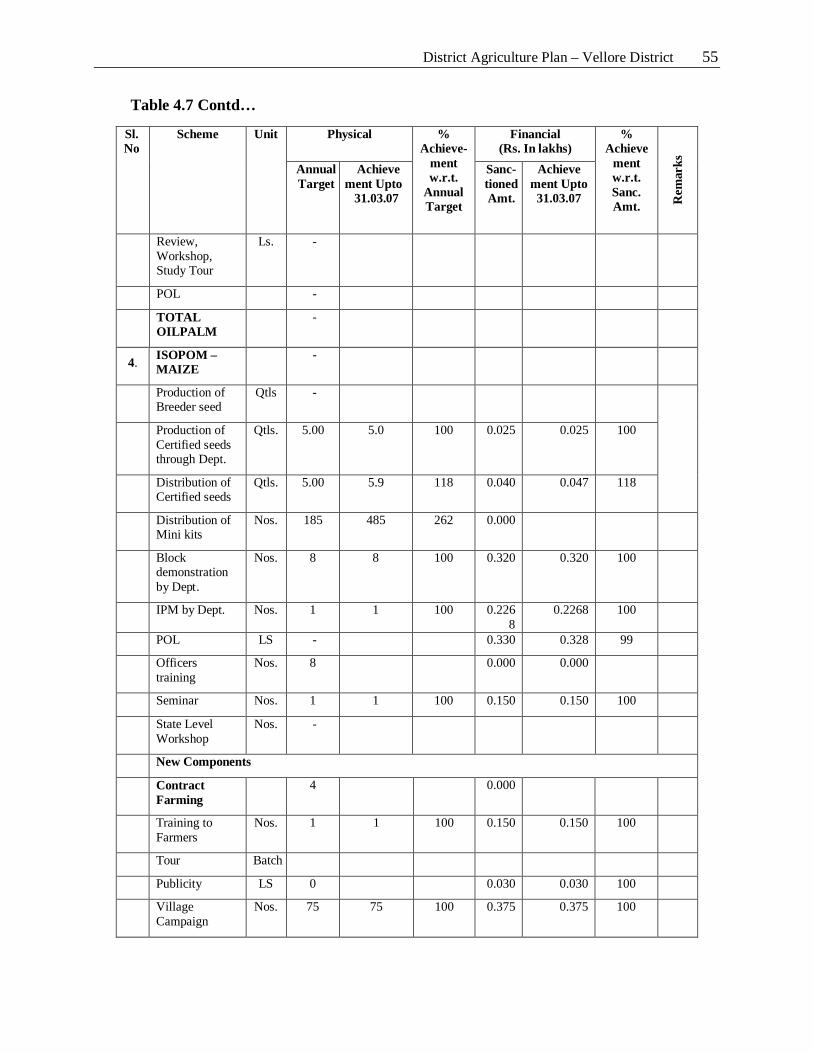
District Agriculture Plan – Vellore District 55
Table 4.7 Contd…
Sl. No
Scheme Unit Physical % Achieve-
ment w.r.t.
Annual Target
Financial (Rs. In lakhs)
% Achieve
ment w.r.t. Sanc. Amt. R
emar
ks
Annual Target
Achieve ment Upto 31.03.07
Sanc- tioned Amt.
Achieve ment Upto 31.03.07
Review, Workshop, Study Tour
Ls. -
POL - TOTAL
OILPALM -
4.
ISOPOM – MAIZE
-
Production of Breeder seed
Qtls -
Production of Certified seeds through Dept.
Qtls. 5.00 5.0 100 0.025 0.025 100
Distribution of Certified seeds
Qtls. 5.00 5.9 118 0.040 0.047 118
Distribution of Mini kits
Nos. 185 485 262 0.000
Block demonstration by Dept.
Nos. 8 8 100 0.320 0.320 100
IPM by Dept. Nos. 1 1 100 0.2268
0.2268 100
POL LS - 0.330 0.328 99
Officers training
Nos. 8 0.000 0.000
Seminar Nos. 1 1 100 0.150 0.150 100
State Level Workshop
Nos. -
New Components
Contract Farming
4 0.000
Training to Farmers
Nos. 1 1 100 0.150 0.150 100
Tour Batch
Publicity LS 0 0.030 0.030 100
Village Campaign
Nos. 75 75 100 0.375 0.375 100
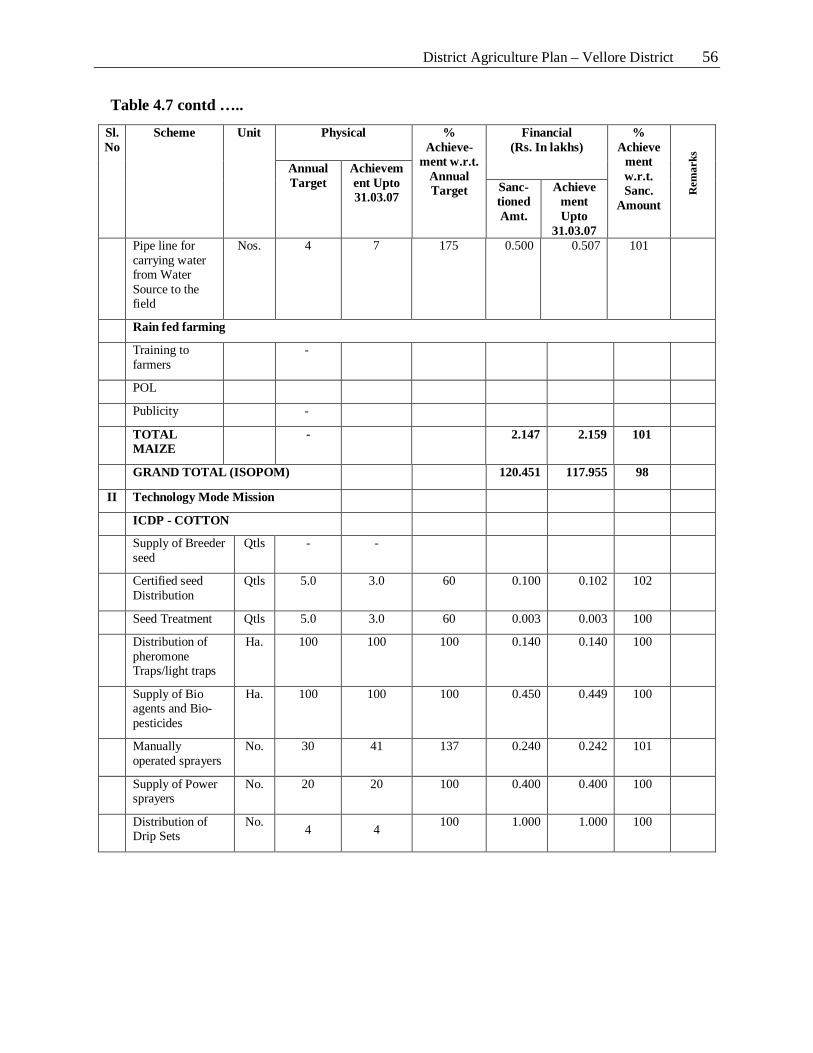
District Agriculture Plan – Vellore District 56
Table 4.7 contd …..
Sl. No
Scheme Unit Physical % Achieve-
ment w.r.t. Annual Target
Financial (Rs. In lakhs)
% Achieve
ment w.r.t. Sanc.
Amount
Rem
arks
Annual Target
Achievement Upto 31.03.07
Sanc- tioned Amt.
Achieve ment Upto
31.03.07 Pipe line for
carrying water from Water Source to the field
Nos. 4 7 175 0.500 0.507 101
Rain fed farming
Training to farmers
-
POL
Publicity -
TOTAL MAIZE
- 2.147 2.159 101
GRAND TOTAL (ISOPOM) 120.451 117.955 98
II Technology Mode Mission
ICDP - COTTON
Supply of Breeder seed
Qtls - -
Certified seed Distribution
Qtls 5.0 3.0 60 0.100 0.102 102
Seed Treatment Qtls 5.0 3.0 60 0.003 0.003 100 Distribution of
pheromone Traps/light traps
Ha. 100 100 100 0.140 0.140 100
Supply of Bio agents and Bio-pesticides
Ha. 100 100 100 0.450 0.449 100
Manually operated sprayers
No. 30 41 137 0.240 0.242 101
Supply of Power sprayers
No. 20 20 100 0.400 0.400 100
Distribution of Drip Sets
No. 4
4
100 1.000 1.000 100
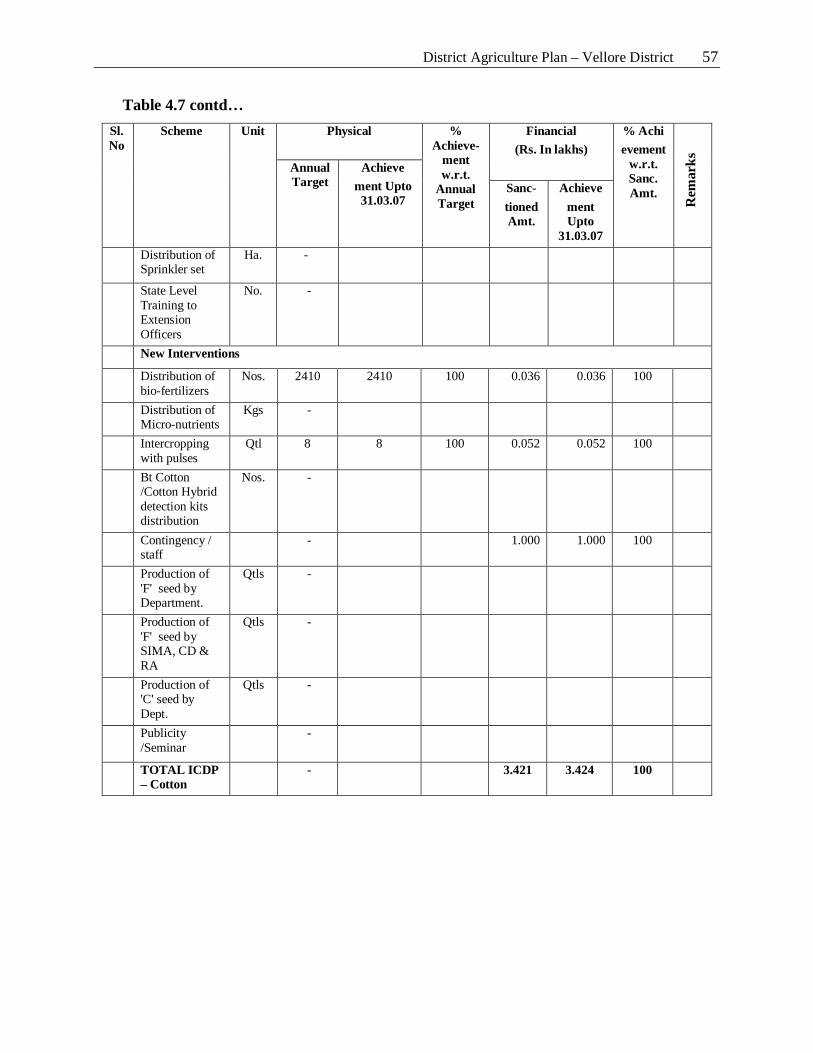
District Agriculture Plan – Vellore District 57
Table 4.7 contd…
Sl. No
Scheme Unit Physical % Achieve-
ment w.r.t.
Annual Target
Financial (Rs. In lakhs)
% Achi evement
w.r.t. Sanc. Amt.
Rem
arks
Annual Target
Achieve ment Upto
31.03.07 Sanc- tioned Amt.
Achieve ment Upto
31.03.07 Distribution of
Sprinkler set Ha. -
State Level Training to Extension Officers
No. -
New Interventions
Distribution of bio-fertilizers
Nos. 2410 2410 100 0.036 0.036 100
Distribution of Micro-nutrients
Kgs -
Intercropping with pulses
Qtl 8 8 100 0.052 0.052 100
Bt Cotton /Cotton Hybrid detection kits distribution
Nos. -
Contingency / staff
- 1.000 1.000 100
Production of 'F' seed by Department.
Qtls -
Production of 'F' seed by SIMA, CD & RA
Qtls -
Production of 'C' seed by Dept.
Qtls -
Publicity /Seminar
-
TOTAL ICDP – Cotton
- 3.421 3.424 100
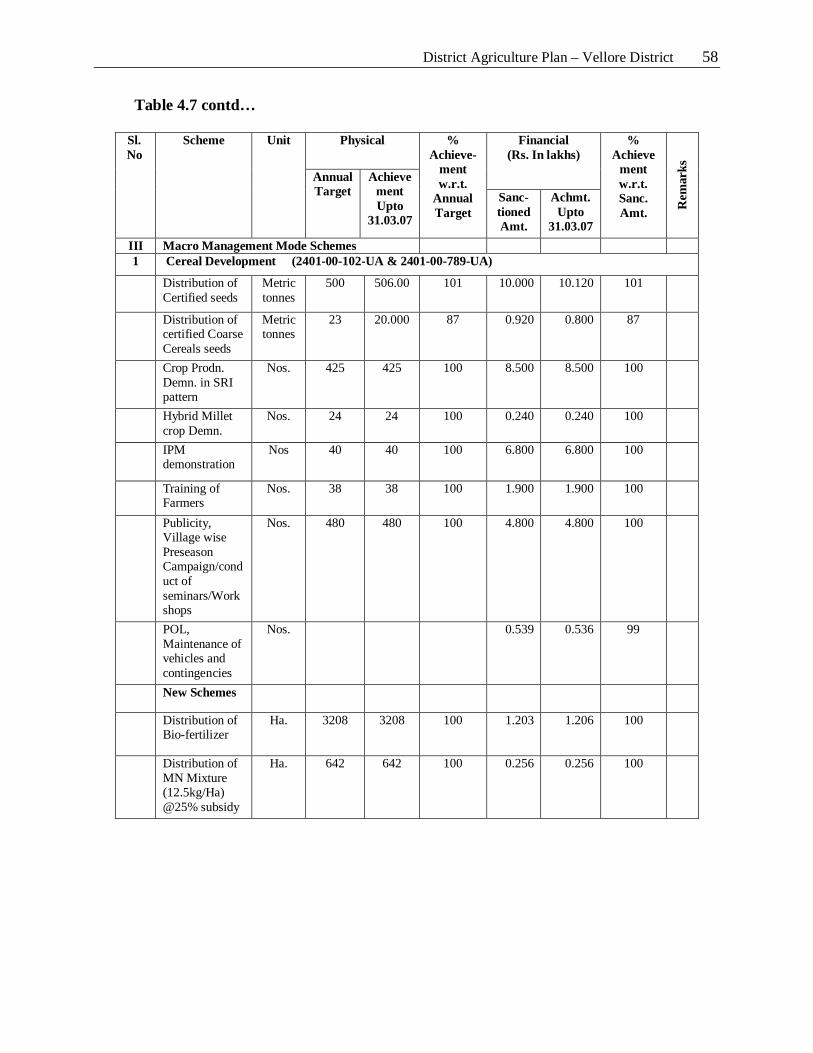
District Agriculture Plan – Vellore District 58
Table 4.7 contd…
Sl. No
Scheme Unit Physical % Achieve-
ment w.r.t.
Annual Target
Financial (Rs. In lakhs)
% Achieve
ment w.r.t. Sanc. Amt. R
emar
ks
Annual Target
Achieve ment Upto
31.03.07
Sanc- tioned Amt.
Achmt. Upto
31.03.07 III Macro Management Mode Schemes 1 Cereal Development (2401-00-102-UA & 2401-00-789-UA)
Distribution of Certified seeds
Metric tonnes
500 506.00 101 10.000 10.120 101
Distribution of certified Coarse Cereals seeds
Metric tonnes
23 20.000 87 0.920 0.800 87
Crop Prodn. Demn. in SRI pattern
Nos. 425 425 100 8.500 8.500 100
Hybrid Millet crop Demn.
Nos. 24 24 100 0.240 0.240 100
IPM demonstration
Nos 40 40 100 6.800 6.800 100
Training of Farmers
Nos. 38 38 100 1.900 1.900 100
Publicity, Village wise Preseason Campaign/conduct of seminars/Workshops
Nos. 480 480 100 4.800 4.800 100
POL, Maintenance of vehicles and contingencies
Nos. 0.539 0.536 99
New Schemes
Distribution of Bio-fertilizer
Ha. 3208 3208 100 1.203 1.206 100
Distribution of MN Mixture (12.5kg/Ha) @25% subsidy
Ha. 642 642 100 0.256 0.256 100
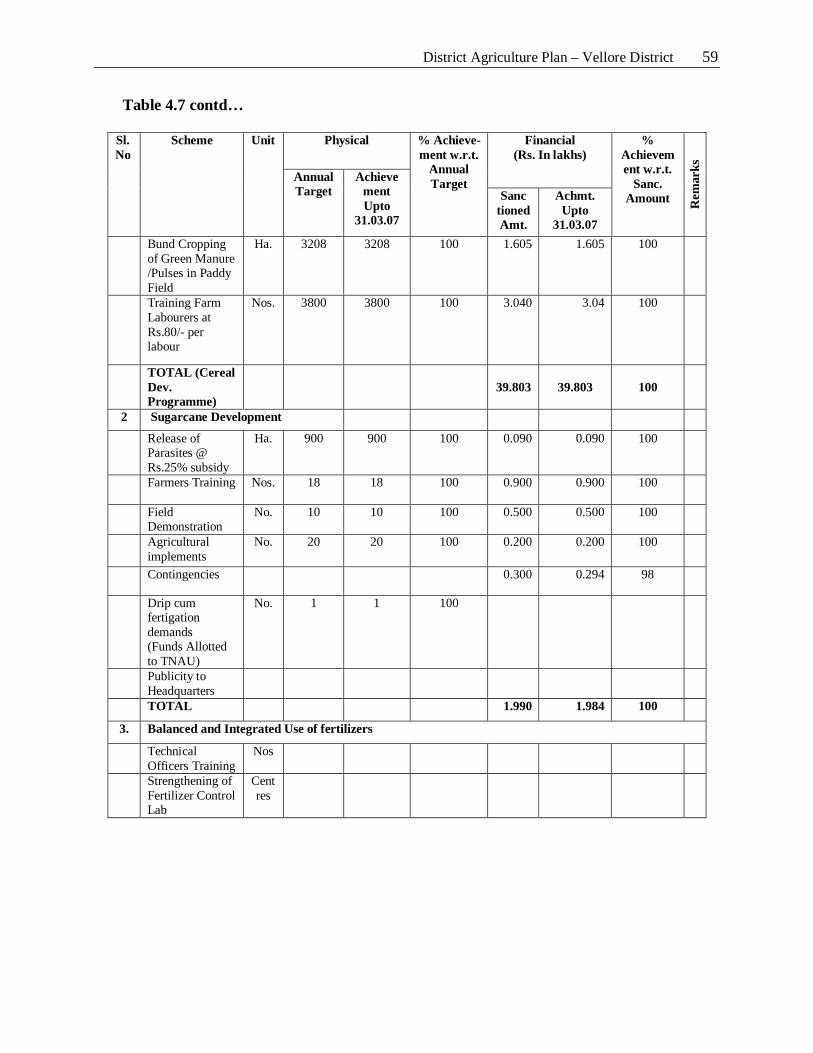
District Agriculture Plan – Vellore District 59
Table 4.7 contd…
Sl. No
Scheme Unit Physical % Achieve-ment w.r.t.
Annual Target
Financial (Rs. In lakhs)
% Achievement w.r.t.
Sanc. Amount R
emar
ks
Annual Target
Achieve ment Upto
31.03.07
Sanc tioned Amt.
Achmt. Upto
31.03.07 Bund Cropping
of Green Manure /Pulses in Paddy Field
Ha. 3208 3208 100 1.605 1.605 100
Training Farm Labourers at Rs.80/- per labour
Nos. 3800 3800 100 3.040 3.04 100
TOTAL (Cereal Dev. Programme)
39.803 39.803 100
2 Sugarcane Development
Release of Parasites @ Rs.25% subsidy
Ha. 900 900 100 0.090 0.090 100
Farmers Training Nos. 18 18 100 0.900 0.900 100
Field Demonstration
No. 10 10 100 0.500 0.500 100
Agricultural implements
No. 20 20 100 0.200 0.200 100
Contingencies 0.300 0.294 98
Drip cum fertigation demands (Funds Allotted to TNAU)
No. 1 1 100
Publicity to Headquarters
TOTAL 1.990 1.984 100
3. Balanced and Integrated Use of fertilizers
Technical Officers Training
Nos
Strengthening of Fertilizer Control Lab
Centres
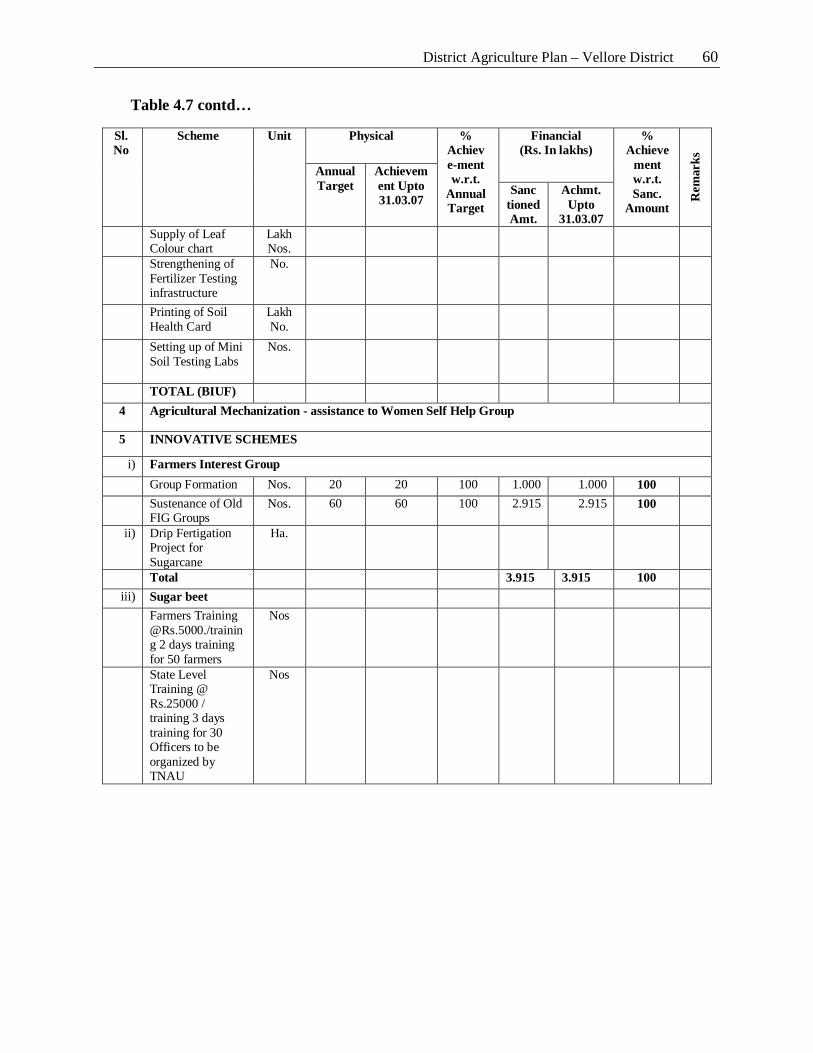
District Agriculture Plan – Vellore District 60
Table 4.7 contd…
Sl. No
Scheme Unit Physical % Achieve-ment w.r.t.
Annual Target
Financial (Rs. In lakhs)
% Achieve
ment w.r.t. Sanc.
Amount
Rem
arks
Annual Target
Achievement Upto 31.03.07
Sanc tioned Amt.
Achmt. Upto
31.03.07 Supply of Leaf
Colour chart Lakh Nos.
Strengthening of Fertilizer Testing infrastructure
No.
Printing of Soil Health Card
Lakh No.
Setting up of Mini Soil Testing Labs
Nos.
TOTAL (BIUF) 4 Agricultural Mechanization - assistance to Women Self Help Group
5 INNOVATIVE SCHEMES
i) Farmers Interest Group Group Formation Nos. 20 20 100 1.000 1.000 100 Sustenance of Old
FIG Groups Nos. 60 60 100 2.915 2.915 100
ii) Drip Fertigation Project for Sugarcane
Ha.
Total 3.915 3.915 100 iii) Sugar beet Farmers Training
@Rs.5000./training 2 days training for 50 farmers
Nos
State Level Training @ Rs.25000 / training 3 days training for 30 Officers to be organized by TNAU
Nos
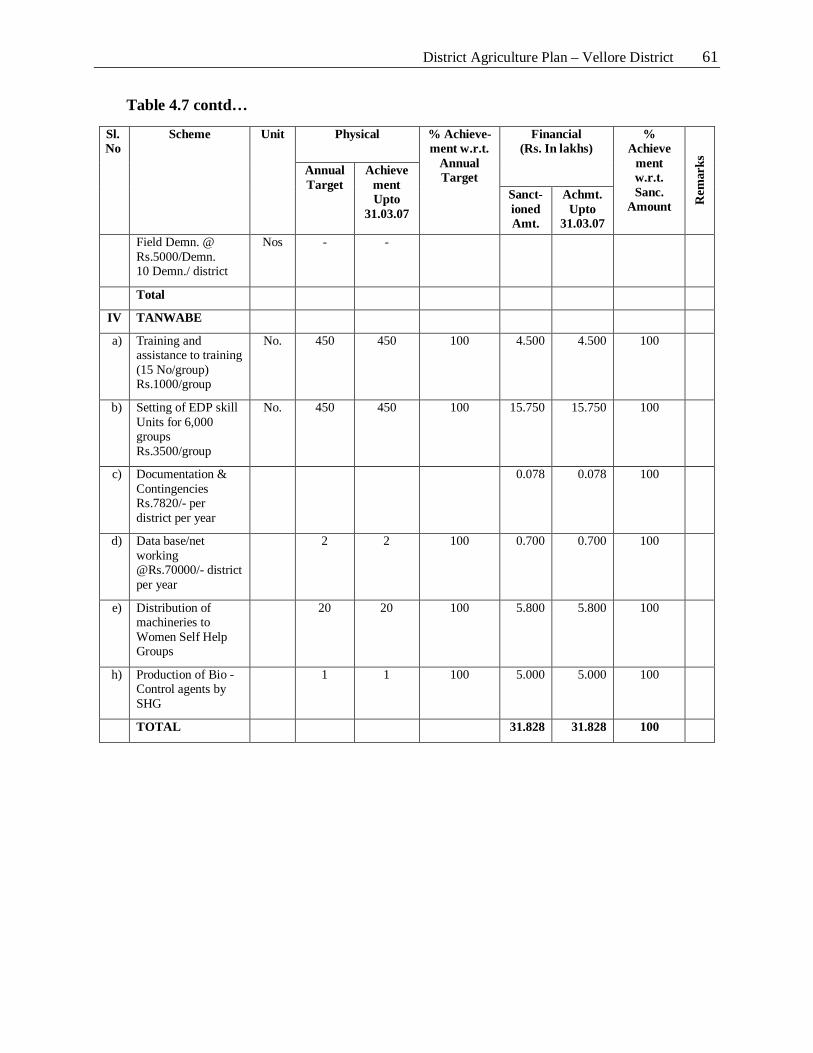
District Agriculture Plan – Vellore District 61
Table 4.7 contd…
Sl. No
Scheme Unit Physical % Achieve-ment w.r.t.
Annual Target
Financial (Rs. In lakhs)
% Achieve
ment w.r.t. Sanc.
Amount Rem
arks
Annual Target
Achieve ment Upto
31.03.07 Sanct-ioned Amt.
Achmt. Upto
31.03.07 Field Demn. @
Rs.5000/Demn. 10 Demn./ district
Nos - -
Total
IV TANWABE
a) Training and assistance to training (15 No/group) Rs.1000/group
No. 450 450 100 4.500 4.500 100
b) Setting of EDP skill Units for 6,000 groups Rs.3500/group
No. 450 450 100 15.750 15.750 100
c) Documentation & Contingencies Rs.7820/- per district per year
0.078 0.078 100
d) Data base/net working @Rs.70000/- district per year
2 2 100 0.700 0.700 100
e) Distribution of machineries to Women Self Help Groups
20 20 100 5.800 5.800 100
h) Production of Bio -Control agents by SHG
1 1 100 5.000 5.000 100
TOTAL 31.828 31.828 100
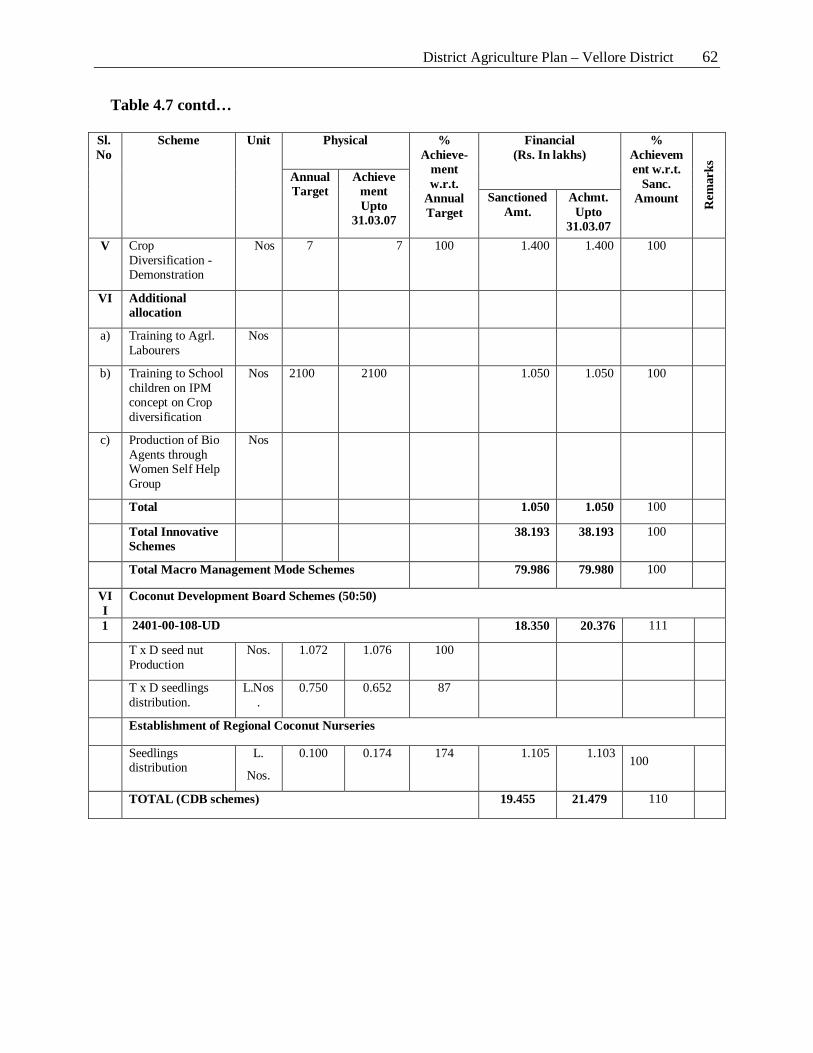
District Agriculture Plan – Vellore District 62
Table 4.7 contd…
Sl. No
Scheme Unit Physical % Achieve-
ment w.r.t.
Annual Target
Financial (Rs. In lakhs)
% Achievement w.r.t.
Sanc. Amount R
emar
ks
Annual Target
Achieve ment Upto
31.03.07
Sanctioned Amt.
Achmt. Upto
31.03.07 V Crop
Diversification - Demonstration
Nos 7 7 100 1.400 1.400 100
VI Additional allocation
a) Training to Agrl. Labourers
Nos
b) Training to School children on IPM concept on Crop diversification
Nos 2100 2100 1.050 1.050 100
c) Production of Bio Agents through Women Self Help Group
Nos
Total 1.050 1.050 100
Total Innovative Schemes
38.193 38.193 100
Total Macro Management Mode Schemes 79.986 79.980 100
VII
Coconut Development Board Schemes (50:50)
1 2401-00-108-UD 18.350 20.376 111
T x D seed nut Production
Nos. 1.072 1.076 100
T x D seedlings distribution.
L.Nos.
0.750 0.652 87
Establishment of Regional Coconut Nurseries
Seedlings distribution
L.
Nos.
0.100 0.174 174 1.105 1.103 100
TOTAL (CDB schemes) 19.455 21.479 110
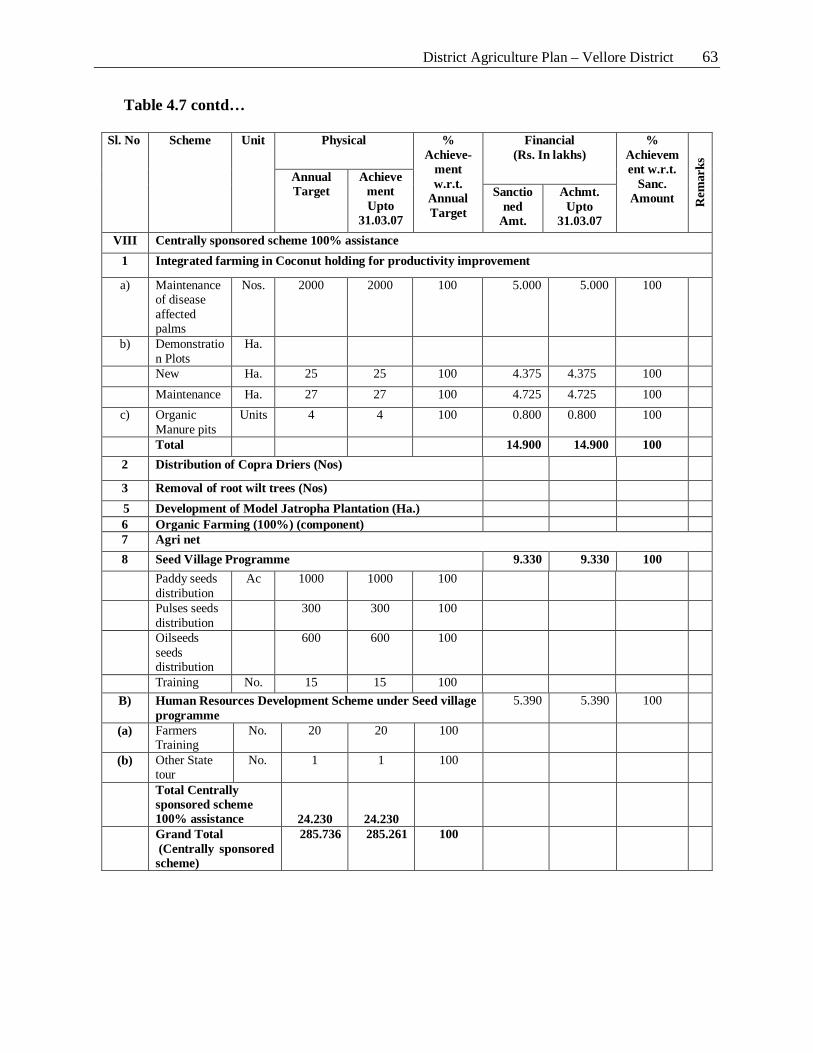
District Agriculture Plan – Vellore District 63
Table 4.7 contd…
Sl. No
Scheme Unit Physical % Achieve-
ment w.r.t.
Annual Target
Financial (Rs. In lakhs)
% Achievement w.r.t.
Sanc. Amount R
emar
ks
Annual Target
Achievement Upto
31.03.07
Sanctioned
Amt.
Achmt. Upto
31.03.07 VIII Centrally sponsored scheme 100% assistance
1 Integrated farming in Coconut holding for productivity improvement
a) Maintenance of disease affected palms
Nos. 2000 2000 100 5.000 5.000 100
b) Demonstration Plots
Ha.
New Ha. 25 25 100 4.375 4.375 100 Maintenance Ha. 27 27 100 4.725 4.725 100
c) Organic Manure pits
Units 4 4 100 0.800 0.800 100
Total 14.900 14.900 100 2 Distribution of Copra Driers (Nos)
3 Removal of root wilt trees (Nos) 5 Development of Model Jatropha Plantation (Ha.) 6 Organic Farming (100%) (component) 7 Agri net 8 Seed Village Programme 9.330 9.330 100 Paddy seeds
distribution Ac 1000 1000
100
Pulses seeds distribution
300 300 100
Oilseeds seeds distribution
600 600 100
Training No. 15 15 100 B) Human Resources Development Scheme under Seed village
programme 5.390 5.390 100
(a) Farmers Training
No. 20 20 100
(b) Other State tour
No. 1 1 100
Total Centrally sponsored scheme 100% assistance 24.230 24.230
Grand Total (Centrally sponsored scheme)
285.736 285.261 100
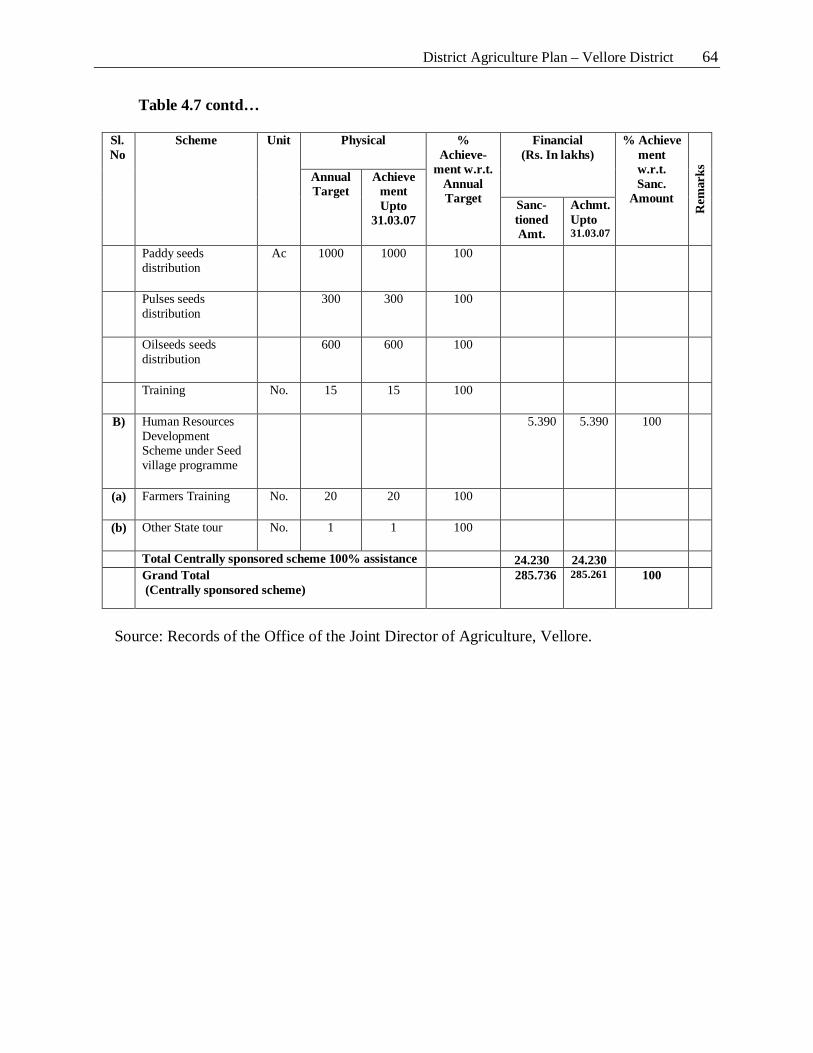
District Agriculture Plan – Vellore District 64
Table 4.7 contd…
Sl. No
Scheme Unit Physical % Achieve-
ment w.r.t. Annual Target
Financial (Rs. In lakhs)
% Achieve ment w.r.t. Sanc.
Amount
Rem
arks
Annual Target
Achieve ment Upto
31.03.07 Sanc- tioned Amt.
Achmt. Upto 31.03.07
Paddy seeds distribution
Ac 1000 1000 100
Pulses seeds distribution
300 300 100
Oilseeds seeds distribution
600 600 100
Training No. 15 15 100
B) Human Resources Development Scheme under Seed village programme
5.390 5.390 100
(a) Farmers Training No. 20 20 100
(b) Other State tour No. 1 1 100
Total Centrally sponsored scheme 100% assistance 24.230 24.230
Grand Total (Centrally sponsored scheme)
285.736 285.261 100
Source: Records of the Office of the Joint Director of Agriculture, Vellore.
District Agriculture Plan – Vellore District 65
4.9 Constraint Analysis
The major constraints that could adversely influence the results that are expected from
the implementation of Agricultural Development Plan are briefly discussed in this section.
4.9.1 Constraints Experienced
1) Paddy
i) Yellowing of transplanted seedlings during winter season
ii) More number of chaffy grains harvested during November – December.
2) Millets
Sorghum
i) Short duration varieties suitable to rainfed cultivation are not available.
ii) Short duration varieties with ratoon capacity is required so that the same can be
maintained as rain fed second crop.
Ragi
Blast resistant varieties need to be developed.
Maize
Variety with both grain and fodder quality is required.
3) Pulses
Regram
i) Wilt disease is the major problem in rain fed cultivation.
ii) Blister Beetle menace is severe – IPM Technology is required.
iii) In APK 1 and VBN 2, more pod borer attack is noticed
Blackgram
New varieties with high yield potential are to be developed for replacing T9 and TMV 1
Greengram
Yellow mosaic virus resistant varieties are required.
District Agriculture Plan – Vellore District 66
4) Oilseeds
Groundnut
i) Tikka leaf spot and rust resistant varieties for rainfed season are to be developed.
ii) Root Wilt resistant varieties also are required.
iii) Drought tolerant variety
iv) Suitable variety to replace TMV.7
v) Export quality Groundnut variety
Gingelly
i) Ill filled capsules is the major problem in Gingelly.
Castor
i) Short duration Castor varieties are required
ii) Slug caterpillar / Borer infestation is more – resistant varieties requested.
5) Cotton
i) Pink bollworm and American Bollworm and sucking pests are the major problems.
Hence, resistant varieties to these pests are to be developed.
ii) Black arm disease problem is severe after monsoon rains
iii) Suitable Bt cotton varieties and hybrids are to be developed by TNAU
6) Sugarcane
i) Wooly Aphid resistant varieties
ii) Red rot resistant varieties
4.9.2 Soil Related Constraints
Developing varieties suitable for tannery effluent area Soil salinity and Alkalinity: 41,000 ha area is affected by salinity and alkalinity
problems which include area affected by tannery effluents. Alkalinity problem area is with pH of more than 8.5. In these areas, the alkalinity is due to the tannery effluents, low rain fall and also continuous irrigation along with stagnation of problem water. For these areas, salt tolerant millets and paddy varieties are required.
Problem soil pH is more than 8.5; Tannery effluent affected area has the pH of more than 8; in salinity area pH is around 3. Hence, technology is to be developed for growing coconut and millet in these areas.
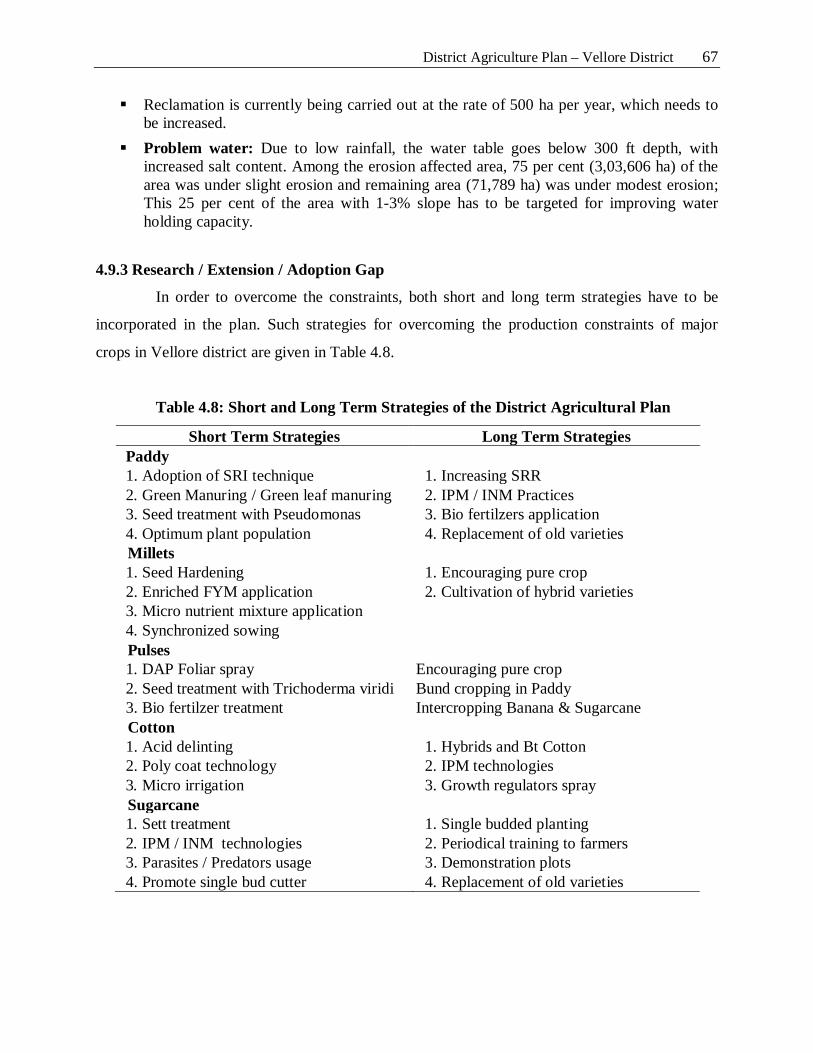
District Agriculture Plan – Vellore District 67
Reclamation is currently being carried out at the rate of 500 ha per year, which needs to be increased.
Problem water: Due to low rainfall, the water table goes below 300 ft depth, with increased salt content. Among the erosion affected area, 75 per cent (3,03,606 ha) of the area was under slight erosion and remaining area (71,789 ha) was under modest erosion; This 25 per cent of the area with 1-3% slope has to be targeted for improving water holding capacity.
4.9.3 Research / Extension / Adoption Gap
In order to overcome the constraints, both short and long term strategies have to be
incorporated in the plan. Such strategies for overcoming the production constraints of major
crops in Vellore district are given in Table 4.8.
Table 4.8: Short and Long Term Strategies of the District Agricultural Plan
Short Term Strategies Long Term Strategies Paddy 1. Adoption of SRI technique 1. Increasing SRR 2. Green Manuring / Green leaf manuring 2. IPM / INM Practices 3. Seed treatment with Pseudomonas 3. Bio fertilzers application 4. Optimum plant population 4. Replacement of old varieties Millets 1. Seed Hardening 1. Encouraging pure crop 2. Enriched FYM application 2. Cultivation of hybrid varieties 3. Micro nutrient mixture application 4. Synchronized sowing Pulses 1. DAP Foliar spray Encouraging pure crop 2. Seed treatment with Trichoderma viridi Bund cropping in Paddy 3. Bio fertilzer treatment Intercropping Banana & Sugarcane Cotton 1. Acid delinting 1. Hybrids and Bt Cotton 2. Poly coat technology 2. IPM technologies 3. Micro irrigation 3. Growth regulators spray Sugarcane 1. Sett treatment 1. Single budded planting 2. IPM / INM technologies 2. Periodical training to farmers 3. Parasites / Predators usage 3. Demonstration plots 4. Promote single bud cutter 4. Replacement of old varieties
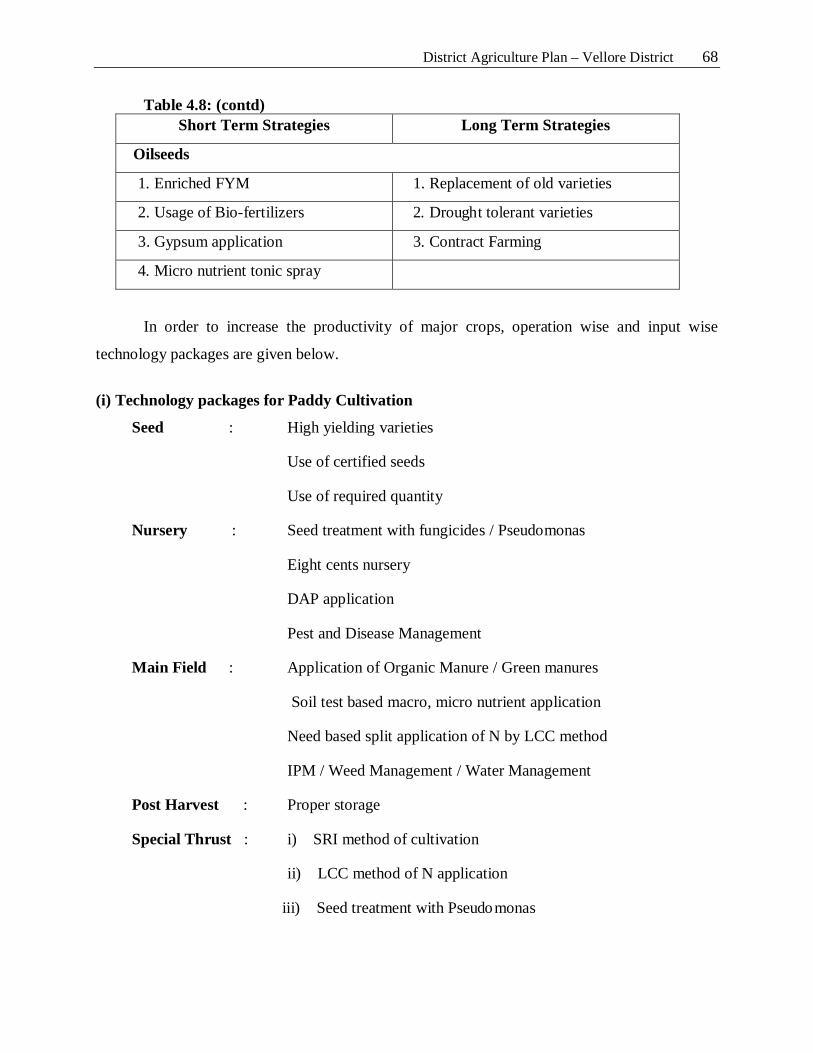
District Agriculture Plan – Vellore District 68
Table 4.8: (contd) Short Term Strategies Long Term Strategies
Oilseeds
1. Enriched FYM 1. Replacement of old varieties
2. Usage of Bio-fertilizers 2. Drought tolerant varieties
3. Gypsum application 3. Contract Farming
4. Micro nutrient tonic spray
In order to increase the productivity of major crops, operation wise and input wise
technology packages are given below.
(i) Technology packages for Paddy Cultivation
Seed : High yielding varieties
Use of certified seeds
Use of required quantity
Nursery : Seed treatment with fungicides / Pseudomonas
Eight cents nursery
DAP application
Pest and Disease Management
Main Field : Application of Organic Manure / Green manures
Soil test based macro, micro nutrient application
Need based split application of N by LCC method
IPM / Weed Management / Water Management
Post Harvest : Proper storage
Special Thrust : i) SRI method of cultivation
ii) LCC method of N application
iii) Seed treatment with Pseudomonas
District Agriculture Plan – Vellore District 69
Activities for Special Thrust : i) Demonstrations
ii) Trainings iii) Mass Media
iv) Field Days v) Campaigns
(ii) Technology packages for Millets Cultivation
Seed : High yielding varieties
Use of certified seeds
Use of required quantity
Nursery : Seed treatment with fungicides / bio-fertilizers
Seed Hardening (Rainfed)
Main Field : Application of Enriched FYM (Rainfed)
Soil test based macro and micro nutrient application
IPM / Weed Management / Water Management
Drought management (Rainfed)
Post Harvest : Proper storage
Special Thrust : i) Seed Hardening
ii) Soil Mulching
Activities for Special Thrust : i) Demonstrations ii) Trainings
iii) Mass Media
iv) Campaigns
(iii) Technology packages for Pulses Cultivation
Seed : High yielding varieties
Use of certified seeds
Use of required quantity
Seed treatment with fungicides / bio-fertilizers
Seed treatment with Trichoderma viridi
District Agriculture Plan – Vellore District 70
Main Field : Application of Organic Manure
Soil test based macro and micro nutrient application
IPM practices to control Pod borers
DAP foliar spray (2%)
Post Harvest : Proper storage
Special Thrust : i) Seed treatment with Trichoderma viridi
ii) DAP foliar spray
Activities for Special Thrust : i) Demonstrations
ii) Trainings iii) Mass Media
iv) Campaigns
(iv) Technology packages for Cotton Cultivation
Seed : Hybrids / Bt Cotton
Poly coat treatment (Designer seed)
Main Field : Application of Organic Manure / Bio-fertilizers
Soil test based macro and micro nutrient application
IPM practices to control Bollworms
Special Thrust : i) Poly coat treatment
ii) Use of Bio-agents to control pests
Activities for Special Thrust: i) Demonstrations ii) Trainings iii) Mass Media iv) Campaigns
(v) Technology packages for Sugarcane Cultivation
Seed : High yielding varieties
Sett treatment
Planting single budded sets
District Agriculture Plan – Vellore District 71
Main Field : Application of Organic Manure / Bio-fertilzers Soil test based macro and micro nutrient application De-trashing and Mulching Use of Bio-agents to control Pests Management of woolly aphid using Acephate Pit Method of planting with Drip and Fertigation Special Thrust : i) Single budded planting ii) Pit method of planting Activities for Special Thrust : i) Demonstrations ii) Trainings iii) Mass Media iv) Campaigns
(vi) Technology packages for Oilseeds Cultivation
Seed : High yielding varieties Use of certified seeds Use of required quantity Seed Hardening (Rainfed) Seed treatment with fungicides / bio-fertilizers / Tviridi Main Field : Application of Enriched FYM (Rainfed) / Bio-fertilizers Soil test based macro and micro nutrient application Application of Gypsum in Groundnut IPM to control RHC in Groundnut Drought management (Rainfed) Sprinkler irrigation method
Post Harvest : Proper storage to reduce Aflotoxin content
Special Thrust : i) Seed Hardening ii) Soil Mulching iii) Enriched FYM application
Activities for Special Thrust: i) Demonstrations ii) Trainings iii) Mass Media iv) Campaigns
District Agriculture Plan – Vellore District 72
CHAPTER V
ALLIED SECTOR
Introduction
Development of allied agricultural sectors has been incorporated as a component
of District Agricultural Plan so as to ensure a holistic development of Vellore district. In
this chapter, various ongoing schemes and technological interventions required for the
development of agriculture allied sectors like horticulture, animal husbandry, fisheries,
agricultural engineering, agricultural marketing and agri-business, sericulture and water
resources (PWD) for Vellore district are discussed.
5.1 Horticulture
The on-going schemes for horticultural development in Vellore district would
throw light on the current status and the priorities to be given for future horticultural
development. The details about on-going schemes on horticultural development in the
district are given in Table 5.1.
Table 5.1: On-going Schemes on Horticultural Development in Vellore District
S. No. On Going Schemes Physical (Ha) Financial
(Rs. in Lakhs)
1 National Horticulture Mission 3555 389.745
2 Integrated Horticulture Development Scheme 1595 16.510
3. Scheme Micro Irrigation 660 100.47
Total 5150 506.725 State Horticulture Farms
Components Navlock Kudapattu Thagarakuppam Total
Propagation (Nos.) 370500 162000 93000 625500
Production (Nos.) 201000 98050 79400 368450
Distribution (Nos.) 201000 98050 79400 368450
Source: Records of the Office of the Assistant Director of Horticulture, Vellore.
District Agriculture Plan – Vellore District 73
As could be seen in Table 5.1, Rs. 507 lakhs worth of developmental works
relating to horticulture was taking place in Vellore district. The basic infrastructure for
the development of horticulture centres around the development of State Horticulture
Farms which are located at Navlock, Kudapattu and Thagarakuppam. The main activities
of these farms are given in lower part of the Table 5.1.
5.2 Animal Husbandry
Livestock enterprise is an important complementary activity to the crop activities.
Basic information about cattle and poultry population (2004) in Vellore District is given
in Table 5.2 below.
The cattle population in Vellore district accounted for 47 per cent of the total
livestock population in the district and it also accounted for 5.5 per cent of the cattle
population in the State as indicated in Table 5.3. Sheep and goat population accounted for
5.3 and 2.8 per cent of their livestock population in the State respectively. Livestock
population in the district was 4.3 per cent of the total livestock population in the State.
As could be seen in Table 5.4, there were eight veterinary hospitals, 50 veterinary
dispensaries and 67 veterinary sub centres. In Table 5.5, block wise number of co-
operative milk producers’ societies and quantity of milk produced during 2005-06 are
given. In Vellore district, there were 323 cooperative societies with a maximum number
of societies in Solingur block (45 societies) followed by Thimiri (42), Gudiyatham (32),
Anaicut (31) and so on. Quantity of milk produced in the district was 347.4 lakh litres in
2005-06.
Average annual production of milk, egg and meat for the triennium ending 2006-
07 is given in Table 5.6. Annual growth rates of productivity of egg and milk and also
production of milk and egg are presented in Tables 5.7 and 5.8 respectively. Although
there were increases in the productivities of milk and egg, there was a declining trend as
regards the production of buffalo milk, egg and meat.
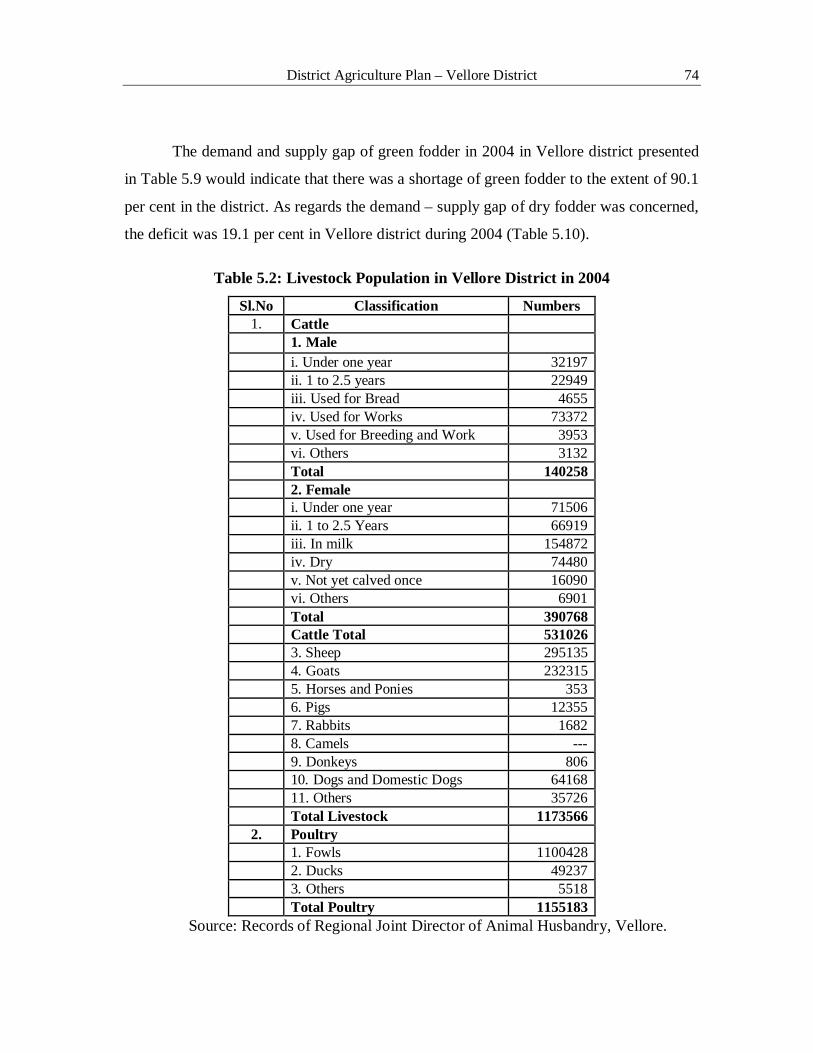
District Agriculture Plan – Vellore District 74
The demand and supply gap of green fodder in 2004 in Vellore district presented
in Table 5.9 would indicate that there was a shortage of green fodder to the extent of 90.1
per cent in the district. As regards the demand – supply gap of dry fodder was concerned,
the deficit was 19.1 per cent in Vellore district during 2004 (Table 5.10).
Table 5.2: Livestock Population in Vellore District in 2004
Sl.No Classification Numbers 1. Cattle 1. Male i. Under one year 32197 ii. 1 to 2.5 years 22949 iii. Used for Bread 4655 iv. Used for Works 73372 v. Used for Breeding and Work 3953 vi. Others 3132 Total 140258 2. Female i. Under one year 71506 ii. 1 to 2.5 Years 66919 iii. In milk 154872 iv. Dry 74480 v. Not yet calved once 16090 vi. Others 6901 Total 390768 Cattle Total 531026 3. Sheep 295135 4. Goats 232315 5. Horses and Ponies 353 6. Pigs 12355 7. Rabbits 1682 8. Camels --- 9. Donkeys 806 10. Dogs and Domestic Dogs 64168 11. Others 35726 Total Livestock 1173566
2. Poultry 1. Fowls 1100428 2. Ducks 49237 3. Others 5518 Total Poultry 1155183
Source: Records of Regional Joint Director of Animal Husbandry, Vellore.
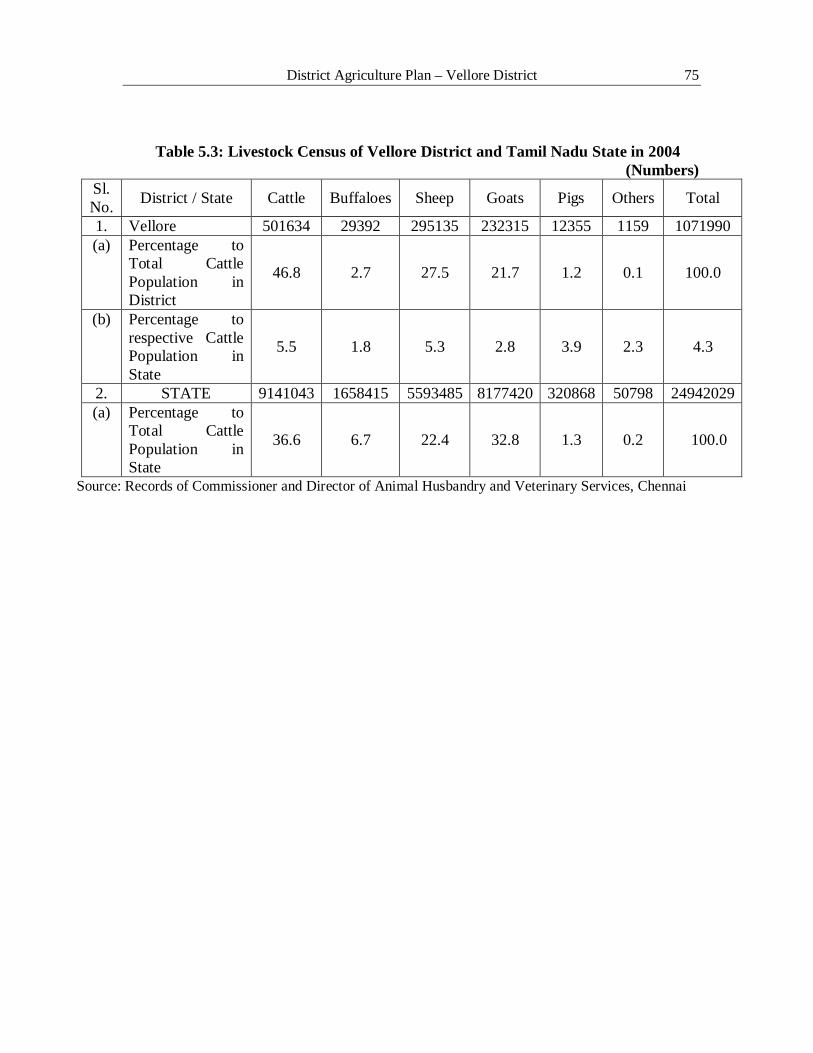
District Agriculture Plan – Vellore District 75
Table 5.3: Livestock Census of Vellore District and Tamil Nadu State in 2004 (Numbers)
Sl. No. District / State Cattle Buffaloes Sheep Goats Pigs Others Total
1. Vellore 501634 29392 295135 232315 12355 1159 1071990 (a) Percentage to
Total Cattle Population in District
46.8 2.7 27.5 21.7 1.2 0.1 100.0
(b) Percentage to respective Cattle Population in State
5.5 1.8 5.3 2.8 3.9 2.3 4.3
2. STATE 9141043 1658415 5593485 8177420 320868 50798 24942029 (a) Percentage to
Total Cattle Population in State
36.6 6.7 22.4 32.8 1.3 0.2 100.0
Source: Records of Commissioner and Director of Animal Husbandry and Veterinary Services, Chennai
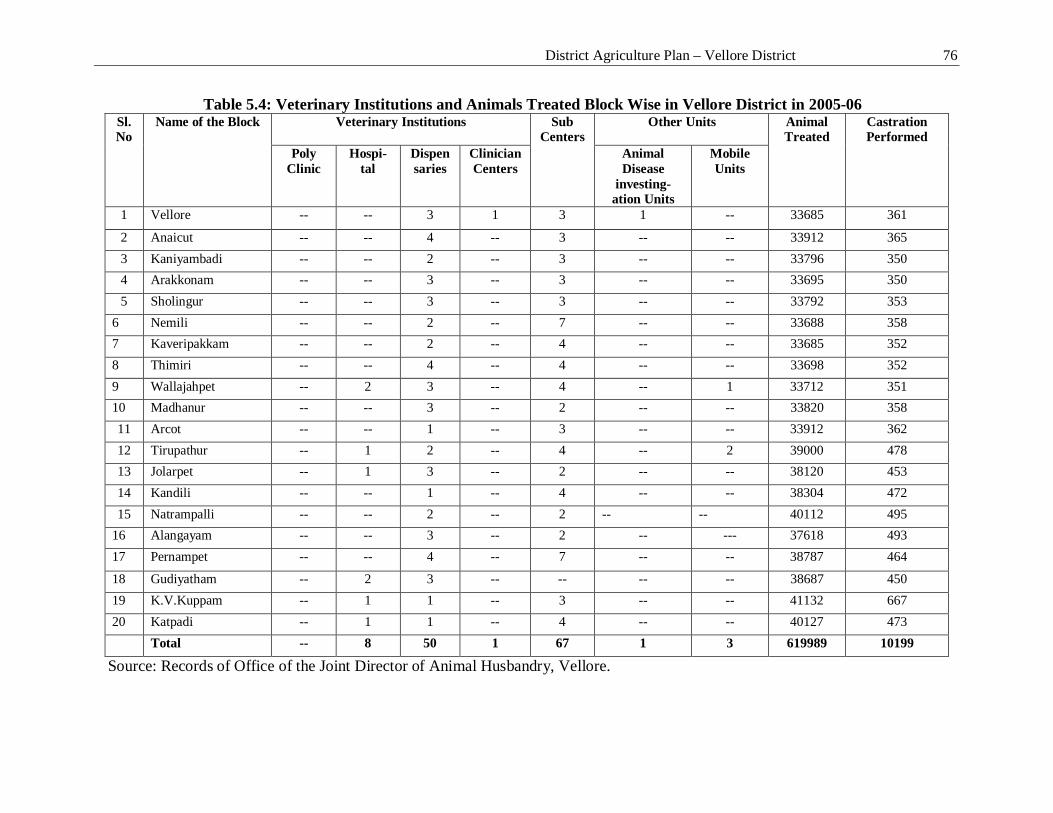
District Agriculture Plan – Vellore District 76
Table 5.4: Veterinary Institutions and Animals Treated Block Wise in Vellore District in 2005-06 Sl. No
Name of the Block Veterinary Institutions Sub Centers
Other Units Animal Treated
Castration Performed
Poly Clinic
Hospi-tal
Dispen saries
Clinician Centers
Animal Disease
investing-ation Units
Mobile Units
1 Vellore -- -- 3 1 3 1 -- 33685 361
2 Anaicut -- -- 4 -- 3 -- -- 33912 365 3 Kaniyambadi -- -- 2 -- 3 -- -- 33796 350 4 Arakkonam -- -- 3 -- 3 -- -- 33695 350 5 Sholingur -- -- 3 -- 3 -- -- 33792 353
6 Nemili -- -- 2 -- 7 -- -- 33688 358 7 Kaveripakkam -- -- 2 -- 4 -- -- 33685 352 8 Thimiri -- -- 4 -- 4 -- -- 33698 352 9 Wallajahpet -- 2 3 -- 4 -- 1 33712 351 10 Madhanur -- -- 3 -- 2 -- -- 33820 358 11 Arcot -- -- 1 -- 3 -- -- 33912 362 12 Tirupathur -- 1 2 -- 4 -- 2 39000 478 13 Jolarpet -- 1 3 -- 2 -- -- 38120 453 14 Kandili -- -- 1 -- 4 -- -- 38304 472 15 Natrampalli -- -- 2 -- 2 -- -- 40112 495
16 Alangayam -- -- 3 -- 2 -- --- 37618 493 17 Pernampet -- -- 4 -- 7 -- -- 38787 464
18 Gudiyatham -- 2 3 -- -- -- -- 38687 450 19 K.V.Kuppam -- 1 1 -- 3 -- -- 41132 667 20 Katpadi -- 1 1 -- 4 -- -- 40127 473 Total -- 8 50 1 67 1 3 619989 10199
Source: Records of Office of the Joint Director of Animal Husbandry, Vellore.
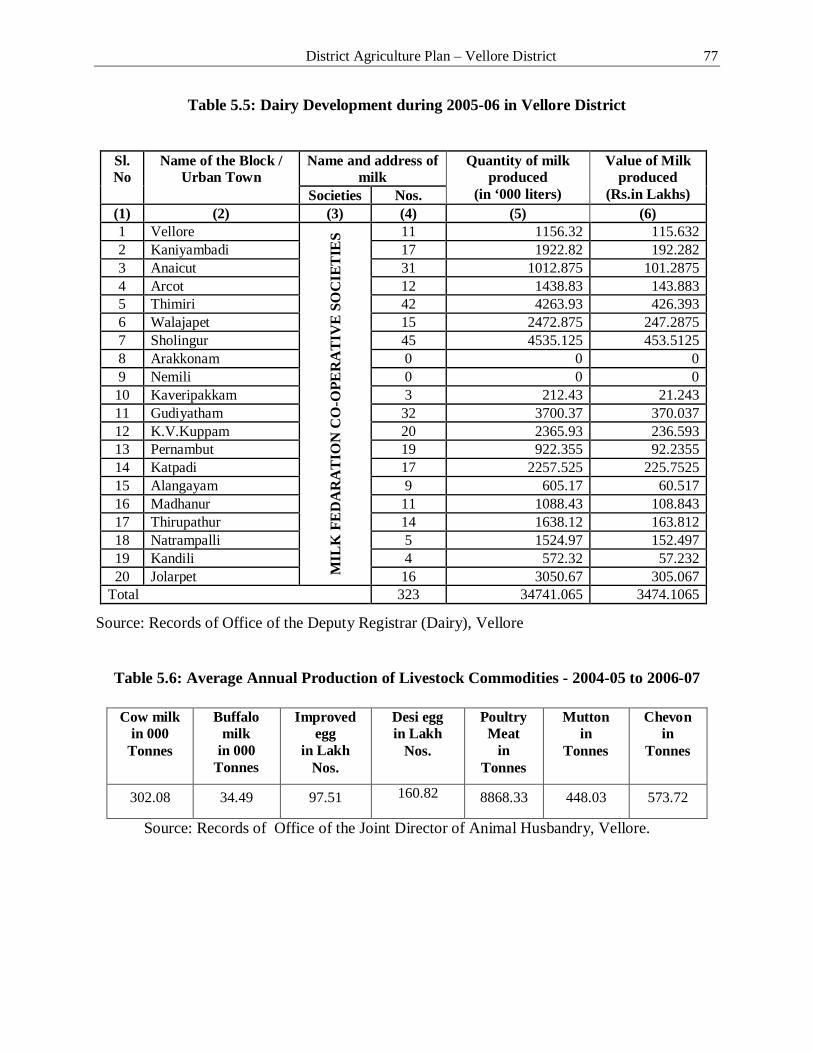
District Agriculture Plan – Vellore District 77
Table 5.5: Dairy Development during 2005-06 in Vellore District
Sl. No
Name of the Block / Urban Town
Name and address of milk
Quantity of milk produced
(in ‘000 liters)
Value of Milk produced
(Rs.in Lakhs) Societies Nos. (1) (2) (3) (4) (5) (6) 1 Vellore
MIL
K F
ED
AR
AT
ION
CO
-OPE
RA
TIV
E SO
CIE
TIE
S 11 1156.32 115.632 2 Kaniyambadi 17 1922.82 192.282 3 Anaicut 31 1012.875 101.2875 4 Arcot 12 1438.83 143.883 5 Thimiri 42 4263.93 426.393 6 Walajapet 15 2472.875 247.2875 7 Sholingur 45 4535.125 453.5125 8 Arakkonam 0 0 0 9 Nemili 0 0 0 10 Kaveripakkam 3 212.43 21.243 11 Gudiyatham 32 3700.37 370.037 12 K.V.Kuppam 20 2365.93 236.593 13 Pernambut 19 922.355 92.2355 14 Katpadi 17 2257.525 225.7525 15 Alangayam 9 605.17 60.517 16 Madhanur 11 1088.43 108.843 17 Thirupathur 14 1638.12 163.812 18 Natrampalli 5 1524.97 152.497 19 Kandili 4 572.32 57.232 20 Jolarpet 16 3050.67 305.067
Total 323 34741.065 3474.1065
Source: Records of Office of the Deputy Registrar (Dairy), Vellore
Table 5.6: Average Annual Production of Livestock Commodities - 2004-05 to 2006-07
Cow milk in 000
Tonnes
Buffalo milk
in 000 Tonnes
Improved egg
in Lakh Nos.
Desi egg in Lakh
Nos.
Poultry Meat
in Tonnes
Mutton in
Tonnes
Chevon in
Tonnes
302.08 34.49 97.51 160.82 8868.33 448.03 573.72
Source: Records of Office of the Joint Director of Animal Husbandry, Vellore.
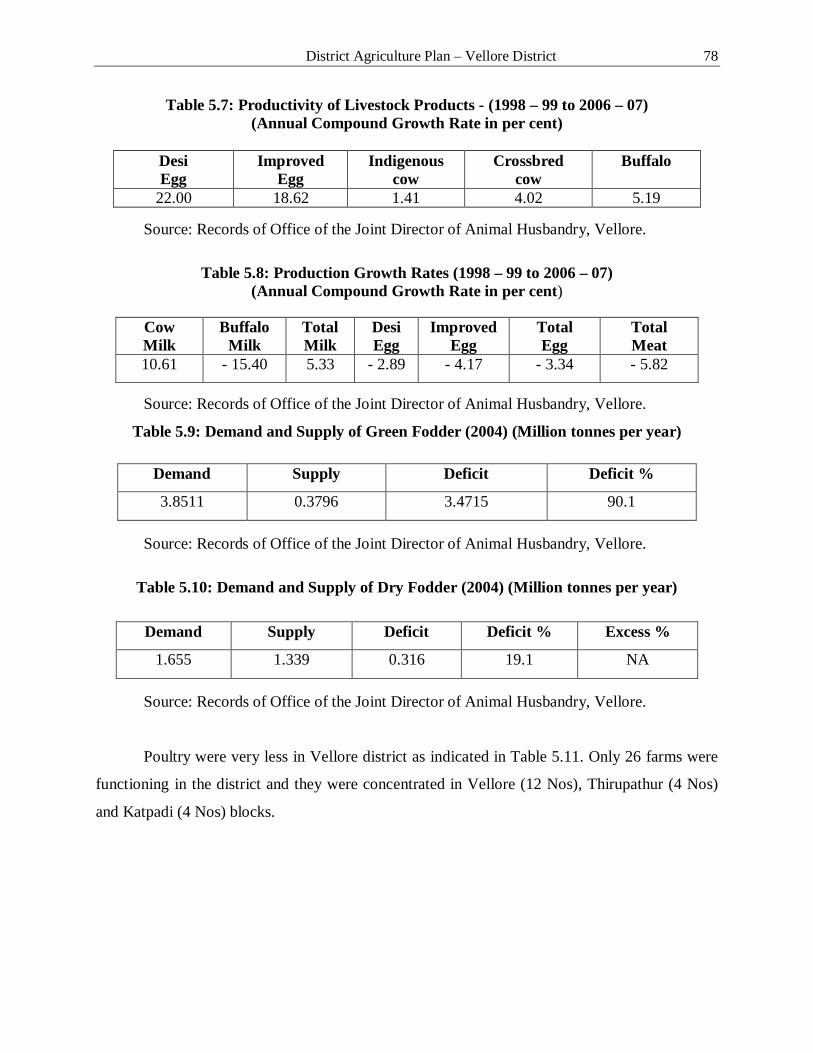
District Agriculture Plan – Vellore District 78
Table 5.7: Productivity of Livestock Products - (1998 – 99 to 2006 – 07) (Annual Compound Growth Rate in per cent)
Desi Egg
Improved Egg
Indigenous cow
Crossbred cow
Buffalo
22.00 18.62 1.41 4.02 5.19
Source: Records of Office of the Joint Director of Animal Husbandry, Vellore.
Table 5.8: Production Growth Rates (1998 – 99 to 2006 – 07) (Annual Compound Growth Rate in per cent)
Cow Milk
Buffalo Milk
Total Milk
Desi Egg
Improved Egg
Total Egg
Total Meat
10.61 - 15.40 5.33 - 2.89 - 4.17 - 3.34 - 5.82
Source: Records of Office of the Joint Director of Animal Husbandry, Vellore.
Table 5.9: Demand and Supply of Green Fodder (2004) (Million tonnes per year)
Demand Supply Deficit Deficit %
3.8511 0.3796 3.4715 90.1
Source: Records of Office of the Joint Director of Animal Husbandry, Vellore.
Table 5.10: Demand and Supply of Dry Fodder (2004) (Million tonnes per year)
Demand Supply Deficit Deficit % Excess %
1.655 1.339 0.316 19.1 NA
Source: Records of Office of the Joint Director of Animal Husbandry, Vellore.
Poultry were very less in Vellore district as indicated in Table 5.11. Only 26 farms were
functioning in the district and they were concentrated in Vellore (12 Nos), Thirupathur (4 Nos)
and Katpadi (4 Nos) blocks.
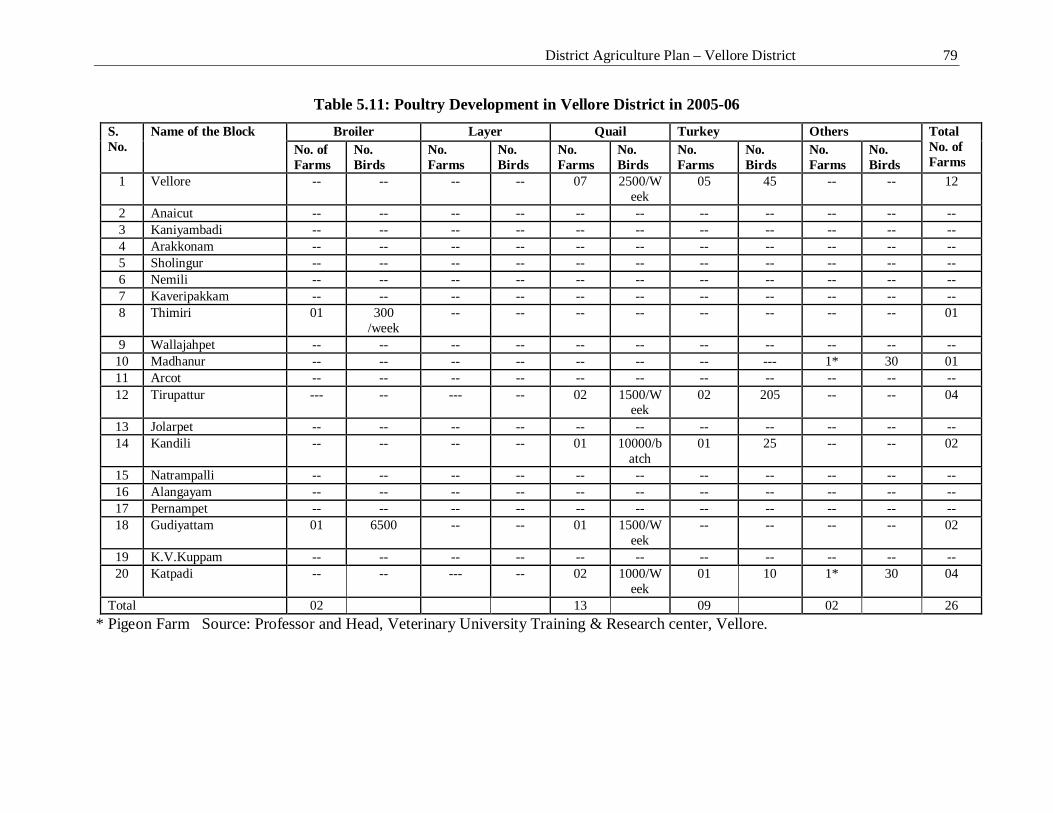
District Agriculture Plan – Vellore District 79
Table 5.11: Poultry Development in Vellore District in 2005-06 S. No.
Name of the Block Broiler Layer Quail Turkey Others Total No. of Farms
No. of Farms
No. Birds
No. Farms
No. Birds
No. Farms
No. Birds
No. Farms
No. Birds
No. Farms
No. Birds
1 Vellore -- -- -- -- 07 2500/Week
05 45 -- -- 12
2 Anaicut -- -- -- -- -- -- -- -- -- -- -- 3 Kaniyambadi -- -- -- -- -- -- -- -- -- -- -- 4 Arakkonam -- -- -- -- -- -- -- -- -- -- -- 5 Sholingur -- -- -- -- -- -- -- -- -- -- -- 6 Nemili -- -- -- -- -- -- -- -- -- -- -- 7 Kaveripakkam -- -- -- -- -- -- -- -- -- -- -- 8 Thimiri 01 300
/week -- -- -- -- -- -- -- -- 01
9 Wallajahpet -- -- -- -- -- -- -- -- -- -- -- 10 Madhanur -- -- -- -- -- -- -- --- 1* 30 01 11 Arcot -- -- -- -- -- -- -- -- -- -- -- 12 Tirupattur --- -- --- -- 02 1500/W
eek 02 205 -- -- 04
13 Jolarpet -- -- -- -- -- -- -- -- -- -- -- 14 Kandili -- -- -- -- 01 10000/b
atch 01 25 -- -- 02
15 Natrampalli -- -- -- -- -- -- -- -- -- -- -- 16 Alangayam -- -- -- -- -- -- -- -- -- -- -- 17 Pernampet -- -- -- -- -- -- -- -- -- -- -- 18 Gudiyattam 01 6500 -- -- 01 1500/W
eek -- -- -- -- 02
19 K.V.Kuppam -- -- -- -- -- -- -- -- -- -- -- 20 Katpadi -- -- --- -- 02 1000/W
eek 01 10 1* 30 04
Total 02 13 09 02 26 * Pigeon Farm Source: Professor and Head, Veterinary University Training & Research center, Vellore.
District Agriculture Plan – Vellore District 80
5.2.1 Strength / Gaps
(a) Dairy Cattle
i) Strength
• Availability of barren lands for conversion it into grazing area. • Enhanced marketing potential in the neighbourhoods • Large scale participation of private players
ii) Weakness
• Fodder scarcity • Inadequate health care • Endemic for Anthrax and Foot and Mouth Disease
(b) Sheep and Goat
i) Strength
• Nomadic rearing – Vast uncultivable land – Rainfed area • Sizeable number of breedable population – Madras Red / Nellore • Consumer’s preference – By-product (leather) is efficiently utilized
ii) Weakness
• Non-availability of superior Rams and Bucks • Unorganized marketing resulting in wild price fluctuations • Absence of mechanism to promote the sector (Financial assistance)
(c) Poultry
i) Strength
• Availability of dry land – conducive atmosphere (Layer) • Contract farming (Broiler) • More scope for backyard poultry
ii) Weakness
• Depopulation of layers • Increase in the input (feed) cost • Bird flu threat due to unregulated farms
(d) Piggery
i) Strength
• Availability of germ plasm from University Livestock Farm • Marketing facility to near-by Metropolitan cities • Low maintenance cost through garbage feeding – Farmer’s Interest Groups
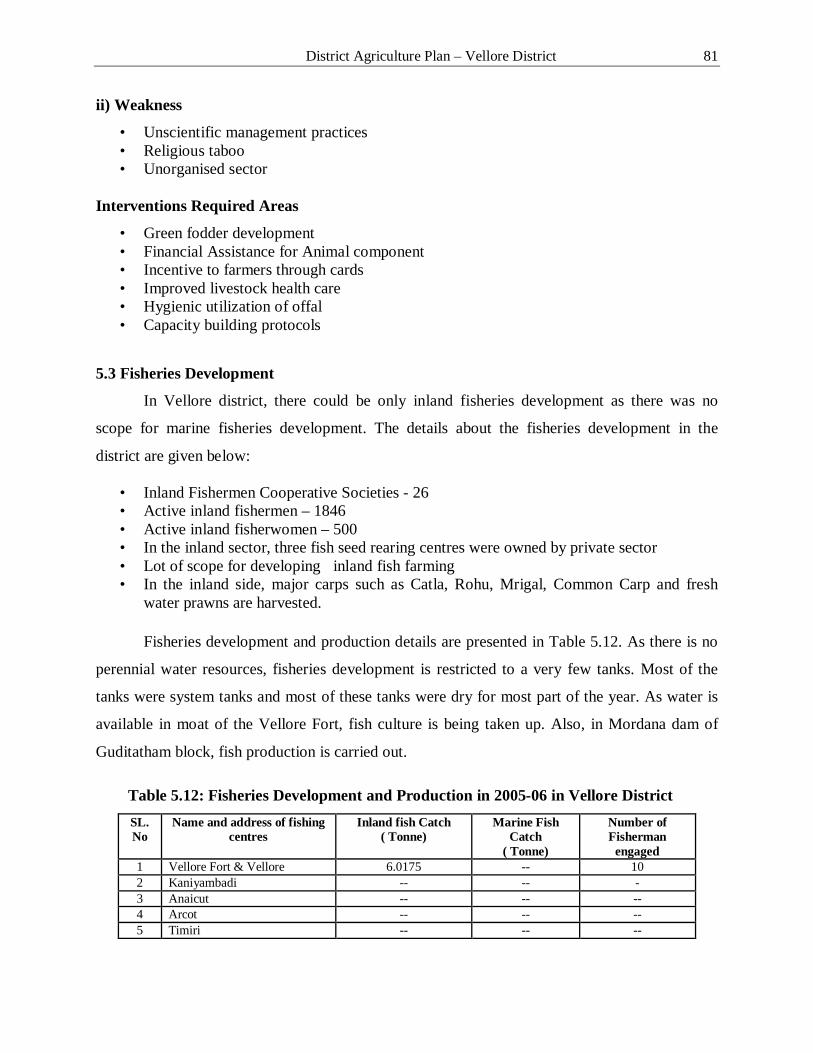
District Agriculture Plan – Vellore District 81
ii) Weakness
• Unscientific management practices • Religious taboo • Unorganised sector
Interventions Required Areas
• Green fodder development • Financial Assistance for Animal component • Incentive to farmers through cards • Improved livestock health care • Hygienic utilization of offal • Capacity building protocols
5.3 Fisheries Development
In Vellore district, there could be only inland fisheries development as there was no
scope for marine fisheries development. The details about the fisheries development in the
district are given below:
• Inland Fishermen Cooperative Societies - 26 • Active inland fishermen – 1846 • Active inland fisherwomen – 500 • In the inland sector, three fish seed rearing centres were owned by private sector • Lot of scope for developing inland fish farming • In the inland side, major carps such as Catla, Rohu, Mrigal, Common Carp and fresh
water prawns are harvested.
Fisheries development and production details are presented in Table 5.12. As there is no
perennial water resources, fisheries development is restricted to a very few tanks. Most of the
tanks were system tanks and most of these tanks were dry for most part of the year. As water is
available in moat of the Vellore Fort, fish culture is being taken up. Also, in Mordana dam of
Guditatham block, fish production is carried out.
Table 5.12: Fisheries Development and Production in 2005-06 in Vellore District SL. No
Name and address of fishing centres
Inland fish Catch ( Tonne)
Marine Fish Catch
( Tonne)
Number of Fisherman
engaged 1 Vellore Fort & Vellore 6.0175 -- 10 2 Kaniyambadi -- -- - 3 Anaicut -- -- -- 4 Arcot -- -- -- 5 Timiri -- -- --
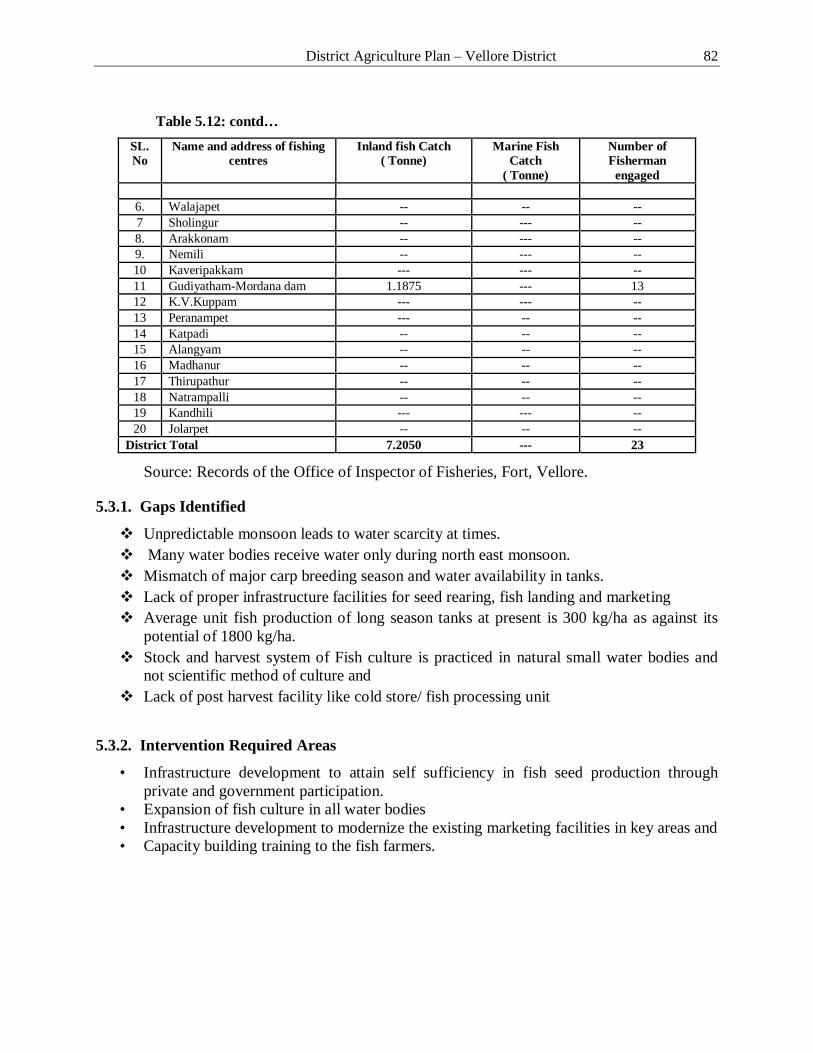
District Agriculture Plan – Vellore District 82
Table 5.12: contd…
SL. No
Name and address of fishing centres
Inland fish Catch ( Tonne)
Marine Fish Catch
( Tonne)
Number of Fisherman
engaged
6. Walajapet -- -- -- 7 Sholingur -- --- -- 8. Arakkonam -- --- -- 9. Nemili -- --- -- 10 Kaveripakkam --- --- -- 11 Gudiyatham-Mordana dam 1.1875 --- 13 12 K.V.Kuppam --- --- -- 13 Peranampet --- -- -- 14 Katpadi -- -- -- 15 Alangyam -- -- -- 16 Madhanur -- -- -- 17 Thirupathur -- -- -- 18 Natrampalli -- -- -- 19 Kandhili --- --- -- 20 Jolarpet -- -- --
District Total 7.2050 --- 23
Source: Records of the Office of Inspector of Fisheries, Fort, Vellore.
5.3.1. Gaps Identified
Unpredictable monsoon leads to water scarcity at times. Many water bodies receive water only during north east monsoon. Mismatch of major carp breeding season and water availability in tanks. Lack of proper infrastructure facilities for seed rearing, fish landing and marketing Average unit fish production of long season tanks at present is 300 kg/ha as against its
potential of 1800 kg/ha. Stock and harvest system of Fish culture is practiced in natural small water bodies and
not scientific method of culture and Lack of post harvest facility like cold store/ fish processing unit
5.3.2. Intervention Required Areas
• Infrastructure development to attain self sufficiency in fish seed production through private and government participation.
• Expansion of fish culture in all water bodies • Infrastructure development to modernize the existing marketing facilities in key areas and • Capacity building training to the fish farmers.
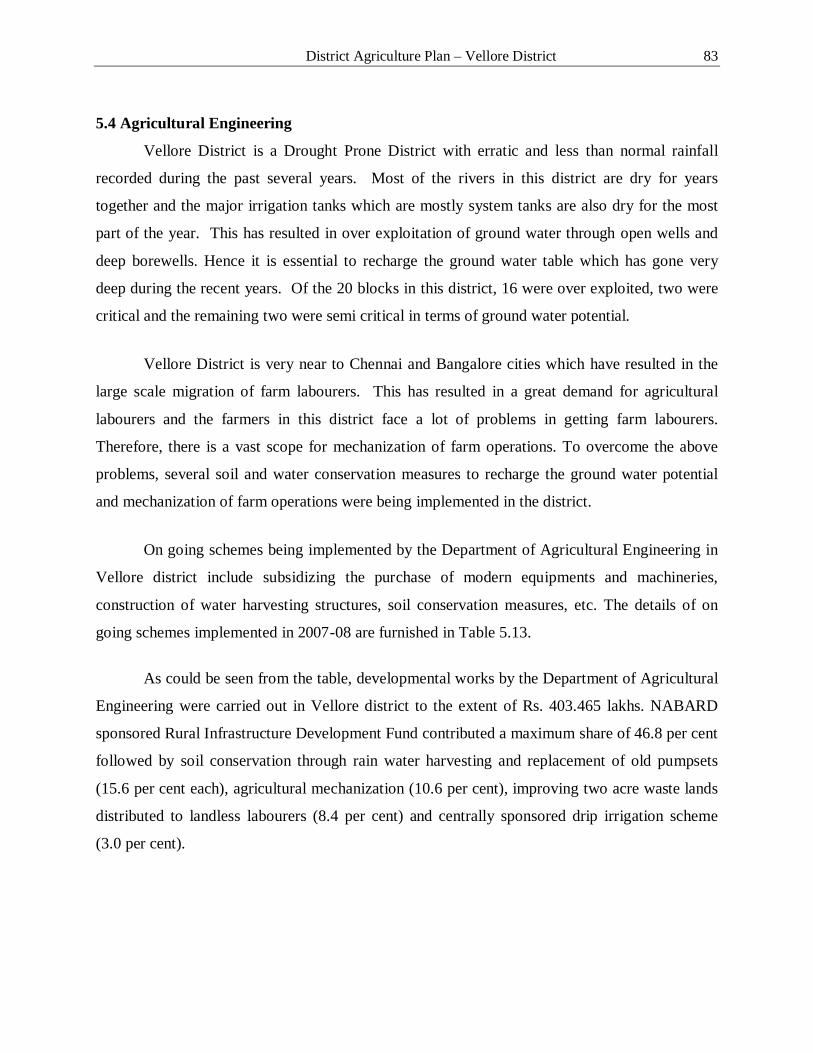
District Agriculture Plan – Vellore District 83
5.4 Agricultural Engineering
Vellore District is a Drought Prone District with erratic and less than normal rainfall
recorded during the past several years. Most of the rivers in this district are dry for years
together and the major irrigation tanks which are mostly system tanks are also dry for the most
part of the year. This has resulted in over exploitation of ground water through open wells and
deep borewells. Hence it is essential to recharge the ground water table which has gone very
deep during the recent years. Of the 20 blocks in this district, 16 were over exploited, two were
critical and the remaining two were semi critical in terms of ground water potential.
Vellore District is very near to Chennai and Bangalore cities which have resulted in the
large scale migration of farm labourers. This has resulted in a great demand for agricultural
labourers and the farmers in this district face a lot of problems in getting farm labourers.
Therefore, there is a vast scope for mechanization of farm operations. To overcome the above
problems, several soil and water conservation measures to recharge the ground water potential
and mechanization of farm operations were being implemented in the district.
On going schemes being implemented by the Department of Agricultural Engineering in
Vellore district include subsidizing the purchase of modern equipments and machineries,
construction of water harvesting structures, soil conservation measures, etc. The details of on
going schemes implemented in 2007-08 are furnished in Table 5.13.
As could be seen from the table, developmental works by the Department of Agricultural
Engineering were carried out in Vellore district to the extent of Rs. 403.465 lakhs. NABARD
sponsored Rural Infrastructure Development Fund contributed a maximum share of 46.8 per cent
followed by soil conservation through rain water harvesting and replacement of old pumpsets
(15.6 per cent each), agricultural mechanization (10.6 per cent), improving two acre waste lands
distributed to landless labourers (8.4 per cent) and centrally sponsored drip irrigation scheme
(3.0 per cent).
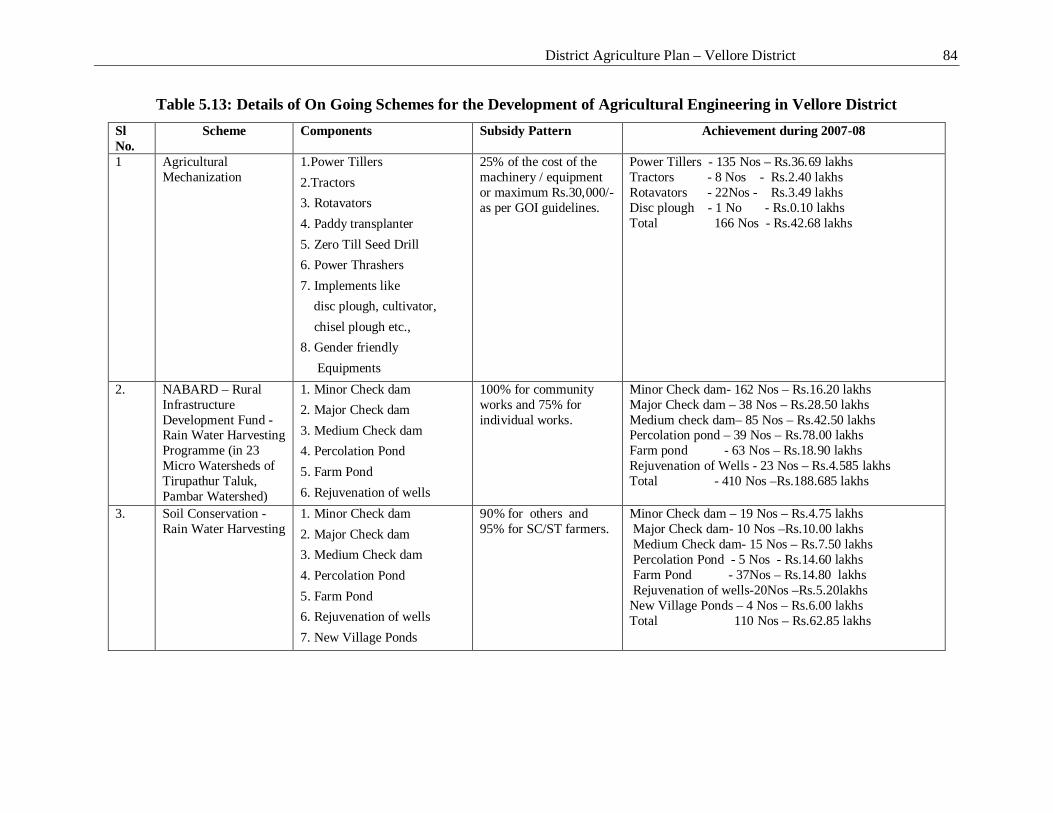
District Agriculture Plan – Vellore District 84
Table 5.13: Details of On Going Schemes for the Development of Agricultural Engineering in Vellore District Sl No.
Scheme Components Subsidy Pattern Achievement during 2007-08
1 Agricultural Mechanization
1.Power Tillers 2.Tractors 3. Rotavators 4. Paddy transplanter 5. Zero Till Seed Drill 6. Power Thrashers 7. Implements like disc plough, cultivator, chisel plough etc., 8. Gender friendly Equipments
25% of the cost of the machinery / equipment or maximum Rs.30,000/- as per GOI guidelines.
Power Tillers - 135 Nos – Rs.36.69 lakhs Tractors - 8 Nos - Rs.2.40 lakhs Rotavators - 22Nos - Rs.3.49 lakhs Disc plough - 1 No - Rs.0.10 lakhs Total 166 Nos - Rs.42.68 lakhs
2. NABARD – Rural Infrastructure Development Fund - Rain Water Harvesting Programme (in 23 Micro Watersheds of Tirupathur Taluk, Pambar Watershed)
1. Minor Check dam 2. Major Check dam 3. Medium Check dam 4. Percolation Pond 5. Farm Pond 6. Rejuvenation of wells
100% for community works and 75% for individual works.
Minor Check dam- 162 Nos – Rs.16.20 lakhs Major Check dam – 38 Nos – Rs.28.50 lakhs Medium check dam– 85 Nos – Rs.42.50 lakhs Percolation pond – 39 Nos – Rs.78.00 lakhs Farm pond - 63 Nos – Rs.18.90 lakhs Rejuvenation of Wells - 23 Nos – Rs.4.585 lakhs Total - 410 Nos –Rs.188.685 lakhs
3. Soil Conservation - Rain Water Harvesting
1. Minor Check dam 2. Major Check dam 3. Medium Check dam 4. Percolation Pond 5. Farm Pond 6. Rejuvenation of wells 7. New Village Ponds
90% for others and 95% for SC/ST farmers.
Minor Check dam – 19 Nos – Rs.4.75 lakhs Major Check dam- 10 Nos –Rs.10.00 lakhs Medium Check dam- 15 Nos – Rs.7.50 lakhs Percolation Pond - 5 Nos - Rs.14.60 lakhs Farm Pond - 37Nos – Rs.14.80 lakhs Rejuvenation of wells-20Nos –Rs.5.20lakhs New Village Ponds – 4 Nos – Rs.6.00 lakhs Total 110 Nos – Rs.62.85 lakhs
District Agriculture Plan – Vellore District 85
Table 5.13 contd… Sl No.
Scheme Components Subsidy Pattern Achievement during 2007-08
4. Replacement of old pump sets scheme Special Component
Below 5 HP
Others
Special Component 5 HP and above
Others Accessories
50% or Rs.3500/- whichever is less 25% or Rs.2500/- whichever is less 50% or Rs.6000/- whichever is less 25% or Rs.5000/- whichever is less 50% or Rs.1500/- whichever is less
Special Component -54 Nos- Rs.2.69 lakhs Below 5 HP
Others - 231 Nos- Rs.9.24 lakhs
Special Component -104 Nos– Rs.7.71 lakhs 5 HP and above
Others 701 Nos- Rs.43.44 lakhs Total 1090 Nos - Rs. 63.08 lakh
5. Centrally Sponsored Micro Irrigation
Drip Irrigation 50% subject to the maximum limit fixed by the GOI as per the spacing of the crop.
Drip Irrigation – 110.30Hec – Rs.12.08 lakhs
Sub-Total 369.375
Sl. No.
Hiring of Machinery Scheme
Components
Hire charges
Achievement during 2007-08
1. Land development Bulldozer – 2 Nos Rs.670- per hour Bulldozers – 2331 Hours Tractor - 6 Nos Rs.265/- per hour Tractors – 4870 Hours Combined Harvestor – 1 No Rs.780/- per hour Combined Harvestor – 90 Hours
2. Minor Irrigation Rock Blasting Units – 5 Nos Rs.250/- per day Rock Blasting Units – 755 Blastings Hand Boring Set – 1 No Rs.40/- per meter Hand Boring Set – 338 Meters Geo physical survey Rs.500/- per point Geo Physical Survey – 172 Points
Distribution of 2 Acres Wastelands
Jungle Clearance, land shaping, Tractor Ploughing, Bund formation,
Rs.2600/per Acre 100% subsidy
Phase.I – 172.07 Acres – Rs.4.73 lakhs Phase.II – 254.84 Acres –Rs. 6.39 lakhs Phase.III – 580.82 Acres – Rs.14.67 lakhs Phase.IV – 381.13 Acres – Rs. 8.30 lakhs Phase.V – 65.34 Acres - Under progress
Sub-Total 34.09 Total 403.465
Source: Records of Office of the Executive Engineer, (AED), Vellore.
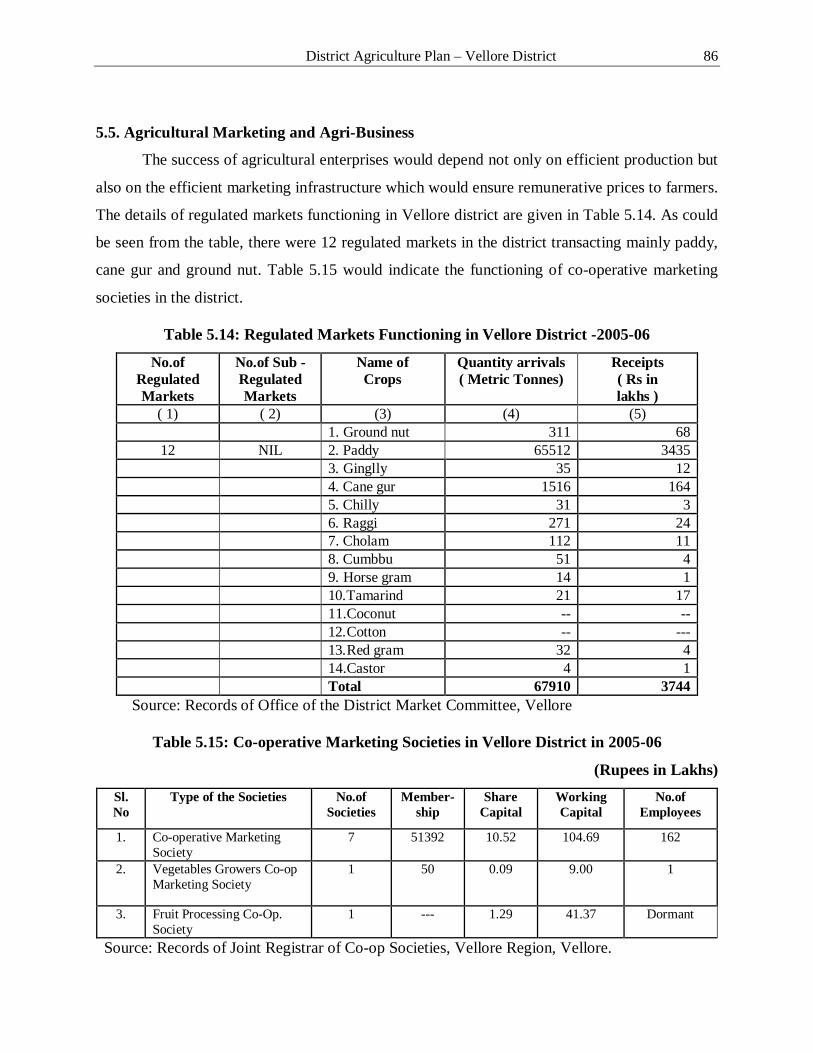
District Agriculture Plan – Vellore District 86
5.5. Agricultural Marketing and Agri-Business
The success of agricultural enterprises would depend not only on efficient production but
also on the efficient marketing infrastructure which would ensure remunerative prices to farmers.
The details of regulated markets functioning in Vellore district are given in Table 5.14. As could
be seen from the table, there were 12 regulated markets in the district transacting mainly paddy,
cane gur and ground nut. Table 5.15 would indicate the functioning of co-operative marketing
societies in the district.
Table 5.14: Regulated Markets Functioning in Vellore District -2005-06
No.of Regulated Markets
No.of Sub - Regulated Markets
Name of Crops
Quantity arrivals ( Metric Tonnes)
Receipts ( Rs in lakhs )
( 1) ( 2) (3) (4) (5) 1. Ground nut 311 68
12 NIL 2. Paddy 65512 3435 3. Ginglly 35 12 4. Cane gur 1516 164 5. Chilly 31 3 6. Raggi 271 24 7. Cholam 112 11 8. Cumbbu 51 4 9. Horse gram 14 1 10.Tamarind 21 17 11.Coconut -- -- 12.Cotton -- --- 13.Red gram 32 4 14.Castor 4 1 Total 67910 3744
Source: Records of Office of the District Market Committee, Vellore
Table 5.15: Co-operative Marketing Societies in Vellore District in 2005-06
(Rupees in Lakhs) Sl. No
Type of the Societies No.of Societies
Member-ship
Share Capital
Working Capital
No.of Employees
1. Co-operative Marketing Society
7 51392 10.52 104.69 162
2. Vegetables Growers Co-op Marketing Society
1 50 0.09 9.00 1
3. Fruit Processing Co-Op. Society
1 --- 1.29 41.37 Dormant
Source: Records of Joint Registrar of Co-op Societies, Vellore Region, Vellore.
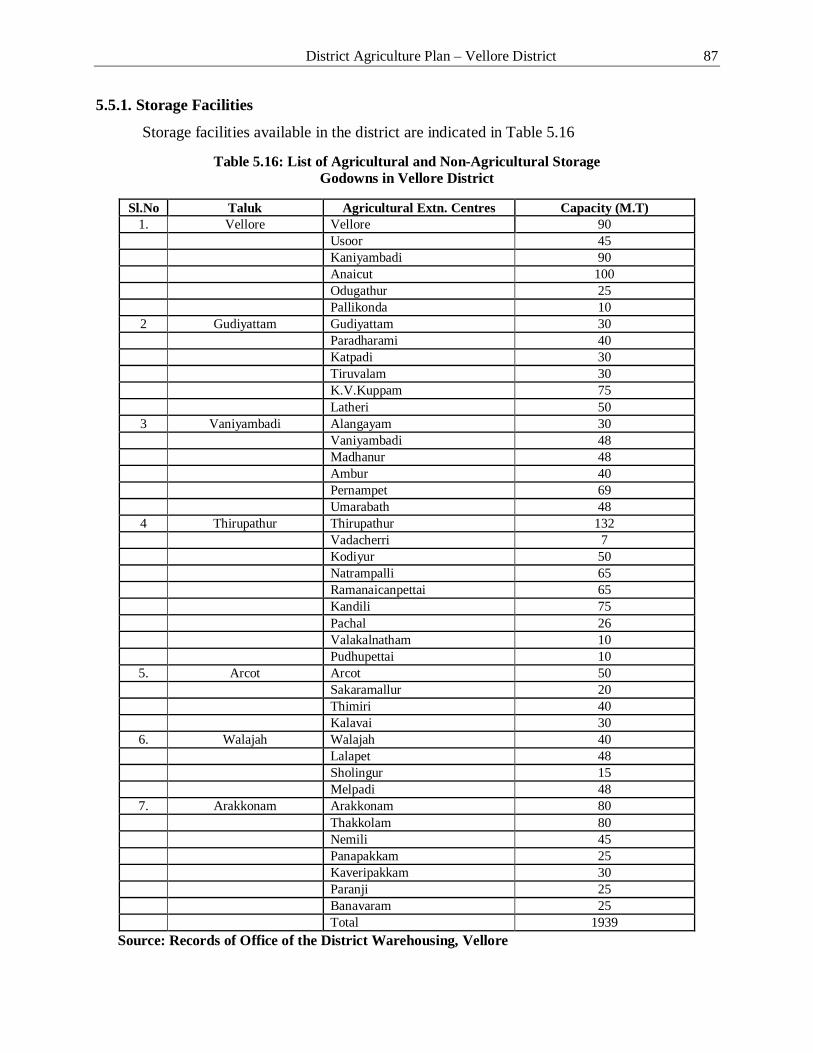
District Agriculture Plan – Vellore District 87
5.5.1. Storage Facilities
Storage facilities available in the district are indicated in Table 5.16
Table 5.16: List of Agricultural and Non-Agricultural Storage Godowns in Vellore District
Sl.No Taluk Agricultural Extn. Centres Capacity (M.T)
1. Vellore Vellore 90 Usoor 45 Kaniyambadi 90 Anaicut 100 Odugathur 25 Pallikonda 10
2 Gudiyattam Gudiyattam 30 Paradharami 40 Katpadi 30 Tiruvalam 30 K.V.Kuppam 75 Latheri 50
3 Vaniyambadi Alangayam 30 Vaniyambadi 48 Madhanur 48 Ambur 40 Pernampet 69 Umarabath 48
4 Thirupathur Thirupathur 132 Vadacherri 7 Kodiyur 50 Natrampalli 65 Ramanaicanpettai 65 Kandili 75 Pachal 26 Valakalnatham 10 Pudhupettai 10
5. Arcot Arcot 50 Sakaramallur 20 Thimiri 40 Kalavai 30
6. Walajah Walajah 40 Lalapet 48 Sholingur 15 Melpadi 48
7. Arakkonam Arakkonam 80 Thakkolam 80 Nemili 45 Panapakkam 25 Kaveripakkam 30 Paranji 25 Banavaram 25 Total 1939
Source: Records of Office of the District Warehousing, Vellore
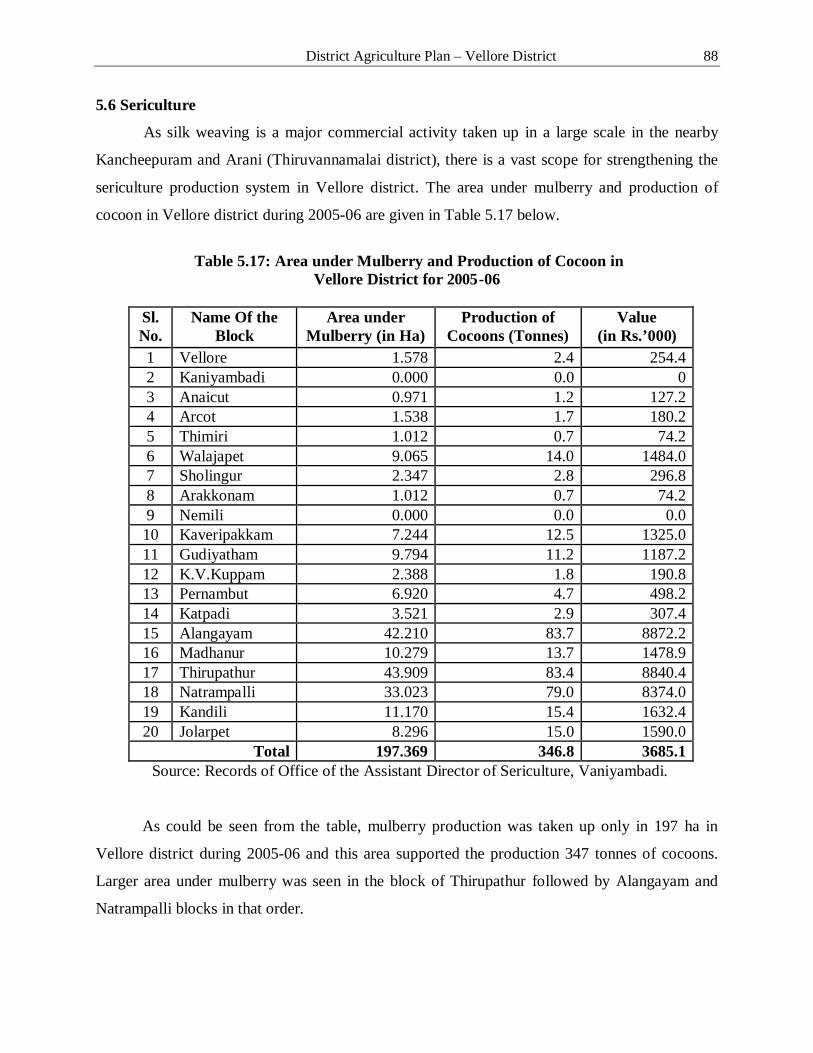
District Agriculture Plan – Vellore District 88
5.6 Sericulture
As silk weaving is a major commercial activity taken up in a large scale in the nearby
Kancheepuram and Arani (Thiruvannamalai district), there is a vast scope for strengthening the
sericulture production system in Vellore district. The area under mulberry and production of
cocoon in Vellore district during 2005-06 are given in Table 5.17 below.
Table 5.17: Area under Mulberry and Production of Cocoon in Vellore District for 2005-06
Sl.No.
Name Of the Block
Area under Mulberry (in Ha)
Production of Cocoons (Tonnes)
Value (in Rs.’000)
1 Vellore 1.578 2.4 254.4 2 Kaniyambadi 0.000 0.0 0 3 Anaicut 0.971 1.2 127.2 4 Arcot 1.538 1.7 180.2 5 Thimiri 1.012 0.7 74.2 6 Walajapet 9.065 14.0 1484.0 7 Sholingur 2.347 2.8 296.8 8 Arakkonam 1.012 0.7 74.2 9 Nemili 0.000 0.0 0.0 10 Kaveripakkam 7.244 12.5 1325.0 11 Gudiyatham 9.794 11.2 1187.2 12 K.V.Kuppam 2.388 1.8 190.8 13 Pernambut 6.920 4.7 498.2 14 Katpadi 3.521 2.9 307.4 15 Alangayam 42.210 83.7 8872.2 16 Madhanur 10.279 13.7 1478.9 17 Thirupathur 43.909 83.4 8840.4 18 Natrampalli 33.023 79.0 8374.0 19 Kandili 11.170 15.4 1632.4 20 Jolarpet 8.296 15.0 1590.0
Total 197.369 346.8 3685.1 Source: Records of Office of the Assistant Director of Sericulture, Vaniyambadi.
As could be seen from the table, mulberry production was taken up only in 197 ha in
Vellore district during 2005-06 and this area supported the production 347 tonnes of cocoons.
Larger area under mulberry was seen in the block of Thirupathur followed by Alangayam and
Natrampalli blocks in that order.
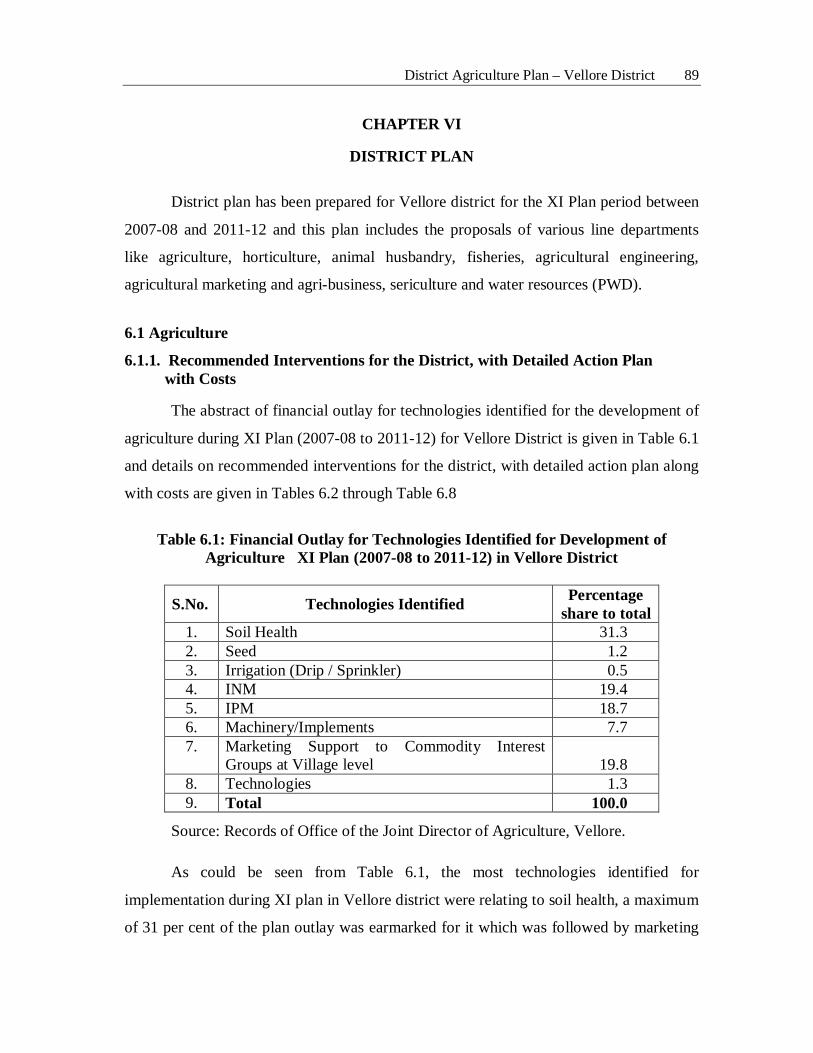
District Agriculture Plan – Vellore District 89
CHAPTER VI
DISTRICT PLAN
District plan has been prepared for Vellore district for the XI Plan period between
2007-08 and 2011-12 and this plan includes the proposals of various line departments
like agriculture, horticulture, animal husbandry, fisheries, agricultural engineering,
agricultural marketing and agri-business, sericulture and water resources (PWD).
6.1 Agriculture
6.1.1. Recommended Interventions for the District, with Detailed Action Plan with Costs
The abstract of financial outlay for technologies identified for the development of
agriculture during XI Plan (2007-08 to 2011-12) for Vellore District is given in Table 6.1
and details on recommended interventions for the district, with detailed action plan along
with costs are given in Tables 6.2 through Table 6.8
Table 6.1: Financial Outlay for Technologies Identified for Development of Agriculture XI Plan (2007-08 to 2011-12) in Vellore District
S.No. Technologies Identified Percentage share to total
1. Soil Health 31.3 2. Seed 1.2 3. Irrigation (Drip / Sprinkler) 0.5 4. INM 19.4 5. IPM 18.7 6. Machinery/Implements 7.7 7. Marketing Support to Commodity Interest
Groups at Village level 19.8 8. Technologies 1.3 9. Total 100.0
Source: Records of Office of the Joint Director of Agriculture, Vellore.
As could be seen from Table 6.1, the most technologies identified for
implementation during XI plan in Vellore district were relating to soil health, a maximum
of 31 per cent of the plan outlay was earmarked for it which was followed by marketing
District Agriculture Plan – Vellore District 90
support to Commodity Interest Groups at Village level with 19.8 per cent, Integrated
Nutrient Management (19.4 per cent), Integrated Pest Management (18.7 per cent), Farm
Mechanization (7.7 per cent) and so on.
The projected area to be covered under crops like paddy, maize, ground nut
(irrigated and rainfed), cotton (rain fed), millets (irrigated) and fodder crops during XI
Five Year Plan (2007-08 to 2011-12) would be 8,24, 500 Ha and the projected increase
from these crops would be 26.06 lakh tonnes (Table 6.2 through Table 6.8). The abstract
of physical and financial targets fixed for the development of agricultural sector through
various technological interventions in the XI plan period are given in Table 6.9. The total
financial outlay for the plan period has been fixed at Rs. 29.17 crores.
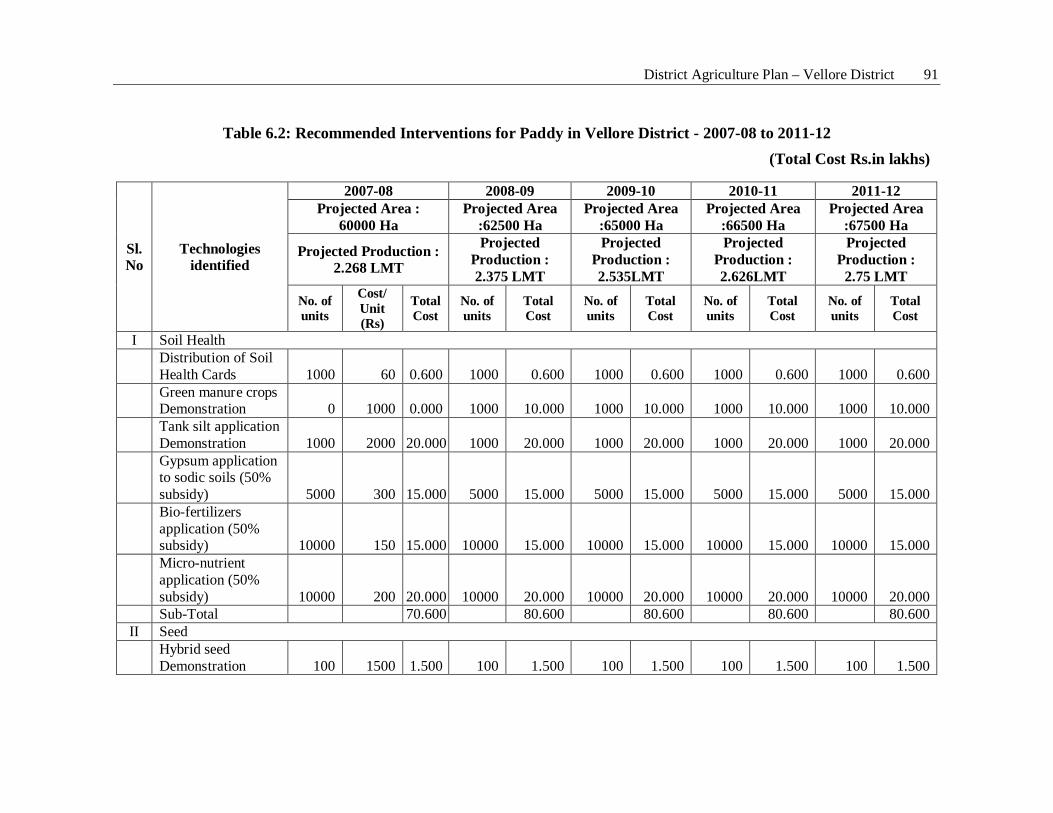
District Agriculture Plan – Vellore District 91
Table 6.2: Recommended Interventions for Paddy in Vellore District - 2007-08 to 2011-12
(Total Cost Rs.in lakhs)
Sl. No
Technologies identified
2007-08 2008-09 2009-10 2010-11 2011-12 Projected Area :
60000 Ha Projected Area
:62500 Ha Projected Area
:65000 Ha Projected Area
:66500 Ha Projected Area
:67500 Ha
Projected Production : 2.268 LMT
Projected Production : 2.375 LMT
Projected Production : 2.535LMT
Projected Production : 2.626LMT
Projected Production :
2.75 LMT No. of units
Cost/ Unit (Rs)
Total Cost
No. of units
Total Cost
No. of units
Total Cost
No. of units
Total Cost
No. of units
Total Cost
I Soil Health
Distribution of Soil Health Cards 1000 60 0.600 1000 0.600 1000 0.600 1000 0.600 1000 0.600
Green manure crops Demonstration 0 1000 0.000 1000 10.000 1000 10.000 1000 10.000 1000 10.000
Tank silt application Demonstration 1000 2000 20.000 1000 20.000 1000 20.000 1000 20.000 1000 20.000
Gypsum application to sodic soils (50% subsidy) 5000 300 15.000 5000 15.000 5000 15.000 5000 15.000 5000 15.000
Bio-fertilizers application (50% subsidy) 10000 150 15.000 10000 15.000 10000 15.000 10000 15.000 10000 15.000
Micro-nutrient application (50% subsidy) 10000 200 20.000 10000 20.000 10000 20.000 10000 20.000 10000 20.000
Sub-Total 70.600 80.600 80.600 80.600 80.600 II Seed
Hybrid seed Demonstration 100 1500 1.500 100 1.500 100 1.500 100 1.500 100 1.500
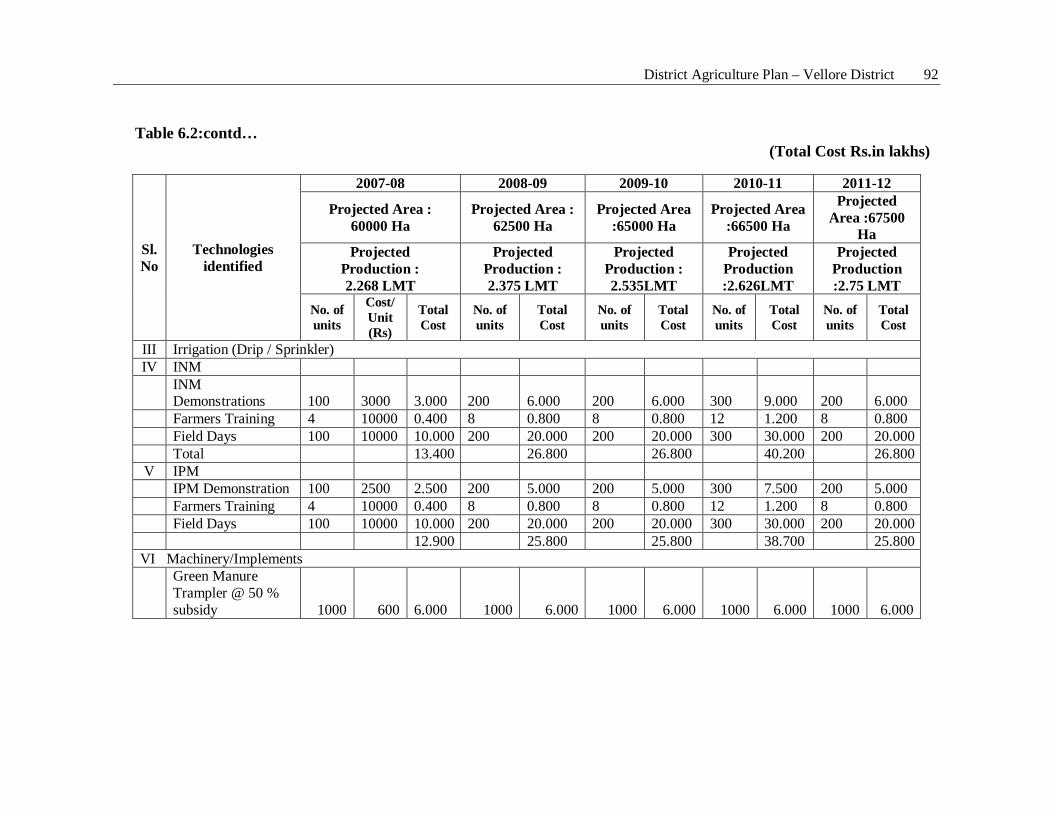
District Agriculture Plan – Vellore District 92
Table 6.2:contd… (Total Cost Rs.in lakhs)
Sl. No
Technologies identified
2007-08 2008-09 2009-10 2010-11 2011-12
Projected Area : 60000 Ha
Projected Area : 62500 Ha
Projected Area :65000 Ha
Projected Area :66500 Ha
Projected Area :67500
Ha Projected
Production : 2.268 LMT
Projected Production : 2.375 LMT
Projected Production : 2.535LMT
Projected Production :2.626LMT
Projected Production :2.75 LMT
No. of units
Cost/ Unit (Rs)
Total Cost
No. of units
Total Cost
No. of units
Total Cost
No. of units
Total Cost
No. of units
Total Cost
III Irrigation (Drip / Sprinkler) IV INM
INM Demonstrations 100 3000 3.000 200 6.000 200 6.000 300 9.000 200 6.000
Farmers Training 4 10000 0.400 8 0.800 8 0.800 12 1.200 8 0.800 Field Days 100 10000 10.000 200 20.000 200 20.000 300 30.000 200 20.000 Total 13.400 26.800 26.800 40.200 26.800
V IPM IPM Demonstration 100 2500 2.500 200 5.000 200 5.000 300 7.500 200 5.000 Farmers Training 4 10000 0.400 8 0.800 8 0.800 12 1.200 8 0.800 Field Days 100 10000 10.000 200 20.000 200 20.000 300 30.000 200 20.000 12.900 25.800 25.800 38.700 25.800
VI Machinery/Implements
Green Manure Trampler @ 50 % subsidy 1000 600 6.000 1000 6.000 1000 6.000 1000 6.000 1000 6.000
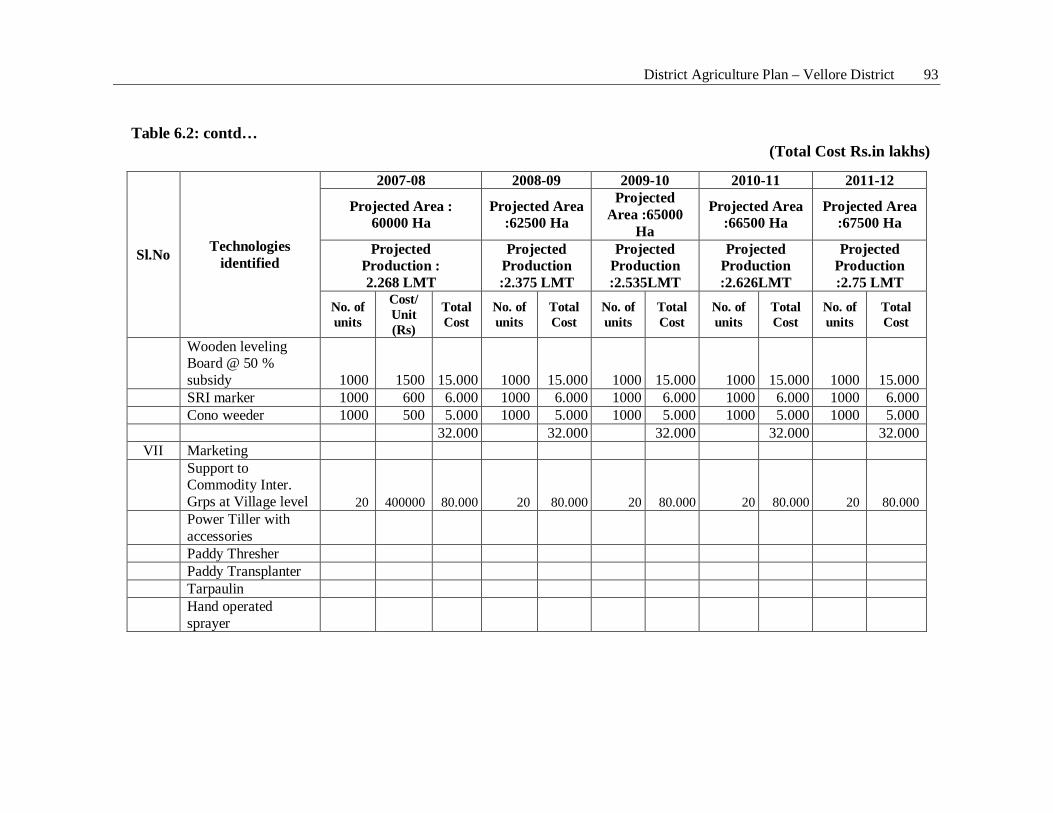
District Agriculture Plan – Vellore District 93
Table 6.2: contd… (Total Cost Rs.in lakhs)
Sl.No Technologies identified
2007-08 2008-09 2009-10 2010-11 2011-12
Projected Area : 60000 Ha
Projected Area :62500 Ha
Projected Area :65000
Ha
Projected Area :66500 Ha
Projected Area :67500 Ha
Projected Production : 2.268 LMT
Projected Production :2.375 LMT
Projected Production :2.535LMT
Projected Production :2.626LMT
Projected Production :2.75 LMT
No. of units
Cost/ Unit (Rs)
Total Cost
No. of units
Total Cost
No. of units
Total Cost
No. of units
Total Cost
No. of units
Total Cost
Wooden leveling Board @ 50 % subsidy 1000 1500 15.000 1000 15.000 1000 15.000 1000 15.000 1000 15.000
SRI marker 1000 600 6.000 1000 6.000 1000 6.000 1000 6.000 1000 6.000 Cono weeder 1000 500 5.000 1000 5.000 1000 5.000 1000 5.000 1000 5.000 32.000 32.000 32.000 32.000 32.000
VII Marketing
Support to Commodity Inter. Grps at Village level 20 400000 80.000 20 80.000 20 80.000 20 80.000 20 80.000
Power Tiller with accessories
Paddy Thresher Paddy Transplanter Tarpaulin
Hand operated sprayer
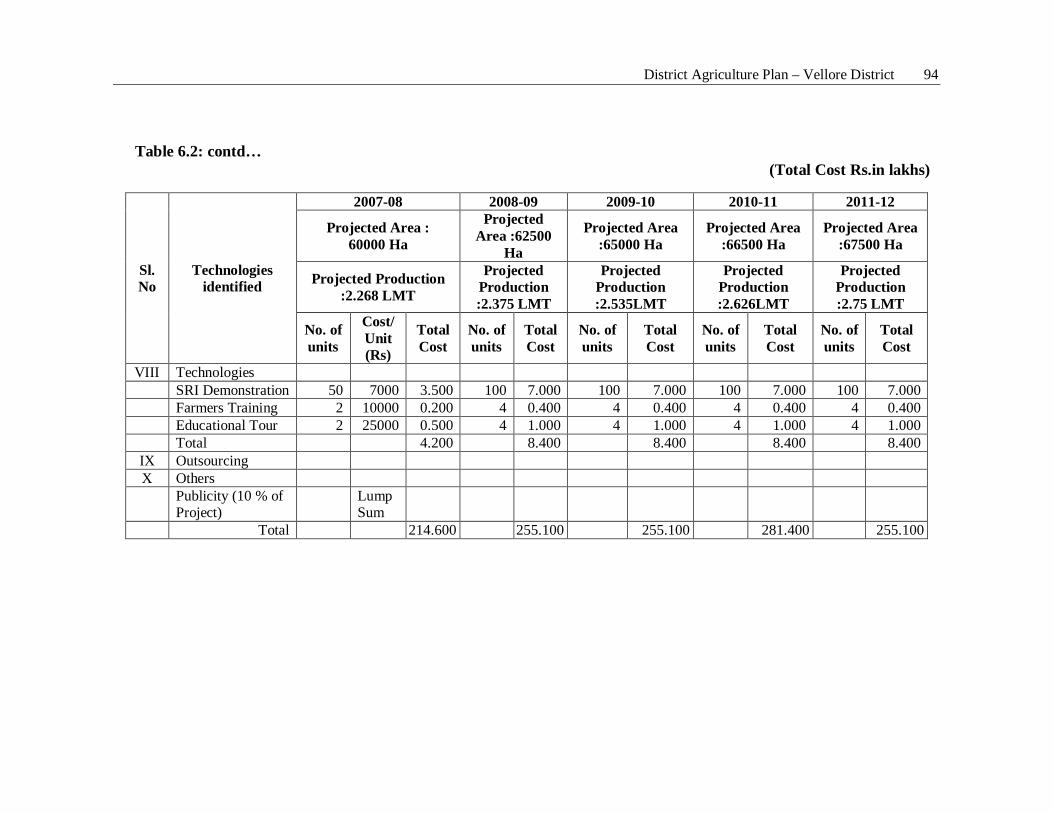
District Agriculture Plan – Vellore District 94
Table 6.2: contd… (Total Cost Rs.in lakhs)
Sl. No
Technologies identified
2007-08 2008-09 2009-10 2010-11 2011-12
Projected Area : 60000 Ha
Projected Area :62500
Ha
Projected Area :65000 Ha
Projected Area :66500 Ha
Projected Area :67500 Ha
Projected Production :2.268 LMT
Projected Production :2.375 LMT
Projected Production :2.535LMT
Projected Production :2.626LMT
Projected Production :2.75 LMT
No. of units
Cost/ Unit (Rs)
Total Cost
No. of units
Total Cost
No. of units
Total Cost
No. of units
Total Cost
No. of units
Total Cost
VIII Technologies SRI Demonstration 50 7000 3.500 100 7.000 100 7.000 100 7.000 100 7.000 Farmers Training 2 10000 0.200 4 0.400 4 0.400 4 0.400 4 0.400 Educational Tour 2 25000 0.500 4 1.000 4 1.000 4 1.000 4 1.000 Total 4.200 8.400 8.400 8.400 8.400
IX Outsourcing X Others
Publicity (10 % of Project)
Lump Sum
Total 214.600 255.100 255.100 281.400 255.100
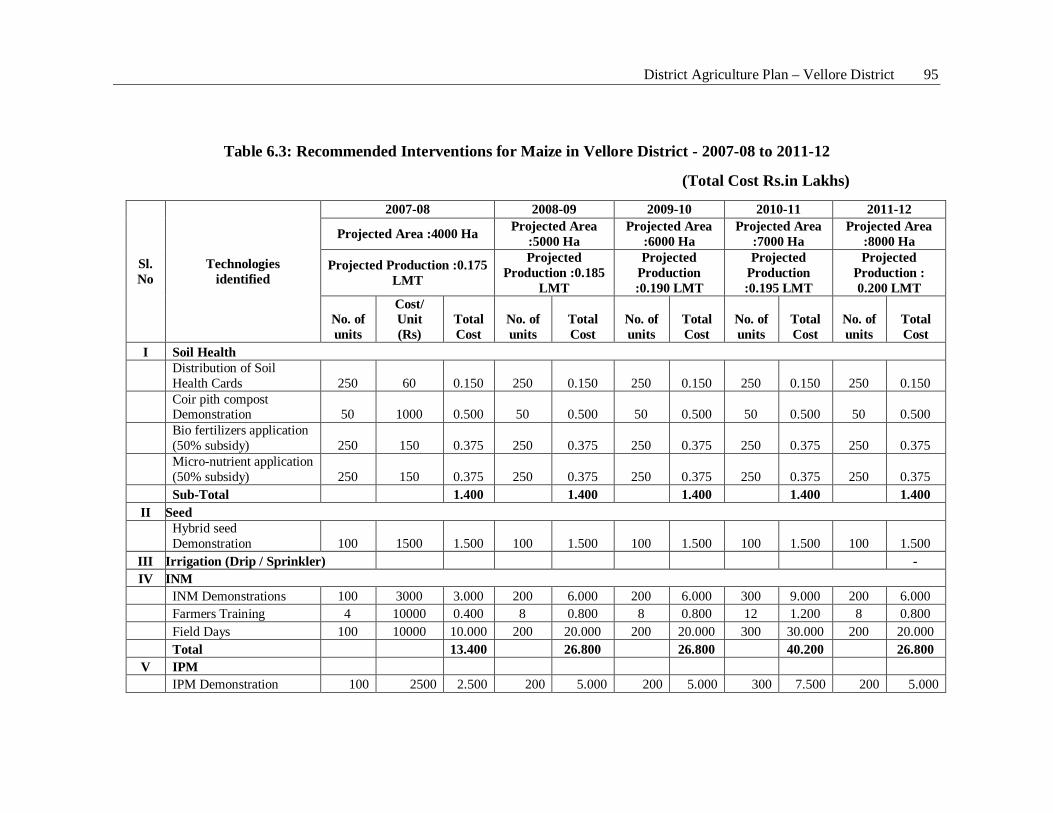
District Agriculture Plan – Vellore District 95
Table 6.3: Recommended Interventions for Maize in Vellore District - 2007-08 to 2011-12
(Total Cost Rs.in Lakhs)
Sl. No
Technologies identified
2007-08 2008-09 2009-10 2010-11 2011-12
Projected Area :4000 Ha Projected Area :5000 Ha
Projected Area :6000 Ha
Projected Area :7000 Ha
Projected Area :8000 Ha
Projected Production :0.175 LMT
Projected Production :0.185
LMT
Projected Production :0.190 LMT
Projected Production :0.195 LMT
Projected Production : 0.200 LMT
No. of units
Cost/ Unit (Rs)
Total Cost
No. of units
Total Cost
No. of units
Total Cost
No. of units
Total Cost
No. of units
Total Cost
I Soil Health
Distribution of Soil Health Cards 250 60 0.150 250 0.150 250 0.150 250 0.150 250 0.150
Coir pith compost Demonstration 50 1000 0.500 50 0.500 50 0.500 50 0.500 50 0.500
Bio fertilizers application (50% subsidy) 250 150 0.375 250 0.375 250 0.375 250 0.375 250 0.375
Micro-nutrient application (50% subsidy) 250 150 0.375 250 0.375 250 0.375 250 0.375 250 0.375
Sub-Total 1.400 1.400 1.400 1.400 1.400 II Seed
Hybrid seed Demonstration 100 1500 1.500 100 1.500 100 1.500 100 1.500 100 1.500
III Irrigation (Drip / Sprinkler) - IV INM
INM Demonstrations 100 3000 3.000 200 6.000 200 6.000 300 9.000 200 6.000 Farmers Training 4 10000 0.400 8 0.800 8 0.800 12 1.200 8 0.800 Field Days 100 10000 10.000 200 20.000 200 20.000 300 30.000 200 20.000 Total 13.400 26.800 26.800 40.200 26.800
V IPM IPM Demonstration 100 2500 2.500 200 5.000 200 5.000 300 7.500 200 5.000
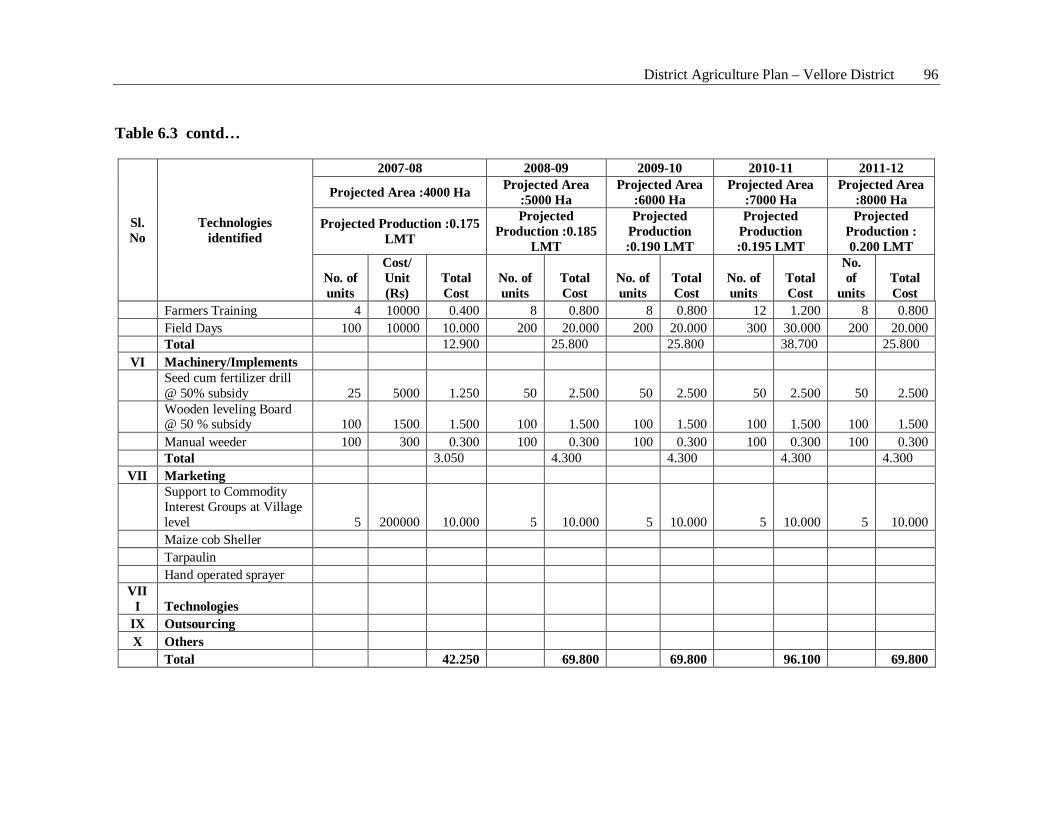
District Agriculture Plan – Vellore District 96
Table 6.3 contd…
Sl. No
Technologies identified
2007-08 2008-09 2009-10 2010-11 2011-12
Projected Area :4000 Ha Projected Area :5000 Ha
Projected Area :6000 Ha
Projected Area :7000 Ha
Projected Area :8000 Ha
Projected Production :0.175 LMT
Projected Production :0.185
LMT
Projected Production :0.190 LMT
Projected Production :0.195 LMT
Projected Production : 0.200 LMT
No. of units
Cost/ Unit (Rs)
Total Cost
No. of units
Total Cost
No. of units
Total Cost
No. of units
Total Cost
No. of
units Total Cost
Farmers Training 4 10000 0.400 8 0.800 8 0.800 12 1.200 8 0.800 Field Days 100 10000 10.000 200 20.000 200 20.000 300 30.000 200 20.000 Total 12.900 25.800 25.800 38.700 25.800
VI Machinery/Implements
Seed cum fertilizer drill @ 50% subsidy 25 5000 1.250 50 2.500 50 2.500 50 2.500 50 2.500
Wooden leveling Board @ 50 % subsidy 100 1500 1.500 100 1.500 100 1.500 100 1.500 100 1.500
Manual weeder 100 300 0.300 100 0.300 100 0.300 100 0.300 100 0.300 Total 3.050 4.300 4.300 4.300 4.300
VII Marketing
Support to Commodity Interest Groups at Village level 5 200000 10.000 5 10.000 5 10.000 5 10.000 5 10.000
Maize cob Sheller Tarpaulin Hand operated sprayer
VIII Technologies
IX Outsourcing X Others Total 42.250 69.800 69.800 96.100 69.800
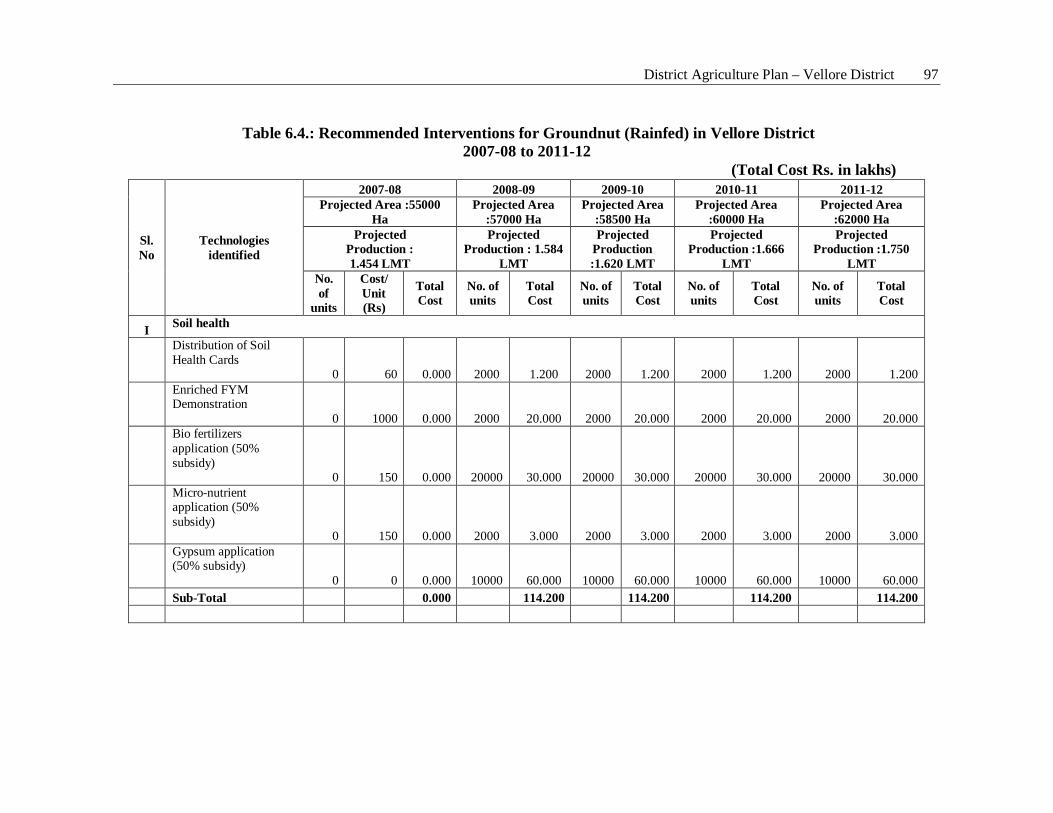
District Agriculture Plan – Vellore District 97
Table 6.4.: Recommended Interventions for Groundnut (Rainfed) in Vellore District 2007-08 to 2011-12
(Total Cost Rs. in lakhs)
Sl. No
Technologies identified
2007-08 2008-09 2009-10 2010-11 2011-12 Projected Area :55000
Ha Projected Area
:57000 Ha Projected Area
:58500 Ha Projected Area
:60000 Ha Projected Area
:62000 Ha Projected
Production : 1.454 LMT
Projected Production : 1.584
LMT
Projected Production :1.620 LMT
Projected Production :1.666
LMT
Projected Production :1.750
LMT No. of
units
Cost/ Unit (Rs)
Total Cost
No. of units
Total Cost
No. of units
Total Cost
No. of units
Total Cost
No. of units
Total Cost
I Soil health
Distribution of Soil Health Cards 0 60 0.000 2000 1.200 2000 1.200 2000 1.200 2000 1.200
Enriched FYM Demonstration 0 1000 0.000 2000 20.000 2000 20.000 2000 20.000 2000 20.000
Bio fertilizers application (50% subsidy) 0 150 0.000 20000 30.000 20000 30.000 20000 30.000 20000 30.000
Micro-nutrient application (50% subsidy) 0 150 0.000 2000 3.000 2000 3.000 2000 3.000 2000 3.000
Gypsum application (50% subsidy) 0 0 0.000 10000 60.000 10000 60.000 10000 60.000 10000 60.000
Sub-Total 0.000 114.200 114.200 114.200 114.200
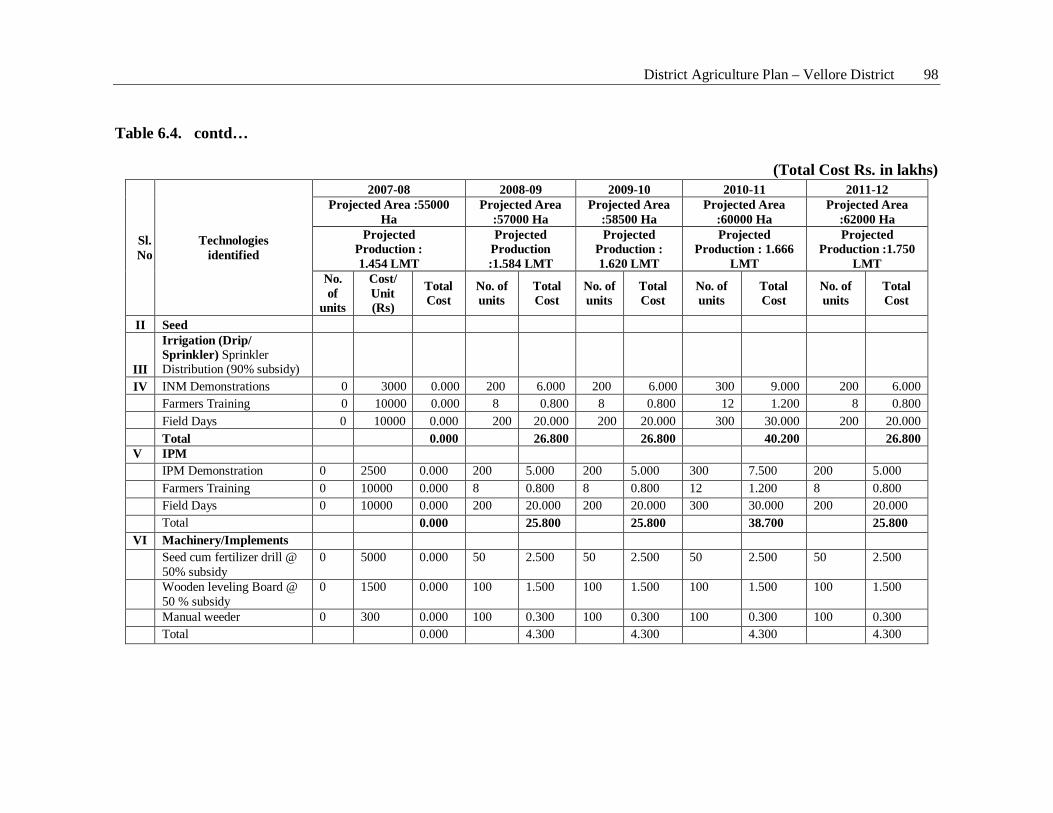
District Agriculture Plan – Vellore District 98
Table 6.4. contd…
(Total Cost Rs. in lakhs)
Sl. No
Technologies identified
2007-08 2008-09 2009-10 2010-11 2011-12 Projected Area :55000
Ha Projected Area
:57000 Ha Projected Area
:58500 Ha Projected Area
:60000 Ha Projected Area
:62000 Ha Projected
Production : 1.454 LMT
Projected Production :1.584 LMT
Projected Production : 1.620 LMT
Projected Production : 1.666
LMT
Projected Production :1.750
LMT No. of
units
Cost/ Unit (Rs)
Total Cost
No. of units
Total Cost
No. of units
Total Cost
No. of units
Total Cost
No. of units
Total Cost
II Seed
III
Irrigation (Drip/ Sprinkler) Sprinkler Distribution (90% subsidy)
IV INM Demonstrations 0 3000 0.000 200 6.000 200 6.000 300 9.000 200 6.000 Farmers Training 0 10000 0.000 8 0.800 8 0.800 12 1.200 8 0.800 Field Days 0 10000 0.000 200 20.000 200 20.000 300 30.000 200 20.000 Total 0.000 26.800 26.800 40.200 26.800
V IPM IPM Demonstration 0 2500 0.000 200 5.000 200 5.000 300 7.500 200 5.000 Farmers Training 0 10000 0.000 8 0.800 8 0.800 12 1.200 8 0.800 Field Days 0 10000 0.000 200 20.000 200 20.000 300 30.000 200 20.000 Total 0.000 25.800 25.800 38.700 25.800 VI Machinery/Implements Seed cum fertilizer drill @
50% subsidy 0 5000 0.000 50 2.500 50 2.500 50 2.500 50 2.500
Wooden leveling Board @ 50 % subsidy
0 1500 0.000 100 1.500 100 1.500 100 1.500 100 1.500
Manual weeder 0 300 0.000 100 0.300 100 0.300 100 0.300 100 0.300 Total 0.000 4.300 4.300 4.300 4.300
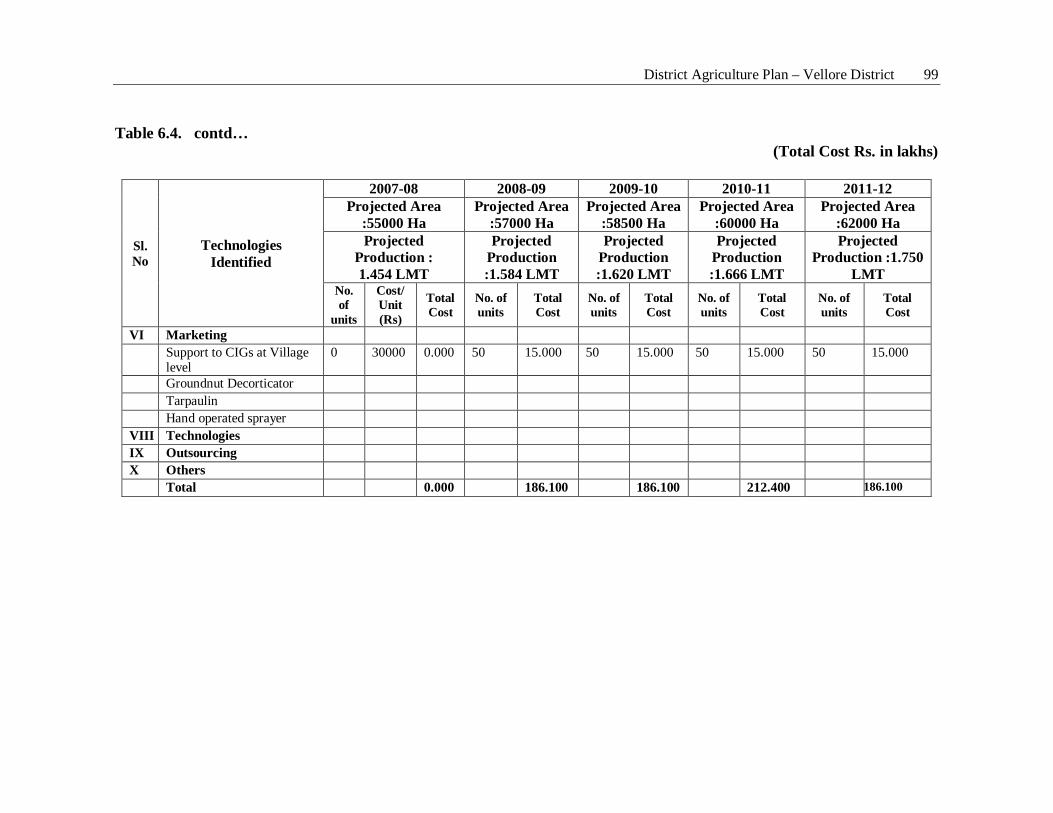
District Agriculture Plan – Vellore District 99
Table 6.4. contd… (Total Cost Rs. in lakhs)
Sl. No
Technologies Identified
2007-08 2008-09 2009-10 2010-11 2011-12 Projected Area
:55000 Ha Projected Area
:57000 Ha Projected Area
:58500 Ha Projected Area
:60000 Ha Projected Area
:62000 Ha Projected
Production : 1.454 LMT
Projected Production :1.584 LMT
Projected Production :1.620 LMT
Projected Production :1.666 LMT
Projected Production :1.750
LMT No. of
units
Cost/ Unit (Rs)
Total Cost
No. of units
Total Cost
No. of units
Total Cost
No. of units
Total Cost
No. of units
Total Cost
VI Marketing Support to CIGs at Village
level 0 30000 0.000 50 15.000 50 15.000 50 15.000 50 15.000
Groundnut Decorticator Tarpaulin Hand operated sprayer VIII Technologies IX Outsourcing X Others Total 0.000 186.100 186.100 212.400 186.100
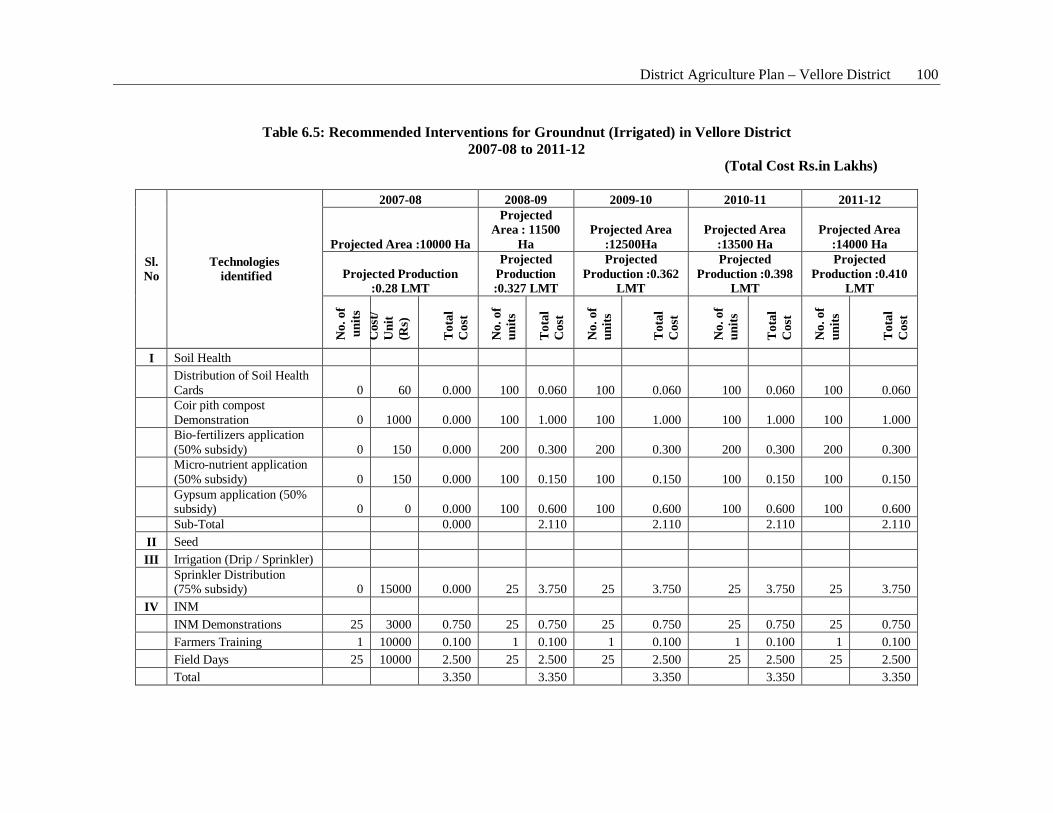
District Agriculture Plan – Vellore District 100
Table 6.5: Recommended Interventions for Groundnut (Irrigated) in Vellore District 2007-08 to 2011-12
(Total Cost Rs.in Lakhs)
Sl. No
Technologies identified
2007-08 2008-09 2009-10 2010-11 2011-12
Projected Area :10000 Ha
Projected Area : 11500
Ha Projected Area
:12500Ha Projected Area
:13500 Ha Projected Area
:14000 Ha
Projected Production :0.28 LMT
Projected Production :0.327 LMT
Projected Production :0.362
LMT
Projected Production :0.398
LMT
Projected Production :0.410
LMT
No.
of
uni
ts
Cos
t/ U
nit
(Rs)
Tot
al
Cos
t
No.
of
units
Tot
al
Cos
t
No.
of
units
Tot
al
Cos
t
No.
of
units
Tot
al
Cos
t
No.
of
units
Tot
al
Cos
t
I Soil Health
Distribution of Soil Health Cards 0 60 0.000 100 0.060 100 0.060 100 0.060 100 0.060
Coir pith compost Demonstration 0 1000 0.000 100 1.000 100 1.000 100 1.000 100 1.000
Bio-fertilizers application (50% subsidy) 0 150 0.000 200 0.300 200 0.300 200 0.300 200 0.300
Micro-nutrient application (50% subsidy) 0 150 0.000 100 0.150 100 0.150 100 0.150 100 0.150
Gypsum application (50% subsidy) 0 0 0.000 100 0.600 100 0.600 100 0.600 100 0.600
Sub-Total 0.000 2.110 2.110 2.110 2.110 II Seed III Irrigation (Drip / Sprinkler)
Sprinkler Distribution (75% subsidy) 0 15000 0.000 25 3.750 25 3.750 25 3.750 25 3.750
IV INM INM Demonstrations 25 3000 0.750 25 0.750 25 0.750 25 0.750 25 0.750 Farmers Training 1 10000 0.100 1 0.100 1 0.100 1 0.100 1 0.100 Field Days 25 10000 2.500 25 2.500 25 2.500 25 2.500 25 2.500 Total 3.350 3.350 3.350 3.350 3.350
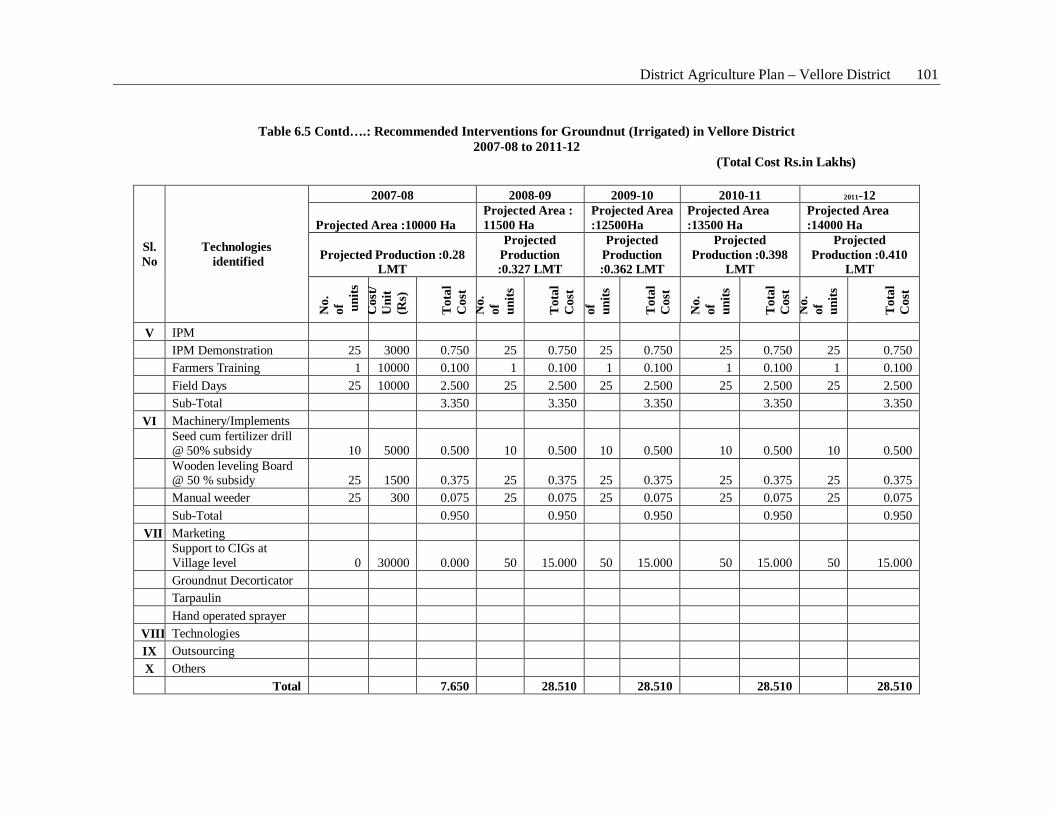
District Agriculture Plan – Vellore District 101
Table 6.5 Contd….: Recommended Interventions for Groundnut (Irrigated) in Vellore District 2007-08 to 2011-12
(Total Cost Rs.in Lakhs)
Sl. No
Technologies identified
2007-08 2008-09 2009-10 2010-11 2011-12
Projected Area :10000 Ha Projected Area : 11500 Ha
Projected Area :12500Ha
Projected Area :13500 Ha
Projected Area :14000 Ha
Projected Production :0.28 LMT
Projected Production :0.327 LMT
Projected Production :0.362 LMT
Projected Production :0.398
LMT
Projected Production :0.410
LMT
No.
of
u
nits
C
ost/
Uni
t (R
s)
Tot
al
Cos
t N
o.
of
units
Tot
al
Cos
t of
un
its
Tot
al
Cos
t
No.
of
un
its
Tot
al
Cos
t N
o.
of
units
Tot
al
Cos
t
V IPM IPM Demonstration 25 3000 0.750 25 0.750 25 0.750 25 0.750 25 0.750 Farmers Training 1 10000 0.100 1 0.100 1 0.100 1 0.100 1 0.100 Field Days 25 10000 2.500 25 2.500 25 2.500 25 2.500 25 2.500 Sub-Total 3.350 3.350 3.350 3.350 3.350
VI Machinery/Implements
Seed cum fertilizer drill @ 50% subsidy 10 5000 0.500 10 0.500 10 0.500 10 0.500 10 0.500
Wooden leveling Board @ 50 % subsidy 25 1500 0.375 25 0.375 25 0.375 25 0.375 25 0.375
Manual weeder 25 300 0.075 25 0.075 25 0.075 25 0.075 25 0.075 Sub-Total 0.950 0.950 0.950 0.950 0.950
VII Marketing
Support to CIGs at Village level 0 30000 0.000 50 15.000 50 15.000 50 15.000 50 15.000
Groundnut Decorticator Tarpaulin Hand operated sprayer
VIII Technologies IX Outsourcing X Others Total 7.650 28.510 28.510 28.510 28.510
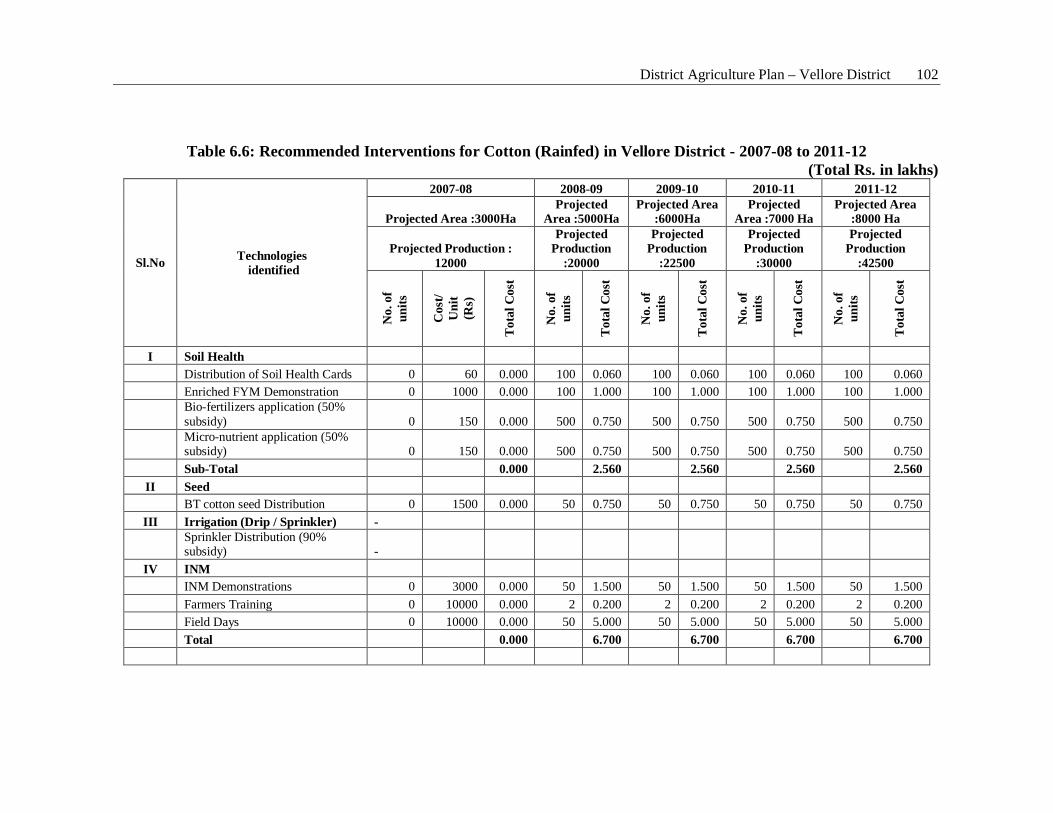
District Agriculture Plan – Vellore District 102
Table 6.6: Recommended Interventions for Cotton (Rainfed) in Vellore District - 2007-08 to 2011-12
(Total Rs. in lakhs)
Sl.No Technologies identified
2007-08 2008-09 2009-10 2010-11 2011-12
Projected Area :3000Ha Projected
Area :5000Ha Projected Area
:6000Ha Projected
Area :7000 Ha Projected Area
:8000 Ha
Projected Production : 12000
Projected Production
:20000
Projected Production
:22500
Projected Production
:30000
Projected Production
:42500
No.
of
units
Cos
t/ U
nit
(Rs)
Tot
al C
ost
No.
of
units
Tot
al C
ost
No.
of
units
Tot
al C
ost
No.
of
units
Tot
al C
ost
No.
of
units
Tot
al C
ost
I Soil Health Distribution of Soil Health Cards 0 60 0.000 100 0.060 100 0.060 100 0.060 100 0.060 Enriched FYM Demonstration 0 1000 0.000 100 1.000 100 1.000 100 1.000 100 1.000
Bio-fertilizers application (50% subsidy) 0 150 0.000 500 0.750 500 0.750 500 0.750 500 0.750
Micro-nutrient application (50% subsidy) 0 150 0.000 500 0.750 500 0.750 500 0.750 500 0.750
Sub-Total 0.000 2.560 2.560 2.560 2.560 II Seed BT cotton seed Distribution 0 1500 0.000 50 0.750 50 0.750 50 0.750 50 0.750
III Irrigation (Drip / Sprinkler) -
Sprinkler Distribution (90% subsidy) -
IV INM INM Demonstrations 0 3000 0.000 50 1.500 50 1.500 50 1.500 50 1.500 Farmers Training 0 10000 0.000 2 0.200 2 0.200 2 0.200 2 0.200 Field Days 0 10000 0.000 50 5.000 50 5.000 50 5.000 50 5.000 Total 0.000 6.700 6.700 6.700 6.700
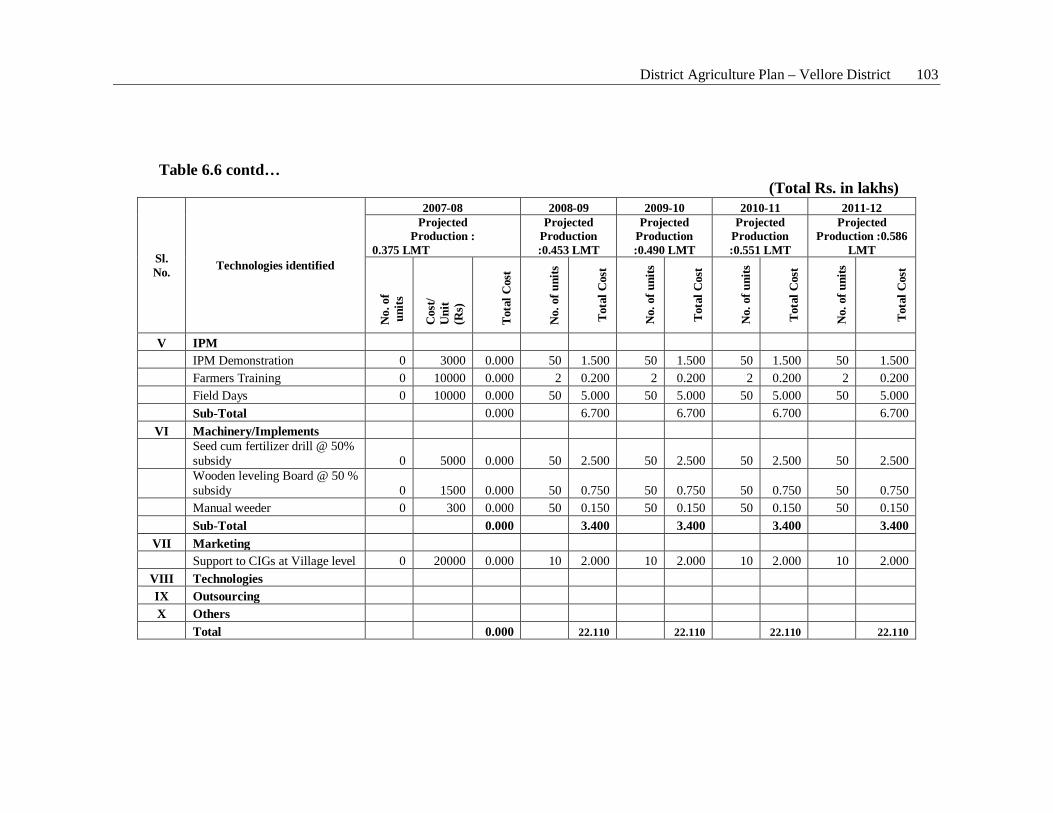
District Agriculture Plan – Vellore District 103
Table 6.6 contd…
(Total Rs. in lakhs)
Sl. No. Technologies identified
2007-08 2008-09 2009-10 2010-11 2011-12 Projected
Production : 0.375 LMT
Projected Production :0.453 LMT
Projected Production :0.490 LMT
Projected Production :0.551 LMT
Projected Production :0.586
LMT
No.
of
uni
ts
Cos
t/ U
nit
(Rs)
Tota
l Cos
t
No.
of u
nits
Tota
l Cos
t
No.
of u
nits
Tota
l Cos
t
No.
of u
nits
Tota
l Cos
t
No.
of u
nits
Tota
l Cos
t
V IPM IPM Demonstration 0 3000 0.000 50 1.500 50 1.500 50 1.500 50 1.500 Farmers Training 0 10000 0.000 2 0.200 2 0.200 2 0.200 2 0.200 Field Days 0 10000 0.000 50 5.000 50 5.000 50 5.000 50 5.000 Sub-Total 0.000 6.700 6.700 6.700 6.700
VI Machinery/Implements
Seed cum fertilizer drill @ 50% subsidy 0 5000 0.000 50 2.500 50 2.500 50 2.500 50 2.500
Wooden leveling Board @ 50 % subsidy 0 1500 0.000 50 0.750 50 0.750 50 0.750 50 0.750
Manual weeder 0 300 0.000 50 0.150 50 0.150 50 0.150 50 0.150 Sub-Total 0.000 3.400 3.400 3.400 3.400
VII Marketing Support to CIGs at Village level 0 20000 0.000 10 2.000 10 2.000 10 2.000 10 2.000
VIII Technologies IX Outsourcing X Others Total 0.000 22.110 22.110 22.110 22.110
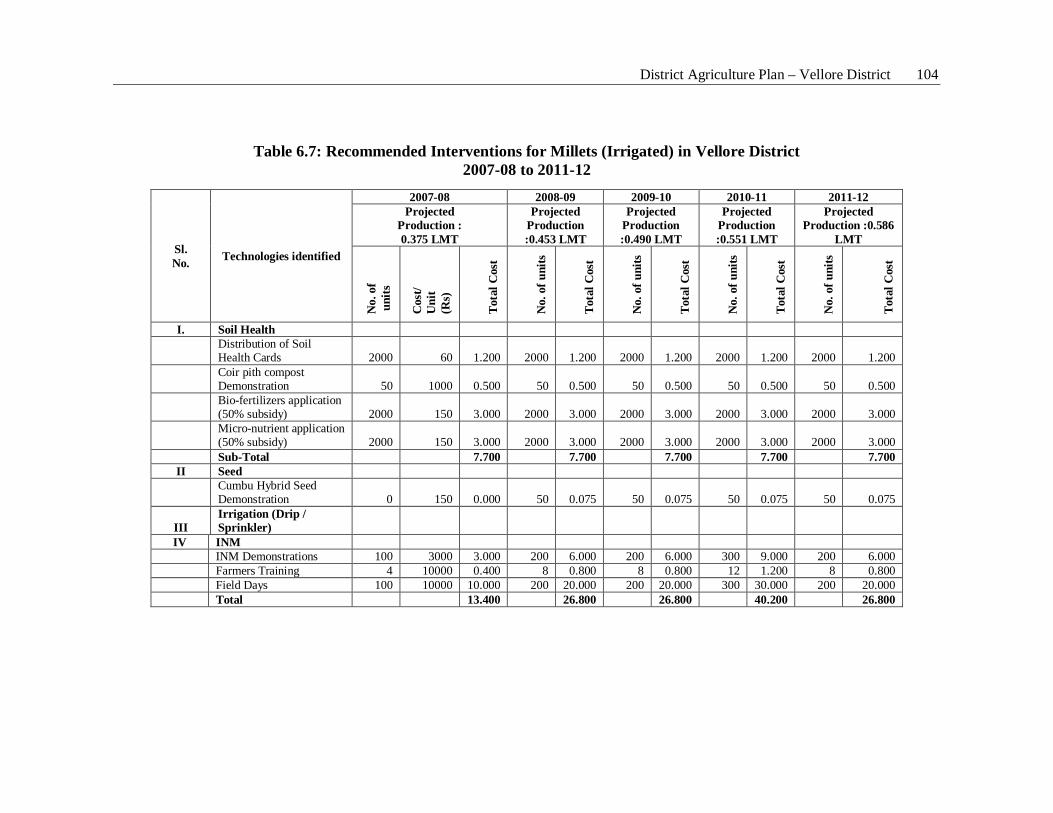
District Agriculture Plan – Vellore District 104
Table 6.7: Recommended Interventions for Millets (Irrigated) in Vellore District
2007-08 to 2011-12
Sl. No. Technologies identified
2007-08 2008-09 2009-10 2010-11 2011-12 Projected
Production : 0.375 LMT
Projected Production :0.453 LMT
Projected Production :0.490 LMT
Projected Production :0.551 LMT
Projected Production :0.586
LMT
No.
of
uni
ts
Cos
t/ U
nit
(Rs)
Tota
l Cos
t
No.
of u
nits
Tota
l Cos
t
No.
of u
nits
Tota
l Cos
t
No.
of u
nits
Tota
l Cos
t
No.
of u
nits
Tota
l Cos
t
I. Soil Health
Distribution of Soil Health Cards 2000 60 1.200 2000 1.200 2000 1.200 2000 1.200 2000 1.200
Coir pith compost Demonstration 50 1000 0.500 50 0.500 50 0.500 50 0.500 50 0.500
Bio-fertilizers application (50% subsidy) 2000 150 3.000 2000 3.000 2000 3.000 2000 3.000 2000 3.000
Micro-nutrient application (50% subsidy) 2000 150 3.000 2000 3.000 2000 3.000 2000 3.000 2000 3.000
Sub-Total 7.700 7.700 7.700 7.700 7.700 II Seed
Cumbu Hybrid Seed Demonstration 0 150 0.000 50 0.075 50 0.075 50 0.075 50 0.075
III Irrigation (Drip / Sprinkler)
IV INM INM Demonstrations 100 3000 3.000 200 6.000 200 6.000 300 9.000 200 6.000 Farmers Training 4 10000 0.400 8 0.800 8 0.800 12 1.200 8 0.800 Field Days 100 10000 10.000 200 20.000 200 20.000 300 30.000 200 20.000 Total 13.400 26.800 26.800 40.200 26.800
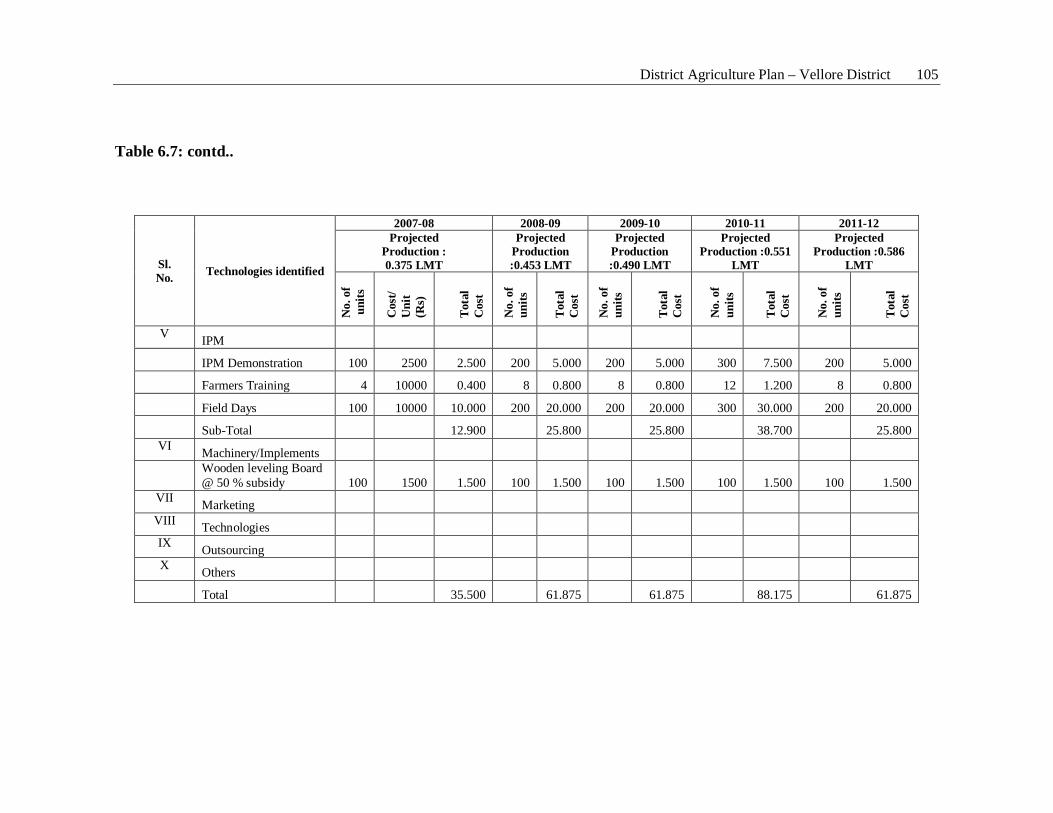
District Agriculture Plan – Vellore District 105
Table 6.7: contd..
Sl. No. Technologies identified
2007-08 2008-09 2009-10 2010-11 2011-12 Projected
Production : 0.375 LMT
Projected Production :0.453 LMT
Projected Production :0.490 LMT
Projected Production :0.551
LMT
Projected Production :0.586
LMT
No.
of
uni
ts
Cos
t/ U
nit
(Rs)
Tota
l C
ost
No.
of
units
Tota
l C
ost
No.
of
units
Tota
l C
ost
No.
of
units
Tota
l C
ost
No.
of
units
Tota
l C
ost
V IPM IPM Demonstration 100 2500 2.500 200 5.000 200 5.000 300 7.500 200 5.000 Farmers Training 4 10000 0.400 8 0.800 8 0.800 12 1.200 8 0.800 Field Days 100 10000 10.000 200 20.000 200 20.000 300 30.000 200 20.000 Sub-Total 12.900 25.800 25.800 38.700 25.800
VI Machinery/Implements
Wooden leveling Board @ 50 % subsidy 100 1500 1.500 100 1.500 100 1.500 100 1.500 100 1.500
VII Marketing VIII Technologies IX Outsourcing X Others Total 35.500 61.875 61.875 88.175 61.875
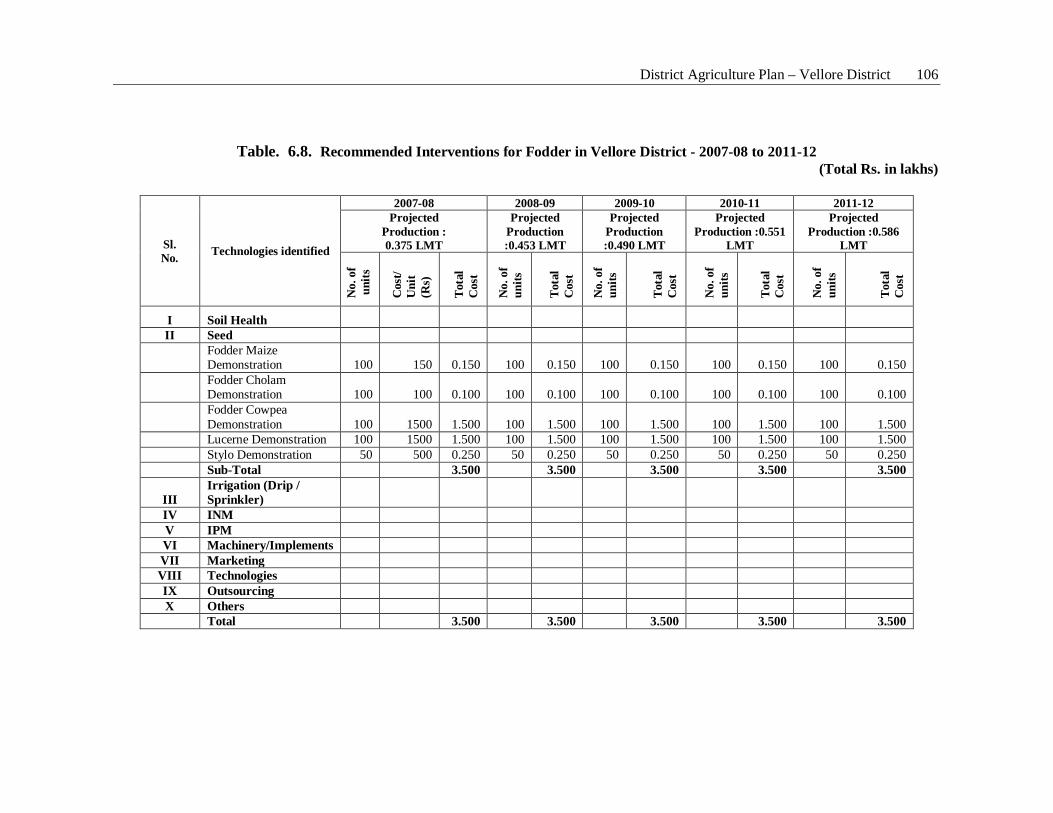
District Agriculture Plan – Vellore District 106
Table. 6.8. Recommended Interventions for Fodder in Vellore District - 2007-08 to 2011-12
(Total Rs. in lakhs)
Sl. No. Technologies identified
2007-08 2008-09 2009-10 2010-11 2011-12 Projected
Production : 0.375 LMT
Projected Production :0.453 LMT
Projected Production :0.490 LMT
Projected Production :0.551
LMT
Projected Production :0.586
LMT
No.
of
uni
ts
Cos
t/ U
nit
(Rs)
Tota
l C
ost
No.
of
units
Tota
l C
ost
No.
of
units
Tota
l C
ost
No.
of
units
Tota
l C
ost
No.
of
units
Tota
l C
ost
I Soil Health II Seed
Fodder Maize Demonstration 100 150 0.150 100 0.150 100 0.150 100 0.150 100 0.150
Fodder Cholam Demonstration 100 100 0.100 100 0.100 100 0.100 100 0.100 100 0.100
Fodder Cowpea Demonstration 100 1500 1.500 100 1.500 100 1.500 100 1.500 100 1.500
Lucerne Demonstration 100 1500 1.500 100 1.500 100 1.500 100 1.500 100 1.500 Stylo Demonstration 50 500 0.250 50 0.250 50 0.250 50 0.250 50 0.250 Sub-Total 3.500 3.500 3.500 3.500 3.500
III Irrigation (Drip / Sprinkler)
IV INM V IPM VI Machinery/Implements VII Marketing VIII Technologies IX Outsourcing X Others Total 3.500 3.500 3.500 3.500 3.500
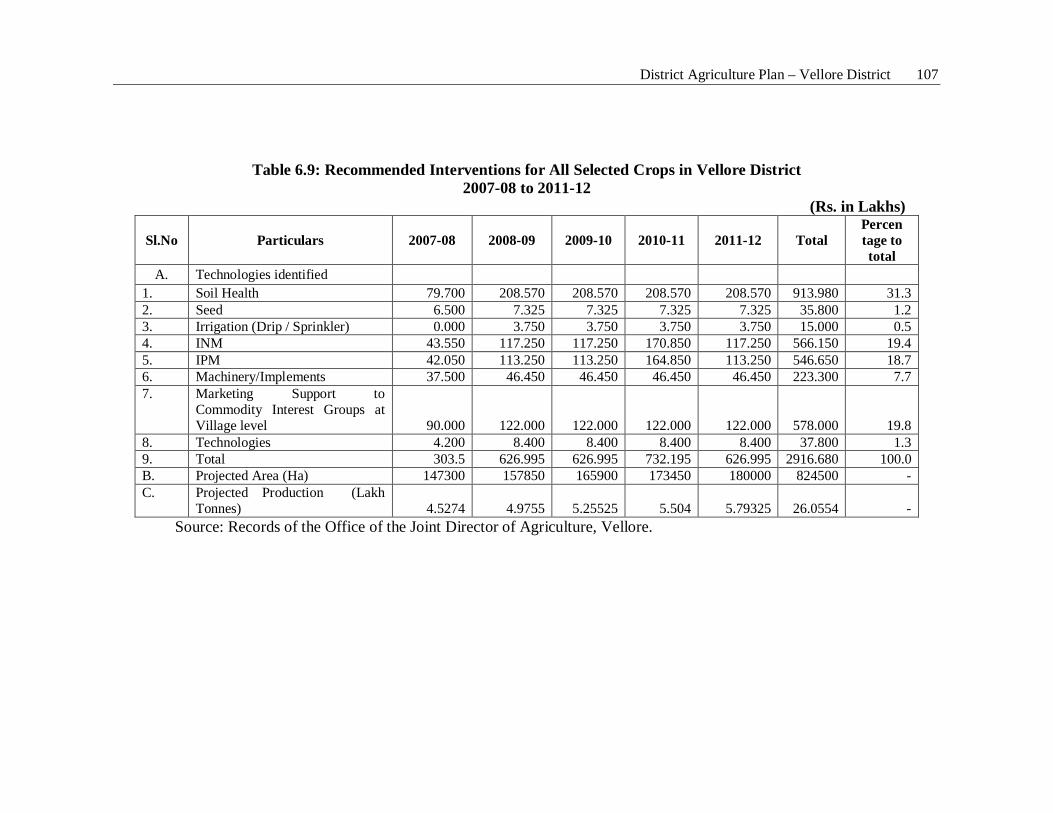
District Agriculture Plan – Vellore District 107
Table 6.9: Recommended Interventions for All Selected Crops in Vellore District 2007-08 to 2011-12
(Rs. in Lakhs)
Sl.No Particulars 2007-08 2008-09 2009-10 2010-11 2011-12 Total Percen tage to total
A. Technologies identified 1. Soil Health 79.700 208.570 208.570 208.570 208.570 913.980 31.3 2. Seed 6.500 7.325 7.325 7.325 7.325 35.800 1.2 3. Irrigation (Drip / Sprinkler) 0.000 3.750 3.750 3.750 3.750 15.000 0.5 4. INM 43.550 117.250 117.250 170.850 117.250 566.150 19.4 5. IPM 42.050 113.250 113.250 164.850 113.250 546.650 18.7 6. Machinery/Implements 37.500 46.450 46.450 46.450 46.450 223.300 7.7 7. Marketing Support to
Commodity Interest Groups at Village level 90.000 122.000 122.000 122.000 122.000 578.000 19.8
8. Technologies 4.200 8.400 8.400 8.400 8.400 37.800 1.3 9. Total 303.5 626.995 626.995 732.195 626.995 2916.680 100.0 B. Projected Area (Ha) 147300 157850 165900 173450 180000 824500 - C. Projected Production (Lakh
Tonnes) 4.5274 4.9755 5.25525 5.504 5.79325 26.0554 - Source: Records of the Office of the Joint Director of Agriculture, Vellore.
District Agriculture Plan – Vellore District 108
6.1.2 Innovative Schemes
Background / Problem Focus
In Vellore District, Agriculture, Horticulture, Animal Husbandry and Sericulture
are the major enterprises practiced by the farming community. The major agricultural
crops grown here are paddy, sugarcane and groundnut. Due to monsoon failures, the
agricultural activities in terms of gross cropped area are reducing gradually, leading to
low income of the farmers. To combat this and to make the farm activities sustainable,
an innovative and integrated approach comprising of agriculture, horticulture, animal
husbandry and other allied departments is the need of the hour, which can improve the
income of the farmers.
In this connection, the potentiality of Vellore district could be explored and
exploited to benefit the farming community. Special projects could be designed to
optimally exploit the natural and human resources in order to generate more income and
employment. Towards this direction, a few income generating but small enterprises have
been proposed as discussed under:
The activities to be focussed are:
i) Formation of commodity interest groups. ii) Training on grading, post harvest technologies, value addition and market
intelligence. iii) Establishment of rural godown with drying yards. iv) Providing cold storage facility. v) Encouraging contract farming and
vi) Food park with basic infrastructure facilities
i) Goal and objectives
To generate additional income to farming community. To develop entrepreneurship among farmers. To generate employment opportunities and To impart value addition to agricultural products.
District Agriculture Plan – Vellore District 109
ii) Project Strategy
Formation of commodity groups
Training programme to create awareness about market intelligence among
farmers.
Encouraging maize as an alternate crop for paddy through contract farming.
Encouraging contract farming in maize and value addition (setting up of cattle
feed mixing unit)
Training programme and Exposure visit to farmers on grading and post harvest
technology.
Setting up of agro based industries with basic infrastructure facilities - Food park
(Groundnut candy making, desiccated coconut production, packed tender coconut
water production, coconut shell powder, spray dried coconut powder production)
Providing storage facilities in rural area.
iii) Project Components
Formation and strengthening of commodity based groups.
Training to farmers on market intelligence.
Facilitation to contact farming.
Setting up of Mini cattle feed mixing unit maintained by Commodity group.
Exposure visit on grading, post harvest technology and value addition.
Establishment of Food Park with basic infrastructure facility.
Establishment of rural godown with drying yards.
Providing cold storage facilities.
The details of special projects along with cost are furnished in Table 6.10
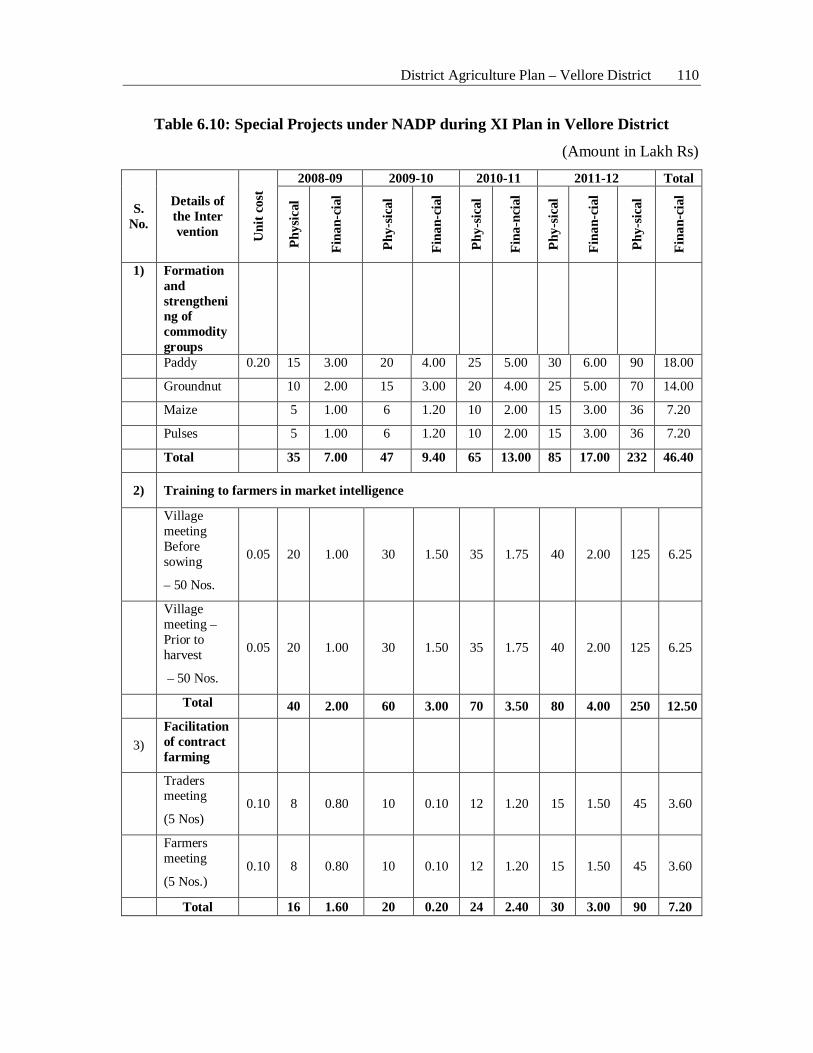
District Agriculture Plan – Vellore District 110
Table 6.10: Special Projects under NADP during XI Plan in Vellore District
(Amount in Lakh Rs)
S. No.
Details of the Inter vention U
nit c
ost
2008-09 2009-10 2010-11 2011-12 Total
Phys
ical
Fina
n-ci
al
Phy-
sica
l
Fina
n-ci
al
Phy-
sica
l
Fina
-nci
al
Phy-
sica
l
Fina
n-ci
al
Phy-
sica
l
Fina
n-ci
al
1) Formation and strengthening of commodity groups
Paddy 0.20 15 3.00 20 4.00 25 5.00 30 6.00 90 18.00
Groundnut 10 2.00 15 3.00 20 4.00 25 5.00 70 14.00
Maize 5 1.00 6 1.20 10 2.00 15 3.00 36 7.20
Pulses 5 1.00 6 1.20 10 2.00 15 3.00 36 7.20
Total 35 7.00 47 9.40 65 13.00 85 17.00 232 46.40
2) Training to farmers in market intelligence
Village meeting Before sowing
– 50 Nos.
0.05 20 1.00 30 1.50 35 1.75 40 2.00 125 6.25
Village meeting – Prior to harvest
– 50 Nos.
0.05 20 1.00 30 1.50 35 1.75 40 2.00 125 6.25
Total 40 2.00 60 3.00 70 3.50 80 4.00 250 12.50
3) Facilitation of contract farming
Traders meeting
(5 Nos) 0.10 8 0.80 10 0.10 12 1.20 15 1.50 45 3.60
Farmers meeting
(5 Nos.) 0.10 8 0.80 10 0.10 12 1.20 15 1.50 45 3.60
Total 16 1.60 20 0.20 24 2.40 30 3.00 90 7.20
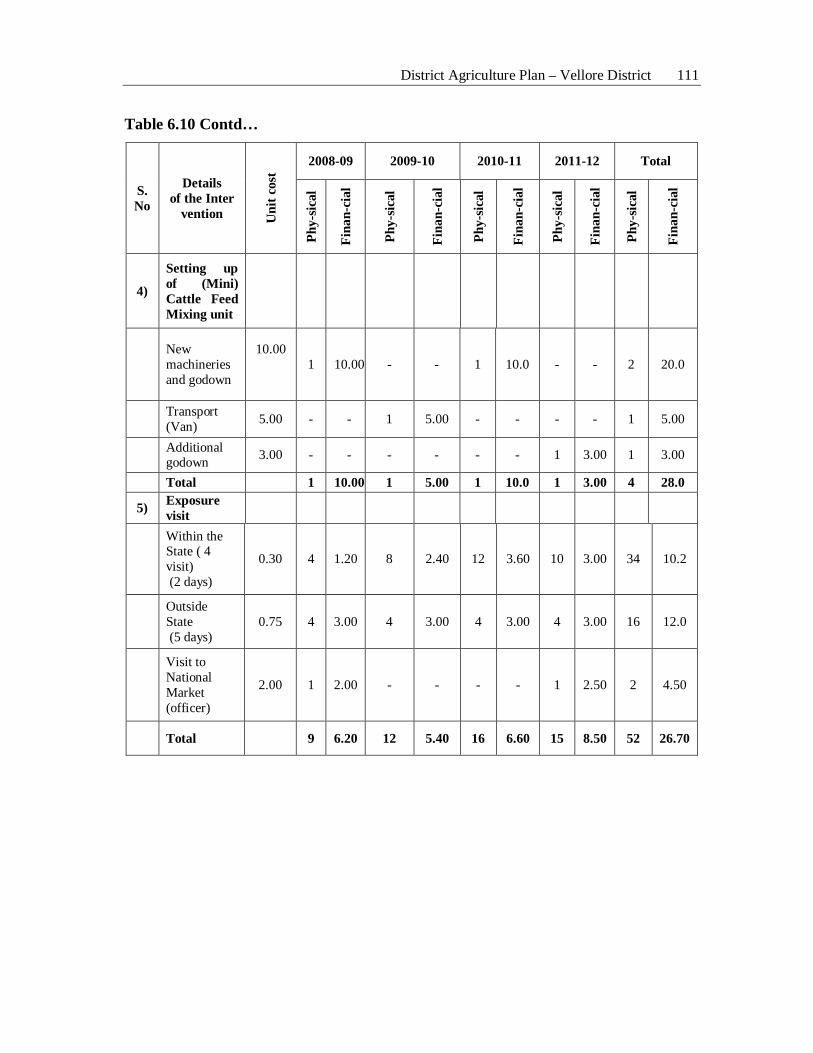
District Agriculture Plan – Vellore District 111
Table 6.10 Contd…
S. No
Details of the Inter
vention Uni
t cos
t
2008-09 2009-10 2010-11 2011-12 Total
Phy-
sica
l
Fina
n-ci
al
Phy-
sica
l
Fina
n-ci
al
Phy-
sica
l
Fina
n-ci
al
Phy-
sica
l
Fina
n-ci
al
Phy-
sica
l
Fina
n-ci
al
4)
Setting up of (Mini) Cattle Feed Mixing unit
New machineries and godown
10.00
1 10.00 - - 1 10.0 - - 2 20.0
Transport (Van) 5.00 - - 1 5.00 - - - - 1 5.00
Additional godown 3.00 - - - - - - 1 3.00 1 3.00
Total 1 10.00 1 5.00 1 10.0 1 3.00 4 28.0
5) Exposure visit
Within the State ( 4 visit) (2 days)
0.30 4 1.20 8 2.40 12 3.60 10 3.00 34 10.2
Outside State (5 days)
0.75 4 3.00 4 3.00 4 3.00 4 3.00 16 12.0
Visit to National Market (officer)
2.00 1 2.00 - - - - 1 2.50 2 4.50
Total 9 6.20 12 5.40 16 6.60 15 8.50 52 26.70
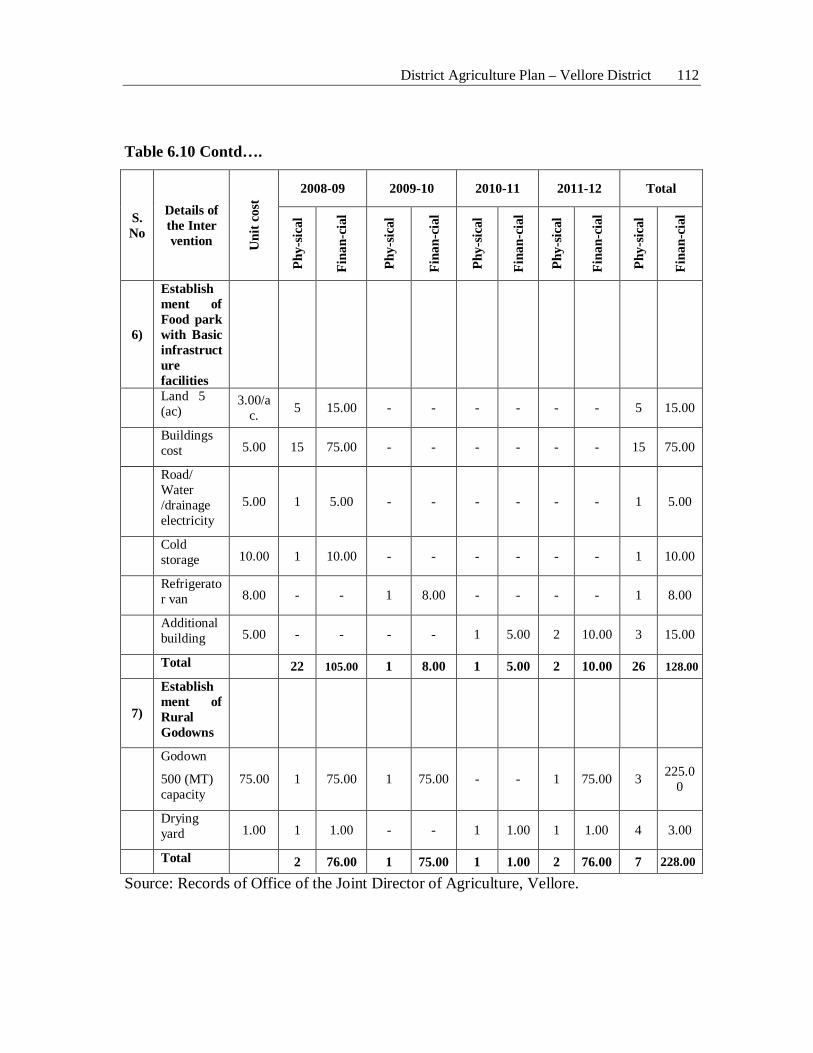
District Agriculture Plan – Vellore District 112
Table 6.10 Contd….
S. No
Details of the Inter vention U
nit c
ost
2008-09 2009-10 2010-11 2011-12 Total
Phy-
sica
l
Fina
n-ci
al
Phy-
sica
l
Fina
n-ci
al
Phy-
sica
l
Fina
n-ci
al
Phy-
sica
l
Fina
n-ci
al
Phy-
sica
l
Fina
n-ci
al
6)
Establishment of Food park with Basic infrastructure facilities
Land 5 (ac)
3.00/ac. 5 15.00 - - - - - - 5 15.00
Buildings cost 5.00 15 75.00 - - - - - - 15 75.00
Road/ Water /drainage electricity
5.00 1 5.00 - - - - - - 1 5.00
Cold storage 10.00 1 10.00 - - - - - - 1 10.00
Refrigerator van 8.00 - - 1 8.00 - - - - 1 8.00
Additional building 5.00 - - - - 1 5.00 2 10.00 3 15.00
Total 22 105.00 1 8.00 1 5.00 2 10.00 26 128.00
7)
Establishment of Rural Godowns
Godown
500 (MT) capacity
75.00 1 75.00 1 75.00 - - 1 75.00 3 225.00
Drying yard 1.00 1 1.00 - - 1 1.00 1 1.00 4 3.00
Total 2 76.00 1 75.00 1 1.00 2 76.00 7 228.00
Source: Records of Office of the Joint Director of Agriculture, Vellore.
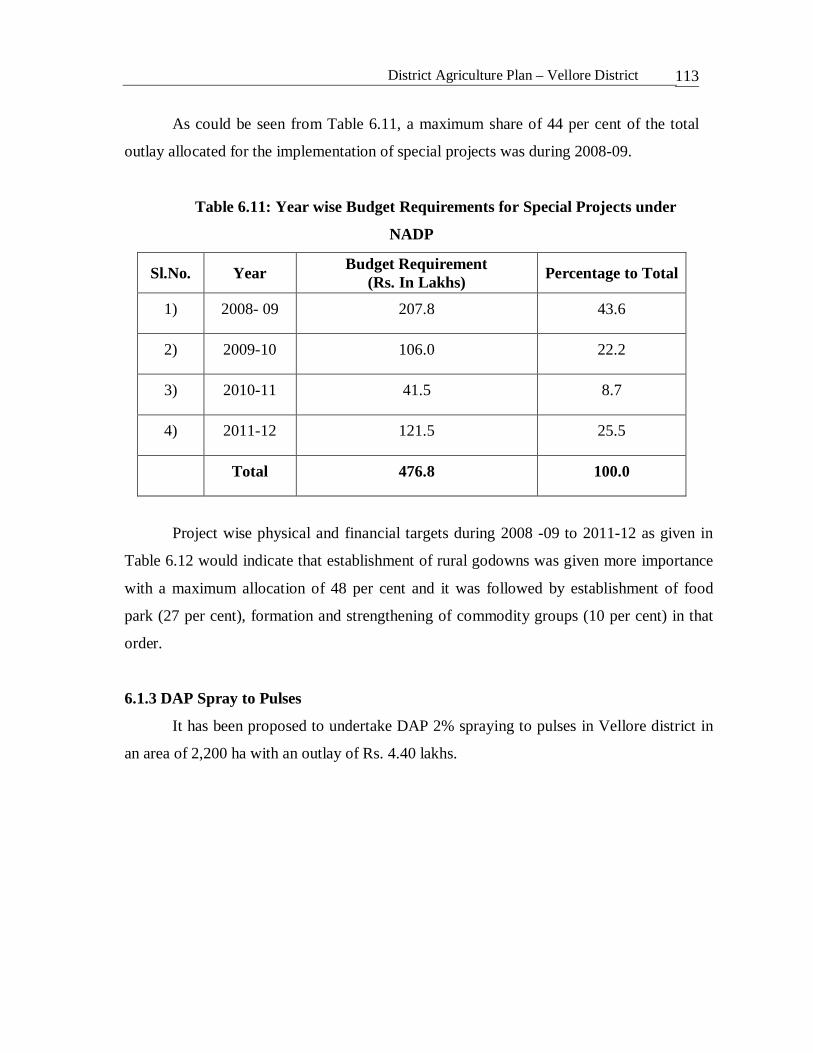
District Agriculture Plan – Vellore District 113
As could be seen from Table 6.11, a maximum share of 44 per cent of the total
outlay allocated for the implementation of special projects was during 2008-09.
Table 6.11: Year wise Budget Requirements for Special Projects under
NADP
Sl.No. Year Budget Requirement (Rs. In Lakhs) Percentage to Total
1) 2008- 09 207.8 43.6
2) 2009-10 106.0 22.2
3) 2010-11 41.5 8.7
4) 2011-12 121.5 25.5
Total 476.8 100.0
Project wise physical and financial targets during 2008 -09 to 2011-12 as given in
Table 6.12 would indicate that establishment of rural godowns was given more importance
with a maximum allocation of 48 per cent and it was followed by establishment of food
park (27 per cent), formation and strengthening of commodity groups (10 per cent) in that
order.
6.1.3 DAP Spray to Pulses
It has been proposed to undertake DAP 2% spraying to pulses in Vellore district in
an area of 2,200 ha with an outlay of Rs. 4.40 lakhs.
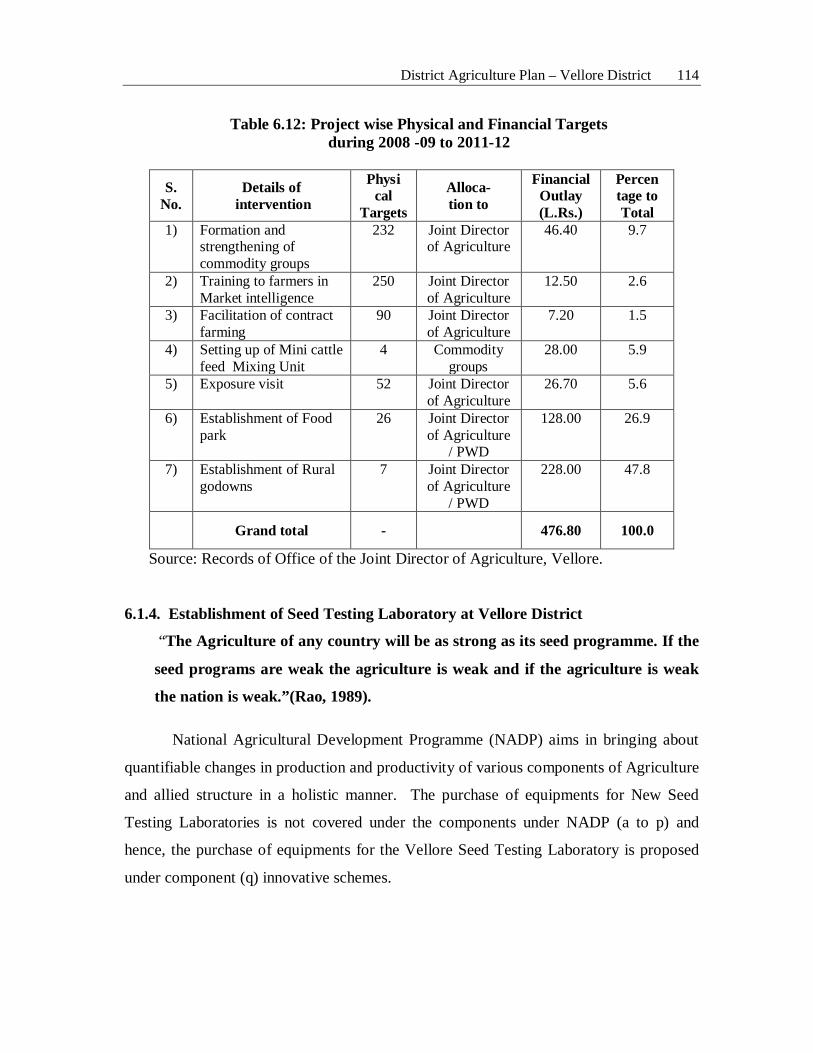
District Agriculture Plan – Vellore District 114
Table 6.12: Project wise Physical and Financial Targets during 2008 -09 to 2011-12
S.
No. Details of
intervention
Physi cal
Targets
Alloca- tion to
Financial Outlay (L.Rs.)
Percen tage to Total
1) Formation and strengthening of commodity groups
232 Joint Director of Agriculture
46.40 9.7
2) Training to farmers in Market intelligence
250 Joint Director of Agriculture
12.50 2.6
3) Facilitation of contract farming
90 Joint Director of Agriculture
7.20 1.5
4) Setting up of Mini cattle feed Mixing Unit
4 Commodity groups
28.00 5.9
5) Exposure visit 52 Joint Director of Agriculture
26.70 5.6
6) Establishment of Food park
26 Joint Director of Agriculture
/ PWD
128.00 26.9
7) Establishment of Rural godowns
7 Joint Director of Agriculture
/ PWD
228.00 47.8
Grand total - 476.80 100.0
Source: Records of Office of the Joint Director of Agriculture, Vellore.
6.1.4. Establishment of Seed Testing Laboratory at Vellore District
“The Agriculture of any country will be as strong as its seed programme. If the
seed programs are weak the agriculture is weak and if the agriculture is weak
the nation is weak.”(Rao, 1989).
National Agricultural Development Programme (NADP) aims in bringing about
quantifiable changes in production and productivity of various components of Agriculture
and allied structure in a holistic manner. The purchase of equipments for New Seed
Testing Laboratories is not covered under the components under NADP (a to p) and
hence, the purchase of equipments for the Vellore Seed Testing Laboratory is proposed
under component (q) innovative schemes.
District Agriculture Plan – Vellore District 115
Seed the living embryo is considered as the basic and cheapest input in modern
agriculture in enhancing and stabilizing the productivity. The cost of seed is usually
negligible when compared to total production cost. Yet, seed can affect the yield potential
of a crop more than any other input factor. The quality seed is one with high physical
purity, germinability, vigour, genetic purity and free of pest and diseases.
Quality control programs are pointless unless they involve seed testing.
Conversely, a seed testing laboratory has little value unless it is a part of a seed
certification program, a seed law enforcement program or a production and marketing
activity.
Seed tests can provide information on pure seed, other crop seed and weed seed
(by percentage and number per unit weight of different species), inert matter, normal and
abnormal seedlings, fresh or hard seed, dead seed and moisture content.
The main aim of seed testing is to obtain accurate and reproducible results. The
seed testing laboratory is an institution in carrying out the seed production and
certification program.
To meet the increasing demand of farming community, seed growers, seed
producers, seed dealers of the district and for easy accessibility to the poor farming
community for the purpose of enhancing Agricultural production in the district, it is
necessary to have a new Seed Testing Laboratory at Vellore district.
i) Objectives of Seed Testing
The main objective of Seed Testing in these laboratories will be to obtain accurate
and reproducible results regarding the purity composition, moisture content, the
occurrence of weed seeds and the percentage of germination to produce normal seedlings
under favourable conditions. In some instances, such additional information such as the
presence of seed borne diseases and pests and varietal purity is desired. Seed testing will
District Agriculture Plan – Vellore District 116
be a guide to the person who will plant the seed and for seed quality control purposes. In
all these cases, the ultimate purpose of making the test is to determine the value of seed
for planting.
ii) Role of Seed Testing Laboratories in Seed Quality Control
On analysis of the past data on productivity and quantity of seeds distributed to
farming community, it is well understood the SEED is very important among all other
factors which influences agricultural production considerably.
While encouraging distribution of Quality seeds, regulation of seeds distributed to
farmers is also very much required to safe guard the interests of the farmers and to keep
up the agricultural production.
iii) Seed Quality Control Activities
Past performance depicts that intensification of regulatory activities have led to
reduction in distribution of sub standard seeds in the State. Tamil Nadu stands first
among other states and Union territories in implementation of the Seeds Act, 1966, The
Seeds Rule 1968 and the Seed Control Order 1983.
To safe guard the interests of farming community and to increase agricultural
production in the district, a strong seed production program and quality control
mechanism play a vital role.
Seed testing plays a pivotal role in modern agriculture. It is being carried out to
analyze the factors like germination, physical purity, moisture, seed health and admixture
of other distinguishable varieties. Seed testing is carried out in the notified seed testing
laboratories. The seed testing results are very important for the successful implementation
of seed certification program and seed law enforcement programs. Certified Seed
Samples, Official seed samples from quality control wing and the service samples sent by
the farmers, seed dealers and seed producers are tested in the laboratories.
District Agriculture Plan – Vellore District 117
iv) Need for Establishing Seed Testing Laboratory
At present, the certified seed samples from Seed Certification wing, Official seed
samples from Seed Quality Control wing and Service samples from Seed Producers, Seed
dealers and farmers are being sent to Kancheepuram district for analysis. This process
results in the delay of results due to transportation of the seed from the place of sampling
to the laboratory. To overcome this problem and render timely supply of quality seeds to
the farming community, seed producers and seed dealers, it is necessary to establish Seed
Testing Laboratory at Vellore district.
As seeds play a vital role in enhancing the agricultural production, it is a must to
check the quality of seeds before being used for sowing. The Seed testing Laboratory is
the hub of Quality Control. Seed testing services are required from time to time to gain
information regarding planting value of seed lots. To carry out the responsibilities
effectively, it is necessary that Seed Testing Laboratory is established, manned and
equipped in a manner such that whatever samples are received from the district could be
analyzed in the least possible time, so that seed quality control work and the need of the
seed industry are effectively met.
v) Seed Distribution
A considerable quantum of quality seeds are being distributed through licensed
seed selling points. The labelled seeds distribution is dominating. Under these
circumstances, ensuring the quality of the seed lots before its usage by the farming
community is very much essential. The quality of such seed lots can be ensured only by
testing these seed lots in the Seed Testing Laboratories for its seed standards. The seed
testing of these seed lots which are not covered under the preview of Seed Certification
and that are covered to some extent under seed quality control program can be ensured
only by inculcating the practice of sending service samples by seed producers, seed
dealers and farmers for testing to Seed Testing Laboratory. In the present scenario, where
District Agriculture Plan – Vellore District 118
Seed Testing Laboratory is not available in the district, the seed producers, seed dealers
and farmers find it very difficult to send the seed samples for analysis. Hence, facilitating
the seed producers, seed dealers and farmers by establishing Seed Testing Laboratory in
the district will be of much use. Accordingly, a Seed Testing Laboratory is proposed to
be established in Vellore district.
In order to meet the increasing demand of quality seeds and to ensure that the
farmers, dealers, producers receive the results of Seed Testing Laboratories at correct
time without delay it is proposed to establish new Seed Testing Laboratory at Vellore
district under National Agricultural Development Programme at a financial outlay of
Rs.6.00 lakhs towards provision of laboratory equipments.
6.1.4.1. Requirement of Equipments for Establishing Seed Testing Laboratory
i) Mixing and Dividing Equipments
Seed samples entering a laboratory should be thoroughly mixed before they are
divided for making a purity analysis. Soil type divider is proposed to be purchased as
these mixers and dividers are faster and more accurate.
ii) Moisture Testing Equipment
Moisture testing equipment for making rapid moisture determinations in order to
provide quick moisture percentage of seed lots is required. Digital moisture meter is to be
purchased.
iii) Weighing Equipments
It is proposed to purchase Top loading weighing balance and Electronic Weighing
balance (to weigh a minimum of 0.1 mg) for weighing the submitted samples and
moisture determinations.
District Agriculture Plan – Vellore District 119
iv) Purity Analysis Equipment
Purity analysis equipments are used to analyze the physical purity of submitted
seed sample which is a pre - requisite for conducting germination test. The illuminated
purity work board is to be purchased for physical purity analysis.
v) Germination Equipment
Seed germination in the laboratory should be made under ideal conditions. This
necessitates controlled temperature and humidity. For conducting germination test under
prescribed temperature and humidity for various agricultural and horticultural crop seed
samples Cabinet germinator is very much required. Germination Trays, Petri dishes are
necessary for conducting Germination Test. Germination paper, filter paper are the media
that are to be purchased for the new Seed Testing Laboratory.
vi) Storage Equipment
The seeds received for testing should be stored at controlled conditions for future
use. Hence, it is proposed to purchase seed storage racks.
vii) General
Thermometer and Hygrometer to measure temperature and humidity respectively
are needed. Trolley (Movable) for transporting sand, Air Conditioner to maintain
prescribed temperature is required. Work table and chair are necessary for carrying out
various works like germination, purity analysis and for working of equipments etc.
viii) Computers with Accessories
Computer with accessories are needed for declaring the results in the internet and
storing data on seed analysis.
ix) Cost Aspects
The Seed Testing Laboratory that is to be established should have the following
equipments (Table 6.13) for the purpose of analyzing seed samples for moisture, physical
purity, germination and Other Distinguishable Varieties.
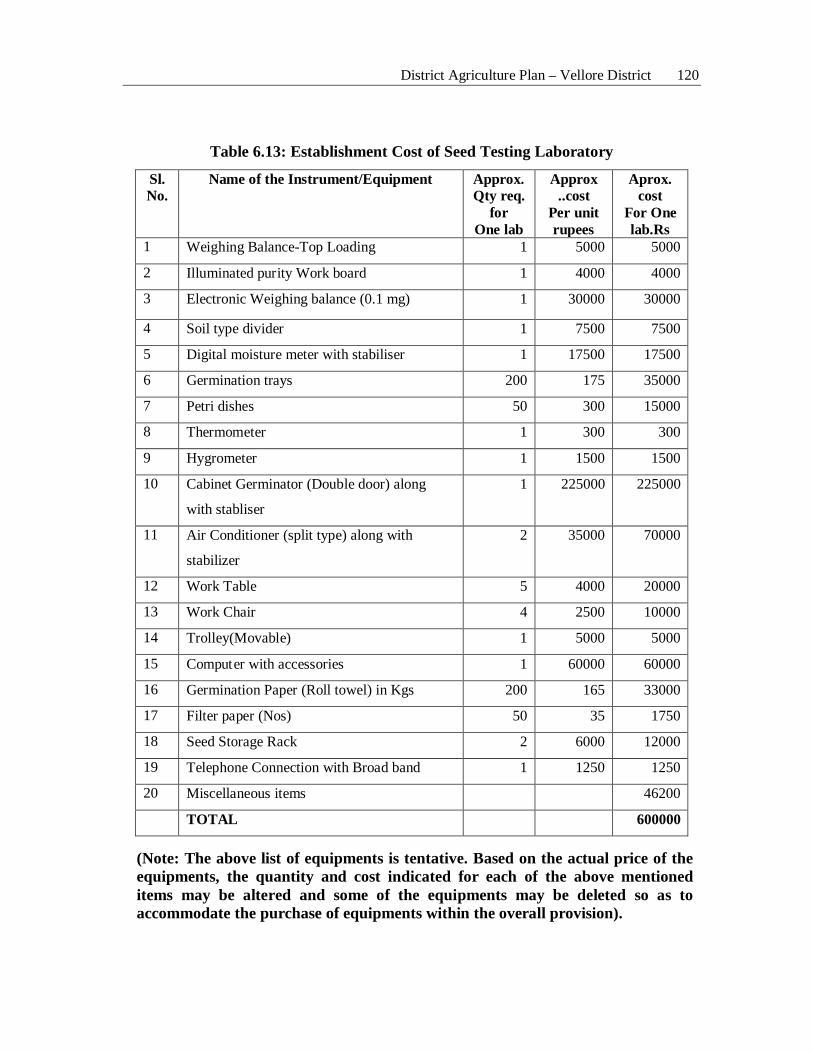
District Agriculture Plan – Vellore District 120
Table 6.13: Establishment Cost of Seed Testing Laboratory
Sl. No.
Name of the Instrument/Equipment Approx. Qty req.
for One lab
Approx ..cost
Per unit rupees
Aprox. cost
For One lab.Rs
1 Weighing Balance-Top Loading 1 5000 5000
2 Illuminated purity Work board 1 4000 4000
3 Electronic Weighing balance (0.1 mg) 1 30000 30000
4 Soil type divider 1 7500 7500
5 Digital moisture meter with stabiliser 1 17500 17500
6 Germination trays 200 175 35000
7 Petri dishes 50 300 15000
8 Thermometer 1 300 300
9 Hygrometer 1 1500 1500
10 Cabinet Germinator (Double door) along
with stabliser
1 225000 225000
11 Air Conditioner (split type) along with
stabilizer
2 35000 70000
12 Work Table 5 4000 20000
13 Work Chair 4 2500 10000
14 Trolley(Movable) 1 5000 5000
15 Computer with accessories 1 60000 60000
16 Germination Paper (Roll towel) in Kgs 200 165 33000
17 Filter paper (Nos) 50 35 1750
18 Seed Storage Rack 2 6000 12000
19 Telephone Connection with Broad band 1 1250 1250
20 Miscellaneous items 46200
TOTAL 600000
(Note: The above list of equipments is tentative. Based on the actual price of the equipments, the quantity and cost indicated for each of the above mentioned items may be altered and some of the equipments may be deleted so as to accommodate the purchase of equipments within the overall provision).
District Agriculture Plan – Vellore District 121
x) Operation and Maintenance Cost of the Laboratory
The staff pattern as proposed in the restructuring shall be accommodated. The
recurring expenditure towards pay and allowances for the staff proposed as per
restructure proposal and the recurring expenditure towards other items shall be borne by
the State Government.
xi) Benefits
The Seed Testing laboratory is an important institution in carrying out the seed
production and seed certification program. The accuracy and reproducibility in the
analyzed results is of paramount importance to the seed producer, processor, certification
and seed law enforcement officials. Establishment of seed testing laboratory at Vellore
district will help the farming community, seed dealers and producers in getting the results
in time, in getting quality seeds at the sowing period and curtailing the sale of
substandard seeds to the farmers well ahead of sowing so that agricultural production of
the district is enhanced.
xii) Expected Date of Completion
The equipments for Seed Testing Laboratory are expected to be purchased during
2008-09.
xiii) Monitoring and Evaluation
Project on implementation of the proposed project shall be evaluated then and
there by Department of Seed Certification which is the implementing department.
6.2 Horticulture
The project proposals for the development of horticultural activities in Vellore
district to be taken up during XI plan period are discussed in this section.
The project components and justification for taking up such projects relating to
horticultural development in Vellore district are given below.
District Agriculture Plan – Vellore District 122
6.2.1. Net House Structure
Protected Cultivation of Vegetables
Protected cultivation of vegetables offers distinct advantages of quality,
productivity and favourable market price to the growers. Vegetable growers can
substantially increase their income by taking protected cultivation of vegetables in off-
season, as the vegetables produced during the normal season generally do not fetch good
returns due to availability of large quantity of these vegetables in the markets. Off season
cultivation of cucurbits under low plastic tunnels is one of the most profitable
technologies. Insect proof net houses can be used for virus-free cultivation of tomato,
chilli, sweet pepper and other vegetables mainly during the rainy season. These low cost
structures are also suitable for growing pesticide-free green vegetables. Low cost green
houses can be used for high quality vegetable cultivation for long duration (6-10 months)
mainly in sub -urban areas of the country to fetch remunerative price to the producers. A
few low cost technologies available for horticultural development are discussed in what
follows.
i) Pandhal for Vegetable Production
Disease incidence is minimized because of proper aeration and better sanitary
condition.
ii) Plastic Crates for Vegetable Handling
Careful harvesting, handling and transporting of fruits and vegetables to packing
houses become necessary to preserve product quality.
iii) Mango Harvester
This equipment would be useful to prevent damage to the fruits when they are
dropped from high trees.
District Agriculture Plan – Vellore District 123
iv) Humic acid / Effective E-microbes
This is used for removal of metals and organic contaminants.
v) Banana Bunch Cover
This provides protection from mechanical damage (leaf rub, etc.) in the field and
during harvesting and transporting to the packing shed. Temperature under the cover can
be from 20 C to 60
C warmer and during cool times of the year this can increase fruit
length and hasten fruit filling (harvest 4 to 14 days earlier). The yield benefits are much
less during the warmer months and special care needs to be taken to avoid sun-burn under
the covers during the warmer months. This involves the use of reflective silver covers
and pulling down a leaf over the cover. Perforated covers are commonly used to reduce
sun-burn damage for export production. At times, early bunch covering is necessary to
protect the fruit from scarring caused by nectar-feeding birds and bats during the
flowering phase. Applying heavier gauge bunch covers (150um) before any bracts lift on
the bunch can overcome this problem.
vi) Community Fencing
Assistance is provided to the group of farmers for laying of barbed fencing around
the fields to demarcate.
vii) Bore Well with Casing Pipe
Laying out bore-wells with casing pipes is done for improving the efficiency of
irrigation.
viii) Tractor-Mounted Steam Boiler
This equipment is used for the purpose of curing turmeric effectively and
economically.
District Agriculture Plan – Vellore District 124
ix) Package for Plant Protection
The Horticultural crops are prone to several diseases and pests which partially or
completely damage the crops. So plant protection becomes essential. Assistance for Bio-
Pesticides and Bio-control agents / Sex pheromones is also necessary.
The technologies identified for horticultural development under NADP in Vellore
district during 2008-09 - 2011-12 are furnished in Table 6.14. Further, the deatails of
strengthening of infrastructure facilities of horticultural farms at Kudappattu, Navlock
and the abstract of the same are furnished in Table 6.15, Table 6.16 and Table 6.17
respectively.
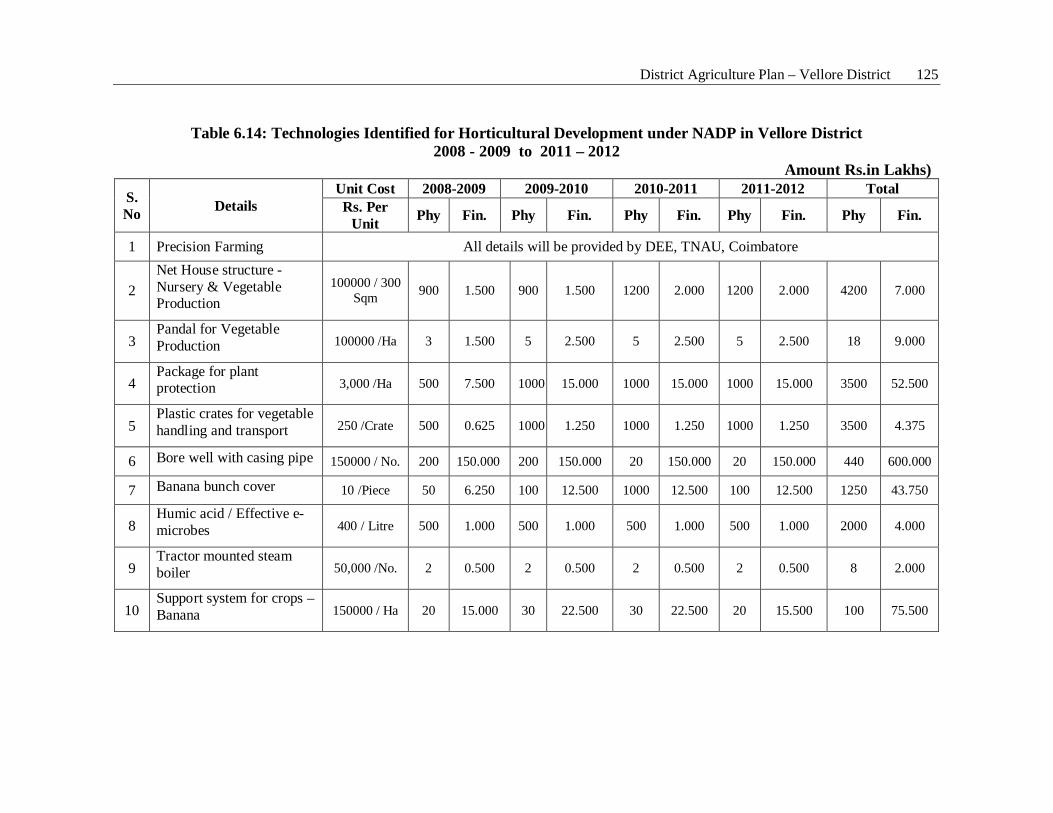
District Agriculture Plan – Vellore District 125
Table 6.14: Technologies Identified for Horticultural Development under NADP in Vellore District 2008 - 2009 to 2011 – 2012
Amount Rs.in Lakhs)
S. No Details
Unit Cost 2008-2009 2009-2010 2010-2011 2011-2012 Total Rs. Per
Unit Phy Fin. Phy Fin. Phy Fin. Phy Fin. Phy Fin.
1 Precision Farming All details will be provided by DEE, TNAU, Coimbatore
2 Net House structure - Nursery & Vegetable Production
100000 / 300 Sqm 900 1.500 900 1.500 1200 2.000 1200 2.000 4200 7.000
3 Pandal for Vegetable Production 100000 /Ha 3 1.500 5 2.500 5 2.500 5 2.500 18 9.000
4 Package for plant protection 3,000 /Ha 500 7.500 1000 15.000 1000 15.000 1000 15.000 3500 52.500
5 Plastic crates for vegetable handling and transport 250 /Crate 500 0.625 1000 1.250 1000 1.250 1000 1.250 3500 4.375
6 Bore well with casing pipe 150000 / No. 200 150.000 200 150.000 20 150.000 20 150.000 440 600.000
7 Banana bunch cover 10 /Piece 50 6.250 100 12.500 1000 12.500 100 12.500 1250 43.750
8 Humic acid / Effective e-microbes 400 / Litre 500 1.000 500 1.000 500 1.000 500 1.000 2000 4.000
9 Tractor mounted steam boiler 50,000 /No. 2 0.500 2 0.500 2 0.500 2 0.500 8 2.000
10 Support system for crops – Banana 150000 / Ha 20 15.000 30 22.500 30 22.500 20 15.500 100 75.500
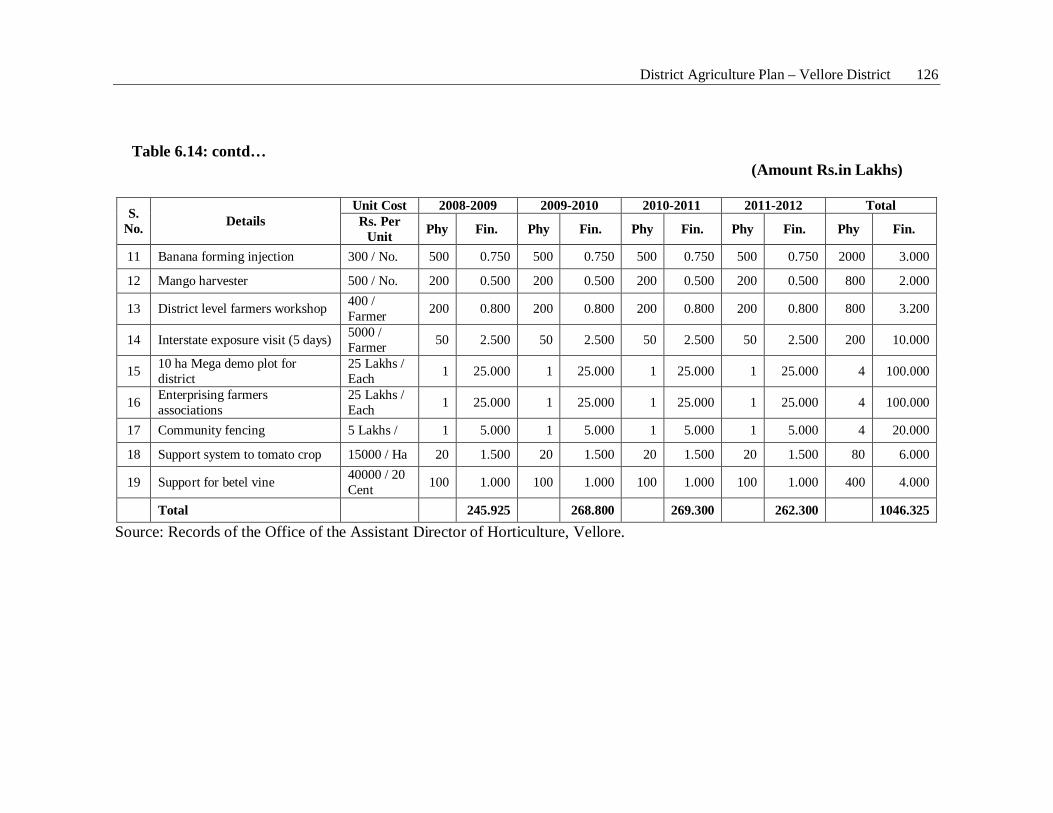
District Agriculture Plan – Vellore District 126
Table 6.14: contd…
(Amount Rs.in Lakhs)
S. No. Details
Unit Cost 2008-2009 2009-2010 2010-2011 2011-2012 Total Rs. Per
Unit Phy Fin. Phy Fin. Phy Fin. Phy Fin. Phy Fin.
11 Banana forming injection 300 / No. 500 0.750 500 0.750 500 0.750 500 0.750 2000 3.000
12 Mango harvester 500 / No. 200 0.500 200 0.500 200 0.500 200 0.500 800 2.000
13 District level farmers workshop 400 / Farmer 200 0.800 200 0.800 200 0.800 200 0.800 800 3.200
14 Interstate exposure visit (5 days) 5000 / Farmer 50 2.500 50 2.500 50 2.500 50 2.500 200 10.000
15 10 ha Mega demo plot for district
25 Lakhs / Each 1 25.000 1 25.000 1 25.000 1 25.000 4 100.000
16 Enterprising farmers associations
25 Lakhs / Each 1 25.000 1 25.000 1 25.000 1 25.000 4 100.000
17 Community fencing 5 Lakhs / 1 5.000 1 5.000 1 5.000 1 5.000 4 20.000
18 Support system to tomato crop 15000 / Ha 20 1.500 20 1.500 20 1.500 20 1.500 80 6.000
19 Support for betel vine 40000 / 20 Cent 100 1.000 100 1.000 100 1.000 100 1.000 400 4.000
Total 245.925 268.800 269.300 262.300 1046.325
Source: Records of the Office of the Assistant Director of Horticulture, Vellore.
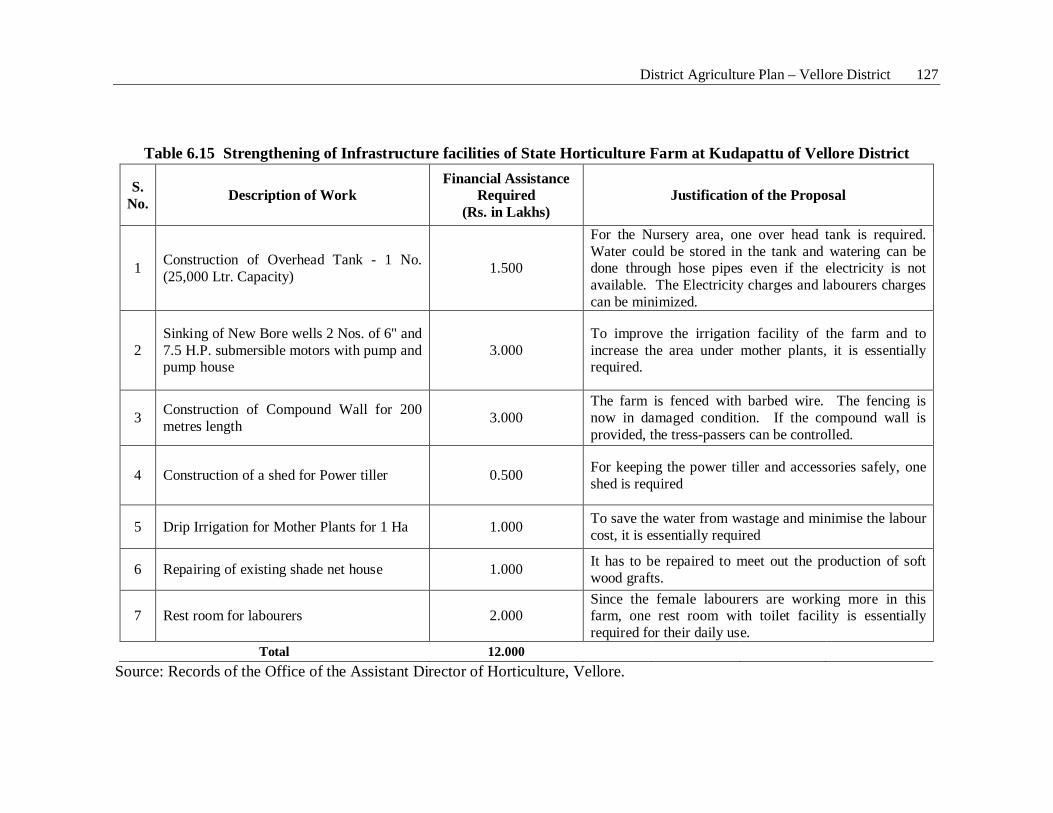
District Agriculture Plan – Vellore District 127
Table 6.15 Strengthening of Infrastructure facilities of State Horticulture Farm at Kudapattu of Vellore District
S. No. Description of Work
Financial Assistance Required
(Rs. in Lakhs) Justification of the Proposal
1 Construction of Overhead Tank - 1 No. (25,000 Ltr. Capacity) 1.500
For the Nursery area, one over head tank is required. Water could be stored in the tank and watering can be done through hose pipes even if the electricity is not available. The Electricity charges and labourers charges can be minimized.
2 Sinking of New Bore wells 2 Nos. of 6" and 7.5 H.P. submersible motors with pump and pump house
3.000 To improve the irrigation facility of the farm and to increase the area under mother plants, it is essentially required.
3 Construction of Compound Wall for 200 metres length 3.000
The farm is fenced with barbed wire. The fencing is now in damaged condition. If the compound wall is provided, the tress-passers can be controlled.
4 Construction of a shed for Power tiller 0.500 For keeping the power tiller and accessories safely, one shed is required
5 Drip Irrigation for Mother Plants for 1 Ha 1.000 To save the water from wastage and minimise the labour cost, it is essentially required
6 Repairing of existing shade net house 1.000 It has to be repaired to meet out the production of soft wood grafts.
7 Rest room for labourers 2.000 Since the female labourers are working more in this farm, one rest room with toilet facility is essentially required for their daily use.
Total 12.000 Source: Records of the Office of the Assistant Director of Horticulture, Vellore.
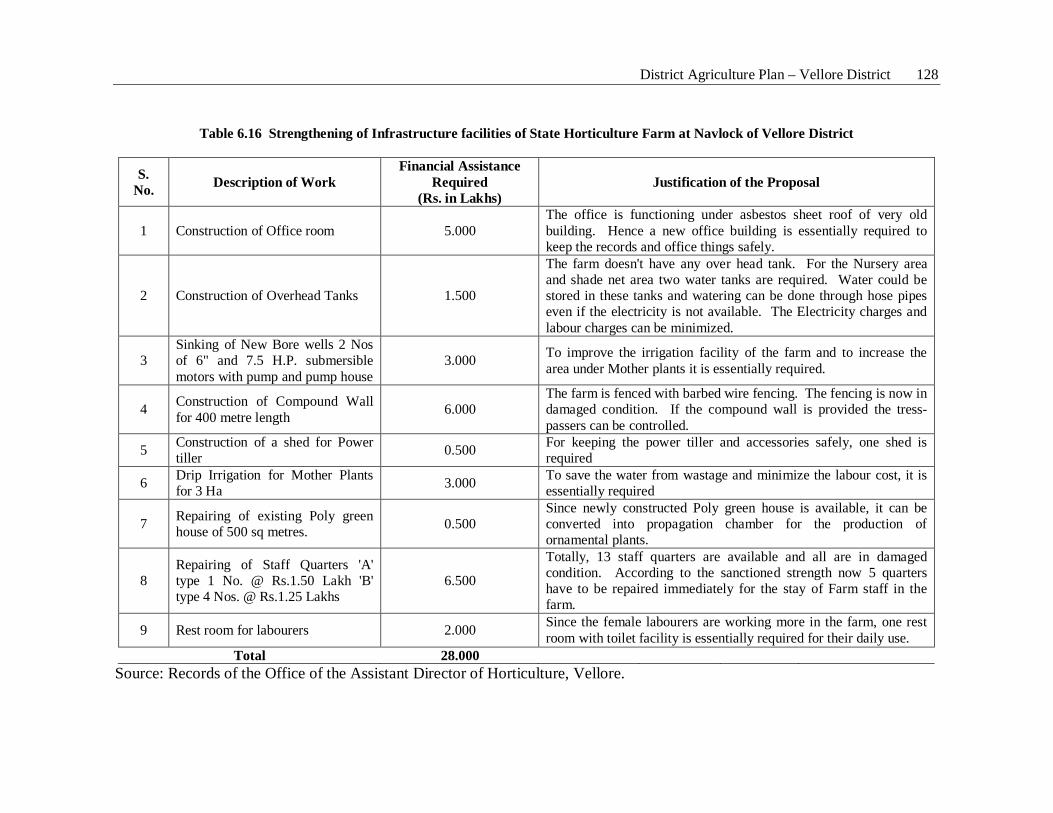
District Agriculture Plan – Vellore District 128
Table 6.16 Strengthening of Infrastructure facilities of State Horticulture Farm at Navlock of Vellore District
S. No. Description of Work
Financial Assistance Required
(Rs. in Lakhs) Justification of the Proposal
1 Construction of Office room 5.000 The office is functioning under asbestos sheet roof of very old building. Hence a new office building is essentially required to keep the records and office things safely.
2 Construction of Overhead Tanks 1.500
The farm doesn't have any over head tank. For the Nursery area and shade net area two water tanks are required. Water could be stored in these tanks and watering can be done through hose pipes even if the electricity is not available. The Electricity charges and labour charges can be minimized.
3 Sinking of New Bore wells 2 Nos of 6" and 7.5 H.P. submersible motors with pump and pump house
3.000 To improve the irrigation facility of the farm and to increase the area under Mother plants it is essentially required.
4 Construction of Compound Wall for 400 metre length 6.000
The farm is fenced with barbed wire fencing. The fencing is now in damaged condition. If the compound wall is provided the tress-passers can be controlled.
5 Construction of a shed for Power tiller 0.500 For keeping the power tiller and accessories safely, one shed is
required
6 Drip Irrigation for Mother Plants for 3 Ha 3.000 To save the water from wastage and minimize the labour cost, it is
essentially required
7 Repairing of existing Poly green house of 500 sq metres. 0.500
Since newly constructed Poly green house is available, it can be converted into propagation chamber for the production of ornamental plants.
8 Repairing of Staff Quarters 'A' type 1 No. @ Rs.1.50 Lakh 'B' type 4 Nos. @ Rs.1.25 Lakhs
6.500
Totally, 13 staff quarters are available and all are in damaged condition. According to the sanctioned strength now 5 quarters have to be repaired immediately for the stay of Farm staff in the farm.
9 Rest room for labourers 2.000 Since the female labourers are working more in the farm, one rest room with toilet facility is essentially required for their daily use.
Total 28.000 Source: Records of the Office of the Assistant Director of Horticulture, Vellore.
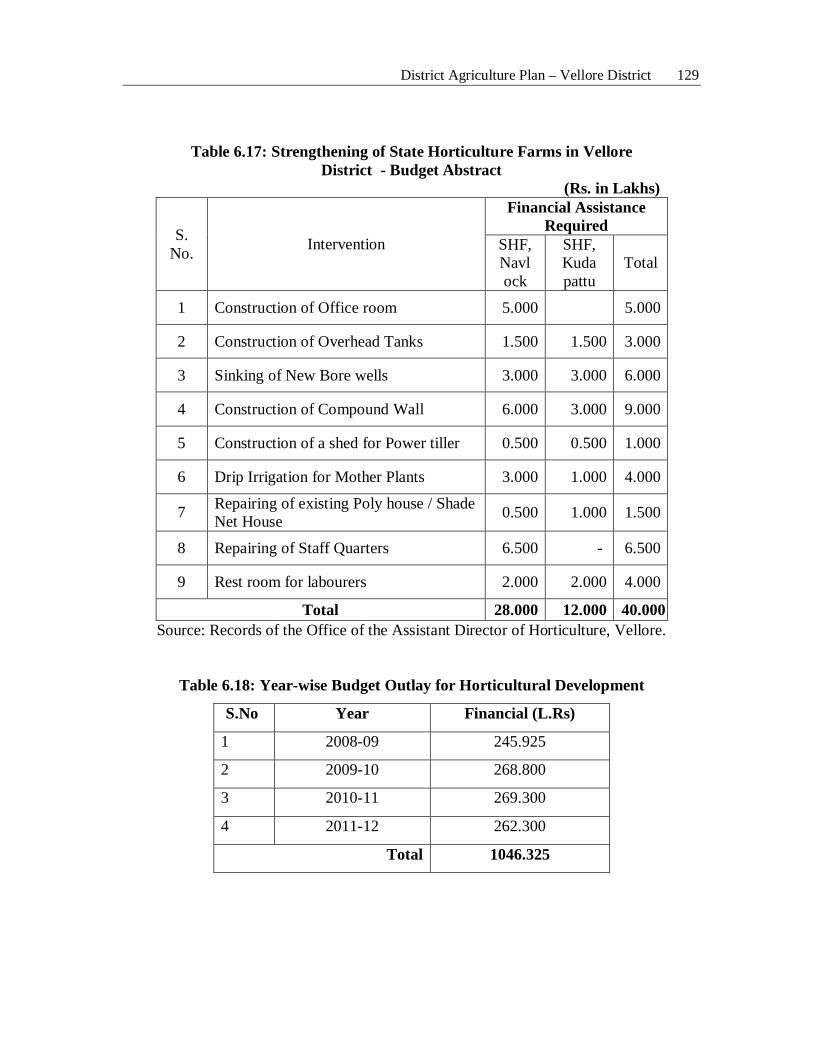
District Agriculture Plan – Vellore District 129
Table 6.17: Strengthening of State Horticulture Farms in Vellore District - Budget Abstract
(Rs. in Lakhs)
S. No. Intervention
Financial Assistance Required
SHF, Navl ock
SHF, Kuda pattu
Total
1 Construction of Office room 5.000 5.000
2 Construction of Overhead Tanks 1.500 1.500 3.000
3 Sinking of New Bore wells 3.000 3.000 6.000
4 Construction of Compound Wall 6.000 3.000 9.000
5 Construction of a shed for Power tiller 0.500 0.500 1.000
6 Drip Irrigation for Mother Plants 3.000 1.000 4.000
7 Repairing of existing Poly house / Shade Net House 0.500 1.000 1.500
8 Repairing of Staff Quarters 6.500 - 6.500
9 Rest room for labourers 2.000 2.000 4.000
Total 28.000 12.000 40.000 Source: Records of the Office of the Assistant Director of Horticulture, Vellore.
Table 6.18: Year-wise Budget Outlay for Horticultural Development
S.No Year Financial (L.Rs)
1 2008-09 245.925
2 2009-10 268.800
3 2010-11 269.300
4 2011-12 262.300
Total 1046.325
District Agriculture Plan – Vellore District 130
In Vellore district, an outlay of Rs.1046 lakhs has been earmarked for
horticultural development for the period from 2008-09 to 2011-12. Additionally, an
amount of Rs. 40.0 lakhs has been proposed for the improvement of facilities in state
horticultural farms at Navlock and Kudapattu.
6.3 Animal Husbandry
Increasing fodder production, control of cattle and poultry diseases, supply of
subsidized mineral mixtures, establishment of bulk milk coolers, strengthening of
manufacturing facilities for milk products, etc were focused in the proposals of the
Department of Animal Husbandry under NADP in Vellore district. As regards the
fisheries development, it has been proposed to subsidize the private fish seed rearing,
supply of fishing implements, capacity building to the farmers, establishment of fish
landing centres, installation of modern fish stalls at Vellore and so on.
I. Intensive Fodder Production, Supplementation of By-pass Protein Feed and Micronutrients to Dairy Cows and Goats and Enhancement of Nutrient Utilization
Abstract
This project aims to reduce the pressure on green fodder requirement by utilizing
the sugarcane tops, develop micro-level fodder units and increase the efficiency of
nutrient utilization in the consumed feed and fodder. The project proposes to
commercialize fodder production by involving the SHG, adoption of the technology of
SCT ensiling and feeding and increase the efficiency of nutrient utilization by
popularizing chaff cutters, supplementing mineral mixture and supplementing By-pass
protein feed to milch animals. The project will be implemented by the Department of
Animal Husbandry and the Department of Dairy Development at a total cost of Rs.
459.80 lakhs in four years
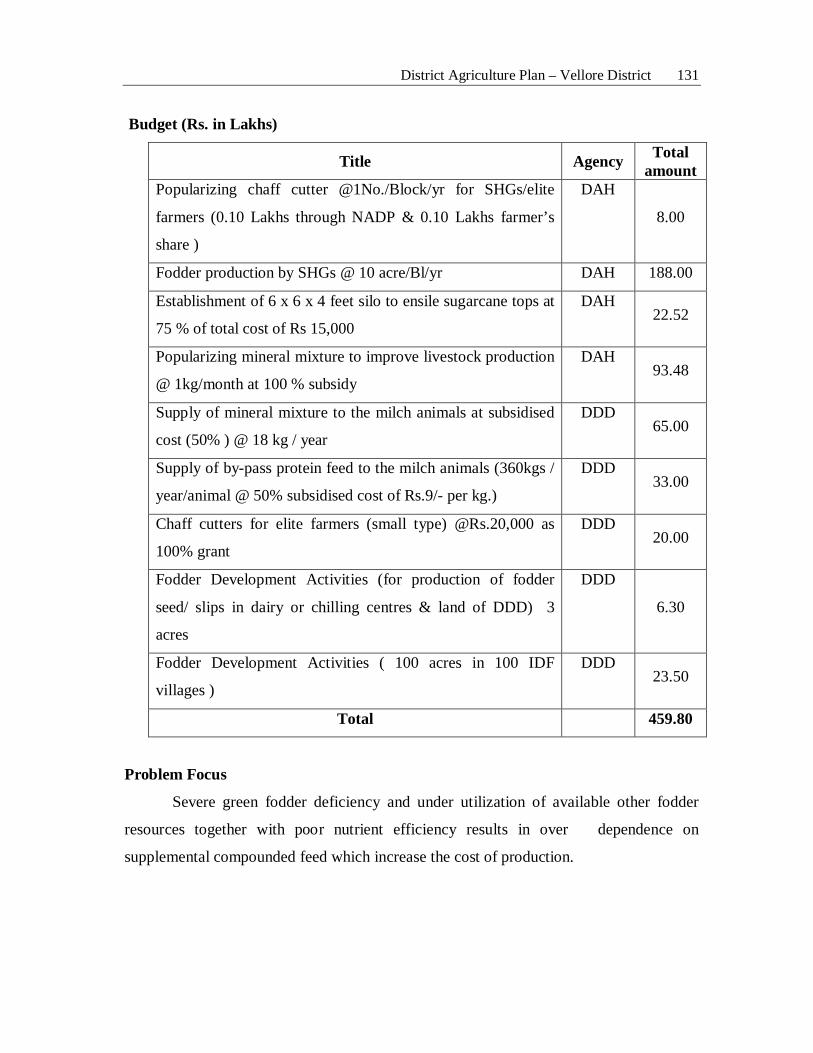
District Agriculture Plan – Vellore District 131
Budget (Rs. in Lakhs)
Title Agency Total amount
Popularizing chaff cutter @1No./Block/yr for SHGs/elite
farmers (0.10 Lakhs through NADP & 0.10 Lakhs farmer’s
share )
DAH
8.00
Fodder production by SHGs @ 10 acre/Bl/yr DAH 188.00
Establishment of 6 x 6 x 4 feet silo to ensile sugarcane tops at
75 % of total cost of Rs 15,000
DAH 22.52
Popularizing mineral mixture to improve livestock production
@ 1kg/month at 100 % subsidy
DAH 93.48
Supply of mineral mixture to the milch animals at subsidised
cost (50% ) @ 18 kg / year
DDD 65.00
Supply of by-pass protein feed to the milch animals (360kgs /
year/animal @ 50% subsidised cost of Rs.9/- per kg.)
DDD 33.00
Chaff cutters for elite farmers (small type) @Rs.20,000 as
100% grant
DDD 20.00
Fodder Development Activities (for production of fodder
seed/ slips in dairy or chilling centres & land of DDD) 3
acres
DDD
6.30
Fodder Development Activities ( 100 acres in 100 IDF
villages )
DDD 23.50
Total 459.80
Problem Focus
Severe green fodder deficiency and under utilization of available other fodder
resources together with poor nutrient efficiency results in over dependence on
supplemental compounded feed which increase the cost of production.
District Agriculture Plan – Vellore District 132
Project Rationale
Increasing fodder production and its nutrient efficiency will reduce feed cost on
production and increase the net income.
Project Strategy
a. Involving SHG in fodder production
b. Ensiling and feeding of sugarcane tops
c. Introduction of fodder chaffers
d. Supplementation with mineral mixture and By- pass protein to enhance
nutrient efficiency.
Project Goal
To reduce fodder and nutrient demand and increase net profit to dairy farmers.
Project Components
One Chaff cutter will be provided to one Self Help Group in each block. The
SHG to be provided with the chaff cutter will be identified by the District Administration.
The Chaff cutter that are provided will be operated manually with provision for
mechanizing the same if necessary in future. The approximate cost of one chaff cutter
works out to Rs.10,000/-
Popularizing chaff cutters by providing to SHG / Elite farmers at 50% of the total
cost of Rs.0.20 lakh each. A total of 80 chaffers will be distributed at the rate of one per
block per year to the total cost of Rs.8.00 lakhs.
Encouraging fodder production in irrigated condition by SHG at the rate of 10
acre per block per year with 100% subsidy on the total cost of Rs.0.20 lakh per acre. The
SHG resorting to fodder production will be given training at the cost of Rs.3.500. This
component will be implemented in 800 acres at the total cost of Rs.188.00 lakhs.
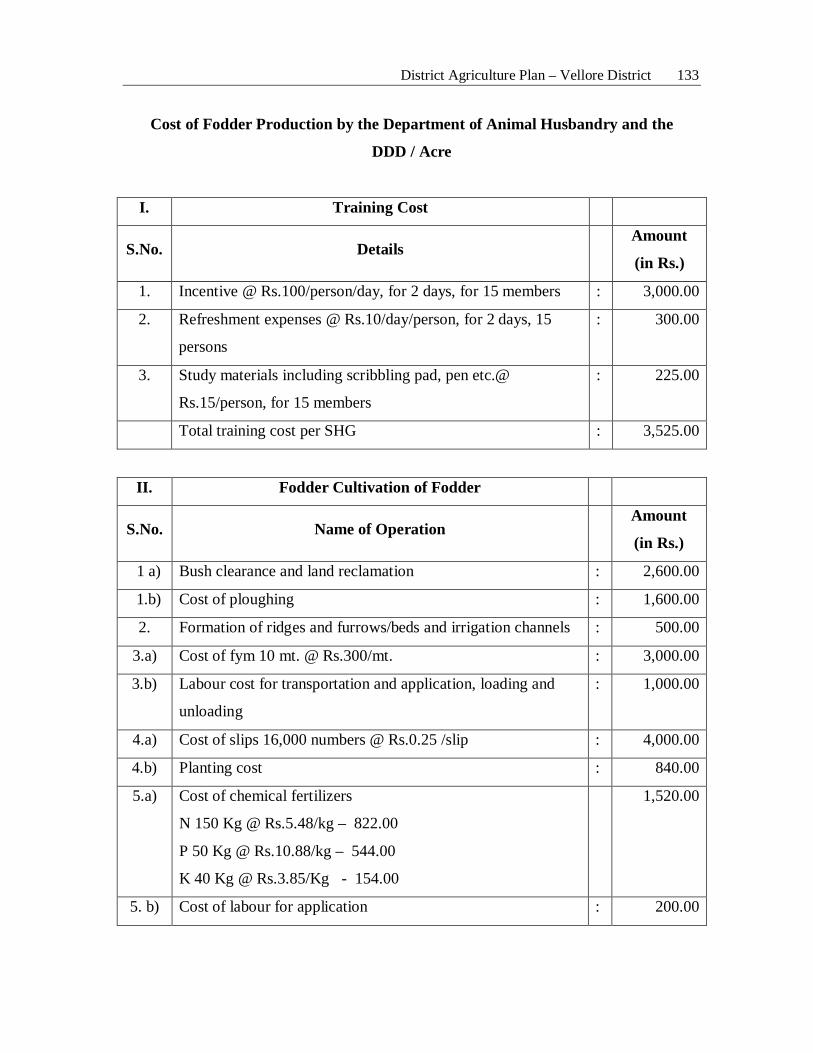
District Agriculture Plan – Vellore District 133
Cost of Fodder Production by the Department of Animal Husbandry and the
DDD / Acre
I. Training Cost
S.No. Details Amount
(in Rs.)
1. Incentive @ Rs.100/person/day, for 2 days, for 15 members : 3,000.00
2. Refreshment expenses @ Rs.10/day/person, for 2 days, 15
persons
: 300.00
3. Study materials including scribbling pad, pen etc.@
Rs.15/person, for 15 members
: 225.00
Total training cost per SHG : 3,525.00
II. Fodder Cultivation of Fodder
S.No. Name of Operation Amount
(in Rs.)
1 a) Bush clearance and land reclamation : 2,600.00
1.b) Cost of ploughing : 1,600.00
2. Formation of ridges and furrows/beds and irrigation channels : 500.00
3.a) Cost of fym 10 mt. @ Rs.300/mt. : 3,000.00
3.b) Labour cost for transportation and application, loading and
unloading
: 1,000.00
4.a) Cost of slips 16,000 numbers @ Rs.0.25 /slip : 4,000.00
4.b) Planting cost : 840.00
5.a) Cost of chemical fertilizers
N 150 Kg @ Rs.5.48/kg – 822.00
P 50 Kg @ Rs.10.88/kg – 544.00
K 40 Kg @ Rs.3.85/Kg - 154.00
1,520.00
5. b) Cost of labour for application : 200.00
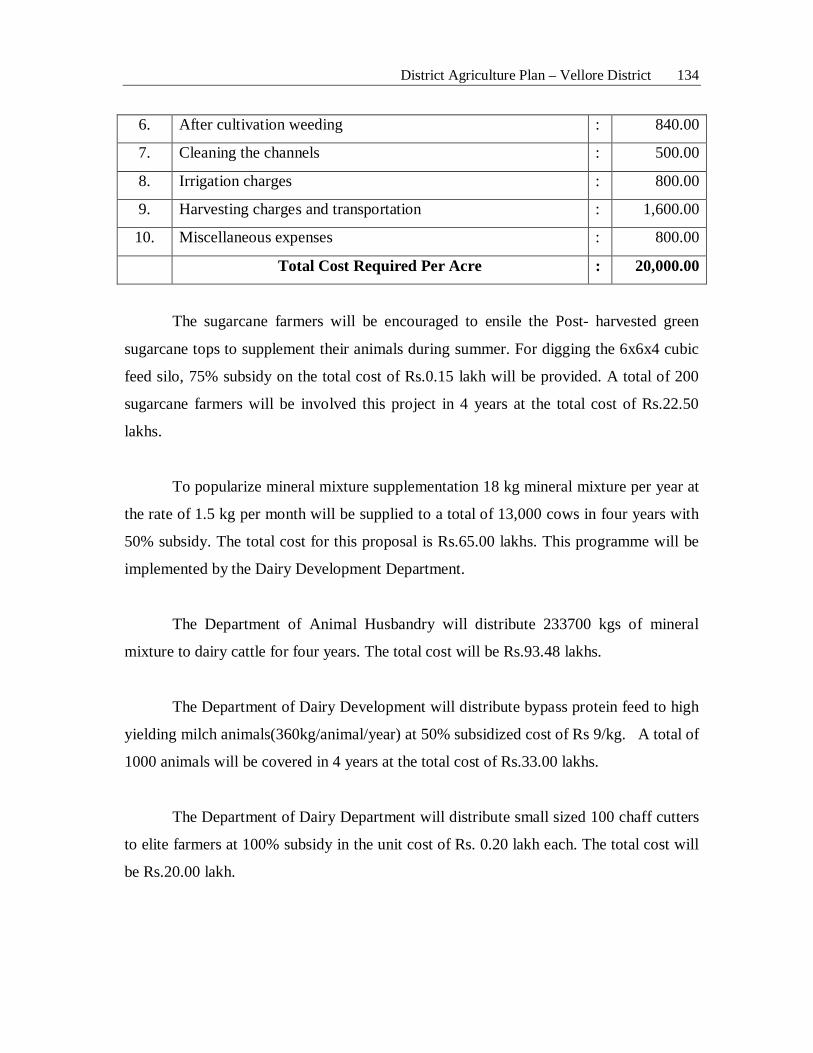
District Agriculture Plan – Vellore District 134
6. After cultivation weeding : 840.00
7. Cleaning the channels : 500.00
8. Irrigation charges : 800.00
9. Harvesting charges and transportation : 1,600.00
10. Miscellaneous expenses : 800.00
Total Cost Required Per Acre : 20,000.00
The sugarcane farmers will be encouraged to ensile the Post- harvested green
sugarcane tops to supplement their animals during summer. For digging the 6x6x4 cubic
feed silo, 75% subsidy on the total cost of Rs.0.15 lakh will be provided. A total of 200
sugarcane farmers will be involved this project in 4 years at the total cost of Rs.22.50
lakhs.
To popularize mineral mixture supplementation 18 kg mineral mixture per year at
the rate of 1.5 kg per month will be supplied to a total of 13,000 cows in four years with
50% subsidy. The total cost for this proposal is Rs.65.00 lakhs. This programme will be
implemented by the Dairy Development Department.
The Department of Animal Husbandry will distribute 233700 kgs of mineral
mixture to dairy cattle for four years. The total cost will be Rs.93.48 lakhs.
The Department of Dairy Development will distribute bypass protein feed to high
yielding milch animals(360kg/animal/year) at 50% subsidized cost of Rs 9/kg. A total of
1000 animals will be covered in 4 years at the total cost of Rs.33.00 lakhs.
The Department of Dairy Department will distribute small sized 100 chaff cutters
to elite farmers at 100% subsidy in the unit cost of Rs. 0.20 lakh each. The total cost will
be Rs.20.00 lakh.
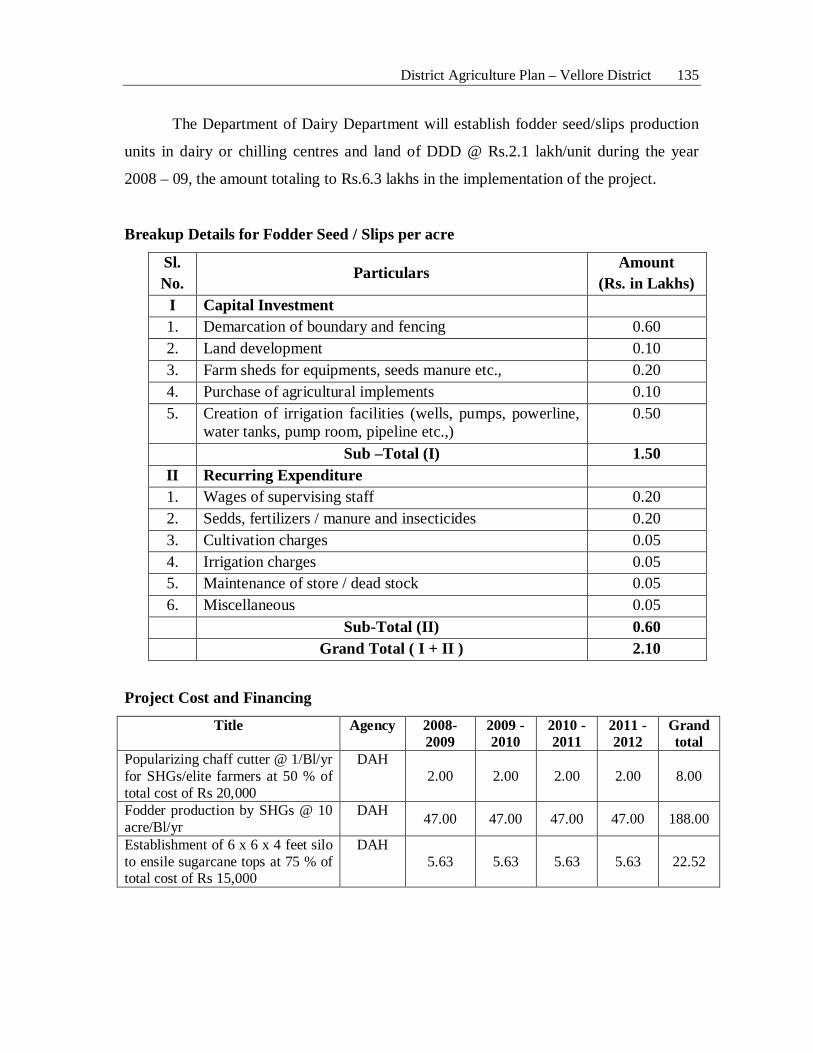
District Agriculture Plan – Vellore District 135
The Department of Dairy Department will establish fodder seed/slips production
units in dairy or chilling centres and land of DDD @ Rs.2.1 lakh/unit during the year
2008 – 09, the amount totaling to Rs.6.3 lakhs in the implementation of the project.
Breakup Details for Fodder Seed / Slips per acre
Sl. No. Particulars Amount
(Rs. in Lakhs) I Capital Investment 1. Demarcation of boundary and fencing 0.60 2. Land development 0.10 3. Farm sheds for equipments, seeds manure etc., 0.20 4. Purchase of agricultural implements 0.10 5. Creation of irrigation facilities (wells, pumps, powerline,
water tanks, pump room, pipeline etc.,) 0.50
Sub –Total (I) 1.50 II Recurring Expenditure 1. Wages of supervising staff 0.20 2. Sedds, fertilizers / manure and insecticides 0.20 3. Cultivation charges 0.05 4. Irrigation charges 0.05 5. Maintenance of store / dead stock 0.05 6. Miscellaneous 0.05 Sub-Total (II) 0.60
Grand Total ( I + II ) 2.10
Project Cost and Financing
Title Agency 2008-2009
2009 - 2010
2010 - 2011
2011 - 2012
Grand total
Popularizing chaff cutter @ 1/Bl/yr for SHGs/elite farmers at 50 % of total cost of Rs 20,000
DAH 2.00 2.00 2.00 2.00 8.00
Fodder production by SHGs @ 10 acre/Bl/yr
DAH 47.00 47.00 47.00 47.00 188.00
Establishment of 6 x 6 x 4 feet silo to ensile sugarcane tops at 75 % of total cost of Rs 15,000
DAH 5.63 5.63 5.63 5.63 22.52
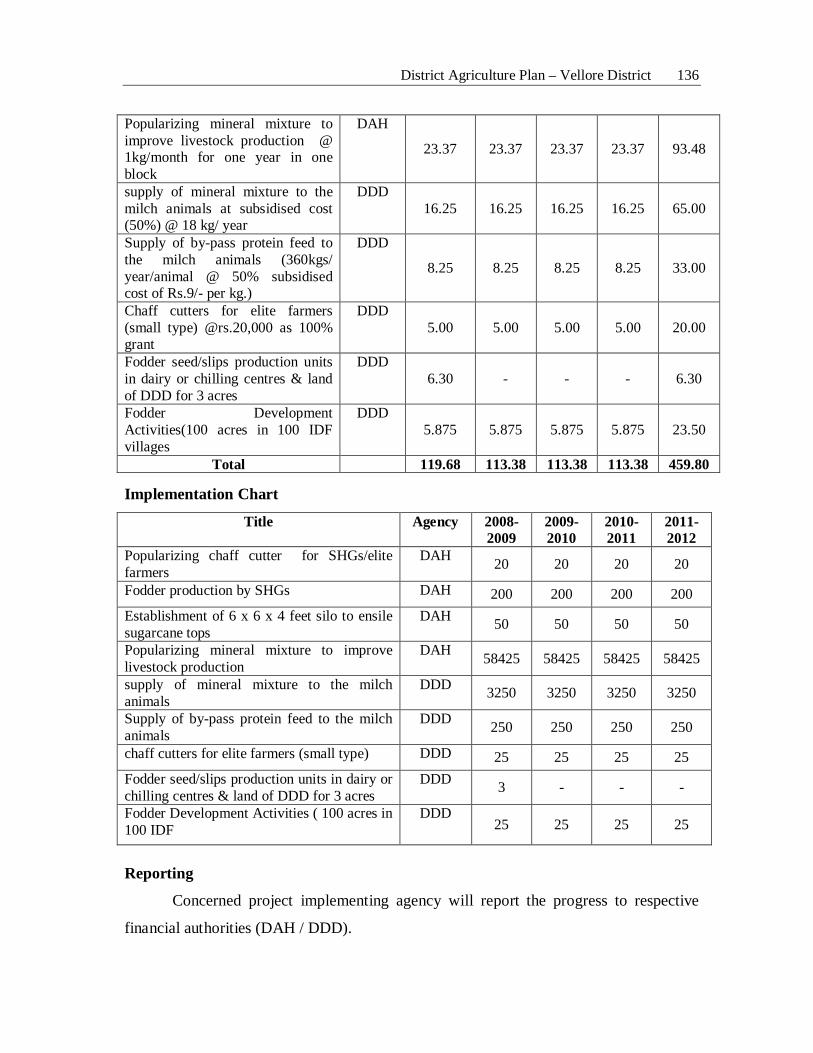
District Agriculture Plan – Vellore District 136
Popularizing mineral mixture to improve livestock production @ 1kg/month for one year in one block
DAH
23.37 23.37 23.37 23.37 93.48
supply of mineral mixture to the milch animals at subsidised cost (50%) @ 18 kg/ year
DDD 16.25 16.25 16.25 16.25 65.00
Supply of by-pass protein feed to the milch animals (360kgs/ year/animal @ 50% subsidised cost of Rs.9/- per kg.)
DDD
8.25 8.25 8.25 8.25 33.00
Chaff cutters for elite farmers (small type) @rs.20,000 as 100% grant
DDD 5.00 5.00 5.00 5.00 20.00
Fodder seed/slips production units in dairy or chilling centres & land of DDD for 3 acres
DDD 6.30 - - - 6.30
Fodder Development Activities(100 acres in 100 IDF villages
DDD 5.875 5.875 5.875 5.875 23.50
Total 119.68 113.38 113.38 113.38 459.80
Implementation Chart
Title Agency 2008-2009
2009-2010
2010-2011
2011-2012
Popularizing chaff cutter for SHGs/elite farmers
DAH 20 20 20 20
Fodder production by SHGs DAH 200 200 200 200 Establishment of 6 x 6 x 4 feet silo to ensile sugarcane tops
DAH 50 50 50 50
Popularizing mineral mixture to improve livestock production
DAH 58425 58425 58425 58425
supply of mineral mixture to the milch animals
DDD 3250 3250 3250 3250
Supply of by-pass protein feed to the milch animals
DDD 250 250 250 250
chaff cutters for elite farmers (small type) DDD 25 25 25 25 Fodder seed/slips production units in dairy or chilling centres & land of DDD for 3 acres
DDD 3 - - -
Fodder Development Activities ( 100 acres in 100 IDF
DDD 25 25 25 25
Reporting
Concerned project implementing agency will report the progress to respective
financial authorities (DAH / DDD).
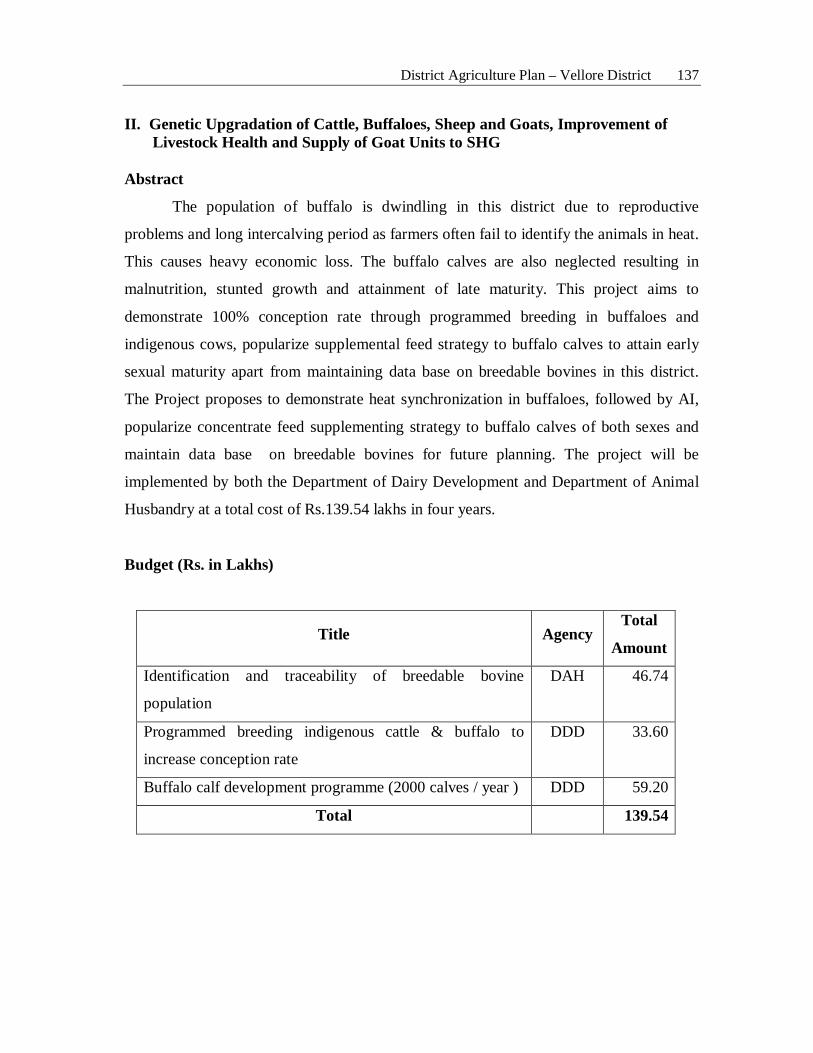
District Agriculture Plan – Vellore District 137
II. Genetic Upgradation of Cattle, Buffaloes, Sheep and Goats, Improvement of Livestock Health and Supply of Goat Units to SHG Abstract
The population of buffalo is dwindling in this district due to reproductive
problems and long intercalving period as farmers often fail to identify the animals in heat.
This causes heavy economic loss. The buffalo calves are also neglected resulting in
malnutrition, stunted growth and attainment of late maturity. This project aims to
demonstrate 100% conception rate through programmed breeding in buffaloes and
indigenous cows, popularize supplemental feed strategy to buffalo calves to attain early
sexual maturity apart from maintaining data base on breedable bovines in this district.
The Project proposes to demonstrate heat synchronization in buffaloes, followed by AI,
popularize concentrate feed supplementing strategy to buffalo calves of both sexes and
maintain data base on breedable bovines for future planning. The project will be
implemented by both the Department of Dairy Development and Department of Animal
Husbandry at a total cost of Rs.139.54 lakhs in four years.
Budget (Rs. in Lakhs)
Title Agency Total
Amount
Identification and traceability of breedable bovine
population
DAH 46.74
Programmed breeding indigenous cattle & buffalo to
increase conception rate
DDD 33.60
Buffalo calf development programme (2000 calves / year ) DDD 59.20
Total 139.54
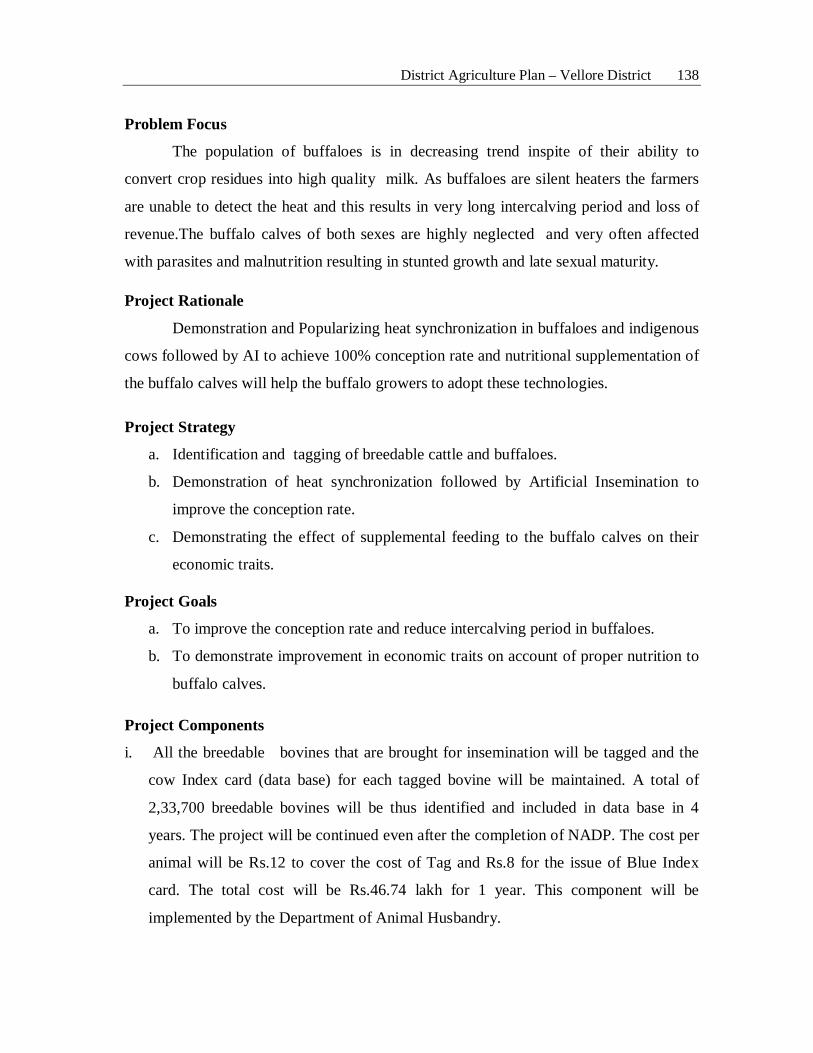
District Agriculture Plan – Vellore District 138
Problem Focus
The population of buffaloes is in decreasing trend inspite of their ability to
convert crop residues into high quality milk. As buffaloes are silent heaters the farmers
are unable to detect the heat and this results in very long intercalving period and loss of
revenue.The buffalo calves of both sexes are highly neglected and very often affected
with parasites and malnutrition resulting in stunted growth and late sexual maturity.
Project Rationale
Demonstration and Popularizing heat synchronization in buffaloes and indigenous
cows followed by AI to achieve 100% conception rate and nutritional supplementation of
the buffalo calves will help the buffalo growers to adopt these technologies.
Project Strategy
a. Identification and tagging of breedable cattle and buffaloes.
b. Demonstration of heat synchronization followed by Artificial Insemination to
improve the conception rate.
c. Demonstrating the effect of supplemental feeding to the buffalo calves on their
economic traits.
Project Goals
a. To improve the conception rate and reduce intercalving period in buffaloes.
b. To demonstrate improvement in economic traits on account of proper nutrition to
buffalo calves.
Project Components
i. All the breedable bovines that are brought for insemination will be tagged and the
cow Index card (data base) for each tagged bovine will be maintained. A total of
2,33,700 breedable bovines will be thus identified and included in data base in 4
years. The project will be continued even after the completion of NADP. The cost per
animal will be Rs.12 to cover the cost of Tag and Rs.8 for the issue of Blue Index
card. The total cost will be Rs.46.74 lakh for 1 year. This component will be
implemented by the Department of Animal Husbandry.
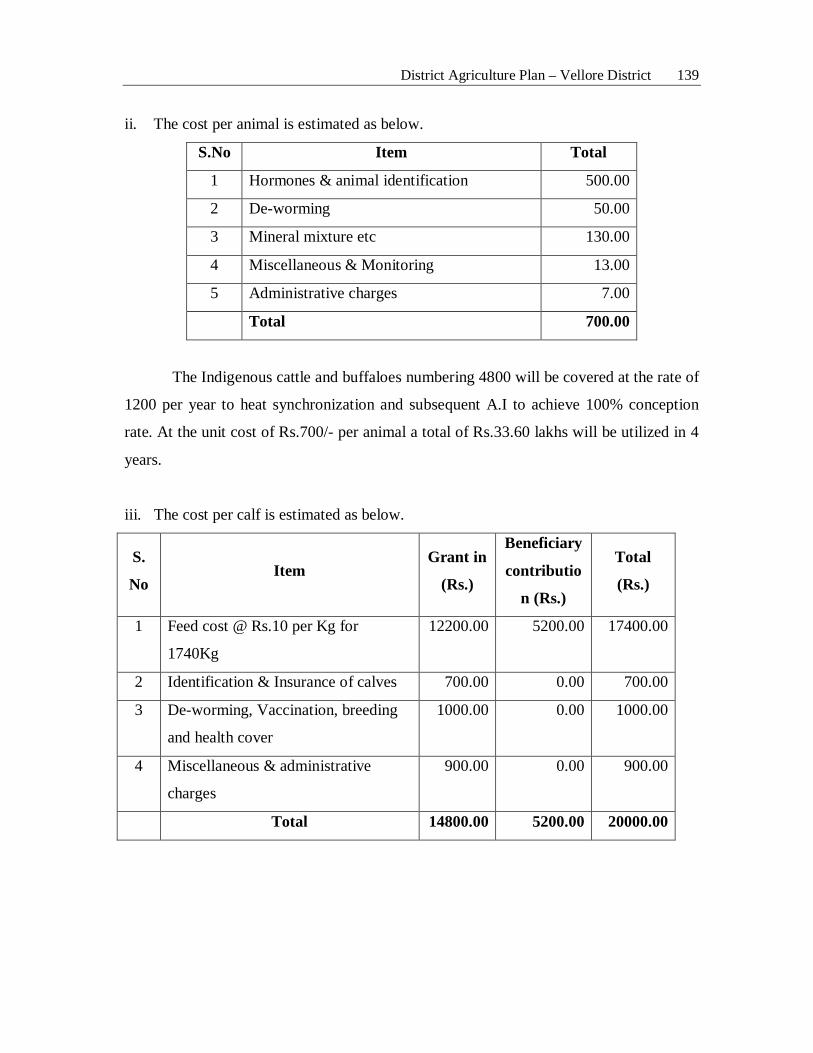
District Agriculture Plan – Vellore District 139
ii. The cost per animal is estimated as below.
S.No Item Total
1 Hormones & animal identification 500.00
2 De-worming 50.00
3 Mineral mixture etc 130.00
4 Miscellaneous & Monitoring 13.00
5 Administrative charges 7.00
Total 700.00
The Indigenous cattle and buffaloes numbering 4800 will be covered at the rate of
1200 per year to heat synchronization and subsequent A.I to achieve 100% conception
rate. At the unit cost of Rs.700/- per animal a total of Rs.33.60 lakhs will be utilized in 4
years.
iii. The cost per calf is estimated as below.
S.
No Item
Grant in
(Rs.)
Beneficiary
contributio
n (Rs.)
Total
(Rs.)
1 Feed cost @ Rs.10 per Kg for
1740Kg
12200.00 5200.00 17400.00
2 Identification & Insurance of calves 700.00 0.00 700.00
3 De-worming, Vaccination, breeding
and health cover
1000.00 0.00 1000.00
4 Miscellaneous & administrative
charges
900.00 0.00 900.00
Total 14800.00 5200.00 20000.00
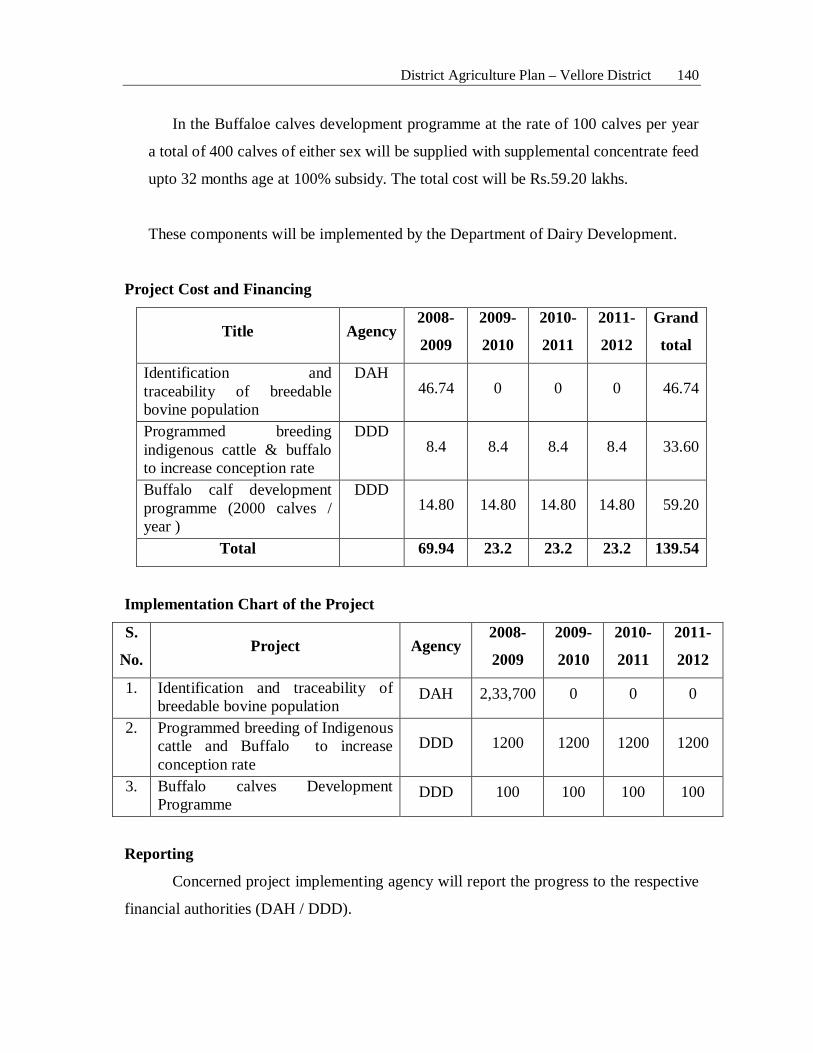
District Agriculture Plan – Vellore District 140
In the Buffaloe calves development programme at the rate of 100 calves per year
a total of 400 calves of either sex will be supplied with supplemental concentrate feed
upto 32 months age at 100% subsidy. The total cost will be Rs.59.20 lakhs.
These components will be implemented by the Department of Dairy Development.
Project Cost and Financing
Title Agency 2008-
2009
2009-
2010
2010-
2011
2011-
2012
Grand
total
Identification and traceability of breedable bovine population
DAH
46.74 0 0 0 46.74
Programmed breeding indigenous cattle & buffalo to increase conception rate
DDD 8.4 8.4 8.4 8.4 33.60
Buffalo calf development programme (2000 calves / year )
DDD 14.80 14.80 14.80 14.80 59.20
Total 69.94 23.2 23.2 23.2 139.54
Implementation Chart of the Project
S.
No. Project Agency
2008-
2009
2009-
2010
2010-
2011
2011-
2012
1. Identification and traceability of breedable bovine population
DAH 2,33,700 0 0 0
2. Programmed breeding of Indigenous cattle and Buffalo to increase conception rate
DDD 1200 1200 1200 1200
3. Buffalo calves Development Programme
DDD 100 100 100 100
Reporting
Concerned project implementing agency will report the progress to the respective
financial authorities (DAH / DDD).
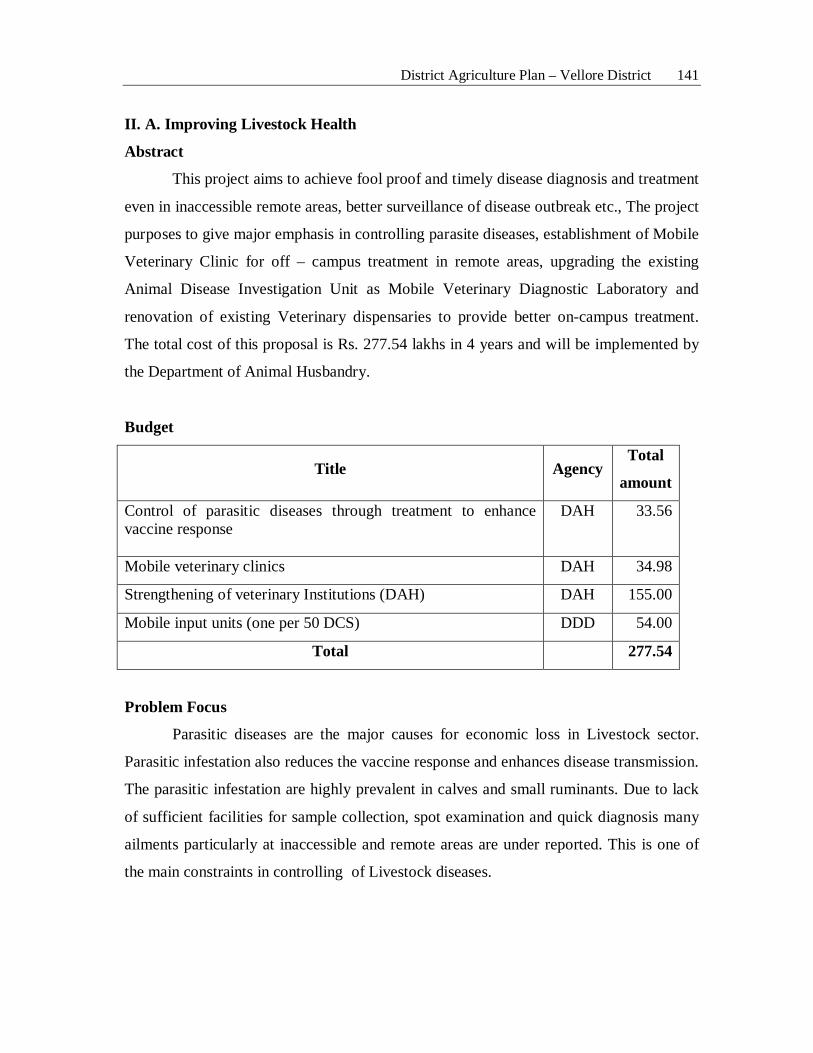
District Agriculture Plan – Vellore District 141
II. A. Improving Livestock Health
Abstract
This project aims to achieve fool proof and timely disease diagnosis and treatment
even in inaccessible remote areas, better surveillance of disease outbreak etc., The project
purposes to give major emphasis in controlling parasite diseases, establishment of Mobile
Veterinary Clinic for off – campus treatment in remote areas, upgrading the existing
Animal Disease Investigation Unit as Mobile Veterinary Diagnostic Laboratory and
renovation of existing Veterinary dispensaries to provide better on-campus treatment.
The total cost of this proposal is Rs. 277.54 lakhs in 4 years and will be implemented by
the Department of Animal Husbandry.
Budget
Title Agency Total
amount
Control of parasitic diseases through treatment to enhance vaccine response
DAH 33.56
Mobile veterinary clinics DAH 34.98
Strengthening of veterinary Institutions (DAH) DAH 155.00
Mobile input units (one per 50 DCS) DDD 54.00
Total 277.54
Problem Focus
Parasitic diseases are the major causes for economic loss in Livestock sector.
Parasitic infestation also reduces the vaccine response and enhances disease transmission.
The parasitic infestation are highly prevalent in calves and small ruminants. Due to lack
of sufficient facilities for sample collection, spot examination and quick diagnosis many
ailments particularly at inaccessible and remote areas are under reported. This is one of
the main constraints in controlling of Livestock diseases.
District Agriculture Plan – Vellore District 142
Project Rationale
Provision of timely and quick disease diagnostic facilities even in inaccessible
and remote areas where livestock population is concentrated will not only control
livestock disease outbreak but also reduce economic loss.
Project Strategy
1. Providing foolproof off–campus Veterinary facilities through mobile veterinary
clinics
2. Strengthening of mobile input units for providing livestock health care
3. Renovation of existing Veterinary dispensaries to provide on–campus quality
Veterinary service to Livestock
Project Goal
1. To achieve timely disease diagnosis and control of diseases even is inaccessible
remote areas.
2. To ensure better surveillance and prevention of disease out break.
3. To minimize economic loss in Livestock sector due to diseases.
Project Components
Control of parasitic diseases through treatment to increase vaccine response.
In order to avoid such suffering and loss to the farmers and to provide veterinary
services and breeding support in time at the doorsteps of the farmers, Mobile Veterinary
Clinics are proposed at the block headquarters of all the districts except in places where
the units are already functioning.
Each unit will consist of one Veterinary Assistant Surgeon, and 1 driver. The staff
for the Mobile Veterinary Clinic will be sourced from the available staff in the
department.
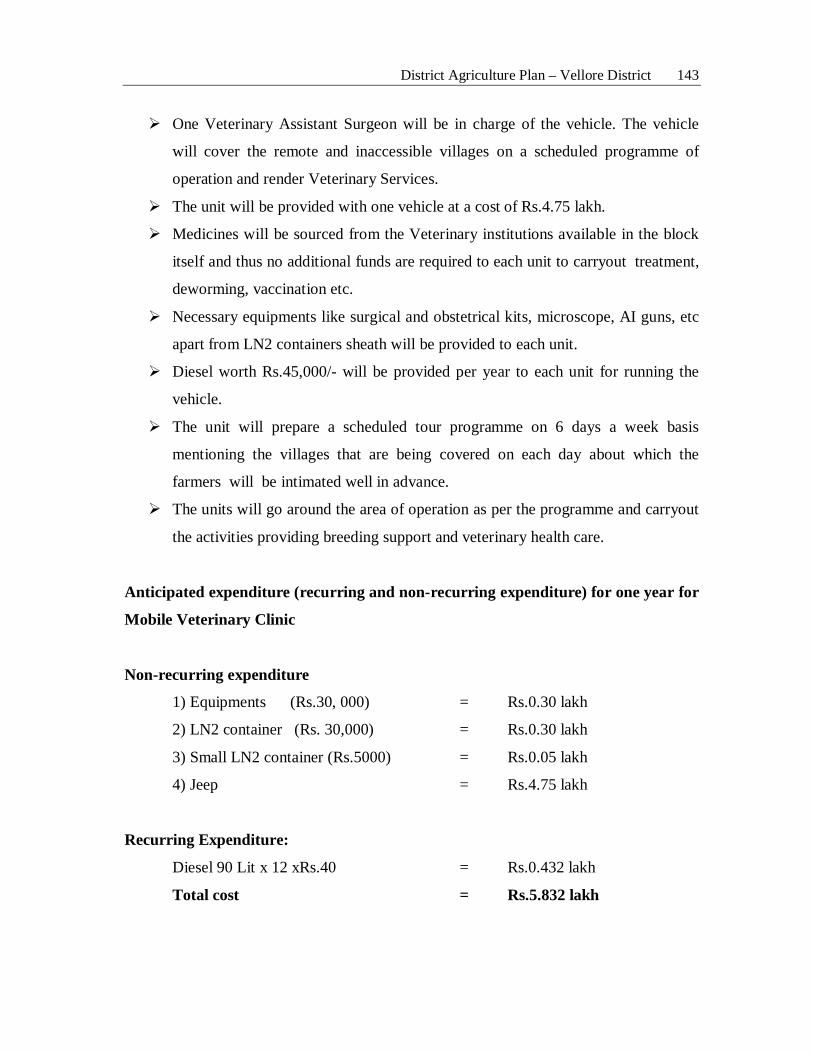
District Agriculture Plan – Vellore District 143
One Veterinary Assistant Surgeon will be in charge of the vehicle. The vehicle
will cover the remote and inaccessible villages on a scheduled programme of
operation and render Veterinary Services.
The unit will be provided with one vehicle at a cost of Rs.4.75 lakh.
Medicines will be sourced from the Veterinary institutions available in the block
itself and thus no additional funds are required to each unit to carryout treatment,
deworming, vaccination etc.
Necessary equipments like surgical and obstetrical kits, microscope, AI guns, etc
apart from LN2 containers sheath will be provided to each unit.
Diesel worth Rs.45,000/- will be provided per year to each unit for running the
vehicle.
The unit will prepare a scheduled tour programme on 6 days a week basis
mentioning the villages that are being covered on each day about which the
farmers will be intimated well in advance.
The units will go around the area of operation as per the programme and carryout
the activities providing breeding support and veterinary health care.
Anticipated expenditure (recurring and non-recurring expenditure) for one year for
Mobile Veterinary Clinic
Non-recurring expenditure
1) Equipments (Rs.30, 000) = Rs.0.30 lakh
2) LN2 container (Rs. 30,000) = Rs.0.30 lakh
3) Small LN2 container (Rs.5000) = Rs.0.05 lakh
4) Jeep = Rs.4.75 lakh
Recurring Expenditure:
Diesel 90 Lit x 12 xRs.40 = Rs.0.432 lakh
Total cost = Rs.5.832 lakh
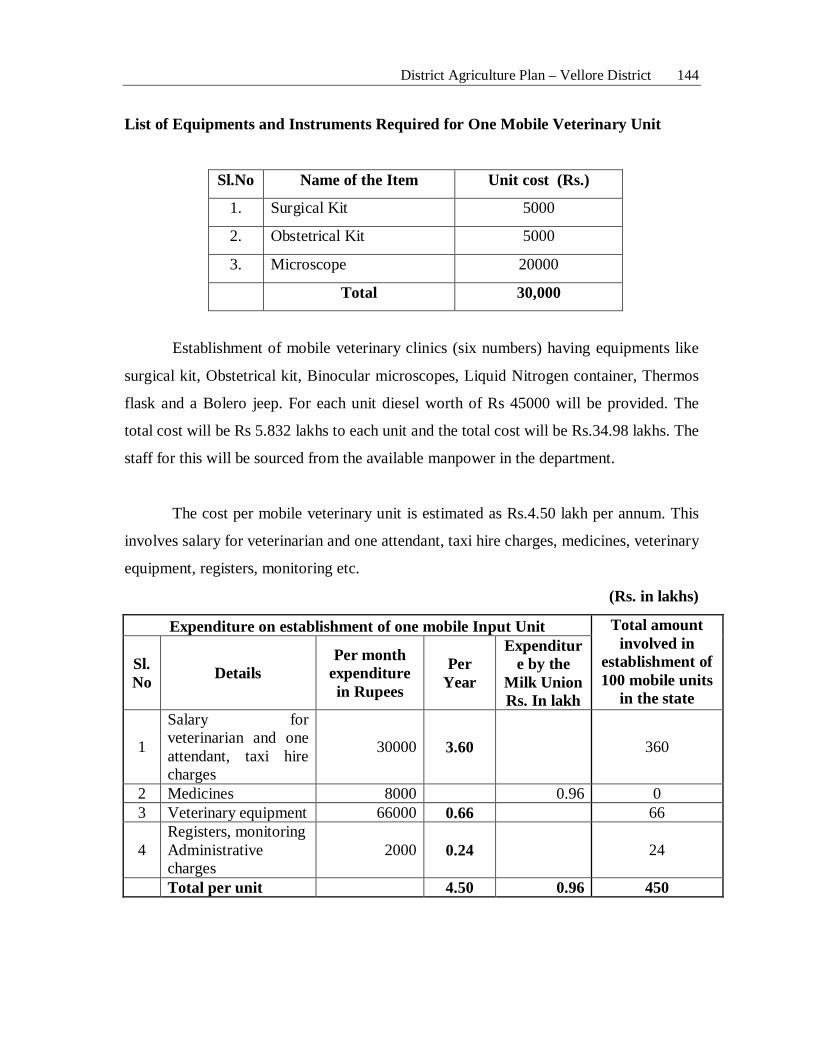
District Agriculture Plan – Vellore District 144
List of Equipments and Instruments Required for One Mobile Veterinary Unit
Sl.No Name of the Item Unit cost (Rs.)
1. Surgical Kit 5000
2. Obstetrical Kit 5000
3. Microscope 20000
Total 30,000
Establishment of mobile veterinary clinics (six numbers) having equipments like
surgical kit, Obstetrical kit, Binocular microscopes, Liquid Nitrogen container, Thermos
flask and a Bolero jeep. For each unit diesel worth of Rs 45000 will be provided. The
total cost will be Rs 5.832 lakhs to each unit and the total cost will be Rs.34.98 lakhs. The
staff for this will be sourced from the available manpower in the department.
The cost per mobile veterinary unit is estimated as Rs.4.50 lakh per annum. This
involves salary for veterinarian and one attendant, taxi hire charges, medicines, veterinary
equipment, registers, monitoring etc.
(Rs. in lakhs)
Expenditure on establishment of one mobile Input Unit Total amount involved in
establishment of 100 mobile units
in the state
Sl. No Details
Per month expenditure in Rupees
Per Year
Expenditure by the
Milk Union Rs. In lakh
1
Salary for veterinarian and one attendant, taxi hire charges
30000 3.60 360
2 Medicines 8000 0.96 0 3 Veterinary equipment 66000 0.66 66
4 Registers, monitoring Administrative charges
2000 0.24 24
Total per unit 4.50 0.96 450
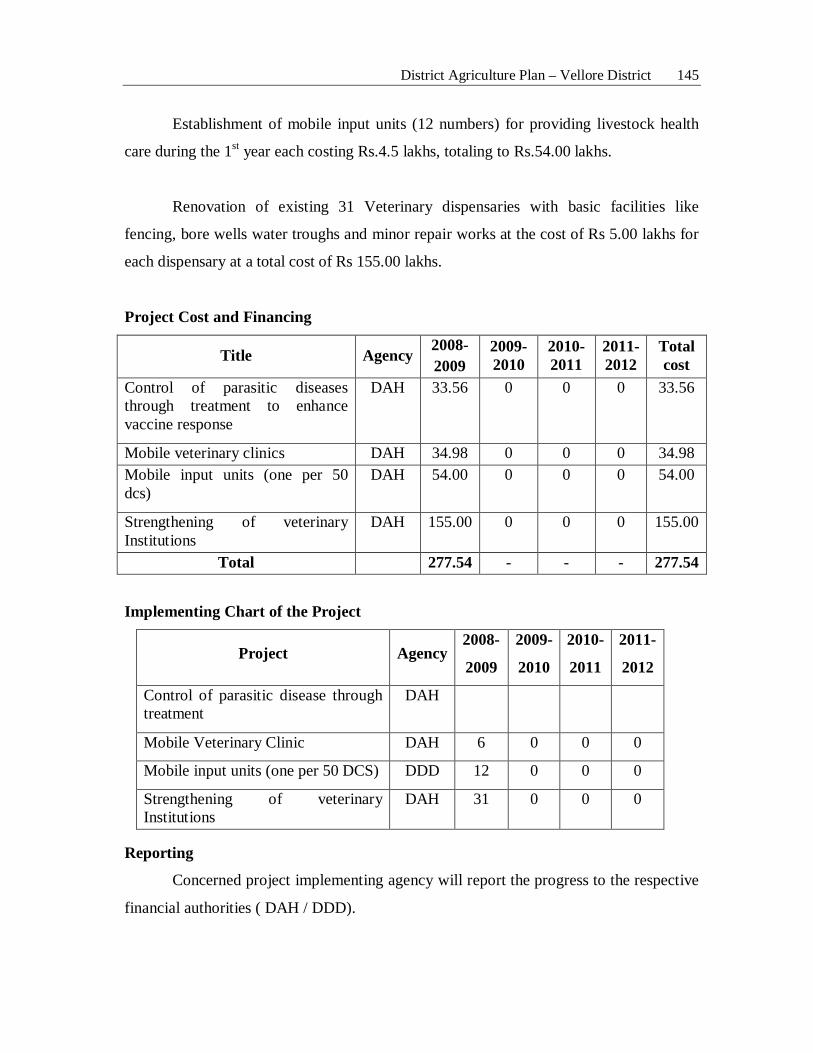
District Agriculture Plan – Vellore District 145
Establishment of mobile input units (12 numbers) for providing livestock health
care during the 1st
year each costing Rs.4.5 lakhs, totaling to Rs.54.00 lakhs.
Renovation of existing 31 Veterinary dispensaries with basic facilities like
fencing, bore wells water troughs and minor repair works at the cost of Rs 5.00 lakhs for
each dispensary at a total cost of Rs 155.00 lakhs.
Project Cost and Financing
Title Agency 2008- 2009
2009-2010
2010-2011
2011-2012
Total cost
Control of parasitic diseases through treatment to enhance vaccine response
DAH 33.56 0 0 0 33.56
Mobile veterinary clinics DAH 34.98 0 0 0 34.98 Mobile input units (one per 50 dcs)
DAH 54.00 0 0 0 54.00
Strengthening of veterinary Institutions
DAH 155.00 0 0 0 155.00
Total 277.54 - - - 277.54
Implementing Chart of the Project
Project Agency 2008-
2009
2009-
2010
2010-
2011
2011-
2012
Control of parasitic disease through treatment
DAH
Mobile Veterinary Clinic DAH 6 0 0 0
Mobile input units (one per 50 DCS) DDD 12 0 0 0
Strengthening of veterinary Institutions
DAH 31 0 0 0
Reporting
Concerned project implementing agency will report the progress to the respective
financial authorities ( DAH / DDD).
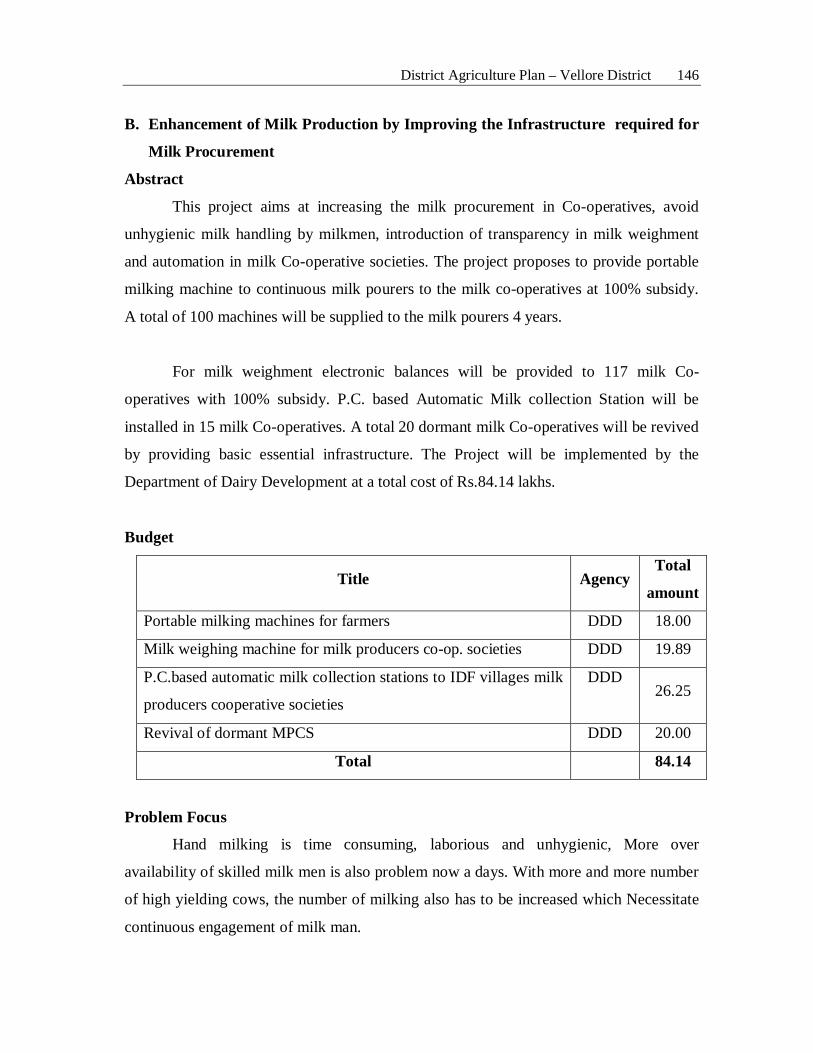
District Agriculture Plan – Vellore District 146
B. Enhancement of Milk Production by Improving the Infrastructure required for
Milk Procurement
Abstract
This project aims at increasing the milk procurement in Co-operatives, avoid
unhygienic milk handling by milkmen, introduction of transparency in milk weighment
and automation in milk Co-operative societies. The project proposes to provide portable
milking machine to continuous milk pourers to the milk co-operatives at 100% subsidy.
A total of 100 machines will be supplied to the milk pourers 4 years.
For milk weighment electronic balances will be provided to 117 milk Co-
operatives with 100% subsidy. P.C. based Automatic Milk collection Station will be
installed in 15 milk Co-operatives. A total 20 dormant milk Co-operatives will be revived
by providing basic essential infrastructure. The Project will be implemented by the
Department of Dairy Development at a total cost of Rs.84.14 lakhs.
Budget
Title Agency Total
amount
Portable milking machines for farmers DDD 18.00
Milk weighing machine for milk producers co-op. societies DDD 19.89
P.C.based automatic milk collection stations to IDF villages milk
producers cooperative societies
DDD 26.25
Revival of dormant MPCS DDD 20.00
Total 84.14
Problem Focus
Hand milking is time consuming, laborious and unhygienic, More over
availability of skilled milk men is also problem now a days. With more and more number
of high yielding cows, the number of milking also has to be increased which Necessitate
continuous engagement of milk man.
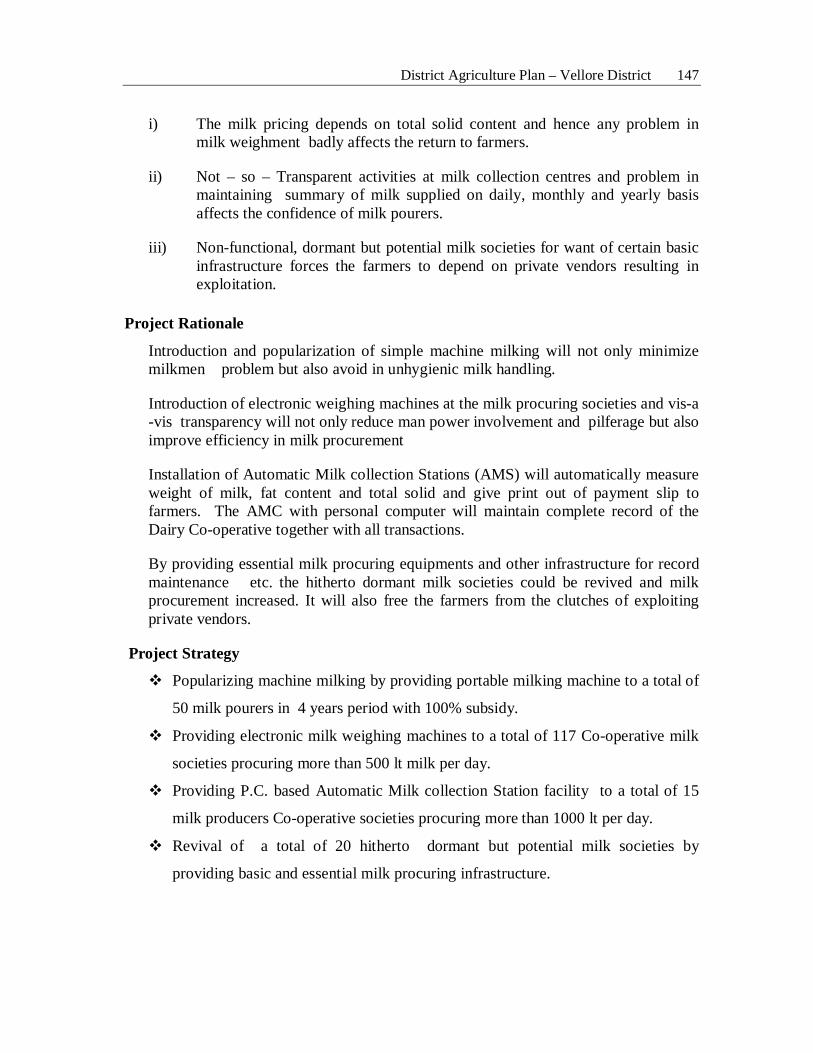
District Agriculture Plan – Vellore District 147
i) The milk pricing depends on total solid content and hence any problem in milk weighment badly affects the return to farmers.
ii) Not – so – Transparent activities at milk collection centres and problem in maintaining summary of milk supplied on daily, monthly and yearly basis affects the confidence of milk pourers.
iii) Non-functional, dormant but potential milk societies for want of certain basic infrastructure forces the farmers to depend on private vendors resulting in exploitation.
Project Rationale
Introduction and popularization of simple machine milking will not only minimize milkmen problem but also avoid in unhygienic milk handling.
Introduction of electronic weighing machines at the milk procuring societies and vis-a -vis transparency will not only reduce man power involvement and pilferage but also improve efficiency in milk procurement
Installation of Automatic Milk collection Stations (AMS) will automatically measure weight of milk, fat content and total solid and give print out of payment slip to farmers. The AMC with personal computer will maintain complete record of the Dairy Co-operative together with all transactions.
By providing essential milk procuring equipments and other infrastructure for record maintenance etc. the hitherto dormant milk societies could be revived and milk procurement increased. It will also free the farmers from the clutches of exploiting private vendors.
Project Strategy
Popularizing machine milking by providing portable milking machine to a total of
50 milk pourers in 4 years period with 100% subsidy.
Providing electronic milk weighing machines to a total of 117 Co-operative milk
societies procuring more than 500 lt milk per day.
Providing P.C. based Automatic Milk collection Station facility to a total of 15
milk producers Co-operative societies procuring more than 1000 lt per day.
Revival of a total of 20 hitherto dormant but potential milk societies by
providing basic and essential milk procuring infrastructure.
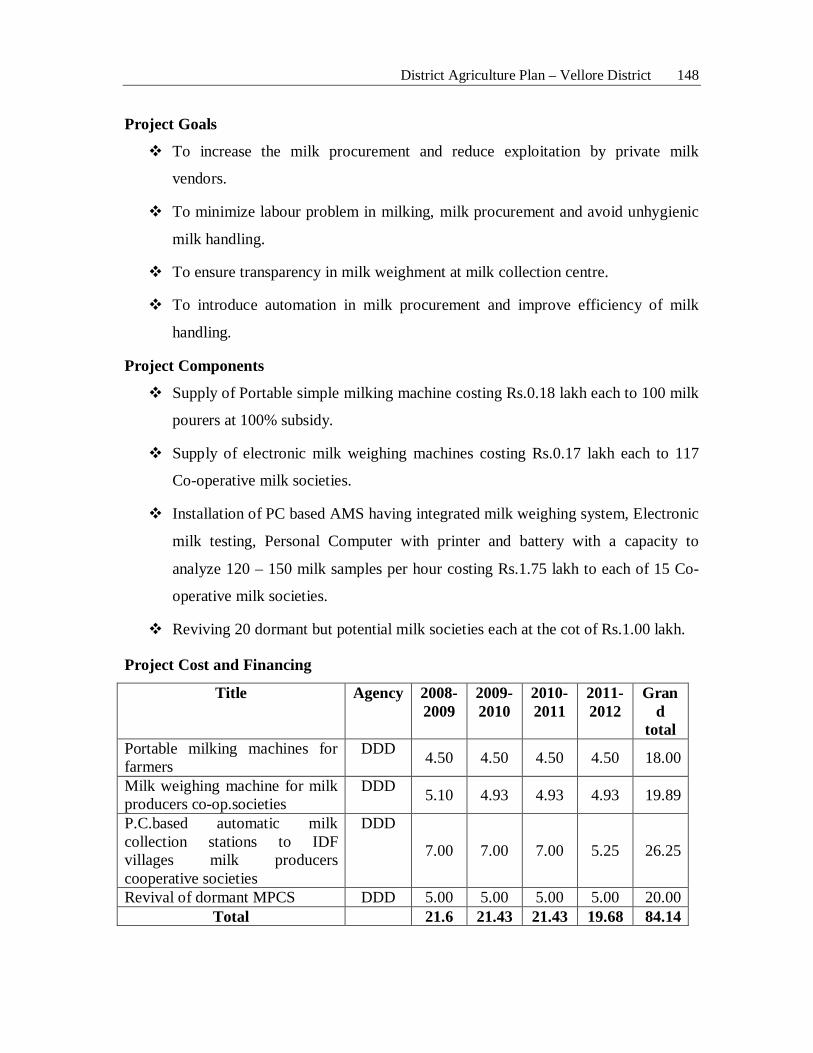
District Agriculture Plan – Vellore District 148
Project Goals
To increase the milk procurement and reduce exploitation by private milk
vendors.
To minimize labour problem in milking, milk procurement and avoid unhygienic
milk handling.
To ensure transparency in milk weighment at milk collection centre.
To introduce automation in milk procurement and improve efficiency of milk
handling.
Project Components
Supply of Portable simple milking machine costing Rs.0.18 lakh each to 100 milk
pourers at 100% subsidy.
Supply of electronic milk weighing machines costing Rs.0.17 lakh each to 117
Co-operative milk societies.
Installation of PC based AMS having integrated milk weighing system, Electronic
milk testing, Personal Computer with printer and battery with a capacity to
analyze 120 – 150 milk samples per hour costing Rs.1.75 lakh to each of 15 Co-
operative milk societies.
Reviving 20 dormant but potential milk societies each at the cot of Rs.1.00 lakh.
Project Cost and Financing
Title Agency 2008- 2009
2009-2010
2010-2011
2011-2012
Grand
total Portable milking machines for farmers
DDD 4.50 4.50 4.50 4.50 18.00
Milk weighing machine for milk producers co-op.societies
DDD 5.10 4.93 4.93 4.93 19.89
P.C.based automatic milk collection stations to IDF villages milk producers cooperative societies
DDD
7.00 7.00 7.00 5.25 26.25
Revival of dormant MPCS DDD 5.00 5.00 5.00 5.00 20.00 Total 21.6 21.43 21.43 19.68 84.14
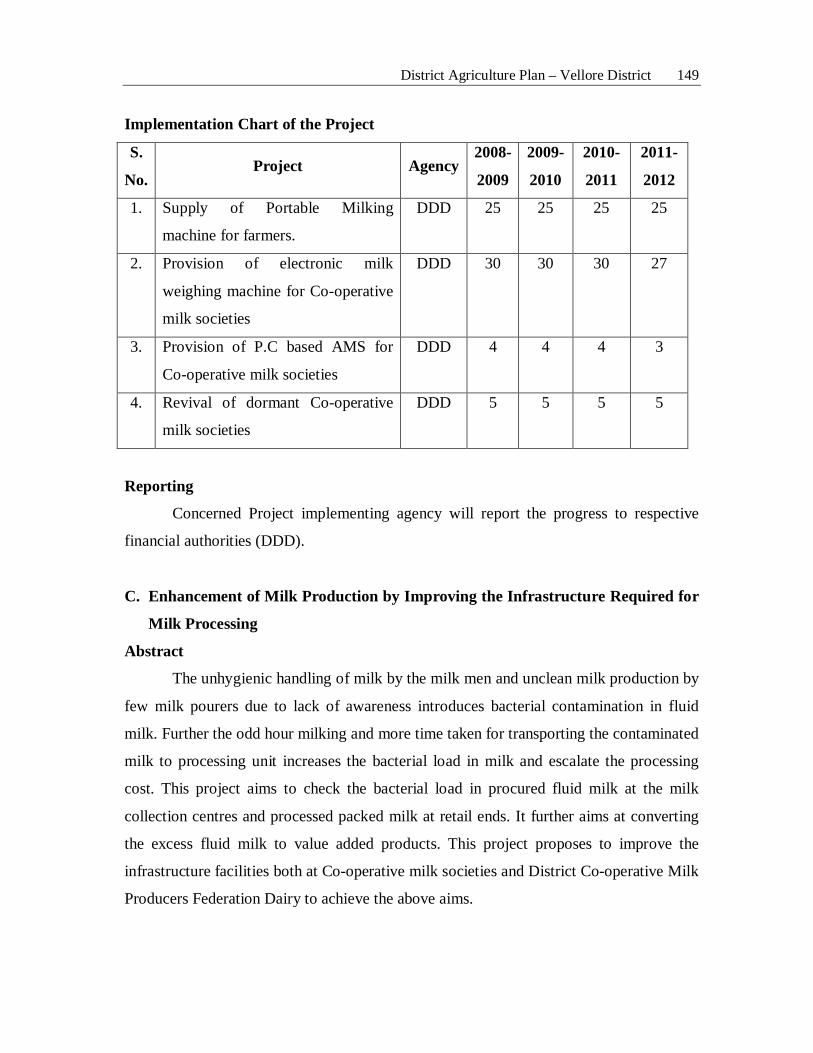
District Agriculture Plan – Vellore District 149
Implementation Chart of the Project
S.
No. Project Agency
2008-
2009
2009-
2010
2010-
2011
2011-
2012
1. Supply of Portable Milking
machine for farmers.
DDD 25 25 25 25
2. Provision of electronic milk
weighing machine for Co-operative
milk societies
DDD 30 30 30 27
3. Provision of P.C based AMS for
Co-operative milk societies
DDD 4 4 4 3
4. Revival of dormant Co-operative
milk societies
DDD 5 5 5 5
Reporting
Concerned Project implementing agency will report the progress to respective
financial authorities (DDD).
C. Enhancement of Milk Production by Improving the Infrastructure Required for
Milk Processing
Abstract
The unhygienic handling of milk by the milk men and unclean milk production by
few milk pourers due to lack of awareness introduces bacterial contamination in fluid
milk. Further the odd hour milking and more time taken for transporting the contaminated
milk to processing unit increases the bacterial load in milk and escalate the processing
cost. This project aims to check the bacterial load in procured fluid milk at the milk
collection centres and processed packed milk at retail ends. It further aims at converting
the excess fluid milk to value added products. This project proposes to improve the
infrastructure facilities both at Co-operative milk societies and District Co-operative Milk
Producers Federation Dairy to achieve the above aims.
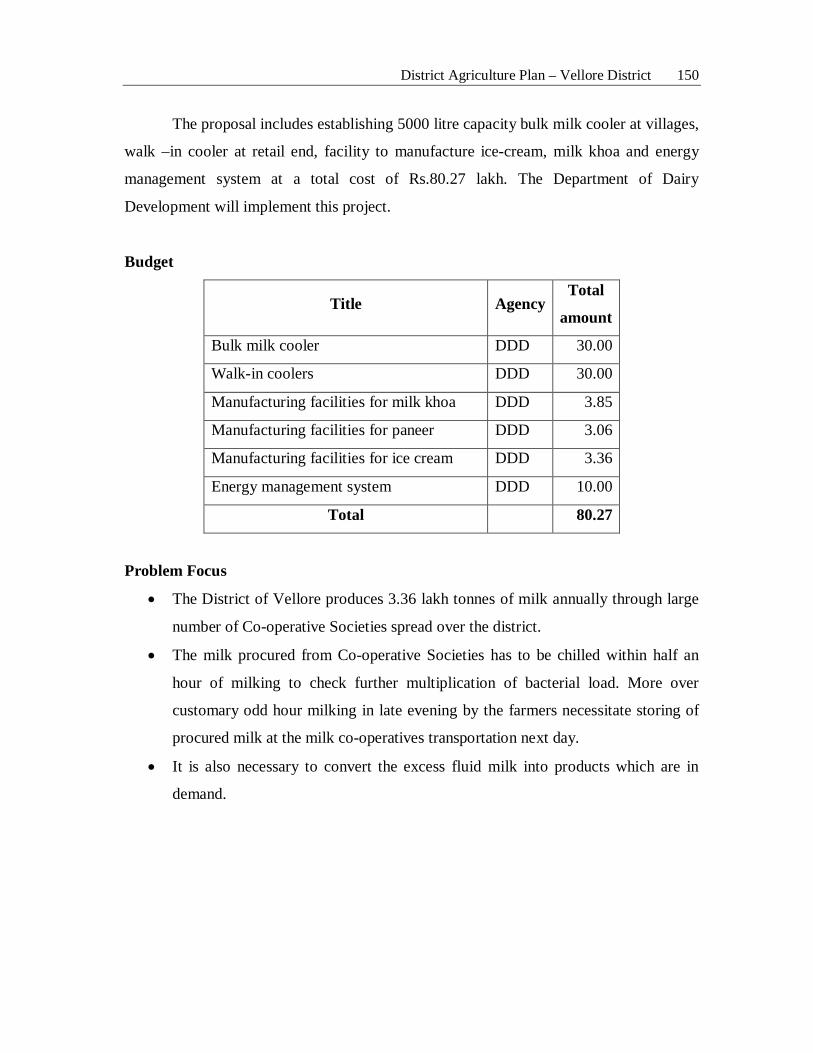
District Agriculture Plan – Vellore District 150
The proposal includes establishing 5000 litre capacity bulk milk cooler at villages,
walk –in cooler at retail end, facility to manufacture ice-cream, milk khoa and energy
management system at a total cost of Rs.80.27 lakh. The Department of Dairy
Development will implement this project.
Budget
Title Agency Total
amount
Bulk milk cooler DDD 30.00
Walk-in coolers DDD 30.00
Manufacturing facilities for milk khoa DDD 3.85
Manufacturing facilities for paneer DDD 3.06
Manufacturing facilities for ice cream DDD 3.36
Energy management system DDD 10.00
Total 80.27
Problem Focus
• The District of Vellore produces 3.36 lakh tonnes of milk annually through large
number of Co-operative Societies spread over the district.
• The milk procured from Co-operative Societies has to be chilled within half an
hour of milking to check further multiplication of bacterial load. More over
customary odd hour milking in late evening by the farmers necessitate storing of
procured milk at the milk co-operatives transportation next day.
• It is also necessary to convert the excess fluid milk into products which are in
demand.
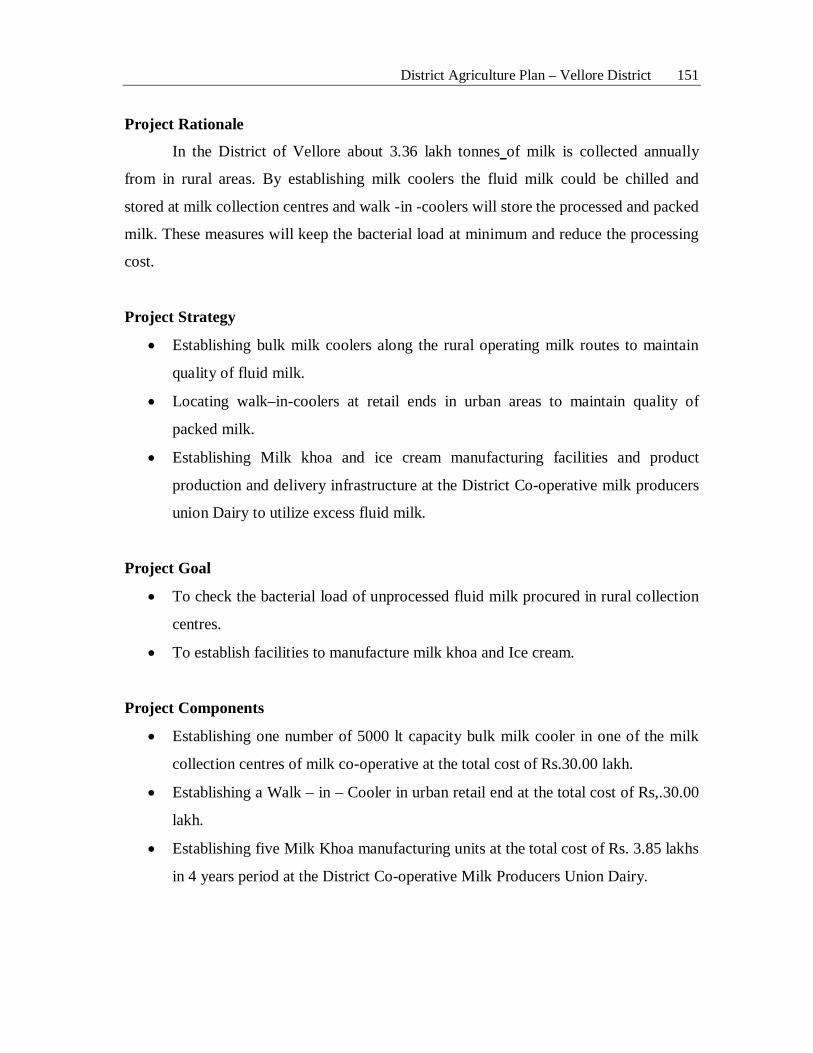
District Agriculture Plan – Vellore District 151
Project Rationale
In the District of Vellore about 3.36 lakh tonnes of milk is collected annually
from in rural areas. By establishing milk coolers the fluid milk could be chilled and
stored at milk collection centres and walk -in -coolers will store the processed and packed
milk. These measures will keep the bacterial load at minimum and reduce the processing
cost.
Project Strategy
• Establishing bulk milk coolers along the rural operating milk routes to maintain
quality of fluid milk.
• Locating walk–in-coolers at retail ends in urban areas to maintain quality of
packed milk.
• Establishing Milk khoa and ice cream manufacturing facilities and product
production and delivery infrastructure at the District Co-operative milk producers
union Dairy to utilize excess fluid milk.
Project Goal
• To check the bacterial load of unprocessed fluid milk procured in rural collection
centres.
• To establish facilities to manufacture milk khoa and Ice cream.
Project Components
• Establishing one number of 5000 lt capacity bulk milk cooler in one of the milk
collection centres of milk co-operative at the total cost of Rs.30.00 lakh.
• Establishing a Walk – in – Cooler in urban retail end at the total cost of Rs,.30.00
lakh.
• Establishing five Milk Khoa manufacturing units at the total cost of Rs. 3.85 lakhs
in 4 years period at the District Co-operative Milk Producers Union Dairy.
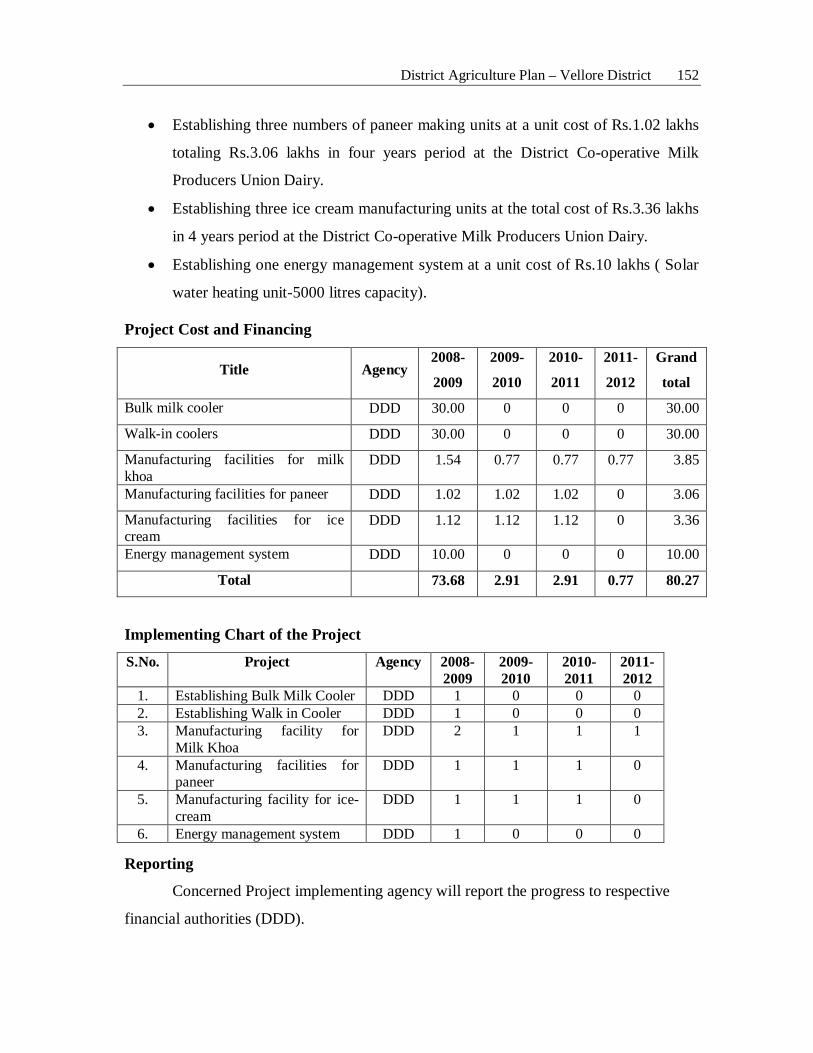
District Agriculture Plan – Vellore District 152
• Establishing three numbers of paneer making units at a unit cost of Rs.1.02 lakhs
totaling Rs.3.06 lakhs in four years period at the District Co-operative Milk
Producers Union Dairy.
• Establishing three ice cream manufacturing units at the total cost of Rs.3.36 lakhs
in 4 years period at the District Co-operative Milk Producers Union Dairy.
• Establishing one energy management system at a unit cost of Rs.10 lakhs ( Solar
water heating unit-5000 litres capacity).
Project Cost and Financing
Title Agency 2008-
2009
2009-
2010
2010-
2011
2011-
2012
Grand
total
Bulk milk cooler DDD 30.00 0 0 0 30.00
Walk-in coolers DDD 30.00 0 0 0 30.00
Manufacturing facilities for milk khoa
DDD 1.54 0.77 0.77 0.77 3.85
Manufacturing facilities for paneer DDD 1.02 1.02 1.02 0 3.06
Manufacturing facilities for ice cream
DDD 1.12 1.12 1.12 0 3.36
Energy management system DDD 10.00 0 0 0 10.00
Total 73.68 2.91 2.91 0.77 80.27
Implementing Chart of the Project
S.No. Project Agency 2008-2009
2009-2010
2010-2011
2011-2012
1. Establishing Bulk Milk Cooler DDD 1 0 0 0 2. Establishing Walk in Cooler DDD 1 0 0 0 3. Manufacturing facility for
Milk Khoa DDD 2 1 1 1
4. Manufacturing facilities for paneer
DDD 1 1 1 0
5. Manufacturing facility for ice-cream
DDD 1 1 1 0
6. Energy management system DDD 1 0 0 0
Reporting
Concerned Project implementing agency will report the progress to respective
financial authorities (DDD).
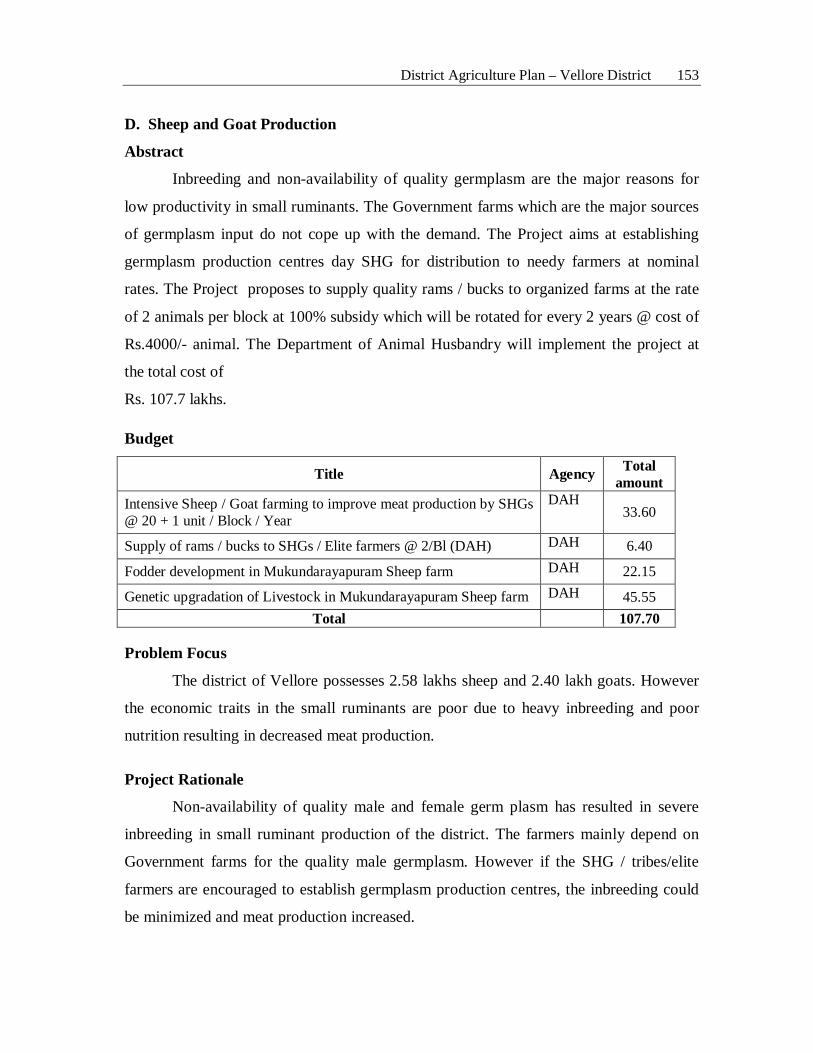
District Agriculture Plan – Vellore District 153
D. Sheep and Goat Production
Abstract
Inbreeding and non-availability of quality germplasm are the major reasons for
low productivity in small ruminants. The Government farms which are the major sources
of germplasm input do not cope up with the demand. The Project aims at establishing
germplasm production centres day SHG for distribution to needy farmers at nominal
rates. The Project proposes to supply quality rams / bucks to organized farms at the rate
of 2 animals per block at 100% subsidy which will be rotated for every 2 years @ cost of
Rs.4000/- animal. The Department of Animal Husbandry will implement the project at
the total cost of
Rs. 107.7 lakhs.
Budget
Title Agency Total amount
Intensive Sheep / Goat farming to improve meat production by SHGs @ 20 + 1 unit / Block / Year
DAH 33.60
Supply of rams / bucks to SHGs / Elite farmers @ 2/Bl (DAH) DAH 6.40
Fodder development in Mukundarayapuram Sheep farm DAH 22.15
Genetic upgradation of Livestock in Mukundarayapuram Sheep farm DAH 45.55 Total 107.70
Problem Focus
The district of Vellore possesses 2.58 lakhs sheep and 2.40 lakh goats. However
the economic traits in the small ruminants are poor due to heavy inbreeding and poor
nutrition resulting in decreased meat production.
Project Rationale
Non-availability of quality male and female germ plasm has resulted in severe
inbreeding in small ruminant production of the district. The farmers mainly depend on
Government farms for the quality male germplasm. However if the SHG / tribes/elite
farmers are encouraged to establish germplasm production centres, the inbreeding could
be minimized and meat production increased.
District Agriculture Plan – Vellore District 154
Project Strategy
A number of Government and Non-Government Organizations are engaged in
breeding of small ruminants though their number is not large. So there is need to rope in
such organizations and encourage others in small ruminant breeding on scientific lines
for production of rams and bucks so that such organizations can supplement the efforts of
Government farms in meeting the requirement of breeding stock.
Project Goals
i. To supply quality Germplasm to needy farmers.
ii. To avoid inbreeding.
iii. To increase meat production.
Project Component
Supply of Rams / Bucks at 100% subsidy to SHG / Elite farmers / Tribes having
sheep or goat farm at the rate of 2 per block. The cost of each animal is Rs. 4,000 and a
total of 160 animals will be supplied in four year of the project itself at the total cost of
Rs.6.40 lakhs
It is proposed to provide, sheep/Goats each unit comprising of 20 ewes/buck and
one Ram/ Doe, by formation of Self Help Groups. The cost per unit (20 females and 1
male) will be Rs.42,000/-
Model Intensive Sheep/Goat farming units will be established through SHGs at a
unit size of 20 + 1 / Unit per Block / Year. The unit cost is Rs. 0.42 lakhs for the total
number of units of 80, the amount totaling to Rs. 33.60 lakhs.
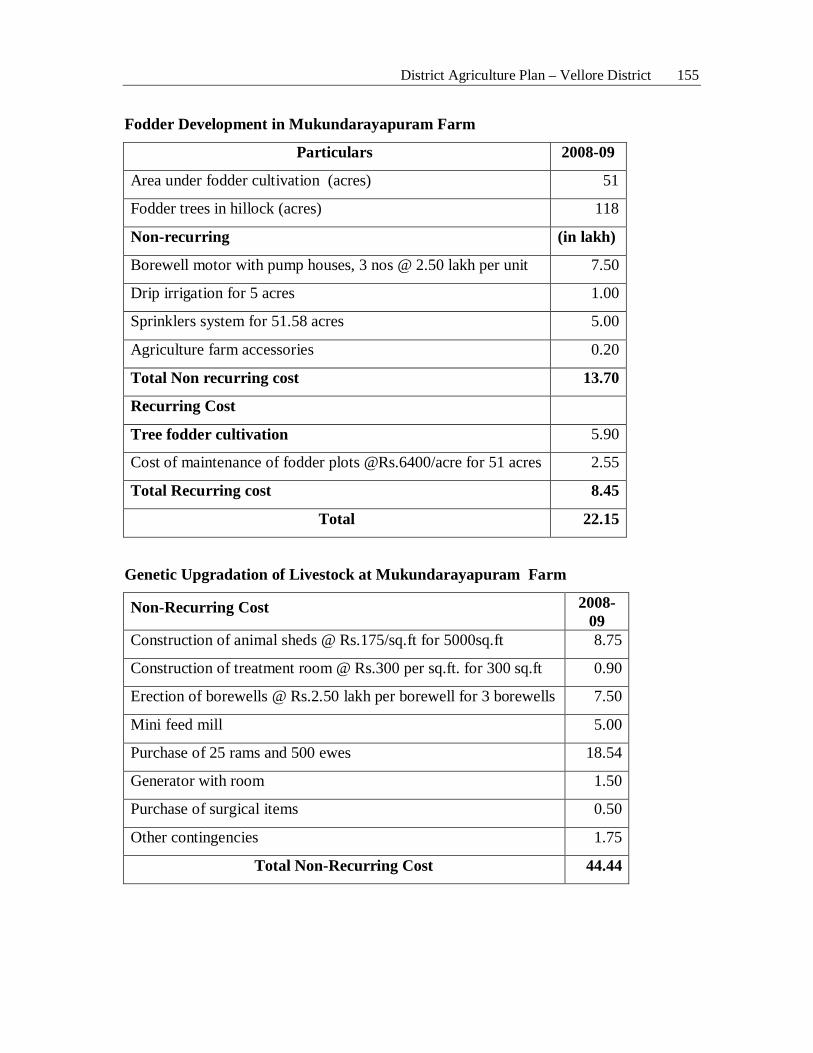
District Agriculture Plan – Vellore District 155
Fodder Development in Mukundarayapuram Farm
Particulars 2008-09
Area under fodder cultivation (acres) 51
Fodder trees in hillock (acres) 118
Non-recurring (in lakh)
Borewell motor with pump houses, 3 nos @ 2.50 lakh per unit 7.50
Drip irrigation for 5 acres 1.00
Sprinklers system for 51.58 acres 5.00
Agriculture farm accessories 0.20
Total Non recurring cost 13.70
Recurring Cost
Tree fodder cultivation 5.90
Cost of maintenance of fodder plots @Rs.6400/acre for 51 acres 2.55
Total Recurring cost 8.45
Total 22.15
Genetic Upgradation of Livestock at Mukundarayapuram Farm
Non-Recurring Cost 2008-09
Construction of animal sheds @ Rs.175/sq.ft for 5000sq.ft 8.75
Construction of treatment room @ Rs.300 per sq.ft. for 300 sq.ft 0.90
Erection of borewells @ Rs.2.50 lakh per borewell for 3 borewells 7.50
Mini feed mill 5.00
Purchase of 25 rams and 500 ewes 18.54
Generator with room 1.50
Purchase of surgical items 0.50
Other contingencies 1.75
Total Non-Recurring Cost 44.44
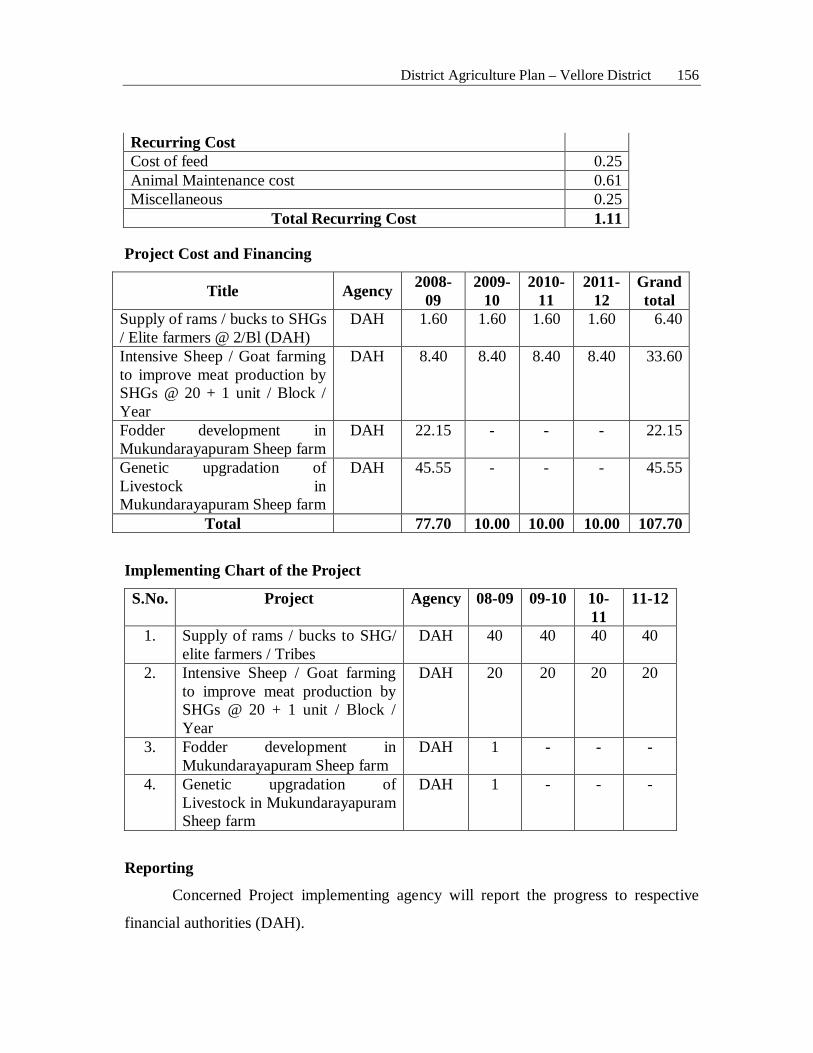
District Agriculture Plan – Vellore District 156
Recurring Cost Cost of feed 0.25 Animal Maintenance cost 0.61 Miscellaneous 0.25
Total Recurring Cost 1.11
Project Cost and Financing
Title Agency 2008-09
2009-10
2010-11
2011-12
Grand total
Supply of rams / bucks to SHGs / Elite farmers @ 2/Bl (DAH)
DAH 1.60 1.60 1.60 1.60 6.40
Intensive Sheep / Goat farming to improve meat production by SHGs @ 20 + 1 unit / Block / Year
DAH 8.40 8.40 8.40 8.40 33.60
Fodder development in Mukundarayapuram Sheep farm
DAH 22.15 - - - 22.15
Genetic upgradation of Livestock in Mukundarayapuram Sheep farm
DAH 45.55 - - - 45.55
Total 77.70 10.00 10.00 10.00 107.70
Implementing Chart of the Project
S.No. Project Agency 08-09 09-10 10-11
11-12
1. Supply of rams / bucks to SHG/ elite farmers / Tribes
DAH 40 40 40 40
2. Intensive Sheep / Goat farming to improve meat production by SHGs @ 20 + 1 unit / Block / Year
DAH 20 20 20 20
3. Fodder development in Mukundarayapuram Sheep farm
DAH 1 - - -
4. Genetic upgradation of Livestock in Mukundarayapuram Sheep farm
DAH 1 - - -
Reporting
Concerned Project implementing agency will report the progress to respective
financial authorities (DAH).
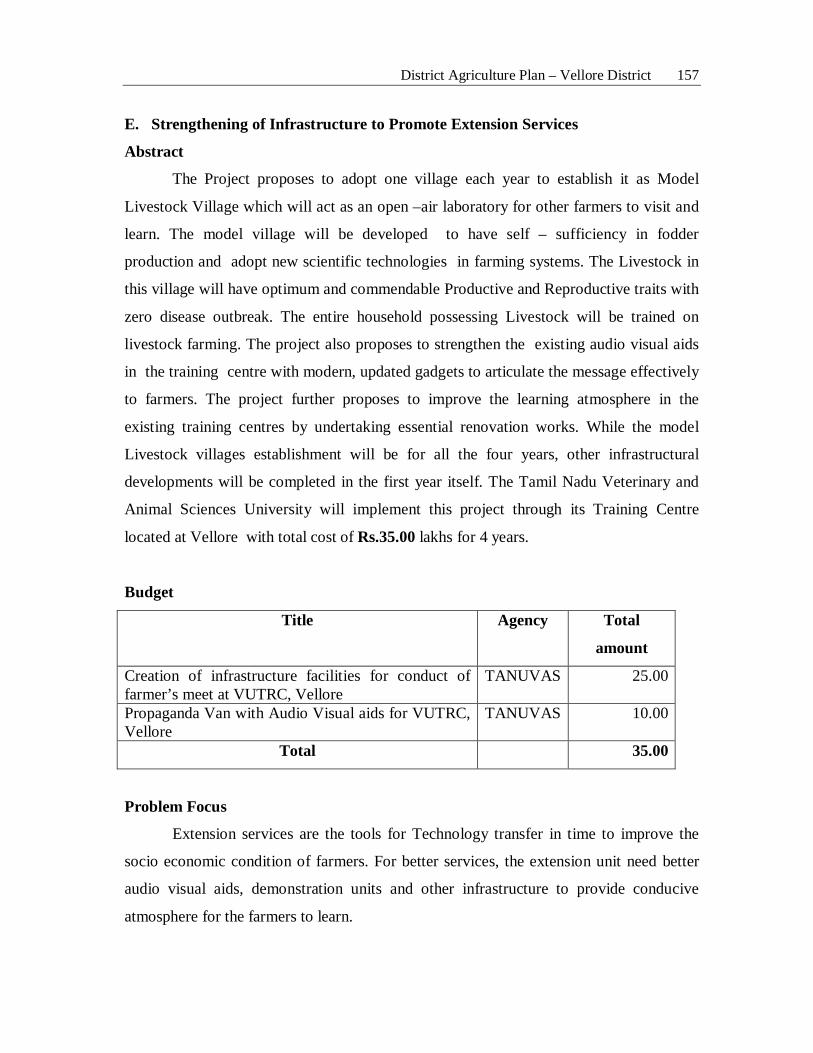
District Agriculture Plan – Vellore District 157
E. Strengthening of Infrastructure to Promote Extension Services
Abstract
The Project proposes to adopt one village each year to establish it as Model
Livestock Village which will act as an open –air laboratory for other farmers to visit and
learn. The model village will be developed to have self – sufficiency in fodder
production and adopt new scientific technologies in farming systems. The Livestock in
this village will have optimum and commendable Productive and Reproductive traits with
zero disease outbreak. The entire household possessing Livestock will be trained on
livestock farming. The project also proposes to strengthen the existing audio visual aids
in the training centre with modern, updated gadgets to articulate the message effectively
to farmers. The project further proposes to improve the learning atmosphere in the
existing training centres by undertaking essential renovation works. While the model
Livestock villages establishment will be for all the four years, other infrastructural
developments will be completed in the first year itself. The Tamil Nadu Veterinary and
Animal Sciences University will implement this project through its Training Centre
located at Vellore with total cost of Rs.35.00 lakhs for 4 years.
Budget
Title Agency Total
amount
Creation of infrastructure facilities for conduct of farmer’s meet at VUTRC, Vellore
TANUVAS 25.00
Propaganda Van with Audio Visual aids for VUTRC, Vellore
TANUVAS 10.00
Total 35.00
Problem Focus
Extension services are the tools for Technology transfer in time to improve the
socio economic condition of farmers. For better services, the extension unit need better
audio visual aids, demonstration units and other infrastructure to provide conducive
atmosphere for the farmers to learn.
District Agriculture Plan – Vellore District 158
Project Rationale
Documentation of the Technologies, remoulding the Technologies in farmers
friendly mode and transferring the same to farmers in an acceptable way requires modern
electronic infrastructure.
Project Strategy
• Strengthening the training equipments in the existing Training centres with
modern updated electronic gadgets.
• Renovating the existing training hall to provide comfort and conducive
environment for learning by farmers.
Project Goal
• To document transferable Technologies and transfer in farmers – friendly mode
for adoption.
• To provide conducive learning atmosphere to farmers in Training centres.
Project Components
Strengthening of Training equipments for conducting capacity building and
Technology dissemination programmes at the Veterinary University Training Centre,
Vellore with following gadgets: Slide Projector, Projection screen, Digital camera, Lap
Top, LCD Projector, DVD Player, Vehicle mounted with Television and other audio
visual aids for conducting off-campus Training and village level campaigns at a cost Rs.
10.00 Lakhs.
The second floor with conference hall facilities will be made available at the
Veterinary University Training and Research Centre, Vellore for the conduct of farmers/
NGO’s /SHG’s technical meet at a total cost of Rs. 25.00 lakhs.
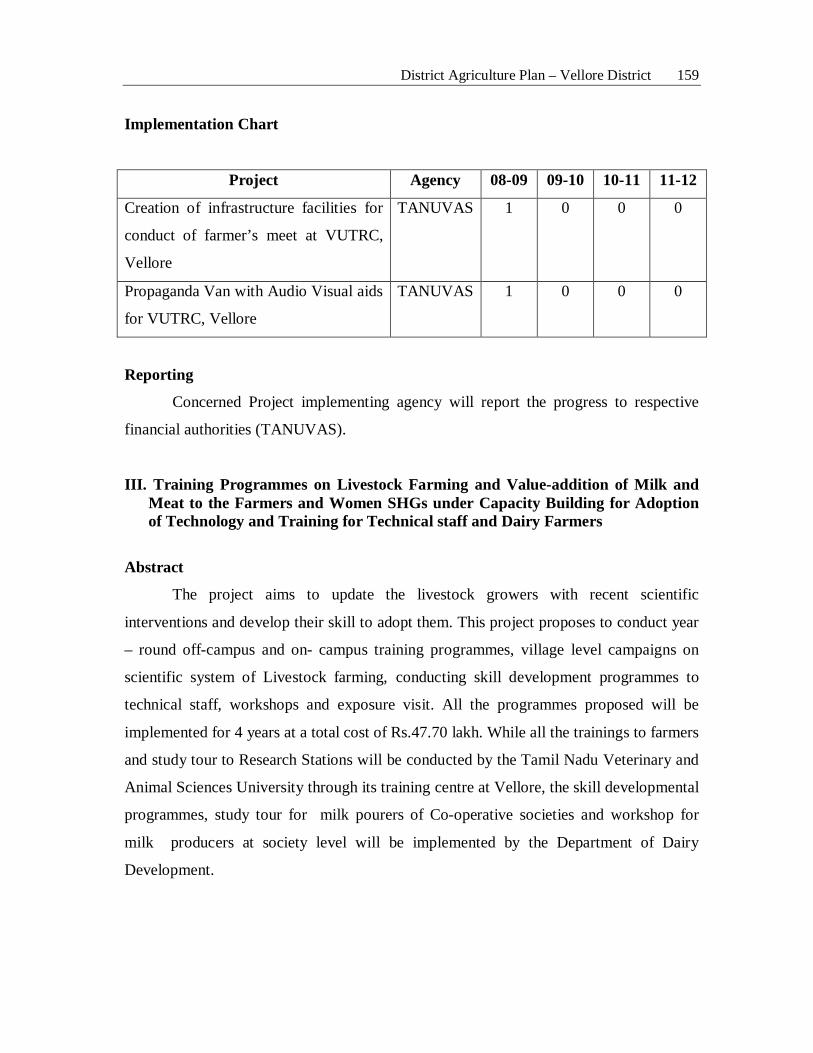
District Agriculture Plan – Vellore District 159
Implementation Chart
Project Agency 08-09 09-10 10-11 11-12
Creation of infrastructure facilities for
conduct of farmer’s meet at VUTRC,
Vellore
TANUVAS 1 0 0 0
Propaganda Van with Audio Visual aids
for VUTRC, Vellore
TANUVAS 1 0 0 0
Reporting
Concerned Project implementing agency will report the progress to respective
financial authorities (TANUVAS).
III. Training Programmes on Livestock Farming and Value-addition of Milk and Meat to the Farmers and Women SHGs under Capacity Building for Adoption of Technology and Training for Technical staff and Dairy Farmers
Abstract
The project aims to update the livestock growers with recent scientific
interventions and develop their skill to adopt them. This project proposes to conduct year
– round off-campus and on- campus training programmes, village level campaigns on
scientific system of Livestock farming, conducting skill development programmes to
technical staff, workshops and exposure visit. All the programmes proposed will be
implemented for 4 years at a total cost of Rs.47.70 lakh. While all the trainings to farmers
and study tour to Research Stations will be conducted by the Tamil Nadu Veterinary and
Animal Sciences University through its training centre at Vellore, the skill developmental
programmes, study tour for milk pourers of Co-operative societies and workshop for
milk producers at society level will be implemented by the Department of Dairy
Development.
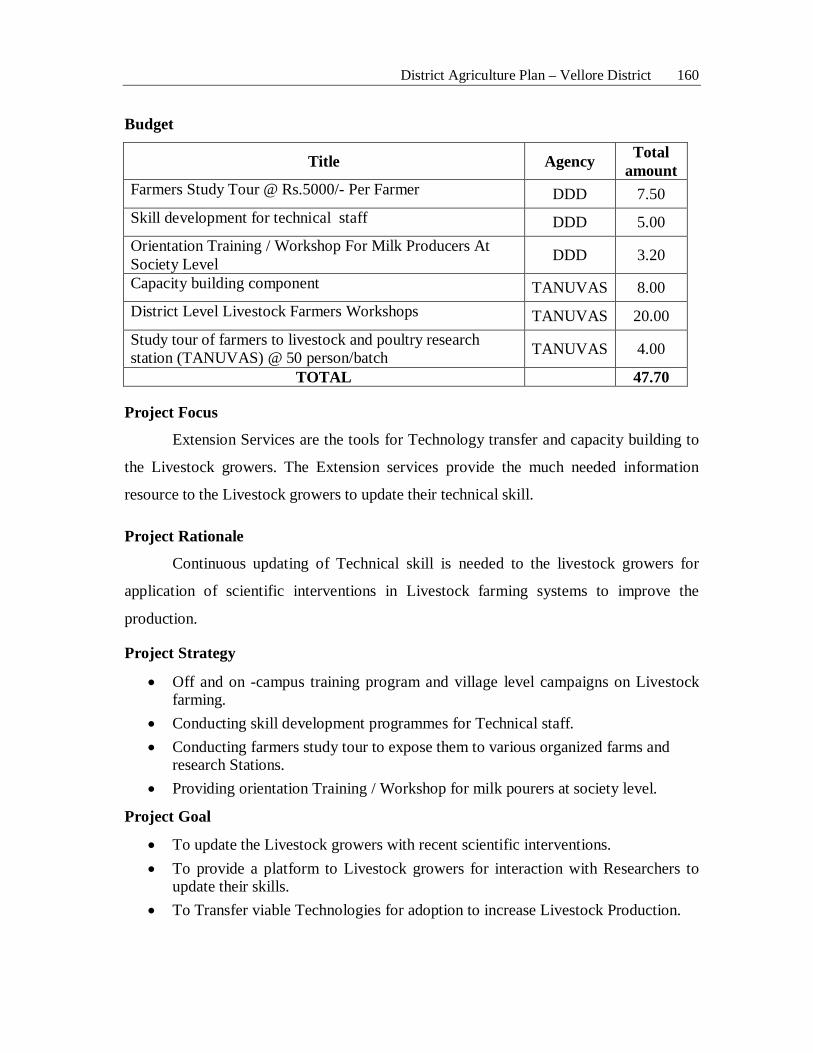
District Agriculture Plan – Vellore District 160
Budget
Title Agency Total amount
Farmers Study Tour @ Rs.5000/- Per Farmer DDD 7.50 Skill development for technical staff DDD 5.00 Orientation Training / Workshop For Milk Producers At Society Level DDD 3.20
Capacity building component TANUVAS 8.00 District Level Livestock Farmers Workshops TANUVAS 20.00 Study tour of farmers to livestock and poultry research station (TANUVAS) @ 50 person/batch TANUVAS 4.00
TOTAL 47.70
Project Focus
Extension Services are the tools for Technology transfer and capacity building to
the Livestock growers. The Extension services provide the much needed information
resource to the Livestock growers to update their technical skill.
Project Rationale
Continuous updating of Technical skill is needed to the livestock growers for
application of scientific interventions in Livestock farming systems to improve the
production.
Project Strategy
• Off and on -campus training program and village level campaigns on Livestock farming.
• Conducting skill development programmes for Technical staff. • Conducting farmers study tour to expose them to various organized farms and
research Stations. • Providing orientation Training / Workshop for milk pourers at society level.
Project Goal
• To update the Livestock growers with recent scientific interventions. • To provide a platform to Livestock growers for interaction with Researchers to
update their skills. • To Transfer viable Technologies for adoption to increase Livestock Production.
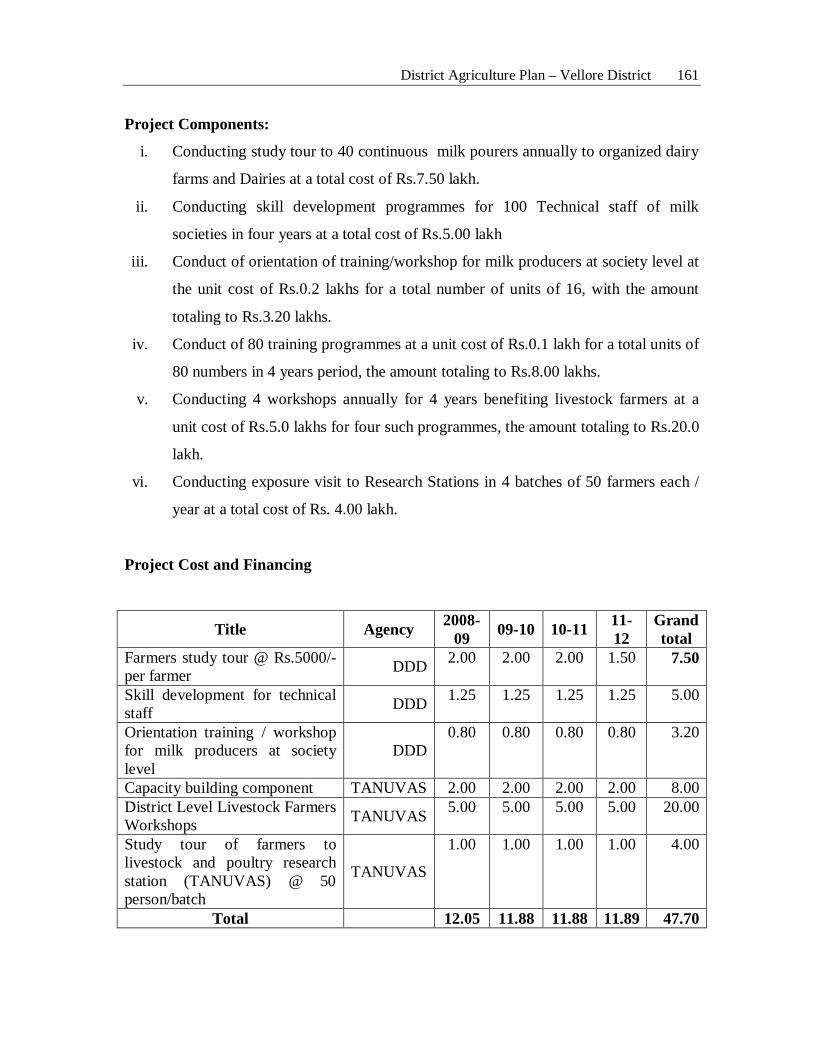
District Agriculture Plan – Vellore District 161
Project Components:
i. Conducting study tour to 40 continuous milk pourers annually to organized dairy
farms and Dairies at a total cost of Rs.7.50 lakh.
ii. Conducting skill development programmes for 100 Technical staff of milk
societies in four years at a total cost of Rs.5.00 lakh
iii. Conduct of orientation of training/workshop for milk producers at society level at
the unit cost of Rs.0.2 lakhs for a total number of units of 16, with the amount
totaling to Rs.3.20 lakhs.
iv. Conduct of 80 training programmes at a unit cost of Rs.0.1 lakh for a total units of
80 numbers in 4 years period, the amount totaling to Rs.8.00 lakhs.
v. Conducting 4 workshops annually for 4 years benefiting livestock farmers at a
unit cost of Rs.5.0 lakhs for four such programmes, the amount totaling to Rs.20.0
lakh.
vi. Conducting exposure visit to Research Stations in 4 batches of 50 farmers each /
year at a total cost of Rs. 4.00 lakh.
Project Cost and Financing
Title Agency 2008-09 09-10 10-11 11-
12 Grand total
Farmers study tour @ Rs.5000/- per farmer DDD 2.00 2.00 2.00 1.50 7.50
Skill development for technical staff DDD 1.25 1.25 1.25 1.25 5.00
Orientation training / workshop for milk producers at society level
DDD 0.80 0.80 0.80 0.80 3.20
Capacity building component TANUVAS 2.00 2.00 2.00 2.00 8.00 District Level Livestock Farmers Workshops TANUVAS 5.00 5.00 5.00 5.00 20.00
Study tour of farmers to livestock and poultry research station (TANUVAS) @ 50 person/batch
TANUVAS
1.00 1.00 1.00 1.00 4.00
Total 12.05 11.88 11.88 11.89 47.70
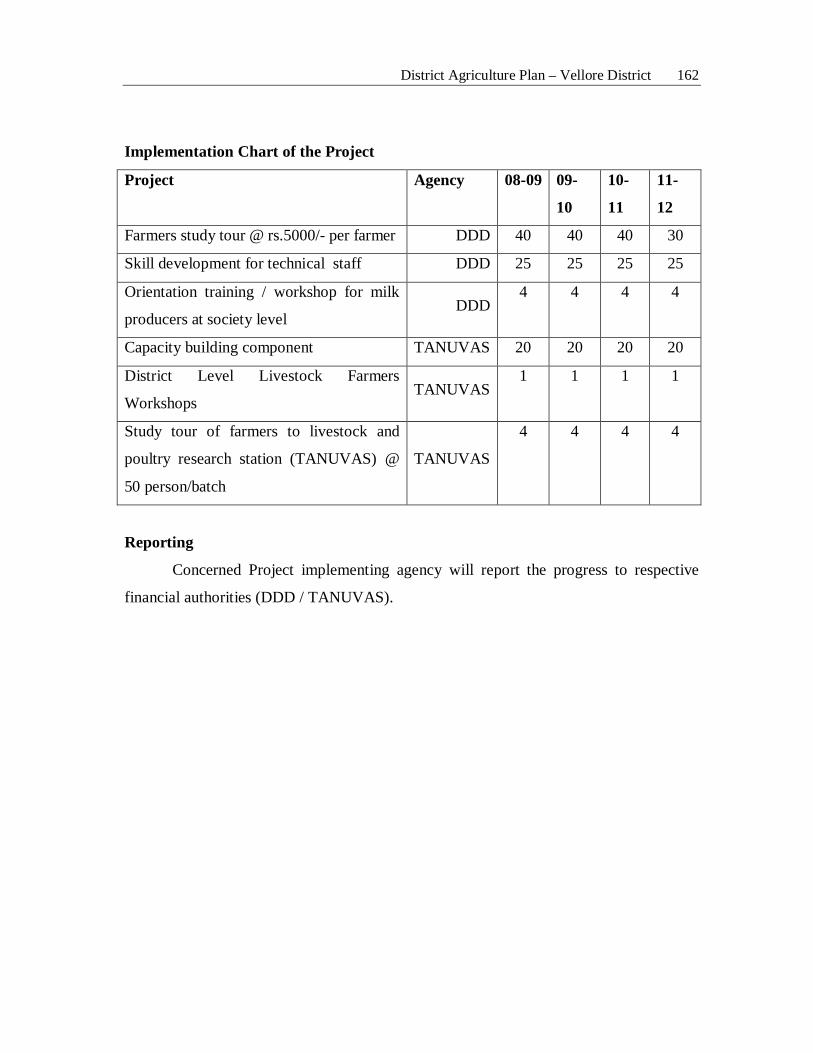
District Agriculture Plan – Vellore District 162
Implementation Chart of the Project
Project Agency 08-09 09-
10
10-
11
11-
12
Farmers study tour @ rs.5000/- per farmer DDD 40 40 40 30
Skill development for technical staff DDD 25 25 25 25
Orientation training / workshop for milk
producers at society level DDD
4 4 4 4
Capacity building component TANUVAS 20 20 20 20
District Level Livestock Farmers
Workshops TANUVAS
1 1 1 1
Study tour of farmers to livestock and
poultry research station (TANUVAS) @
50 person/batch
TANUVAS
4 4 4 4
Reporting
Concerned Project implementing agency will report the progress to respective
financial authorities (DDD / TANUVAS).
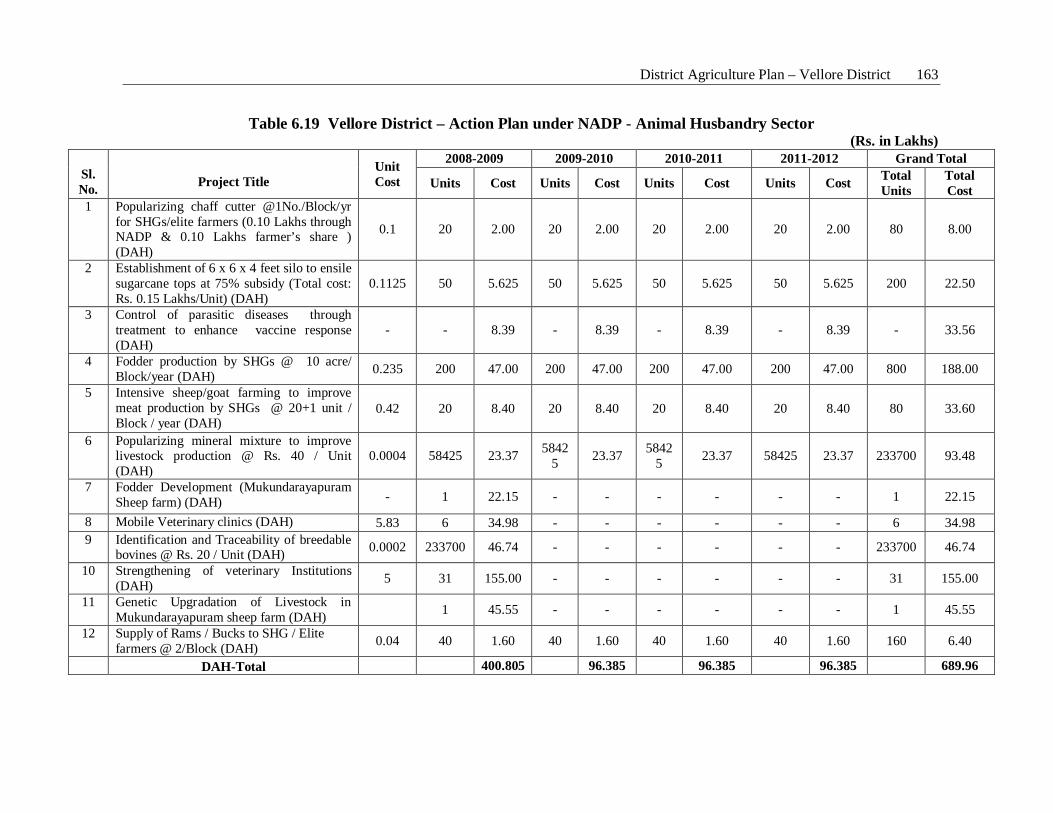
District Agriculture Plan – Vellore District 163
Table 6.19 Vellore District – Action Plan under NADP - Animal Husbandry Sector (Rs. in Lakhs)
Sl. No.
Project Title
Unit Cost
2008-2009 2009-2010 2010-2011 2011-2012 Grand Total
Units Cost Units Cost Units Cost Units Cost Total Units
Total Cost
1 Popularizing chaff cutter @1No./Block/yr for SHGs/elite farmers (0.10 Lakhs through NADP & 0.10 Lakhs farmer’s share ) (DAH)
0.1 20 2.00 20 2.00 20 2.00 20 2.00 80 8.00
2 Establishment of 6 x 6 x 4 feet silo to ensile sugarcane tops at 75% subsidy (Total cost: Rs. 0.15 Lakhs/Unit) (DAH)
0.1125 50 5.625 50 5.625 50 5.625 50 5.625 200 22.50
3 Control of parasitic diseases through treatment to enhance vaccine response (DAH)
- - 8.39 - 8.39 - 8.39 - 8.39 - 33.56
4 Fodder production by SHGs @ 10 acre/ Block/year (DAH) 0.235 200 47.00 200 47.00 200 47.00 200 47.00 800 188.00
5 Intensive sheep/goat farming to improve meat production by SHGs @ 20+1 unit / Block / year (DAH)
0.42 20 8.40 20 8.40 20 8.40 20 8.40 80 33.60
6 Popularizing mineral mixture to improve livestock production @ Rs. 40 / Unit (DAH)
0.0004 58425 23.37 58425 23.37 5842
5 23.37 58425 23.37 233700 93.48
7 Fodder Development (Mukundarayapuram Sheep farm) (DAH) - 1 22.15 - - - - - - 1 22.15
8 Mobile Veterinary clinics (DAH) 5.83 6 34.98 - - - - - - 6 34.98 9 Identification and Traceability of breedable
bovines @ Rs. 20 / Unit (DAH) 0.0002 233700 46.74 - - - - - - 233700 46.74
10 Strengthening of veterinary Institutions (DAH) 5 31 155.00 - - - - - - 31 155.00
11 Genetic Upgradation of Livestock in Mukundarayapuram sheep farm (DAH) 1 45.55 - - - - - - 1 45.55
12 Supply of Rams / Bucks to SHG / Elite farmers @ 2/Block (DAH) 0.04 40 1.60 40 1.60 40 1.60 40 1.60 160 6.40
DAH-Total 400.805 96.385 96.385 96.385 689.96
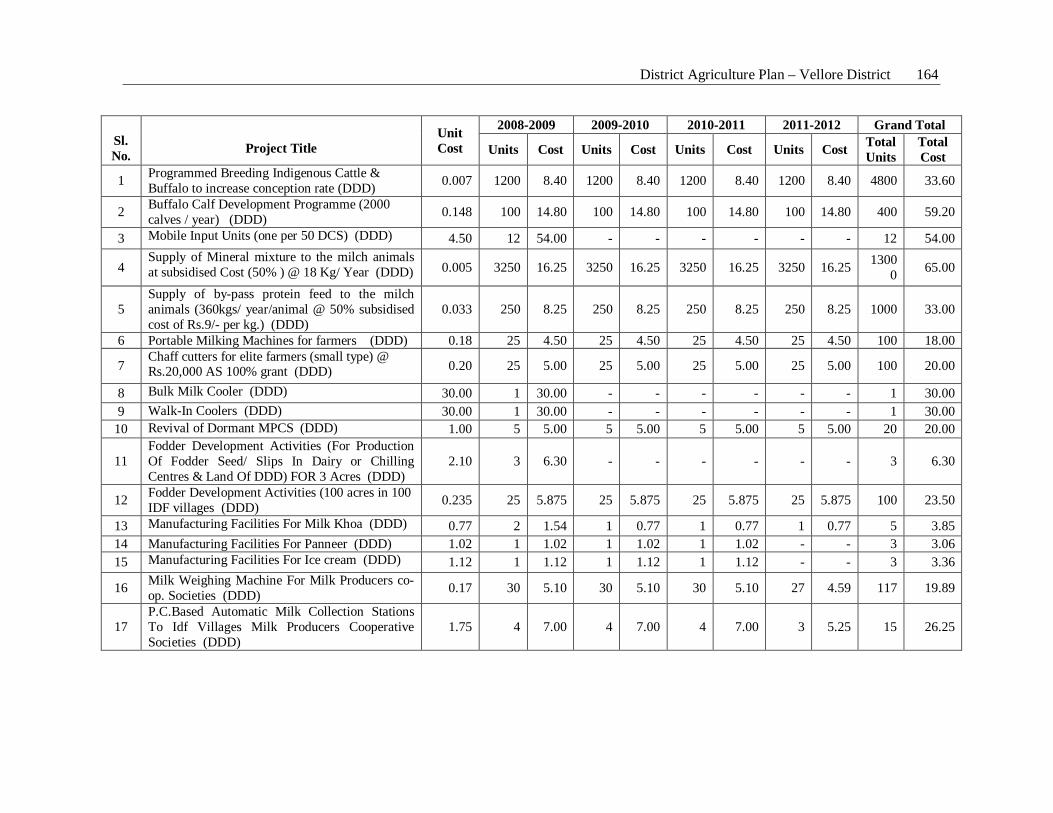
District Agriculture Plan – Vellore District 164
Sl. No.
Project Title
Unit Cost
2008-2009 2009-2010 2010-2011 2011-2012 Grand Total
Units Cost Units Cost Units Cost Units Cost Total Units
Total Cost
1 Programmed Breeding Indigenous Cattle & Buffalo to increase conception rate (DDD) 0.007 1200 8.40 1200 8.40 1200 8.40 1200 8.40 4800 33.60
2 Buffalo Calf Development Programme (2000 calves / year) (DDD) 0.148 100 14.80 100 14.80 100 14.80 100 14.80 400 59.20
3 Mobile Input Units (one per 50 DCS) (DDD) 4.50 12 54.00 - - - - - - 12 54.00
4 Supply of Mineral mixture to the milch animals at subsidised Cost (50% ) @ 18 Kg/ Year (DDD) 0.005 3250 16.25 3250 16.25 3250 16.25 3250 16.25 1300
0 65.00
5 Supply of by-pass protein feed to the milch animals (360kgs/ year/animal @ 50% subsidised cost of Rs.9/- per kg.) (DDD)
0.033 250 8.25 250 8.25 250 8.25 250 8.25 1000 33.00
6 Portable Milking Machines for farmers (DDD) 0.18 25 4.50 25 4.50 25 4.50 25 4.50 100 18.00
7 Chaff cutters for elite farmers (small type) @ Rs.20,000 AS 100% grant (DDD) 0.20 25 5.00 25 5.00 25 5.00 25 5.00 100 20.00
8 Bulk Milk Cooler (DDD) 30.00 1 30.00 - - - - - - 1 30.00 9 Walk-In Coolers (DDD) 30.00 1 30.00 - - - - - - 1 30.00
10 Revival of Dormant MPCS (DDD) 1.00 5 5.00 5 5.00 5 5.00 5 5.00 20 20.00
11 Fodder Development Activities (For Production Of Fodder Seed/ Slips In Dairy or Chilling Centres & Land Of DDD) FOR 3 Acres (DDD)
2.10 3 6.30 - - - - - - 3 6.30
12 Fodder Development Activities (100 acres in 100 IDF villages (DDD) 0.235 25 5.875 25 5.875 25 5.875 25 5.875 100 23.50
13 Manufacturing Facilities For Milk Khoa (DDD) 0.77 2 1.54 1 0.77 1 0.77 1 0.77 5 3.85 14 Manufacturing Facilities For Panneer (DDD) 1.02 1 1.02 1 1.02 1 1.02 - - 3 3.06 15 Manufacturing Facilities For Ice cream (DDD) 1.12 1 1.12 1 1.12 1 1.12 - - 3 3.36
16 Milk Weighing Machine For Milk Producers co-op. Societies (DDD) 0.17 30 5.10 30 5.10 30 5.10 27 4.59 117 19.89
17 P.C.Based Automatic Milk Collection Stations To Idf Villages Milk Producers Cooperative Societies (DDD)
1.75 4 7.00 4 7.00 4 7.00 3 5.25 15 26.25
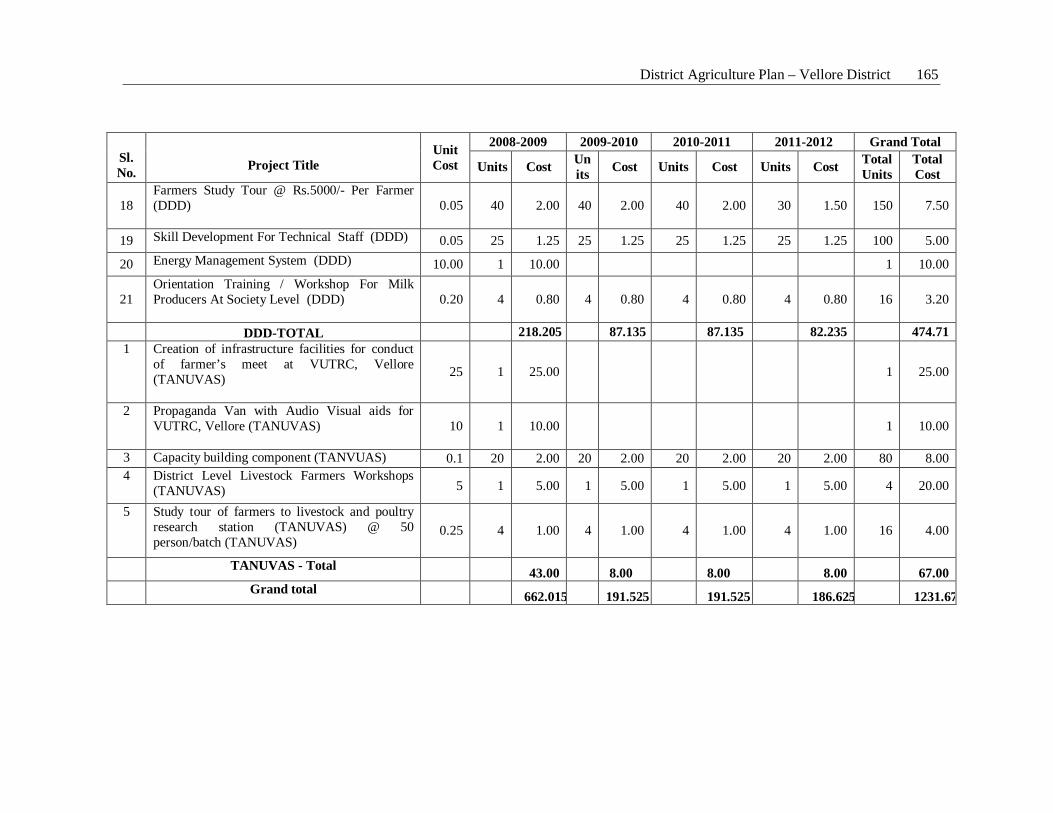
District Agriculture Plan – Vellore District 165
Sl. No.
Project Title
Unit Cost
2008-2009 2009-2010 2010-2011 2011-2012 Grand Total
Units Cost Units Cost Units Cost Units Cost Total
Units Total Cost
18 Farmers Study Tour @ Rs.5000/- Per Farmer (DDD)
0.05 40 2.00 40 2.00 40 2.00 30 1.50 150 7.50
19 Skill Development For Technical Staff (DDD) 0.05 25 1.25 25 1.25 25 1.25 25 1.25 100 5.00
20 Energy Management System (DDD) 10.00 1 10.00 1 10.00
21 Orientation Training / Workshop For Milk Producers At Society Level (DDD)
0.20 4 0.80 4 0.80 4 0.80 4 0.80 16 3.20
DDD-TOTAL 218.205 87.135 87.135 82.235 474.71 1 Creation of infrastructure facilities for conduct
of farmer’s meet at VUTRC, Vellore (TANUVAS)
25 1 25.00 1 25.00
2 Propaganda Van with Audio Visual aids for VUTRC, Vellore (TANUVAS)
10 1 10.00 1 10.00
3 Capacity building component (TANVUAS) 0.1 20 2.00 20 2.00 20 2.00 20 2.00 80 8.00 4 District Level Livestock Farmers Workshops
(TANUVAS) 5 1 5.00 1 5.00 1 5.00 1 5.00 4 20.00
5 Study tour of farmers to livestock and poultry research station (TANUVAS) @ 50 person/batch (TANUVAS)
0.25 4 1.00 4 1.00 4 1.00 4 1.00 16 4.00
TANUVAS - Total 43.00 8.00 8.00 8.00 67.00 Grand total 662.015 191.525 191.525 186.625 1231.67
District Agriculture Plan – Vellore District 166
6.5.1. Fisheries
Inland
1. 50% Subsidy Assistance to Private Fish Seed Rearing / Fish Seed Production
Abstract
The fish farmers in Vellore district are progressive farmers and evince interest in
adopting modern technologies in fish seed production / fish production. The resources
can be utilised to expand the inland fisheries activities in the district. The potential can
also be tapped to cater to the need of other districts. Hence, it is proposed to encourage
private participation in fish seed production
Budget : Rs. 5.00 lakhs (50% Subsidy)
Background / Problem Focus
• Inadequate infrastructure development causing problems to attain self sufficiency
in seed production
• Fish seed production / Rearing is not adequate.
• Fish seed production / rearing in private sector has been not encouraged to
minimize intake from neighbouring States.
• Fish culture activity shall be encouraged by extending 50% subsidy on inputs.
Project Rationale
• Infrastructure development to attain self sufficiency in seed production
• Fish seed production / rearing in private sector should be encouraged to minimize
import from other States.
• Fish culture activity shall be encouraged by extending 50% subsidy on inputs.
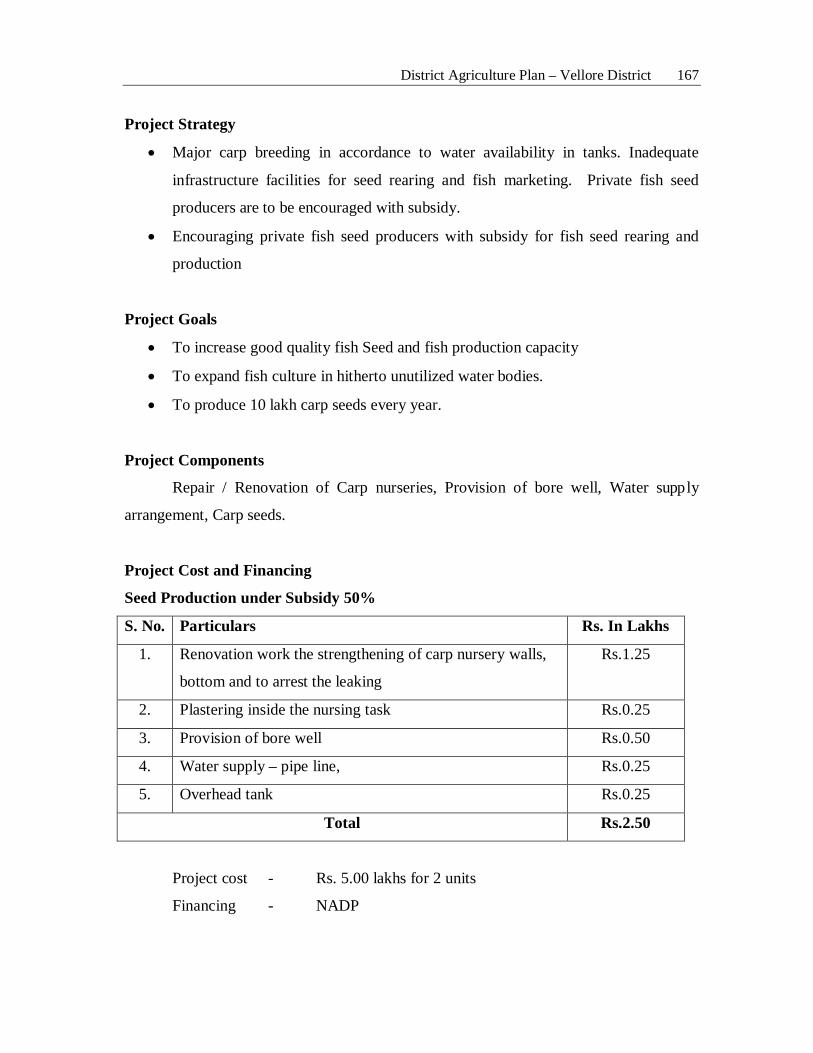
District Agriculture Plan – Vellore District 167
Project Strategy
• Major carp breeding in accordance to water availability in tanks. Inadequate
infrastructure facilities for seed rearing and fish marketing. Private fish seed
producers are to be encouraged with subsidy.
• Encouraging private fish seed producers with subsidy for fish seed rearing and
production
Project Goals
• To increase good quality fish Seed and fish production capacity
• To expand fish culture in hitherto unutilized water bodies.
• To produce 10 lakh carp seeds every year.
Project Components
Repair / Renovation of Carp nurseries, Provision of bore well, Water supply
arrangement, Carp seeds.
Project Cost and Financing
Seed Production under Subsidy 50%
S. No. Particulars Rs. In Lakhs
1. Renovation work the strengthening of carp nursery walls,
bottom and to arrest the leaking
Rs.1.25
2. Plastering inside the nursing task Rs.0.25
3. Provision of bore well Rs.0.50
4. Water supply – pipe line, Rs.0.25
5. Overhead tank Rs.0.25
Total Rs.2.50
Project cost - Rs. 5.00 lakhs for 2 units
Financing - NADP
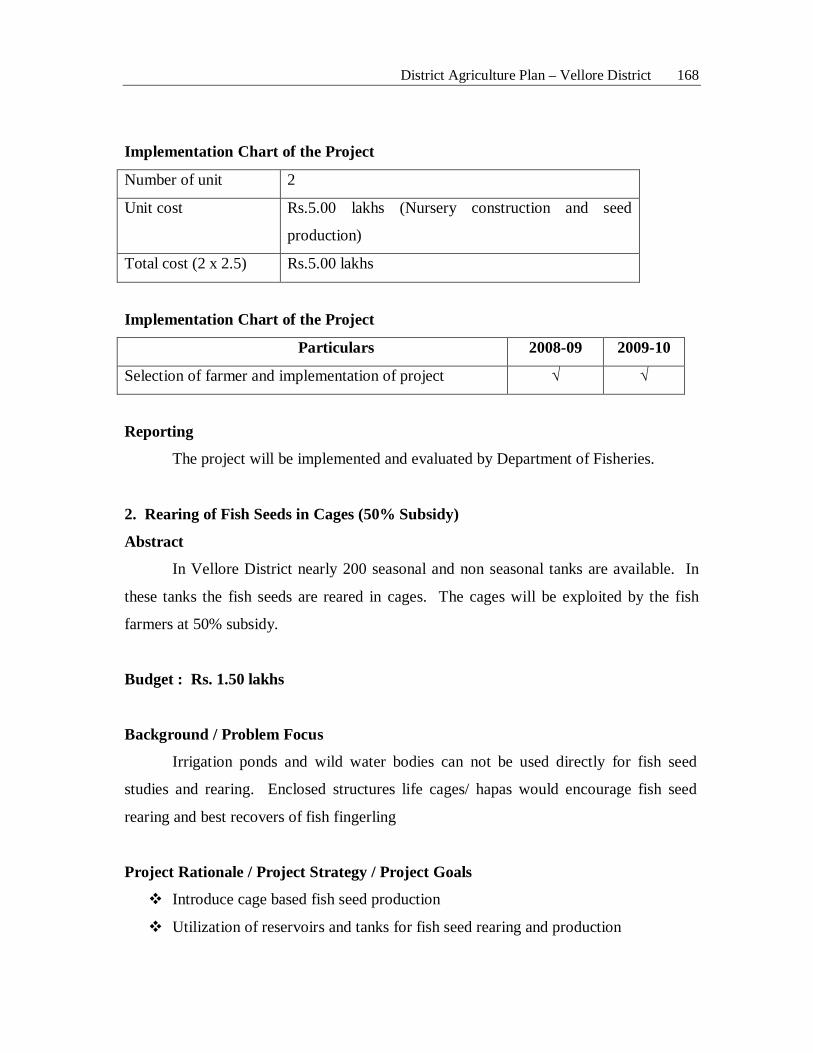
District Agriculture Plan – Vellore District 168
Implementation Chart of the Project
Number of unit 2
Unit cost Rs.5.00 lakhs (Nursery construction and seed
production)
Total cost (2 x 2.5) Rs.5.00 lakhs
Implementation Chart of the Project
Particulars 2008-09 2009-10
Selection of farmer and implementation of project √ √
Reporting
The project will be implemented and evaluated by Department of Fisheries.
2. Rearing of Fish Seeds in Cages (50% Subsidy)
Abstract
In Vellore District nearly 200 seasonal and non seasonal tanks are available. In
these tanks the fish seeds are reared in cages. The cages will be exploited by the fish
farmers at 50% subsidy.
Budget : Rs. 1.50 lakhs
Background / Problem Focus
Irrigation ponds and wild water bodies can not be used directly for fish seed
studies and rearing. Enclosed structures life cages/ hapas would encourage fish seed
rearing and best recovers of fish fingerling
Project Rationale / Project Strategy / Project Goals
Introduce cage based fish seed production
Utilization of reservoirs and tanks for fish seed rearing and production
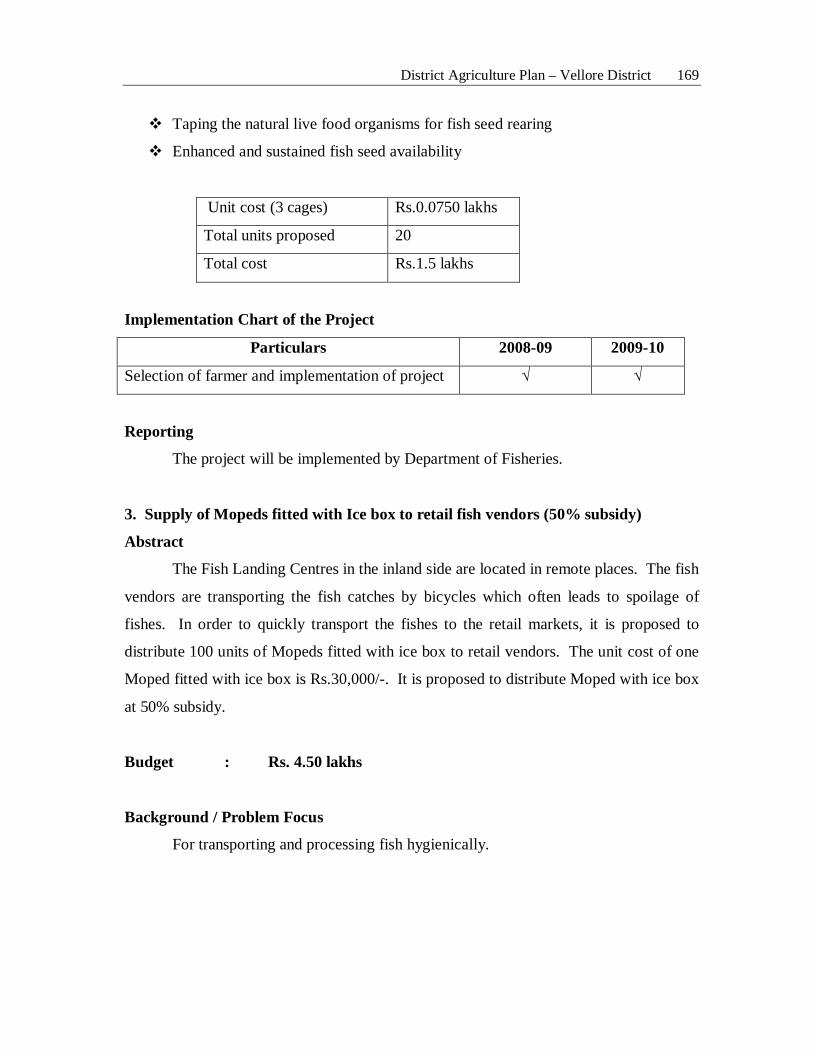
District Agriculture Plan – Vellore District 169
Taping the natural live food organisms for fish seed rearing
Enhanced and sustained fish seed availability
Unit cost (3 cages) Rs.0.0750 lakhs
Total units proposed 20
Total cost Rs.1.5 lakhs
Implementation Chart of the Project
Particulars 2008-09 2009-10
Selection of farmer and implementation of project √ √
Reporting
The project will be implemented by Department of Fisheries.
3. Supply of Mopeds fitted with Ice box to retail fish vendors (50% subsidy)
Abstract
The Fish Landing Centres in the inland side are located in remote places. The fish
vendors are transporting the fish catches by bicycles which often leads to spoilage of
fishes. In order to quickly transport the fishes to the retail markets, it is proposed to
distribute 100 units of Mopeds fitted with ice box to retail vendors. The unit cost of one
Moped fitted with ice box is Rs.30,000/-. It is proposed to distribute Moped with ice box
at 50% subsidy.
Budget : Rs. 4.50 lakhs
Background / Problem Focus
For transporting and processing fish hygienically.
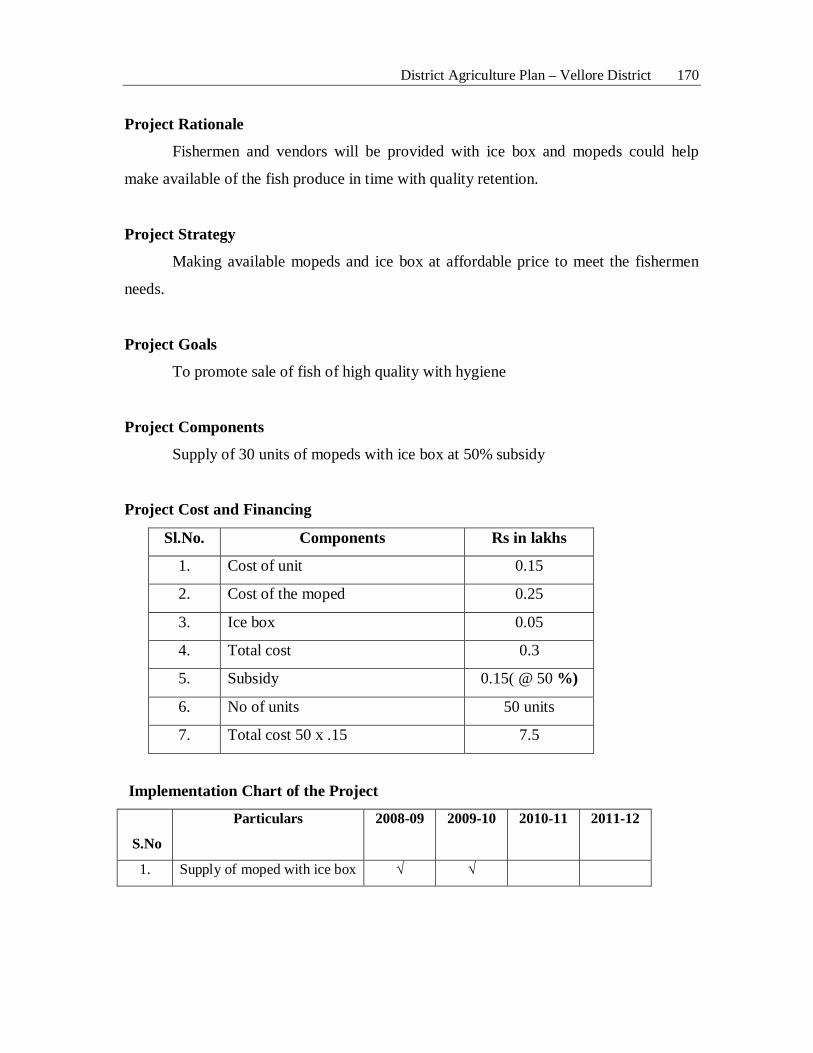
District Agriculture Plan – Vellore District 170
Project Rationale
Fishermen and vendors will be provided with ice box and mopeds could help
make available of the fish produce in time with quality retention.
Project Strategy
Making available mopeds and ice box at affordable price to meet the fishermen
needs.
Project Goals
To promote sale of fish of high quality with hygiene
Project Components
Supply of 30 units of mopeds with ice box at 50% subsidy
Project Cost and Financing
Sl.No. Components Rs in lakhs
1. Cost of unit 0.15
2. Cost of the moped 0.25
3. Ice box 0.05
4. Total cost 0.3
5. Subsidy 0.15( @ 50 %)
6. No of units 50 units
7. Total cost 50 x .15 7.5
Implementation Chart of the Project
S.No
Particulars 2008-09 2009-10 2010-11 2011-12
1. Supply of moped with ice box √ √
District Agriculture Plan – Vellore District 171
100% financing will be done by NADP
Rs. 4.50 lakhs for 30 units
Duration will be 3 years (2008-2009; 2009-10; 2010-11)
Implementation Chart of the Project
TAFCOFED will implement this project.
Reporting
Progress of the project will be reported periodically.
1. Supply of fishing implements (Nets) (50% subsidy)
Abstract
The mopeds with ice box will be provided to inland fishermen for hygienic
marketing.
Budget : Rs. 7.50 lakhs
Background / Problem Focus
To provide gillnets to the fishermen at 50% subsidy
Project Rationale
To enhance fish production through capture fisheries.
Project Strategy
To provide 100 nos. of gillnets to the inland fishermen.
Project Goals
To intervene fishing in natural water bodies.
District Agriculture Plan – Vellore District 172
Project Components
Supply of gillnets at 50% subsidy (Rs.2.50 lakhs)
Project Cost and Financing
Subsidy for
1. Cost of moped : Rs.12,500
2. Cost of ice box : Rs. 2,500
Total cost : Rs.15,000
(Rs. 0.15 lakh for 30 units)
Implementation Chart of the Project
The project will be implemented by the Department of Fisheries.
Reporting
The progress of the project will be reported periodically.
5. Expansion of fish culture in open water system (50% subsidy)
Abstract
The fish culture and fish production can be improved in open water system
through 50% subsidy to the fish farmers.
Budget : Rs 4.69 lakhs
Background / Problem Focus
To utilize open waters for freshwater fish culture.
Project Rationale
To enhance fish production through fish culture.
District Agriculture Plan – Vellore District 173
Project Strategy
To increase the fish production in open water systems.
Project Goals
• To increase the fish production in open water systems.
• To utilize 750 ha for fish production
Project components
Utilization of open water bodies.
Project Cost and Financing
Project cost : Rs. 4.69 lakhs
Financing : NADP
Subsidy : 50% (Rs.2.745 lakhs)
Implementation Chart of the Project
Duration : 3 years (2008-2009; 2009-2010, 2010-2011)
The project will be implemented by the Department of Fisheries.
Reporting
The progress of the project will be reported periodically.
6. Capacity building and training to the fish farmers
Abstract
To train the trainees in the Dept. of fisheries in the advanced fisheries
technologies and to enhance the technical knowledge of the scientist involved in fisheries
development who formulate and implement new projects.
Budget : Rs. 10.00 lakhs
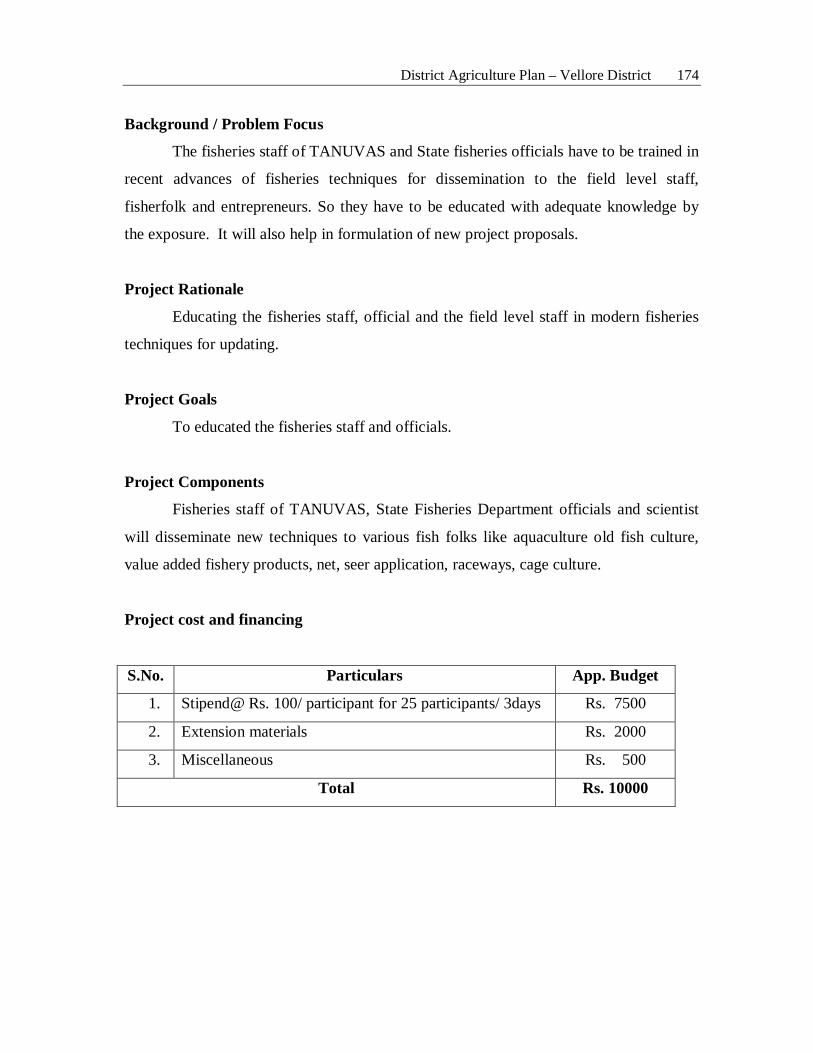
District Agriculture Plan – Vellore District 174
Background / Problem Focus
The fisheries staff of TANUVAS and State fisheries officials have to be trained in
recent advances of fisheries techniques for dissemination to the field level staff,
fisherfolk and entrepreneurs. So they have to be educated with adequate knowledge by
the exposure. It will also help in formulation of new project proposals.
Project Rationale
Educating the fisheries staff, official and the field level staff in modern fisheries
techniques for updating.
Project Goals
To educated the fisheries staff and officials.
Project Components
Fisheries staff of TANUVAS, State Fisheries Department officials and scientist
will disseminate new techniques to various fish folks like aquaculture old fish culture,
value added fishery products, net, seer application, raceways, cage culture.
Project cost and financing
S.No. Particulars App. Budget
1. Stipend@ Rs. 100/ participant for 25 participants/ 3days Rs. 7500
2. Extension materials Rs. 2000
3. Miscellaneous Rs. 500
Total Rs. 10000
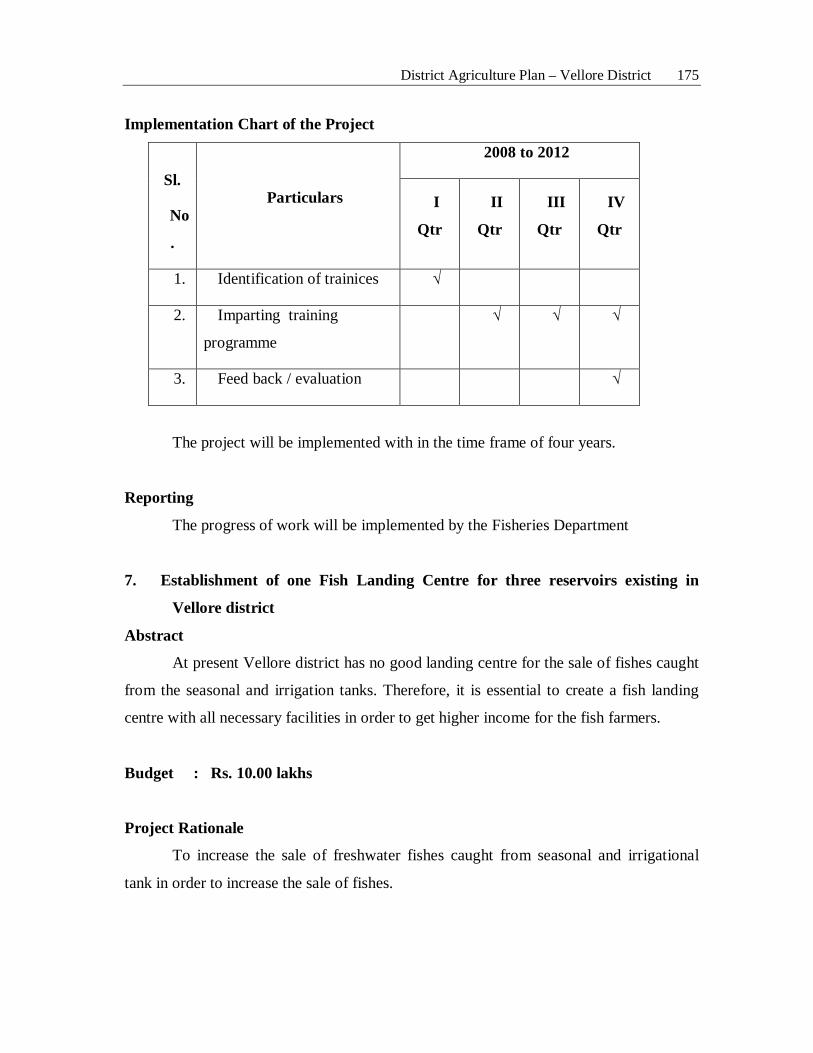
District Agriculture Plan – Vellore District 175
Implementation Chart of the Project
Sl.
No
.
Particulars
2008 to 2012
I
Qtr
II
Qtr
III
Qtr
IV
Qtr
1. Identification of trainices √
2. Imparting training
programme
√ √ √
3. Feed back / evaluation √
The project will be implemented with in the time frame of four years.
Reporting
The progress of work will be implemented by the Fisheries Department
7. Establishment of one Fish Landing Centre for three reservoirs existing in
Vellore district
Abstract
At present Vellore district has no good landing centre for the sale of fishes caught
from the seasonal and irrigation tanks. Therefore, it is essential to create a fish landing
centre with all necessary facilities in order to get higher income for the fish farmers.
Budget : Rs. 10.00 lakhs
Project Rationale
To increase the sale of freshwater fishes caught from seasonal and irrigational
tank in order to increase the sale of fishes.
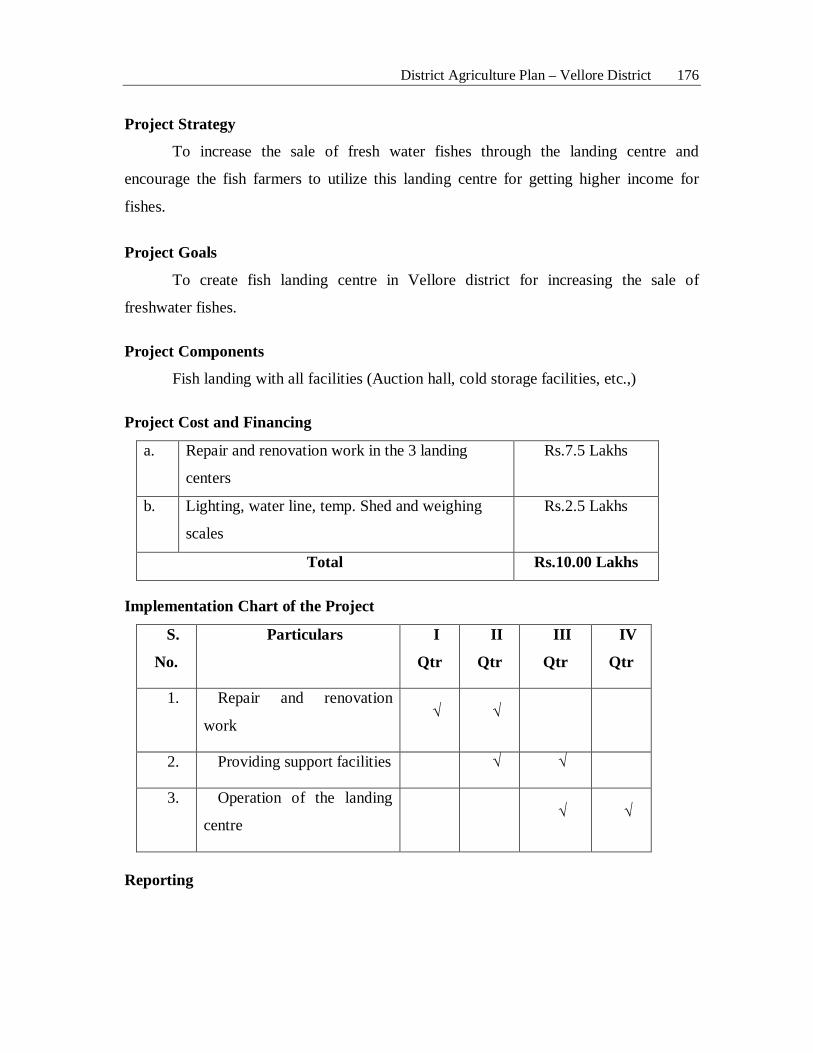
District Agriculture Plan – Vellore District 176
Project Strategy
To increase the sale of fresh water fishes through the landing centre and
encourage the fish farmers to utilize this landing centre for getting higher income for
fishes.
Project Goals
To create fish landing centre in Vellore district for increasing the sale of
freshwater fishes.
Project Components
Fish landing with all facilities (Auction hall, cold storage facilities, etc.,)
Project Cost and Financing
a. Repair and renovation work in the 3 landing
centers
Rs.7.5 Lakhs
b. Lighting, water line, temp. Shed and weighing
scales
Rs.2.5 Lakhs
Total Rs.10.00 Lakhs
Implementation Chart of the Project
S.
No.
Particulars I
Qtr
II
Qtr
III
Qtr
IV
Qtr
1. Repair and renovation
work √ √
2. Providing support facilities √ √
3. Operation of the landing
centre √ √
Reporting
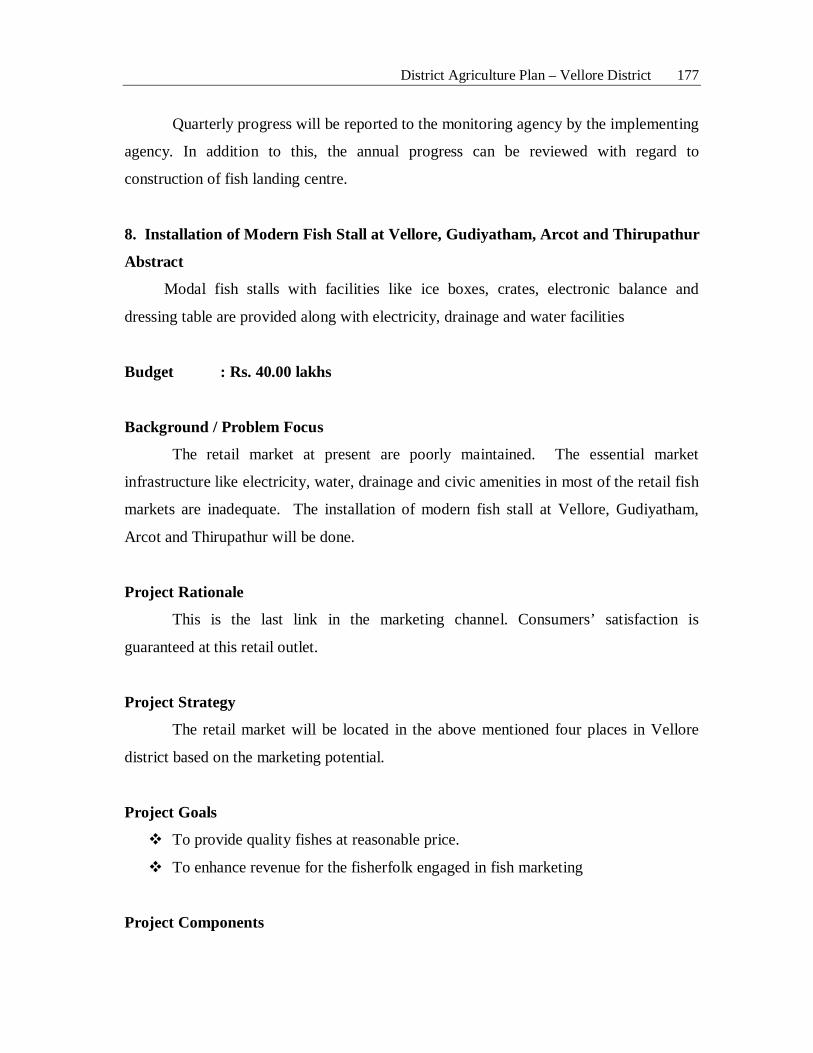
District Agriculture Plan – Vellore District 177
Quarterly progress will be reported to the monitoring agency by the implementing
agency. In addition to this, the annual progress can be reviewed with regard to
construction of fish landing centre.
8. Installation of Modern Fish Stall at Vellore, Gudiyatham, Arcot and Thirupathur
Abstract
Modal fish stalls with facilities like ice boxes, crates, electronic balance and
dressing table are provided along with electricity, drainage and water facilities
Budget : Rs. 40.00 lakhs
Background / Problem Focus
The retail market at present are poorly maintained. The essential market
infrastructure like electricity, water, drainage and civic amenities in most of the retail fish
markets are inadequate. The installation of modern fish stall at Vellore, Gudiyatham,
Arcot and Thirupathur will be done.
Project Rationale
This is the last link in the marketing channel. Consumers’ satisfaction is
guaranteed at this retail outlet.
Project Strategy
The retail market will be located in the above mentioned four places in Vellore
district based on the marketing potential.
Project Goals
To provide quality fishes at reasonable price.
To enhance revenue for the fisherfolk engaged in fish marketing
Project Components

District Agriculture Plan – Vellore District 178
Construction of stall, ice boxes, crates, etc.
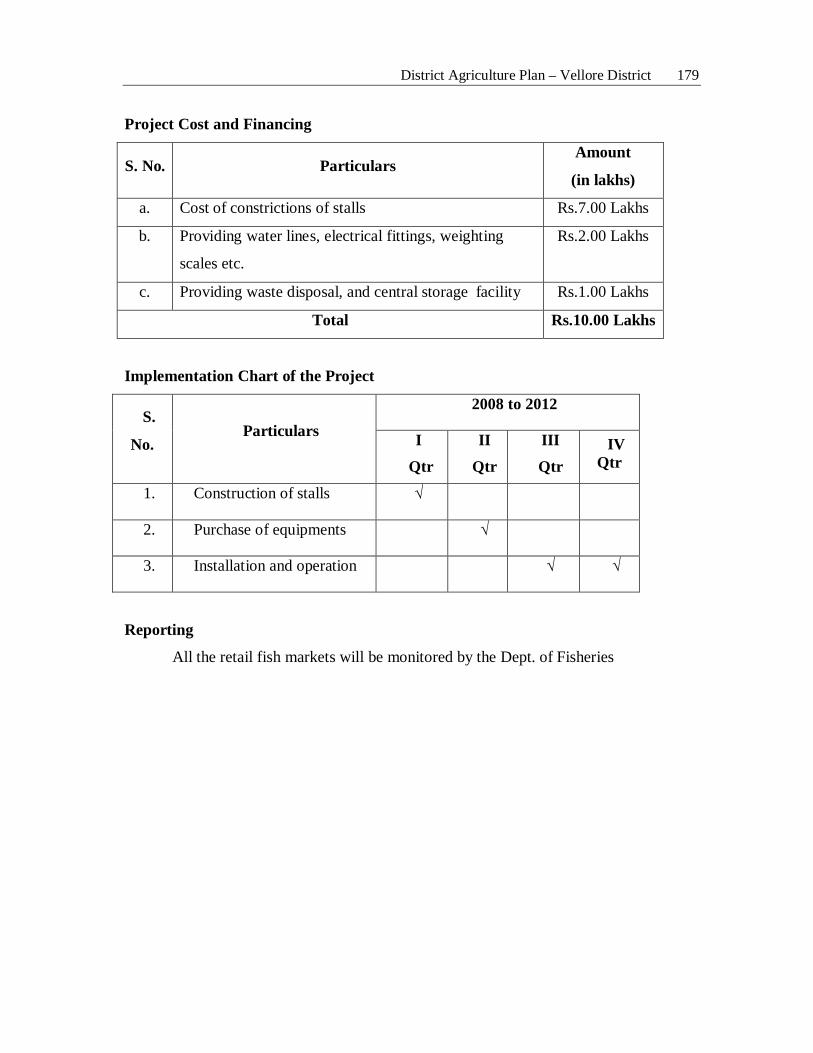
District Agriculture Plan – Vellore District 179
Project Cost and Financing
S. No. Particulars Amount
(in lakhs)
a. Cost of constrictions of stalls Rs.7.00 Lakhs
b. Providing water lines, electrical fittings, weighting
scales etc.
Rs.2.00 Lakhs
c. Providing waste disposal, and central storage facility Rs.1.00 Lakhs
Total Rs.10.00 Lakhs
Implementation Chart of the Project
S.
No. Particulars
2008 to 2012
I
Qtr
II
Qtr
III
Qtr IV
Qtr
1. Construction of stalls √
2. Purchase of equipments √
3. Installation and operation √ √
Reporting
All the retail fish markets will be monitored by the Dept. of Fisheries
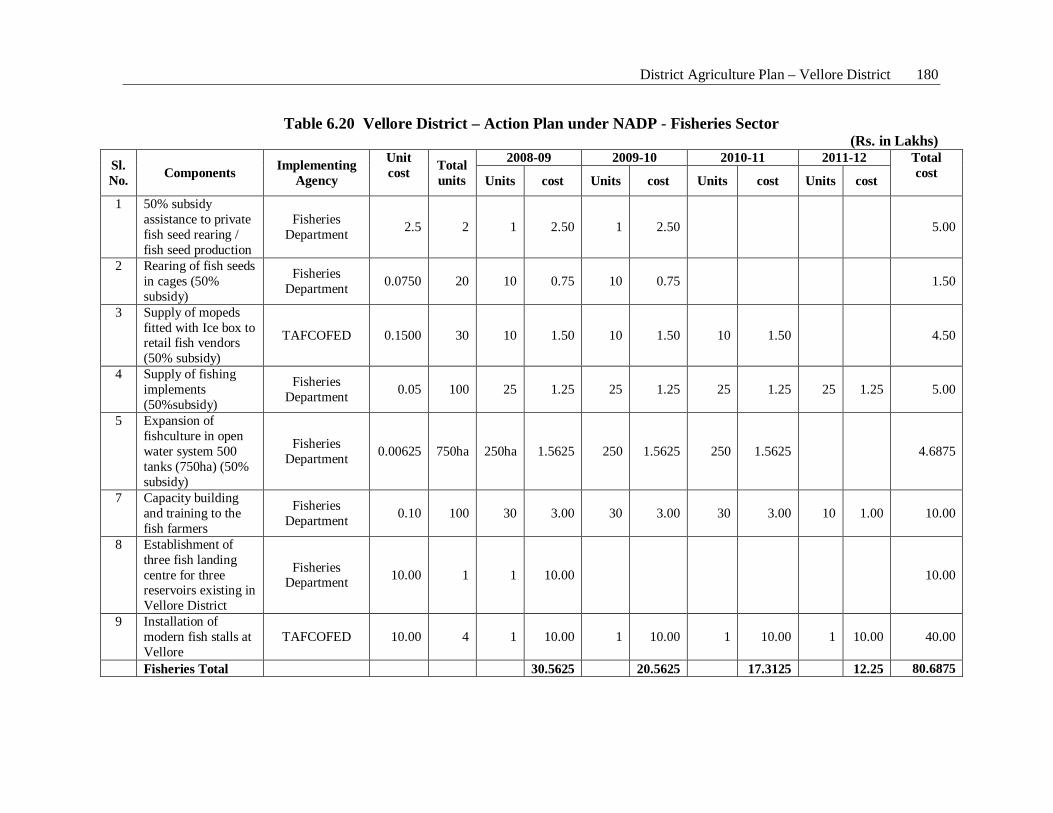
District Agriculture Plan – Vellore District 180
Table 6.20 Vellore District – Action Plan under NADP - Fisheries Sector (Rs. in Lakhs)
Sl. No. Components Implementing
Agency
Unit cost
Total units
2008-09 2009-10 2010-11 2011-12 Total cost
Units cost Units cost Units cost Units cost
1 50% subsidy assistance to private fish seed rearing / fish seed production
Fisheries Department 2.5 2 1 2.50 1 2.50 5.00
2 Rearing of fish seeds in cages (50% subsidy)
Fisheries Department 0.0750 20 10 0.75 10 0.75 1.50
3 Supply of mopeds fitted with Ice box to retail fish vendors (50% subsidy)
TAFCOFED 0.1500 30 10 1.50 10 1.50 10 1.50 4.50
4 Supply of fishing implements (50%subsidy)
Fisheries Department 0.05 100 25 1.25 25 1.25 25 1.25 25 1.25 5.00
5 Expansion of fishculture in open water system 500 tanks (750ha) (50% subsidy)
Fisheries Department 0.00625 750ha 250ha 1.5625 250 1.5625 250 1.5625 4.6875
7 Capacity building and training to the fish farmers
Fisheries Department 0.10 100 30 3.00 30 3.00 30 3.00 10 1.00 10.00
8 Establishment of three fish landing centre for three reservoirs existing in Vellore District
Fisheries Department 10.00 1 1 10.00 10.00
9 Installation of modern fish stalls at Vellore
TAFCOFED 10.00 4 1 10.00 1 10.00 1 10.00 1 10.00 40.00
Fisheries Total 30.5625 20.5625 17.3125 12.25 80.6875
District Agriculture Plan – Vellore District 181
6.4 Agricultural Engineering
The developmental works to be carried out by the Department of Agricultural
Engineering for Vellore district under NADP for XI plan period have been proposed here.
i) Project Rationale
Due to the depletion of ground water and shortage of agricultural labour,
agriculture in Vellore District has become very difficult and uneconomical. Measures to
improve the ground water potential and mechanization of agriculture to solve the labour
demand have become essential to make agriculture viable and remunerative.
ii) Project Strategy
To improve the ground water potential and to mechanize agriculture, the
following components are proposed in this project.
1. Stream I
a) Introduction of newly developed Agricultural machineries / Implements
b) Innovative Water Harvesting Structures and
c) Promoting concept of Mechanized Villages
2. Stream II
a) Popularization of Agricultural Mechanization through conventional machinery /
equipments
b) Conventional Water Harvesting Structures
c) Soil Conservation Works and
d) Water Management Works
To popularize the conventional Agricultural Machineries / equipments, a subsidy
of 25 per cent of the cost of machinery has been proposed. To introduce newly developed
Agricultural Machinery/Equipments, a subsidy of 50 per cent of the cost of machinery
has been proposed whereas a subsidy of 75 per cent has been proposed for gender
District Agriculture Plan – Vellore District 182
friendly equipments. Similarly, 100 per cent subsidy has been proposed for community
Water Harvesting Structures and 90 per cent subsidy has been proposed for individual
Water Harvesting Structures, soil conservation works and water management works.
iii) Project Goals
1. Mechanizing agriculture through popularization of existing machinery/implements and introduction of new machinery/implements thereby making agriculture viable and remunerative.
2. Harvesting rainwater and developing ground water potential 3. Control of soil erosion and management of runoff. 4. Controlling of silt deposition in major reservoirs and 5. Improving agriculture thereby increasing food production.
iv) Project Components
1. Stream I
1. Introduction of Newly Developed Agricultural Machinery / Implements like Mini Combined Harvester, Multi Crop Thrasher, Paddy Transplanter / Maize Husker Sheller,
2. Coconut De-husker, Groundnut Decorticator, Chisel plough, Tractor Operator combined Harvester, etc.,
3. Innovative Water Harvesting Structures like Lined Farm Ponds and Rejuvenation of Percolation Ponds with Recharge shafts,
4. Promoting the concept of Mechanized Villages through Distribution of crop based package of Agricultural Machinery.
2. Stream II
1. Popularization of conventional machinery/equipments like Power Tiller, Rotavator, Cultivator, Offset Disc Harrow, Disc Plough etc.
2. Water Harvesting Structures like Farm Ponds, Check dams, Percolation Ponds, Recharge shaft, New Village Tanks, etc.
3. Soil Conservation Works like Compartmental bunding, Land shaping, Terrace support wall etc.
4. Water Management works like laying PVC Pipes, Ground level Reservoir, Fertigation Assembly, etc.
District Agriculture Plan – Vellore District 183
Abstract of Agricultural Engineering Development Programmes under NADP
1. Name of the District : Vellore
2. State : Tamil Nadu
3. Name of the Department : Agricultural Engineering Department
4. Types of works proposed :
1. Stream I
a) Introduction of newly developed Agricultural Machinery/Implements
b) Innovative Water Harvesting Structures
c) Promoting concept of mechanized villages
2. Stream II
a) Popularisation of Agricultural Mechanisation through Conventional
machinery/equipments
b) Water Harvesting Structures
c) Soil Conservation Works
d) Water Management works
5. Total cost of the project : Stream I - Rs. 1491.29 lakhs
Stream II - Rs. 527.88 lakhs
Total - Rs. 2019.17 lakhs
The budget of the development of Agricultural Engineering activities is given in Table 6.22.
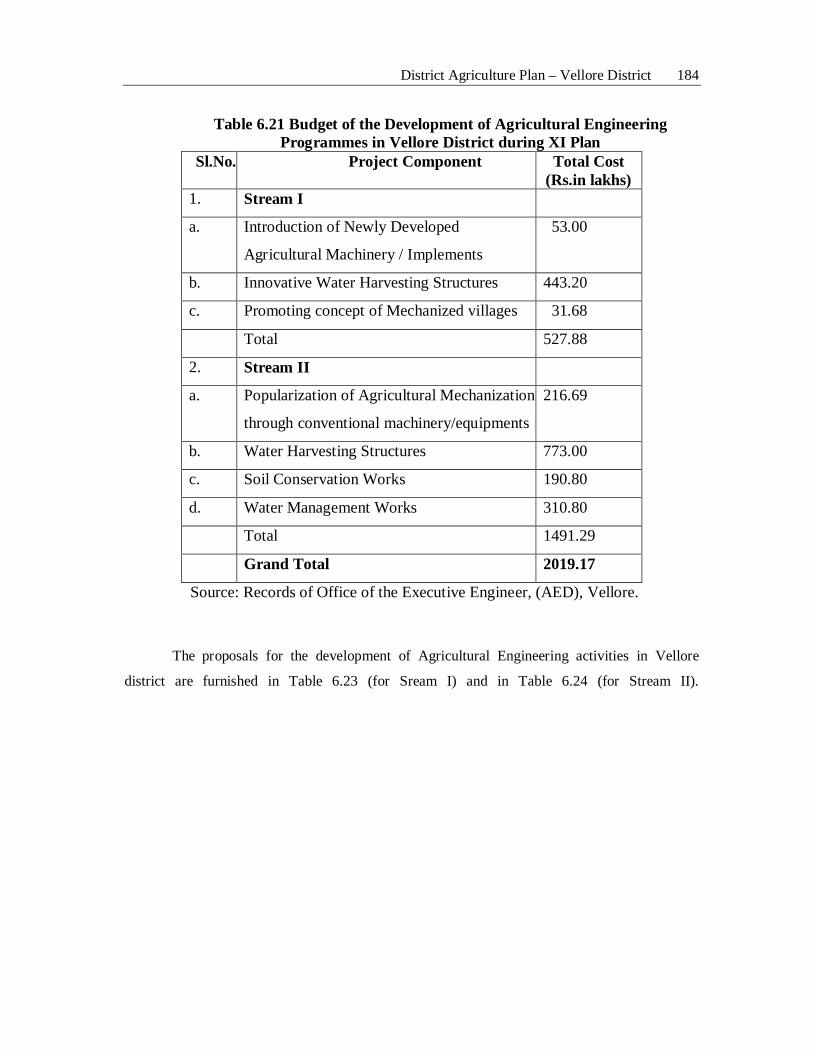
District Agriculture Plan – Vellore District 184
Table 6.21 Budget of the Development of Agricultural Engineering Programmes in Vellore District during XI Plan
Sl.No. Project Component Total Cost (Rs.in lakhs)
1. Stream I
a. Introduction of Newly Developed
Agricultural Machinery / Implements
53.00
b. Innovative Water Harvesting Structures 443.20
c. Promoting concept of Mechanized villages 31.68
Total 527.88
2. Stream II
a. Popularization of Agricultural Mechanization
through conventional machinery/equipments
216.69
b. Water Harvesting Structures 773.00
c. Soil Conservation Works 190.80
d. Water Management Works 310.80
Total 1491.29
Grand Total 2019.17
Source: Records of Office of the Executive Engineer, (AED), Vellore.
The proposals for the development of Agricultural Engineering activities in Vellore
district are furnished in Table 6.23 (for Sream I) and in Table 6.24 (for Stream II).
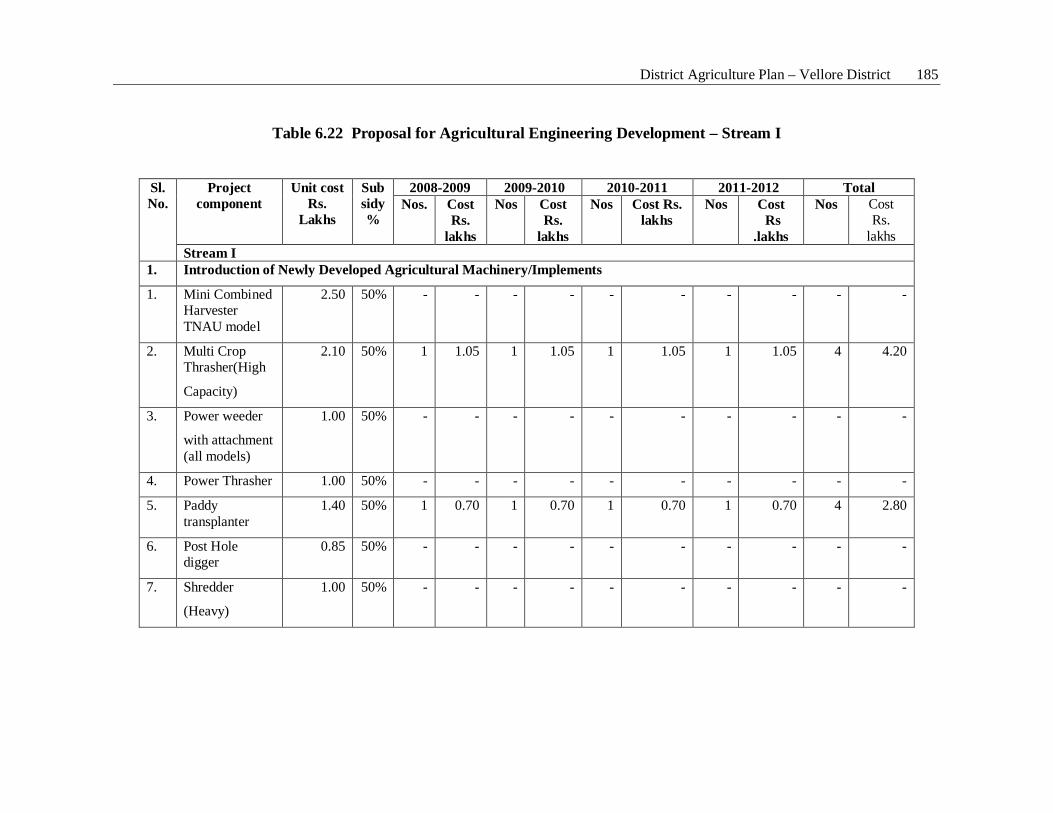
District Agriculture Plan – Vellore District 185
Table 6.22 Proposal for Agricultural Engineering Development – Stream I
Sl. No.
Project component
Unit cost Rs.
Lakhs
Sub sidy %
2008-2009 2009-2010 2010-2011 2011-2012 Total Nos. Cost
Rs. lakhs
Nos Cost Rs.
lakhs
Nos Cost Rs. lakhs
Nos Cost Rs
.lakhs
Nos Cost Rs.
lakhs Stream I
1. Introduction of Newly Developed Agricultural Machinery/Implements
1. Mini Combined Harvester TNAU model
2.50 50% - - - - - - - - - -
2. Multi Crop Thrasher(High
Capacity)
2.10 50% 1 1.05 1 1.05 1 1.05 1 1.05 4 4.20
3. Power weeder
with attachment (all models)
1.00 50% - - - - - - - - - -
4. Power Thrasher 1.00 50% - - - - - - - - - -
5. Paddy transplanter
1.40 50% 1 0.70 1 0.70 1 0.70 1 0.70 4 2.80
6. Post Hole digger
0.85 50% - - - - - - - - - -
7. Shredder
(Heavy)
1.00 50% - - - - - - - - - -
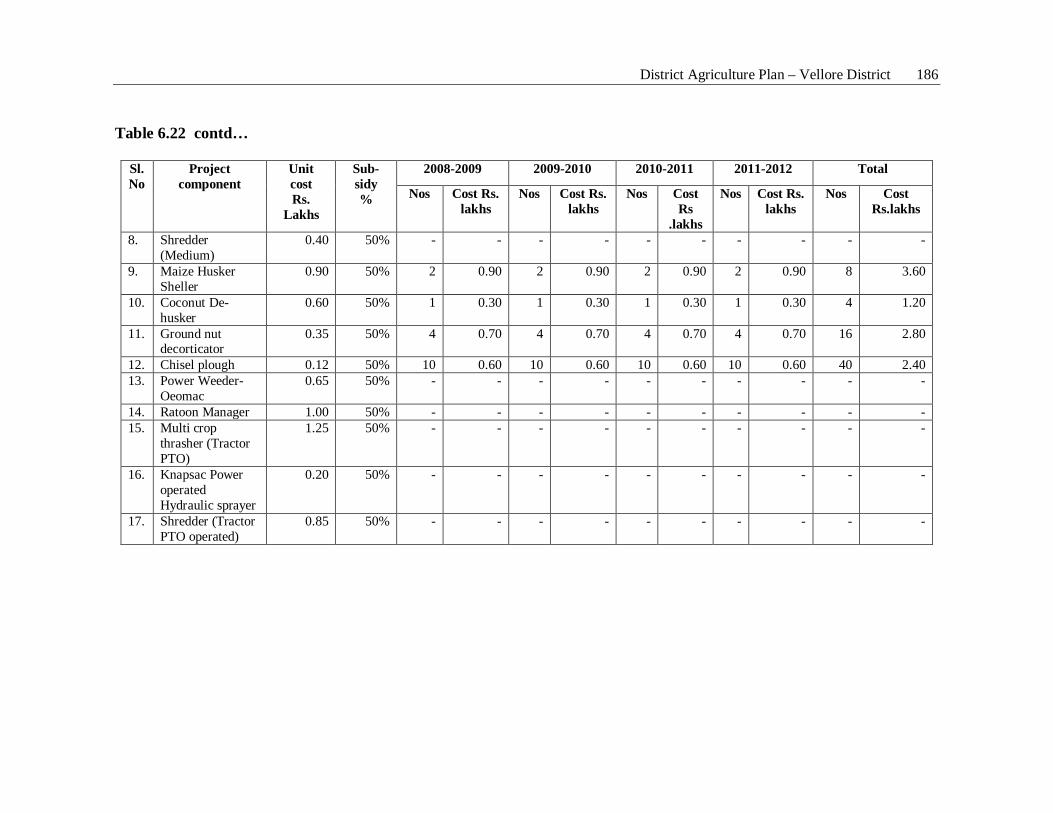
District Agriculture Plan – Vellore District 186
Table 6.22 contd…
Sl. No
Project component
Unit cost Rs.
Lakhs
Sub- sidy %
2008-2009 2009-2010 2010-2011 2011-2012 Total
Nos Cost Rs. lakhs
Nos Cost Rs. lakhs
Nos Cost Rs
.lakhs
Nos Cost Rs. lakhs
Nos Cost Rs.lakhs
8. Shredder (Medium)
0.40 50% - - - - - - - - - -
9. Maize Husker Sheller
0.90 50% 2 0.90 2 0.90 2 0.90 2 0.90 8 3.60
10. Coconut De-husker
0.60 50% 1 0.30 1 0.30 1 0.30 1 0.30 4 1.20
11. Ground nut decorticator
0.35 50% 4 0.70 4 0.70 4 0.70 4 0.70 16 2.80
12. Chisel plough 0.12 50% 10 0.60 10 0.60 10 0.60 10 0.60 40 2.40 13. Power Weeder-
Oeomac 0.65 50% - - - - - - - - - -
14. Ratoon Manager 1.00 50% - - - - - - - - - - 15. Multi crop
thrasher (Tractor PTO)
1.25 50% - - - - - - - - - -
16. Knapsac Power operated Hydraulic sprayer
0.20 50% - - - - - - - - - -
17. Shredder (Tractor PTO operated)
0.85 50% - - - - - - - - - -
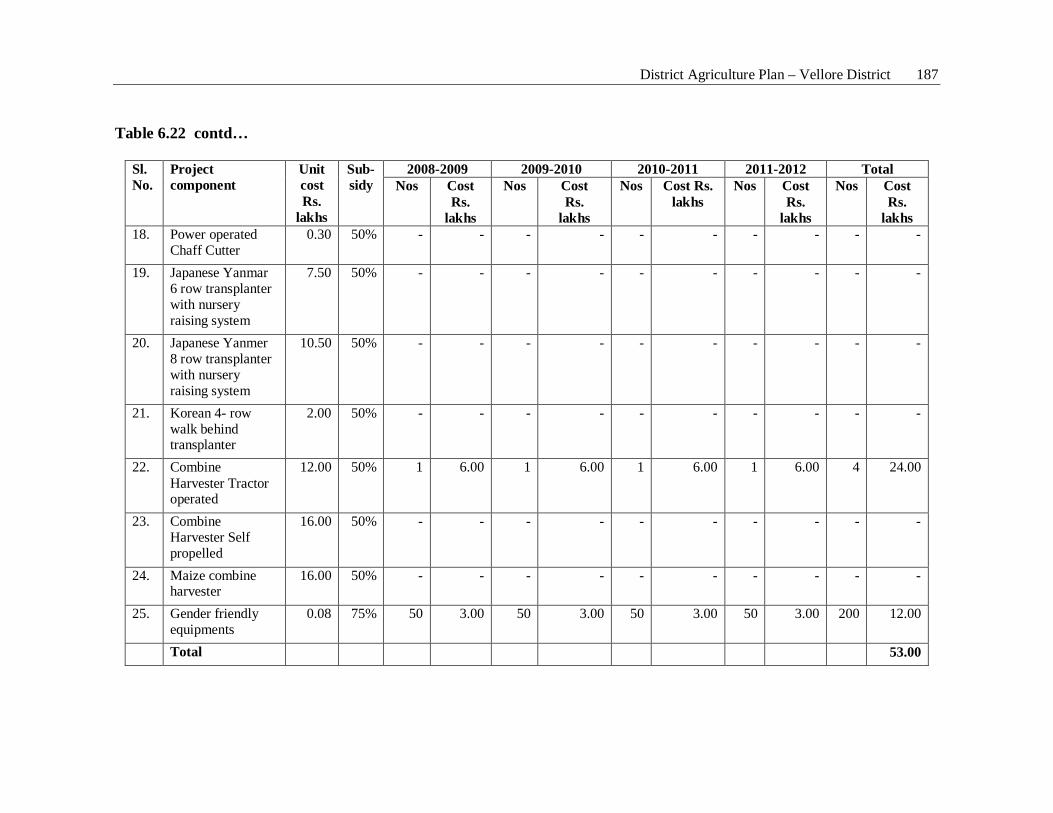
District Agriculture Plan – Vellore District 187
Table 6.22 contd…
Sl. No.
Project component
Unit cost Rs.
lakhs
Sub- sidy
2008-2009 2009-2010 2010-2011 2011-2012 Total Nos Cost
Rs. lakhs
Nos Cost Rs.
lakhs
Nos Cost Rs. lakhs
Nos Cost Rs.
lakhs
Nos Cost Rs.
lakhs 18. Power operated
Chaff Cutter 0.30 50% - - - - - - - - - -
19. Japanese Yanmar 6 row transplanter with nursery raising system
7.50 50% - - - - - - - - - -
20. Japanese Yanmer 8 row transplanter with nursery raising system
10.50 50% - - - - - - - - - -
21. Korean 4- row walk behind transplanter
2.00 50% - - - - - - - - - -
22. Combine Harvester Tractor operated
12.00 50% 1 6.00 1 6.00 1 6.00 1 6.00 4 24.00
23. Combine Harvester Self propelled
16.00 50% - - - - - - - - - -
24. Maize combine harvester
16.00 50% - - - - - - - - - -
25. Gender friendly equipments
0.08 75% 50 3.00 50 3.00 50 3.00 50 3.00 200 12.00
Total 53.00
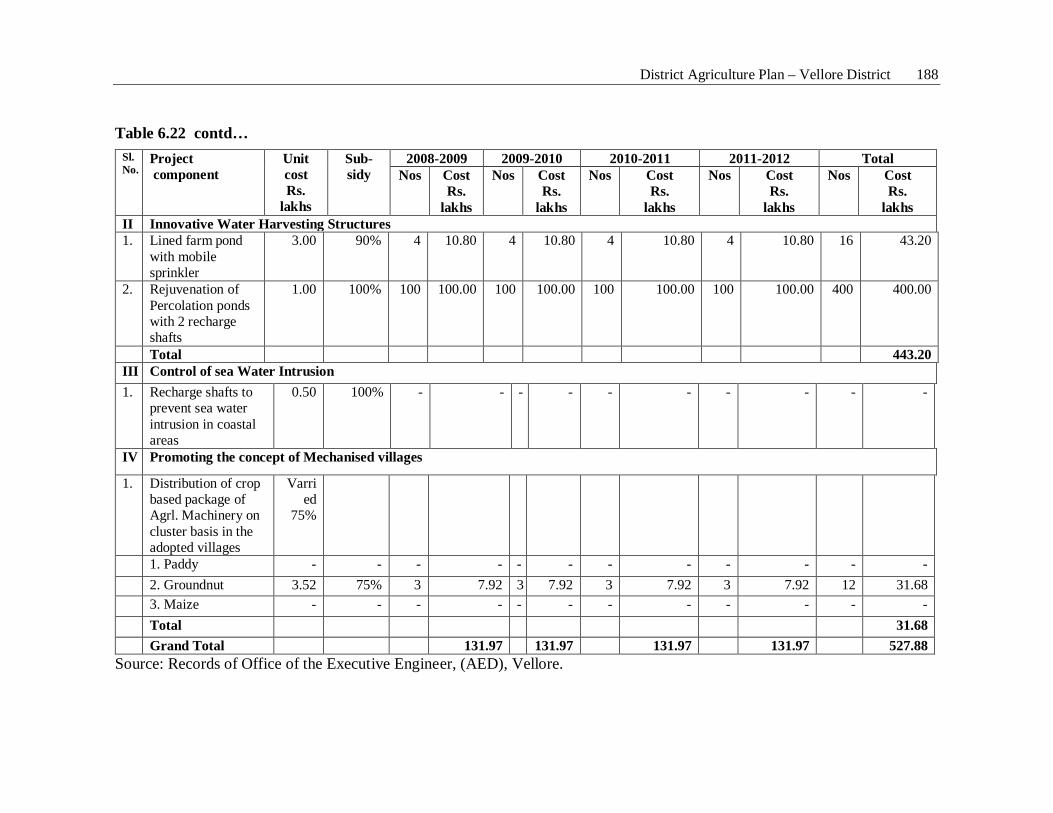
District Agriculture Plan – Vellore District 188
Table 6.22 contd…
Sl. No.
Project component
Unit cost Rs.
lakhs
Sub-sidy
2008-2009 2009-2010 2010-2011 2011-2012 Total Nos Cost
Rs. lakhs
Nos Cost Rs.
lakhs
Nos Cost Rs.
lakhs
Nos Cost Rs.
lakhs
Nos Cost Rs.
lakhs II Innovative Water Harvesting Structures 1. Lined farm pond
with mobile sprinkler
3.00 90% 4 10.80 4 10.80 4 10.80 4 10.80 16 43.20
2. Rejuvenation of Percolation ponds with 2 recharge shafts
1.00 100% 100 100.00 100 100.00 100 100.00 100 100.00 400 400.00
Total 443.20 III Control of sea Water Intrusion 1. Recharge shafts to
prevent sea water intrusion in coastal areas
0.50 100% - - - - - - - - - -
IV Promoting the concept of Mechanised villages
1. Distribution of crop based package of Agrl. Machinery on cluster basis in the adopted villages
Varried
75%
1. Paddy - - - - - - - - - - - - 2. Groundnut 3.52 75% 3 7.92 3 7.92 3 7.92 3 7.92 12 31.68 3. Maize - - - - - - - - - - - - Total 31.68 Grand Total 131.97 131.97 131.97 131.97 527.88
Source: Records of Office of the Executive Engineer, (AED), Vellore.
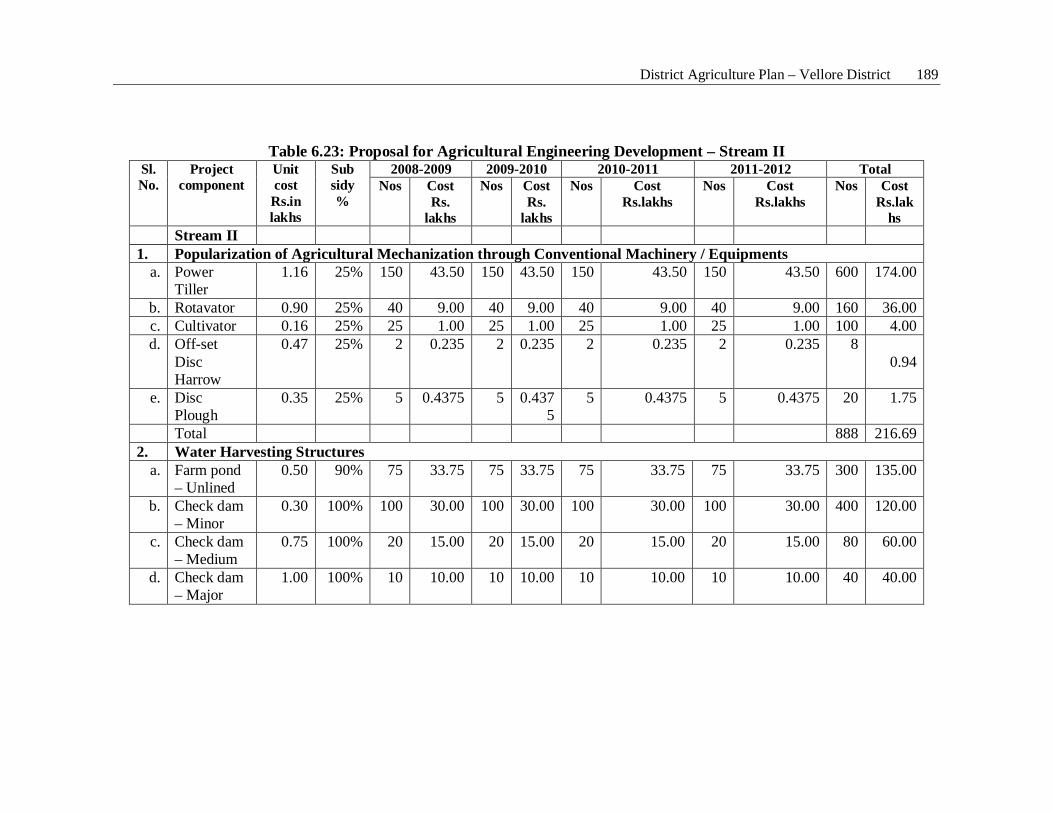
District Agriculture Plan – Vellore District 189
Table 6.23: Proposal for Agricultural Engineering Development – Stream II
Sl. No.
Project component
Unit cost Rs.in lakhs
Sub sidy %
2008-2009 2009-2010 2010-2011 2011-2012 Total Nos Cost
Rs. lakhs
Nos Cost Rs.
lakhs
Nos Cost Rs.lakhs
Nos Cost Rs.lakhs
Nos Cost Rs.lak
hs Stream II 1. Popularization of Agricultural Mechanization through Conventional Machinery / Equipments
a. Power Tiller
1.16 25% 150 43.50 150 43.50 150 43.50 150 43.50 600 174.00
b. Rotavator 0.90 25% 40 9.00 40 9.00 40 9.00 40 9.00 160 36.00 c. Cultivator 0.16 25% 25 1.00 25 1.00 25 1.00 25 1.00 100 4.00 d. Off-set
Disc Harrow
0.47 25% 2 0.235 2 0.235 2 0.235 2 0.235 8 0.94
e. Disc Plough
0.35 25% 5 0.4375 5 0.4375
5 0.4375 5 0.4375 20 1.75
Total 888 216.69 2. Water Harvesting Structures
a. Farm pond – Unlined
0.50 90% 75 33.75 75 33.75 75 33.75 75 33.75 300 135.00
b. Check dam – Minor
0.30 100% 100 30.00 100 30.00 100 30.00 100 30.00 400 120.00
c. Check dam – Medium
0.75 100% 20 15.00 20 15.00 20 15.00 20 15.00 80 60.00
d. Check dam – Major
1.00 100% 10 10.00 10 10.00 10 10.00 10 10.00 40 40.00
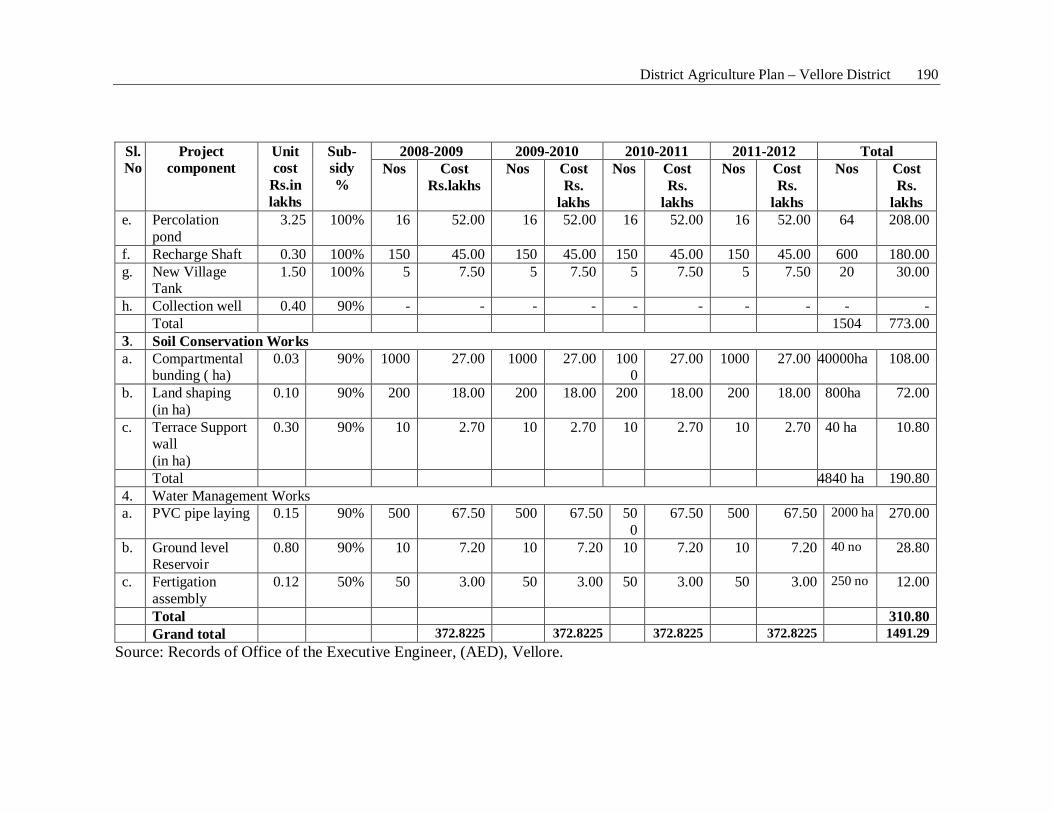
District Agriculture Plan – Vellore District 190
Sl. No
Project component
Unit cost
Rs.in lakhs
Sub-sidy %
2008-2009 2009-2010 2010-2011 2011-2012 Total Nos Cost
Rs.lakhs Nos Cost
Rs. lakhs
Nos Cost Rs.
lakhs
Nos Cost Rs.
lakhs
Nos Cost Rs.
lakhs e. Percolation
pond 3.25 100% 16 52.00 16 52.00 16 52.00 16 52.00 64 208.00
f. Recharge Shaft 0.30 100% 150 45.00 150 45.00 150 45.00 150 45.00 600 180.00 g. New Village
Tank 1.50 100% 5 7.50 5 7.50 5 7.50 5 7.50 20 30.00
h. Collection well 0.40 90% - - - - - - - - - - Total 1504 773.00 3. Soil Conservation Works a. Compartmental
bunding ( ha) 0.03 90% 1000 27.00 1000 27.00 100
0 27.00 1000 27.00 40000ha 108.00
b. Land shaping (in ha)
0.10 90% 200 18.00 200 18.00 200 18.00 200 18.00 800ha 72.00
c. Terrace Support wall (in ha)
0.30 90% 10 2.70 10 2.70 10 2.70 10 2.70 40 ha 10.80
Total 4840 ha 190.80 4. Water Management Works a. PVC pipe laying 0.15 90% 500 67.50 500 67.50 50
0 67.50 500 67.50 2000 ha 270.00
b. Ground level Reservoir
0.80 90% 10 7.20 10 7.20 10 7.20 10 7.20 40 no 28.80
c. Fertigation assembly
0.12 50% 50 3.00 50 3.00 50 3.00 50 3.00 250 no 12.00
Total 310.80 Grand total 372.8225 372.8225 372.8225 372.8225 1491.29
Source: Records of Office of the Executive Engineer, (AED), Vellore.
District Agriculture Plan – Vellore District 191
6.5 Agricultural Marketing
Strengthening of Agricultural Marketing and Agribusiness development in Tamil
Nadu through NADP funding is discussed in this section.
1. Current Status of Agribusiness
Agriculture, as a primary sector provides livelihood to 56per cent of the
population and contributes around 13per cent of the State GDP. In value terms between
65 and 75per cent of agricultural produce is transacted in markets, usually through long
marketing chains, regulated markets and an emerging commercialized retail system in
urban centers. Unorganized small players (handling less than 0.5 tonne / day) process
more than 75 per cent of industry output. The Government is taking efforts to achieve
targeted growth rate of four per cent in Agriculture during XI Plan period. Though fertile
soil, good quality water and long period of sunlight which are the basic requirements for
agriculture are available in abundance in Tamil Nadu, still the productivity has not been
enhanced to its potential level.
The Government is taking efforts to attain sustainable agricultural development
by bringing agriculture as a commercial venture by switching over from the present
method of cultivation through adoption of new scientific method of cultivation to
increase the productivity to manifold, value addition, processing and utilization of
marketing opportunities. To improve the marketing opportunities for agricultural
produce, the Uzhavar Santhai, post harvest management, cold storage facilities for
perishables, food processing, establishment of export zones, terminal markets have been
taken up. To reduce the loss of the food products which are upto 30 per cent, necessary
provisions are made in the Agricultural Industrial Policy to ensure remunerative price to
the produce, encourage food processing sector and export to earn foreign exchange by
increasing the food processing from the present level of one per cent to 10 per cent, out of
the total production, increasing value addition from 7 per cent to 30 per cent. Under this
policy, all assistance which is provided to other industries will be extended to agro based
industries, agricultural machineries and industries manufacturing micro irrigation
equipments.
District Agriculture Plan – Vellore District 192
One Deputy Director of Agriculture (Agri Business) for each district, one
Agricultural Officer for every two blocks, one Assistant Agricultural Officer for one
block have been posted as per restructuring to regulate Agri Business and encourage
entrepreneurs. In 103 Uzhavar Shandies, 51 Agricultural Officers and 52 Deputy
Agricultural Officers are posted. After restructuring 239 original posts have been
enhanced to 906 posts in Agricultural Marketing and Agri Business Department.
2. Agribusiness and the National Development Goals
The Planning Commission’s Mid-Term Appraisal (MTA) of the Tenth Plan notes
that achieving higher growth rates depends on reversing the decline in growth of the
agricultural sector and requires a move away from ‘business as usual’. Under the eleventh
Plan, areas identified for special attention in the agriculture sector included among others:
(i) diversification to high value crops and activities; (ii) increasing cropping intensity;
(iii) strengthening of marketing, processing and value addition infrastructure; (iv)
revamping and modernizing the extension systems and encouraging the private sector to
provide extension services; and (v) bridging the gap between research and farmers’
yields.
For the agriculture sector, the eleventh Plan projected an annual growth rate of 4
per cent which was seen as achievable if growth of 6 to 8 per cent could be achieved in
horticulture. These growth rates have not been attempted largely because constraints
identified in the Plan have not been overcome. These constraints include lack of modern
and efficient infrastructure, poor technological support and post harvest management,
underdeveloped and exploitative market structures, inadequate research and extension to
address specific agricultural problems and linkages with farmers and industry. The strong
relationship between agriculture and rural poverty means that current plans, policy and
sector performance will be unable to address the needs of rural poor.
The two most important programs related to agribusiness development are the
Technology Mission for Integrated Development of Horticulture (TM) and the National
Horticultural Mission (NHM). The focus of the TM is production of horticultural
District Agriculture Plan – Vellore District 193
products in Hill states, whereas post harvest management and processing have only a
nominal presence. The NHM has a broader coverage of states and addresses issues of
market infrastructure development and processing. However, the key issue of
coordination within value chains is not addressed. There needs to be a better
understanding of why despite generous subsidies in the past, progress has been slow with
private investment in market infrastructure and development of the processing industry.
At present 21 Market committees are functioning in Tamil Nadu at district Level There
are 277 Regulated Markets, 15 Check Posts, 108 Rural Godowns and 108 grading centres
functioning under the Market Committees
3. Major Constraints and Challenges in Agricultural Marketing and Agribusiness Development in the State Current agricultural marketing and agribusiness system in the state is the outcome
of several years of Government intervention. The system has undergone several changes
during the last 50 years owing to the increased marketed surplus; increase in urbanization
and income levels and consequent changes in the pattern of demand for marketing
services; increase in linkages with distant and overseas markets; and changes in the form
and degree of government intervention. An important characteristic of agricultural
produce markets in Tamil Nadu has been that private trade has continued to dominate the
market. With the large quantities required to be handled by the private trade, the size and
structure of markets over time have considerably expanded. There are a large number of
wholesalers and retailers to handle the trade in food grains. Apart from traders,
processors also play an important role as they also enter in the market as bulk buyers and
sellers.
Agricultural development continues to remain the most important objective of
State planning and policy. The experience of agricultural development in the state has
shown that the existing systems of delivery of agricultural inputs and marketing of
agricultural output have not been efficient in reaching the benefits of technology to all the
sections of farmers. The timely, quality and cost effective delivery of adequate inputs still
remains a dream despite the marketing attempts of the corporate sector and the
District Agriculture Plan – Vellore District 194
developmental programmes of the state. Also, the farmers are not able to sell their surplus
produce remuneratively. There are plenty of distress sales among farmers both in
agriculturally developed as well as backward regions in the State. There are temporal and
spatial variations in the markets and the producers’ share in consumers’ rupee has not
been satisfactory, except for a few commodities. In fact, in some commodities like
tomato in some regions in State, producers end up making net losses at the same time
when traders make substantial profits from the same crop. However, it needs to be
recognized that producers’ relative share in the final price of a product certainly goes
down with the increase in the number of value-adding stages, and therefore, cannot be
used as an indicator of a market’s efficiency or inefficiency. Nevertheless, the other
aspects of the market performance like absolute share of the producer in terms of
remunerability, fluctuations in prices across seasons, large spatial price differences and
lack of proper market outlets itself, are the issues which have become increasingly crucial
in the present context. There are structural weaknesses of agricultural markets like
unorganized suppliers as against organized buyers, weak holding capacity of the
producers and the perishable nature of the produce in the absence of any storage
infrastructure. In the presence of these characteristics of the market, the rural producers
cannot simply be left to fend for themselves so far as marketing of their produce is
concerned. And if the marketing system does not assure good returns to producers, not
much can be achieved in the field of product quality and delivery which are critical for
processing and manufacturing sectors. In the environment of liberalization and
globalization, the role of the state in agricultural marketing and input supply is being
reduced, and an increasing space is being provided to the private sector to bring about
better marketing efficiency in input and output markets. On the other hand, processors
and/or marketers face problems in obtaining timely, cost effective, and adequate supply
of quality raw materials.
Small farms produce more than 35 percent of State total grain, and over half of
total fruits and vegetables despite being resource constrained. The marginal holdings
have higher cropping intensity compared with that of the small, medium and large
District Agriculture Plan – Vellore District 195
farmers, mainly owing to higher irrigated area as percentage of net sown area. The small
and marginal farmers are certainly going to stay for long time in State though they are
going to face a number of challenges. Therefore, what happens to small and marginal
farmers has implications for the entire State and people’s livelihoods. But, they can
adequately respond to these challenges only if there is efficient marketing system for
handling their small surpluses. Otherwise, they will only be losers in the process of
globalization and liberalization. The viability of the small holdings is an important issue
and promoting agricultural diversification towards high value crops through an efficient
marketing system is argued to be one of the means through which this can be achieved.
Hence there is an urgent need for specific intervention in agricultural marketing in Tamil
Nadu.
4. Sector Problem Analysis
The core problem for agribusiness development in Tamil Nadu is the general
failure in coordinating the decisions of private stakeholders (e.g. farmers, traders and
agro-processors in the case of the agrifood system) and service providers from the public,
private and nongovernmental organizations (NGO) sectors.
Farmers fail to link among themselves through effective producer organizations to
be able to undertake joint decisions in production and marketing. Farmers have weak
linkages with enterprises and often fail to link effectively to markets because of limited
access to relevant market intelligence and inadequate market infrastructure. Farmers are
also poorly linked to research and extension providers to be able to address their specific
technology and knowledge needs that would enable them to innovate into high value
production systems.
Entrepreneurs have weak linkages with farmers through contacts and vertical
integration arrangements and are distant from consumers because of the absence of
organized retail chains. Linkages with service providers are characterized by a lack of
confidence particularly in the case of research and extension organizations. The absence
District Agriculture Plan – Vellore District 196
of proper certification, quality assurance systems and inadequate infrastructure continues
to limit the integration of production with international markets.
Most of the service providers’ agencies fail to link with each other, particularly
during implementation of national programs. Links between states and central agencies
are often limited. Service providers from the public sector are often unable to provide
effective services due to lack of funding, bureaucratic hurdles and the lack of a culture
that is client and business oriented. Most NGOs are not used to working in the field of
enterprise development and their presence in the agribusiness sector is marginal. Service
providers from the private sectors are emerging but are mainly oriented to the needs of
corporate clients rather than small and medium enterprises or producer groups that
dominate total production.
Past interventions to improve technology, infrastructure and access to credit and
markets had modest impact on growth of the sector. The policy assumption that more
funds and subsidies will lead to the desired results has proven to be incorrect. Steps for
ensuring coordination within each value chain have not been recognized. In spite of
subsidies, progress has been slow with few effective value chains emerging and few
stakeholders investing in market infrastructure such as the cooperative sector in
Bangalore. The capacity of individuals, groups and service providers to understand and
practice value chain principles and management remains low.
For growth to accelerate substantially a new way of thinking about agribusiness
development in Tamil Nadu and promoting agribusiness is needed. This new way, and
the related business practices that go with it, implies overcoming significant coordination
failures. This requires appropriate institutional mechanisms that currently do not exist
within current policy setting.
District Agriculture Plan – Vellore District 197
5. Project Rationale
The rationale for the proposed Augmentation of Agricultural Marketing and
Agribusiness development in Tamil Nadu through NADP funding is based on the
following:
i. The rate of agricultural growth over the past decade has been declining in
Tamil Nadu. Agribusiness through its linkages to production, industry and
services has the potential to transform the agricultural system into a more
dynamic sector.
ii. As urbanization and incomes grow, there is a growing demand for a wider
range of agrifood products, of higher quality and greater convenience, in
Tamil Nadu. Meeting this demand requires organized retailing and effective
agribusiness supply chains.
iii. Agribusiness contributes to the production of higher value products and
diversification away from staple foods. Through this diversification and the
development of the value chain between producers and consumers, the rural
economy benefits from innovation and the creation of non-farm employment.
iv. Tamil Nadu has a comparative advantage in a number of agricultural
commodities. Increasing integration with global markets and the potential to
become a stronger player in agricultural trade requires quality assurance and
competitive advantage.
v. The State Government has identified agribusiness development as a strategic
priority. In Tamil Nadu, agribusiness has a significant role to play in rural and
economic development, and agro-enterprises could be a major source of rural
non-farm employment and income.
vi. The existing government programs to promote agricultural diversification are
broad-based programs with multiple objectives. For agribusiness development
to happen a more focused approach is needed to complement the initiatives
already covered by the different national programs.
District Agriculture Plan – Vellore District 198
6. Project Strategy
The project will promote the Agri-business practices and models required to
support agribusiness development in Tamil Nadu, allowing the sector to contribute to
economic growth, particularly in rural areas. New Agri-business practices will be
introduced relating to: (i) farmers and entrepreneurs engaging service providers to solve
specific technology problems (ii) learning to work together in the value chain (iii) making
effective use of market intelligence in decision making; and (iv) making investments in
supply chain infrastructure and market places.
7. Project Approach
The project aims at improving business practices needed for agribusiness
development in Tamil Nadu. Profit motivations are critical to the improvement of
business practices. Rather than starting from a production point of view, stakeholders are
encouraged to start from understanding market requirements and opportunities. The
project will help stakeholders to access the relevant technologies and knowledge services
needed for realizing the identified profit opportunities. Those profit opportunities are
realized by working together with other stakeholders in the value chain, and by
improving linkages through investments and existing physical infrastructure.
8. Project Goals
The expected impact of the project will be an increasingly competitive
agribusiness sector, informed by the adoption of improved business practices in the
Agriculture sector, leading to diversification, higher value addition, and higher incomes
for farmers, farm workers and entrepreneurs and reduced rural poverty. The expected
outcome of the project will be increased benefits (incomes) for farmers, farm workers and
entrepreneurs in the selected value chains.
Through the adoption of improved agribusiness practices the project will facilitate
the development of a competitive agribusiness sector in Tamil Nadu, promoting
diversification and contributing to the transformation of agriculture into a system
producing higher value and contributing to the reduction of poverty in rural areas.
District Agriculture Plan – Vellore District 199
The envisaged project’s interventions will provide higher value for consumers,
value that will be shared as distributed benefits to value chain stakeholders including
farmers, entrepreneurs and workers. This will be achieved through activities that improve
business practices related to use of market information, investment in technology transfer
and knowledge services, development of value chain linkages and investment in market
infrastructure. The distributed benefits will provide incentive for ongoing involvement
and further innovation from which the sector can extend its development.
The project impact is to develop an increasingly competitive agribusiness sector
in Tamil Nadu attained through the adoption of improved business practices in the
horticultural sector leading to higher value added and higher income of farmers, farm
workers and entrepreneurs, particularly women amongst them.
The project outcome is increased benefits to farmers, entrepreneurs and workers
who are involved in selected value chains in Tamil Nadu
9. Project components
1. Establishment/ organization of commodity groups for marketing in the state with financial assistance from NADP
2. Facilitation of Contract Farming between farmers and bulk buyers in the state with financial assistance from NADP
3. Dissemination of Market intelligence 4. Arrangement of Buyers - Sellers Meet 5. Organizing the exposure visits to important markets within the state and outside
the state by commodity groups / farmers and extension functionaries. 6. Strengthening of market extension centre at each district/ block level for capacity
building and dissemination of marketing information. 7. Strengthening of selected village shandies with financial assistance from NADP 8. Capacity building of farmer’s skill 9. Price surveillance 10. Regulated Market uzhavar Shandies Publicity 11. Market Infrastructure
District Agriculture Plan – Vellore District 200
10. Project Components Description
10.1 Establishment/ organization of commodity groups for marketing in the state
with financial assistance from NADP
i) Project Rationale
According to Government sources, the inefficient marketing system leads to an
avoidable waste of around Rs 50,127 crore. A major part of this can be saved by
introducing scale and technology in agricultural marketing. Milk and eggs marketing are
two success areas of role of scale and technology in marketing. The extent to which the
farmer-producers will benefit (out of saving of avoidable waste) depends on the group-
marketing practices adopted by the farmers. In this sense, Farmers’ Groups/ Commodity
Groups need to be promoted for undertaking marketing activities on behalf of the
individual members of the group.
Based on the international experience, in view of expanding retail trade,
organizing the farmers and equipping the commodity groups can facilitate the
aggregation of produce and also enhance the bargaining power of the farmers. The
experience in Malaysia, Thailand and Philippines indicated that the retail chains will
depend on some intermediary agency for sourcing the produce. If this role can be taken
by the farmers’ commodity groups, the commodities can move directly to the market
without any intermediary. Further, adoption of technology both in production and post-
harvest management which is expected to flow from the organized retailers and other
research institutions can be efficient through the farmers’ commodity groups. There is no
single model for organizing the farmers for the whole country. Depending on the strength
of the existing farmers’ institutions, various models could be adopted. The model of
farmers’ marketing commodity groups cannot be the same throughout the country. It can
be cooperatives, SHGs or any other form. Therefore it is proposed to organize the
commodity groups for marketing of agricultural commodities in Tamil Nadu over the
period of four years.
District Agriculture Plan – Vellore District 201
ii) Project Strategy
Formation of commodity groups for group marketing in the state with financial
assistance from NADP
iii) Project Goals
Organizing Group Marketing of major agricultural commodities for realizing
higher prices through establishing commodity groups is the project goal.
iv) Project Components:
1. Organising meetings with large number of farmers 2. Identification of willing / co operating Farmers 3. Organising the willing farmers in to groups 4. Periodical meeting with groups and coordinating the activities
v) Project cost and Financing
Arranging / organising Commodity Groups involves several rounds of meeting
with large number of farmers to begin with and finally arriving at about required number
of farmers for group cultivation of marketing. To organize these, an amount of
Rs.20000/= is provided per group.
In this project it is proposed to organize 210 commodity groups in four (ground
nut, maize, coconut and pulses) commodities for marketing of agricultural commodities
in Vellore district over the period of four years. This will require resources of Rs 50.36
lakhs for the period of four years. The details are presented in Table 52.
vi) Reporting
1. Quarterly progress reports to be sent to the Deputy Director (Agricultural Marketing and Agri Business) by the concerned Agricultural Officer (Agricultural Marketing and Agri Business) and Secretaries of Marketing Committees.
2. Periodical Inspection to be undertaken by the Deputy Director (Agricultural Marketing and Agri Business)
District Agriculture Plan – Vellore District 202
10.2 Facilitation of Contract Farming between farmers and bulk buyers in the state with financial assistance from NADP i) Project Rationale
Apart from linking the farmer to consumer through farmers’ organizations,
another initiative for reducing transaction cost is establishment of direct channel between
farmer-processor/bulk consumers, through contract farming (CF). For different reasons,
both farmers and farm product processors/distributors may prefer contracts to complete
vertical integration. A farmer may prefer a contract which gives access to additional
sources of capital, and a more certain price by shifting part of the risk of adverse price
movement to the buyer. Farmers also get an access to new technology and inputs,
including credit, through contracts which otherwise may be beyond their reach. For a
processor or distributor, contracts are more flexible in the face of market uncertainty,
make smaller demands on scarce capital resources, and impose less of an additional
burden of labour relations, ownership of land, and production activities, on management.
At more macro economic level, contracting can help to remove market
imperfections in produce, capital (credit), land, labour, information and insurance
markets; facilitate better coordination of local production activities which often involve
initial investment in processing, extension etc.; and can help in reducing transaction
costs. It has also been used in many situations as a policy step by the state to bring about
crop diversification for improving farm incomes and employment. CF is also seen as a
way to reduce costs of cultivation as it can provide access to better inputs and more
efficient production methods. The increasing cost of cultivation was the reason for the
emergence of CF in Japan and Spain in the 1950s and in the Indian Punjab in the early
1990s. Though there are concerns about the ability of the small farms and firms to
survive in the changing environment of agribusiness, still there are opportunities for them
to exploit like in product differentiation with origin of product or organic products and
other niche markets. But, the major route has to be through exploitation of other factors
like external economies of scale through networking or clustering and such other
alliances like CF.
District Agriculture Plan – Vellore District 203
Marketing tie-ups between farmers and processors or bulk purchasers have special
significance for small farmers, who have small marketed surplus and do no have staying
power. Such arrangements are being encouraged to help in reducing price risks of farmers
and to also expand the markets for farm products. It is to be noted that contract farming
of sugarcane is going on for the last more than 50 years in Tamil Nadu. In case of cotton,
maize and medicinal plants there are few cases of contract farming. Contract farming in
milk, eggs and broiler production is successfully taking place in large scale in Tamil
Nadu. The lessons learnt in case of sugarcane, cotton and other commodities have to be
taken into account during formulation of the project. For this in this NADP programme
facilitation contract farming between the traders and producer is proposed.
ii) Project Strategy
Facilitation of contract farming between the traders and producer by organising
buyers and sellers meet in the block levels
iii) Project Components
1. Organising meeting with farmers, large scale buying firms, crop insurance companies and banks.
2. Identification of willing / co operating Farmers/ commodity clusters 3. Organising the willing farmers in to groups 4. Arranging the Groups to have contract/agreement with select large scale buyers,
banks and crop insurance firms. 5. Periodical watching of contracts and conflict management.
iv) Project cost and Financing
Arranging / organising Commodity Groups involve several rounds of meeting
with large number of farmers and traders, train them in contract specification and monitor
them. To organize these an amount of Rs.10,000/- is provided.
In this project it is proposed to organize the meeting on various crops regarding
contract farming between farmers and bulk buyers in Vellore district for marketing of
agricultural commodities in Tamil Nadu over the period of four years. This will require
resources of Rs. 15.87 lakhs for the period of four years. The Details are presented in
Table 6.25.
District Agriculture Plan – Vellore District 204
v) Implementation Chart of the project
Implementation chart of the project is given in Table 6.25.
vi) Reporting
1. Quarterly progress reports to be sent to the Deputy Director (Agricultural Marketing
and Agri Business) by the concerned Agricultural Officer (Agricultural Marketing
and Agri Business) and Secretaries of Marketing committees.
2. Periodical Inspection undertaken by the Deputy Director (Agricultural Marketing
and Agri Business)
10. 3. Dissemination of Market intelligence
i) Project Rationale
Rural (primary and periodic) Markets are the first contact points of farmers with
the market economy, both for selling and buying. As there have been high price
differentials many times between the Wholesale Markets and the Rural Markets, there is
room for arbitrage which is being exploited by the traders to their advantage. Therefore, it
is imperative to make the Wholesale Markets as the price discovery point and the Rural
Markets as the price takers with due consideration for transport and other costs. As the
Rural Markets have few traders, the tendency to collude among them is high. In the
Wholesale Markets, as traders are many, one can expect a fair price. In a country like
India with 70 percent of its population living in about 6.25 lakhs villages and depending
on agriculture as their main occupation, accurate and timely information about the market
prices of the agricultural commodities is of extreme significance.
The most important marketing information is price data. Agricultural price data
are based on thousands or millions of transactions, many of them on a small scale, that
are taking place every day all over the country. Collecting an adequate sample and
making sure that these are representative enough to be useful is not an easy task. As
farmers become more market oriented, extension workers need to be in a position to
District Agriculture Plan – Vellore District 205
advise them not only on how to grow crops but also on how to market them. Knowledge
of produce handling, storage and packaging is also essential. An understanding of costs
and margins is essential for all those involved with agricultural marketing. Before any
agro-processing venture is started, or before an existing venture decides to expand its
product line, an understanding of the market for the planned products is essential. Market
research can never guarantee success but it can certainly increase the likelihood that the
new business will turn out to be profitable. Hence in this project is included the
dissemination of market intelligence provided by the Domestic and Export Market
Intelligence Cell, Centre for Agricultural and Rural Development Studies, Tamil Nadu
Agricultural University, Coimbatore and other agencies.
ii) Project Strategy
• Dissemination of Market intelligence provided by the Domestic and Export Market
• Intelligence Cell, Centre for Agricultural and Rural Development Studies, Tamil
Nadu Agricultural University, Coimbatore and other agencies through different
mass media.
iii) Project Components
1. Procurement of market intelligence reports and
2. Dissemination of Market intelligence to all the Stake holders through different
mass media.
iv) Project cost and Financing
In this project it is proposed to disseminate Market intelligence of agricultural
commodities to all the Stake holders through different mass media in Vellore district over
the period of four years. This will require resources of Rs.31.26 lakhs for the period of
four years. The details are presented in Table 6.25.
District Agriculture Plan – Vellore District 206
v) Implementation Chart of the project
Implementation chart of the project is given in Table 6.25.
vi) Reporting
1. Quarterly progress reports to be sent to the Deputy Director (Agricultural
Marketing and Agri Business) by the concerned Agricultural Officer (Agricultural
Marketing and Agri Business) and Secretaries of Marketing committees.
2. Periodical Inspection undertaken by the Deputy Director (Agricultural Marketing
and Agri Business).
10.4. Arrangement of Buyers - Sellers Meet
i) Project Rationale
Indian farmers usually produce diverse goods and services to meet the family
requirements. Marketable surpluses, if any, are disposed off immediately after harvest to
meet the cash requirements when prices are generally depressed and often to specific
buyers who have provided credit.
There is limited market for all good and services produced by the farmers in the
vicinity. In contrast, quite often, they buy goods and services in lean period when prices
are generally higher. Therefore, the nature, degree and the complexity of the problems
faced vary among the farmers, regions, and markets.
Several alternatives are available within each market for the farmers. Critical
evaluation of the alternatives is important in deciding a profitable set to determine the
overall profitability of the farms.
The most important aspect of the agricultural market intelligence is to create
awareness about the demand and quality requirements for various agricultural produce
District Agriculture Plan – Vellore District 207
among farmers and also to build knowledge on the availability of various agricultural
commodities among the traders.
There is increasing pressure on all segments of the agriculture produce economy
to respond to the challenges that the global markets pose in the new post: WTO world
trade order.
Buyers and sellers meet functions as platform linking agribusiness community
namely farmers, traders, commission agents, agricultural processed food organizations,
millers, machinery manufacturers in an egalitarian exchange of ideas and materials.
It is beautifully explained as a business partnership between producers and
buyers to enhance their knowledge for mutual gain.
Arrangement of these meetings brings together the two important aspect of
success i.e. technology and human resources. Besides display of agricultural commodities
through exhibitions, the meet aspect covers all the latest market related interventions and
provides need based solutions to farmers through direct contact with experts.
ii) Project cost and Financing
In this project it is proposed to arrange for 14 buyers sellers meet in Vellore
district over the period of four years. This will require resources of Rs.3.28 lakhs for the
period of four years. The details are presented in Table 6.25.
10.5 Organizing the exposure visits to important markets within the state and outside the state by commodity groups / farmers and extension functionaries.
i) Project Rationale
The goal of 4 per cent growth in agriculture can only be achieved by increasing
productivity per unit of land. Considering the costs and constraints of resources such as
water, nutrients and energy, the genetic enhancement of productivity should be coupled
District Agriculture Plan – Vellore District 208
with input use efficiency. This can be made possible only by creation and utilization of
new and improved technology. Since new technology creation and development is a slow
process, for attaining the desired 4per cent growth during the XIth Plan period, we will
have to rely more on known and proven technology. Agriculture research system claims
to have a large number of promising technologies to achieve high growth and promote
farming systems that improve natural resource base. However, these are not seen at
farmers’ fields at large. Visit of other areas, where new technologies are being
implemented successfully i.e., exposure visits is an important thing to enlighten the
farmers for implementing those technologies in their areas also. It is easy to know the
new technology through demonstration. Farmers will be selected to visit different places
within the State where the technologies are well adopted. Therefore it is proposed to
organize the exposure visit to important markets within the state and outside the state by
commodity groups / farmers and extension functionaries in the state for marketing of
agricultural commodities in Tamil Nadu over the period of four years.
ii) Project Strategy
Organizing the exposure visits to important markets within the state and outside
the state by commodity groups / farmers and extension functionaries.
iii) Project Goals
Organizing the exposure visit to important markets within the state and outside
the state by commodity groups / farmers and extension functionaries in the state for
marketing of agricultural commodities in Tamil Nadu over the period of four years from
NADP funding.
iv) Project Components
1. Organizing the exposure visit to important markets within the state by commodity groups / farmers.
2. Organizing the exposure visit to important markets outside the state by commodity groups / farmers
3. Organizing the exposure visit to important markets within the state and outside the state by extension functionaries
District Agriculture Plan – Vellore District 209
v) Project cost and Financing
Visit of important markets, where new opportunity for marketing of the
commodity and consumer preference i.e., exposure visits SAFAL market Bangalore is an
important thing to enlighten the farmers for marketing their produce as well as consumer
preference. It is easy to know the marketing of the commodity through observation and
participation in the well developed markets. Farmers will be selected to visit different
market places within the State where the new opportunities for marketing of commodities
exist. This will require resources of Rs.72.74 lakhs for the period of four years. The
details are presented in Table 6.24.
vi) Reporting
1. Quarterly progress reports to be sent to the Deputy Director (Agricultural
Marketing and Agri Business) by the concerned Agricultural Officer (Agricultural
Marketing and Agri Business) and Secretaries of Marketing committees.
2. Periodical Inspection undertaken by the Deputy Director (Agricultural Marketing
and Agri Business)
10.6. Strengthening of market extension centre at each district/ block level for capacity building and dissemination of marketing information.
i) Project Rationale
Over the last few years mass media has seen a phenomenal growth in the country
both in terms of reach and advance in technology. This medium has not been exploited to
its full potential for the purpose of agricultural extension specifically market led
extension. A concerted and well-coordinated effort now needs to be made to use the
electronic media in the Extension strategy by strengthening infrastructure facility. Market
led Extension is now becoming more diversified, technology intensive, knowledge
oriented and more demand-driven. This requires the extension workers at the cutting edge
level to be master of so many trades, which is neither practicable nor possible. Use of IT
in extension enables the extension workers to be more effective in meeting the
information needs of farmers. The growing Information and communication technology
District Agriculture Plan – Vellore District 210
is used widely in the entire developmental sector except in agricultural sector. Use of
interactive multimedia and such other tools will help the extension workers to serve the
farmers better. Similarly, extension systems have to utilize the existing print and
electronic mass media for faster dissemination of information to farmers. The
technological advancement in telecommunication and space technology has to be fully
tapped for devising appropriate programs for farmers. Hence there is a urgent need to
strengthening of market extension centre at each district/ block level with LCD projectors
and lap top computer including internet facilities.
ii) Project Strategy
Strengthening of market extension centre at each district/ block level for capacity
building and dissemination of marketing information.
iii) Project Goals
Strengthening of market extension centre at each district/ block level for capacity
building and dissemination of marketing information in Tamil Nadu over the period of
four years from NADP funding.
iv) Project Components
Strengthening of market extension centre at each district/ block level.
v) Project cost and Financing
Over the last few years mass media has seen a phenomenal growth in the country
both in terms of reach and advance in technology. This medium has not been exploited to
its full potential for the purpose of agricultural extension specifically market led
extension. A concerted and well-coordinated effort now needs to be made to use the
electronic media in the Extension strategy by strengthening infrastructure facility. In this
project it is proposed to strengthening market extension centre in Vellore district over the
period of four years. This will require resources of Rs. 5.0 lakhs for the period of four
years. The Details are presented in Table 6.24.
District Agriculture Plan – Vellore District 211
vi) Reporting
1. Quarterly progress reports to be sent to the Deputy Director (Agricultural Marketing and Agri Business) by the concerned Agricultural Officer (Agricultural Marketing and Agri Business) and Secretaries of Marketing committees.
2. Periodical Inspection undertaken by the Deputy Director (Agricultural Marketing and Agri Business)
10.7. Strengthening of selected village shandies with financial assistance from NADP
i) Project Rationale
Considering the importance of Rural Primary Markets, there is an urgent need to
develop these rural periodic markets in a phased manner with necessary infrastructural
amenities to have a strong base of the marketing channel. The task of developing more
than 21,000 Rural Periodic Markets is a gigantic one. Therefore, only selected markets
will be developed initially and the rest could be developed in phases. The selection of
markets is based on economic considerations rather than financial viability in view of
their socio-economic importance and equity. Considering the existing constraints in the
markets, the modernization should provide for transparent auction system for price
discovery of the agricultural produce, bulk weighing arrangement, bulk handling, proper
parking, waste disposal, and storage facility. The details of infrastructure needed for an
ideal wholesale market are given below:
1. Grading Facilities 2. Price Display Mechanism
3. Electronic Weighing Machine
ii) Project Strategy
Strengthening of selected village shandies through establishing Grading Facilities,
Standardization Facilities, Price Display Mechanism and Electronic Weighing Machines
iii) Project Components
1. Establishing Grading Facilities
2. Establishing Standardization Facilities
3. Purchasing and Establishing Price Display Mechanism and Electronic Weighing
Machines
District Agriculture Plan – Vellore District 212
iv) Project cost and Financing
In this project it is proposed to strengthen Village Shandies in Vellore district
over the period of four years. This will require resources of Rs. 1.62 lakhs for the period
of four years. The Details are presented in Table 6.25.
v) Reporting
1. Quarterly progress reports to be sent to the Deputy Director (Agricultural
Marketing and Agri Business) by the concerned Agricultural Officer (Agricultural
Marketing and Agri Business) and Secretaries of Marketing committees.
2. Periodical Inspection undertaken by the Deputy Director (Agricultural Marketing
and Agri Business)
10.8. Capacity Building of Farmers’ Skill
i) Project Rationale
Apart from pursuing policies and creating formal organizations to intervene in
agricultural marketing, governments have adopted several programmes of providing
market support services. It appears that the types of programmes initiated cover a very
wide spectrum of possible solutions to help small and marginal farmers. However, the
benefits have not adequately reached the intended target groups. The main reason is that
agricultural marketing and business related aspects of training, education and research
have remained neglected in our country.
The role of the market as knowledge and information exchange amongst the
converging farmers needs to be appreciated and harnessed. Farmers get benefit from
deregulation of markets, minimum guaranteed price scheme, contract farming, and
crop/income insurance, only to the extent they organize in marketing groups, self-help
groups, cooperatives or companies and learn skills suited to the new marketing
environment. Understanding quality standards (including FAQ), learning the terms of
contract and insurance, and choosing and preparing the produce for the market are going
to be essential skills for farmers. There is a need for greater synergy between extension
District Agriculture Plan – Vellore District 213
services and market. State Marketing Departments and Boards, APMCs, Krishi Vigyan
Kendras (KVKs), Marketing Cooperatives, NGOs and PRIs should pay increasing
attention to train the farmers in marketing related skills. All stakeholders in the Supply
Chain (i.e. from farmers to consumers) should be exposed to the following characteristics
and complexities of the marketing system to make it more efficient. Hence in this project
the following training programmes are proposed with budget requirement of Rs. 139.46
lakhs.
Training on Warehousing and storage
Training on Grading
Training on Market intelligence
Training on Post Harvest Management of selected commodities
Massive awareness programme is to be undertaken to demystify the commodity
futures markets and enable the farmers to enter into futures contract so as to insure
their price risk.
Training to farmers on selected commodities for Export Promotion.
ii) Project Strategy
Training will be organized for farmers / commodity groups on Warehousing and
storage, Grading, Market intelligence, Post Harvest Management of selected commodities
and awareness programme is to be undertaken to demystify the commodity futures
markets and enable the farmers to enter into futures contract so as to insure their price
risk in the state with financial assistance from NADP.
iii) Project Components
Organising training to farmers / commodity groups on Warehousing and storage,
Grading, Market intelligence, Post Harvest Management of selected commodities and
awareness programme is to be undertaken to demystify the commodity futures markets
and enable the farmers to enter into futures contract so as to insure their price risk
District Agriculture Plan – Vellore District 214
iv) Project Cost and Financing
In this project it is proposed to organize about 1183 trainings under Capacity
Building of Farmers Skill titles for marketing of agricultural commodities in Vellore
district over the period of four years. This will require resources of Rs.139.46 lakhs for
the period of four years. The Details are presented in Table 6.25.
v) Reporting
1. Quarterly progress reports to be sent to the Deputy Director (Agricultural
Marketing and Agri Business) by the concerned Agricultural Officer (Agricultural
Marketing and Agri Business) and Secretaries of Marketing committees.
2. Periodical Inspection undertaken by the Deputy Director (Agricultural Marketing
and Agri Business)
10.9. Strengthening of selected Market Infrastructure (Equipments)
i) Rationale
Considering the importance of different Markets, there is an urgent need to
develop these markets in a phased manner with necessary infrastructural amenities to
have a strong base of the marketing channel. Suitability and adequacy of marketing
infrastructure depends on the type and quantity of marketed surpluses of agricultural
produce in the State. The estimated marketed surpluses of various commodities given
below would reflect the need for improvement in the market infrastructure in coming
years.
Estimates of Marketed Surpluses of Various Commodities
Commodity Marketed surplus ratio (per cent)
Rice 51.9 Wheat 53.8 Jowar 39.7 Bajra 45.4 Maize 46.2 Other Coarse Cereals 57.1 Pulses 53.9
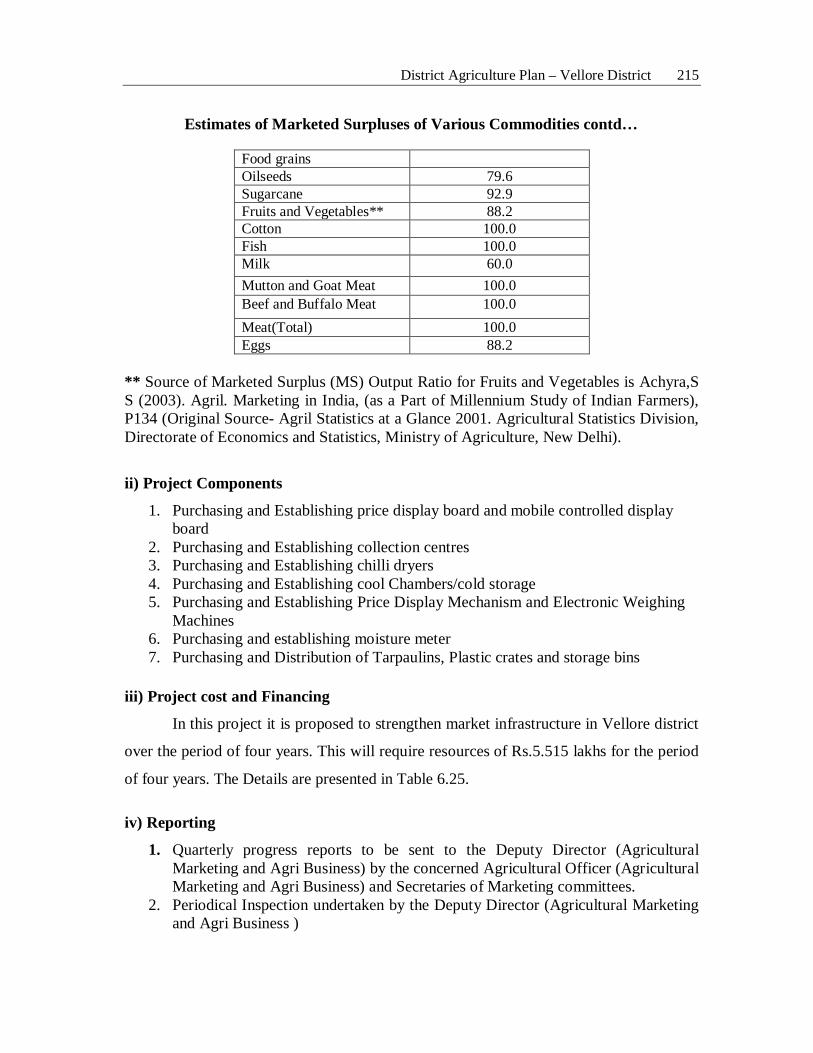
District Agriculture Plan – Vellore District 215
Estimates of Marketed Surpluses of Various Commodities contd…
Food grains Oilseeds 79.6 Sugarcane 92.9 Fruits and Vegetables** 88.2 Cotton 100.0 Fish 100.0 Milk 60.0 Mutton and Goat Meat 100.0 Beef and Buffalo Meat 100.0 Meat(Total) 100.0 Eggs 88.2
** Source of Marketed Surplus (MS) Output Ratio for Fruits and Vegetables is Achyra,S S (2003). Agril. Marketing in India, (as a Part of Millennium Study of Indian Farmers), P134 (Original Source- Agril Statistics at a Glance 2001. Agricultural Statistics Division, Directorate of Economics and Statistics, Ministry of Agriculture, New Delhi).
ii) Project Components
1. Purchasing and Establishing price display board and mobile controlled display board
2. Purchasing and Establishing collection centres 3. Purchasing and Establishing chilli dryers 4. Purchasing and Establishing cool Chambers/cold storage 5. Purchasing and Establishing Price Display Mechanism and Electronic Weighing
Machines 6. Purchasing and establishing moisture meter 7. Purchasing and Distribution of Tarpaulins, Plastic crates and storage bins
iii) Project cost and Financing
In this project it is proposed to strengthen market infrastructure in Vellore district
over the period of four years. This will require resources of Rs.5.515 lakhs for the period
of four years. The Details are presented in Table 6.25.
iv) Reporting
1. Quarterly progress reports to be sent to the Deputy Director (Agricultural Marketing and Agri Business) by the concerned Agricultural Officer (Agricultural Marketing and Agri Business) and Secretaries of Marketing committees.
2. Periodical Inspection undertaken by the Deputy Director (Agricultural Marketing and Agri Business )
District Agriculture Plan – Vellore District 216
10.10. Establishment of Price surveillance mechanism through NADP Funding
i) Rationale
Collection of real time data in the open markets for major agricultural
commodities and further analysis is essential for forecasting of prices well in advance of
the sowing season so that farmers can take their sowing decisions on a scientific basis.
This will enhance the income of the farmers which is one of the objectives of the project.
ii) Project Components
This involves collection of data on prices of different commodities in the
unregulated markets in the notified area. This entails collection of time series and
current/real time data which will be sent to Domestic and Export Market Intelligence Cell
of Tamil Nadu Agricultural University, for processing and further analysis to forecast
prices of major agricultural commodities.
iii) Project cost and Financing
In this project it is proposed to collect data at a minimum interval of one month
from major assembly markets on a continuous basis in Vellore district over the period of
four years. This will require resources of Rs. 0.95 lakhs for the period of four years. The
details are presented in Table 6.25.
iv) Reporting
1. Quarterly progress reports to be sent to the Deputy Director (Agricultural Marketing and Agri Business) by the concerned Agricultural Officer (Agricultural Marketing and Agri Business) and Secretaries of Marketing committees.
2. Periodical Inspection undertaken by the Deputy Director (Agricultural Marketing and Agri Business)
10.11. Strengthening of Regulated Market and Uzhavar Shandies Publicity i) Rationale Arrivals to market yards of regulated markets are only about 15 per cent of the
marketed surplus in Tamil Nadu. Similarly sale through Uzhavar Shandies is also limited
in case of fruits and vegetables. Hence it is necessary to have publicity programme on the
District Agriculture Plan – Vellore District 217
benefits of sale through regulated markets and Uzhavar Shandies so that the net price
realized by the farmers could be increased. To achieve this publicity and propaganda
programmes will be undertaken in this district for the next four years.
ii) Project Components
Hoardings, publicity through F.M. radio, posters, folders, wall paintings and
village cultural programmes will form the components.
iii) Project cost and Financing
In this project it is proposed to have the publicity programmes with the above
components in this district with a financial outlay of Rs. 23.0 lakhs over the period of
four years. The details are presented in Table 6.25.
iv) Reporting
1. Quarterly progress reports to be sent to the Deputy Director (Agricultural
Marketing and Agri Business) by the concerned Agricultural Officer (Agricultural
Marketing and Agri Business) and Secretaries of Marketing committees.
2. Periodical Inspection undertaken by the Deputy Director (Agricultural Marketing
and Agri Business)
11. Project cost
The total cost for development of agricultural marketing so as to increase the
profitability of farmers would be Rs.349.05 lakhs for this district for the next four years.
12. Implementation
Department of Agricultural Marketing and Agribusiness, Government of Tamil
Nadu will be the implementing agency for proposed project. The Deputy Director of
Agricultural Marketing along with the team of Officials and the Secretary of District
Market Committees and team of Officials of Market Committee and Regulated Markets
will be implementing the project jointly.
District Agriculture Plan – Vellore District 218
13. Project Performance Monitoring System
Outcomes of the project will be measured against initial baseline data which will
provide a benchmark for future interventions. The details of each monitoring and
evaluation activity will be refined and finalized during the first six months of the project,
as a joint effort of the management of the project, the stakeholders and technical
assistance by the Performance Monitoring Evaluation unit.
14. Sustainability
Project sustainability refers to the continuation of benefits generated by the
project even after project completion. Through the project activities, stakeholders will
improve their capacity in identifying market opportunities and taking sound business
decisions regarding investment, production and marketing. The improved capacity will
result in the emergence of profitable enterprises to be able to adapt better market
conditions and seize existing opportunities and benefits; the enterprises and the benefits
will continue to exist even after the completion of the project. However, the success of
the project also depends on the sustainability of some of the institutional mechanisms
(for example DEMIC) introduced by the project. In some cases, the institutional support
will have to be continued for the benefits to continue to flow after the completion of the
project and result in the models and practices introduced by the project to be replicated
by other stakeholders in the agricultural sector in the state.
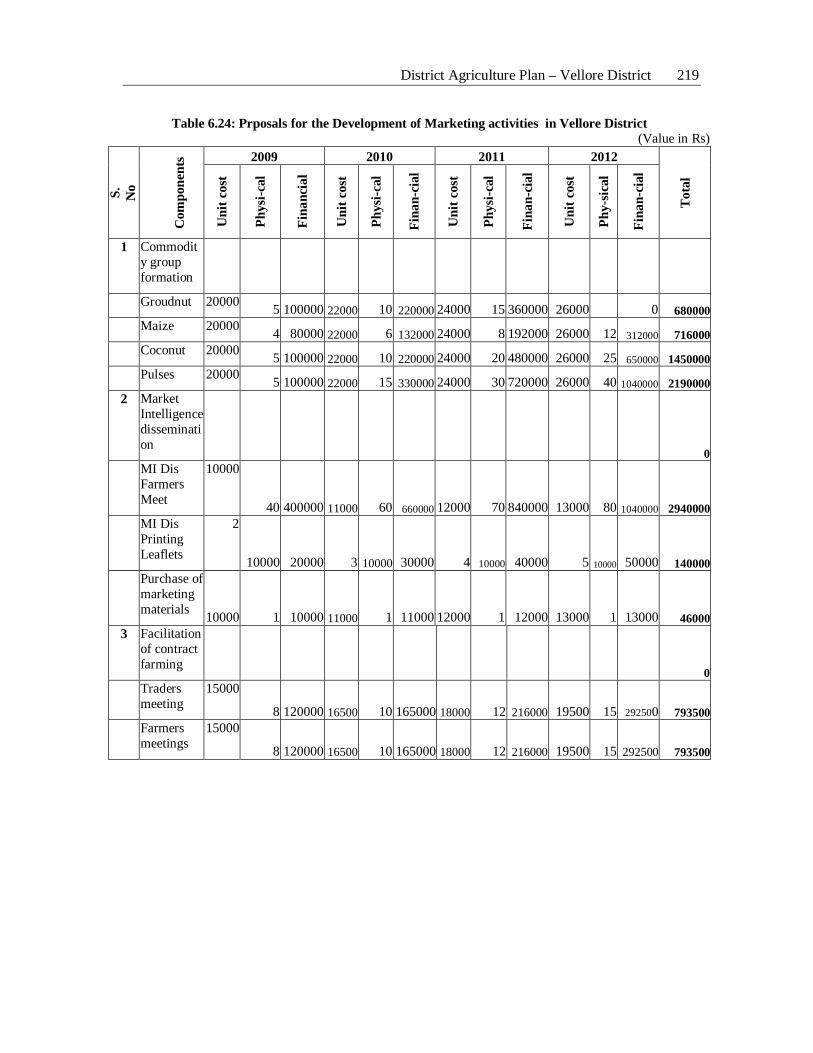
District Agriculture Plan – Vellore District 219
Table 6.24: Prposals for the Development of Marketing activities in Vellore District (Value in Rs)
S.
N
o C
ompo
nent
s 2009 2010 2011 2012
Tot
al
Uni
t cos
t
Phys
i-cal
Fina
ncia
l
Uni
t cos
t
Phys
i-cal
Fina
n-ci
al
Uni
t cos
t
Phys
i-cal
Fina
n-ci
al
Uni
t cos
t
Phy-
sica
l
Fina
n-ci
al
1 Commodit
y group formation
Groudnut 20000 5 100000 22000 10 220000 24000 15 360000 26000 0 680000 Maize 20000 4 80000 22000 6 132000 24000 8 192000 26000 12 312000 716000 Coconut 20000 5 100000 22000 10 220000 24000 20 480000 26000 25 650000 1450000 Pulses 20000 5 100000 22000 15 330000 24000 30 720000 26000 40 1040000 2190000 2 Market
Intelligence dissemination 0
MI Dis Farmers Meet
10000
40 400000 11000 60 660000 12000 70 840000 13000 80 1040000 2940000
MI Dis Printing Leaflets
2
10000 20000 3 10000 30000 4 10000 40000 5 10000 50000 140000
Purchase of marketing materials 10000 1 10000 11000 1 11000 12000 1 12000 13000 1 13000 46000
3 Facilitation of contract farming 0
Traders meeting
15000
8 120000 16500 10 165000 18000 12 216000 19500 15 292500 793500
Farmers meetings
15000
8 120000 16500 10 165000 18000 12 216000 19500 15 292500 793500
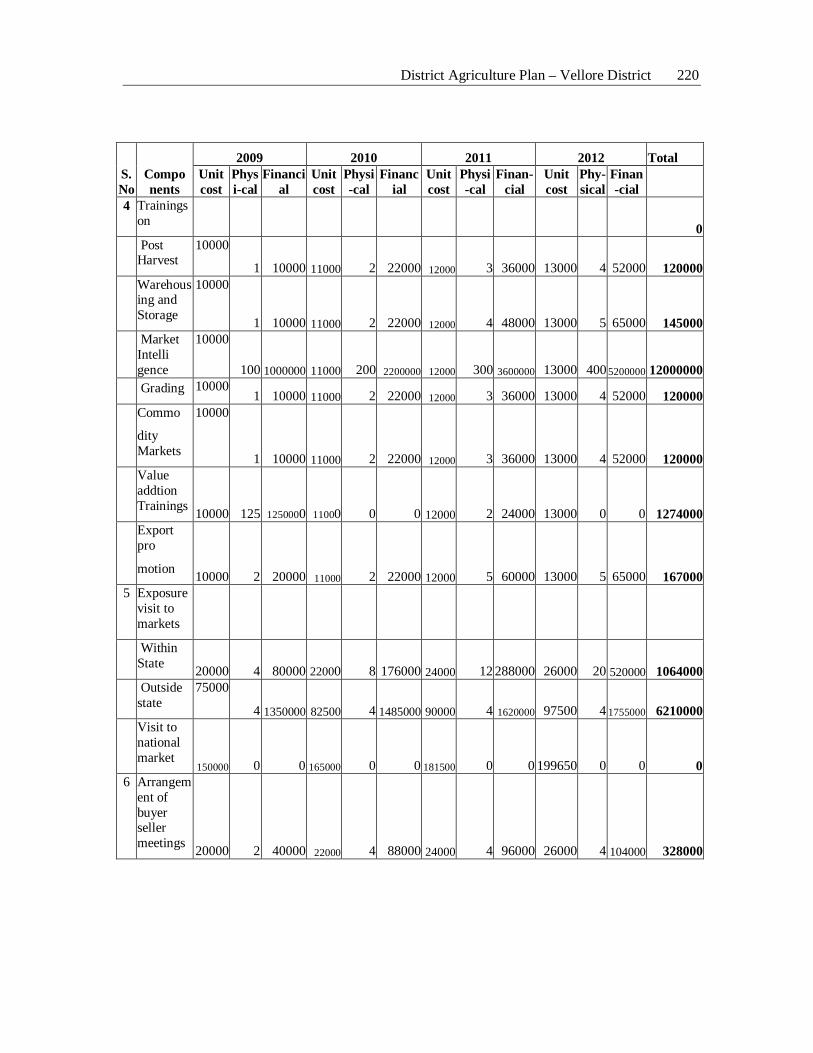
District Agriculture Plan – Vellore District 220
S. No
Compo nents
2009 2010 2011 2012 Total Unit cost
Physi-cal
Financial
Unit cost
Physi-cal
Financial
Unit cost
Physi-cal
Finan-cial
Unit cost
Phy-sical
Finan-cial
4 Trainings on 0
Post Harvest
10000
1 10000 11000 2 22000 12000 3 36000 13000 4 52000 120000 Warehous
ing and Storage
10000
1 10000 11000 2 22000 12000 4 48000 13000 5 65000 145000 Market
Intelli gence
10000
100 1000000 11000 200 2200000 12000 300 3600000 13000 400 5200000 12000000
Grading 10000 1 10000 11000 2 22000 12000 3 36000 13000 4 52000 120000
Commo
dity Markets
10000
1 10000 11000 2 22000 12000 3 36000 13000 4 52000 120000
Value addtion Trainings 10000 125 1250000 11000 0 0 12000 2 24000 13000 0 0 1274000
Export pro
motion 10000 2 20000 11000 2 22000 12000 5 60000 13000 5 65000 167000 5 Exposure
visit to markets
Within State 20000 4 80000 22000 8 176000 24000 12 288000 26000 20 520000 1064000
Outside state
75000
4 1350000 82500 4 1485000 90000 4 1620000 97500 4 1755000 6210000
Visit to national market
150000 0 0 165000 0 0 181500 0 0 199650 0 0 0 6 Arrangem
ent of buyer seller meetings 20000 2 40000 22000 4 88000 24000 4 96000 26000 4 104000 328000
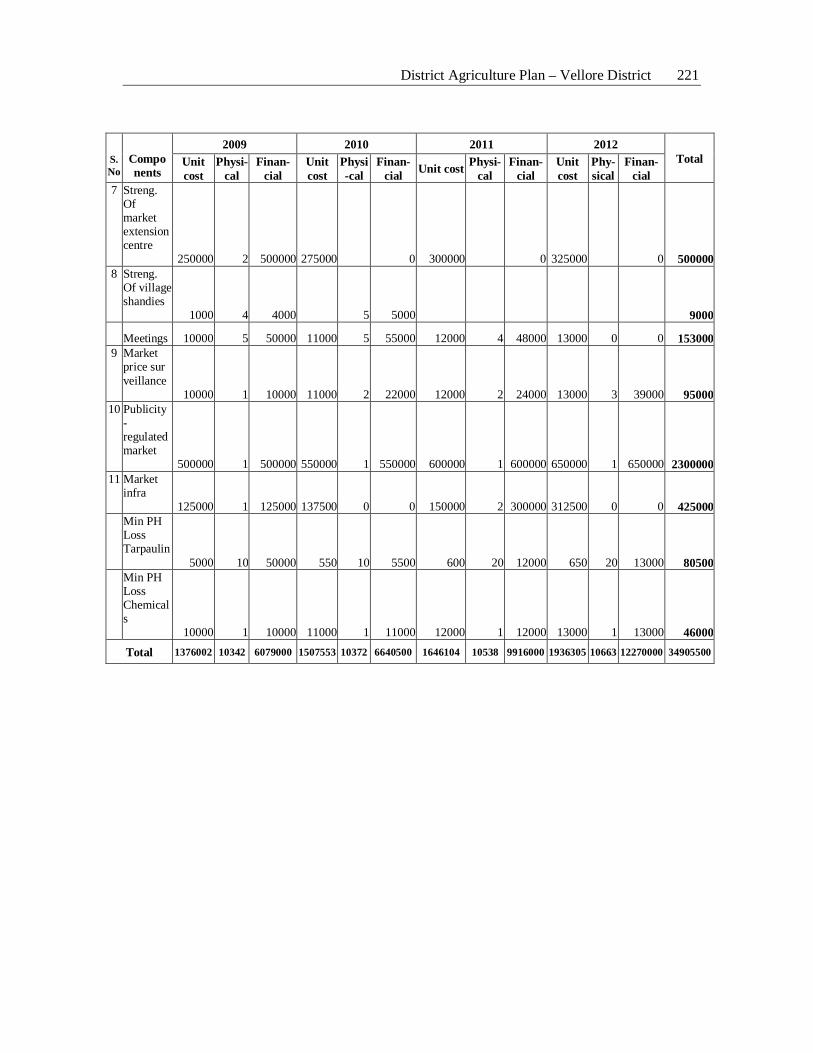
District Agriculture Plan – Vellore District 221
S. No
Compo nents
2009 2010 2011 2012 Total Unit
cost Physi-
cal Finan-
cial Unit cost
Physi-cal
Finan-cial Unit cost Physi-
cal Finan-
cial Unit cost
Phy-sical
Finan-cial
7 Streng. Of market extension centre 250000 2 500000 275000 0 300000 0 325000 0 500000
8 Streng. Of village shandies 1000 4 4000 5 5000 9000
Meetings 10000 5 50000 11000 5 55000 12000 4 48000 13000 0 0 153000
9 Market price sur veillance 10000 1 10000 11000 2 22000 12000 2 24000 13000 3 39000 95000
10 Publicity - regulated market 500000 1 500000 550000 1 550000 600000 1 600000 650000 1 650000 2300000
11 Market infra 125000 1 125000 137500 0 0 150000 2 300000 312500 0 0 425000
Min PH Loss Tarpaulin 5000 10 50000 550 10 5500 600 20 12000 650 20 13000 80500
Min PH Loss Chemicals 10000 1 10000 11000 1 11000 12000 1 12000 13000 1 13000 46000
Total 1376002 10342 6079000 1507553 10372 6640500 1646104 10538 9916000 1936305 10663 12270000 34905500
District Agriculture Plan – Vellore District 222
6.6 Sericulture
There is a greater demand for the raw silk from nearby the production centres of
silk products like Arani and Kancheepuram. This further enhances the scope for
expansion of area under mulberry and cocoon production. The development of sericulture
activities under NADP in Vellore district is discussed below.
Under sericulture development, it has been proposed to expand the area under
mulberry to the extent of 2,500 acres, establishment of community spinning hall,
community chawkie rearing centre, community silk twisting unit, cottage basin reeling
unit and so on. The budget requirement for sericulture development in Vellore district
under NADP is given in Table 6.25.
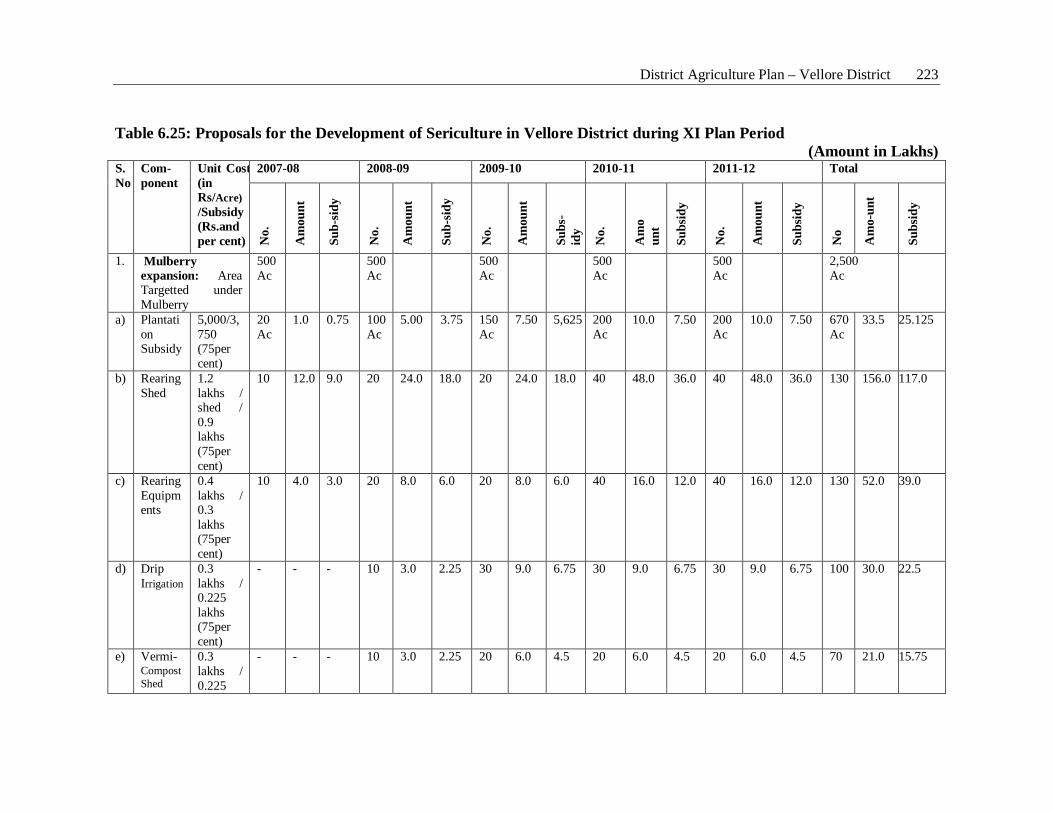
District Agriculture Plan – Vellore District 223
Table 6.25: Proposals for the Development of Sericulture in Vellore District during XI Plan Period (Amount in Lakhs)
S. No
Com- ponent
Unit Cost (in Rs/Acre) /Subsidy (Rs.and per cent)
2007-08 2008-09 2009-10 2010-11 2011-12 Total
No.
Am
ount
Sub-
sidy
No.
Am
ount
Sub-
sidy
No.
Am
ount
Subs
- id
y
No.
Am
o un
t
Subs
idy
No.
Am
ount
Subs
idy
No
Am
o-un
t
Subs
idy
1. Mulberry expansion: Area Targetted under Mulberry
500 Ac
500 Ac
500 Ac
500 Ac
500 Ac
2,500 Ac
a) Plantation Subsidy
5,000/3,750 (75per cent)
20 Ac
1.0 0.75 100 Ac
5.00 3.75 150 Ac
7.50 5,625 200 Ac
10.0 7.50 200 Ac
10.0 7.50 670 Ac
33.5 25.125
b) Rearing Shed
1.2 lakhs / shed / 0.9 lakhs (75per cent)
10 12.0 9.0 20 24.0 18.0 20 24.0 18.0 40 48.0 36.0 40 48.0 36.0 130 156.0 117.0
c) Rearing Equipments
0.4 lakhs / 0.3 lakhs (75per cent)
10 4.0 3.0 20 8.0 6.0 20 8.0 6.0 40 16.0 12.0 40 16.0 12.0 130 52.0 39.0
d) Drip Irrigation
0.3 lakhs / 0.225 lakhs (75per cent)
- - - 10 3.0 2.25 30 9.0 6.75 30 9.0 6.75 30 9.0 6.75 100 30.0 22.5
e) Vermi-Compost Shed
0.3 lakhs / 0.225
- - - 10 3.0 2.25 20 6.0 4.5 20 6.0 4.5 20 6.0 4.5 70 21.0 15.75
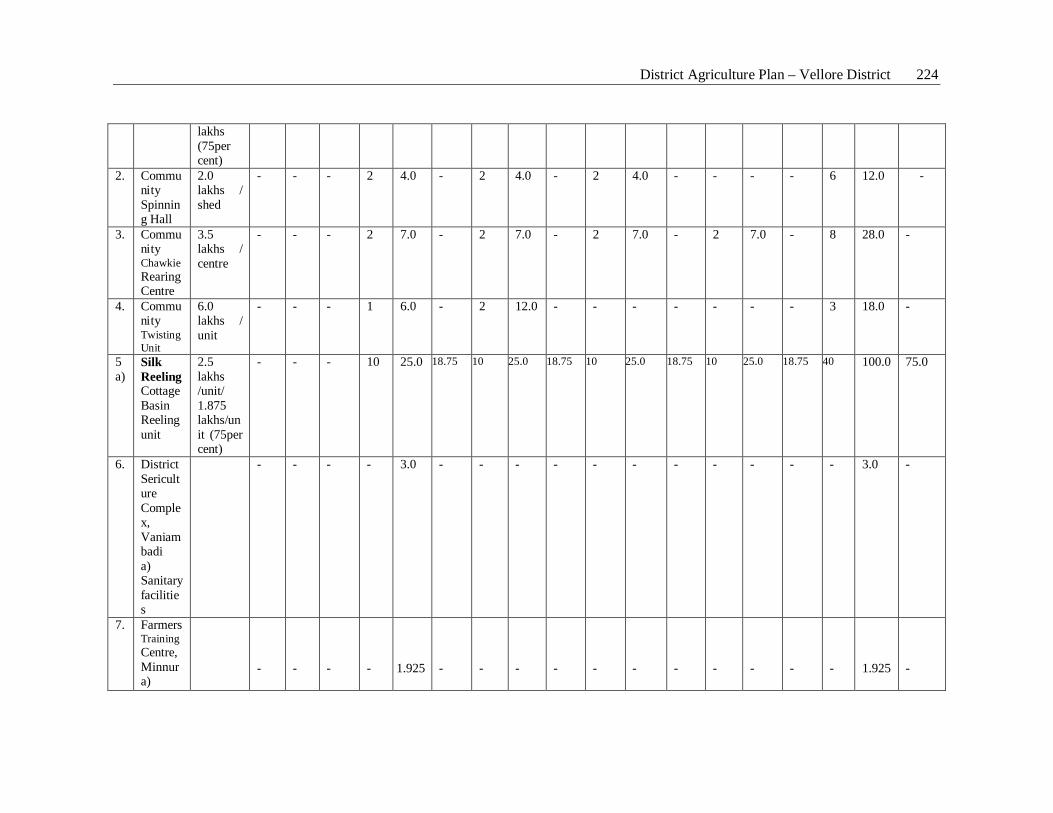
District Agriculture Plan – Vellore District 224
lakhs (75per cent)
2. Community Spinning Hall
2.0 lakhs / shed
- - - 2 4.0 - 2 4.0 - 2 4.0 - - - - 6 12.0 -
3. Community Chawkie Rearing Centre
3.5 lakhs / centre
- - - 2 7.0 - 2 7.0 - 2 7.0 - 2 7.0 - 8 28.0 -
4. Community Twisting Unit
6.0 lakhs / unit
- - - 1 6.0 - 2 12.0 - - - - - - - 3 18.0 -
5 a)
Silk Reeling Cottage Basin Reeling unit
2.5 lakhs /unit/ 1.875 lakhs/unit (75per cent)
- - - 10 25.0 18.75 10 25.0 18.75 10 25.0 18.75 10 25.0 18.75 40 100.0 75.0
6. District Sericulture Complex, Vaniambadi a) Sanitary facilities
- - - - 3.0 - - - - - - - - - - - 3.0 -
7. FarmersTraining Centre, Minnur a)
-
-
-
-
1.925
-
-
-
-
-
-
-
-
-
-
-
1.925
-
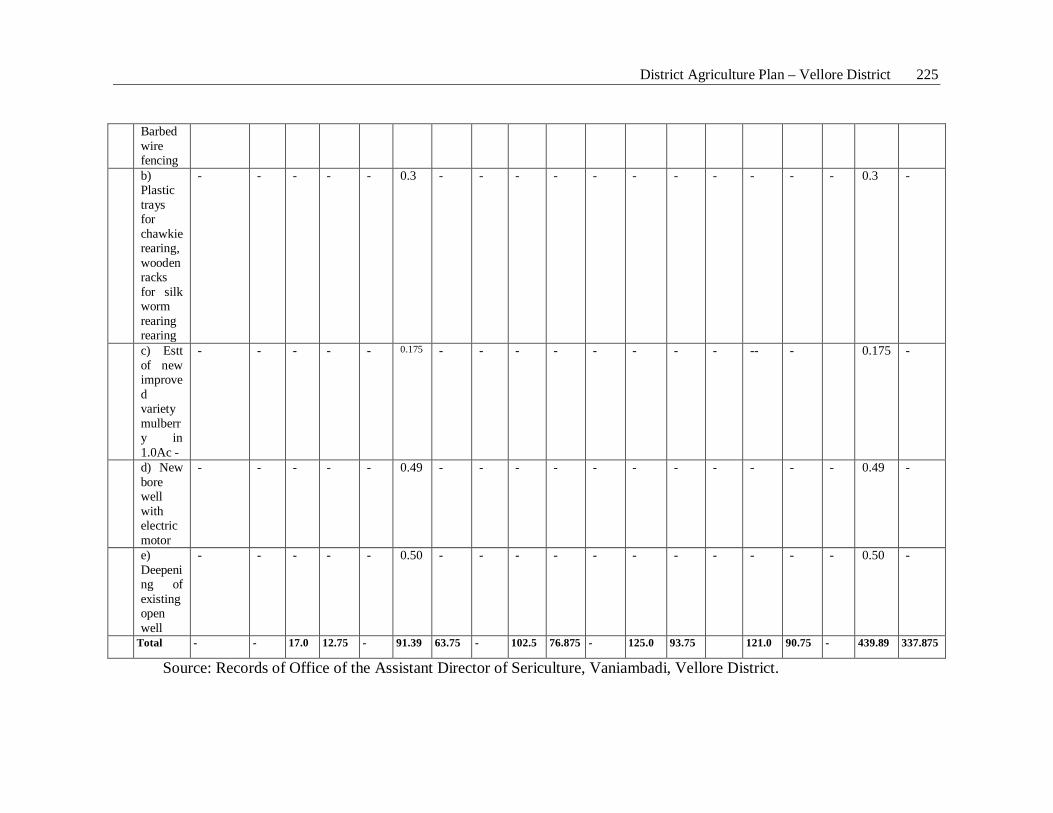
District Agriculture Plan – Vellore District 225
Barbed wire fencing
b) Plastic trays for chawkierearing, wooden racks for silk worm rearing rearing
- - - - - 0.3 - - - - - - - - - - - 0.3 -
c) Estt of new improved variety mulberry in 1.0Ac -
- - - - - 0.175 - - - - - - - - -- - 0.175 -
d) New bore well with electric motor
- - - - - 0.49 - - - - - - - - - - - 0.49 -
e) Deepening of existing open well
- - - - - 0.50 - - - - - - - - - - - 0.50 -
Total - - 17.0 12.75 - 91.39 63.75 - 102.5 76.875 - 125.0 93.75 121.0 90.75 - 439.89 337.875
Source: Records of Office of the Assistant Director of Sericulture, Vaniambadi, Vellore District.
District Agriculture Plan – Vellore District 226
6.7. Water Resources Organisation
Palar and Ponnai are the major rivers flowing through the district. However, they
remain dry for most part of the year. The details of Ayacut projects with area and number
of tanks benefited are given in Table 2.9. Palar Ayacut Project supported 148 tanks in
Vellore district indirectly with an ayacut area of 13,882 hectares while Ponnai Ayacut
Project indirectly supported 126 tanks with an ayacut area of 8,973 hectares.
The developmental works relating to water resources, especially canals and tanks
maintained by Public Works Department in Vellore district under NADP during XI Plan
Period are given in Table 6.26. As could be seen from Table. 6.26, rehabilitation and
modernization of tanks and supply channels have been proposed to take up at the cost
estimate of Rs 9,132.8 lakhs coveing an ayacut area of 5,812.2 hectares in Vellore,
Thiruppathur, Arakkonam, Walajah, Gudiyatham, Katpadi and Arcot taluks of Vellore
district.
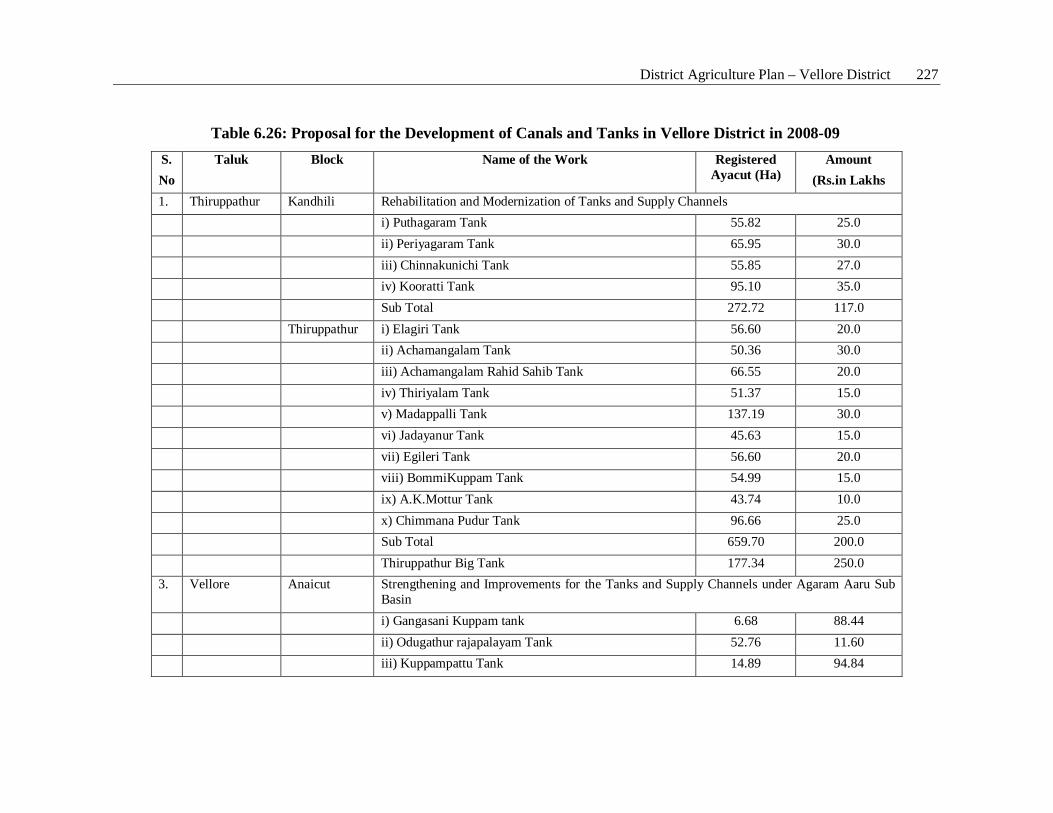
District Agriculture Plan – Vellore District 227
Table 6.26: Proposal for the Development of Canals and Tanks in Vellore District in 2008-09 S. No
Taluk Block Name of the Work Registered Ayacut (Ha)
Amount (Rs.in Lakhs
1. Thiruppathur Kandhili Rehabilitation and Modernization of Tanks and Supply Channels i) Puthagaram Tank 55.82 25.0 ii) Periyagaram Tank 65.95 30.0 iii) Chinnakunichi Tank 55.85 27.0 iv) Kooratti Tank 95.10 35.0 Sub Total 272.72 117.0 Thiruppathur i) Elagiri Tank 56.60 20.0 ii) Achamangalam Tank 50.36 30.0 iii) Achamangalam Rahid Sahib Tank 66.55 20.0 iv) Thiriyalam Tank 51.37 15.0 v) Madappalli Tank 137.19 30.0 vi) Jadayanur Tank 45.63 15.0 vii) Egileri Tank 56.60 20.0 viii) BommiKuppam Tank 54.99 15.0 ix) A.K.Mottur Tank 43.74 10.0 x) Chimmana Pudur Tank 96.66 25.0 Sub Total 659.70 200.0 Thiruppathur Big Tank 177.34 250.0 3. Vellore Anaicut Strengthening and Improvements for the Tanks and Supply Channels under Agaram Aaru Sub
Basin i) Gangasani Kuppam tank 6.68 88.44 ii) Odugathur rajapalayam Tank 52.76 11.60 iii) Kuppampattu Tank 14.89 94.84
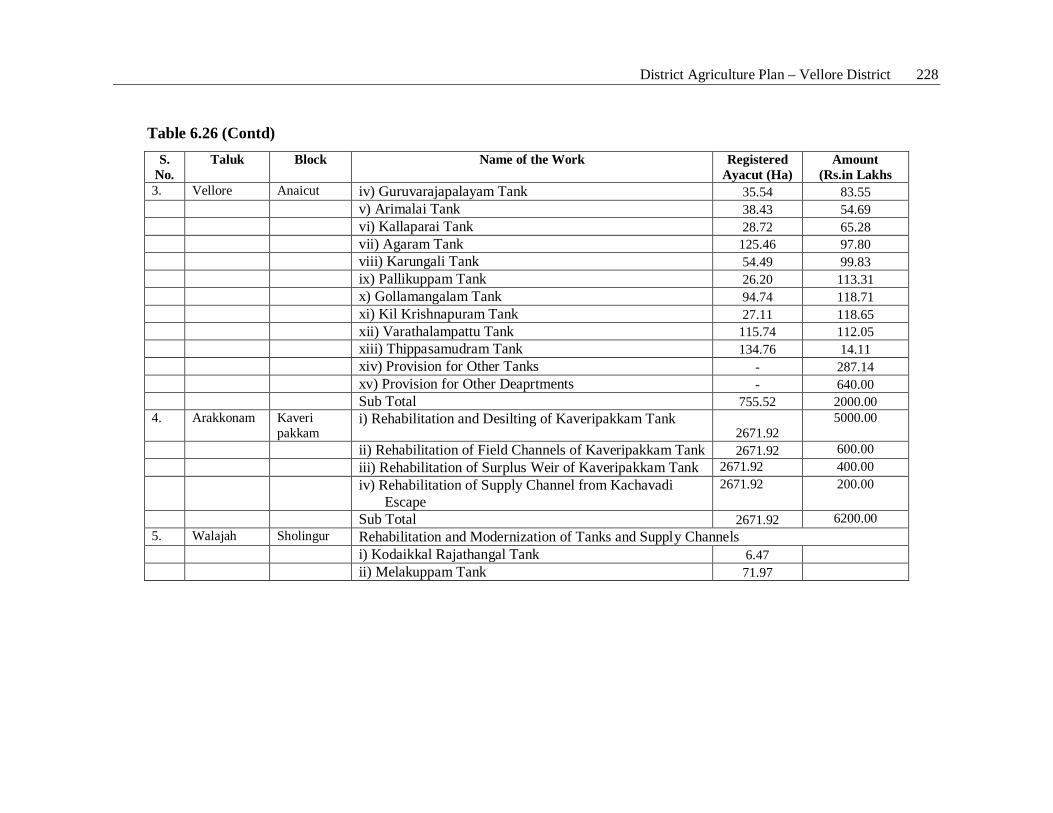
District Agriculture Plan – Vellore District 228
Table 6.26 (Contd) S.
No. Taluk Block Name of the Work Registered
Ayacut (Ha) Amount
(Rs.in Lakhs 3. Vellore Anaicut iv) Guruvarajapalayam Tank 35.54 83.55 v) Arimalai Tank 38.43 54.69 vi) Kallaparai Tank 28.72 65.28 vii) Agaram Tank 125.46 97.80 viii) Karungali Tank 54.49 99.83 ix) Pallikuppam Tank 26.20 113.31 x) Gollamangalam Tank 94.74 118.71 xi) Kil Krishnapuram Tank 27.11 118.65 xii) Varathalampattu Tank 115.74 112.05 xiii) Thippasamudram Tank 134.76 14.11 xiv) Provision for Other Tanks - 287.14 xv) Provision for Other Deaprtments - 640.00 Sub Total 755.52 2000.00 4. Arakkonam Kaveri
pakkam i) Rehabilitation and Desilting of Kaveripakkam Tank
2671.92 5000.00
ii) Rehabilitation of Field Channels of Kaveripakkam Tank 2671.92 600.00 iii) Rehabilitation of Surplus Weir of Kaveripakkam Tank 2671.92 400.00 iv) Rehabilitation of Supply Channel from Kachavadi
Escape 2671.92 200.00
Sub Total 2671.92 6200.00 5. Walajah Sholingur Rehabilitation and Modernization of Tanks and Supply Channels i) Kodaikkal Rajathangal Tank 6.47 ii) Melakuppam Tank 71.97
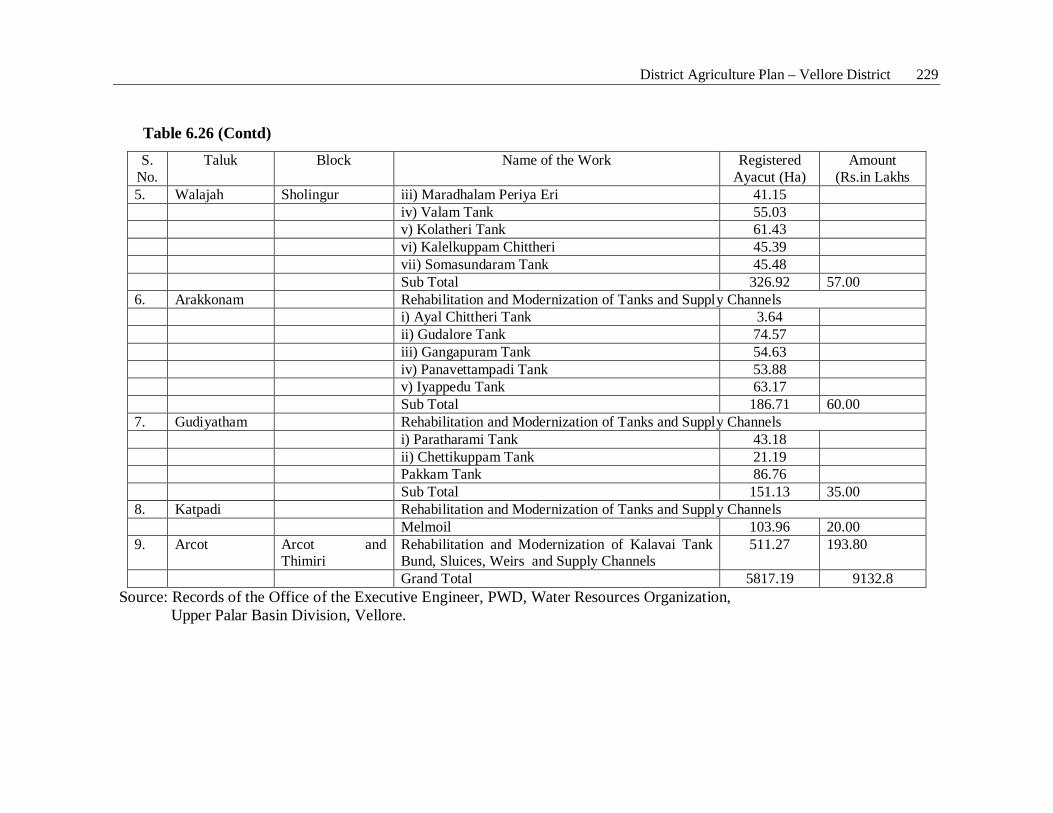
District Agriculture Plan – Vellore District 229
Table 6.26 (Contd)
S. No.
Taluk Block Name of the Work Registered Ayacut (Ha)
Amount (Rs.in Lakhs
5. Walajah Sholingur iii) Maradhalam Periya Eri 41.15 iv) Valam Tank 55.03 v) Kolatheri Tank 61.43 vi) Kalelkuppam Chittheri 45.39 vii) Somasundaram Tank 45.48 Sub Total 326.92 57.00 6. Arakkonam Rehabilitation and Modernization of Tanks and Supply Channels i) Ayal Chittheri Tank 3.64 ii) Gudalore Tank 74.57 iii) Gangapuram Tank 54.63 iv) Panavettampadi Tank 53.88 v) Iyappedu Tank 63.17 Sub Total 186.71 60.00 7. Gudiyatham Rehabilitation and Modernization of Tanks and Supply Channels i) Paratharami Tank 43.18 ii) Chettikuppam Tank 21.19 Pakkam Tank 86.76 Sub Total 151.13 35.00 8. Katpadi Rehabilitation and Modernization of Tanks and Supply Channels Melmoil 103.96 20.00 9. Arcot Arcot and
Thimiri Rehabilitation and Modernization of Kalavai Tank Bund, Sluices, Weirs and Supply Channels
511.27
193.80
Grand Total 5817.19 9132.8 Source: Records of the Office of the Executive Engineer, PWD, Water Resources Organization, Upper Palar Basin Division, Vellore.
1
Preparation of Draft Action Plan and Presentation in District Collector’s Meeting
Proceedings of the Meeting
Based on the baseline information and proposals, draft action plan was prepared and this
was presented in the District Collector’s Meeting held on May 10, 2008 under the chairmanship
of the Project Officer, District Rural Development Agency, Vellore District. This meeting was
attended by the scientists from TNAU, officials from line departments and the representatives of
local bodies and wide coverage about this meeting was given in the media also.
Thiru. M.Madesan, Joint Director of Agriculture, Vellore delivered the welcome address.
He also highlighted various possibilities and modalities for promoting the export of agricultural
commodities. The programme was presided by Thiru.N. Aruljyotiarasan, the District Project
Officer, District Rural Development Officer, Vellore. The Chief Guest emphasized the
importance of participation of panchayat leaders and farmers from the grass root level in the
preparation of developmental plans. Dr. K. Mani, Professor (Agricultural Economics), Centre for
Agricultural and Rural Development Studies, Tamil Nadu Agricultural University, Coimbatore
explained the various components of the District Agriculture Plan. He also invited suggestions
from Panchayat Leaders for refining the proposed plan. Dr. D.Baskaran, Associate Professor,
Veterinary University Training and Research Centre, Vellore discussed about Animal Husbandry
component of the District Plan. Thiru P. Anbarasan, Assistant Executive Engineer, Uppar Palar
Basin Sub Division, Public Works Department, Vellore informed about the various
developmental activities relating to canal and tank irrigation in Vellore district. Thiru. A.
Selvaraj, Vellore District Fishermen Co-operative Federation, Fort, Vellore discussed about the
fisheries developmental programmes that are being implemented by the government in Vellore
district. Sixty participants including line department officials, panchayat chairmen and farmers
participated in the discussion. Participants suggested several modifications in the draft plan such
as strengthening of storage facilities for fruits and vegetables, additional transport facilities to
transport fruits and vegetables to Chennai so as to reach Chennai at right time, strengthening of
weekly shandies and so on. Dr. V.Ravichandran, Programme Co-ordinator, Krishi Vigyan
Kendra, Virinjipuram proposed the Vote of Thanks.
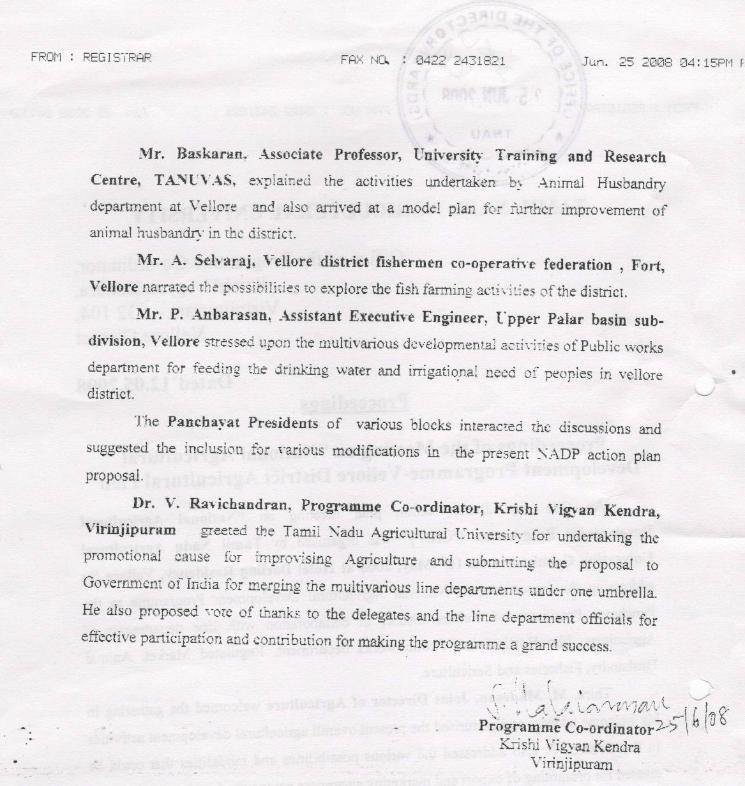
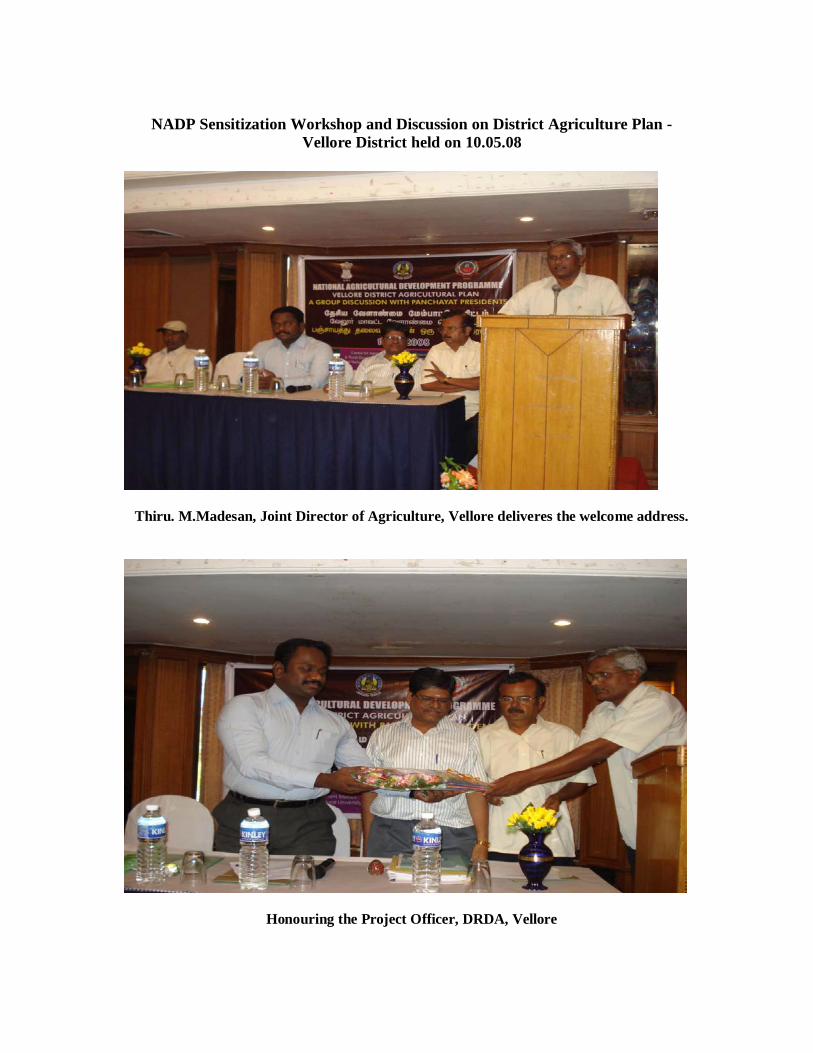
NADP Sensitization Workshop and Discussion on District Agriculture Plan - Vellore District held on 10.05.08
Thiru. M.Madesan, Joint Director of Agriculture, Vellore deliveres the welcome address.
Honouring the Project Officer, DRDA, Vellore
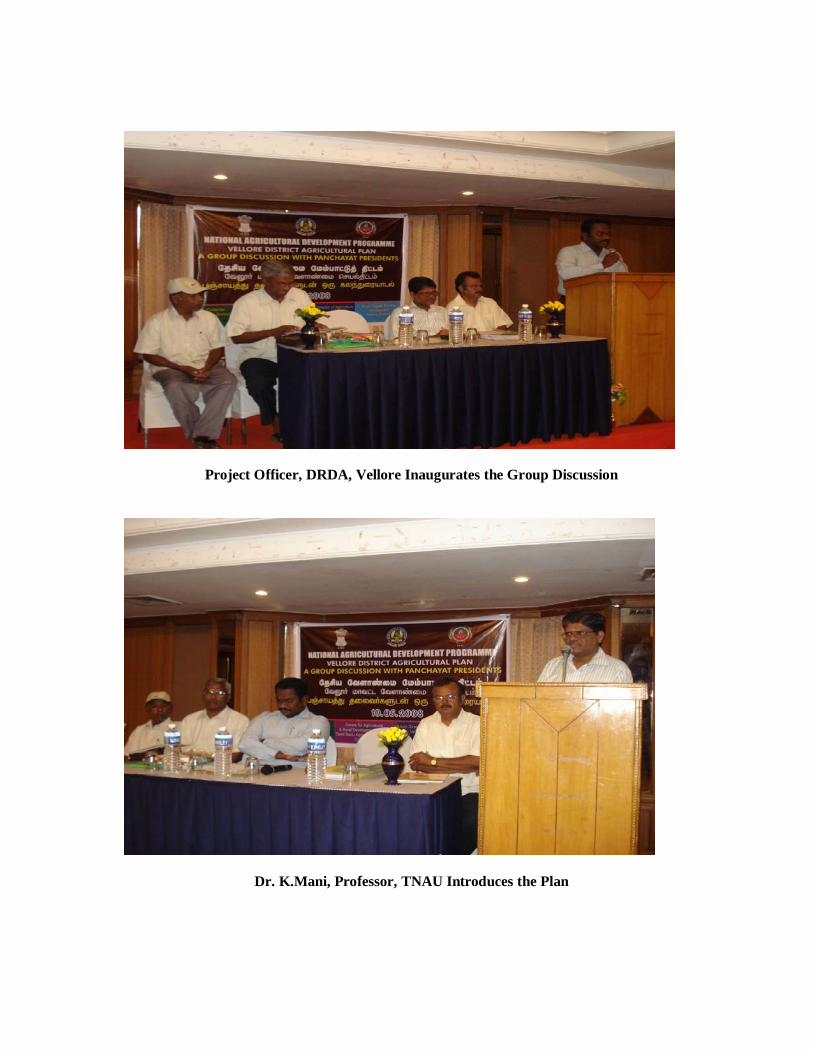
Project Officer, DRDA, Vellore Inaugurates the Group Discussion
Dr. K.Mani, Professor, TNAU Introduces the Plan
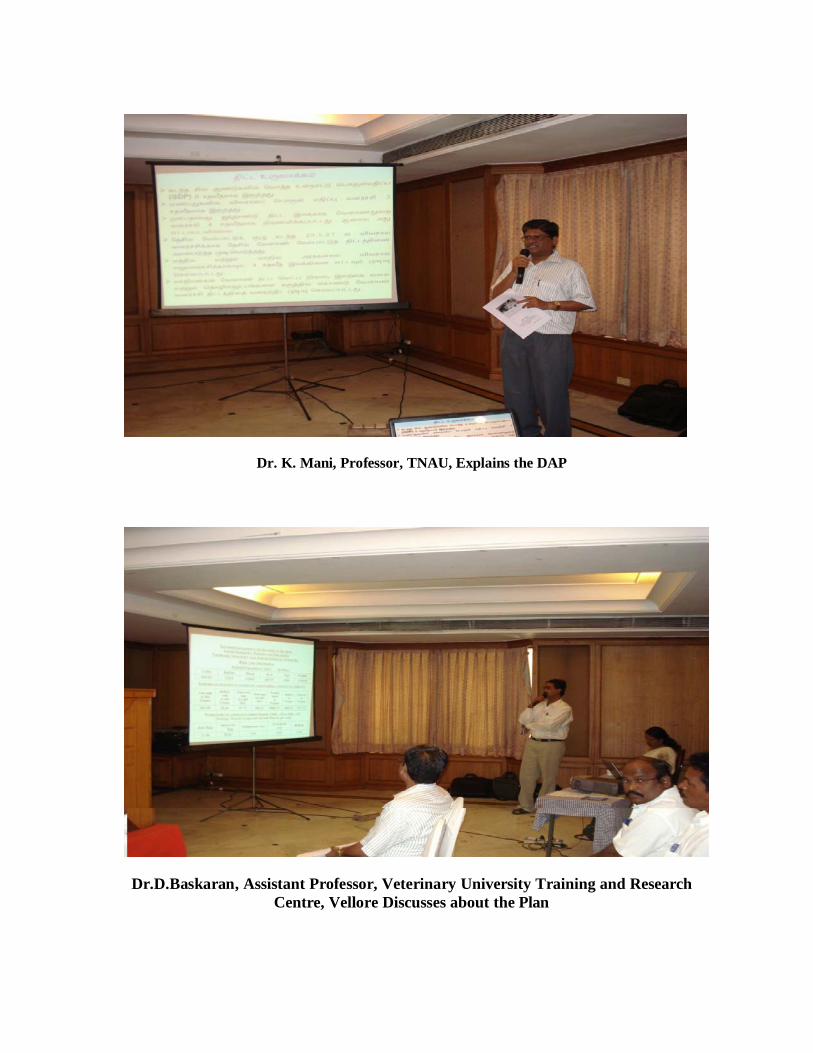
Dr. K. Mani, Professor, TNAU, Explains the DAP
Dr.D.Baskaran, Assistant Professor, Veterinary University Training and Research
Centre, Vellore Discusses about the Plan
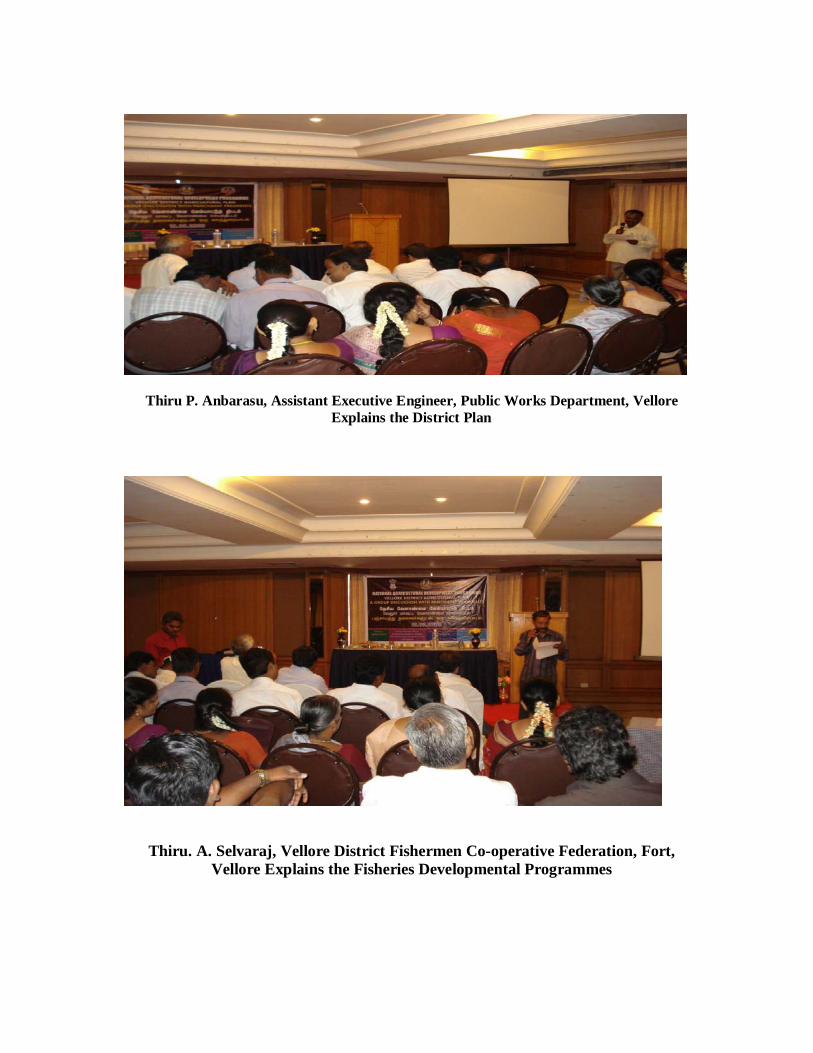
Thiru P. Anbarasu, Assistant Executive Engineer, Public Works Department, Vellore Explains the District Plan
Thiru. A. Selvaraj, Vellore District Fishermen Co-operative Federation, Fort,
Vellore Explains the Fisheries Developmental Programmes
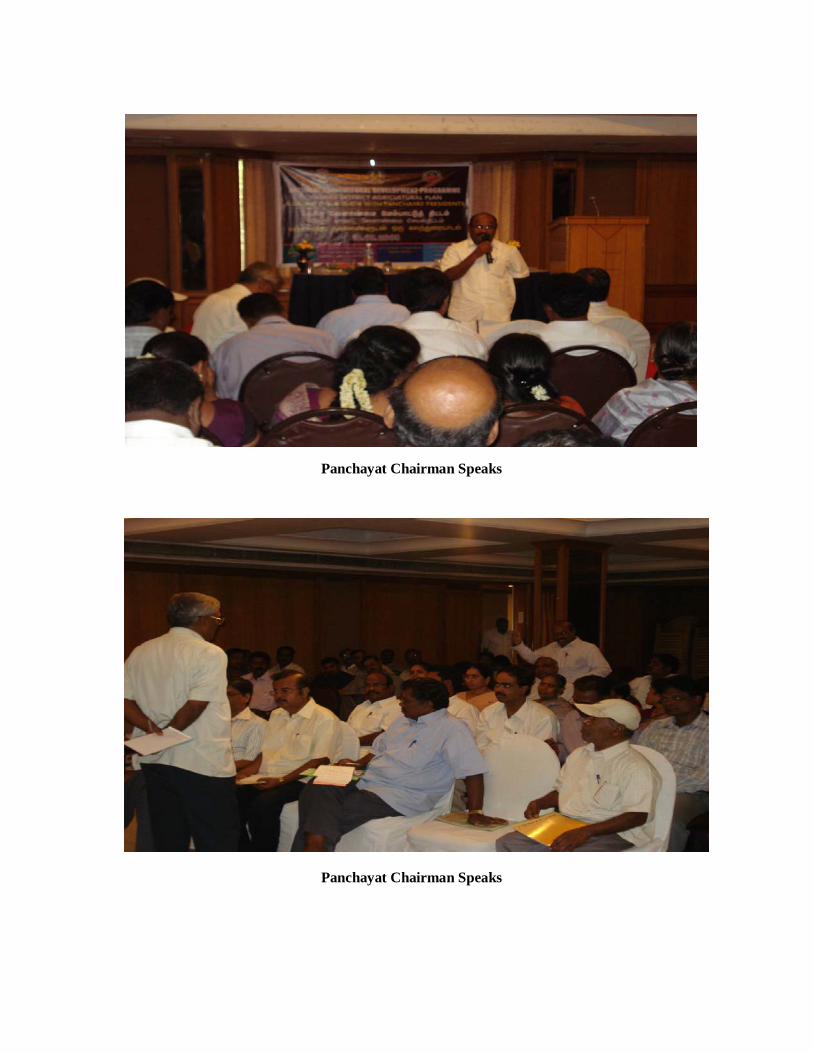
Panchayat Chairman Speaks
Panchayat Chairman Speaks
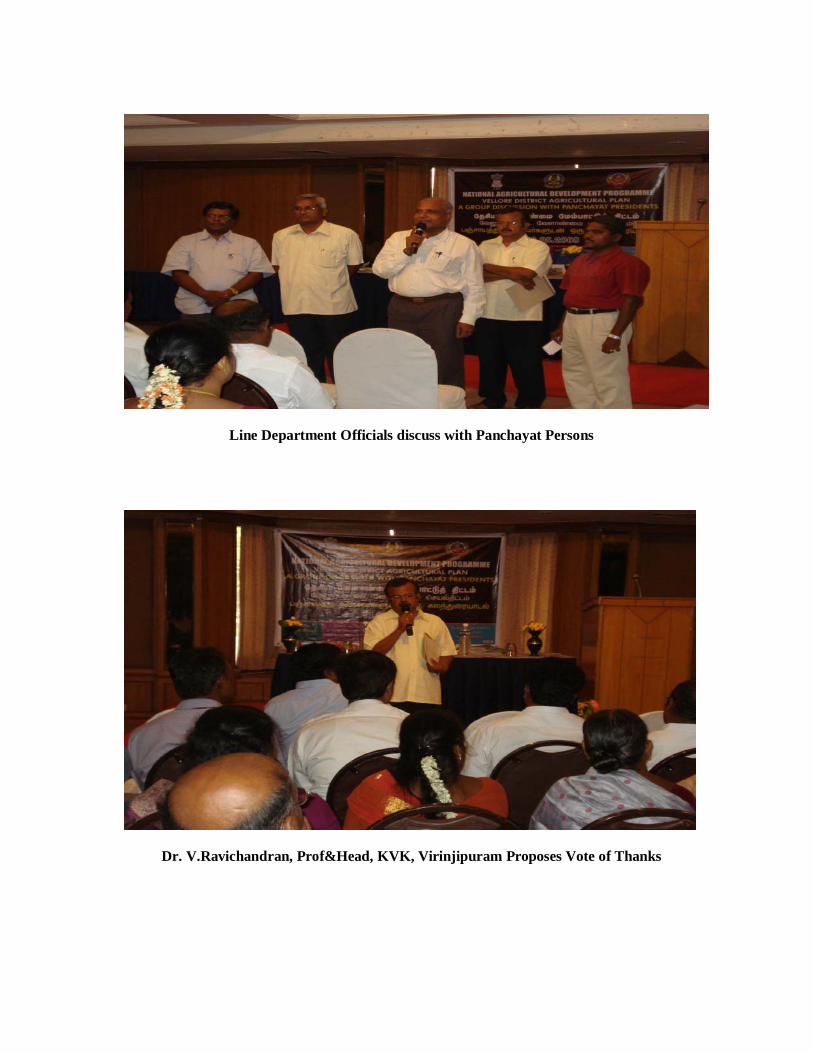
Line Department Officials discuss with Panchayat Persons
Dr. V.Ravichandran, Prof&Head, KVK, Virinjipuram Proposes Vote of Thanks