Vein pattern Recodnition
22
A Study of Similarity between Genetically Identical Body Vein Patterns Akhtar Abbas 813-FBAS-MSCS Sunawar Khan 813-FBAS-MSCS
-
Upload
sunawar-khan-ahsan -
Category
Education
-
view
30 -
download
2
Transcript of Vein pattern Recodnition

A Study of Similarity between
Genetically Identical Body Vein Patterns
Akhtar Abbas 813-FBAS-MSCS Sunawar Khan 813-FBAS-MSCS

Genetically identical vein patterns are studied.
Use an automatic matching algorithm.
Genetically identical vein patterns are distinguishable.
Why: as with fingerprints and palm prints, have some genetic dependence.
This paper is to be heard

Title: A Study of Similarity between genetically identical Body vein patterns.
Study: Pattern Recogniton
By: Hengyi Zhang, Chaoying Tang, Xiaojie Li, Adams Wai Kin Kong
From: Nanyang Technological University – Singapor Nanjing University of Aeronautics and Astronautics- China
Year: 2014
Publisher :
About this paper
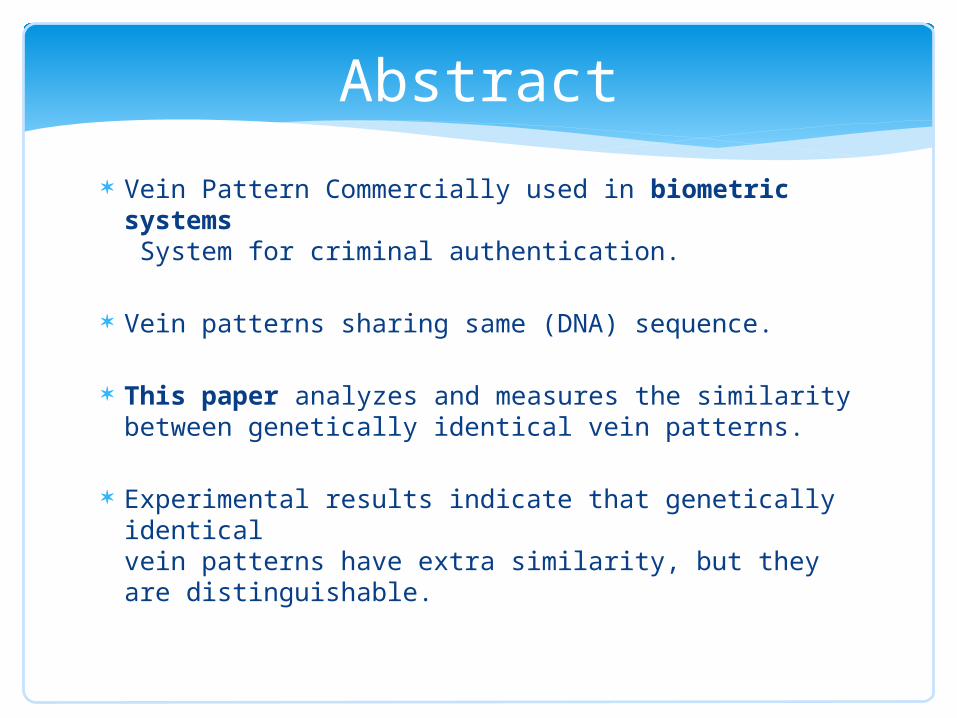
Vein Pattern Commercially used in biometric systems System for criminal authentication.
Vein patterns sharing same (DNA) sequence.
This paper analyzes and measures the similarity between genetically identical vein patterns.
Experimental results indicate that genetically identicalvein patterns have extra similarity, but they are distinguishable.
Abstract

Intro: Twins can be classified into two types, dizygotic and monozygotic.
Intro: Vein recognition systems have been available forcommercial applications.
Utilization: near infrared (NIR) to capture vein patterns from palms, fingers or back of the hands in controlled environments.
Proposed: Identifying criminals and victims in evidenceimages, where their faces are not observable.
1: How it classified.
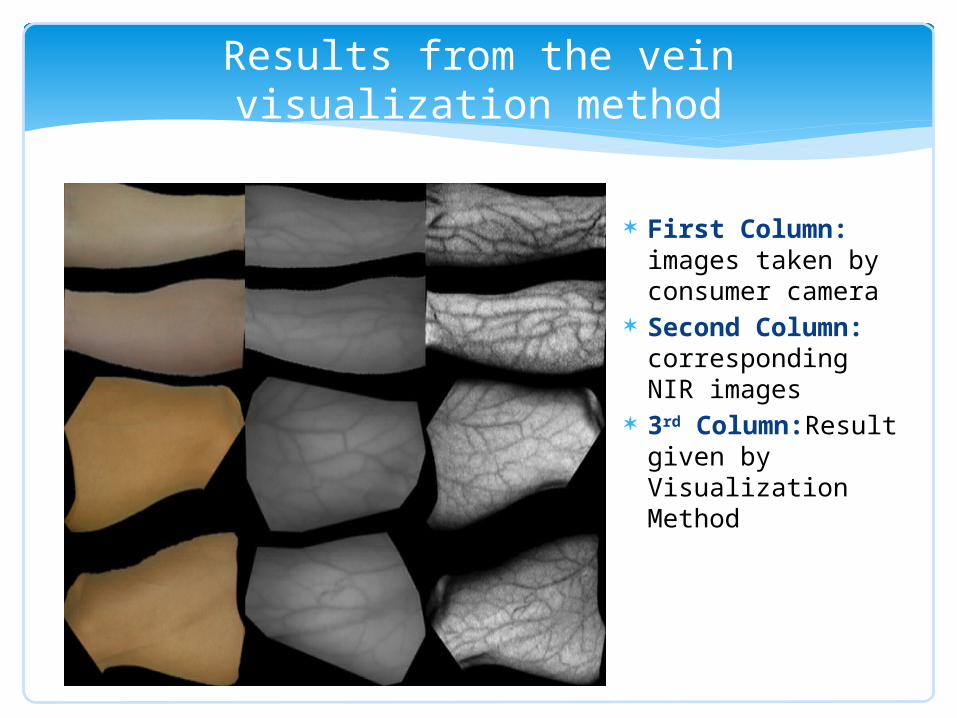
Results from the vein visualization method
First Column: images taken by consumer camera
Second Column: corresponding NIR images
3rd Column:Result given by Visualization Method

2: Related WorkA: Related Work on Biometric
Veins
Back of the Hand
Palm Vein Pattern
Fingers
1991, MacGregor and Welford presented system called Veincheck using vein patterns acquired from the back of a clenched fist under near infraredlight.
The finger vein matching method proposed by Miura uses transmitting infrared light to capture finger veinimages.
Method: back-propagation neural network as aclassifier was also developed.
Neighborhood matching radon transform (NMRT),Hessian phase, and scale invariant feature transform(SIFT) were also studied for hand [19] and palm veinrecognition.
Related Work on Biometric Veins

Doddington observed that monozygotic twins’ sound is quite similar to each other, but their spectrograms look very different.
Their experiments had two configurations: General Cases and Twin Cases
Zhang reported that voice recognition couldperform better than face recognition when classifyingmonozygotic twins.
Sun used multiple biometric traits, including fingerprints, faces, and irises to identify monozygotic twins.
Related WorkB. Related work on monozygotic twins’
biometrics

Related work on monozygotic twins’ biometrics

This algorithm uses a series of preprocessing steps to extract vein patterns.
Gabor filter bank Enhancement scheme Thresholding and Thinning methods applied
Three-step matching scheme to measure similaritybetween body vein patterns.
Rigid and non-rigid point sets, which are called data set and model set.
Similarity score is calculated based on the average distance of corresponding points.
3. AN ALGORITHM FOR MEASURING SIMILARITY BETWEEN BODY VEIN PATTERNS
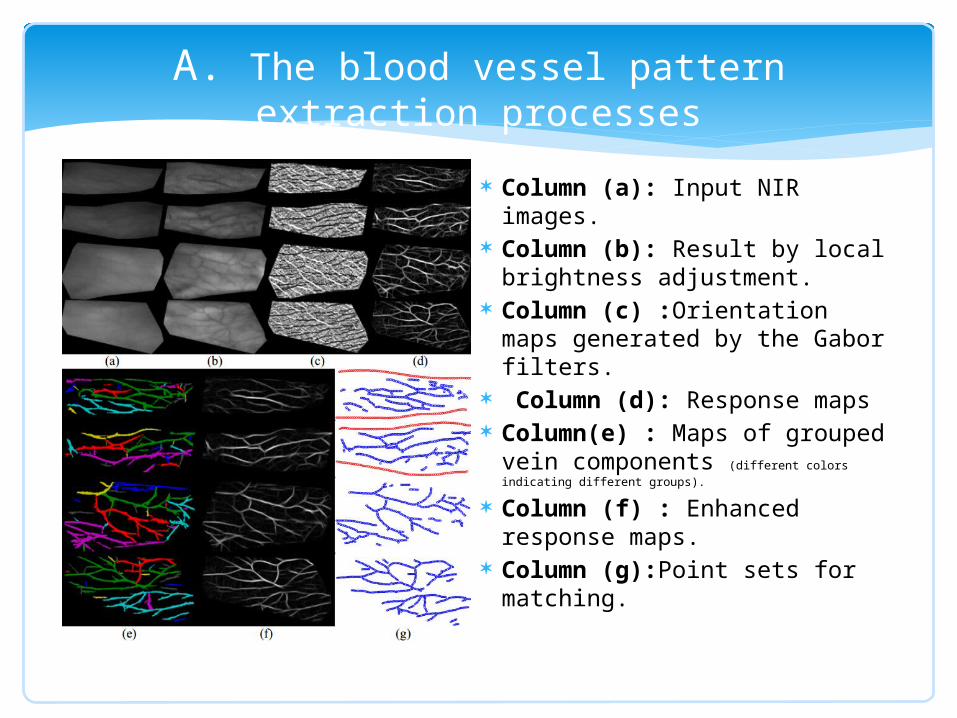
A. The blood vessel pattern extraction processes
Column (a): Input NIR images.
Column (b): Result by local brightness adjustment.
Column (c) :Orientationmaps generated by the Gabor filters.
Column (d): Response maps Column(e) : Maps of
grouped vein components (different colors indicating different groups).
Column (f) : Enhanced response maps.
Column (g):Point sets for matching.

B. Vein Pattern Matching
(a) and (b) are two NIRimages.
(c) shows the points extracted from (a) and (b).
Blue and red dotsrespectively from (a) and (b) represent model and data points. Note thatboundary points are shown in lighter color.
(d) illustrates. Outliersoutside the overlapping area are marked in green.
(e) illustrates Green points are regarded as noise.
(f) shows the alignment result Above Images
(g) is the final non-rigid alignment result.

Genuine and Imposter Distributions
Virtual Twin Distributions, CMC curves and Analyses
4. Experimental Results

4. Experimental ResultsDistribution of Dissimilarity ValuesGenuine and Imposter Distribution
(a)matching genuine forearm pairs (b) matching genuine thigh pairs.

Experimental Results
Distribution of Dissimilarity Values
(a)Left forearm with Strip (b) Right Forearm without Strip
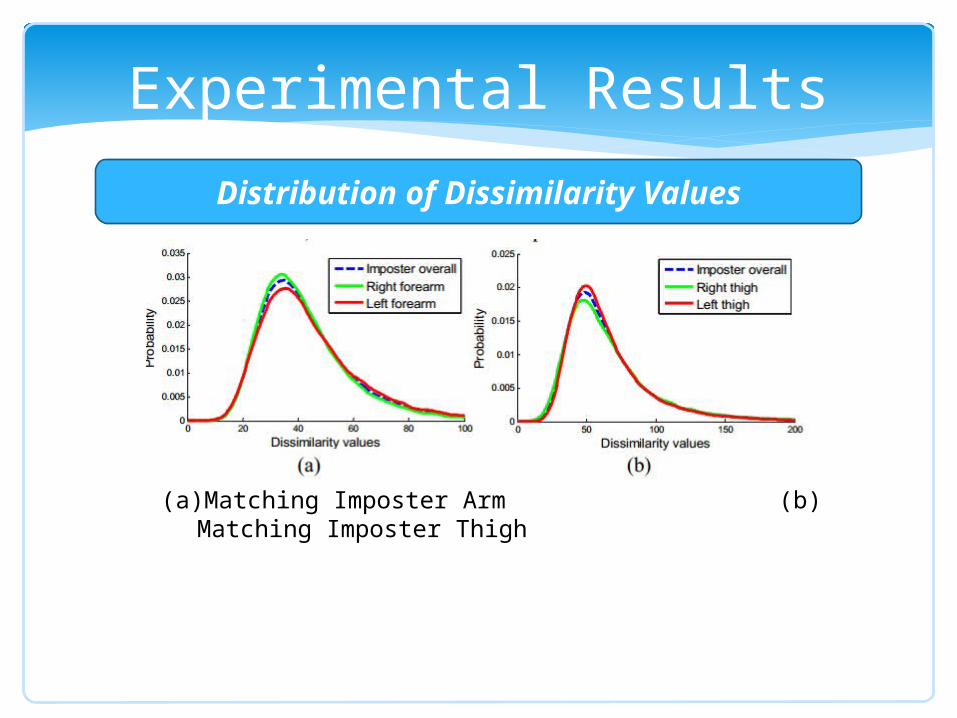
Experimental Results
Distribution of Dissimilarity Values
(a)Matching Imposter Arm (b) Matching Imposter Thigh

Virtual Twin Distributions, CMC curves and Analyses
MEANS µ AND STANDARD DEVIATIONS σ OF THE GENUINE,IMPOSTER AND VIRTUAL TWIN DISTRIBUTIONS
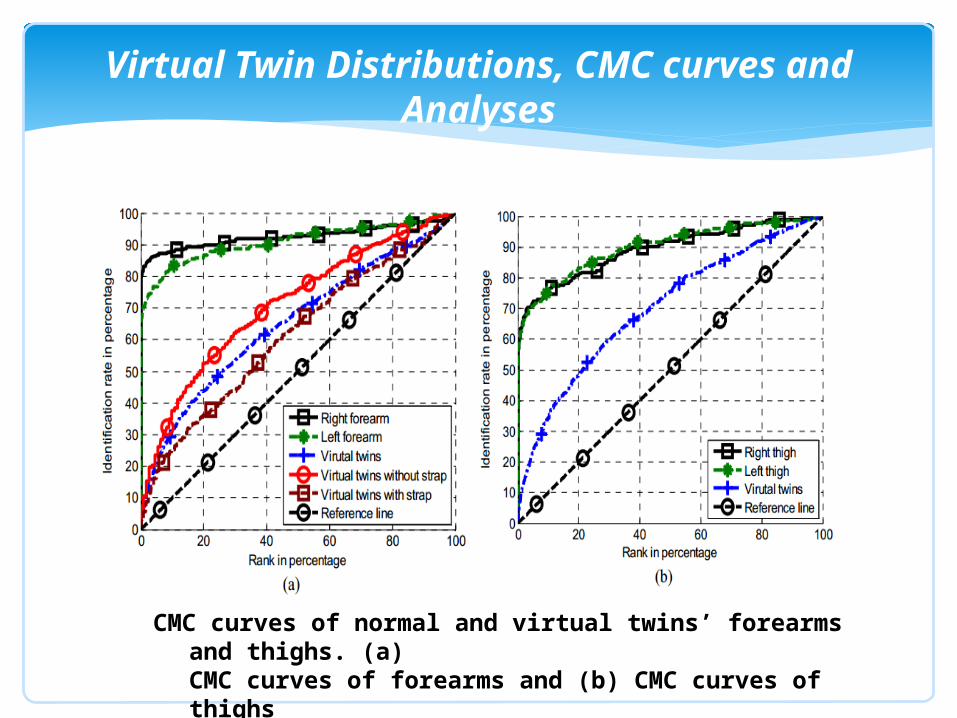
Virtual Twin Distributions, CMC curves and Analyses
CMC curves of normal and virtual twins’ forearms and thighs. (a)CMC curves of forearms and (b) CMC curves of thighs

Genetically identical vein patterns are studied, using an automatic matching algorithm.
Experimental results indicate that genetically identical vein patterns are distinguishable
Fingerprints and palmprints, have some genetic dependence.
Conclusion
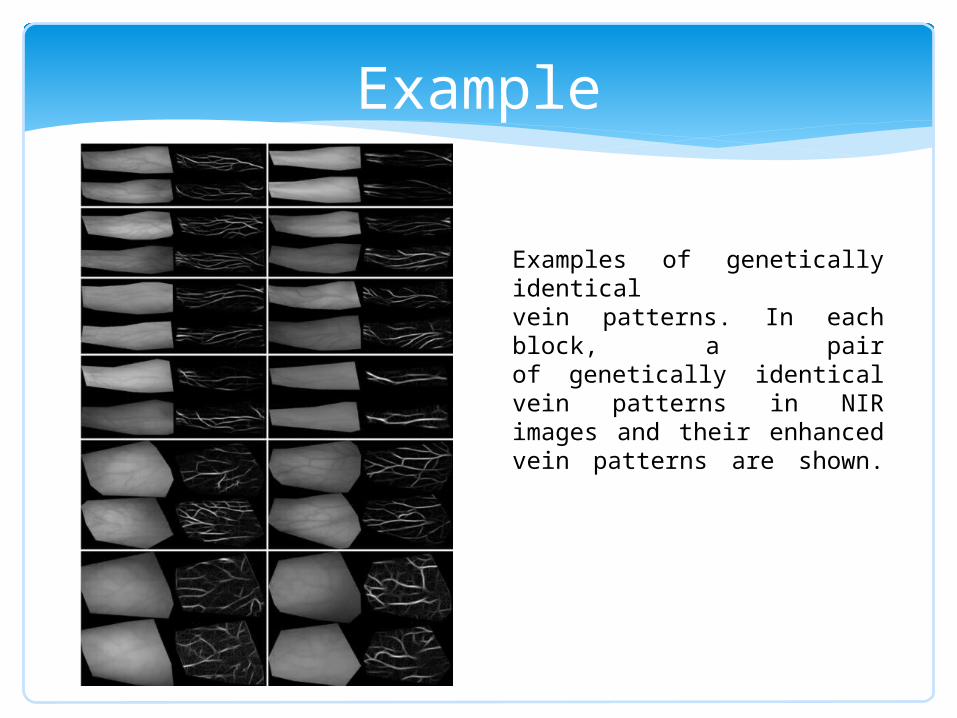
Example
Examples of genetically identical vein patterns. In each block, a pairof genetically identical vein patterns in NIR images and their enhanced vein patterns are shown.
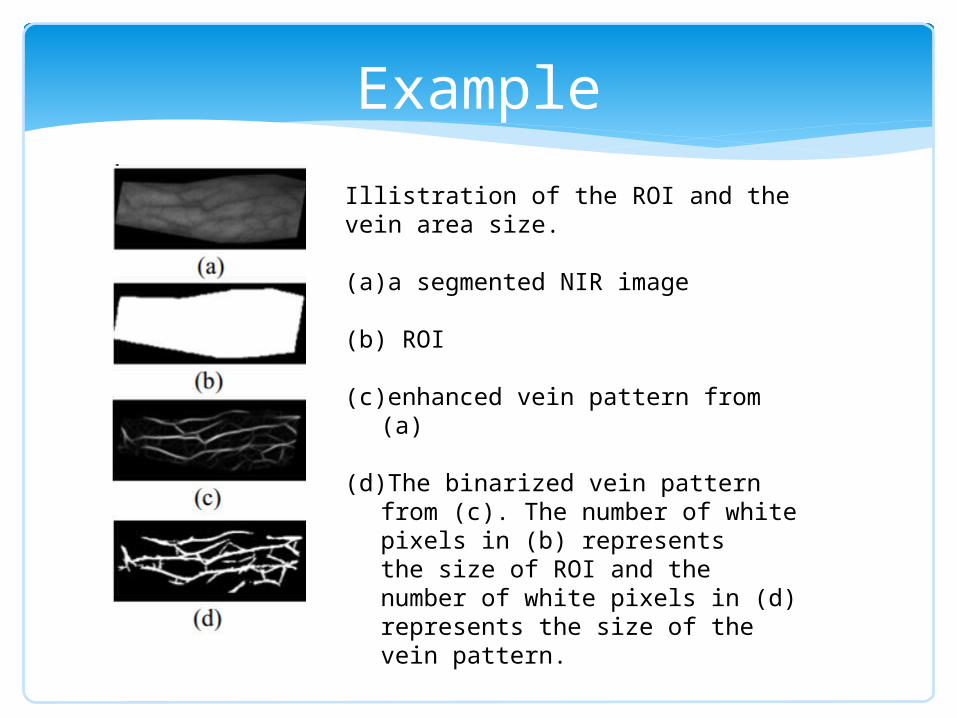
Example
Illistration of the ROI and the vein area size.
(a)a segmented NIR image
(b) ROI
(c) enhanced vein pattern from (a)
(d)The binarized vein pattern from (c). The number of white pixels in (b) representsthe size of ROI and the number of white pixels in (d) represents the size of thevein pattern.


![Sensors - University at Buffalogovind/CSE666/fall2007/Sensors.pdf · Palm Vein Authentication [Watanabe 2007] • Belongs to the family of vascular pattern authentication technologies](https://static.fdocuments.net/doc/165x107/5fca48541a4d2c080e619981/sensors-university-at-buffalo-govindcse666fall2007sensorspdf-palm-vein-authentication.jpg)