Vegetation Management for Increased Water Yield in...
43
Vegetation Management for Increased Water Yield Item Type text; Book Authors Ffolliott, Peter F.; Thorud, David B. Publisher College of Agriculture, University of Arizona (Tucson, AZ) Rights Copyright © Arizona Board of Regents. The University of Arizona. Download date 10/05/2018 23:21:53 Link to Item http://hdl.handle.net/10150/602146
Transcript of Vegetation Management for Increased Water Yield in...

Vegetation Management for Increased Water Yield
Item Type text; Book
Authors Ffolliott, Peter F.; Thorud, David B.
Publisher College of Agriculture, University of Arizona (Tucson, AZ)
Rights Copyright © Arizona Board of Regents. The University of Arizona.
Download date 10/05/2018 23:21:53
Link to Item http://hdl.handle.net/10150/602146

Vegetation Management for Increased Water Yield
in Arizona
by Peter F. Ffolliott & David B. Thorud
Technical Bulletin 215
Agricultural Experiment Station
The University of Arizona
Tucson
Vegetation Management for Increased Water Yield in Arizona
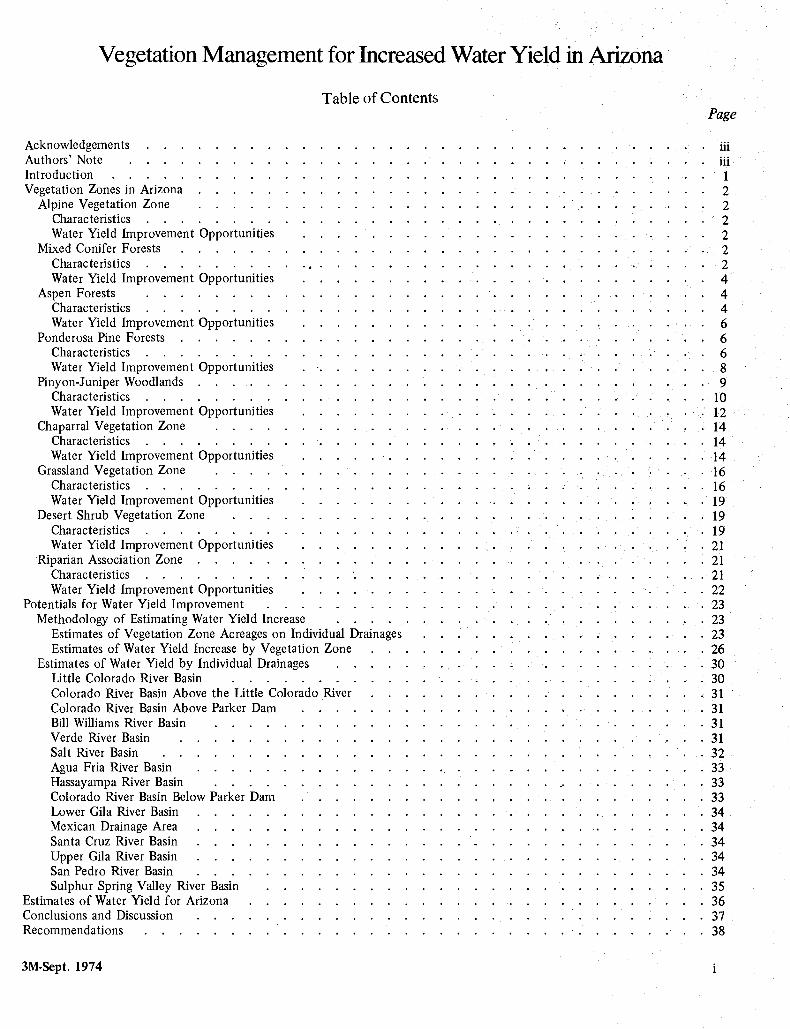
Table of Contents
Acknowledgements Authors' Note
Page
Introduction 1
Vegetation Zones in Arizona 2
Alpine Vegetation Zone 2
Characteristics 2 Water Yield Improvement Opportunities 2
Mixed Conifer Forests 2
Characteristics 2 Water Yield Improvement Opportunities 4
Aspen Forests 4 Characteristics . . . . . . . . . . . . . . . . . . 4 Water Yield Improvement Opportunities 6
Ponderosa Pine Forests 6 Characteristics 6 Water Yield Improvement Opportunities . . . . . . . . . 8
Pinyon- Juniper Woodlands .............................. 9 Characteristics 10 Water Yield Improvement Opportunities 12
Chaparral Vegetation Zone . . . . . . . . . . . . . 14 Characteristics 14 Water Yield Improvement Opportunities 14
Grassland Vegetation Zone . . . . . . . . . . . . . 16 Characteristics 16 Water Yield Improvement Opportunities 19
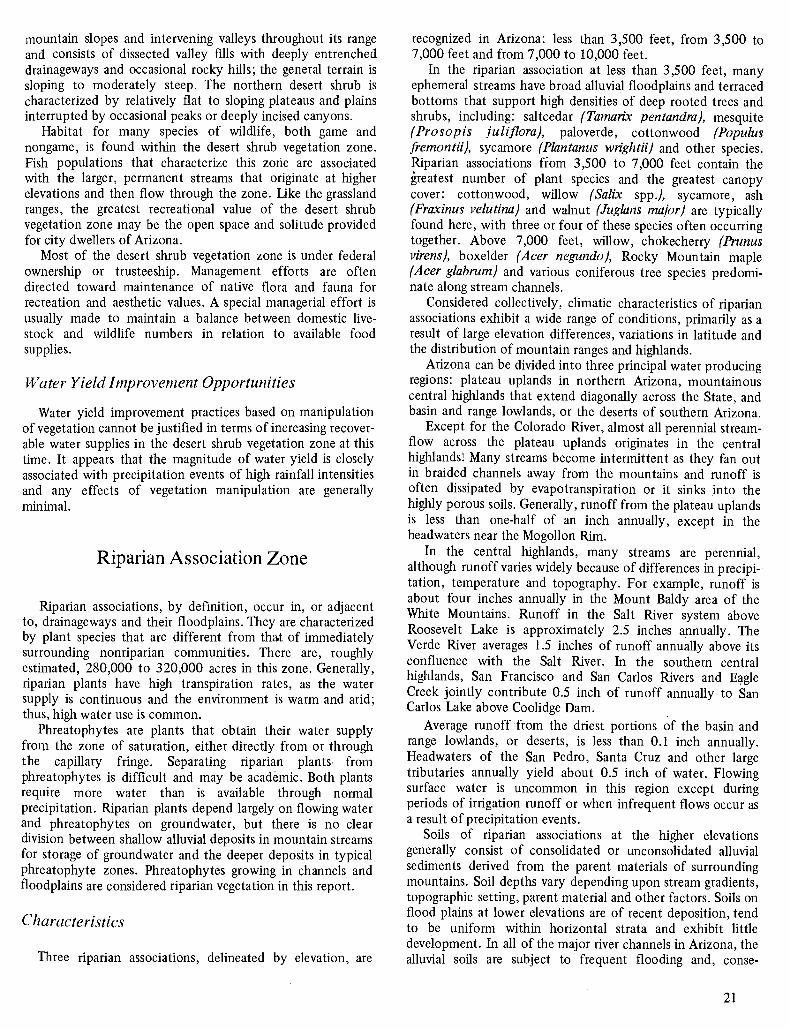
Desert Shrub Vegetation Zone ............................ 19 Characteristics 19 Water Yield Improvement Opportunities . . . . . . . . 21
Riparian Association Zone 21 Characteristics 21 Water Yield Improvement Opportunities 22
Potentials for Water Yield Improvement 23 Methodology of Estimating Water Yield Increase ..................... 23
Estimates of Vegetation Zone Acreages on Individual Drainages . . . . . . 23 Estimates of Water Yield Increase by Vegetation Zone 26
Estimates of Water Yield by Individual Drainages . . . . . . . . 30 Little Colorado River Basin . . . . . . . . . . . . . . . 30 Colorado River Basin Above the Little Colorado River 31 Colorado River Basin Above Parker Dam 31 Bill Williams River Basin 31 Verde River Basin 31 Salt River Basin 32 Agua Fria River Basin 33 Hassayampa River Basin 33 Colorado River Basin Below Parker Dam 33 Lower Gila River Basin 34 Mexican Drainage Area 34 Santa Cruz River Basin 34 Upper Gila River Basin 34 San Pedro River Basin 34 Sulphur Spring Valley River Basin 35
Estimates of Water Yield for Arizona 36 Conclusions and Discussion 37 Recommendations 38
3M -Sept. 1974
List of Figures
Page
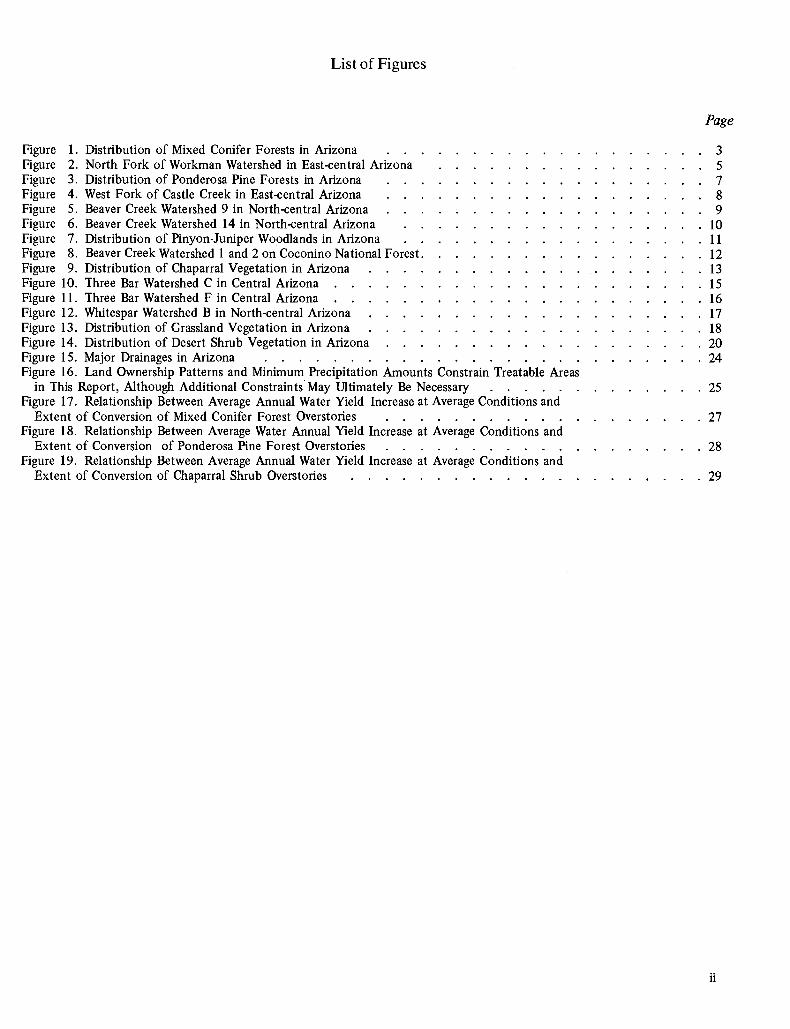
Figure 1. Distribution of Mixed Conifer Forests in Arizona 3 Figure 2. North Fork of Workman Watershed in East -central Arizona 5 Figure 3. Distribution of Ponderosa Pine Forests in Arizona 7 Figure 4. West Fork of Castle Creek in East -central Arizona 8 Figure 5. Beaver Creek Watershed 9 in North -central Arizona 9 Figure 6. Beaver Creek Watershed 14 in North -central Arizona 10 Figure 7. Distribution of Pinyon- Juniper Woodlands in Arizona 11 Figure 8. Beaver Creek Watershed 1 and 2 on Coconino National Forest 12 Figure 9. Distribution of Chaparral Vegetation in Arizona 13 Figure 10. Three Bar Watershed C in Central Arizona 15 Figure 11. Three Bar Watershed F in Central Arizona 16 Figure 12. Whitespar Watershed B in North -central Arizona 17 Figure 13. Distribution of Grassland Vegetation in Arizona 18 Figure 14. Distribution of Desert Shrub Vegetation in Arizona 20 Figure 15. Major Drainages in Arizona 24 Figure 16. Land Ownership Patterns and Minimum Precipitation Amounts Constrain Treatable Areas
in This Report, Although Additional Constraints May Ultimately Be Necessary 25 Figure 17. Relationship Between Average Annual Water Yield Increase at Average Conditions and
Extent of Conversion of Mixed Conifer Forest Overstories 27 Figure 18. Relationship Between Average Water Annual Yield Increase at Average Conditions and
Extent of Conversion of Ponderosa Pine Forest Overstories 28 Figure 19. Relationship Between Average Annual Water Yield Increase at Average Conditions and
Extent of Conversion of Chaparral Shrub Overstories 29
ii

Acknowledgements
This study was supported, in part, by the Rocky Mountain Forest and Range Experiment Station (USDA Forest Service), the Arizona Water Commission and by funds provided by the U.S. Department of Interior as authorized under the Water Resources Research Act of 1964, PL 88 -379.
The assistance of Karl F. Wenger and David E. Herrick, Rocky Mountain Forest and Range Experiment Station; William D. Hurst and George R. Proctor, Southwestern Re- gion, USDA Forest Service; Philip C. Briggs, Arizona Water Commission; and Kel M. Fox, Arizona Water Resources Com- mittee, the members of a Steering Committee for the study, are gratefully acknowledged. Also, Robert E. Moore, formerly with the Salt River Project, was instrumental in establishing this study.
Authors' Note
This brief report is based, in part, upon many published reports and source data summaries. To conserve space and preserve continuity, direct reference to these materials has been omitted here. However, a complete bibliography is
presented as a component of the larger and more voluminous documents that provides the details of this study.
1Ffolliott, Peter F., and David B. Thorud. 1975. Improving Water Yield in Arizona by Vegetation Management. University of Arizona Depart- ment of Watershed Management.
111
Vegetation Management for Increased Water Yield in Arizona
by Peter F. Ffolliott & David B. 'Thorud*
Technical Bulletin 215
Introduction
Present water consumption in Arizona includes the mining of an estimated two to three million acre -feet annually from groundwater reserves in addition to utilization of developed surface water supplies. It is important that all alternatives for developing water resources be evaluated if both present and future needs are to be met on a sustained basis. Even with the projected construction of the Central Arizona Project, the net annual groundwater depletion will not be offset. Conse- quently, the Arizona Water Resources Committee, the Arizona Water Commission, the USDA (U.S. Department of Agricul- ture) Forest Service and the University of Arizona have jointly sponsored a "state -of- the -art" assessment of the potentials for increasing water yield in Arizona by means of vegetation management. This assessment is primarily based on a review of the Arizona Watershed Program.
The Arizona Watershed Program was initiated in 1957 following publication of the Barr Report, a document which provided projections of the potentials for increasing water yield through vegetation management.2 Subsequently, a long- term, multimillion dollar watershed management research program, which continues to the present, 'was established in several vegetation zones throughout Arizona. As a result of this investment of time, talent and funds, new knowledge of hydrologic processes, principles applicable to watershed man- agement and vegetation resources has been acquired.
In the present study, this new knowledge was organized, analyzed and summarized for the benefit of natural resource planners in Arizona. The primary document produced by the study is voluminous and includes detailed consideration of research methodologies and results, descriptions of vegetation zones, bibliographies and other topics relevant to natural resource management.3 The briefer form presented here high-
*Associate Professor and Head of Department of Watershed Manage- ment, respectively, College of Agriculture, University of Arizona.
2Barr, George W. (ed.). 1956. Recovering rainfall (report of Arizona Watershed Program). University of Arizona Department of Agricul- tural Economics, Tucson. Part I, 33 pp.; Part II, 218 pp.
3Ffolliott and Thorud.
lights the primary document. The study was essentially a review of published documents,
source data and summaries produced since 1956. Unpublished reports and personal communications were also employed if other sources were unavailable. The general sequence of events included a review and summary of the available pertinent materials followed by an extrapolation of the information developed to Arizona watersheds. In the extrapolation process, estimates of potential increased water yield that might be realized by implementing specified vegetation management practices were developed. The study was concluded with recommended guidelines for future research and operational programs relating to the production of increased water by means of vegetation management.
The main objective of the analysis was to define potentials for increasing water yield from watersheds in Arizona. In the application of vegetation management practices to capture this water potential, consideration must be given to other natural resources and values. To illustrate, the production of water is
inextricably linked to the production of timber for primary wood products and forage for domestic livestock and wildlife, the provision of recreation environments, the maintenance or enhancement of scenic resources, and other natural resource values. Consideration of these collateral needs will operate to modify the estimates of water yield potential described in this report to achieve the greatest total benefit or to meet evident public needs. Detailed descriptions of these collateral needs and relevant bibliographies are presented in the primary document.
The study provides specific estimates of the potential to increase water yield based on stated assumptions pertaining to the applicability of research results and available vegetation descriptions. Therefore, users of these estimates should recog- nize that the values have a hypothetical structure and are presented only for the purpose of demonstrating potentials.
Basic source documents for the study were organized into a
computerized bibliographic information system which is being maintained and expanded by the Department of Watershed Management, University of Arizona, for the benefit of present and future users of such information.
1
Vegetation Zones in Arizona
Nine vegetation zones were recognized in this analysis. Although arbitrarily delineated, these zones are considered distinguishable and suitable for characterizing the potentials for water yield improvement by vegetation management, as
evaluated at this time. General characteristics, spatial distribution and water yield
improvement opportunities, if any, are presented for each vegetation zone. The water yield improvement opportunities, which subsequently formed the basis for estimating potential water yield increases that might be realized by implementing various management options, were derived from experimental watershed studies conducted in the respective vegetation zones.
Alpine Vegetation Zone
The alpine vegetation zone of approximately 1,600 acres occupies elevations above 11,500 feet on Humphrey's, Agassiz and Fremont Peaks of the San Francisco Mountain. Although limited in size, this vegetation zone is hydrologically important since it supplies snowmelt water for groundwater recharge in the Flagstaff vicinity.
Characteristics
The alpine area on San Francisco Mountain is above timberline and has no forest overstory species. Two plant associations have been distinguished, the alpine rock field and the alpine meadow. Normally, the former gradually merges into and is succeeded by the latter, which is the climax. The alpine rock field association is characterized by lichens and mosses on rock outcrops and in crevices, with vascular plants scattered among boulders where sufficient soil occurs. In the alpine meadow association, alpine meadow species start as
pioneers on rocky slopes and at the base of rock slides, and then spread vegetatively to form mats. Subsequently, soil develops on the mats and other plants become established.
The alpine vegetation zone, as compared with other vegeta- tion zones in the State, is characterized by relatively high precipitation, cool temperatures and high wind movements.
Deep and often long -lasting accumulations of snow occur in the alpine vegetation zone, providing a relatively high water yield per unit area. Some of the water produced is discharged from many springs found on San Francisco Mountain. No perennial streams arise in the zone. Surface runoff occurs for only short periods of time after rapid snowmelt or heavy rainfall events. Although not quantified, erosion rates and sediment yields are presumed to be minimal.
Soils on San Francisco Mountain are derived from volcanic rock of various forms which are highly permeable. Rocks in the alpine tundra above timberline consist largely of finer - grained lavas. San Francisco Mountain rises abruptly from a
timbered plateau at about 7,000 feet in elevation to a
2
maximum of 12,655 feet. It has the shape of a hollow, truncated cone which is about 12 miles in diameter at the base, two miles in diameter at the top, and one mile high. Generally, slopes within the alpine vegetation zone on San Francisco Mountain are about 40 to 45 percent, and all aspects are represented.
Various wildlife species are common, although they only inhabit the zone intermittently during late spring, summer and early autumn. There is no fish resource. Recreational activities are primarily limited to hiking, sightseeing and picnicking. The zone may also provide a site for big game hunting. Navajo and Hopi religious shrines are present.
The entire alpine vegetation zone is located within the Coconino National Forest. Generally, man has not utilized the zone for commercial natural resource products and applica- tions. Management has been and probably will remain directed toward the protection of the zone from destructive agents.
Water Yield Improvement Opportunities
Water yield improvement practices involving manipulation of vegetation currently are not considered realistic manage- ment options for the alpine zone which is unique in Arizona and of limited acreage.
Mixed Conifer Forests
Mixed conifer forests extend over 240,000 acres in the White, Chuska and San Francisco Mountains, and on the Kaibab Plateau, therefore, mixed conifers are principally found in the northern part of the State. Generally, these forests occur at elevations of 8,000 to 11,500 feet, with associated physiography in part determining their exact range (Figure 1).
The mixed conifer forests generally have higher area water yields than any other forest zone in Arizona, primarily due to the greater precipitation which occurs at higher elevations.
Characteristics
Seven coniferous and one deciduous species in a wide variety of mixtures characterize the mixed conifer forests. These overstory species include: Engelmann spruce (Picea engelmannii), blue spruce (Picea pungens), Douglas -fir (Pseudotsuga menziesii), white fir (Abies concolor), corkbark fir (Abies lasiocarpa var. arizonica), ponderosa pine (Pinus ponderosa), southwestern white pine (Pinus strobiformis) and quaking aspen (Populus tremuloides). The dense overstories that are common to the zone generally permit little or no herbaceous vegetation to occur. With comparatively low pro- duction of forage species, domestic livestock carrying capacities are low in relation to other vegetation zones in the State.

o a > w z
UTA H .._ ._.._..COLO.
o
O IO 20 30 40
MILES
A
MIXED CONIFER
URBAN
LAKES
RIVERS
MEXICO
Figure 1. Distribution of the Mixed Conifer Forests in Arizona. (The Douglas-fir type is only approximated, as the small map scale does not permit all of the small, scattered areas in the type to be shown.)
3

Annual precipitation in high- elevation mixed conifer forests ranges from 30 to 45 inches and is normally in excess of potential evapotranspiration. As a result, streams originating in this area are usually perennial. In contrast, streams originating in low elevation mixed conifer forests are often intermittent. Snowmelt probably is the most important source of runoff. For example, 89 to 99 percent of the annual water yield from USDA Forest Service experimental watersheds in this zone during 1965 and 1966 was attributed to snowmelt. Few descriptions of temperature regimes, relative humidity, evapo- ration rates, wind patterns and other climatic parameters are available for the mixed conifer forests.
Average annual water yield estimates from this zone have been developed by several investigators. These yields are variable and, as is common with upstream watersheds, not all of the water produced reaches downstream points of consump- tion due to transmission depletions. Considering the water budget in mixed conifer forests, an average annual water yield estimate approximating three to seven inches seems appropri- ate. Erosion and sediment losses from undisturbed watersheds are probably low, and water quality high.
Soils in the zone are varied in origin. However, regardless of origin, these soils are characteristically medium to moderately fine textured. Soil materials (regolith) are usually deep, allow- ing for deep water penetration and storage. Commonly, these forests occur over a wide range of slope and aspect combina- tions, although slope steepness is generally greater than is
found in other forest zones. Mixed conifer forests are of value as summer habitat for a
variety of big and small game animals, rodents, and game and nongame birds. Since streams originating in the higher eleva- tions of the forests are usually perennial, they often support game and nongame fish resources. The mixed conifer forests receive heavy recreational use throughout the year. Some of the best big game hunting and winter sports areas are found within the zone along with high altitude lake and stream fishing.
All of the commercial land is under some type of federal ownership or trusteeship, with management being mainly the responsibility of the USDA Forest Service and the USDI (U.S. Department of Interior) Bureau of Indian Affairs. The latter agency provides assistance to Indian tribal councils in the administration and management of Indian tribal lands. Large - scale lumbering operations were negligible, at least in the high elevations of the mixed conifer forests, until the late 1940's. Since then, the volume of lumber and other wood products harvested from these forests has increased rapidly. Generally, management emphasis is directed toward: protecting and improving water yield and quality, providing a flow of wood resources, furnishing summer food for domestic livestock and wildlife, and safeguarding natural beauty and aesthetic values.
Water Yield Improvement Opportunities
Results were generated from the partial conversion experi- ments on Workman Creek Watershed in east -central Arizona. These results pointed out the opportunities for, and estimates of, average water yield improvement through manipulation of mixed conifer forest overstories. Although these studies must
4
be assessed as "case histories," insight to potential water yield increases may be obtained.
On the North Fork of Workman Creek, where the forest overstories are being converted to perennial grass and sprouting brush in four management steps, no change in water yield occurred following removal of the riparian vegetation. How- ever, an increase in water yield of 1.25 inches (45 percent) at average conditions (1959 -68) occurred after converting 80 acres of moist -site vegetation to grass (Figure 2). Then, after converting another 100 acres of dry -site vegetation to grass, the water yield increase attributed to the combined effect of all treatments was 5.52 inches (198 percent) at average conditions (1969 -72).
On the South Fork of Workman Creek, no change in water yield was observed following an individual tree selection cut. However, an increase in water yield of 5.94 inches (215 percent) at average conditions (1969 -72) occurred after a subsequent uniform thinning was applied to areas dominated by ponderosa pine and the clearing of areas dominated by Douglas -fir and white fir.
Summarizing the results from the Workman Creek Water- shed, the conversion of approximately one -third of North Fork, specifically the moist -site vegetation immediately adja- cent to the stream channel, increased water yield by approxi- mately 0.10 of an acre -foot per acre annually. Conversion of another 40 percent of the watershed, specifically the dry -site vegetation immediately adjacent to the moist -site vegetation, was followed by an increased water yield of approximately 0.45 of an acre -foot per acre annually. The increase in water yield observed following the uniform thinning and clearing treatment on South Fork, approximately 0.50 of an acre -foot per acre annually, compares favorably with the results obtained on North Fork after the combined riparian, moist - site and dry -site treatments. Possibly, this similar increase in water yield can be attributed to the similarity in the clearing of Douglas -fir and white fir on South Fork to the conversion of moist -site and dry -site vegetation on North Fork, both in terms of area and juxtaposition of watershed treated.
The hydrologic response to the clearing of mixed conifer forest overstories on parts of the East Fork of Willow Creek, another experimental area in east -central Arizona, cannot be documented at this time because of insufficient posttreatment data.
Aspen Forests
Quaking aspen is commonly found interspersed with mixed conifer and ponderosa pine forests. It occupies approximately 79,000 acres. Aspen forests are mostly in the White Mountain vicinity with other forests on lower slopes of San Francisco Mountain, on the Kaibab Plateau and scattered across numer- ous mountain ranges in southern Arizona. Although not extensive, aspen forests may be hydrologically important and may also have high protective cover value on many watersheds.
Characteristics
Quaking aspen frequently occurs in intermixture with various coniferous species, but its occurrence in pure stands is

Figure 2. North Fork of Workman Watershed in East -central Arizona.
given primary emphasis here. When mixed with other over - story species, quaking aspen is often associated with Engelmann spruce, Douglas -fir, white fir and ponderosa pine. Many grasses, grasslike plants, forbs and shrubs grow beneath aspen overstories, providing forage for domestic livestock and wildlife.
Aspen forests occupy areas of characteristically high pre- cipitation, with average annual amounts ranging from 25 to 35 inches. Precipitation during the winter, when the aspen over - story is leafless, furnishes the major source of moisture for soil moisture recharge and streamflow. Temperatures in aspen forests are relatively cool, primarily because of the high elevations where aspen is usually found. Little information exists to describe relative humidity, evaporation rates and other climatic parameters.
Hydrologic characteristics of aspen forests generally are similar to those of the surrounding mixed conifer and ponder- osa pine forests. Depending on elevation, average annual water yield from areas supporting aspen is estimated to be three to six inches and is closely related to the amount of annual precipitation. Years of greatest water yield are associated with years of large amounts of precipitation. This relationship can be modified by soil conditions, physiography and vegetation. Erosion and sediment losses in natural stands are considered relatively low, although specific data are limited. Water quality
is considered to be generally high. Quaking aspen grows on a variety of soils, ranging from
shallow and rocky to deep and heavy. Typically this highly adaptable species is found within an elevational range of 7,500 to 10,000 feet. At its upper limits, aspen may occur on almost any combination of slope and aspect, while at the lower limits it usually occupies relatively cool, moist sites.
Aspen forests provide an important food source and, in many instances, seasonal protective cover for many species of wildlife. With the exception of some large, permanent streams flowing through the higher elevations of Arizona, most drain- ages that arise from aspen forests are intermittent. Thus, no significant fish populations are associated with these forests. Aspen forest stands are highly regarded aesthetically. In areas where forests are predominantly coniferous, the scenic varia- tion offered by aspen is especially appreciated. Additionally, due to the many wildlife species that inhabit aspen forests, these areas are often favorite hunting locations.
The most extensive aspen forest acreage, about 70 percent, occurs under the jurisdiction of the USDA Forest Service or is located on Indian tribal lands; private ownerships comprise the remainder. Current management practices are generally con- cerned with maintaining aspen forest as a watershed -protecting cover, insuring its recreation and aesthetic value, and improv- ing forage production for domestic livestock and wildlife.
5
Water Yield Improvement Opportunities
No water yield improvement experiments involving vegeta- tion manipulation have been conducted in the aspen forest in Arizona. Thus, the basis for discussing the opportunities for, and estimates of, potential water yield increase is limited. Furthermore, the relatively small acreages in aspen forests, the treatable portion of which may be even less considering realistic management options, suggests that little direct impact may be derived by imposing water yield improvement treat- ments.
For accounting purposes, and because aspen, mixed conifer and ponderosa pine forests frequently occur in intermixture and have many similar hydrologic characteristics, the acreages in aspen forests have been combined with the acreages in the mixed conifer and ponderosa pine forests in this report.
Ponderosa Pine Forests
Ponderosa pine forests, an area in excess of 5,000,000 acres, supply many natural resource products, and are used for a variety of other purposes in Arizona. These forests do the following: yield water for municipal, agricultural and indus- trial developments; furnish a diversity of primary wood products; contribute forage for domestic livestock and wild- life; and provide recreation environments.
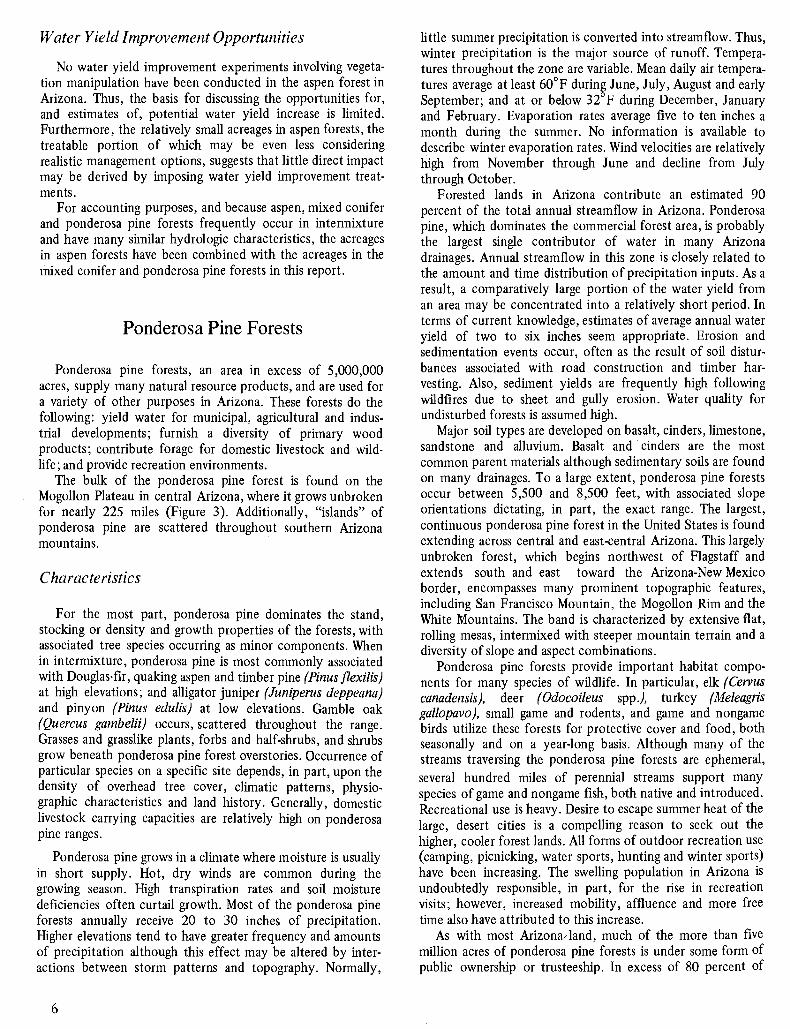
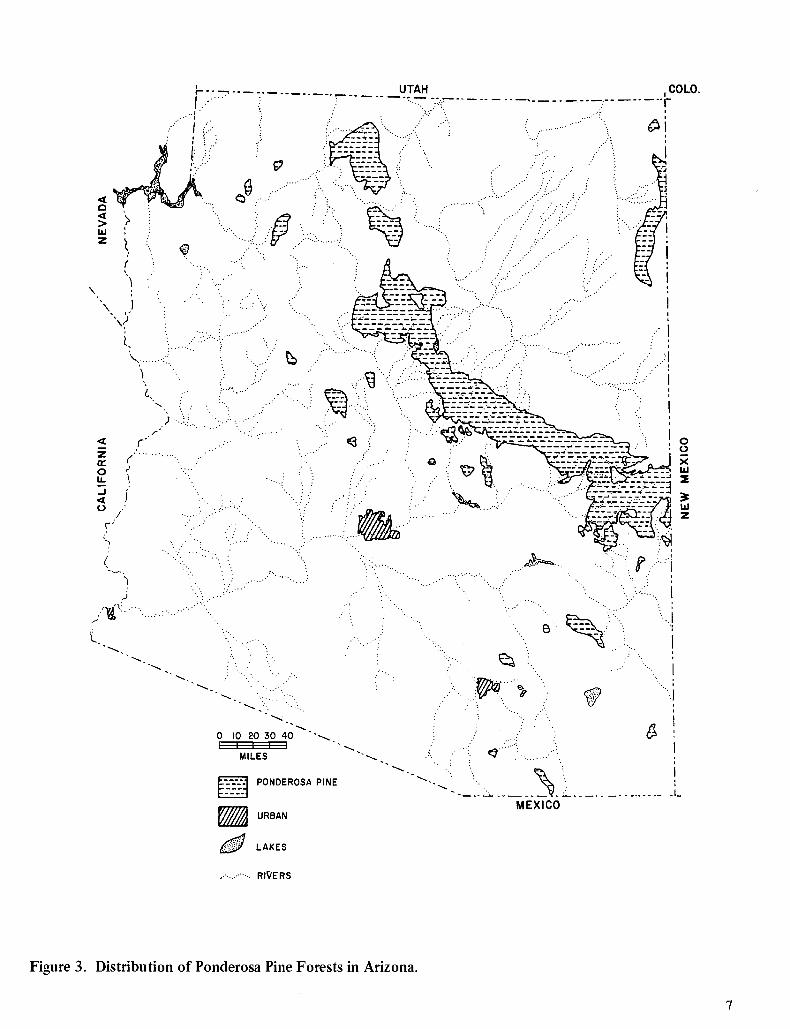
The bulk of the ponderosa pine forest is found on the Mogollon Plateau in central Arizona, where it grows unbroken for nearly 225 miles (Figure 3). Additionally, "islands" of ponderosa pine are scattered throughout southern Arizona mountains.
Characteristics
For the most part, ponderosa pine dominates the stand, stocking or density and growth properties of the forests, with associated tree species occurring as minor components. When in intermixture, ponderosa pine is most commonly associated with Douglas -fir, quaking aspen and timber pine (Pinus flexilis) at high elevations; and alligator juniper (Juniperus deppeana) and pinyon (Pinus edulis) at low elevations. Gamble oak (Quercus gambelii) occurs, scattered throughout the range. Grasses and grasslike plants, forbs and half- shrubs, and shrubs grow beneath ponderosa pine forest overstories. Occurrence of particular species on a specific site depends, in part, upon the density of overhead tree cover, climatic patterns, physio- graphic characteristics and land history. Generally, domestic livestock carrying capacities are relatively high on ponderosa pine ranges.
Ponderosa pine grows in a climate where moisture is usually in short supply. Hot, dry winds are common during the growing season. High transpiration rates and soil moisture deficiencies often curtail growth. Most of the ponderosa pine forests annually receive 20 to 30 inches of precipitation. Higher elevations tend to have greater frequency and amounts of precipitation although this effect may be altered by inter- actions between storm patterns and topography. Normally,
6
little summer precipitation is converted into streamflow. Thus, winter precipitation is the major source of runoff. Tempera- tures throughout the zone are variable. Mean daily air tempera- tures average at least 60 °F during June, July, August and early September; and at or below 32 °F during December, January and February. Evaporation rates average five to ten inches a
month during the summer. No information is available to describe winter evaporation rates. Wind velocities are relatively high from November through June and decline from July through October.
Forested lands in Arizona contribute an estimated 90 percent of the total annual streamflow in Arizona. Ponderosa pine, which dominates the commercial forest area, is probably the largest single contributor of water in many Arizona drainages. Annual streamflow in this zone is closely related to the amount and time distribution of precipitation inputs. As a
result, a comparatively large portion of the water yield from an area may be concentrated into a relatively short period. In terms of current knowledge, estimates of average annual water yield of two to six inches seem appropriate. Erosion and sedimentation events occur, often as the result of soil distur- bances associated with road construction and timber har- vesting. Also, sediment yields are frequently high following wildfires due to sheet and gully erosion. Water quality for undisturbed forests is assumed high.
Major soil types are developed on basalt, cinders, limestone, sandstone and alluvium. Basalt and cinders are the most common parent materials although sedimentary soils are found on many drainages. To a large extent, ponderosa pine forests occur between 5,500 and 8,500 feet, with associated slope orientations dictating, in part, the exact range. The largest, continuous ponderosa pine forest in the United States is found extending across central and east -central Arizona. This largely unbroken forest, which begins northwest of Flagstaff and extends south and east toward the Arizona -New Mexico border, encompasses many prominent topographic features, including San Francisco Mountain, the Mogollon Rim and the White Mountains. The band is characterized by extensive flat, rolling mesas, intermixed with steeper mountain terrain and a
diversity of slope and aspect combinations. Ponderosa pine forests provide important habitat compo-
nents for many species of wildlife. In particular, elk (Cervus canadensis), deer (Odocoileus spp.), turkey (Meleagris gallopavo), small game and rodents, and game and nongame birds utilize these forests for protective cover and food, both seasonally and on a year -long basis. Although many of the streams traversing the ponderosa pine forests are ephemeral, several hundred miles of perennial streams support many species of game and nongame fish, both native and introduced. Recreational use is heavy. Desire to escape summer heat of the large, desert cities is a compelling reason to seek out the higher, cooler forest lands. All forms of outdoor recreation use
(camping, picnicking, water sports, hunting and winter sports) have been increasing. The swelling population in Arizona is
undoubtedly responsible, in part, for the rise in recreation visits; however, increased mobility, affluence and more free time also have attributed to this increase.
As with most Arizona/ land, much of the more than five
million acres of ponderosa pine forests is under some form of public ownership or trusteeship. In excess of 80 percent of
4
La
.. . .. .. .. m.. ,..... .. . .. .r .w.... ... ..... ... .,... ... ..... ... .., . ... . ... ... ... ....-........ "'".. ' r UTAH COLO.
. ..
. .
. . . .
....
0 10 20 30 40 I i i i I
MILES
PONDEROSA PINE
URBAN
LAKES
Figure 3. Distribution of Ponderosa Pine Forests in Arizona.
. .
MEXICO
7

Figure 4. West Fork of Castle Creek in East -central Arizona.
these forests is under federal agencies or Indian tribal lands jurisdiction. The remainder is in State or private ownership. Recognizing the total mix of natural resource products as well as uses to which ponderosa pine forests can be utilized requires implementation of multiple use management practices. Inte- grated plans have been formulated to provide wood, forage, water, wildlife and recreation to meet the demands of the people of the State.
Water Yield Improvement Opportunities
Opportunities for, and estimates of, potential water yield improvement through vegetation management in the ponder- osa pine forests are synthesized from the results of experi- ments applied to the Castle Creek Watershed in east -central Arizona and Beaver Creek Watershed in north -central Arizona. Again, these results document case histories. Such information suggests relative magnitudes of potential water yield increases following implementation of vegetation management practices.
Within a general framework, water yield improvement through vegetation management in ponderosa pine forests may be placed in two broad categories: the clearing or thinning of forest overstories. Various alternatives and combinations are possible within each category. For instance, considering the
8
removal of forest overstories, different arrangements, orienta- tions and patterns of clearings are possible. Regarding the reduction of forest overstory density, different intensities and combinations of intensities can be imposed.
Experiments involving clearing of ponderosa pine forest overstories have been imposed on the West Fork of Castle Creek and on Beaver Creek Watersheds 12, 9, 14 and 16.
On the West Fork of Castle Creek, where one -sixth of the forest overstory was cleared and the remaining five- sixths was subjected to a cultural thinning treatment, a water yield increase of 0.61 inch (29 percent) at average conditions (1967 -73) has been observed since treatment (Figure 4).
On Beaver Creek Watershed 12, a water yield increase of 2.1 inches (34 percent) at average conditions (1968 -73) has occurred since a complete clearing of the forest overstory. In a
sense, this treatment represents a "benchmark" in terms of treatment severity.
On Beaver Creek Watershed 9, where one -third of the forest overstory was removed in uniform, parallel strips, a water yield increase of 1.1 inches (16 percent) at average conditions (1969 -73) has occurred (Figure 5). No cultural treatment has been implemented to alter the forest overstory structure on the two -thirds of the watershed that was not cleared.
On Beaver Creek Watershed 14, a water yield increase of 1.0 inch (21 percent) at average conditions (1971 -73) has

Figure 5. Beaver Creek Watershed 9 in North -central Arizona.
occurred following a combined stripcut- shelterwoodcut. This treatment specified that one -third of ' forest overstory was removed in irregularly shaped strips, for aesthetic purposes, and the forest overstory on the remaining two -thirds was thinned to 80 square feet of basal area per acre (Figure 6).
On Beaver Creek Watershed 16, a water yield increase of 5.6 inches (103 percent) was observed in the first year after another combined stripcut -shelterwoodcut was implemented (1973). In contrast to the treatment on Watershed 14, this treatment specified that one -half of the forest overstory was removed in irregularly shaped strips and the forest overstory on the other one -half was thinned to 80 square feet of basal area per acre. Unfortunately, the posttreatment year that was documented included an unusually wet winter, with a record snowfall. Thus, additional analyses will be necessary to describe "average" conditions.
In summarizing the above results, the clearing of forest overstory on one -sixth of the West Fork of Castle Creek, with the remaining five -sixths subjected to a thinning treatment, increased water yield by 0.05 of an acre -foot annually. Clearing of one -third of the forest overstory on Beaver Creek Watershed 9 (uniform strips) and on Beaver Creek Watershed 14 (irregular strips) increased water yield by approximately 0.10 of an acre -foot annually. Cultural treatments on the remaining two- thirds of the watershed, if any, had seemingly
little observable effect. A complete clearing of forest overstory on Beaver Creek Watershed 12 increased water yield by approximately 0.20 of an acre -foot annually. Description of possible water yield increase after partial clearing of forest overstory on Beaver Creek Watershed 16 will require further study to assess average conditions.
A thinning experiment of ponderosa pine forest overstories by group selection on Beaver Creek Watershed 17 provides the only basis to date for evaluating a reduction in forest overstory density as a water yield improvement practice.
On Beaver Creek Watershed 17, an annual water yield increase of 1.7 inches (22 percent) at average conditions (1970 -73) has occurred since the removal of 75 percent of the ponderosa pine basal area, which reduced the forest overstory density level to an average of 30 square feet per acre. Thus, thinning the forest overstory on this watershed increased water yield by approximately 0.15 of an acre -foot per acre annually.
Pinyon -Juniper Woodlands
The pinyon juniper woodland zone, of more than 14,000,000 acres, lies adjacent to and surrounds the commer-
9

Figure 6. Beaver Creek Watershed 14 in North -central Arizona.
cial forests in Arizona. Occurring at lower elevations, and generally with less annual precipitation than commercial for- ests, these woodlands exhibit a lower water yield improvement potential. Pinyon juniper woodlands, primarily located in the northern half of the State, occur at elevations of 4,500 to 7,500 feet. In southern Arizona, the woodlands merge with the chaparral vegetation zone (Figure 7).
Characteristics
The most consistent forest overstory species found in the woodlands is pinyon, primarily common pinyon (Pinus edulis) but with singleleaf (Pinus monophylla) or Mexican pinyon (Pinus cembroides) occurring on limited areas. North of the Mogollon Rim, Utah ( Juniperus osteosperma) and one -seed juniper ( Juniperus monosperma) are intermixed with pinyon; south of the Mogollon Rim, alligator juniper (Juniperus deppeana) is found. Grasses, grasslike plants, forbs, half -shrubs and shrubs, both annuals and perennials, abound beneath pinyon juniper woodland overstories. Commonly, domestic livestock which spend the summer at higher elevations come to the woodlands in winter, where snows do not normally cover forage or inhibit movement.
10
Pinyon juniper woodlands occupy a semiarid climatic re- gion, with wide fluctuations in precipitation, temperature, evaporation rate and wind movement. Average annual precipi- tation varies from 12 to 24 inches. It is characterized by a bimodal distribution pattern. Summer precipitation occurs as short -lived, violent thunderstorms from May through September. Winter precipitation, normally rain but occasion- ally snow, occurs as a result of relatively slow moving frontal storms. Temperatures determine, in part, the areal extent of the woodland zone. Generally, temperatures are about 6 °F higher than in the adjacent ponderosa pine forests immediately above, and about 5 °F lower than in the vegetation zones below. Evaporation rates are relatively high during the growing season, and may affect water yield potentials in the zone. Generally, only during the coldest months (December, January and February) does precipitation exceed the evapotranspira- tion rate.
In comparison with the state's commercial forests, pinyon - juniper woodlands cannot necessarily be considered high water yielding. Average annual water yield from the woodlands is variable, again depending upon the amount and time distribu- tion of precipitation. However, based on knowledge of the hydrologic processes affecting the water budget in the pinyon - juniper woodlands, an estimated average annual water yield

UTAH ,COLO.
0 10 20 30 40 -
MILES
r
PINYON- JUNIPER
URBAN
LAKES
RIVERS
Figure 7. Distribution of Pinyon- Juniper Woodlands in Arizona.
MEXICO
11

Figure 8. Beaver Creek Watershed 1 and 2 on Coconino National Forest.
not exceeding one inch appears acceptable. Unfortunately, little descriptive information is available for characterizing erosion rates, sedimentation and water quality.
The majority of soils within the pinyon juniper woodland zone are derived from three primary parent materials: basalt, limestone and sandstone. Generally, the woodland zone occupies extensive areas of essentially level or, at the most, gently rolling topography. With the exception of steep canyon walls, sloping mesas and breaks, few slopes exceed 20 to 25 percent. All aspects are well represented.
The pinyon juniper woodland zone provides protective cover and some food for many species of wildlife. Elk, deer, turkey; small game and rodents utilize the woodlands to some extent throughout the year. As no permanent streams arise from the zone, the only significant fish populations are found within the permanent streams that arise in higher, commercial forests and then flow through the zone. Normally, recrea- tionists leaving their homes in metropolitan centers in Arizona travel through pinyon juniper woodlands to reach second homes or to engage in various sporting activities at the higher elevations. Thus, casual, en route recreation (picnicking, hiking and photography) generally characterize this vegetation zone. Additionally, the upper fringes of the woodland zone, imme- diately below ponderosa pine forests, is often a favored location to establish semipermanent camps during big game
12
hunting seasons. Most pinyon juniper woodlands are under federal owner-
ship or trusteeship, with the remainder under State or private jurisdiction. In recent years, ranchers have shown interest in
removing pinyon juniper woodland overstories to increase forage production for domestic livestock consumption. Consequently, range improvement practices have been imple- mented on large acreages of both public and private lands. Considering the pinyon juniper woodlands as an entity, man- agement is often directed toward forage production, game habitat and improved watershed condition. Management also has recognized a need to develop the wood products potential for the zone even if such products are obtained on a "mining" basis.
Water Yield Improvement Opportunities
Potential water yield improvement opportunities involving the manipulation of pinyon juniper woodland overstories do not currently appear promising. Considering conversion treat- ments, the only realistic management practice that is appropri- ate, mechanical techniques (chaining, cabling and hand clear- ing with power saws) have not increased water yields following experiments applied to the Beaver Creek Watershed (Figure 8)

LAKES
Figure 9. Distribution of Chaparral Vegetation in Arizona.
13

and on Corduroy Creek and Cibecue Ridge in east -central Arizona. The only evaluated water yield improvement experi- ment to show increased water yield is the application of herbicides to kill pinyon and juniper trees on the stump.
Aerial application of a mixture of 2ih pounds of picloram and five pounds of 2,4 -D per acre on Beaver Creek Watershed 3 has resulted in a water yield increase of 0.45 inch (65 percent) at average conditions (1969 -72). However, as only one application of a single mixture of herbicides has been assessed on one watershed, general statements regarding the operational use of chemical conversion treatments to increase water yield are probably not appropriate.
As a result of the lack of water yield increase following the mechanical conversion of pinyon juniper woodland over - stories, and the limited testing and possible constraints associated with the operational implementation of chemical conversion, water yield improvement practices involving the manipulation of pinyon juniper woodlands are difficult to assess at this time.
Chaparral Vegetation Zone
The chaparral vegetation zone occurs largely on rough, discontinous mountainous terrain south of the Mogollon Rim, extending from Seligman in the northwest to the Chiricahua Mountains in the southeast (Figure 9). Estimates of acreage in chaparral vegetation vary from about 3,000,000 to nearly 6,000,000 acres; this variation may be a result of different criteria used in determining boundaries between the more mesic (neither decidedly wet nor dry) and zeric (decidedly dry) vegetation zones that occur, respectively, at the upper and lower extent of the chaparral type.
Characteristics
Fifty or more shrub species may be found in the chaparral type, but generally less than 15 are important in terms of density. In many locations, chaparral stands consist of a
heterogeneous species mix, but often only one or two species dominate. Shrub live oak (Quercus turbinella) appears to be the most prevalent species, while Emory (Quercus emoryi) and Palmer oak ( Quercus dunnii), true (Cercocarpus montanus) and burchleaf mountain -mahogany (Cercocarpus betuloides), Pringle (Arctostaphylos pringlei) and pointleaf manzanita (Arctostaphylos pungens), yellowleaf ( Garrya flavescens) and Wright silktassel (Garrya greggii), hollyleaf buckthorn (Rhamnus crocea), desert ceanothus ( Ceanothus greggii) and other shrub species may be included in the chaparral intermixture. Annual and perennial grasses, forbs and half - shrubs occur as lesser vegetation in the zone, particularly where the overstory canopy is only moderately dense or open. Chaparral ranges are often grazed year -long by domestic livestock because the evergreen plants that are common to the zone provide a continuous forage supply.
Climate of chaparral vegetation zone is characterized by a
cool, wet winter period from November until March; then, by
14
a warm, dry period for two or three months. Following the dry period, a second wet period runs from July to October, when rainfall again decreases. Average annual precipitation varies from 16 inches at the lower limits of the chaparral type to over 25 inches in the higher rainfall zones. Approximately 55 to 60 percent of the annual precipitation occurs as rain or snow between November and April. Summer rainfall occurs mainly in July and August, which are the wettest months of the year. Mean daily air temperatures generally vary from about 85 °F in July to 35 °F in January. Evaporation rates can approach 80 to 85 inches per year.
Water yield attributed to chaparral vegetation zone is
difficult to isolate. Chaparral vegetation often is limited to bands along the flanks of mountains. Stream drainage crosses the bands and, on large watersheds, some of the flow at the outlet is derived from other vegetation zones at higher eleva- tions. Estimates of average annual water yield from pre- dominately chaparral- covered areas vary from less than 0.1 inch to approximately three inches. Rates of erosion and sedimentation appear to be relatively low for undisturbed chaparral, particularly in comparison to the temporary high rates observed immediately after disturbance by fire or herbi- cide treatments. Water quality characteristics of streamflow originating from chaparral watersheds have only recently been monitored and, thus, cannot be quantified.
Chaparral soils typically are coarse -textured, deep and poorly developed. Granites occur on more than half of the zone, and sandstone and diabase occur on less than 10 percent of the area. The topography of the zone is characterized largely as isolated mountain ranges dissected by steep -walled gorges and canyons. Elevations generally vary between 3,000 and 6,000 feet, and slopes of 60 to 70 percent are common. All aspects are presented.
Wildlife populations tend to be comparatively low particu- larly in dense, continous stands. However, high deer popula- tions are often associated with mixed -shrub types, and other wildlife species may be found concentrated in fringe areas. Streamflow, especially from undisturbed chaparral areas, is
often intermittent; therefore, fish populations are restricted to permanent streams flowing through the zone. Recreation activities are generally dispersed, including hiking, picnicking, camping, hunting and sightseeing.
More than 80 percent of the three to six million acres of chaparral vegetation in Arizona is under federal ownership or trusteeship. The primary management objectives associated with the zone have been concerned with domestic livestock and wildlife, emphasizing forage production and grazing of grasses, forbs and shrubs. During the 1950's, the potential for chaparral watersheds to produce more streamflow for down- stream users received increasing attention. As a result, some operational programs designed to increase water yield have been initiated. Recent and stricter herbicide controls have restricted some programs.
Water Yield Improvement Opportunities
Results to date suggest that water yield, generally, from the chaparral vegetation zone can be increased by removal of shrub overstories and establishment of a replacement grass and

Figure 10. Three Bar Watershed C in Central Arizona.
forb cover. Feasibility studies indicate opportunities may be economically beneficial if multiple products and uses derived from the natural resource base in this zone are considered. At this time, thinning of chaparral overstory densities is not considered a realistic treatment for water yield improvement since chaparral shrubs often sprout, or reseed, vigorously, and tend to quickly reoccupy treated areas.
Although experimental watersheds have been established at several locations within the chaparral vegetation zone, only posttreatment source data from Three Bar Watershed in central Arizona and Whitespar Watershed in north -central Arizona are included in the present analysis. The compara- tively low precipitation amounts, unusual soil characteristics and sparse initial shrub densities on the Natural Drainage Watersheds in central Arizona may limit the opportunity to extrapolate data from these watersheds to other areas of chaparral. Mignus Watersheds in north -central Arizona, which are still being calibrated, will not be subjected to water yield improvement experimentation until 1974, or later.
Various methods of converting chaparral vegetation to grasses and forbs have been attempted to increase water yield. Among these methods is the use of chemicals, either separately or in combination with burning treatments. Both approaches have been successful. The portion of a watershed area that has been cleared of chaparral shrubs has varied among watersheds.
On Three Bar Watershed C nearly all chaparral overstory was removed by chemical treatments following a wildfire. This left less than 10 percent canopy cover (Figure 10), and an annual water yield increase of 5.78 inches (328 percent) at average conditions (1961 -72) was observed.
On Three Bar Watershed B, an annual water yield increase of 1.28 inches (320 percent) at average conditions (1966 -72) occurred since the removal of the chaparral shrubs by chemical treatments on the north -facing slopes. The treated area, on which the posttreatment shrub cover was less than 10 percent, constituted 40 percent of the watershed area.
On Three Bar Watershed F, a water yield increase of 2.67 inches (703 percent) at average conditions (1970 -72) occurred after essentially all of the chaparral overstory was removed by chemical treatments, leaving less thin 10 percent canopy cover (Figure 11).
On Whitespar Watershed B, where only the chaparral shrubs in the stream channel were removed by chemical treatments (Figure 12), a water yield increase of 0.53 inch (66 percent) at average conditions (1968 -72) was observed. The treated area, on which 10 to 20 percent of the shrubs remained after treatment, constituted approximately 15 percent of the water- shed area.
In summary, conversion of approximately 15 percent of the chaparral overstory on Whitespar Watershed B, specifically the
15

Figure 11. Three Bar Watershed F in Central Arizona. shrubs in the stream channel, increased water yield by about 0.04 of an acre -foot per acre annually. Conversion of 40 percent chaparral overstory on Three Bar Watershed B, specifi- cally a removal of north -facing slope shrubs, increased water yield by 0.10 of an acre -foot per acre annually. A complete conversion of essentially all chaparral overstory on Three Bar Watersheds C and F increased water yield by 0.20 to 0.50 of an acre -foot per acre annually.
Grassland Vegetation Zone The grassland vegetation zone, which includes mountain,
plains and desert grassland types, covered approximately one - fourth of Arizona, an estimated 18,210,000 acres, as of the early 1950's. Subsequent invasion by plant species from adjacent vegetation zones may have reduced the areal extent of the grasslands (Figure 13). Occurring through a range of elevations, the individual grassland types differ in terms of water yield and other natural resource potentials.
Characteristics
The mountain grassland type, small in aggregate area, is
16
found scattered within mixed conifer and ponderosa pine forests. Plains grassland type occurs as nearly uninterrupted cover between 5,000 and 7,000 feet, essentially in the eastern half of the State. The desert grassland is best developed in southeastern Arizona at 3,000 to 5,000 foot elevation. It is also found in the northwestern quarter of the State.
Normally, overstory species are not considered part of a grassland plant community. Scattered, isolated trees, shrubs or other woody plant species may occur either naturally or through invasion from adjacent vegetation zones. More than one -half of the genera , and nearly one -third of the native and introduced grass species growing without cultivation in the United States, are represented in Arizona, many of which grow in the grassland vegetation zone. Many have high forage value for domestic livestock and many are utilized by various wildlife species. With overall consideration, general produc- tivity of the - grassland zgne has decreased in recent years due to overstory species invasion from adjacent zones. This is attributed, in part, to overgrazing by domestic livestock.
Among the three grassland types, climatic characteristics vary widely. In the mountain grasslands,,average annual precipi- tation is 30 to 35 inches of which about 40 percent occurs between June and September; mean daily air temperatures range from 30 °F to 65 °F, coinciding somewhat with the patterns in adjacent mixed conifer and ponderosa pine forests.

Figure 12. Whitespar Watershed B in North-central Arizona. 17

- ._ -__- UTAH , COLO.
3 w
0 10 20 30 40 - 1 1 1 1 1
MILES ' GRASSLAND
URBAN
LAKES
RIVERS
Figure 13. Distribution of Grassland Vegetation in Arizona.
18
MEXICO

In the plains grasslands, average annual precipitation is about 17 inches with extremes of 10 and 20 inches. Mean daily maximum air temperatures may reach 95 °F, while mean daily minimum air temperatures may be as low as 32 °F. In the desert grasslands, average annual precipitation varies from 8 to 15 inches while mean daily air temperatures range from 40 °F to 80 °F.
Little is known about the water yield from mountain grasslands, although estimates approximating those character- izing mixed conifer and ponderosa pine forests may be appropriate. Estimates of annual water yield from plains grasslands, while not developed in detail, probably do not exceed one inch. Annual water yield from desert grasslands is low, perhaps between 0.1 and 0.5 inch, although it may be locally higher on some ranges. Sediment production on mountain grasslands is normally low, has not been docu- mented for plains grasslands and is considered minimal on desert grasslands.
Soils in the mountain grasslands are usually fine- textured alluviums that frequently are easily compacted and often poorly drained. Soils in the plains grasslands are generally shallow, and predominately medium -textured; deep, medium - to -fine- textured alluvial soils are found along many of the drainageways. Soils in desert grasslands are shallow to moder- ately deep, stony and rocky, often covered by decomposing litter. For the most part, the grassland vegetation zone occupies relatively level topography as compared to much of the adjacent vegetation zones.
The grassland vegetation zone provides habitat components for many species of wildlife, both game and nongame. The only fish populations found in the zone are associated with permanent streams flowing through and originating at higher elevations. Grasslands may provide important recreational opportunities in Arizona by being a source of open space and solitude for city dwellers.
Most of the grassland vegetation zone is under federal ownership or trusteeship with some acreages under State and private jurisdictions. Generally, grassland ranges in Arizona provide forage for domestic livestock, important protection for many watersheds in a water- scarce area and casual recrea- tion for many.
Water Yield Improvement Opportunities
Water yield improvement practices involving vegetation manipulations are not considered to be realistic management options in the grassland vegetation zone at this time. Further- more, with the possible exception of mountain grasslands, which are relatively limited in extent, the water yielding characteristics of grassland ranges are inherently low; thus, there appears to be little opportunity for improving water yield in the future.
Desert Shrub Vegetation Zone
The desert shrub vegetation zone occupies about 35,700,000 acres and includes the northern and southern
desert shrub types. Unfortunately, delineation between desert shrub vegetation and the adjacent grassland vegetation zone is often indistinct, partly due to the invasion of grasslands by shrubs. Thus, the actual extent of the desert shrub types is frequently difficult to ascertain (Figure 14). Since northern and southern desert shrubs occur at different elevations, water yield and other natural resource potentials may differ.
Characteristics
The northern desert shrub type (the sagebrush range) is largely confined to elevations between 2,500 and 5,000 feet north of the Colorado and Little Colorado Rivers, an area known locally as the "strip." The southern desert shrub type occurs mainly in the southwestern one -third of Arizona, at elevations of about 150 to 3,000 feet.
Overstory species that characterize the desert shrub vegeta- tion zone include numerous shrubs and cacti. Pure, unbroken stands of big sagebrush (Artemisia tridentata) are common through the northern desert shrub type. Another characteristic shrub of this type is blackbrush (Coleogyne ramosissima); additionally, fourwing saltbush (Atriplex canescens) and winterfat (Eurotia Janata) predominate locally. Common shrubs and cacti in the southern desert shrub type include creosotebush (Larrea tridentata), paloverdes (Cercidium spp.) and cacti (Carnegiea gigantea, Opuntia spp.). Generally, the occurrence of high- valued forage species in the desert shrub vegetation zone is limited, except in years when abundant annuals may carpet the desert floor.
Average annual precipitation in the northern desert shrub type is about 10 inches, of which 50 percent or more may occur from June through September, depending upon the locale. Mean daily air temperatures in the northern desert shrub type range from 70° to 80 °F in the hottest month, and from 30° to 40 °F in the coldest month. Average annual precipitation in the southern desert shrub type varies from 3
to 12 inches, with about 60 percent of this amount commonly occurring from July through September; effective precipita- tion is normally not expected in April, May or June. Mean daily air temperatures in the southern desert shrub type during the hottest month range from 80° to 90 °F and from 30° to 35 °F in the coldest.
Only limited descriptions of water yield are available to characterize the desert shrub vegetation zone. Considering the zone as an entity, an annual water yield of less than 0.5 inch seems appropriate. However, some of the highest sediment movements in Arizona occur in the northern desert shrub type, primarily because of the sparse ground cover and erodible soils. Watershed management practices are often less directed toward increasing the limited runoff than in stabiliz- ing the surface soils. Sediment movements are also high in the southern desert shrub type, where most of the runoff occurs as flash flood flows after brief and intense summer thunder- storms.
Throughout much of the desert shrub vegetation zone, layers of calcareous hardpan, or caliche, are abundant on extensive areas. Formation of caliche in the soil is due, in part, to the interrupted penetration of water under arid conditions. The desert shrub vegetation zone generally occupies the lower
19

0 10 20 30 40 r MILES
1 ill DESERT SHRUB
URGA N
0 LAKES
RI VERS
Figure 14. Distribution of Desert Shrub Vegetation in Arizona.
20
mountain slopes and intervening valleys throughout its range and consists of dissected valley fills with deeply entrenched drainageways and occasional rocky hills; the general terrain is
sloping to moderately steep. The northern desert shrub is
characterized by relatively flat to sloping plateaus and plains interrupted by occasional peaks or deeply incised canyons.
Habitat for many species of wildlife, both game and nongame, is found within the desert shrub vegetation zone. Fish populations that characterize this zone are associated with the larger, permanent streams that originate at higher elevations and then flow through the zone. Like the grassland ranges, the greatest recreational value of the desert shrub vegetation zone may be the open space and solitude provided for city dwellers of Arizona.
Most of the desert shrub vegetation zone is under federal ownership or trusteeship. Management efforts are often directed toward maintenance of native flora and fauna for recreation and aesthetic values. A special managerial effort is
usually made to maintain a balance between domestic live- stock and wildlife numbers in relation to available food supplies.
Water Yield Improvement Opportunities
Water yield improvement practices based on manipulation of vegetation cannot be justified in terms of increasing recover- able water supplies in the desert shrub vegetation zone at this time. It appears that the magnitude of water yield is closely associated with precipitation events of high rainfall intensities and any effects of vegetation manipulation are generally minimal.
Riparian Association Zone
Riparian associations, by definition, occur in, or adjacent to, drainageways and their floodplains. They are characterized by plant species that are different from that of immediately surrounding nonriparian communities. There are, roughly estimated, 280,000 to 320,000 acres in this zone. Generally, riparian plants have high transpiration rates, as the water supply is continuous and the environment is warm and arid; thus, high water use is common.
Phreatophytes are plants that obtain their water supply from the zone of saturation, either directly from or through the capillary fringe. Separating riparian plants from phreatophytes is difficult and may be academic. Both plants require more water than is available through normal precipitation. Riparian plants depend largely on flowing water and phreatophytes on groundwater, but there is no clear division between shallow alluvial deposits in mountain streams for storage of groundwater and the deeper deposits in typical phreatophyte zones. Phreatophytes growing in channels and floodplains are considered riparian vegetation in this report.
Characteristics
Three riparian associations, delineated by elevation, are
recognized in Arizona: less than 3,500 feet, from 3,500 to 7,000 feet and from 7,000 to 10,000 feet.
In the riparian association at less than 3,500 feet, many ephemeral streams have broad alluvial floodplains and terraced bottoms that support high densities of deep rooted trees and shrubs, including: saltcedar (Tamarix pentandra), mesquite (Prosopis fuliflora), paloverde, cottonwood (Populus fremontii), sycamore (Plantanus wrightii) and other species. Riparian associations from 3,500 to 7,000 feet contain the greatest number of plant species and the greatest canopy cover: cottonwood, willow (Salix spp.), sycamore, ash (Fraxinus velutina) and walnut (Juglans major) are typically found here, with three or four of these species often occurring together. Above 7,000 feet, willow, chokecherry (Prunus virens), boxelder (Acer negundo), Rocky Mountain maple (Acer glabrum) and various coniferous tree species predomi- nate along stream channels.
Considered collectively, climatic characteristics of riparian associations exhibit a wide range of conditions, primarily as a result of large elevation differences, variations in latitude and the distribution of mountain ranges and highlands.
Arizona can be divided into three principal water producing regions: plateau uplands in northern Arizona, mountainous central highlands that extend diagonally across the State, and basin and range lowlands, or the deserts of southern Arizona.
Except for the Colorado River, almost all perennial stream - flow across the plateau uplands originates in the central highlands! Many streams become intermittent as they fan out in braided channels away from the mountains and runoff is often dissipated by evapotranspiration or it sinks into the highly porous soils. Generally, runoff from the plateau uplands is less than one -half of an inch annually, except in the headwaters near the Mogollon Rim.
In the central highlands, many streams are perennial, although runoff varies widely because of differences in precipi - tation, temperature and topography. For example, runoff is about four inches annually in the Mount Baldy area of the White Mountains. Runoff in the Salt River system above Roosevelt Lake is approximately 2.5 inches annually. The Verde River averages 1.5 inches of runoff annually above its confluence with the Salt River. In the southern central highlands, San Francisco and San Carlos Rivers and Eagle Creek jointly contribute 0.5 inch of runoff annually to San Carlos Lake above Coolidge Dam.
Average runoff from the driest portions of the basin and range lowlands, or deserts, is less than 0.1 inch annually. Headwaters of the San Pedro, Santa Cruz and other large tributaries annually yield about 0.5 inch of water. Flowing surface water is uncommon in this region except during periods of irrigation runoff or when infrequent flows occur as a result of precipitation events.
Soils of riparian associations at the higher elevations generally consist of consolidated or unconsolidated alluvial sediments derived from the parent materials of surrounding mountains. Soil depths vary depending upon stream gradients, topographic setting, parent material and other factors. Soils on flood plains at lower elevations are of recent deposition, tend to be unifor,u within horizontal strata and exhibit little development. In all of the major river channels in Arizona, the alluvial soils are subject to frequent flooding and, conse-
21

quently, are characterized by a range of textures. Riparian sites may vary from narrow, deep, steep -walled canyon bottoms, to intermediately exposed sites with at least one terrace or bench, to exposed, wide valleys with meandering streams.
Riparian association zones frequently provide "prime" habitat for many game and nongame species of wildlife and fish. Higher elevation associations are particularly attractive for camping, picnicking, hiking and fishing. Lower elevation river bottom and flood plain associations provide oùtlets for numerous recreation activities, including hunting, hiking, bird watching and photography.
Acreages of riparian lands in Arizona are poorly docu- mented, as are ownership patterns. Most of the land is under federal ownership or trusteeship.
Water Yield Improvement Opportunities
Opportunities for water yield improvement through vegeta- tion manipulations in the riparian zone are relatively difficult to assess. Incomplete inventories of the extent and character of many riparian communities, a limited basis for estimating water yield change following specific treatments and complex ownership patterns, are some of the reasons for this problem.
It is estimated from current knowledge that about two acre -feet per acre of water may be annually salvaged by removing riparian vegetation, and assuming that Arizona has approximately 300,000 acres of riparian vegetation based on existing inventories, then an annual water yield increase of 600,000 acre -feet may be realized if all the land underwent conversion treatments. However, due to considerations for land uses other than water (wildlife, recreation, aesthetics, etc.), in addition to physical factors affecting water yield, land ownership patterns and related management policies, a down- ward adjustment in this estimated annual increase will be required.
22

Potential for Water Yield Improvement
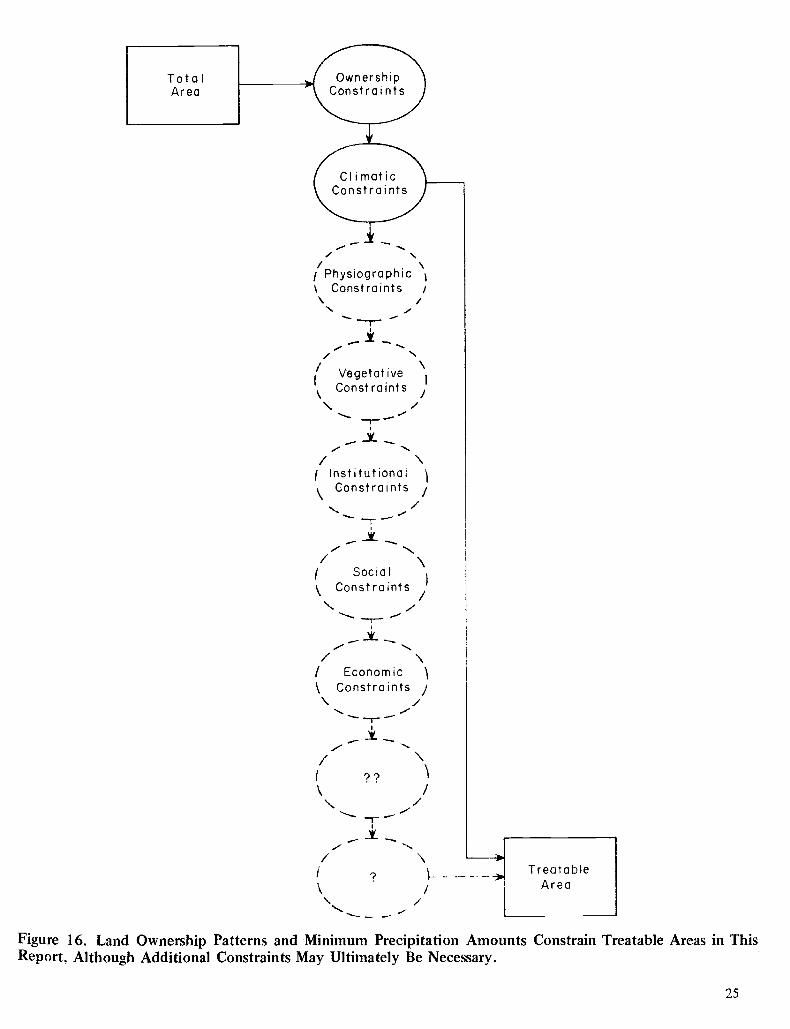
Attempts to estimate potentials for increasing water yield by vegetation management in operational programs require two general levels of evaluation. First, research information must be extrapolated from experimental watershed studies to predict water yield increases from vegetation management practices. Second, land areas appearing to have increased water yield potential, as constrained when possible, and if appropri- ate, by vegetation, physiography, climate, social, institutional and economic factors, must be identified and evaluated.
Once these evaluations are completed, potential water yield increases expected as a result of implementing water yield improvement practices can be made for the areas of interest. For this purpose, Arizona was arbitrarily divided into 15
drainages (Figure 15). A first approximation of potential increased water yield obtainable by vegetation management within each of these drainages was then developed. Unfortu- nately, from a watershed management point of view, detailed analyses of the status- of vegetation zones within the drainages are incomplete. Therefore, any estimates of potential water yield increases that are identified must be considered tentative and possibly subject to unknown errors. Recognizing these deficiencies, such estimates of water yield improvement should be considered only as tentative index values.
Methodology for Estimating Water Increase
A general methodology designed to provide estimates of potential water yield increases was devised for this report. Briefly, the vegetation zones, and their extent, were mapped on each of the 15 drainages into which Arizona was divided. Then, precipitation isohyets and land ownership patterns were superimposed on each vegetation zone and the total acreage within precipitation strata was determined by land ownership category for each drainage. Following downward adjustments necessitated by considering, when possible, constraints to the implementation of vegetation management practices, the identified treatable areas were combined with estimates of water yield gains that might be expected as a result of implementing a particular water yield improvement program.
It is emphasized that treatable areas, as identified in this report, have not necessarily been reduced to account for all constraints that ultimately must be recognized in the imple- mentation of a water yield improvement practice on a partic- ular watershed. Instead, only two constraints which could be identified in common, across all of the 15 drainages into which Arizona was divided, have been considered: specifically land ownership patterns and minimum precipitation amounts (Figure 16). Additional reductions in treatable areas due to physiographic, vegetative, institutional, social, economic and perhaps other constraints will undoubtedly be prerequisite prior to operational implementation in a multiple -use frame- work.
Estimates of potential water yield increases in this report refer to an on -site response at the outlet of the treated watershed. No allowance was made for transmission depletions that may occur between the outlet of the treated areas and any downstream points of use. Furthermore, estimates of water yield increases assume that all treatment areas are completely treated. Even if this full potential could be achieved, it would take time since large acreages are often involved. Thus, between the time that operational projects are initiated and the time when all identified areas have been treated, any annual water yield increase would be expected to be less than the estimated potentials.
Estimates of Vegetation Zone Acreages on Individual Drainages
The procedure used to obtain estimates of vegetation zone acreages in each of the 15 drainages involved the classification of land within the individual drainages by vegetation zones, annual precipitation amounts and ownership status. The neces- sary source data included: (1) maps of the individual drainages identified and prepared by the Department of Watershed Management, University of Arizona; (2) USDI Geological Survey maps outlining annual precipitation patterns for Arizona; (3) analyses by the Water Supply Forecast Unit, U.S. Weather Bureau, Salt Lake City, Utah, with adjusted climato- logical data and correction values derived by correlations with physiographic factors; and (4) relevant ownership maps.
Once the source data were collected and the appropriate categories depicted on base maps, acreages within each cate- gory were measured with a planimeter. Possible, but unknown, procedural errors include errors in translating source data to the base maps and errors in measuring acreages with the planimeter.
The estimates of acreages by vegetation zone, annual precipitation class and ownership category within each of the 15 drainages are not necessarily consistent with previous summaries of similar information, either in this report or elsewhere since basic sources of information vary depending on particular needs.
Redefinitions and corresponding adjustments of vegetation zones were sometimes required due to a lack of complete source data necessary for delineating vegetation zones in a
manner consistent with definitions used in this report. Also, the acreages assigned to the respective vegetation zones may be different from the acreages given elsewhere and may involve unknown errors. These errors could include discrepancies in the delineations of vegetation types on different maps, various definitions of the vegetation types, and problems associated with small map scales and varying mapping units.
The acreages assigned to the annual precipitation classes within a vegetation zone are based, in part, upon relatively
23

UTAH , COLO.
2
KINGMAN..
BAGDAD
..'WHITERIVER:` 9
iYUMA
t.
0 IO 20 30 40 It i l l MILES
.:14
r. : BENSON
' RIVERS LAKES (WETORDRY) ® URBAN AREAS
I. LITTLE COLORADO RIVER BASIN
2. COLORADO RIVER ABOVE THE LITTLE COLORADO
3. COLORADO RIVER BASIN ABOVE PARKER DAM
4. BILL WILLIAMS RIVER BASIN
5. VERDE RIVER BASIN
6. SALT RIVER BASIN
T. AGUA FRIA RIVER BASIN
8. HASSAYAMPA RIVER BASIN
Figure 15. Major Drainages in Arizona.
24
MEXICO
9. COLORADO RIVER BASIN BELOW PARKER DAM
10. LOWER GILA RIVER BASIN
II. MEXICAN DRAINAGE AREA
12. SANTA CRUZ RIVER BASIN
13. UPPER GILA RIVER BASIN
14. SAN PEDRO RIVER BASIN
15. SULPHUR SPRING VALLEY BASIN
Climatic Constraints
-- j Physiographic \ 1 Constraints i
T .Y!
Vegetative Constraints
\ /
/ \
/ Institutional Constraints
\
/ Social \ Constraints
` T i I \
/ Economic \
\ Constraints / \ / T ̀
\ ??
\ /
/
i
Treatable Area
Figure 16. Land Ownership Patterns and Minimum Precipitation Amounts Constrain Treatable Areas in This Report, Although Additional Constraints May Ultimately Be Necessary.
25
small scale maps outlining the precipitation patterns in Arizona. Consequently, possible errors of unknown magni- tudes may be associated with these assignments.
Redefinitions of the ownership categories were sometimes required due to a lack of complete source data necessary to identify ownerships in a consistent manner within all of the drainages. Also, errors of unknown magnitudes may have occurred in the assignments of acreages to the various owner- ships that were recognized.
Estimates of Water Yield Increase by Vegetation Zone
To assess potentials for increasing water yield by vegetation management within the 15 drainages, opportunities for, and estimates of, average increase must be identified by vegetation zone. Such identifications, as used in this report, were derived from current evaluations of experimental watershed studies. It is assumed that, although average conditions may not neces- sarily occur with a high frequency, such an estimate may be representative of water yield increase that may be realized over long periods of time and accounted for on an annual basis. In addition to developing these estimates of average water yield improvement potential, management constraints must also be recognized, when possible and if appropriate.
At this time, opportunities for water yield improvement through vegetation management are presented for the mixed conifer and ponderosa pine forests, and the chaparral vegeta- tion zone. Additional investigation will be necessary to identify and verify estimates of water yield increase attributed to vegetation management in other vegetation zones suggesting promise, specifically the riparian associations and perhaps, to some extent, the pinyon - juniper woodlands.
Mixed Conifer Forests Results from the Workman Creek Watershed experiments
suggest a general trend between average annual water yield increase following treatment and the extent of conversion of mixed conifer forest overstories (Figure 17). This trend must be interpreted as tentative since specific areas and juxtaposi- tions of conversion treatments have been intermixed and magnitudes of forest overstories initially removed have been ignored. Furthermore, this trend cannot necessarily be verified through statistical analyses.
The trend mentioned above implies that a range of manage- ment options can be considered for extrapolating and evalu- ating opportunities for water yield improvement in mixed conifer forests. In this analysis, two options were considered. First, considering a "low" option in terms of treatment severity, it was assumed that a water yield increase of 0.10 of an acre -foot per acre may be realized annually by converting one -third of the area located immediately adjacent to stream channels. Second, considering a "high" option in terms of treatment severity, it was assumed that a water yield increase of approximately 0.50 of an acre -foot per acre may be obtained annually by converting two- thirds of the area located immediately adjacent to stream channels.
Specific knowledge of possible constraints to the imple-
25
mentation of these two options is currently incomplete. For initial planning purposes, it was assumed that they can be implemented without regard to influences on other natural resource products and uses. Obviously, such an assumption is subject to doubt, and the imposition of constraints may be necessary to insure the desired flow of all natural resource uses that are based on mixed conifer forests.
Minimum forest densities below which a conversion treat- ment should not be implemented to achieve an increase in water yield have not been defined for mixed conifer forests. Physiographic constraints involving aspect, slope, soil features and other factors are also unknown. The only climatic con- straints to the management options that may be approximated at this time is a requirement for a minimum precipitation amount of at least 25 inches annually.
The clear- cutting controversy, perhaps one of the more important social and institutional constraints, may limit the extent to which large acreages of mixed conifer forests can be considered for a conversion treatment. However, as a point of departure, it was assumed that such treatments can be imple- mented without serious objections.
All of the mixed conifer forest lands delineated for consid- eration in this report are found either within national forest or Indian tribal lands. Therefore, at a first level of interest, it will be assumed that most of the acreages within these forests may initially be considered for treatment.
Incomplete knowledge exists to evaluate the economic, social, recreational and aesthetic feasibility of implementing conversion programs in mixed conifer forests for water yield improvement alone on an individual drainage basis. At this time, it will be assumed that economic constraints may not necessarily be limiting. However, economic evaluations will be required prior to the implementation of operation programs on individual drainages.
In this report, treatable areas in the mixed conifer forests, by definition, were all national forest or Indian tribal lands receiving at least 25 inches of precipitation annually.
Ponderosa Pine Forests
As 'with mixed conifer forests, a general trend between average annual water yield increase following treatment and the extent of clearing of ponderosa pine forest overstories can be obtained from the results of experimental watershed studies, in this case from the West Fork of Castle Creek and the Beaver Creek Watershed (Figure 18). Such a trend must be interpreted as tentative.
Considering all experiments designed to increase water yield through vegetation management in ponderosa pine forests, three management options were developed here as examples for extrapolating the opportunities for, and estimates of, water yield improvement in ponderosa pine forests. A low and a high option in terms of treatment severity were specified, using Figure 18 as a basis, for options based on clearing treatments. First, considering a low option, it was assumed that a water yield increase of 0.10 of an acre -foot per acre may be annually obtained by clearing one -third of the acreage on ponderosa pine forest watersheds. This one -third will be located in either uniform or irregular stripcuts. Second, considering a high option, a water yield increase of approximately 0.20 of an
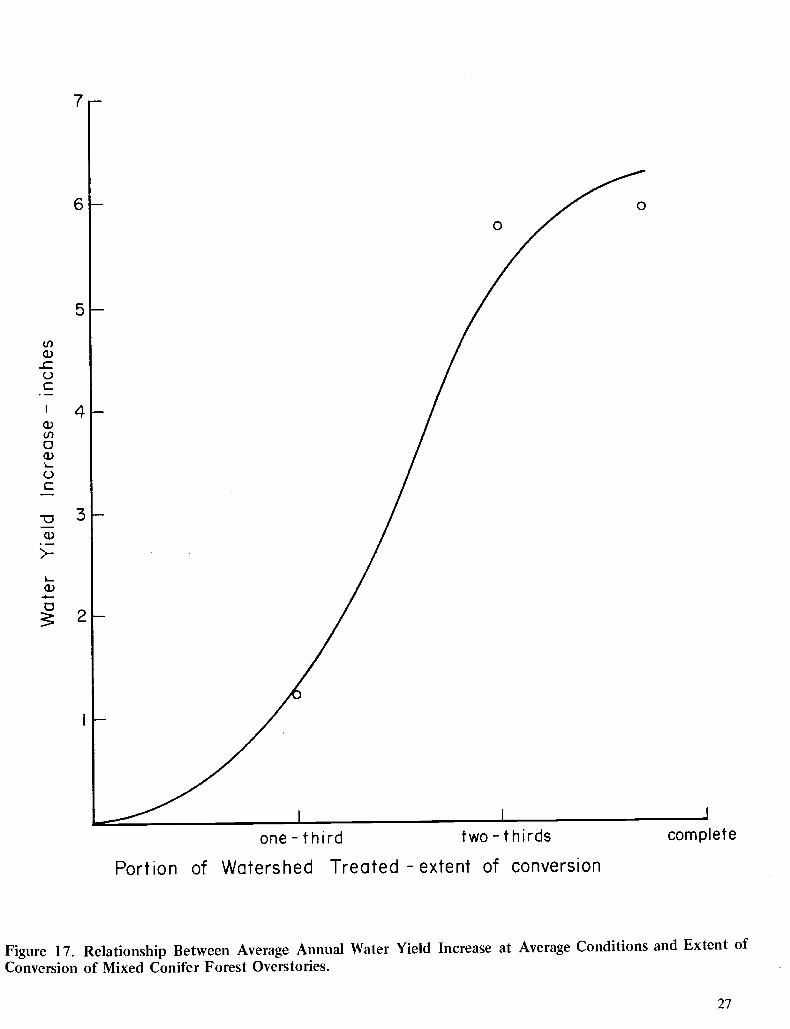
7
6
5
4
I
o o
I I I
one -third two - thirds
Portion of Watershed Treated - extent of conversion
complete
Figure 17. Relationship Between Average Annual Water Yield Increase at Average Conditions and Extent of
Conversion of Mixed Conifer Forest Overstories.
27
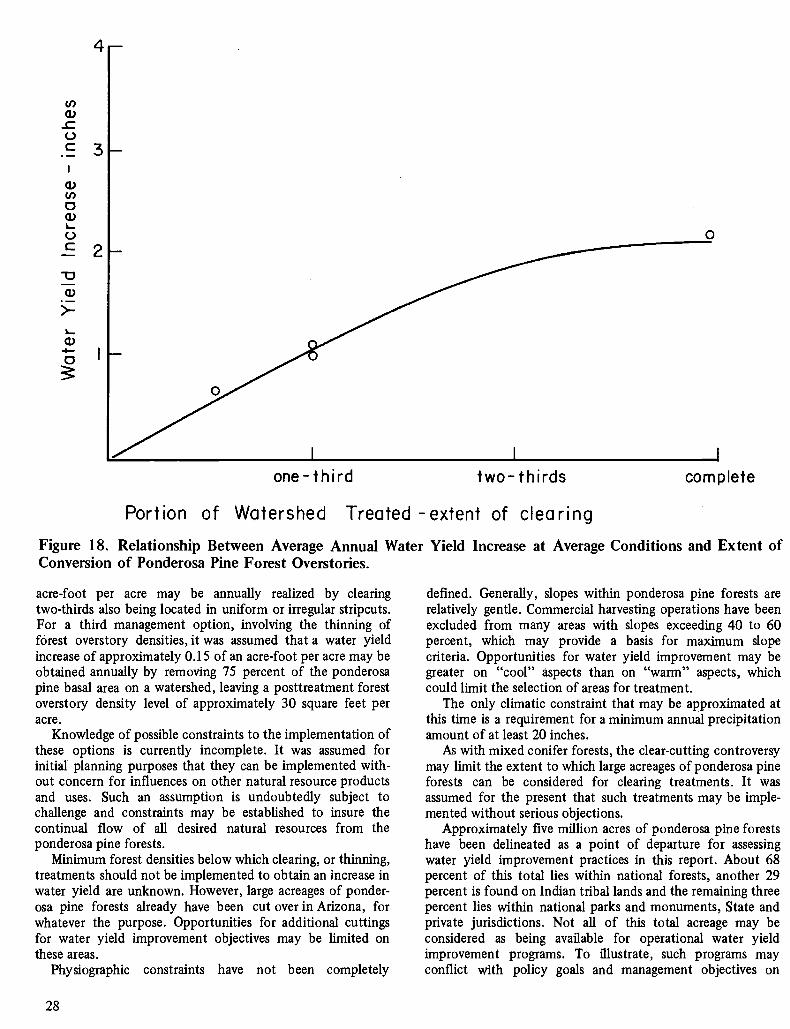
4
3
2
Portion of Watershed Treated - extent of clearing
Figure 18. Relationship Between Average Annual Water Yield Increase at Average Conditions and Extent of Conversion of Ponderosa Pine Forest Overstories.
acre -foot per acre may be annually realized by clearing two -thirds also being located in uniform or irregular stripcuts. For a third management option, involving the thinning of forest overstory densities, it was assumed that a water yield increase of approximately 0.15 of an acre -foot per acre may be obtained annually by removing 75 percent of the ponderosa pine basal area on a watershed, leaving a posttreatment forest overstory density level of approximately 30 square feet per acre.
Knowledge of possible constraints to the implementation of these options is currently incomplete. It was assumed for initial planning purposes that they can be implemented with- out concern for influences on other natural resource products and uses. Such an assumption is undoubtedly subject to challenge and constraints may be established to insure the continual flow of all desired natural resources from the ponderosa pine forests.
Minimum forest densities below which clearing, or thinning, treatments should not be implemented to obtain an increase in water yield are unknown. However, large acreages of ponder- osa pine forests already have been cut over in Arizona, for whatever the purpose. Opportunities for additional cuttings for water yield improvement objectives may be limited on these areas.
Physiographic constraints have not been completely
28
defined. Generally, slopes within ponderosa pine forests are relatively gentle. Commercial harvesting operations have been excluded from many areas with slopes exceeding 40 to 60 percent, which may provide a basis for maximum slope criteria. Opportunities for water yield improvement may be greater on "cool" aspects than on "warm" aspects, which could limit the selection of areas for treatment.
The only climatic constraint that may be approximated at this time is a requirement for a minimum annual precipitation amount of at least 20 inches.
As with mixed conifer forests, the clear -cutting controversy may limit the extent to which large acreages of ponderosa pine forests can be considered for clearing treatments. It was assumed for the present that such treatments may be imple- mented without serious objections.
Approximately five million acres of ponderosa pine forests have been delineated as a point of departure for assessing water yield improvement practices in this report. About 68 percent of this total lies within national forests, another 29 percent is found on Indian tribal lands and the remaining three percent lies within national parks and monuments, State and private jurisdictions. Not all of this total acreage may be considered as being available for operational water yield improvement programs. To illustrate, such programs may conflict with policy goals and management objectives on
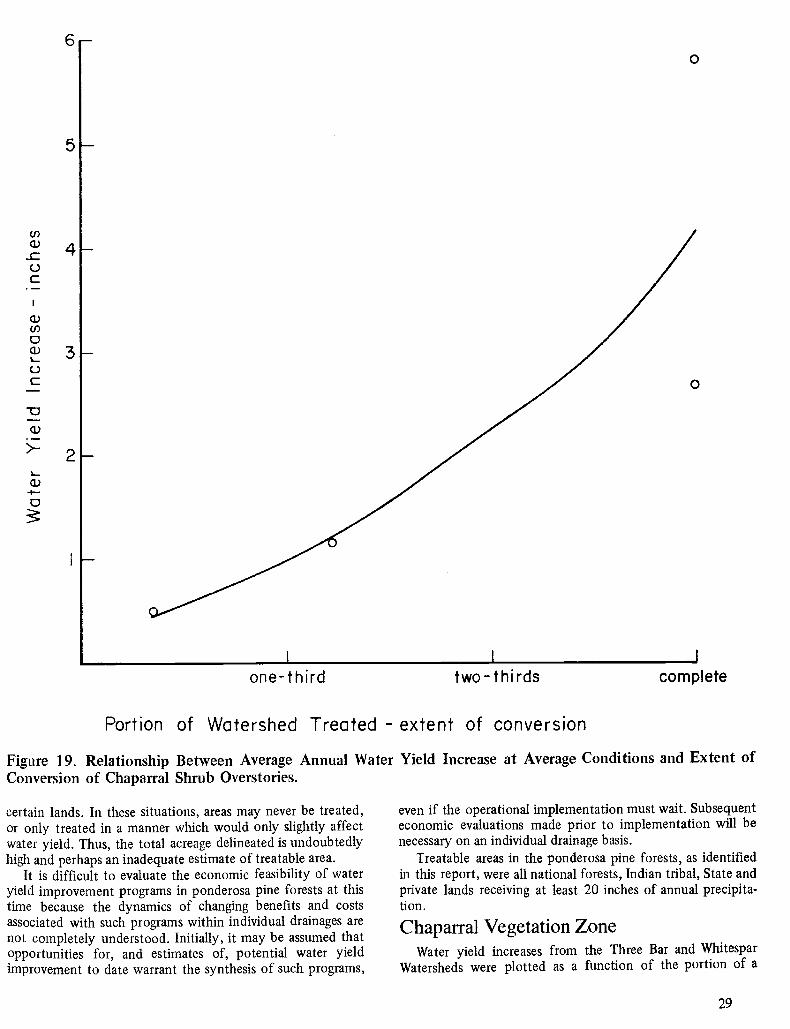
6
5
4
3
2
i
0
one -third two-thirds
Portion of Watershed Treated - extent of conversion
complete
Figure 19. Relationship Between Average Annual Water Yield Increase at Average Conditions and Extent of Conversion of Chaparral Shrub Overstories.
certain lands. In these situations, areas may never be treated, or only treated in a manner which would only slightly affect water yield. Thus, the total acreage delineated is undoubtedly high and perhaps an inadequate estimate of treatable area.
It is difficult to evaluate the economic feasibility of water yield improvement programs in ponderosa pine forests at this time because the dynamics of changing benefits and costs associated with such programs within individual drainages are not completely understood. Initially, it may be assumed that opportunities for, and estimates of, potential water yield improvement to date warrant the synthesis of such programs,
even if the operational implementation must wait. Subsequent economic evaluations made prior to implementation will be necessary on an individual drainage basis.
Treatable areas in the ponderosa pine forests, as identified in this report, were all national forests, Indian tribal, State and private lands receiving at least 20 inches of annual precipita- tion.
Chaparral Vegetation Zone Water yield increases from the Three Bar and Whitespar
Watersheds were plotted as a function of the portion of a
29

watershed that is treated (Figure 19). This was done to provide a basis for estimating potential water yield increases that may be realized following conversion of chaparral shrub overstories to a replacement cover of grasses and forbs. The general trend that is illustrated must be interpreted as tentative, since experimental watershed studies are considered case histories.
Although the trend may suggest a range of management options, only two will be considered as examples for extrapolating the opportunities for, and estimates of, water yield improvement in the chaparral vegetation zone. First, considering a low option in terms of treatment severity, it was assumed that a water yield increase of 0.10 of an acre -foot per acre may be annually realized by converting 40 percent of the acreage on chaparral watersheds, with this 40 percent being located on the moist, relatively cool north -facing slopes. Second, considering a high option, it was assumed that a water yield increase of approximately 0.20 of an acre -foot per acre may be annually obtained by converting 60 percent of the acreage on chaparral watersheds, with no particular restrictions on where this 60 percent is located.
Knowledge of possible constraints to implementation of the management options exemplified above is incomplete. For initial planning purposes, it was assumed that they can be imposed without regard to influences on other natural re- source products and uses. Such an assumption is subject to doubt, and constraints may be identified to insure the desired flows of all natural resources that are derived from the chaparral vegetation zone.
Minimum shrub densities below which a conversion treat- ment should not be implemented to achieve an increase in water yield are not currently well defined.
Likewise, physiographic constraints have 'not been com- pletely defined. It is known that slope may be an important factor in prescribing a treatment and, therefore, guidelines ranging between 30 and 60 percent have been suggested as maximum allowable slopes.
With respect to climatic constraints, the only limitation that may be approximated at this time is a requirement for a minimum precipitation amount of at least 16 inches annually.
Total acreage estimates of the chaparral vegetation zone within the delineated drainages may be too high, since no allowances were made for many of the possible measurement and definition errors previously discussed. Most of the chaparral vegetation zone lies within national forest and Indian tribal lands; additional acreages are under State and private jurisdictions.
Economic evaluations of water yield improvement feasi- bility in the chaparral vegetation zone are not complete. Initially, it has been assumed that economic constraints may not necessarily be limiting. Economic assessments will be required prior to implementation on an individual drainage basis.
Treatable areas in the chaparral vegetation zone, as defined in this report, were all national forest, Indian tribal, State and private lands receiving at least 16 inches of precipitation annually.
Estimates of Water Yield by Drainages
Given knowledge of the opportunities for, and estimates of,
30
potential water yield improvement in the mixed conifer and ponderosa pine forests and the chaparral vegetation zone, and the delineation of acreages within these vegetation zones in each of the 15 drainages into which Arizona was divided, approximations of potential water yield increases to be expected as a result of implementing the specified manage- ment options may be developed.
Little Colorado River Basin The Little Colorado River Basin, one of the largest drain-
ages into which Arizona has been divided, encompasses approximately 13,400,000 acres. Alpine vegetation, mixed conifer and ponderosa pine forests, pinyon juniper woodlands, grassland, desert shrub vegetation and croplands are repre- sented in varying amounts. However, the water yield improve- ment potentials, as recognized at this time, are only found in the mixed conifer and ponderosa pine forests.
As identified within the framework of assumed constraints (i.e., all national forest, Indian tribal, State and private lands receiving minimum precipitation amounts annually), the treat- able areas in the mixed conifer and ponderosa pine forests are 31,113 (91 percent of total) and 986,731 (76 percent of total) acres, respectively. Considering the water yield improvement management options for these two vegetation zones, the following estimates of potential water yield increase after implementation in various combinations were synthesized:
Water Yield Increase acre-feet per year
3,113 98,673
101,786
3,113 197,345 200,458
3,113 148,009 151,122
15,566 98,673
114,239
15,566 197,345 212,911
15,566 148,009 163,575
It is emphasized that estimates of potential water yield increase developed above are examples of responses that may be realized by implementing specified management options on areas identified as treatable. Whether these increases can be obtained is dependent, in part, upon such factors as initial forest densities, physiographic characteristics of the site and climatic regimes associated with the site. Also, in interpreting these estimates, it must be assumed that all acreages con-
Management Option
(1) mixed conifers: ponderosa pine:
(2) mixed conifers: ponderosa pine:
convert one -third clear one -third
convert one -third clear two -thirds
(3) mixed conifers: convert one -third ponderosa pine: thin 75 percent of density
(4) mixed conifers: ponderosa pine:
(5) mixed conifers: ponderosa pine:
convert two- thirds clear one -third
convert two -thirds clear two -thirds
(6) mixed conifers: convert two -thirds ponderosa pine: thin 75 percent of density

sidered to be treatable have been completely subjected to the vegetation management practices specified by the designated options.
Colorado River Basin Above the
Little Colorado River The Colorado River Basin above the juncture of the Little
Colorado River and within Arizona is an area of nearly 5,500,000 acres. While ponderosa pine forests, pinyon juniper woodlands, grasslands and desert shrubs occur within the area, the only water yield improvement potentials, as currently assessed, are contained in the ponderosa pine forests.
Treatable area in the ponderosa pine forests is 46,703 (24 percent of total) acres. Using the management options for these forests, the following estimates of potential water yield increase were recognized:
Water Yield Increase Management Option acre-feet per year
(1) (2) (3)
ponderosa pine: clear one -third ponderosa pine: clear two -thirds ponderosa pine: thin 75 percent of density
4,670 9,339 7,004
Colorado River Basin Above Parker Dam Above Parker Dam, the Colorado River Basin, another of
the larger drainages into which Arizona has been divided, covers an area in excess of 11,100,000 acres. Within this drainage, ponderosa pine forests, pinyon - juniper woodlands, chaparral, grasslands and desert shrubs are found in varying acreages. Water yield improvement potentials are located in the ponderosa pine forests and the chaparral vegetation zone.
Treatable areas in the ponderosa pine forests and the chaparral vegetation zone are 245,353 (31 percent of total) and 18,024 (24 percent of total) acres, respectively. As developed in terms of management options for the ponderosa pine forests and management options chosen to exemplify possibilities in the chaparral vegetation zone, estimates of potential water yield increase are:
Water Yield Increase Management Option acre-feet per year
(1) ponderosa pine: clear one -third 24,535 chaparral: convert 40 percent 1,802
26,337
(2) ponderosa pine: clear one -third chaparral: convert 60 percent
(3) ponderosa pine: clear two- thirds chaparral: convert 40 percent
(4) ponderosa pine: clear two- thirds chaparral: convert 60 percent
(5) ponderosa pine: thin 75 percent of density chaparral: convert 40 percent
24,535 3,604
28,139
49,070 1,802
50,872
49,070 3,604
52,674
36,803 1,802
38,605
(6) ponderosa pine: thin 75 percent of density 36,803 chaparral: convert 60 percent 3,604
40,407
Bill Williams River Basin
The Bill Williams River Basin is an area of approximately 2,900,000 acres. Ponderosa pine forests, pinyon juniper wood- lands, chaparral, grasslands and desert shrubs are found within the Basin. At this time, the water yield improvement poten- tials are considered to be in the ponderosa pine forests and the chaparral vegetation zone.
Treatable areas in the ponderosa pine forests and the chaparral vegetation zone are 29,493 (92 percent of total) and 416,561 (60 percent of total) acres, respectively. Using the management options for these two vegetation zones, estimates of potential water yield increase were developed, as follows:
Water Yield Increase Management Option acre-feet per year
(1) ponderosa pine: clear one -third chaparral: convert 40 percent
(2) ponderosa pine: clear one -third chaparral: convert 60 percent
(3) ponderosa pine: clear two -thirds chaparral: convert 40 percent
(4) ponderosa pine: clear two -thirds chaparral: convert 60 percent
2,949 41,656 44,605
2,949 83,312 86,261
5,898 41,656 47,554
5,898 83,312 89,219
(5) ponderosa pine. thin 75 percent of density 4,424 chaparral: convert 40 percent 41,656
46,080'
(6) ponderosa pine: thin 75 percent of density 4,424 chaparral: convert 60 percent 83,312
Verde River Basin 87,736
A drainage that supplies important water resources to Phoenix and central Arizona, the Verde River Basin, is an area of nearly 4,500,000 acres. Mixed conifer and ponderosa pine forests, pinyon juniper woodlands, chaparral, grasslands, desert shrubs and croplands occur within the basin in varying acreages. The water yield improvement potentials, as evaluated at this time, are contained in the mixed conifer and ponderosa pine forests and the chaparral vegetation zone.
Treatable areas in the mixed conifer forests, the ponderosa pine forests and the chaparral vegetation zone are 15,560 (86 percent of total), 693,043 (82 percent of total) and 602,934 (91 percent of total) acres, respectively. Using the manage- ment options chosen to exemplify these three vegetation zones, the following estimates of potential water yield increase were developed:
31

Water Yield Increase Management Option acre-feet per year
( 1) mixed conifers: convert one -third ponderosa pine: clear one -third chaparral: convert 40 percent
( 2) mixed conifers: convert one -third ponderosa pine: clear one -third chaparral: convert 60 percent
( 3) mixed conifers: convert one -third ponderosa pine: clear two -thirds chaparral: convert 40 percent
( 4) mixed conifers: convert one -third ponderosa pine: clear two- thirds chaparral: convert 60 percent
( 5) mixed conifers: convert one -third ponderosa pine: thin 75 percent of density chaparral: convert 40 percent
( 6) mixed conifers: convert one -third ponderosa pine: thin 75 percent of density chaparral: convert 60 percent
( 7) mixed conifers: convert two- thirds ponderosa pine: clear one -third chaparral: convert 40 percent
( 8) mixed conifers: convert two -thirds ponderosa pine: clear one -third chaparral: convert 60 percent
( 9) mixed conifers: convert two -thirds ponderosa pine: clear two -thirds chaparral: convert 40 percent
(10) mixed conifers: convert two -thirds ponderosa pine: clear two -thirds chaparral: convert 60 percent
(11) mixed conifers: convert two -thirds ponderosa pine: thin 75 percent of density chaparral: convert 40 percent
32
1,556 69,304 60,293
131,153
1,556 69,304
120,586 191,446
1,556 138,608 60,293
200,457
1,556 138,608 120,586 260,750
1,556 103,956 60,293
165,805
1,556 103,956 120,586 226,098
7,782 69,304 60,293
137,379
7,782 69,304
120,586 197,672
7,782 138,608 60,293
206,683
7,782 138,608 120,586 266,976
7,782 103,956 60,293
172,031
(12) mixed conifers: convert two -thirds ponderosa pine: thin 75 percent of density chaparral: convert 60 percent
Salt River Basin
7,782 103,956 120,586 232,324
Another drainage that supplies important water resources to Phoenix and central Arizona is the Salt River Basin. It encompasses an area in excess of 4,400,000 acres. Within the basin, mixed conifer and ponderosa pine forests, pinyon - juniper woodlands, chaparral, grasslands, desert shrubs and croplands are represented in varying acreages. Water yield improvement potentials, as assessed at this time, are located in the mixed conifer and ponderosa pine forests and the chaparral vegetation zone.
Treatable area in the mixed conifer forests, ponderosa pine forests and chaparral vegetation zone are 36,045 (100 percent of total), 978,952 (91 percent of total) and 573,441 (99 percent of total) acres, respectively. Considering management options for these three vegetation zones, estimates of potential water yield increase were synthesized, as follows:
Water Yield Increase Management Option acre-feet per year
( 1) mixed conifers: convert one -third ponderosa pine: clear one -third chaparral: convert 40 percent
( 2) mixed conifers: convert one -third ponderosa pine: clear one -third chaparral: convert 60 percent
( 3) mixed conifers: convert one -third ponderosa pine: clear two- thirds chaparral: convert 40 percent
( 4) mixed conifers: convert one -third ponderosa pine: clear two -thirds chaparral: convert 60 percent
( 5) mixed conifers: convert one -third ponderosa pine: thin 75 percent of density chaparral: convert 40 percent
( 6) mixed conifers: convert one -third ponderosa pine: thin 75 percent of density chaparral: convert 60 percent
( 7) mixed conifers: convert two -thirds ponderosa pine: clear one -third chaparral: convert 40 percent
3,604 97,895 57,344
158,843
3,604 97,895
114,688 216,187
3,604 195,789 57,344
256,737
3,604 195,789 114,688 314,081
3,604 146,842 57,344
207,790
3,604 146,842 114,688 265,134
18,022 97,895 57,344
173,261

( 8) mixed conifers: convert two -thirds ponderosa pine: clear one -third chaparral: convert 60 percent
( 9) mixed conifers: convert two -thirds ponderosa pine: clear two -thirds chaparral: convert 40 percent
(10) mixed conifers: convert two -thirds ponderosa pine: clear two -thirds chaparral: convert 60 percent
mixed conifers: convert two -thirds ponderosa pine: thin 75 percent of density chaparral: convert 40 percent
(12) mixed conifers: convert two- thirds ponderosa pine: thin 75 percent of density chaparral: convert 60 percent
18,022 97,895
114,688 230,605
18,022 195,789 57,344
271,155
18,022 195,789 114,688 328,499
18,022 146,842 57,344
222,208
18,022 146,842 114,688 279,552
Agua Fria River Basin
The Agua Fria River Basin is a drainage area of nearly 1,700,000 acres. Ponderosa pine forests, pinyon juniper wood- lands, chaparral, grasslands, desert shrubs and croplands occur within the basin. The water yield improvement potentials are found in the ponderosa pine forests and the chaparral vegeta- tion zone.
Treatable areas in the ponderosa pine forests and the chaparral vegetation zone are 26,211 (89 percent of total) and 403,863 (85 percent of total) acres, respectively. Utilizing the management' options for these two vegetation zones as examples, estimates of potential water yield increase are:
Water Yield Increase Management Option acre-feet per year
(1) ponderosa pine: clear one -third chaparral: convert 40 percent
(2) ponderosa pine: clear one -third chaparral: convert 60 percent
(3) ponderosa pine: clear two -thirds chaparral: convert 40 percent
(4) ponderosa pine: clear two -thirds chaparral: convert 60 percent
(5) ponderosa pine: thin 75 percent of density chaparral: convert 40 percent
2,621 40,386 43,007
2,621 80,773 83,394
5,243 40,386 45,629
5,243 80,778 86,016
3,932 40,386 44,318
(6) ponderosa pine: thin 75 percent of density 3,932 chaparral: convert 60 percent 80,773
84,705
Hassayampa River Basin
The Hassayampa River Basin, one of the smaller drainages into which Arizona has been divided, is an area just in excess of 1,000,000 acres. Ponderosa pine, chaparral, desert shrubs and croplands are found within the basin. At this time, the water yield improvement potentials are assumed contained in the ponderosa pine forests and the chaparral vegetation zone.
Treatable areas in the ponderosa pine forests and the chaparral vegetation zone are 16,384 (100 percent of total) and 218,734 (100 percent of total) acres, respectively. As assessed in terms of the management options for these two vegetation zones, estimates of potential water yield increase are:
Water Yield Increase Management Option acre-feet per year
(1) ponderosa pine: clear one -third 1,638 chaparral: convert 40 percent 21,873
23,511
(2) ponderosa pine: clear one -third 1,638 chaparral: convert 60 percent 43,745
45,383
(3) ponderosa pine: clear two -thirds 3,277 chaparral: convert 40 percent 21,873
25,150
(4) ponderosa pine: clear two -thirds chaparral: convert 60 percent
3,277 43,745 47,022
(5) ponderosa pine: thin 75 percent of density 2,458 chaparral: convert 40 percent 21,873
24,331
(6) ponderosa pine: thin 75 percent of density 2,458 chaparral: convert 60 percent 43,745
46,203
Colorado River Basin Below Parker Dam
The Colorado River Basin below Parker Dam is a drainage of approximately 2,600,000 acres. Within the basin, pinyon - juniper woodlands, chaparral, desert shrubs and croplands occur in varying acreages. The only water yield improvement potentials, as currently recognized, are associated with the chaparral vegetation zone. However, all of the acreage delineated as chaparral lies in annual precipitation classes of less than 16 inches. Thus, on the average, this acreage does not receive the minimum annual precipitation considered neces- sary to achieve an increase in water yield through vegetation manipulation. Consequently, the water yield improvement opportunities appear to be 'relatively insignificant at this point in time.
33

Lower Gila River Basin
The Lower Gila River Basin encompasses an area in excess of 7,200,000 acres. Pinyon juniper woodlands, chaparral, desert shrubs and croplands are found within the basin. At this time, the only water yield improvement potentials that can be identified occur in the chaparral vegetation zone. However, all acreage delineated as chaparral is in annual precipitation classes that are less than 16 inches, the minimum considered necessary to achieve an increase in water yield. Consequently, the opportunities for water yield improvement are insignifi- cant, as assessed in terms of current knowledge. Mexican Drainage Area
The Mexican Drainage Area covers about 2,500,000 acres. Pinyon juniper woodlands, grasslands, desert shrubs and crop- lands occur within the drainage area in varying acreages. As evaluated in terms of current knowledge and considering the vegetation zones that characterize the drainage area, the water yield improvement potentials which may be realized through vegetation manipulation are insignificant.
Santa Cruz River Basin The Santa Cruz River Basin is a drainage area of over
5,100,000 acres in size. Ponderosa pine forests, pinyon juniper woodlands, chaparral, grasslands, desert shrubs and croplands occur in varying acreages within the basin. The water yield improvement potentials, as assessed at this time, are found in the ponderosa pine forests and the chaparral vegetation zone.
The treatable areas in the ponderosa pine forests and the chaparral vegetation zone are 49,561 (83 percent of total) and 35,594 (92 percent of total) acres, respectively. Using the management options for these two vegetation zones, the following estimates of potential water yield increases were developed:
Water Yield Increase Management Option acre-feet per year
(1) ponderosa chaparral:
(2) ponderosa chaparral:
(3) ponderosa chaparral:
(4) ponderosa chaparral:
(5) ponderosa chaparral:
(6) ponderosa chaparral:
34
pine: clear one -third convert 40 percent
pine: clear one -third convert 60 percent
pine: clear two- thirds convert 40 percent
pine: clear two -thirds convert 60 percent
pine: thin 75 percent of density convert 40 percent
pine: thin 75 percent of density convert 60 percent
4,956 3,359 8,315
4,956 6,717
11,673
9,912 3,359
13,271
9,912 6,717
16,629
7,434 3,359
10,793
7,434 6,717
14,151
Upper Gila River Basin
The Upper Gila River Basin, another drainage that provides important water resource to central Arizona, is an area in excess of 6,800,000 acres. Ponderosa pine forests, pinyon - juniper woodlands, chaparral, grasslands, desert shrubs and croplands are represented in the basin. Currently, the water yield improvement potentials are considered to be located in the ponderosa pine forests and the chaparral vegetation zone.
Treatable areas in the ponderosa pine forests and the chaparral vegetation zone are 270,343 (71 percent of total) and 236,345 (93 percent of total) acres, respectively. As synthesized in terms of the management options for these two vegetation zones, estimates of potential water yield increase are:
Management Option (1) ponderosa pine: clear one -third
chaparral: convert 40 percent
(2) ponderosa pine: clear one -third chaparral: convert 60 percent
Water Yield Increase acre-feet per year
27,034 23,634 50,668
(3) ponderosa pine: clear two -thirds chaparral: convert 40 percent
(4) ponderosa pine: clear two -thirds chaparral: convert 60 percent
27,034 47,268 74,302
54,067 23,634 77,701
54,067 47,268
101,335
(5) ponderosa pine: thin 75 percent of density 40,550 chaparral: convert 40 percent 23,634
64,184
(6) ponderosa pine: thin 75 percent of density 40,550 chaparral: convert 60 percent 47,268
87,818 San Pedro River Basin
The San Pedro River Basin, another of the smaller drainages into which Arizona has been divided, encompasses approxi- mately 2,500,000 acres. Within the basin, ponderosa pine forests, pinyon juniper woodlands, chaparral, grasslands and desert shrubs occur in varying acreages. The water yield improvement potentials, as currently assessed, are found in the ponderosa pine forests and the chaparral vegetation zone.
Treatable areas in the ponderosa pine forests and the chaparral vegetation zone are 30,724 (96 percent of total) and 9,424 (64 percent of total) acres, respectively. Using the management options for these two vegetation zones, the following estimates of potential water yield increases were determined:
Management Option
(1) ponderosa pine: clear one -third chaparral: convert 40 percent
Water Yield Increase acre-feet per year
3,072 942
4,014

(2) ponderosa pine: clear one -third chaparral: convert 60 percent
(3) ponderosa pine: clear two- thirds chaparral: convert 40 percent
(4) ponderosa pine: clear two- thirds chaparral: convert 60 percent
3,072 1,884 4,956
6,144 942
7,086
6,144 1,884 8,028
(5) ponderosa pine: thin 75 percent of density 4,608 chaparral: convert 40 percent 942
5,550
(6) ponderosa pine: thin 75 percent of density 4,608 chaparral: convert 60 percent 1,884
6,492
Sulphur Springs Valley River Basin
The Sulphur Spring Valley River Basin is a drainage area in excess of 4,500,000 acres. Ponderosa pine forests, pinyon - juniper woodlands, grasslands, desert shrubs and croplands are found within the basin in varying acreages. The water yield improvement potentials are located in the ponderosa pine forests.
The treatable area in the ponderosa pine forests is 56,524 (81 percent of total) acres. Considering the management options for these forests, the following estimates of potential water yield increases were identified:
Water Yield Increase Management Option acre-feet per year
(1) ponderosa pine: clear one -third 5,652 (2) ponderosa pine: clear two -thirds 11,305 (3) ponderosa pine: thin 75 percent of density 8,479
Again, estimates of potential water yield increase, as developed above, must be considered tentative for reasons previously mentioned.
35

Estimates of Water Yield for Arizona
To provide a general overview for Arizona as a whole, the estimates of potential water yield derived from the individual drainages were summarized by vegetation zone. Again, as was the case with individual drainages, the water yield improve- ment potentials in the State, as recognized at this time, are only found in the mixed conifer and ponderosa pine forests, and the chaparral vegetation zone.
The treatable areas in the mixed conifer forests, the ponderosa pine forests and chaparral vegetation zone, as identified within the framework of assumed constraints, are approximately 82,700 (94 percent of total), 3,430,000 (69 percent of total) and 2,512,900 (81 percent of total) acres, respectively. Considering the management options that have been selected to exemplify the possibilities for water yield improvement in these three vegetation zones, the following estimates of potential water yield increase were developed:
Water Yield Increase Management Option acre-feet per year
( 1) mixed conifers: convert one -third ponderosa pine: clear one -third chaparral: convert 40 percent
( 2) mixed conifers: convert one -third ponderosa pine: clear one -third chaparral: convert 60 percent
( 3) mixed conifers: convert one -third ponderosa pine: clear two -thirds chaparral: convert 40 percent
( 4) mixed conifers: convert one -third ponderosa pine: clear two -thirds chaparral: convert 60 percent
( 5) mixed conifers: convert one -third ponderosa pine: thin 75 percent of density chaparral: convert 40 percent
( 6) mixed conifers: convert one -third ponderosa pine: thin 75 percent of density chaparral: convert 60 percent
( 7) mixed conifers: convert two- thirds ponderosa pine: clear one -third chaparral: convert 40 percent
36
8,273 342,999 251,289 602,561
8,273 342,999 502,577 853,849
8,273 685,997 251,289 945,559
8,273 685,997 502,577
1,196,847
8,273 514,499 251,289 774,061
8,273 514,499 502,577
1,025,349
41,370 342,999 251,289 635,658
( 8) mixed conifers: convert two- thirds ponderosa pine: clear one -third chaparral: convert 60 percent
( 9) mixed conifers: convert two- thirds ponderosa pine: clear two -thirds chaparral: convert 60 percent
(10) mixed conifers: convert two -thirds ponderosa pine: clear two -thirds chaparral: convert 60 percent
(11) mixed conifers: convert two- thirds ponderosa pine: thin 75 percent of density chaparral: convert 40 percent
(12) mixed conifers: convert two -thirds ponderosa pine: thin 75 percent of density chaparral: convert 60 percent
41,370 342,999 502,577 886,946
41,370 685,997 251,289 978,656
41,370 685,997 502,577
1,229,944
41,370 514,499 215,289 807,289
41,370 514,499 502,577
1,058,446
As pointed out previously, estimates of potential water yield increase, as listed above, must be considered tentative. Also, not all of the indicated potential water yield increases may necessarily be available for possible use within the boundaries of Arizona, since some of the identified drainages have stream networks that allow water supplies to flow out of the State. As a first approximation, these estimates suggest opportunities for water yield improvement by means of vegetation management in Arizona.

Conclusions and Discussion
Knowledge of the potentials to increase water yield by means of vegetation management has increased greatly since the Arizona Watershed Program was initiated in 1957. How- ever, further effort is needed to help fill the gap that remains between research results and operational application phases of the program.
The results of this study suggest that the potentials for increasing water yield by vegetation management as defined herein are significant, particularly in the mixed conifer and ponderosa pine forests and in the chaparral vegetation zone. The range in potential water yield increase at average condi- tions was calculated at approximately 600,000 to 1,200,000 acre -feet per year for Arizona as a whole. These estimates are based on arbitrarily defined management options for the three vegetation zones, and excluded areas receiving insufficient annual precipitation as suggested by research results, and areas in ownerships which may preclude such management consider- ations. The estimates do not include increases in water yield that may be achieved by managing riparian vegetation, the potential of which is estimated to average two acre -feet per acre annually for treated areas. More specific estimates of the total volume potential for riparian vegetation were omitted at this time because additional inventory data are needed.
The management options used in this study were simplified practices based on research findings and experience to date, and do not exhaust all possible alternatives. The kinds of assumptions required in applying these practices as hypo- thetical water yield improvement treatments preclude recom- mendations pertaining to the implementation of specific man- agement practices on particular areas. However, the results of this study can probably be considered as approaching the upper limits of the potentials for water yield increase. Specific management plans for implementation will require more re- fined and intensive basic data on a site -by -site basis, as well as more rigorous analysis of impacts. Additional compromise with other resource management plans will no doubt be incorporated into the specific plans, and this can be expected to reduce actual water yield increases to some level less than these potentials.
The study has shown that research to date has provided sufficient knowledge to allow development of management plans which will probably result in increased water yields and allow qualitative estimates of the water yield increases to be expected as a result of treatment. The study has also shown that present research and resource inventory information are inadequate for quantitative predictions of the hydrologic effects and other impacts of proposed management plans.
Since eventual operational application is a primary objec- tive of water yield research programs, the effects of vegetation management practices intended to increase water yield must be considered in a multiple -use framework. Current experi- ence, and policy, indicate that such programs to be econom- ically feasible must benefit, and often do, other collateral natural resource uses and values, such as timber and forage
production, wildlife habitat and recreation activity, in addition to water yield. Without other benefits, such as returns from timber sales, the implementation of vegetation management practices which enhance water yield may not be practical. However, in some cases, increased water production alone may justify certain practices.
While the present study indicates that some basins and vegetation types in Arizona have little apparent potential for increasing water yield by means of vegetation management, this does not necessarily mean that all areas in these basins do not, or would not, respond favorably to management. Treat- ments may be feasible for localized developments, perhaps for domestic livestock water, recreation applications or other uses with relatively limited needs in terms of total water supply.
Natural resource planners should recognize that estimated potential water yield increases at average conditions are not likely to occur every year. This conclusion is based on the variability in annual water yield increase that has been observed on various watersheds to date. Increases are relatively large in some years, small, or perhaps nonexistent, in others, depending partly upon variations in annual precipitation.
To conclude, the analysis presented in this report is not intended as a possible panacea for solving problems of water supply in Arizona. However, it appears that a successful program would help alleviate effects of water deficits.
37

Recommendations
Increased water yield has generally not been considered a primary objective of operational vegetation management programs in Arizona. This may be due to uncertainties in terns of expected results and the lack of marketplace mechanisms relating to water. Nonetheless, the present study shows that increased water yield could be considered as a secondary objective in the management framework, until such time as more research information and the perceived needs of society justify considering it as a primary objective. This recommendation appears feasible since vegetation in many areas will be managed for other objectives that involve clearing and thinning, such as timber production in the ponderosa pine forests. If vegetation conditions are to be modified in this manner, the operations could also be designed to enhance water yield as well as other products and uses, perhaps with only minor extra efforts. Thus, even if the water yield benefits to be realized cannot be precisely predicted at present, the treatments that appear most likely to cause increased water production could be prescribed at relatively little extra cost. It is recommended that management guidelines be perfected for this purpose.
The present study was primarily concerned with increased production of streamflow at the outlet of treated watersheds. Disposition of runoff once it flows from treated areas was not evaluated, although transmission depletions between the point of production and point of ultimate use will have an important bearing on the economic feasibility of vegetation management practices designed to increase water yield. If a significant proportion of the increased yield is evaporated, transpired or disposed of by deep seepage before it can be beneficially utilized downstream, treatment benefits will be lessened accordingly. Although methods for estimating transmission depletions are available, it is recommended that additional research efforts be initiated to develop more reliable and quantitative techniques. Such information is needed for complete evaluation of treatment feasibility.
This study has further indicated the difficulties involved in extrapolating research results from relatively small experi- mental watersheds to other locations which may be dissimilar from the experimental areas and may be much larger. Well - developed analytic techniques for making this information transfer are presently lacking and relatively little knowledge as a result of practical operational experience is available as a substitute. It is recommended that future research efforts be directed towards developing regionalization techniques and validating their application.
Another difficulty in developing estimates of the potentials for increasing water yield involves the availability of pertinent inventory information on characteristics, and present management status, of Arizona's vegetation zones. This diffi- culty can partly be attributed to a lack of knowledge as to precisely what parameters should be inventoried for the purpose of predicting increases in water yield to be expected as a result of vegetation management practices. It is recom- mended that a program be initiated to develop more adequate inventory data utilizing present technology. It is further recommended that these data be combined with existing
38
research results, as a first step, to eliminate from consideration the vegetation areas that are probably not suitable for treat- ment. These areas may be excluded for various reasons, such as: initial vegetation densities too low, precipitation too low, slopes too steep, soils too shallow or erodible or scenic value too high. The resource inventory information needs will undoubtedly vary by vegetation zone. For example, in the chaparral zone, depth to bedrock is significant; while in riparian associations, depth to the water table is important.
It is also recommended that research efforts be initiated to more precisely characterize parameters that should be inven- toried to provide the most effective input for hydrologic models developed for extrapolating water yield information from experimental watersheds to locations where operational programs may be implemented. The inventory efforts should consider needs of extrapolation models and vice versa. That is, most benefits will be gained if inventory information can be easily incorporated into water yield models and if water yield models utilize inventory data that can be feasibly obtained on a practical scale.
In summary, it is recommended that future research efforts should give high priority to four general needs relating to the implementation of vegetation management practices intended to increase water yield on an operational basis:
First, management guidelines should be perfected for in- cluding water yield considerations in management plans even when other resource uses are of a higher immediate priority.
Second, means should be perfected to evaluate transmission depletions of the increased water yield between the point of production and the point of downstream use.
Third, more reliable means for extrapolating research infor- mation from experimental watersheds to other locations will be required before operational programs can be fully instituted.
Fourth, more and better inventory information is needed to evaluate the potentials for increasing water yield on a site -by- site basis.
As evaluated at this time, some vegetation zones, such as pinyon juniper woodlands, were identified as having little apparent potential for increased water yield. Consequently, there appears to be little justification for further major studies of the potential to increase water yield by vegetation manage- ment in these zones. However, this conclusion is not intended to indicate that hydrologic research should be abandoned in such zones. Many other aspects of the hydrologic cycle are important in terms of the on -site and off -site use and signifi- cance of water. For example, forage production on rangelands, provision of water supplies for domestic livestock, wildlife and downstream reservoirs, and maintenance of natural ecosystems are all closely related to the hydrologiccharacteristics of these areas. Thus, for example, studies of precipitation distribution in time, space, form and amount; infiltration and runoff processes; erosion and sedimentation phenomena; soil mois- ture characteristics and many other factors require continued support, and should not be neglected because increased water yield by means of vegetation management may not appear feasible at this time.