Ved Stranden 18 Digitalisation and automation in the...
118
Digitalisation and automation in the Nordic manufacturing sector – Status, potentials and barriers
-
Upload
dinhnguyet -
Category
Documents
-
view
224 -
download
1
Transcript of Ved Stranden 18 Digitalisation and automation in the...

Digitalisation and automation in the Nordic manufacturing sector– Status, potentials and barriers
Ved Stranden 18DK-1061 Copenhagen Kwww.norden.org
Since the beginning of the nineties, the total employment in Nordic manufacturing has fallen with app. 500.000 persons. In spite of this fall in the employment level, manufacturing still has considerable importance for the Nordic countries. This shows for example in exports, research and development, growth in productivity and the development of rural areas. The report points that manufacturing is on the brink of a new era, called “Industry 4.0.” Tomorrow’s successful manufacturing business will be characterized by the way they are able to integrate new advanced production technology, especially digitalisation and automation. The report goes through status, barriers and political initiatives taken concerning digitalisation and automation in all of the Nordic countries. The report also brings recommendations to common Nordic initiatives and opportunities for co-operation on the area.
Digitalisation and automation in the Nordic manufacturing sector
TemaN
ord 2015:578
TemaNord 2015:578ISBN 978-92-893-4406-7 (PRINT)ISBN 978-92-893-4422-7 (PDF)ISBN 978-92-893-4408-1 (EPUB)ISSN 0908-6692
TemaN
ord 2015:578


Digitalisation and automation in
the Nordic manufacturing sector
– Status, potentials and barriers
IrisGroup
TemaNord2015:578

DigitalisationandautomationintheNordicmanufacturingsector–Status,potentialsandbarriersIrisGroupISBN978‐92‐893‐4406‐7(PRINT)ISBN978‐92‐893‐4422‐7(PDF)ISBN978‐92‐893‐4408‐1(EPUB)http://dx.doi.org/10.6027/TN2015‐578TemaNord2015:578ISSN0908‐6692©NordicCouncilofMinisters2015Layout:HanneLebechCoverphoto:ImageSelectPrint:Rosendahls‐SchultzGrafiskPrintedinDenmark
ThispublicationhasbeenpublishedwithfinancialsupportbytheNordicCouncilofMinisters.However,thecontentsofthispublicationdonotnecessarilyreflecttheviews,policiesorrecom‐mendationsoftheNordicCouncilofMinisters.
www.norden.org/nordpub
Nordicco‐operationNordicco‐operationisoneoftheworld’smostextensiveformsofregionalcollaboration,involv‐ingDenmark,Finland,Iceland,Norway,Sweden,andtheFaroeIslands,Greenland,andÅland.
Nordicco‐operationhasfirmtraditionsinpolitics,theeconomy,andculture.Itplaysanim‐portantroleinEuropeanandinternationalcollaboration,andaimsatcreatingastrongNordiccommunityinastrongEurope.
Nordicco‐operationseekstosafeguardNordicandregionalinterestsandprinciplesintheglobalcommunity.CommonNordicvalueshelptheregionsolidifyitspositionasoneoftheworld’smostinnovativeandcompetitive.
NordicCouncilofMinistersVedStranden18DK‐1061CopenhagenKPhone(+45)33960200www.norden.org

Contents
Preface ................................................................................................................................................................. 7 1. Summary and perspectives ............................................................................................................... 9
1.1 The state of Nordic manufacturing .................................................................................. 9 1.2 Structure and transformation of Nordic manufacturing .................................... 10 1.3 Digitalisation and “reindustrialisation” ...................................................................... 12 1.4 Barriers to further digitalisation and automation ................................................. 14 1.5 Current Policy initiatives in the Nordic countries ................................................. 15 1.6 Future perspectives .............................................................................................................. 16
2. Background – Manufacturing and digitalisation at a glance ........................................... 19 2.1 Introduction ............................................................................................................................. 19 2.2 Deindustrialisation and why manufacturing matters ......................................... 19 2.3 Industry 4.0 – digitalisation and automation as drivers for growth
and competitiveness in Manufacturing ...................................................................... 26 2.4 The Nordic countries and industry 4.0 ....................................................................... 30
3. Structure and changes in Nordic manufacturing ................................................................. 33 3.1 Introduction ............................................................................................................................. 33 3.2 Development in employment and productivity ..................................................... 33 3.3 Sectoral specialisation ........................................................................................................ 38 3.4 Regional distribution of manufacturing activities ................................................. 39 3.5 Firm distribution ................................................................................................................... 42 3.6 Structural changes in the Nordic manufacturing sector .................................... 45 3.7 Summary.................................................................................................................................... 51
4. Digitalisation and automation in Nordic manufacturing ................................................. 53 4.1 Introduction ............................................................................................................................. 53 4.2 A general typology for digitalisation in manufacturing ...................................... 53 4.3 Level of digitalisation in Nordic industries ............................................................... 56 4.4 Perspectives and potentials ............................................................................................. 62 4.5 Summary.................................................................................................................................... 65
5. Barriers to further digitalisation and automation in the manufacturingsector ......................................................................................................................................................... 67 5.1 Introduction ............................................................................................................................. 67 5.2 Three levels of digitalisation and automation ......................................................... 67 5.3 Prevalent barriers among the target groups ............................................................ 70 5.4 Summary.................................................................................................................................... 76

6 Nordic Production
6. Policies facilitating automation and digitalisation .............................................................. 79 6.1 Introduction ............................................................................................................................. 79 6.2 Policies in Denmark.............................................................................................................. 81 6.3 Policies in Finland ................................................................................................................. 85 6.4 Policies in Iceland .................................................................................................................. 89 6.5 Policies in Norway ................................................................................................................ 90 6.6 Policies in Sweden ................................................................................................................. 92 6.7 Policies in UK ........................................................................................................................... 95 6.8 Policies in Germany .............................................................................................................. 98 6.9 Summary and discussion ................................................................................................. 102
Literature ....................................................................................................................................................... 111

Preface
Denmark holds the presidency for the Nordic Council of Ministers in 2015, in co-operation with Greenland and the Faroe Islands. Focus is on growth, welfare, values and the Arctic.
Under this presidency, Denmark has launched projects within the focus areas in order to strengthen Nordic co-operation. Digitalisation and automation in the Nordic manufacturing sector is one of these projects.
The first step of the project is this report. It gives an overview of similarities and differences in the manufacturing sectors of the Nordic countries, and it looks into the status and potentials for digitalisation and automation. Furthermore, it examines the barriers for the different types of businesses that hinder implementation or development of digitalisation and automation. Finally, it reviews the political initiatives taken by the Nordic countries, benchmarked with the initiatives taken in Germany and the United Kingdom.
The Danish Presidency project will continue in 2016 and 2017, promoting learning and inspiration across the Nordic countries, as well as developing proposals for new Nordic initiatives. This is done in order to overcome the barriers of digitalisation and automation for different types of manufacturing businesses in the Nordic countries. The aim is to unleash the potential for the Nordic manufacturing sector, to meet the challenges and opportunities of new advanced production technologies and new business models that the technologies entail.


1. Summary and perspectives
1.1 The state of Nordic manufacturing
Nordic manufacturing has undergone dramatic changes during the last two decades. The term “deindustrialisation” is often used to describe the development, as thousands of manufacturing jobs annually have been lost in the Nordic countries, as well as in other Western countries.
Figure 1.1 shows the development in manufacturing employment as a share of total employment in all Nordic countries since 1991.
Figure 1.1: Employment in manufacturing as a share of total employment In the Nordic countries, 1991–2013
Source: www.dst.dk/nordicstatistics (LABO01)
On average, the manufacturing’s share of employment has dropped by approximately 6 percentage points over the last two decades. In absolute numbers, employment in Nordic manufacturing has been reduced by approximately 500,000 people since 1991.
There are several explanations for the decrease in manufacturing employment. This include offshoring of production, loss of competitiveness vis-à-vis newly industrialised countries, outsourcing of non-core activities to service providers, as well as productivity gains that reduce the need for workers.
5%
7%
9%
11%
13%
15%
17%
19%
21%
1991
1992
1993
1994
1995
1996
1997
1998
1999
2000
2001
2002
2003
2004
2005
2006
2007
2008
2009
2010
2011
2012
2013
Denmark Finland Iceland Norway Sweden
10 Nordic Production
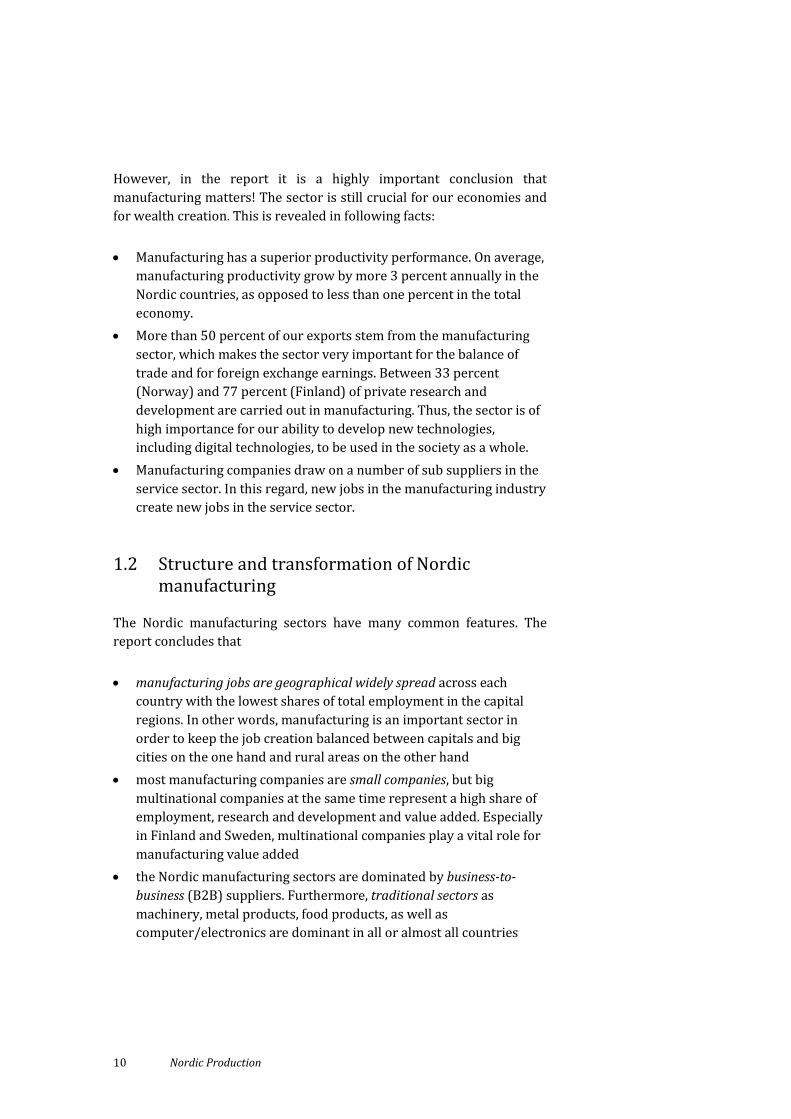
However, in the report it is a highly important conclusion that manufacturing matters! The sector is still crucial for our economies and for wealth creation. This is revealed in following facts:
• Manufacturing has a superior productivity performance. On average,manufacturing productivity grow by more 3 percent annually in theNordic countries, as opposed to less than one percent in the totaleconomy.
• More than 50 percent of our exports stem from the manufacturingsector, which makes the sector very important for the balance oftrade and for foreign exchange earnings. Between 33 percent(Norway) and 77 percent (Finland) of private research anddevelopment are carried out in manufacturing. Thus, the sector is ofhigh importance for our ability to develop new technologies,including digital technologies, to be used in the society as a whole.
• Manufacturing companies draw on a number of sub suppliers in theservice sector. In this regard, new jobs in the manufacturing industrycreate new jobs in the service sector.
1.2 Structure and transformation of Nordic manufacturing
The Nordic manufacturing sectors have many common features. The report concludes that
• manufacturing jobs are geographical widely spread across eachcountry with the lowest shares of total employment in the capitalregions. In other words, manufacturing is an important sector inorder to keep the job creation balanced between capitals and bigcities on the one hand and rural areas on the other hand
• most manufacturing companies are small companies, but bigmultinational companies at the same time represent a high share ofemployment, research and development and value added. Especiallyin Finland and Sweden, multinational companies play a vital role formanufacturing value added
• the Nordic manufacturing sectors are dominated by business-to-business (B2B) suppliers. Furthermore, traditional sectors asmachinery, metal products, food products, as well ascomputer/electronics are dominant in all or almost all countries

Nordic Production 11
• the last two decades have been characterised by a growing demandfor high-skilled labour and a decreasing demand for low-skilledlabour.
However, the report also highlights important differences. When analysed in the terms of clusters or value chains (instead of
traditional sector analyses), manufacturing specialisation between the five countries differs significantly. The aluminum cluster has a dominant position in Iceland, while oil technology (including suppliers in the machinery and metal sector) is the single most important cluster in Norway. ICT and electronics have been extremely important for industrial development in Finland, while the same is present for multinational companies within automotives, consumer electronics and steel in Sweden. Denmark has a more diverse manufacturing sector.
These cluster specialisations are also the main explanation for diverse national productivity and employment development patterns.
From an international perspective, Sweden and Finland have faced unusual development with good job performance and extremely high productivity growth rates before the crisis. This was followed by low or even negative growth rates after 2007. The “rise and fall” of Nokia as the world leader on cell phones explain a great part of the development in Finland. Sweden specialises within cyclical sectors, such as electronics and automotives. It is highly dependent on global demand, which partly explains the big differences in the performance of the country before and after the crisis.
The report also concludes that the manufacturing sector in the Nordic countries currently is undergoing some radical changes with regard to business models and composition of production:
• Offshoring of production has been particularly strong when it comesto mass production or production in large batches. Smaller,customized and more knowledge intensive production batchesdominate in a number of sectors today.
• “Servitization” represents an important development – not least inthe Nordic countries. New product related services representopportunities to create more value to customers, and to shelter fromfierce competition on production costs and product prices.Successful manufacturing companies are often characterised bysophisticated product-service business models.

12 Nordic Production
• Digitalisation and automation is transforming manufacturing in a number of ways: o Digital technologies are used to develop intelligent products that
communicate with each other (Internet-of-things) and/or report back to producers in order to optimize use, maintenance and energy consumption.
o Digital technologies link companies closer to suppliers and customers allowing for closer cooperation on innovation, flows of intermediates, inventory control, adjustment to demand patterns, etc.
o Production becomes more digitalised and automated through the use of robotics and computer aided manufacturing systems that allow for leaps forward in labour productivity performance.
o Administration tasks are being automated, as well as communication between different functions in the internal value chain.
1.3 Digitalisation and “reindustrialisation”
For Nordic manufacturing, digitalisation and automation might represent a window of opportunities for a much better manufacturing performance than seen during the past two decades. Thus, it can be claimed that the Nordic countries have several preconditions for faster and better implementation of digital technologies than other economies:
• Digital skills and readiness. The Nordic people are world leaders
when it comes to use of digital technologies, and they represent high digital competences in a number of areas.
• Research and development. The Nordic countries are among the nations that spend most on research and development (compared to GDP) – an important prerequisite for developing new digital technologies.
• Culture and work place development. Optimal use of digital technologies is closely linked to intra-organisational cooperation and customised production. The informal work place culture and low power distance in the Nordic countries represent an important competitive advantage in this regard.

Nordic Production 13
• Strong ICT-sectors. The ICT sector is an important driver, and thesector’s share of total private employment and value added are highin Nordic countries.
These strongholds and characteristics might also explain why Nordic manufacturing sectors, on average, perform better with regard to digitalisation than the rest of EU. See figure 1.2.
Figure 1.2: Level of digitalisation and automation in manufacturing companies in the Nordic countries, Germany, UK and EU
Source: Eurostat. Note: Survey data are due to the use of samples and modest reply rates connected with some uncertainties, and the results should therefore be interpreted with some caution.
The figure shows that the fraction of manufacturing companies at a low level of digitalisation is much higher in the rest of EU compared in the Nordic countries. There are, however, also differences among Nordic countries. In the Nordic region, the diffusion of digital technologies seems to be fastest in Denmark and Iceland, and slowest in Norway.
Less difference exists between the countries when it comes to the share of companies at an advanced level. In this regard, it is again important to note that the biggest multinational companies represent a large share of employment and value added in especially Sweden and Finland. These companies are also digitally very advanced. The multinational companies in Finland and Sweden might actually more than offset the slower diffusion of digital technologies in these countries, if one wishes to compare the overall digital competitiveness of each country.
This is reflected in the fact that 1) Sweden is the Nordic country with most industrial robots per employee, 2) Finland takes a lead position when it comes to use of sensors in production and products.
23% 40%
26% 53%
40% 42% 39% 56%
57% 39%
54%
30% 49% 33% 47%
27%
20% 21% 20% 17% 11% 25%
14% 17%
0%
20%
40%
60%
80%
100%
Denmark Finland Iceland Norway Sweden Germany UK EU28
Low Basic-Moderate Advanced

14 Nordic Production
1.4 Barriers to further digitalisation and automation
There is a huge potential for further digitalisation and automation in Nordic manufacturing, hence transforming increased digitalisation into higher productivity and better competitiveness.
A recent study concludes that productivity of the manufacturing sectors in Denmark, Finland and Sweden can be increased by approximately 15 percent, if the degree of automation in each branch is increased to the level of most automated countries.
Moreover, increased digitalisation is important to stay competitive within new business models (servitization, data driven business models, etc.) and new types of products and production models (Internet-of-things, 3D-printing, etc.). Thus, effective diffusion of new digital technologies will also pave the way for more effective ways to meet customer demands.
It is therefore important to identify and address barriers to further digitalisation and automation.
The report concludes that several barriers to digitalisation and automation in the manufacturing industry exist, and that these barriers are common to all Nordic countries.
However, the different barriers are not common to all types of firms. When it comes to digitalisation and automation, companies can be divided into three different groups:
• Innovators – a small group of advanced companies involved indeveloping the digital technologies of tomorrow.
• Early adopters – companies that are among the first to apply newdigital technologies and who are first movers in developing new,digital business models.
• Followers – companies investing in and applying digital technologywhen the technologies become more mature.
All three groups of companies are important for the speed of digitalisation and automation. Innovators have a decisive role in developing digital technologies to be used in key sectors in each country (together with universities and other knowledge institutions). Early adopters start the diffusion process and deliver the business cases that give inspiration to other companies. Followers are crucial for the big uptake of technologies and for the overall digitalisation and automation level of each sector and country.

Nordic Production 15
The most important barriers for further digitalisation and automation in each of the three groups are briefly summarised in the table below.
Table 1.1: Selected barriers to further digitalisation and automation in the manufacturing sector
Innovators Early adopters Followers
Diverse standards hinder communication between different technologies and products (Internet-of-things).
Shortage of ICT-specialists.
Matchmaking and design of joint research and development projects.
Access to funding of applied research (in some countries).
Access to inspiration and expertise in design, which create convincing business cases that attract investments in digital technologies.
Access to test and demonstration facilities (test of new production techniques, prototyping, etc.)
Access to (external) data and data security.
Access to risk capital.
Shortage of ICT-skills (in general).
Limited management resources for developing new business models and reorganisation of production.
Difficulties in identifying the right customised solution.
Lack of risk capital.
1.5 Current Policy initiatives in the Nordic countries
The report maps national policies and initiatives furthering digitalisation and automation in manufacturing in the Nordic countries and in two benchmark countries – Germany and UK.
As indicated in the figure below, there are significant differences in both magnitude and focus among the countries.
Figure 1.3: Digitalisation and automation in manufacturing – current policy focus
Source: IRIS Group.
Focus on digitalisation and automation in national
business policies
Applied R&D –”Innovators”
Test and demonstration
”Early adoptors”
Technology diffusion –
”Followers”
Denmark
Sweden
Norway
Iceland
Finland
Germany
UK
Strong Moderate Low

16 Nordic Production
In the left part of the figure, we have evaluated the general commitment to automation and digitalisation in the seven countries. The main parameters are here the magnitude of investments (size of schemes, etc.) as well as focus on the issue in national business policy strategies.
As shown, Finland, Germany and UK have the strongest commitment, while Norway and Iceland are the countries least committed to the agenda of fostering automation and digitalisation in manufacturing.
Finland invests by far the most means in programmes and initiatives stimulating automation and digitalisation (compared to the size of the economies). The three most important initiatives in Finland (“DIGILE”, “Industrial Internet” and “5th Gear”) receive approx. EUR 200 mill. from the government. To compare, the three key initiatives in Denmark receive EUR 15 mill. in public support.
In the right part of the figure, we have highlighted how national efforts are composed in relation to the three types of companies.
All countries invest a high proportion of their means in activities that are relevant for early adopters. Thus, access to test and demonstration facilities, as well as funds for projects focusing on bringing new technologies to market, are a common feature in all countries.
Denmark and UK are the only countries that supply programmes that target digital followers (through diagnostic tools, advisory services and courses) specifically. Conversely, Finland and Germany concentrate a lot of public funding on applied research within digitalisation and automation that mainly have innovators as participants.
1.6 Future perspectives
The report indicates that considerable room to both strengthen the national efforts and for increased cooperation between the Nordic countries exist.
1.6.1 Promoting technology diffusion among followers
According to newer analyses, there is a great potential for increasing productivity and competitiveness among manufacturing SMEs through a more widespread exploitation of existing digital technologies.
Among the countries in focus, only Denmark and UK have dedicated programmes in this area.

Nordic Production 17
There seems to be a need for more programmes that combine neutral advisory services, use of diagnostic tools and support for implementation of digital technologies in manufacturing SMEs.
Furthermore, the combination of significant economic potentials in all countries and few experiences with stimulating uptake of digital technologies calls for cooperation and exchange of experiences.
Enhanced collaboration among the Nordic countries could include:
• A design of policy initiatives that motivate more young people toenrol at technical educations and enhances interaction with regionalindustries. This in order to meet the skills needed by manufacturingcompanies.
• Exchange of practices in approaching manufacturing SMEs regardingimplementation of digital technologies in production (use ofdiagnostic tools, design of services, competencies needed, etc.)
• Development of common evaluation practices and tools to measureoutcome and effects of programmes.
• Workshop and seminars for practitioners in organisations supplyingservices to SMEs.
1.6.2 Test and demonstration for early adopters
A critical mass of early adopters is very important for the ambitions of maintaining a strong position regarding digitalisation and automation in Nordic manufacturing. Thus, a key challenge is to develop optimal frameworks for developing, testing and applying new digital technologies.
All Nordic countries have developed ambitious programmes and schemes targeting early adopters. These initiatives include access to test facilities and funding of development projects where researches and companies cooperate on bringing new technologies to the market.
Most of the initiatives are new, and there is in general little evidence of how to organise effective ecosystems in this area. The review of policies also reveals quite different approaches in the policy design. Some countries focus on physical facilities (test beds, pilot factories, etc.), while other concentrate on funding cooperative projects. Moreover, countries like Norway, Sweden and Germany are, in this area, channelling most public funding to companies via regional anchored cluster organisations.

18 Nordic Production
In other words, there seems, also in this area, to be a need for exchange of practices and experiences. Nordic cooperation could cover:
• Exchange of practices on how to design efficient ecosystems for early
adopters. Joint Nordic initiatives may focus on how national and regional initiatives can support facilities for test and design in convincing business cases efficiently. Furthermore, these initiatives can engage local investors and business angels, secure ICT-expertise, prototyping facilities, etc. – both in the densely populated areas and in the rural areas.
• Analyses and exchange of results and experiences regarding organisation of schemes, funding principles, organising of test facilities, recruitment practices, development of services to companies – that include both regional and national approaches.
• Development of common evaluation designs. • A Nordic strategy for development and access to test and
demonstration facilities.
1.6.3 Applied research and development targeted innovators
Significant investments in applied research and development are key to preserve and develop future manufacturing strongholds in the Nordic countries.
Leading industrial nations, like UK and Germany, spend large amounts on applied research and development in order to develop the digital technologies of tomorrow. In most Nordic countries, research in advanced digitalisation and automation technologies is at a relatively modest level – except for Finland. The Nordic countries share a common challenge in defining the niches where they have a potential to become world leaders.
Enhanced collaborative efforts among the Nordic countries could evolve around issues like:
• Enhanced collaborative effort among Nordic manufacturers,
researchers etc. in order to attract research and development funding under EUs Horizon 2020 programme.
• Joint Nordic collaboration with international “technology-hotspots” related to Industry 4.0. Focus could be on establishing Nordic partnerships with organisations like the “Catapult Centres” in UK and “Pilot Factories” in Germany.

2. Background – Manufacturingand digitalisation at a glance
2.1 Introduction
This chapter gives an overview of the two central trends and forces behind this report – manufacturing and digitalisation.
First, section 2.2 presents key data on Nordic manufacturing. The section shows that the last two decades have been characterized by so-called “deindustrialisation”, measured in terms of development in employment. On the other hand, the section also argues that manufacturing continues to be a very important sector, and that it plays a vital role in terms of productivity growth, wealth creation and exports.
Section 2.3 discusses digitalisation and automation and how it is expected to reshape the manufacturing sector – also referred to as “Industry 4.0”.
Finally, section 2.4 shortly discusses Nordic preconditions for competing in a new era where digital technologies will transform manufacturing practices and business models. It is argued that Industry 4.0 might lead to a sort of “reindustrialisation” in the years to come.
2.2 Deindustrialisation and why manufacturing matters
2.2.1 The tendency towards deindustrialisation
Figure 2.1 shows the development in manufacturing employment in all Nordic countries since 1991.

20 Nordic Production
Figure 2.1: Employment in manufacturing as a share of total employment In the Nordic countries, 1991–2013
Note: There is a breach in the data between 2008–2009 and therefore two sources are used.
Source: OECD.STAT & www.dst.dk/nordicstatistics (LABO01) (The national bureaus of statistics).
The figure shows a significant drop in manufacturing’s share of employment in all countries. On average, the share has dropped by approximately 6 percentage points over two decades. The largest drop has taken place in Sweden, where manufacturing’s share of total employment fell from almost 20 percent in 1991 to 11 percent in 2013. In no countries has the fall been below five percent.
In absolute numbers, employment in the Nordic manufacturing industries has dropped from 1,9 mill. employed in 1991 to 1,4 mill. employed in 2013.
Figure 2.1. illustrates how the shape of the five curves differ from each other. In Finland and Sweden, the fall in manufacturing employment mostly took place after 2008, while a large part of the jobs in the other three countries were lost in the time period from 1997–2007.
Iceland’s manufacturing sector experienced a significant drop in the time period 2004–2008, but the country has been able to recapture some of the employment loss during and after the crisis.1
The Nordic drop in manufacturing employment is part of a general tendency in the Western part of the world. Most Western countries have
1 Some of the increase in manufacturing’s share of total employment in Iceland after 2008 can be explained by the collapse of the financial sector.
5%
7%
9%
11%
13%
15%
17%
19%
21%
1991
1992
1993
1994
1995
1996
1997
1998
1999
2000
2001
2002
2003
2004
2005
2006
2007
2008
2009
2010
2011
2012
2013
Denmark Finland Iceland Norway Sweden

Nordic Production 21
faced so-called “deindustrialisation”, and the drop in employment has been even more severe in other economies. Figure 2.2 illustrates the development in manufacturing employment in four different regions, measured in terms of manufacturing employment as a share of total employment. As the figure shows, the decline in manufacturing’s share of total employment has been stronger in US and Japan than in the Nordic countries, while China – as a newly industrialized country – has faced a rise in the relative importance of manufacturing.
Figure 2.2: Development in manufacturing employment, 1991=100
Source: IRIS Group based on: OECD.STAT & M.P. Timmer, G.J. de Vries, and K. de Vries (2014). “Patterns of Structural Change in Developing Countries”.
There is no single explanation behind the distinctive drop in manufacturing employment in the Western world. Usually the following factors are considered to be of most importance:2
• Labour productivity is increasing faster in manufacturing than inother parts of the economy (se next section). Hence, a sharperdecrease in the number of workers needed to produce a givennumber of outputs.
• Generally, the demand for goods grows more slowly compared to thedemand for services. This is because we use a higher share of ourincome on services, when we become wealthier.
• A significant share of production activities has been offshored tocountries with lower production and labour costs (China, India,
2 OECD (2006). The changing nature of manufacturing in OECD economies, UNIDO (2013). Industrial Development Report 2013 – Sustaining Employment Growth: The Role of Manufacturing and Structural Change.
Nordic countries
Japan
USA
China
50
60
70
80
90
100
110
120
130
1991
1992
1993
1994
1995
1996
1997
1998
1999
2000
2001
2002
2003
2004
2005
2006
2007
2008
2009
2010
2011

22 Nordic Production
Eastern Europe, etc.).3 Meanwhile, the rise of industrial competiveness in newly industrialised countries has increased the share of total manufacturing output within these nations.
• Manufacturing companies have to an increasing extent outsourcednon-core activities to suppliers, including service providers.
Thus, the explanations behind the deindustrialisation process in the Western world are a mix of reasons related to both loss of competitiveness and sound economic development principles!
2.2.2 Why manufacturing matters
In spite of the fact that employment has dropped significantly, it is often argued that manufacturing is still crucial for the economy and the business sector as a whole.
The labour productivity argument presented above is illuminated in the next figure. The figure shows – for four Nordic countries – the annual growth in productivity in manufacturing and the total private sector, respectively, over a 12-years period.
Figure 2.3: Productivity growth 2001–2013, manufacturing and the private sector as a whole
Note: Real value added per hour worked, percentage change at annual rate.
Source: OECD Productivity Database.
While manufacturing productivity on average grew by approximately three percent annually in the Nordic countries, the growth rate for the
3 A Danish survey from 2013 showed that 28% of all manufacturing companies with more than 50 employees offshored production activities in the period 2009–2011. In the period 2001–2006, the share was 25%.
3,8%
2,2% 2,5%
4,4%
0,8% 0,8% 0,1% 1,5% 0%
1%
2%
3%
4%
5%
Denmark Finland Norway Sweden
Manufacturing Total economy

Nordic Production 23
private sector as a whole was below one percent (except for Sweden). In general, productivity growth in large sectors, like service and construction, has been extremely modest in the Nordic countries.4
The figure also reveals the importance of manufacturing for wealth creation, since productivity growth is the most important factor behind long-term economic growth.
The superior productivity performance of the manufacturing sector is also revealed in the fact that manufacturing output has dropped less than manufacturing employment. Figure 2.4 shows the development in manufacturing value added as a share of GDP in the Nordic countries, UK, Germany and Europe.
Figure 2.4: Manufacturing value added as a share of GDP, 1997–2013
Source: World Development Indicators.
In general, the trend has also had negative consequences when it comes to value added. However, the drop in value added is less sharp than the drop in employment.
Furthermore, there are some distinctive differences between the countries illustrated in figure 2.4. While Germany has been able to keep manufacturing’s share of value added at 22 percent since 1996, there has been a significant drop in Finland, UK, and to a lesser extent Sweden.
The figure also indicates that the manufacturing industry has diverse importance for the economic growth of countries. In UK and Norway, less than 10 percent of value added steams from the manufacturing
4 See for instance OECD (2015). Compendium of Productivity Indicators.
DEN
FIN
ICE
NOR
SWE
GER
UK
EU
5%
10%
15%
20%
25%
30%

24 Nordic Production
sector. Manufacturing’s share of value added in these countries is less than half the share in Germany.
A second indicator of the importance of manufacturing is the composition of the exports. In general, manufacturing’s share of exports is much higher than manufacturing’s share of value added and employment. This means that manufacturing plays a decisive role in our export-import balance, and thus in our ability to import goods and services from other countries.
Figure 2.5 shows manufacturing’s share of total exports in four Nordic countries and two benchmark countries.
Figure 2.5: Manufacturing exports as a share of total exports, 2011
Source: IRIS Group based on: The World Bank.
National differences also exist in terms of exports. Within the Nordic countries, manufacturing covered more than two thirds of total exports in Sweden and Finland in 2011. On the other hand, only 25 percent of the Norwegian exports steamed from manufacturing companies. In general, the differences between the countries when it comes to value added (figure 2.5 above) are reflected in the relative importance of manufacturing exports.
Manufacturing is also very important for the renewal of the business sector in general – and for the development and exploitation of new technologies in particular.
This is demonstrated in the fact that most private research and development (R&D) are carried out in the manufacturing sector. Figure 2.6 shows the proportion of private sector research and development carried out by manufacturing companies in the Nordic countries and the two-benchmark countries.
53%
73%
25%
70% 83%
53%
0%
10%
20%
30%
40%
50%
60%
70%
80%
90%
Denmark Finland Norway Sweden Germany UK

Nordic Production 25
Figure 2.6:R&D in manufacturing industries as a share of total private sector R&D, 2011
Source: Eurostat.
Again, the highest shares are found in Finland, Sweden and Germany, while manufacturing research and development plays a less important role in Norway.
However, in general manufacturing’s expenditure on research and development per employee is approximately four times higher than in the private sector as a whole. This partly explains why productivity is growing faster in manufacturing.
To sum up, while manufacturing output and employment have dropped significantly during the last two decades, the sector is still very important for the development of the Nordic economies and for their ability to create wealth. The relative importance of manufacturing, however, differs between countries. In Scandinavia, Finland and Norway represent two outer poles in this regard.
Finally, it is important to notice that manufacturing also creates many jobs in other sectors. As mentioned in the prior section, the drop in manufacturing employment is partly explained by the fact that a number of service functions have been outsourced to service suppliers. Thus, the real drop in manufacturing activity might be significantly less than expressed in the above figures. In general, manufacturing makes use of a number of suppliers in areas like construction, financial services, consultancy, etc.
52%
77%
44% 33%
72% 86%
37%
0%10%20%30%40%50%60%70%80%90%
100%
Denmark Finland Iceland Norway Sweden Germany UK

26 Nordic Production
2.3 Industry 4.0 – digitalisation and automation as drivers for growth and competitiveness in Manufacturing
2.3.1 The smart manufacturing industry
The manufacturing sector is highly diverse, with activities ranging from pharmaceuticals, automotives and electronics to food, drink and clothing. It is characterized by firms in many different sizes, with a disproportionate share of activity accounted for by a smaller number of large multinational companies. However, most manufacturing companies have less than 50 employees.5
• In most sectors, big companies are also leaders in the developmentand exploitation of new technologies. Smaller companies are often“technology followers”, competing on flexibility and the ability tomeet customer demand on a just-in-time basis – and implementingnew technologies when the technologies reach a more mature phase.On the other hand, new and small companies play an important rolein younger high tech sectors like biotech, clean tech, and parts of theICT sector.
• In spite of these differences, the sector as a whole is undergoingprofound changes. These changes are driven by the development ofboth new business models and technologies, especially digitaltechnologies.6
5 See for instance UK Government Office (2013). The Future of Manufacturing. 6 Deloitte (2014). Industry 4.0 – Challenges and solutions for the digital transformation and use of exponential technologies.

Nordic Production 27
The business model revolution in manufacturing Manufacturing has traditionally been understood as a production process in which raw materials are transformed into physical products through involvement of people, machines, and other resources. It is now clear that physical production in tomorrow’s industries will be at the centre of a much broader value chain, in which non-production activities play a still more important role for manufacturing companies.7 These activities include:
• Development of new services (i.e. after sale services and othertechnical services to customers) in connection with the product – so-called servitization.
• Re-use, remanufacturing, recycling of products, as well as use ofgreen production technologies, in order to save cost and fulfil userrequirements regarding emissions and energy use throughout thevalue chain.
• Increasing use of design, including design processes as an approachto innovation.
• Closer links to customers and suppliers regarding innovation – i.e.early participation in innovation processes among customers to makeuse of knowledge and experiences throughout the value chain.8
A Danish analysis from 2012 focused on manufacturing growth companies that were characterized by an increase in both employment and turnover during the financial crisis, thus creating growth in a period of recession. The analysis revealed that the growth companies, in general, had undergone substantial changes in their business models, and that these changes play a crucial role in their success.9 Especially increased supply of services and innovation partnerships with customers were important common features in the business models of the successful companies.
7 IRIS Group (2012). Fremtidens Industri and MC Kinsey Global Institute (2012). Manufacturing the Future: The next era of global growth and innovation. 8 Morten T. Hansen and Julian Birkinshaw (2011). The Innovation Value Chain. In: Harward Business Review. 9 IRIS Group (2012). Fremtidens Industri. Udarbejdet for REG LAB.

28 Nordic Production
Industry 4.0 and the digital revolution Digitalisation and automation play important roles in the current transformation of the manufacturing sector.
Firstly, digitalisation and automation enable enterprises to create new and profitable business models. The use of digital technologies is often a prerequisite for the development of new business models. Thus digital technologies
• make it possible to link customers closer to the company and engagethem in the development and test of new products
• ease the transformation to product-service business models forinstance by making automatic surveillance and maintenance ofproducts possible
• enables green business models by producing better data to be usedfor documentation and by allowing surveillance of product lifecycles, production, input flows, energy use, etc.
Secondly, these technologies contribute to the improvement of competitiveness of manufacturing companies – by increasing productivity and reducing unit costs.
Especially in high labour cost countries like the Nordic countries, the latter (potential) effect of digital technologies can play an important role in keeping up with competitors in low cost countries.
For instance, digital technologies and automation can contribute to improvement of competitiveness by reducing labour cost’s share of total cost – thus reducing the disadvantage of high labour cost compared to foreign competitors. Moreover, reduced labour costs can play an important role when it comes to decisions regarding offshoring (or maybe reshoring) of production.
It is now argued that new digital technologies will reshape most industries – both with regard to products, concepts, production processes, organization of firms and business models.10 Many observers and industrial analytics use the term “Industry 4.0” to describe the on-going transformation of manufacturing. While steam power, electricity, mass production, and stand alone computers and electronics transformed manufacturing in earlier times, digitalisation and automation transforms manufacturing in the so-called “Industry 4.0 era”.
10 Se for instance Germany Trade and Invest (2014). Industrie 4.0 – Smart manufacturing for the future or UK Government Office (2013). The future of manufacturing.

Nordic Production 29
The figure below summarizes some of the current and future changes in manufacturing that are linked to increased digitalisation and automation.
Figure 2.7: Digitalisation reshaping industries
Source: Boston Consulting.
The concepts in the figure are just examples of “Industry 4.0”. They highlight a number of ways in which digital technologies can be used to improve competitiveness and to make more value for customers. For instance digital technologies
• enables more intelligent products like washing machinesprogrammed to start when the use of the energy nets and prices arelow (internet of things)
• are embedded in robots and make fully automated product linesbased on integrated systems and machines (advanced robotics andComputer Integrated Manufacturing)
• is driving the development of new manufacturing technologies,where each product can be altered and customized withoutreorganization of product lines (additive manufacturing)
• produce a lot of data that can be used for improvements inproduction, personalized marketing and new services connected toproducts (big data).

30 Nordic Production
It is the wide range of new opportunities opened by digital technologies that sum up to what can become the fourth industrial revolution – reshaping industries and creating many opportunities for countries, regions and companies taking advantage of those technologies. Also, digital technologies will also create dire straits for those that are not adaptable.11
2.4 The Nordic countries and industry 4.0
To sum up the analysis and discussions in this chapter, we have faced a long period of deindustrialisation with many jobs lost in most Western countries, including the Nordic countries. This negative trend might continue due to underlying economic factors like increasing demand for services, increasing industrial competence in newly industrialized countries, outsourcing, etc.
On the other hand, the industries of tomorrow are not developing and producing products like in the past, which make it extremely difficult to make sober forecast based on historic data. The future development in the manufacturing sector might be a lot different from the development in the last couple of decades – due to new, digital technologies.
Moreover, digitalisation and automation can be used to offset some of the disadvantages connected with locating production in high (labour) cost countries.
For the manufacturing sectors in the Nordic countries, Industry 4.0 and digitalisation might re-present a window of opportunities to what can be labelled “reindustrialisation”. Or at a bare minimum as means to regain some of the lost manufacturing ground vis-à-vis other economies.
It might be claimed that the Nordic countries have several positive preconditions for faster and better implementation of digital technologies:
• Digital skills. The Nordic people are world leading when it comes touse of digital technologies. A higher fraction of people in the Nordiccountries (comparing to the rest of the EU) have “above basic” digitalcompetence when it comes to digital information, digital
11 A Swedish survey reveals that digital advanced companies on average are growing 1.8 percentage points faster than less digital peers. See Boston Consulting Group (2013). Digital Sweden.

Nordic Production 31
communication, digital content-creation and digital problem solving.12
• Digital readiness. INSEAD and World Economic Forum havedeveloped an index that measures the ability of individual countriesto take advantage of ICT and digital technologies. It consists of 53ICT-related indicators within areas like skills, ICT-usage,infrastructure and regulation. Among 143 countries, Sweden,Finland and Norway are ranked in top 5, while Denmark and Icelandare ranked in top 20.13
• Research and development. High investments in research anddevelopment are important in order to develop and implementdigital technologies. The Nordic countries are among the leaders inprivate research and development (compared to GDP) with Finlandand Sweden placed in top 5 in OECD.14
• Broadband coverage. The Nordic countries are among the top inOECD when it comes to number of fixed and mobile broadbandsubscription per inhabitants, 2014.15
• Culture and work place organization. Optimal use of digitaltechnologies is closely linked to intra-organizational cooperation,production in small batches, close link to customers, etc. Hence, theNordic model characterized by an informal work place culture andlow power distance might represent an important competitiveadvantage.16
• Strong ICT-sectors. The ICT sectors share of value added and totalprivate employment are high in the Nordic countries (especiallySweden and Finland) compared to the OECD-average.17
However, these advantages are not automatically transferred into faster digitalisation and automation. As we turn back to in chapter 4, successful implementation of digital technologies is also influenced by a number of obstacles and barriers. Thus, the ability of countries, regions and companies to cope with these obstacles might be of even higher importance than the preconditions listed above.
12 European Commission (2014). Digital Agenda Scoreboard. 13 INSEAD and World Economic Forum (2015); The Global Information Technology Report. 14 OECD.STAT (2013). 15 OECD, Broadband Portal. 16 Mandag Morgen (2009). Scandinavian management model makes good bottom lines. 17 European Commission (2014). The EU ICT sector and its R&D performance.


3. Structure and changes inNordic manufacturing
3.1 Introduction
This chapter goes into further details with the Nordic manufacturing sector. Section 3.2 presents more details on the development in employment and productivity and discusses country specific differences. Section 3.3 goes into details with sectorial specialisation in each country and shed light on differences in the manufacturing structure between the Nordic countries.
Thereafter, section 3.4 maps the regional distribution of manufacturing activities in each country and highlights whether some regions are more dependent on manufacturing than others.
Section 3.5 focuses on firm structure and finally section 3.6 goes into details with structural changes in the manufacturing sector regarding demand for labour and composition of activities. The overall purpose of the chapter is to provide more detailed information on the Nordic manufacturing sectors in terms of performance, structure and important trends.
3.2 Development in employment and productivity
3.2.1 Facts
Figure 3.1 provides further insight into the differences in the development of manufacturing employment in the Nordic countries in the recent years. It shows the total number of manufacturing jobs in 2013 and the changes in number of jobs since 2008.

34 Nordic Production
Figure 3.1: Total number of manufacturing jobs 2013 and change in number of jobs 2008–2013
Source: www.dst.dk/nordicstatistics (LABO01).
Not surprisingly, Sweden holds most manufacturing jobs in absolute terms. However, Sweden is also the country that lost most jobs during the financial crisis (the amount of jobs within the Swedish manufacturing industry decreased with approximately 90,000 jobs in the period 2008–2013). The largest relative drop in jobs took place in Danish manufacturing where 22 percent of the jobs disappeared in the period 2008–2013. The total decrease in jobs within Nordic manufacturing sectors during the five years period sums up to almost 300,000 workers.
Another important performance indicator is, as highlighted in previous chapter, productivity growth. The next figure divides productivity development since 2001 into two sub periods, 2001–2007 and 2007–2013. The figure includes four Nordic countries and two benchmark countries (UK and Germany).18
18 Statistical data are not available for Iceland.
-100.000
100.000
300.000
500.000
700.000
Denmark Finland Iceland Norway Sweden
Employment in manufacturing 2013
Change in total number of manufacturing jobs 2008-2013

Nordic Production 35
Figure 3.2: Annual change in labor productivity, manufacturing industries 2001–2013
Note: Productivity is measured as real value added per hour worked.
Source: OECD Productivity Database.
In all countries, labour productivity has on average increased by more than two percent annually since 2001. Looking at the period as a whole, the best performing country is Sweden with an average growth rate exceeding four percent. Also the Danish manufacturing industry has experienced high productivity growth during the period. Both countries have performed significantly better than the EU average and the two benchmark countries.
The figure furthermore illustrates significant differences in the productivity growth patterns among Nordic countries. Finland and Sweden experienced very high growth rates before 2008, and very modest rates afterwards – Finland even faced negative rates. UK and Germany also performed better in the first part of the period. In Denmark and Norway, the productivity growth pattern has been less volatile.
3.2.2 Discussion
Chapter 2 and the above figures indicate a reverse trend in structural competitiveness for Sweden and Finland compared to other EU countries and the rest of the Nordic region. Thus, for the two countries:
• The period before 2008 was characterised by both high productivitygrowth and a much better job performance than the rest of EU andthe other Nordic countries.
-4%
-2%
0%
2%
4%
6%
8%
DNK FIN NOR SWE DEU GBR EU28*
2001-2013 2001-2007 2007-2013

36 Nordic Production
• The period from 2008 and onwards was characterised by both slow productivity growth and high job loss in the two countries.
For Finland, the explanation for this pattern is closely linked to the development of one particular sector. Finland experienced an impressive industrial growth from the late nineties to 2007, which to a great extent was driven by the ICT-sector and in particular Nokia. Hence, 60 percent of the growth in manufacturing output during the period 1998–2007 came from the ICT-industry.19
Conversely, the fall in employment and productivity after 2007 can be explained by a steep fall in output of the ICT-industry, while the forest and machinery industries, which are strong Finish sectors, also experienced a significant decrease.
The fall in output and competitiveness of these three sectors are the main explanations why the Finnish GDP still remains below its pre-crisis level. Thus, Finland has not yet fully recovered from the industrial collapse, which started in 2008 and led to a significant loss of the country’s economic base
Sweden’s manufacturing sector is dominated by companies and industries, which produce intermediate and capital goods and product types that are very cyclically sensitive (steel, automotive, machinery). This fact is perceived as the main explanation why Swedish manufacturing performed impressively before 2008 and weakly after the crisis. The latter period has been characterised by overcapacity in many Swedish companies and low capital investments20 leading to sluggish productivity growth.
Using EU as a benchmark, Norway has performed averagely regarding productivity growth and the country has faced only a moderate drop in employment. Norway’s manufacturing sector is dominated by two types of companies and value chains – oil technology (and subcontractors especially within machinery) and food production. These clusters have not to the same extent as other sectors been influenced by the economic crisis. This has enabled a more smooth development in Norwegian manufacturing.
As the only Nordic country, Iceland has been able to preserve employment in manufacturing after the start of the financial crisis. This is due to Iceland’s strong aluminum sector that has faced a steep rise in
19 Bengt Holmström, Sixten Korkman and Matti Pohjola (2014). The nature of Finlands economic crisis and the prerequisites for growth. 20 IF Metall et al. (2012). Made in Sweden 2030.

Nordic Production 37
output since 2006. The access to cheap energy sources in Iceland has given the aluminum sector a huge competitive advantage compared to producers in other countries using more expensive energy. The sector is very dependent on access to cheap energy – 75 percent of all energy produced in Iceland is used in the aluminum sector.21 On the other hand, exports of fish (the second largest sector) have dropped by one third since 2000.
The big, relative drop in employment in Denmark after 2008 should be seen in the light of the fact that manufacturing employment actually rose between 2006 and 2008. Moreover, Denmark is by far the country that has faced the highest productivity growth rates after the crisis. One important explanation for the development of Danish employment and productivity, compared to other countries before and during the crisis, might be the flexible labour market of Denmark. It makes it easier for employers to adjust the labour force to demand and production.
However, the Danish drop in employment since 2008 is still severe. An increased level of offshoring combined with a large decrease in local demand and low investment rates during and after the crisis are considered the most important explanations.22
To sum up, the country specific patterns can to a large extent be explained by the development in dominant sectors. After 2008, oil technology in Norway and aluminum in Iceland have helped these countries to a better manufacturing performance than their peers. Moreover, ICT in Finland and automotive as well as steel in Sweden have contributed to both high growth rates and recession in these two countries.
A last note is that big companies play an important role when it comes to productivity growth. Historically, big multinational companies have performed better than other companies when it comes to productivity growth.23 This can be explained by the fact that multinational companies invest more in research and development, new technology and LEAN. Thus, big companies accounts for more than 80 percent of private investments in research and development in Sweden.
The development in Sweden and Finland also reflects that multinational companies have been strong growth engines from the early 90ties until 2007. Though, their relative importance dropped a little during and after the crisis. When very big companies with an
21 EU (2011). Screening report, Iceland. 22 Danmarks Statistik (2013). Industriens udvikling 2000-2012. Produktionspanelet (2015). Gode job. Anbefalinger til regeringen for at styrke Danmark som produktionsland. 23 MC Kinsey (2012). Growth and renewal in the Swedish Economy.

38 Nordic Production
extreme high productivity level become smaller, it is reflected in national productivity statistics!
3.3 Sectoral specialisation
Based on international sector statistics, figure 3.3 shows the five most important manufacturing sectors in Denmark, Norway, Sweden and Finland. It is measured in terms of numbers of employed.24
Figure 3.3: The five largest manufacturing industries – as measured by employment (2012)
Source: IRIS Group based on Eurostat.
The figure shows both similarities and differences. The sector of machinery and equipment is important in all countries. In top of this list
24 Statistical data are not available for Iceland.

Nordic Production 39
are Denmark, Sweden and Finland. Fabricated metal products are also an important sector in all countries. The computer and electronic sector is on the top 5 list in three countries – with the highest share in Finland.
Moreover, the food production industry is a leading sector in Norway and Denmark (and Iceland), while motor vehicles, not surprisingly, can be found on the list in Sweden. Moreover, other transport equipment (vessels) holds many jobs in Norway. The same is the case for pharma in Denmark and paper in Finland.
Measured by traditional statistics, no sector takes a very dominant position in any country. The figure also indicates that traditional sectors (as opposed to high tech sectors like ICT, computers, pharma, etc.) like machinery, metals and food products still play a very important role for the Nordic economies.
However, the figure does not tell the full story of Nordic specialisation.
To take an example, there is no official “oil technology industry” sector. In Norway, many companies classified under machinery, transportation equipment and metals are subcontractors to the oil industry. Likewise, many machinery companies are delivering machines and equipment to the food industry in Denmark, the automotive industry in Sweden and to ICT/electronics in Finland. Thus, in a value chain perspective there are bigger differences in structure of the Nordic manufacturing sectors than indicated in figure 3.3.
3.4 Regional distribution of manufacturing activities
Figure 3.4 shows the regional distribution of manufacturing employment in four countries.

40 Nordic Production
Figure 3.4: Regional distribution of total manufacturing employment (2012)
Source: IRIS Group based on Eurostat.
The figure indicates that manufacturing work places are widely spread in all four countries. No region holds more than one third of the manufacturing jobs in any country.
Of course, the differences in figure 3.4 reflect the density of people living in different regions. This explains the low numbers in the Northern parts of Sweden and Norway.
Figure 3.5 instead reveals manufacturing’s share of total private employment in the different regions.

Nordic Production 41
Figure 3.5: Manufacturing’s share of the regional private employment (2012)
Source: IRIS Group based on: Eurostat.
The figure indicates that manufacturing is an important sector in most regions. In only the Oslo-region, less than 10 percent of the employed in the private sector have their occupation in manufacturing.
However, the figure also reveals certain structural differences. In all countries, manufacturing’s share of total private employment is significant lower in the capital regions than in the other regions. Thus, manufacturing seems to be an important sector that fosters a balanced development in employment opportunities in Nordic countries. The highest shares are found in Jutland (Denmark) and in mid/south Sweden.

42 Nordic Production
On the other hand, many headquarters of multinational companies are located in capital regions. This is especially the case in Sweden where many multinational companies managements find it difficult to operate from regions located far from international airports, abundant supply of highly educated people, financial centres, etc.25
The numbers in the figure, of course, also reflects that the manufacturing sector is smaller in Norway than in other Nordic countries.
3.5 Firm distribution
Small companies represent the vast majority of manufacturing companies. On average, 90 percent of all manufacturing companies in the Nordic countries have less than 20 employees. This share is a little higher than in the benchmark countries. In Germany, a little more than 80 percent of the companies have less than 20 employees. See figure 3.6.
Figure 3.6: Manufacturing enterprises by size class, 2012
Source: Eurostat.
25 Palludan, Uffe (2012). Danmark & Sverige – danskere og svenskere.
0% 20% 40% 60% 80% 100%
UK
Germany
Sweden
Norway
Finland
Denmark
From 0 to 9 persons employed From 10 to 19 persons employed
From 20 to 49 persons employed From 50 to 249 persons employed
250 persons employed or more

Nordic Production 43
Figure 3.6 also illustrates that less than two percent of the companies in all Nordic countries have more than 250 employees.
The picture is quite different when it comes to the distribution of employment on different enterprise sizes. Figure 3.7 shows, for the same size classes as in figure 3.6, the share of total manufacturing employment.
Figure 3.7: Manufacturing employment by enterprise size
Source: Eurostat.
Only around 15–20 percent of the total employment has their occupation in enterprises with less than 20 employees. On the other hand, approximately half of the manufacturing labour force is employed in companies with more than 250 employees.
The differences between the two figures are especially remarkable for Sweden and Finland. In these countries, a small number of large multinational companies employ a large fraction of the manufacturing labour force.
In Sweden, the ten largest companies represent 20 percent of total value added in 2010 (a fraction that is even higher if subcontractors are taken into consideration). Moreover, these companies account for 35 percent of value added growth over the period 1997–2007.26
The dominance of multinational companies is even more profound in Finland where the turnover of the 10 largest companies corresponds to
26 MC Kinsey (2012). Growth and renewal in the Swedish Economy.
0% 20% 40% 60% 80% 100%
UK
Germany
Sweden
Norway
Finland
Denmark
From 0 to 9 persons employed From 10 to 19 persons employed
From 20 to 49 persons employed From 50 to 249 persons employed
250 persons employed or more

44 Nordic Production
52 percent of the total BNP within the manufacturing industries.27 The biggest contributor is of course Nokia. However, Finland is also hosting three companies in the top 10 over the world’s biggest paper industry companies. Moreover, some of the world’s biggest players in the machinery sector come from Finland (e.g. Sandvik and KONE).
Who are the customers? There exists no exact statistics concerning the distribution of Nordic manufacturing with regard to types of products and types of customers.
Yet, different analyses emphasise that most manufacturing companies in the Nordic countries produce parts and products to other (manufacturing) companies (traditional business to business – B2B).28 This is also highlighted in that machinery and metal companies have a dominant position (see section 3.3).
Simplified, the Nordic manufacturing consist of 1) a few very big companies producing non-food consumer goods (Nokia, Ericsson, Novo Nordisk, Volvo, Lego, etc.), 2) a big food producing sector, 3) a huge group of mostly small and medium sized subcontractors within a range of sectors.
Even a large part of the multinational companies (except for the automotive sector) and the food industry are B2B-companies selling a large fraction of their products to super market chains or other parts of the retail sector.
The Norwegian oil technology cluster is an illustrative example of the dynamic Nordic B2B-segment. It develops and sells a number of technically advanced products used in the Norwegian oil sector and within extraction of raw materials in other countries. Technologies developed in the sector are expected be used increasingly and sold to other sectors, e.g. renewable energy, space and pharma.
27 Statistics Finland. 28 See for instance IRIS Group (2012). Fremtidens industri; Norwegian Centres of Excellence et al. (2015). Oljeteknologiindutrien. Norges nye fastlandssektor. Per Christian Rålm (2014). Mat og industri – status og udvikling i norsk matindustri.

Nordic Production 45
3.6 Structural changes in the Nordic manufacturing sector
Manufacturing is a highly dynamic sector. It is the leading sector with regard to research and development, use of new technologies, redistribution of activities, offshoring, exports, etc. This also means that the sector is undergoing profound changes in a number of areas.
Structural changes in manufacturing are the theme of this final section. It focuses on demand for labour, composition of activities along the value chain and changes in the production pattern.
3.6.1 Changes in the demand for labour
Educational attainment is not measured by the same standards in the Nordic countries. Instead, we have taken the development in the composition of the Danish manufacturing employment as a point of departure. See figure 3.8.
Figure 3.8: Danish manufacturing employment by educational attainment, 1993–2013
Source: Statistics Denmark.
43% 39% 36% 32% 28% 25%
5% 5% 6% 5%
5% 5%
41% 42% 43% 44%
45% 45%
10% 11% 13% 15% 16% 17%
2% 2% 3% 4% 6% 7%
0%
10%
20%
30%
40%
50%
60%
70%
80%
90%
100%
1993 1997 2001 2005 2009 2013
Long-cycle higher education
Short & medium-cycle higher education
Vocational education
Upper secondary school
Basic school

46 Nordic Production
The figure shows how the last two decades are characterised by a significant change in the composition of labour. In 1993, almost one out of two employed in Danish manufacturing were unskilled (no vocational or higher education). In 2013, the share of unskilled employees has dropped to 30 percent. At the same time, the share of employees with a higher education has doubled. The biggest growth is seen among employees with a university degree.
The same pattern is reported in the other Nordic countries. From 1993 to 2010, the share of employees with higher education in Swedish engineering doubled, hence represent 20 percent of the work force in 2010.29 In Norway, the share of unskilled labour in manufacturing dropped by six percentage points (from 23 percent to 17 percent) in just six years (from 2008 to 2014).
The explanations for the significant shift in the composition of labour are the same in all countries and they can be summarised in the following points:30
• Many unskilled jobs have disappeared due to offshoring off simpler,
bulk production activities to low cost countries. • Automation and use of new technologies in industrial production
means that a majority of jobs requires digital competencies and other technical skills. Moreover automation result in manual job functions are replaced by machines.
• Pre-production activities like research and development, design, product development and prototyping has grown relatively to production activities (see next section).
• Also post-production activities like logistics, quality control and documentation have increased. These functions often demand highly qualified personnel.31
There is no sign of a slowdown in this tendency. Contrary, most forecasts indicate further increases in the demand for high-skilled labour, as well as decreases in the demand for low skilled.32 In fact,
29 IF Metall et al. (2015). Made in Sweden 2030. 30 See for instance Mc Kinsey (2012). Growth and renewal in the Swedish Economy, IRIS Group (2015). Fremtidens Industri or Norsk Industri (2015). Konjunkturrapporten. 31 See for instance Per Christian Rålm (2014). Mat og industri – status og udvikling i norsk matindustri 32 See for instance: IF Metall et al. (2014). Made in Sweden (2030) or UK Government Office (2013) The future of manufacturing.

Nordic Production 47
shortages of engineers and technical trained workers are in these studies emphasized as the greatest barriers to growth in manufacturing.
3.6.2 Changes in the composition of manufacturing activities
As discussed in chapter 2, the business models in manufacturing are undergoing changes. One sign of this tendency is a decrease in the relative share of production activities compared to non-production activities.
More efforts are put into research and innovation, as well as post production activities like quality control, marketing and after sale services. Meanwhile, also more production activities than non-production activities are offshored. The result is a change in the composition of manufacturing activities.
There exist no exact evidence of the magnitude of this change in the Nordic countries, but a Danish analysis from 2012 provides some information. Almost 1,000 manufacturing SMEs were in a survey asked to split their total employment into four categories – pre-production activities, production activities, post-production activities and management/administration. Furthermore, the companies were asked to make estimates of the distribution five years earlier and five years ahead. The results are shown in figure 3.9.
Figure 3.9: Distribution of employees in manufacturing SMEs, Denmark, 2007–2017
Source: IRIS Group and the Southern University of Denmark (2012); “Fremtidens Industri”.
12% 12% 12%
55% 48% 45%
15% 18% 21%
19% 21% 22%
0%10%20%30%40%50%60%70%80%90%
100%
Distribution 2007 Distribution 2013 Distribution 2017
Management Production Pre-production After production

48 Nordic Production
The figure shows that approx. 55 percent of the employees in 2007 were engaged in production activities. In 2012, this ratio had fallen to 48 percent. Moreover, the expectations about the future are a further drop to 45 percent in 2017.
Conversely, the share of employees engaged with pre-production activities is expected to increase from 15 percent in 2007 to 21 percent in 2017.
Furthermore, it is relevant to have in mind, when looking at the results of the survey, that it does not include large companies. Evidence suggests that the tendencies towards increased research and development, outsourcing of production activities and servitization are stronger in big companies than in SMEs.33
However, it is also noticeable that the decrease in the share production activities is expected to slow down.
According to the study, one explanation is that a number of companies have offshored bulk production activities (or production in large batches), while the remaining production is often production in small, customized batches. The latter kind of production is more difficult to offshore and is less exposed to competition from low cost competitors (due to high knowledge content).34
As mentioned in chapter 2, another important aspect of new manufacturing business models is the increased supply of product related services. Services (like maintenance, surveillance, advisory services, etc.) represent opportunities to create more value to customers and to shelter from fierce competition on production cost and product prices.
In almost all countries so-called servitization has increased significantly. Figure 3.10 shows estimates of the development in servitization in 21 different countries based on an international study.
33 McKinsey (2012). Growth and renewal in Swedish economy. 34 IRIS Group and the University of Southern Denmark (2012). Fremtidens Industri.

Nordic Production 49
Figure 3.10: Servitization – share of medium sized and large companies supplying services to customers, 2007 and 2011
Note: Data originates from the OSIRIS-database. The figure is based on approx. 10,000
manufacturing companies with more 100 employees. The calculations are based on text search using words like consultancy, services, etc.
Source: Neely m.fl. (2011): “The servitization of manufacturing: Further evidence”.
According to the figure, the Nordic manufacturing sectors in general perform well when it comes to supply of services. In 2011, Finland was ranked second, while Norway was ranked third among the 21 countries. Denmark, on the other hand, seems to be a latecomer when it comes to product-service business models.
Moreover, a number of analyses conclude that new, combined product-service business models will be of growing importance. In general, manufacturing companies supplying services are doing better than manufacturing companies that do not offer product related services. At the same time, the supply of services are emphasised in studies of successful companies, and thus highlighted as one of the most important factors behind manufacturing success.35
35 See IRIS Group (2015). Når produkter og service slter sammen – en analyse af servitization i dansk industri. Teknologisk Institut (2013). De skjulte helte – produktivitetssucceser i dansk industri. UK Government Office (2013). The future of manufacturing.
0102030405060
USA
Finl
and
Nor
way
Mal
aysia
Belg
ium
Sing
apor
eSw
eden
Fran
ce UK
Switz
erla
ndJa
pan
Taiw
anAu
stria
Spai
nGe
rman
yAu
stra
liaN
ethe
rland
sDe
nmar
kTh
aila
ndGr
eece
Chin
a
2007 2011

50 Nordic Production
3.6.3 Changes in the composition of production
A last point to highlight is the fact that the composition of production is undergoing changes in the Nordic countries as well. The picture of manufacturing companies producing large batches of standardized products is no longer valid.
Firstly, it is primarily mass production and production in large batches that have been offshored during the last 15–20 years.
Denmark, among other countries, has experienced how manufacturing companies increasingly have outsourced mass production processes, which have typically been performed by unskilled labour. Hence, unskilled jobs in the manufacturing industry have declined due to outsourcing of simpler manufacturing activities. 25 percent of Danish manufacturing firms (with more than 50 employees) outsourced these business activities from 2006–2009. Between the years 2009–2011 this share further grew to 28 percent.36
Secondly, new technologies have made it possible to develop specialized, small-scale productions characterized by small batches that are changeable in accordance to diverse customer needs. During the last few years, the technological development has enabled easy programming and adjustment of robots to fit specific batches. At the same time, prices of robots have decreased. Hence, these robots serve small, diversified, and niche productions well and they are increasingly perceived as essential investments in future growth of firms.37
Over the next 20 years, modelling and simulation are expected to become integrated into all production processes, as the cost of computing continues to fall. This will allow increasingly complex simulations to optimize and check the safety of new products, designs and production systems, new process concepts, factory design, andsupply chains. In addition, simulation capabilities will become embedded within processes to provide intelligent, adaptive, real time control, revolutionizing quality performance and options for product complexity.38
36 Danmarks Statistik (2013). Industriens udvikling 2000–2012. 37 Dansk Metal (2014). Stort potentiale for flere robotter i industrien. 38 Government Office for Science (2013). The future of Manufacturing: A new era of opportunity and challenge for the UK.

Nordic Production 51
3.7 Summary
This chapter has shown both similarities and differences in the five Nordic manufacturing sectors.
The similarities and common characteristics can be summarised in the following bullets:
• All countries have faced moderate to high manufacturingproductivity growth rates in a long-term perspective.
• Nordic manufacturing is dominated by business-to-business companies (B2B) within sectors like machinery metals and food products.
• Most Nordic manufacturing companies are small. However, thesectors are at the same time dominated by a minor group ofmultinational companies representing a large share of valueadded and investments in research and development.
• Manufacturing activities are widely spread over the countries.• All countries are facing a significant growth in the demand for
high skilled labour and a decrease in the use of low-skilled labourin the manufacturing sector. This is caused by the offshoring ofproduction in large batches and increased focus on pre-production activities.
• New business models, like servitization, play an increasing role in allcountries.
The most important differences, on the other hand, are the following:
• Measured in the terms of clusters or value chains, themanufacturing specialisation differs between the five countries.Aluminum dominates in Iceland, while oil technology is the singlemost important cluster in Norway. ICT and electronics have beenextremely important for industrial development in Finland, whilethe same is valid for automotives, consumer electronics and steelin Sweden. Denmark has a more diverse manufacturing sector.
• These cluster specialisations are the main explanation todifferences in productivity and employment development patterns.Sweden and Finland have faced an, from an internationalperspective, tremendous development with high productivitygrowth rates before the crisis, and low, or even negative, rates after2007. Iceland’s alu-sector has been particular successful resulting

52 Nordic Production
in employment growth in the manufacturing sector as a whole since 2008.
• Multinational companies play the most important role in Finland andSweden.

4. Digitalisation and automationin Nordic manufacturing
4.1 Introduction
This chapter gives an overview of the use of digitalisation and automation technologies in Nordic manufacturing. It also outlines perspectives and potentials for further digitalisation and automation in the Nordic manufacturing sector in the future.
In section 4.2, we introduce a general typology of the use of digital and automation technologies in manufacturing. The typology has five levels and encompasses all enterprises – from those at a low and basic level of digitalisation to the most advanced enterprises with advanced data driven business models. We use the typology to give an overview of the level of automation and digitalisation across the Nordic countries.
Section 4.3 analyses the current level of digitalisation in manufacturing in each Nordic country based on recent survey data from EUROSTAT and statistics.
In section 4.4, we focus on future perspectives for digitalisation and automation in manufacturing. Furthermore, we outline economic potentials tied to additional digitalisation – both for the individual enterprise and in a broader, societal perspective.
4.2 A general typology for digitalisation in manufacturing
As discussed in chapter 2, new digital technologies have a significant impact on the way manufacturing companies are doing business.
Ten to fifteen years ago, a large proportion of manufacturing enterprises did not even have access to the Internet and mostly used ICT in production on a stand-alone basis. Today, digitalisation and automation is the primary driver of profitability and market differentiation in a growing number of companies and industries.
There are countless numbers of ways in which manufacturing companies can benefit from digitalisation and automation.

54 Nordic Production
At the very basic level, standard software applications (i.e. software for accounting purposes, communication and costumer relation management, etc.) can save time and enhance labour productivity.
Similar, new labour saving technologies like industrial robots have in the last two decades been introduced in growing numbers. Recently an array of new, less expensive and more flexible industrial robots has been introduced, which further add to the level of automation in the manufacturing sector.
More advanced enterprises have adapted ICT-solutions that are integrated, and allow information to flow more efficiently internally and to suppliers as well as customers along the value chain.
In recent years, digitalisation has fostered new types of data driven business models in which big data analytics have become a key driver of strategy. Data analytics are used in a growing number of ways to drive business strategy – for examples for cost reduction, to improve quality and to develop new services related to products.
But diffusion of new technologies takes time, and huge differences in the level of digitalisation and automation exist – across companies, industries and countries.
In order to measure how widespread digitalisation and automation are across Nordic manufacturing, we have developed a digitalisation typology in five levels. See figure 4.1.
Figure 4.1: Level of digitalisation and automation in manufacturing companies – a typology
Source: IRIS Group.

Nordic Production 55
The typology represents different levels of digitalisation and integration:
• Low: Enterprises in this category have very limited ICT-usage.Typically, companies at the lowest level of the typology only usecomputers for administrative purposes and for e-mailcommunication internally, with suppliers, customers, etc.Technology in production is mainly mechanical.
• Basic: At this level, digital technologies are used on a stand-alonebasis, e.g. ordering from suppliers’ webpages, ICT for accounting,company webpage for marketing purposes, isolated CNC-machines39
in production.• Moderate: Companies with a moderate degree of digitalisation use
automation and digital technologies in several areas within thecompany. Typically an ERP-system is in place to support integrationand enhance the flow of information across departments andfunctions along the internal value chain (sales, production planning,production control, material planning, and service). Production linesmight be partly automated including robots and computer integratedsystems. Communication between design and production are alsooften digitalised – for instance by use of CAD-CAM systems.40
• Advanced: Use of digitalisation and automation technologies in allmajor areas of the company. The solutions are not only integratedacross departments and functions. Hence, in most cases ICT-platforms are also integrated with customers and suppliers.
• Digital business models: All key processes (sales, productionplanning, production control, material planning, and service) areautomated and linked to supplier/customer. There is a strong focuson data driven business development – often through thedevelopment of data driven services (after sale services, surveillanceof products, automated maintenance, etc.).
39 Computer Numerical Control. 40 Computer Aided Design and Computer Aided Manufacturing.

56 Nordic Production
4.3 Level of digitalisation in Nordic industries
Eurostat collects survey data on enterprises usage of ICT on a yearly basis. The data are comparable across countries, which makes it possible to compare digitalisation in different European country.
Unfortunately, the number of indicators is rather limited, and it is not possible to make a complete distribution of the surveyed companies across the levels in the typology. For example, we cannot distinguish companies with digital business models from companies on an advanced level of digitalisation.
Similar, the EUROSTAT data does not allow a clear distinction between enterprises on a basic and a moderate level of digitalisation. Despite these limitations the EUROSTAT survey, on enterprises’ ICT-usage, gives valuable insights and makes it possible to shed new light on differences in digitalisation among countries.
Figure 4.2 estimates how manufacturing companies in the Nordic countries, and Germany and UK are distributed across the three broader categories of “low”, “basic-moderate” and “advanced” levels of digitalisation.
The “advanced” category refers to manufacturing enterprises that in the 2014 survey reported that their business processes were automatically linked to those of their suppliers and/or customers (this in order to allow for efficient information exchange along the horizontal (external) value chain).
The “basic-moderate” category comprises manufacturing enterprises that in the 2014 survey reported they had sent or received orders via the Internet and/or enterprises using ERP software (this with the purpose to share information across departments and functions internally along the (vertical) value chain).
The category “low” refers to manufacturing enterprises that are inexperienced when it comes to sending or receiving orders electronically and/or which do not use software solutions for internal information exchange (ERP).
Figure 4.2 shows how manufacturing enterprises are distributed across the three main categories41 in the Nordic countries, the two benchmark countries and EU.
41 A weakness in the survey is that it does not include questions on digital technologies in production like robots, CAM-systems, etc. But we assume a close link between digitalisation of business processes in the companies and use of digital and automation technologies in production.

Nordic Production 57
Figure 4.2: Level of digitalisation and automation in manufacturing companies in the Nordic countries, Germany, UK and EU
Source: Eurostat. Note: Survey data are due to the use of samples and modest reply rates connected with some uncertainties, and the results should therefore be interpreted with some caution.
The figure reveals that across countries only approximately one out of six companies are on an advanced level. More companies are on a low level of digitalisation than on advanced level.
But there are also differences across countries. One important message in the figure is that manufacturing in the Nordic countries, as well as UK and Germany, is characterised by a higher degree of digitalisation than EU as a whole.
Thus, a relatively large share of Nordic manufacturing enterprises reports to be above the lowest level of digitalisation. This is particular the case for Denmark and Iceland where three out four companies are either digitalised at a basic-moderate level or at an advanced level. The share of manufacturing enterprises with a relatively low level of digitalisation varies from 23 percent in Denmark to 53 percent in Norway. In Finland and Sweden 40 percent of the manufacturing enterprises are at a low level of digitalisation, which is similar to both Germany and the UK.
However, it is relevant to emphasise that figure 4.2 does not necessarily show, which country that has the most sophisticated manufacturing sector as a whole. As discussed in chapter 3, value added is in some countries concentrated to a small number of large and very sophisticated companies. This is the case for Sweden and Finland, as
23% 40%
26%
53% 40% 42% 39%
56%
57% 39%
54%
30% 49% 33% 47%
27%
20% 21% 20% 17% 11% 25%
14% 17%
0%10%20%30%40%50%60%70%80%90%
100%
Denmark Finland Iceland Norway Sweden Germany UK EU28
Low Basic-Moderate Advanced

58 Nordic Production
well as for UK. Digitalisation in these companies might to a higher degree compensate for a great number of small companies at a low digital level.
National variation in industry structures can partly explain country differences shown in figure 4.2. For example, the benefits of information sharing systems (ERP) and e-commerce might be more limited in some industries. If this is the case for the oil technology industry in Norway and the forest and paper industry in Finland, it can explain why this kind of ICT-usage is more limited in these countries.
At the other end of the spectrum, we find companies characterised by “advanced” digitalisation. This category covers enterprises whose businesses are automatically linked to those of their suppliers/consumers. Here Germany stands out with a 25 percent share.
Quite surprisingly, Sweden has only 11 percent of the manufacturing enterprises in the advanced category. One possible explanation is that underlying data only measures the degree of digitalisation. Hence, it does not reflect the extent to which for example advanced enterprises employ automation technologies.
When it comes to automation, Swedish manufacturing enterprises have traditionally been frontrunners among the Nordic countries and in EU.
There are several reasons for this. Firstly, in Sweden large companies account for an unusually high share of manufacturing value added and employment. And many of the large Swedish companies, especially in automotive and machinery industry, compete in highly globalised markets and face fierce competitive pressure. Further, a relatively large proportion of Swedish manufacturing outputs are goods, which are manufactured in large batches.
As shown in figure 4.3, the highest density of industrial robots in manufacturing today can be found in Japan and Germany. Sweden has the highest share of industry robots among the Nordic countries and ranks as number three on a global scale.

Nordic Production 59
Figure 4.3: Stock of industry robots per 10,000 employed in manufacturing industries (2013)
Source: International Federation of Robotics (2015).
In recent years, Denmark and Finland have been able to catch up on Sweden in case of density of industry robots. This development is fuelled by smaller, more flexible and less expensive types of robots that have been marketed and spawned stronger incentives to invest in automation for small and medium sized companies (SMEs).
Thus, the new flexible robots have paved the way for more profitable investments for a growing number of enterprises – especially enterprises characterised by small-scale production.
Norway has a remarkable low density of industry robots compared to other Nordic countries. There are several explanations for this.42
One cause is the composition of industries in Norway. Manufacturing related to oil and gas exploitation as well as manufacturing related to fishing industries play important roles in Norway. On a global scale, these industries are considered to be rather small, niche industries, and are often not in focus when global manufactures of automation technologies develop new standardised technology. Thus, it might be more time-consuming and more expensive for major parts of Norway’s manufacturing companies to apply the standard automation technologies available at the global market.
Another explanation highlighted in recent literature is the fact that labour costs in Norway are very high. It might cause management to doubt their chances of survival in a globalised market and thus hamper incentives for long-term investments in new production technologies.
42 Teknologirådet (2013). Made in Norway
0
50
100
150
200
250
300
350

60 Nordic Production
On the other hand, high labour cost is a very strong incentive to invest in automation technology.
That said it is important to note that Norway also has a number of advanced, digitalised and highly automated manufacturing companies. This is particular the case for a range of enterprises in the furniture industry, for key suppliers in the oil and gas sector and manufactures of components to the automotive industry.43
New technologies as enablers for digital business models and Internet of Things As mentioned previously, due to lack of relevant comparable data, it is not possible to quantify the share of manufacturing enterprises that have develop digital business models.
Similarly, and also due to lack of data, we cannot estimate how many enterprises that are exploiting new technologies related to “Internet of Things”44 across the Nordic countries and Germany and UK.
But we do have access to comparable data measuring the share of manufacturing enterprises using RFID technologies45 in their products and processes.
RFID-technology is only one technology among a broad span of technologies underpinning the vision of the “Internet of things”.
Thus, it is a weak indicator for diffusion of digital business models in manufacturing. However, usage of RFID gives a hint on how well equipped Nordic manufacturing enterprises are to exploit new business opportunities related to a future “Industry 4.0” (see chapter 2). The concept of Industry 4.0 indicates a world where industry robots, 3D-printers and products. These are expected to be digitally linked and suppliers, manufacturers, distributors and end-users will then share common digital platforms and automatically exchange information throughout the value chain.
43 E.g. the manufacturing company Ekornes that produces furniture. 44 The Internet of Things (IoT) refers to networks of physical objects or “things” embedded with electronic “tags”, software, sensors, and network connectivity, which enables these objects to collect, communicate and exchange data. OECD defines IoT as: “All devices and objects whose state can be read or altered via the Internet, with or without the active involvement of individuals using the devices”. 45 Radio-frequency identification (RFID) is a wireless technology that utilizes electromagnetic fields to transfer data, for the purposes of automatically identifying and tracking tags attached to objects. RFID is coming into increasing use in industry as an alternative to the bar code. The advantage of RFID is that it does not require direct contact or line-of-sight scanning.

Nordic Production 61
Figure 4.4 displays the share of manufacturing enterprises that have embedded RFID-technologies in processes and products. The data covers all Nordic countries and the two benchmark countries, while it relates to 2014.
Figure 4.4: Share of enterprises using Radio Frequency Identification (RFID) technologies (2014)
Source: Eurostat (2014); Survey on ICT-usage in business sector.
Significant cross-country differences exist in terms of employing RFID-technologies.
In Germany and Finland RFID-technology is most widely used among manufacturing enterprises. In these two countries, almost one in four companies report to be using RFID-technology to some extend.
Among the rest of the depicted countries, the share of companies using RFID technologies is at a much more modest level, and all Nordic countries - except Finland – rank below the EU average.
It is not surprising that Finland and Germany are frontrunners in EU within this field. Germany hosts some of the world’s leading manufactures like Siemens, BMW Group etc., who are massively engaged in promotion of new advanced production technologies.
In Finland, a large pool of previously Nokia employees have since 2008/09 found jobs in other parts of the Finnish manufacturing industry. Typically, these Nokia employees have contributed to the rise of the level in ICT-competencies and they have also helped to identify areas where advanced digital technologies can be beneficial for new employers.
It might be more surprising that the majority of Nordic countries, and a prominent industry nation like UK, rank below the EU-average in this field.
10%
23%
8% 8% 8%
24%
8% 13%
0%
5%
10%
15%
20%
25%
30%
Denmark Finland Iceland Norway Sweden Germany UnitedKingdom
EU28

62 Nordic Production
There is no single explanation for this pattern, but an obvious rationalisation is that RFID-technology has been more applicable in some industries than in others.
It is only recently that RFID-tags have become available as a “throw-away” technology and have become commercially interesting to a broader set of industries. Thus, the use of this technology is probably biased towards specific industries, e.g. ICT and electronics (where Finland and Germany are strong).
Another explanation might be that Sweden, Denmark, Norway and UK is simply lack a driving force to accelerate the dissemination of these new technologies – similar to 1) the way Siemens and others has been a key driver in Germany and 2) the large pool of highly ICT-skilled Nokia-workers.
4.4 Perspectives and potentials
Despite a widespread digitalisation and automation in manufacturing over the last two decades, the technological pace does not seem to slow down in the future.
For example, a Swedish study recently showed how 91 percent of Swedish enterprises estimate that digitalisation will have significant impact on their competitiveness within a five-year perspective.46 Today, this share is 61 percent.
A number of different factors are expected to drive a new wave of investments in automation and digitalisation technologies in the future.
• Firstly, diffusion of existing technology will continue. This is not justthe case in the Nordic countries. Global competitors originating fromother part of EU as well as newly developed countries like China,India etc. are also expected to invest in digitalisation andautomation, as wage levels rise in these countries. Continuedinvestments in existing digitalisation and automation technologies inNordic manufacturing is key to raise productivity and staycompetitive in a global market.
• Secondly, we will witness an increased focus on digitalisation ofexisting products, new digital services and the development of data-driven business models. Competition in manufacturing focuses
46 PWC (2015). The smart manufacturing industry.

Nordic Production 63
increasingly on the ability to create value for the customers. This leads to an increased emphasis on servitization and more intelligent products. Manufactures compete increasingly on utilisation of new embedded ICT (sensors, software solutions, etc.) and on the ability to exploit data commercially.
• Thirdly, new advanced technologies like advanced robotics, additivetechnologies (like 3D printing) and Internet of Things will drive anew production paradigm (Industry 4.0). This developmentrepresents a huge market potential.
There are huge economic benefits tied to all of the three perspectives outlined above – both for the individual manufacturing company and for the Nordic economies as a whole.
In a recent study, researchers at Copenhagen Business School estimated the economic potentials tied to enhanced dissemination of existing automation technologies. They presented evidence for a potential 15 percent increase in labour productivity in Sweden, Finland and Denmark, respectively, if enterprises within the different manufacturing industries used automation technologies to the same extent as enterprises in the most automatically advanced country. See table 4.1 below.
The economic potential is in the table estimated for each industry. The second column from the left refers to the “best practice” country, hence the country with the highest degree of automation for the specific industry. The other columns show the estimated increase in labour productivity, in different industries, if the automation level is raised to the level of the country with the highest automation level today.
Table 4.1: Economic potentials (gain in labour productivity) related to further automation
Best Denmark Finland Sweden Germany Japan UK
Food FIN 7% 0% 7% 9% 14% 14% Textiles DNK 0% 9% 10% 9% 10% 10% Wood and wooden products DNK 0% 20% 17% 1% 22% 21% Paper and printing FIN 2% 0% 3% 2% 2% 3% Chemicals FIN 21% 10% 20% 12% 13% 29% Glass, concrete etc. GER 4% 7% 9% 0% 8% 10% Metal and machinery DNK 0% 4% 1% 5% 6% 12% Electronics JPN 17% 14% 20% 17% 0% 24% Automotive GER 81% 80% 66% 0% 16% 76% All other JPN 40% 39% 39% 28% 0% 41% Total - 15% 15% 16% 8% 8% 22%
Source: Kromann et al. (2010). Automation og arbejdsproduktivitet – en analyse baseret på branche – og landeforskelle.

64 Nordic Production
The table reveals both similarities and differences among the Nordic countries. All three Nordic countries exhibit a significant potential for enhanced productivity in automotives, electronics, chemicals and in the category “other manufacturing industries”.
Similarly, all Nordic countries are among the most advanced in metal & machinery and paper & printing industries, hence potentials for further automation and productivity gains are limited.
Table 4.1 also shows a number of differences across the Nordic countries. For example the Danish manufactures of wood products represent best practice, while Finland and Sweden are estimated to possess a substantial potential for further automation and associated potential productivity gain of approximately 20 percent. Similarly, Finland hosts the most automated food sector, while there is a significant potential for further automation in the food manufacturing industry in Denmark and Sweden.
All three Nordic countries are estimated to have an estimated total potential of approximately 15 percent gain in labour productivity, which is almost twice the potential in Germany and Japan where manufacturing enterprises have automated production processes the most.
Digitalisation represents major business potentials Beside a significant potential for increased labour productivity, further digitalisation and automation also represent major future business potentials.
New digital technologies, new software, embedded ICT, etc. will make it possible to develop new and more intelligent products, as well as new types of services that represent a higher value to the user.
Similar, the fourth wave of industrialisation is expected to generate a huge market for more advanced, digitally linked machines, robots and other kinds of production equipment needed to build self-organising manufacturing systems in the future.
The digital transformation of manufacturing will pose both challenges and new possibilities for today’s manufacturers. For example, the German manufacturing company Siemens estimates the future marked potential of digital manufacturing to be a trillion dollar market. Similarly, it is estimated that by 2020, Internet of Things technology will include nearly 26 billion devices, adding USD 1.9 trillion in global economic value.47
For companies not caring about how digitalisation will affect the business models of their industry, the market will probably erode. On
47 Deloitte (2015) The Internet of Things Ecosystem: Unlocking the Business Value of Connected Devices.

Nordic Production 65
the other hand, companies who are actively considering how to improve their products, services and work processes through digitalisation will be much better prepared to capture a fraction of the future market of more digitalised goods and services.
4.5 Summary
While digitalisation and automation is a matter for virtually all companies, there exist big differences in the level of digitalisation and automation across companies, industries and even countries.
Only 20 percent of all manufacturing companies are perceived to be on an advanced level of digitalisation. In comparison, more than one third of the Nordic companies are on a low level. These numbers indicate a huge potential for increased digitalisation, although a relatively big part of value added is concentrated in big companies, which are typically very digital advanced.
On the other hand, Nordic manufacturing industries are more digitally advanced than most of their peers in the EU. German manufacturing seems, however, to be a European leader when it comes to digitalisation, especially measured in terms of the share of digitally advanced companies.
There is no doubt that the speed of automation and digitalisation will be of enormous importance for the development in profitability and competiveness in Nordic manufacturing.
Firstly, there seem to be a potential for a two digits raise in productivity just by making better use of existing automation technologies.
Secondly, completion of new digital business models will be strong in the future. Advanced digitalisation is fundamental for manufacturing companies to be able to compete on services, embedded ICT and Internet of Things. While these competition factors are not the norm today, they are excepted to determine successes and downturns in the future.
Thirdly, we will see new technologies like very advanced robots and additive technologies forming a new production paradigm in the future. They will contribute to a further digitalisation where all production processes become fully automated and integrated.
It is crucial for future growth in Nordic manufacturing to become successful in all three areas.


5. Barriers to furtherdigitalisation and automationin the manufacturing sector
5.1 Introduction
This chapter focuses on key barriers to digitalisation and automation in the manufacturing sector. The basis for this chapter is a review of recent literature on automation and digitalisation in manufacturing and specific analyses of barriers to digitalisation in some Nordic countries.
Section 5.2 describes how barriers analytically can be divided into three different categories according to the maturity of technology and types of companies.
Section 5.3 elaborates on the characteristics of the barriers for each of the three categories, and gives – where possible – evidence on how widespread the barriers are among Nordic manufacturing.
Section 5.4 wraps up key findings and comments on the perspective of enhanced digitalisation and automation in Nordic manufacturing.
5.2 Three levels of digitalisation and automation
Diffusion and utilisation of new digital technologies in the manufacturing sector are associated with a wide range of barriers.
Our desk research suggests that significant variation exist across different segments of enterprises.
We distinguish between three categories of enterprises and related barriers:
• “Followers” – technology diffusion. This group is by far the largest inabsolute numbers. It consists of companies that invest in and applydigital technology when technologies become increasingly mature.Followers are reluctant to make investments in new technology inearly phases. Typically, this is the case despite a considerable marketfor well-tested solutions exists. Often, these companies lack ICT-

68 Nordic Production
skilled personnel. The driver for investments in digital solutions among followers is usually cost-reduction and higher quality of products and services.
• “The early adopters” – demonstration and testing of new technologies. Early adopters are among the first to apply new digital technologies and first movers to develop new digital business models. These enterprises experiment with new technologies to find innovative solutions that create higher customer value. Their main challenges evolve around how to exploit new business opportunities through the application of new technology. They are often more willing to invest in development projects with a higher risk and longer time-to-market, as long as they have confidence in the business case. Their main drivers for investments are ambitions to add more value to their products, enter new markets and/or to reduce costs.
• “The innovators” – focus on applied research and development. Innovators are the most digitally advanced companies and they engage in development of digital technologies of tomorrow. Applied research and development and new technological advancements are main business drivers for this group of enterprises. These enterprises keep track with the latest technological trends and invest substantial resources in research and development projects carried out in close partnerships with scientists and other research and development intensive companies. Investments in these development projects are typically subject to significant risks because the projects have long-term perspectives and focus on immature technologies.
Figure 5.1 provides an illustration of the three types of companies and associated barriers.

Nordic Production 69
Figure 5.1: Barriers to automation and digitalisation
Source: IRIS Group.
Along the horizontal axis we distinguish the three different categories of enterprises based on how far technology is from being applicable in industrial processes and products. The Innovators who focus on developing new technology are located furthest to the right of the x-axis.
The vertical axis defines the number of enterprises within each category. The grey bars illustrate how the total numbers of companies within each category decrease. In other words, the majority of enterprises are “followers”, fewer are “early adopters”, and only a limited number of enterprises are categorised as “innovators”.
Above each category, we have listed the most prevalent barriers in terms of development and application of digitalisation and automation. We discuss these barriers and their significance in Nordic countries in more detail below.

70 Nordic Production
5.3 Prevalent barriers among the target groups
Digitalisation and automation of the Nordic manufacturing sector can take different paths.
Digitalisation and automation can be obtained through diffusion of existing technology among the large group of followers, thus lifting more enterprises from a low and basic level to a moderate and more advanced level of automation and digitalisation (see chapter 4).
Another path is when companies engage in innovation, development and testing of new technologies in order to develop and marketing more intelligent products with embedded ICT, develop new digital services and/or new digital business models.
A third path is when SMEs engage in long-term research and development in order to develop and commercialise new cutting edge automation and digitalisation technologies in the future.
Based on our research, we identify the most prevalent barriers and classify them according to each of the three groups in which they most commonly occur. However, it is worth noting that classifications of barriers should not to be perceived statically. Thus, barriers may occur across all three target groups, yet each barrier may still be most prevalent within one target group.
5.3.1 Barriers among the followers
The private market can to a relative extent drive the diffusion of mature technologies. Often, it is possible to follow the footsteps of other companies or get inspiration from convincing business cases that are related to other industries etc.
However, a number of barriers, especially among SMEs, frequently hamper or prolong the diffusion of mature and established technologies. Below, we have listed barriers most commonly emphasized in the literature:
• Scarce management resources. Scarce management resources
characterize most of the small manufacturers, partly because the management – besides being manager – is also engaged in the day-to-day operational tasks. Often it keeps small companies from digital advancement because it is time consuming to find the right technological solution and customize it in accordance with the specific needs companies have.
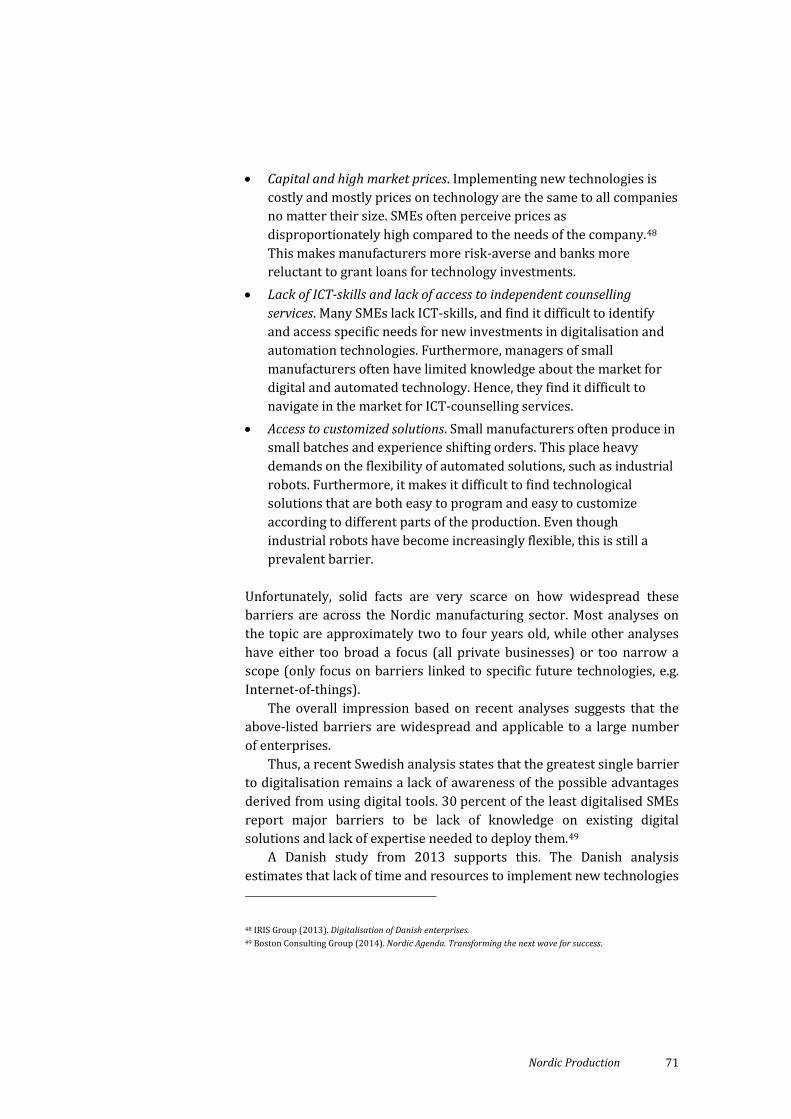
Nordic Production 71
• Capital and high market prices. Implementing new technologies iscostly and mostly prices on technology are the same to all companiesno matter their size. SMEs often perceive prices asdisproportionately high compared to the needs of the company.48
This makes manufacturers more risk-averse and banks morereluctant to grant loans for technology investments.
• Lack of ICT-skills and lack of access to independent counsellingservices. Many SMEs lack ICT-skills, and find it difficult to identifyand access specific needs for new investments in digitalisation andautomation technologies. Furthermore, managers of smallmanufacturers often have limited knowledge about the market fordigital and automated technology. Hence, they find it difficult tonavigate in the market for ICT-counselling services.
• Access to customized solutions. Small manufacturers often produce insmall batches and experience shifting orders. This place heavydemands on the flexibility of automated solutions, such as industrialrobots. Furthermore, it makes it difficult to find technologicalsolutions that are both easy to program and easy to customizeaccording to different parts of the production. Even thoughindustrial robots have become increasingly flexible, this is still aprevalent barrier.
Unfortunately, solid facts are very scarce on how widespread these barriers are across the Nordic manufacturing sector. Most analyses on the topic are approximately two to four years old, while other analyses have either too broad a focus (all private businesses) or too narrow a scope (only focus on barriers linked to specific future technologies, e.g. Internet-of-things).
The overall impression based on recent analyses suggests that the above-listed barriers are widespread and applicable to a large number of enterprises.
Thus, a recent Swedish analysis states that the greatest single barrier to digitalisation remains a lack of awareness of the possible advantages derived from using digital tools. 30 percent of the least digitalised SMEs report major barriers to be lack of knowledge on existing digital solutions and lack of expertise needed to deploy them.49
A Danish study from 2013 supports this. The Danish analysis estimates that lack of time and resources to implement new technologies
48 IRIS Group (2013). Digitalisation of Danish enterprises. 49 Boston Consulting Group (2014). Nordic Agenda. Transforming the next wave for success.

72 Nordic Production
together with high prices on digital solutions poses barriers for digitalisation for more than 50 percent of Danish SMEs.
Furthermore, there is reason to believe these barriers are particularly widespread among small manufacturers in Denmark, Finland and Norway, as these countries host a large number of manufacturers with specialised production in small batches and an accordingly need for customised solutions.
These needs for customised solutions result in higher prices and analyses suggests that up to three quarters of Danish and Norwegian companies regard investment costs as the primary barrier to automation and digitalisation.50
One of the few barriers where we actually do have access to comparable data is on enterprises’ access to relevant ICT-skills, see figure 5.2.
The blue bars in the chart show the share of enterprises that have recruited/tried to recruit ICT-skilled personnel. The green bars show the share that has had hard-to-fill vacancies.
Figure 5.2: Access to ICT skilled personnel as a barrier for digitalisation
Source: Eurostat.
50 Quartz+Co (2012). Er industrien i Norge offensiv i bruken av virkemidler for å styrke egen konkurransekraft?; IRIS Group (2013). Digitalisering af dansk erhvervsliv.
0
2
4
6
8
10
12
14
16
Denmark Finland Iceland Norway Sweden EuropeanUnion
Enterprise recruited/tried to recruit personnel for jobs requiring ICTspecialist skills
Enterprise had hard-to-fill vacancies for jobs requiring ICT specialist skills

Nordic Production 73
In all Nordic countries the share of enterprises recruiting for ICT-skilled personnel is higher compared to the EU-average – except for Norway, where the share is similar to the EU-average.
Also, the share of companies that experience hard-to-fill vacancies is significantly higher in the Nordic countries compared to the EU-average. The figures reflect that Nordic companies are at a relatively high level of digitalisation compared to the average level of EU. However, at the same time access to ICT-skills is a barrier to digitalisation for a substantial number of Nordic enterprises.
It is important to address these barriers as substantial evidence emphasise how a rise in digital levels of this large pool of “follower” companies can result in economic gains at both company level and societal level (see chapter 4).
5.3.2 Barriers among the early adopters
The group of early adopters play a leading role in applying and testing new technologies. Often this group of enterprises seeks new innovative answers and solutions to common challenges and obstacles that are widespread in their industries. The key challenge for the group of early adopters relates to integrating new digital technologies in existing products and services, and the development of new, digital business models in order to utilise and commercialise digital technologies.
These companies typically have a sound IT-understanding and are willing to take more risks than the followers. However, utilising new technologies in this manner often require development projects that include new types of collaboration and have uncertain outcomes.
Below, we have listed the barriers, primarily emphasised in the literature, for the group of early adoptors:
• Convincing business case and access to risk capital. Outcomes ofdigital innovation are always uncertain and require significantinvestments in developing, testing and marketing of new intelligentproducts and services. Thus, innovative efforts have uncleareconomic benefits.51 A large number of early adoptors report havingtrouble establishing a convincing business case due to difficulties inestimating innovation costs and market potential. Lack of a strong
51 According to a survey among Swedish manufacturing companies, 44% regard unclear economic benefits from investing in advanced manufacturing as the most or second most important barrier to the successful introduction of Industry 4.0 technology. (PwC (2015) The Smart Manufacturing Industry).

74 Nordic Production
business case makes it equally difficult to raise the external risk capital needed to fund the development phase.
• Access to data and data security. The connection of internal andexternal data contains substantial business opportunities. Butregularly digital products and new digital business models areassociated with risks of leakage, hacking and abuse. To avoid this,companies that experiment with innovative use of data are obligedto make substantial investments in monitoring and safety systems.
• Specialist ICT skills. Many early adoptors struggle to find employeeswho are specialised within both ICT and business development.Hence, they can develop holistic business models that combineinternal data from customers, intelligent products and machines aswell as external data. Several analyses emphasise this need for ICT-specialists. For example, a survey among Swedish manufacturingcompanies reveals that 40 percent regard the lack of sufficientlyqualified ICT personnel as the most, or second most, importantchallenge to the successful introduction of Industry 4.0 technology.52
• Matchmaking and access to prototyping facilities. As corecompetencies of manufacturers typically lie within “non-digital”technical areas, they commonly lack certain forms of expertknowledge, e.g. within software development. In addition, only fewcompanies have access to prototyping facilities (e.g. 3D printing)where they can test and customise new products in accordance withcustomer feedback.
A strong focus on overcoming the barriers, outlined above, is particularly important in the Nordic countries, where a large share of manufacturing SMEs compete in global markets of high quality products and services.
Obtaining a critical mass of innovative SMEs pursuing digital ventures is key in order to accelerate the digital transformation of Nordic manufacturing. Thus, the Nordic countries share common challenges when it comes to building an efficient ecosystem of advisors, researchers with expert knowledge, test facilities and experienced investors who know how to exploit business opportunities associated with new digital technologies.
52 PwC (2015) The Smart Manufacturing Industry.

Nordic Production 75
5.3.3 Barriers among the innovators
The future of manufacturing is characterised by technological concepts such as Cyber-Physical Systems, Internet of Things and Internet of Services that are expected to represent a market worth billions within the next five to ten years.
Primarily large research-intensive companies have the capacity to participate in long-term development of these technologies. Despite significant internal resources, research-based enterprises still experience a number of barriers.
Below, we elaborate on the barriers most commonly emphasised in the literature for the group of research-based companies:
• Standardized communication technology. The ability to comprehendvisions of future manufacturing, such as “smart factories” and“Industry 4.0”, depends on the development of technologies thatenable connection of devices that used to be separate systems.However, the development of universal communication standardshas so far failed because of resistance within industries to let go ofproprietary systems.53
• Excellent research and ICT specialists. Development andimplementation of digital or automated state of the art technologyrequires access to the excellent research environments and ICTspecialists. However, due to the relatively small size of Nordiccountries, access to a critical mass of scientists and specialists islimited. Therefore, an analysis suggests that European countries willhave to join forces in cluster-like collaborations in order to gathercore competencies from research and industry.54
• Claims to data. As technology develops, intelligent products areincreasingly producing substantial amounts of data that present vastopportunities for business development. However, legislation on therights to use these data is unclear. Who is entitled to use the datathat accumulate during production in a smart factory? The user? Themanufacturer? The IT service provider? There are sound argumentsfor all of these claims, and each would have far-reachingconsequences for the control of production processes, the
53 According to a survey of Swedish and German manufacturing companies 25% regard the lack of universal communication standards, norms and certification options as a central barrier for the introduction of Industry 4.0 technology (PwC (2015). The Smart Manufacturing Industry). 54 Roland Berger Strategy Consultants (2014). The digital transformation of industry. How important is it? Who are the winners? What must be done now?

76 Nordic Production
coordination of logistic flows and maintenance cycles as well as optimisation at the shop floor.
• Research and development funding. Developing ground breakingtechnologies that are applicable throughout different sectors withinmanufacturing is typically undertaken in projects that have a timeframe of five years or more and include a number of leadingscientists and industrialists. Thus, these projects are dependent onpatient risk capital with a longer time horizon for return oninvestment. That makes involved companies highly dependent onopportunities for public research and development funding, whichare limited in the Nordic countries compared to leading industrialnations.
• Matchmaking. There are substantial evidence on the positivesocioeconomic effects of collaborations between researchenvironments and industry across the value chain.55 However, theoutcome of these collaborations often depends on the right matchbetween competencies and many companies lack qualified externalassistance on matchmaking and general facilitation of thecollaboration.
• State of the art technology. Innovation contains substantial risksbecause it requires access to highly advanced equipment andtechnologies that are both very expensive and do not necessarilycontain the expected commercial potential. Thus, a challenge formany innovators is that they have no access to excellent equipmentunless they risk investing in it themselves.
Supporting these research-intensive companies is an essential prerequisite to be a part of the digital economy of the future.
5.4 Summary
This chapter argues that there are several barriers to digitalisation and automation in the manufacturing industry, and that these barriers are more or less common to all Nordic countries.
Moreover, companies can be divided into three groups with regard to the development and use of digital technologies – innovators, early
55 See for instance IRIS Group (2014). Vidensamarbejde under lup – evaluering af universiteternes erhvervssamarbejde og teknologioverførsel PwC (2015). The smart manufacturing industry.

Nordic Production 77
adopters and followers. Each group are characterised by a different mix of barriers linked to further digitalisation:
• Innovators face barriers within areas like differing standards, accessto specialists, appropriate research and development funding andregulation.
• Early adopters face some of the same barriers, but use of new digitaltechnologies in this group is also hindered or delayed by otherbarriers, such as lack of convincing business cases, limited riskcapital, and a lack of access to the right facilities (e.g. prototypingfacilities).
• Followers (or non-users) face barriers like lack of ICT-skills, limitedmanagement resources and difficulties in identifying the rightcustomised solutions. Lack of capital is furthermore a barrier formany companies in this group.
The existence of many serious barriers to digitalisation and automation indicate why diffusion takes time. They might also explain why some countries faster adopt digital technologies than other countries (see chapter 4).


6. Policies facilitatingautomation and digitalisation
6.1 Introduction
The purpose of this final chapter is to give an overview of existing policy initiatives fostering digitalisation and automation in the manufacturing sector in the Nordic countries and the two benchmark countries.
This is not a simple task since companies in most countries have access to a number of schemes that might be used to develop or implement digital technologies.
Among others, this is the case for initiatives that focus on access to capital. Typically, these are general initiatives addressing capital needs for a broad range of purposes – including funding of digitalisation and automation projects.
The same applies to general schemes, which promote the development, testing and diffusion of new technologies. Of course, digitalisation and automation are sometimes important issues in projects that are supported under these general schemes.
Moreover, the Nordic countries have to a varying degree developed public co-financed technology service organisations supplying technical services to SMEs. The Approved Technological Service Institutes in Denmark and SINTEF in Norway are examples hereof. These organisations help SMEs with the implementation of a number of technologies, including robots and other ICT-based production systems.
Some of these institutes are even specialised within digitalisation and automation. As an example, UK has recently reorganised their technological service system into seven so-called Catapult Centres. Two of these centres – Digital Catapult and Advanced Manufacturing Catapult – play a key role in the digitalisation of the UK production sector.
The chapter concentrates on initiatives, schemes and programs thatare more or less dedicated to the task of fostering automation and digitalisation in manufacturing. It is thus important to stress that it leaves most general innovation schemes out – and therefore does not give a full overview of all policies that in reality affect the level and pace of digitalisation and automation in manufacturing.

80 Nordic Production
Based on our desk research and discussion with experts, figure 6.1 gives an overview of the prioritisation and focus in national policies stimulating digitalisation and automation in manufacturing.
Figure 6.1: Digitalisation and automation in manufacturing – current policy focus
Source: IRIS Group.
In the left part of the figure, we have evaluated the general commitment to digitalisation and automation in the seven countries. The main parameters are here the magnitude of investments (size of schemes, etc.) as well as the focus on the issue in national business policy strategies.
As illustrated, Finland, Germany and UK have the strongest commitment to the agenda of fostering automation and digitalisation in manufacturing. Conversely, Norway and Iceland are the countries least committed to the agenda.
In the right part of the figure, we have highlighted how the national efforts are composed in relation to the company typology presented in chapter 5. It appears that the countries have different focus.
For instance, while Finland has a strong commitment to applied research and development in their use of public means, Denmark mostly emphasises diffusion of technologies in terms of schemes dedicated to digitalisation and automation.
In the next seven sections, we introduce the most important schemes and initiatives in each country, while section 6.9 sums up and gives perspectives for future efforts in the Nordic countries.
In our research, five types of policy means are identified. Often concrete schemes or programs contain more than one of these means,
Focus on digitalisation and automation in national
business policies
Applied R&D –”Innovators”
Test and demonstration
”Early adoptors”
Technology diffusion –
”Followers”
Denmark
Sweden
Norway
Iceland
Finland
Germany
UK
Strong Moderate Low

Nordic Production 81
i.e. the means are combined to address specific barriers to furtherdigitalisation and automation. The five means are:
• Research and innovation projects. Includes cooperation that has long-term perspectives focusing on developing new technologies orapplying new research or technology in concrete areas. “Innovators”and “early adoptors” primarily use research and innovation projects.
• Advisory services, matchmaking and access to technology. Includesboth advanced counselling on technology development, access tostate-of-the art technology and independent advice on how toincrease digitalisation. This mean is used by all three target groups –but matchmaking and access to technology is most relevant for“early adopters” and “Innovators”.
• Subsidies and access to capital. Includes co-financing of digitalisationprojects as well as access to soft loans and other kinds of financing.This mean is mostly relevant for “early adopters” and “followers”.
• Education and training. Includes courses and practical training in useof new technology. This mean covers skills applicable to the largegroup of “technology followers” and more specialised ICT-skillstargeted “early adopters”.
• Inspiration and benchmarking. Includes access to case stories,benchmarking tools, seminars, etc. This mean is mainly relevant for“followers”.
6.2 Policies in Denmark
In contrast to Finland, the Danish initiatives stimulating digitalisation and automation have, for the time being, their emphasis on diffusing technologies that already exist or have a short-medium time-to-market. Moreover, means are also combined, which includes support schemes, advisory services, tailor made education and support of cluster organisations.
Generally speaking, Innovation Fund Denmark co-funds strategic research and development of high-tech platforms, as well as smaller grants for development of innovative solutions in SMEs in Denmark. Among the six strategic areas of Innovation Fund Denmark are “production, materials, digitalisation and ICT”. Among other instruments, which can be used to further automation and digitalisation is the so-called InnoBooster scheme. This scheme aims to increase the

82 Nordic Production
level of innovation in Danish SMEs by providing grants up to DKK 500,000. The grants are used to invest in knowledge, consultancy services, equipment and cooperation with knowledge institutes.
Schemes that in particular target SMEs are the two GTS-institutes Danish Technological Institute and FORCE Technology. They have initiated the innovation-project Production in Denmark56 that aims to strengthen employment, productivity and competitiveness by exploiting the growth potential of existing state-of-the art technologies and through exchange of knowledge in cluster activities. The target audience of these activities are primarily manufacturing SMEs.
The Danish Regions and The Danish Agency for Research and Innovation co-funds a number of business growth programmes and cluster initiatives. Currently, some of these initiatives focus on digitalisation and automation in manufacturing.
The business support programme Vaekstløft, which is a new initiative that aims to create growth in manufacturing SMEs,57 is an example hereof. See box 6.1.
56 See: http://www.teknologisk.dk/ydelser/produktion-i-danmark/34373 (Danish). 57 See: https://regionalt.erhvervsstyrelsen.dk/sites/default/files/ ansoegningsmateriale_nationalpulje_smv.pdf (Danish).

Nordic Production 83
Box 6.1. Realising the growth potential: “Vaekstløft”
Vækstløft is an initiative established in collaboration between the Danish Business Authority and the six Regional Growth Forums. It is administered by the so-called Growth Houses that are specialised in business support for companies with high growth potential. The project will initially identify 3,000 manufacturing SMEs with substantial growth potential, out of which 1,000 companies will be offered to participate. The target group is thus “followers” according to the use of terms in chapter 5.
During the programme, the SME will be offered an initial “growth check” aimed at identifying the growth potentials and challenges of the individual company. This is done by a private consultant in dialogue with the SME.
Afterwards, the consultant and the company will compose a tailored plan to create growth in the company, i.e. whether there are potentials in investing in digital technology. The consultant will assist the company in executing the plan, i.e. identify viable technologies and sources of finance. The goal is to strengthen the productivity and competitiveness of 1,000 SMEs.
It is expected that digitalisation and automation will be an important element in many of the projects.
The programme will have EUR 3.8 mill. at its disposal from the European Regional Fund and Social Fund. 50 pct. co-funding from the companies participating is required.
Currently, the Danish Agency for Science, Technology and Innovation supports approximately 20 different cluster organisations. One of the oldest is Robo Cluster, which facilitates research projects and knowledge exchange on automation and robotics technologies. Both developers and users of automation technologies are represented in the network.
A newer cluster initiative is MADE (Manufacturing Academy of Denmark).58 The aim of MADE is to make Denmark an attractive location for sustainable, high-tech and knowledge-based manufacturing companies. See box 6.2.
58 See http://made.dk/welcome

84 Nordic Production
Box 6.2. MADE
MADE is a so-called “strategic platform for innovation and research” (SPIR). Primarily it relates SMEs within manufacturing. The participants come from all three target groups presented in chapter 5, but “early adopters” may be seen as the main target group. MADE activities fall into three categories:
• The core activity of MADE lies in facilitating a number of collaborativeresearch- and innovation projects aimed at various aspects of automationand digitalisation in SMEs, e.g. enabling technologies such as sensors and3D print, digitalisation of supply chains, hyper flexible automation and high speed product development.
• Secondly, MADE facilitates knowledge exchange and matchmaking throughopen workshops, site-visits and demonstration projects. The objective is tosolve concrete challenges in manufacturing companies.
• Thirdly, MADE seeks to coordinate education and life-long learningactivities among Danish educational institutions, in order to ensure abetter correspondence between competencies and business needs.
The Danish Council for Strategic Research and the Danish Council for Technology and Innovation granted DKK 64 mill. in 2013 to MADE. Besides that, MADE is financed with a total of DKK 119,5 mill. from the participating companies, universities and other actors.
Thus, the cluster initiatives mainly focus on bringing new technologies to the market (“early adopters”), while the business support programmes and the services provided by “Vækstløft” and Inno-Booster focus on “followers”.
Another example of an initiative made for followers is the education programme KOMP-AD (Compentence Track for Automation and Digitalisation in SMEs).59 The program was an attempt to address one of the typical challenges of SMEs: the lack of knowledge and practical competencies in the field of automation and digitalisation. The project aims to assist SMEs in improving their productivity and growth, by increasing their use of digital and automated solutions in products and services. See box 6.3.
59 See: http://komp-ad.dk/

Nordic Production 85
Box 6.3. KOMP-AD
KOMP-AD is a collaboration of 15 Danish vocational schools and colleges, 250 SMEs, business associations and public actors within business support. KOMP-AD was initiated in 2013 and was finalised in 2015. The target group was mainly SMEs within manufacturing industries.
The main objective of KOMP-AD is to offer tailor made competency-development packages for SMEs. The project consists of three phases:
• Recruitment and screening of SMEs to identify companies with potentialsand challenges within automation and digitalization.
• Initial problem identification and dialogue with the SMEs. • “Tailor-made” competency-development courses for employees and
managers in the SMEs based on the practical challenges of the individualcompany.
The budget for the project is DKK 39,5 mill. 50 percent are funded by the EU Social Fund.
6.3 Policies in Finland
In a Nordic context, Finland seems to have the strongest commitment to become at the cutting edge of digitalisation and automation in the research and innovation policy.
What characterises Finnish policies is the distinctive focus on disruptive, collaborative research and development supported by strong cluster ecosystems. The Finnish innovation outlook historically stems from the experience of being in a “catch-up” situation, following Second World World War. More recently, Finland’s policies draw on the experiences of its powerful ICT-sector, and its development during the rise and decline of Nokia – an experience, which fostered a strong wish to remain competitive and at the cutting-edge of innovation.
The overarching goal is to position Finnish industries at the global forefront of automation and digitalisation. Thus, Finland’s mix of policies is focusing on “innovators” and “early adopters”.
The key driver in Finnish policy is TEKES – the Finnish National Agency for Technology and Innovation. TEKES’ support is centred on a number of strategic focal areas, including “Digitalism renewing business and industry”.

86 Nordic Production
In practice, the area is addressed by stimulating the development of clusters that carry out joint research and innovation projects. Thus, the core of Finland’s digitalisation policy is a number of financially capable and autonomous cluster organisations that facilitate and organise research and innovation projects. Furthermore, they seek to create a vibrant ecosystem of companies and research institutions originating from the entire value chain.
A key instrument is the six TEKES-funded Strategic Centres for Science, Technology and Innovation (SHOKs). Within the framework of these centres, companies and research units work in close cooperation and carry out research that has been jointly defined based on the strategic research agenda of each centre.
DIGILE is one of the six SHOK cluster-centres. Currently the activities of DIGILE are centred on four strategic business research programs. In addition, DIGILE is offering services to companies within test and demonstration, and it facilitates networks and internationalisation. See box 6.4.

Nordic Production 87
Box 6.4. Positioning the Finnish ICT-cluster at the cutting edge: DIGILE
DIGILE is a non-profit cluster organisation with the objective to create a vibrant cluster ecosystem around a number of disruptive, collaborative research and development projects focusing on digitalisation. Moreover, DIGILE facilitates test and demonstration of new products and concepts in collaboration with partner companies. The activities are primarily targeted at innovative ICT companies with research and development activity, universities and relevant public authorities. DIGILE’s activities fall into three categories:
• Research projects aiming to meet the needs of Finnish industry and societywithin a five to ten year period. Currently four research platforms arefacilitated by DIGILE. Among them are “The Future of Internet of Things”and “Need 4 Speed” which focus on developing novel digital businessmodels.
• “DIGILE Business Development” seeks to assist companies in testing ideasand concepts. DIGILE acts as an advisor and network facilitator helping toset up business consortia around the idea and helps with IPR-issues andstandard templates for contracts.
• Finally, DIGILE strives to further internationalisation by facilitatinginternational strategic partnerships with companies and universitiesabroad.
Since 2008, DIGILE has on average received EUR 40–50 mill. in funding per year. 60 percent of the funding comes from TEKES and 40 percent from co-funding by the companies involved.
Source: http://www.digile.fi/frontpage, http://www.digile.fi/Services/researchprograms
But DIGILE is not the only SHOK-cluster that focuses on digitalisation. Another example is FIMECC (Finnish Metals and Engineering Competence Cluster) which emphasis is on automation in the manufacturing industries. Like DIGILE, FIMECC engages in research programs, tests and demonstrations, internationalisation, as well as innovation camps for university students addressing concrete challenges in businesses.60
Another TEKES-funded program of interest is Industrial Internet. The program aims to renew the business operations of companies through
60 http://www.fimecc.com

88 Nordic Production
internet technologies and to encourage companies from different fields to engage in new kinds of cooperation. See box 6.5.
Box 6.5. Preparing Finnish industries for the Internet-of-Things: Industrial Internet
Industrial Internet is a research and innovation program focusing on the refinement of big data-technologies in terms of machine-to-machine communication and real-time service and production processes. The program covers the period 2014–2019.
Mainly targeted at research-active companies, the program also supports the development of new technological solutions (with long time to market) required in digital business as well as related research. Companies can apply for co-funding under the program if they meet the following criteria:
• The project helps renew business processes and services using industrialinternet technologies.
• It has considerable volume to ensure impact. • It features cross-industry collaboration. • It features pilots and demonstrations with active industrial participation.
The total budget for the five-year program is approximately EUR 100 mill. out of which TEKES funds account for approximately EUR 50 million.
The urge of Finland to stay at the forefront of ICT also manifests itself in Finland’s efforts to consolidate its traditional position as a powerhouse of wireless communication technologies. The TEKES-funded 5th Gear program aims to ensure Finland’s future lead within 5G-technology – the next generation of wireless data communications.
The program seeks to solve practical problems for businesses regarding 5G-technology, foster new businesses, and position Finland as the leading target for international investments in the area. See box 6.6.61
61 Also see “Hilla” - a TEKES funded program with a focus on growth industries (wireless ICT, automotive and traffic, health and heavy industries), which benefit from using ICT technologies. Main aim is to develop new growth companies. See http://www.hilla.center/

Nordic Production 89
Box 6.6. Development and diffusion of 5G-technology in Finland: 5th Gear
The program “5th Gear” focuses on research, tests and demonstration, as well as diffusion of 5G-wireless technologies in the Finnish business sector. Millimetre wave technologies, software defined networks and the management of heterogeneous network solutions are examples hereof.
The program targets companies of various sizes and research institutions. Compared to DIGILE and FIMECC, which are grounded in research of novel technologies with a long time to market, this program also covers more mature technologies and a broader range of businesses, including the diffusion of existing technologies. The activities include:
• Piloting and demonstration driven world-class 5G research. • Cross-industry collaboration, innovation and utilisation. • Global competiveness, new business opportunities and international
investments.
The total budget for the five-year programme is approximately EUR 100 mill. of which TEKES funds EUR 50 mill. 5th Gear runs in the time period 2014–2019.
See more on the webpage: http://www.tekes.fi/en/programmes-and-services/tekes-programmes/5thgear
6.4 Policies in Iceland
The Science and Technology Policy Council is the main body in Iceland responsible for developing and adopting policies on science, technological development and innovation. Due to the small size of the Icelandic economy, the council has not incorporated a distinct focus on enhancing digitalisation and automation within manufacturing in its policies.
However, based on a paper regarding the ecosystem of the internet economy and digitalisation, a task force appointed by the Icelandic parliament is currently working on a strategy that explores potentials for increased digitalisation in the Icelandic industry. The strategy will be announced ultimo 2015.
Despite absence of policies with an exclusive focus on digitalisation within manufacturing, some projects are worth mentioning. RANNIS62 – The Icelandic Centre for Research – administers the broad competitive
62 RANNIS has a close cooperation with the Icelandic Science and Technology Council.

90 Nordic Production
funding program Technology Development Fund whose aim is to increase innovation in the Icelandic industry. Here, projects within digitalisation and automation, among others, can apply for a maximum of ISK 45 mill.63 for a period of three years. The fund calls for proposals twice a year.
In addition, a non-profit research platform called Icelandic Institute for Intelligent Machines was founded in 2009 with support from, among others, RANNIS’ competitive funds.64 The Institute develops software tools, methods and systems within areas of artificial intelligence, robotics and simulation that are applicable in a wide range of areas, including manufacturing. Thus, the Institute introduces a solid framework for collaboration between research and different parties from industries via targeted projects, collaborative platforms etc.
Finally, the Icelandic Ministry of Industry and Innovation runs seven Innovation Centres whose aim are to encourage innovation among industrial entrepreneurs and established companies. The centres provide a combination of business support on e.g. business model, financing, growth and foreign partnerships and technological consulting within a number of specialised fields. Hence, the centres collaborate with companies on the development of new technology, products and services.
6.5 Policies in Norway
Compared to most of the other Nordic countries, Norway has until now had a limited focus on automation and industrial digitalisation in their business and innovation policy. Thus, Norway has not developed initiatives or organisations that exclusively focus on development or promotion of digitalisation and automation within the manufacturing industry.
On the other hand, the Norwegian government supports digitalisation and automation in manufacturing through broader cluster initiatives. A vast majority of Norwegian cluster organisations receive funding from the government under the program Norwegian Innovation Clusters. Some of these clusters deal with digitalisation and automation in manufacturing.
One of the industrial clusters is NCE Raufoss that has the objective to develop cutting edge research within niche areas of manufacturing. For instance, NCE Raufoss gathers companies specialising in production of
63 Which is around EUR 300,000. 64 These include Reykjavik University’s School of Computer Science, the Interdisciplinary Research Center in artificial intelligence CADIA and more.

Nordic Production 91
lightweight materials by means of automated production.65 Thus, companies work together to develop new automation technology that can be used in their production.
Furhermore, the broad industrial cluster organisation iKuben recently launched a research project inspired by “Industry 4.0” in Germany. The project is initated in line with the cluster’s recent decision of prioritising Industrial internet as the main area of attention. See box 6.7.
Box 6.7. iKuben: Manufacturing Network 4.0
iKuben was founded in 2012 as a cluster of internationally oriented manufacturing companies in the Western region of Norway.
In the summer 2015, iKuben launched the research project Manufacturing Network 4.0, which is carried out in collaboration with the Norwegian University of Science and Technology, Molde University College, and a number of other research insitutions and manufacturing companies form different sectors.
The overall purpose is to strengthen the competitiveness of Norwegian companies struggling with high production costs. To realise this objective new principles for planning and managing the production of innovative products are developed. The project is organised around four key areas appointed by the participating companies:
1. Value chain design and localisation. 2. Innovation through production networks.3. Future forms of production. 4. Use of ICT to increase effectiveness.
iKuben defines the initiative as a competence project that aims to develop new knowledge. Hence, its ambition is to develop knowlegde on how to implement ICT across the entire value chain, thereby making technology an organic part of the companies’ production and business development.
Manufacturng Network 4.0 is funded with NOK 20 mill. from The Research Council of Norway and NOK 5,6 mill. from companies.
iKuben receives an annual support around NOK 2 mill. from the public cluster program “Arena”, which is a part of the overall Norwegian Innovation Cluster Program.
See more on the webpage: http://www.ikuben.no/nb-no/omikuben.aspx
65 The joint research and development company Sintef Raufoss Manufacturing is the project manager for NCE Raufoss and acts furthermore as a technology and development hub for the cluster members.

92 Nordic Production
6.6 Policies in Sweden
Sweden has launched a number initiatives with the objective to develop digital technologies that can be applied within a range of industries.
The Swedish innovation agency VINNOVA has appointed manufacturing and ICT as “strategically important areas of expertise”. This focus has recently been reinforced as the Swedish parliament in the summer 2015 commissioned VINNOVA to promote digitalisation within the Swedish industry. Thus, VINNOVA has allocated SEK 22 million to map the current digital situation of Swedish industry. Based on this VINNOVA will work out a strategy to adress industrial needs within digitalisation.
In 2013, a constallation of actors from industry and academia – with the industry association Teknikföretagen as a lead partner – worked out a strategic innovation agenda Made in Sweden 2030. The vision was to assure Sweden will obtain a leading position within sustainable and innovative manufacturing in 2030.
The agenda is enacted with support from VINNOVA by means of the innovation program Produktion2030. The ambition of the program is to strengthen the use of digital technologies within the Swedish manufacturing industry through funding of collaborative research and development projects. See box 6.8.

Nordic Production 93
Box 6.8. Production2030
Production2030 is an open innovation program where project consortia consisting of researchers and companies can apply for funding of research and development projects lasting up to a maximum of five months. The program particularly targets innovative SMEs within manufacturing (“early adopters”).
The projects can apply for a maximum of SEK 500,000 and government support must not exceed 67 percent of the project’s total budget. Projects with particular high potential have the opportunity to apply for additional funding. The fund calls for proposals once a year.
The grants can be used to develop and test new ideas that have great market potential but also contain more risks than ordinary research projects. For instance, the projects evolve around developing new digital concepts, methods and prototypes for production purposes.
In order to diffuse the results, the program also initiates the following activities:
• Tests and demonstration of knowledge and technology through a dividendprogram for scientific researchers and companies within the projects.
• Dissemination of results to SMEs through collaboration with SME-orientedclusters.
Partners in the program are the Innovation Agency VINNOVA, the Swedish Energy Agency and the Research Council Formas. At this point, three application rounds have taken place. The total budget from the last round was SEK 8 mill.
See more on the webpage: http://www.produktion2030.se/en/vision-agenda
Another VINNOVA funded initiative is the challenge-driven innovation project STREAM. The project aims to create new and competitive solutions within automation through collaborative projects with participation of three leading industrial companies. These solutions will have a generic form that makes them applicable throughout the whole industry and thereby strengthen Sweden’s strong global position within automation. Thus, the aim is to use the results to develop new automation solutions that can be used in Swedish manufacturing. See box 6.9.

94 Nordic Production
Box 6.9. STREAM – Innovations for Sustainable, Smart, and Efficient Automation
STREAM evolves around three case studies carried out in a collaboration between researchers and the industrial companies ABB, Bombardier, and Prevas. These companies are highly specialised within the fields of industrial IT and automation technologies (“innovators”).
The three projects focus on developing new technologies based on big data. The studies focus on:
• Developing a tool for maintenance of automated cranes in containerterminals by using the logs of performance data and error messages todetect faulty cranes and to predict the productivity loss associated withthose cranes.
• Optimising effectiveness of modern trains by developing demonstratorstelling the driver which speed is the most economical given other nearbytrains, constraints on timely arrival, speed limits, etc.
• Developing an extended furnace heating time prognosis for soaking pits byintegrating an energy model inside the furnace.
Based on results of the three case studies, STREAM builds up a toolbox of generic models that are applicable throughout the whole automation industry. These include architecture for connecting developed modules, methodologies for solving industrial problems, and business models for new services and products.
STREAM covers the period 2012–2017. VINNOVA has supported the project with SEK 20.5 mill.
See more on the webpage: http://www.produktion2030.se/en/vision-agenda
Finally, VINNOVA also supports regional development within automation and ICT through funds to the collaborative platform Process IT Innovation. The objective of the platform is to develop a leading innovation environment within digitalisation and automation in Northern Sweden by increasing the competitiveness of the regional ICT suppliers. See box 6.10.

Nordic Production 95
Box 6.10. Process IT Innovation
Process IT Innovation is a collaborative cluster platform established to foster regional growth through digitalisation and automation in Northern Sweden. The region faces a number of developmental challenges (e.g. emigration) and is dominated by traditional businesses within the primary sectors (forestry, mining etc.). However, the region also features an emerging ICT cluster around Luleå and Umeå. For example, Luleå is the location of Facebook’s Nordic data centre.
The target group of Process IT Innovation is the entire manufacturing sector, but with a particular focus on the primary sector of Northern Sweden.
The core task of the platform is to facilitate a number of research and development projects, which brings researchers and ICT companies together with manufacturing industries and their suppliers. The focus of the research projects is to identify concrete solutions to challenges regarding digitalisation and automation in manufacturing and in primary sectors. In particular, internet-of-things, e.g. for tracking purposes, is a key focal area.
Process IT Innovation has a combined budget, including industrial co-funding, of approximately SEK 41 mill. in 2014. The platform is supported by VINNOVA, which has awarded Process IT Innovation as winner of the regional program Vinnväxt.
See more on the webpage: http://www.processitinnovations.se
6.7 Policies in UK
UK has experienced the biggest decrease worldwide in manufacturing. Since the early 70ties, manufacturing’s share of GDP in UK has dropped from 30 percent to just 10 percent. Three million people work in British manufacturing, as opposed to nine 9 million people in the 60ties.
On the other hand, UK still has industrial strongholds within aircraft industry, automotives, pharma and the process industry.
Furthermore, there is a strong political will to support manufacturing, hence, manufacturing continues to be perceived an important driver for growth in UK. The sector still represents 70 percent of investments in research and development and 53 percent of UK exports.
The central public authority in UK is Innovate UK, which is an agency under the Department for Business, Innovation and Skills. Innovate UK invests annually GBP 440 mill. in bringing research and new knowledge to market through innovative projects.

96 Nordic Production
The support of Innovative UK is divided into a number of sub themes with “High value manufacturing” as the second largest. This group received GBP 72 mill. in 2014 under different schemes ranging from small innovation vouchers to companies and collaborative research and development projects. A big share of the projects concerns the development of digital technologies and production technologies, including automation.
The most important UK policy, with regard to digitalisation and automation in manufacturing, is the Catapult Centres. These centres were established in 2012 and represent a huge investment in raising the technological level in British industries. The overall aim is to bridge the gap between new research and use of knowledge and technologies in the business sector.
The centres contain new technology that is partly financed by government and partly financed by sponsors (big companies). They supply a number of services, which include:
• Advisory services to SMEs provided by specialist, including bothexperts employed at the centres and associated researchers.
• Cooperative projects often co-financed by Innovate UK.• Test and demonstration.• Access of state-of-the art technologies for development projects.• Early use of new technology in order assess relevance and to
develop business cases.
One of the Catapult centres is HVM (High Value Manufacturing) Catapult. The overall objective of HVM Catapult is to help manufacturing companies of all sizes to develop and test new technology. It removes some of the risks in innovation and technology implementation by providing access to open source technology, which include robots and other automation techniques. See box 6.11.

Nordic Production 97
Box 6.11. High Value Manufacturing Catapult – provides access to state of the technology
HVM Catapult invests in development and maturing new technologies within 22 areas, e.g. informatics, automation, electronics, visualisation, 3D printing and internet of things. It consists of seven independent centres placed in different parts of UK and it targets all manufacturing companies. However, in reality advanced companies (“innovators” and “early adopters”) use the services to implement new technologies.
More than 1,500 companies make use of the centres’ services annually, and they serve as hosts for 1,000 innovation projects annually.
Automation is a focal area in all seven centres. The overall goal is to develop a new generation of advanced manufacturing automation systems in order to automate complex manufacturing processes. This includes the development of advanced robotic manipulators, which are used in assembly and digital logistics systems.
The seven centres have established a common Automation Forum that works with manufacturers to provide simpler methods to implement automated systems in SMEs. Thus, the use of robotics and other technologies in complex production of high value goods in small batches are key focal areas – and are supported by pooling competences of the different centres.
The total revenue of HVM Catapult was GBP 224 mill. in 2014.Approximately 25 percent comes from basic financing, hence Innovate UK, while 45 percent are revenue from companies. The rest is provided via public tenders of innovation funds for collaborative projects (under Innovate UK).
Another important Catapult Centre is The Digital Catapult. The overall goal of the centre is to accelerate the way to market for UK’s best digital ideas. It focuses on issues like Internet of Things, innovative use of data and data-driven business models. While the centre has a broader focus than manufacturing, the catapult still plays an important role in developing tomorrow’s intelligent products in UK’s manufacturing sector (i.e. for tracking and traceability).
Another specific feature of the UK business support system is advisory services tailor made to manufacturing. The scheme Manufacturing Advisory Service plays a decisive role in the efforts to stimulate growth and competitiveness in manufacturing SMEs with growth potential. The scheme has existed since 2002. It focuses on many issues, including digitalisation and automation. We have included the example since it is the only business support initiative in the seven countries focusing explicitly on the manufacturing sector. See box 6.12.

98 Nordic Production
Box 6.12. Manufacturing Advisory Services (MAS) – tailor made services to manufacturing SMEs
Manufacturing Advisory Service is a program that aims to increase growth and profitability in UK manufacturing SMEs. The target group is all production companies (“followers” using the terms from chapter 5) with ambitions and potentials to grow. A consortium of four private companies with offices throughout the UK supplement the program.
The following services are supplied under MAS:
• Free, neutral advisory services based on a common tool – “Diagnostic Business Assessment”. Together with top management MAS identifies keygrowth challenges in the process. The service is supplied by a group of“business growth managers” with manufacturing background.
• Access to a network of manufacturing specialists (experts from privatecompanies) that can cooperate with the companies on issues identified viathe advisory service.
• Grants to companies (covers 50 percent of the costs that manufacturingspecialists may have).
• Workshops, seminars and short courses. • Reference to other business support providers, including Catapults.
The support is divided into three main areas – product development, operations (including productivity issues) and supply chain development.
The annual budget of MAS is GBP 25 mill. MAS is financed by Innovate UK. From 2015 MAS has become a part of a wider program Business Growth Services in order to create better coherence between public financed services to companies. But MAS is still an independent part of the larger program.
6.8 Policies in Germany
German manufacturers have for decades had a leading position when it comes to manufacturing of high-quality products and application of advanced technologies. Thus, Germany has been able to preserve a high amount of jobs in manufacturing (see chapter 2).
Leading German manufacturers like Siemens, BMW Group, and other industry champions have traditionally played an active role arguing for a strong focus on manufacturing in national research and innovation policy.
The national business and innovation policy has a strong focus on the future of manufacturing and the concept of “Industry 4.0”. This is

Nordic Production 99
reflected in the ambitious National High-Tech Strategy 2020 – a EUR 8.6 billion strategy for public-private funded research, development and innovation. Here, “Manufacturing of the future” and “Industry 4.0” are prioritised as one of ten high-profile “future projects”.
Under the umbrella Industry 4.0, a number of programmes and schemes have been initiated in order to establish the German manufacturing as a leading sector, compared to other nations’ manufacturing industry, and a provider of future manufacturing solutions.
Autonomics for Industry 4.0 is one of the key programmes aiming to integrate state-of-the-art ICT technology within industrial production. The overarching goal is to accelerate the development of innovative products and solutions. Thus, the program indicates an important step towards the implementation of Industry 4.0. See box 6.13.

100 Nordic Production
Box 6.13. Autonomics for Industry 4.0
Autonomics for Industry 4.0 program funds 14 development projects carried out in a close partnership between medium and large-scale industrial companies and researchers. The goal is to develop new digital technologies to be used in leading sectors. The participants are “innovators” and “early adopters”.
Besides support to research and development activities as well as activities within innovation, the program also offers services in a number of areas, including:
• Studies on the technological and economic potential of so-called cyber-physical systems in logistics and production, and transfer of the findings toproviders of automation technology.
• Monitoring through 1) assistance on creating networks with similarprojects 2) application and diffusion of projects findings in brief studies 3)involvement of partners with expertise and interest in crosscutting topics.
• Exploitation support through 1) analysis of market potentials for projectinventions, analyses of competitors/target groups/value chains, as well aspossible partnerships 2) mapping of barriers 3) translation of projectresults to viable business models.
• Transfer of results through 1) preparation and diffusion of results atworkshops, conferences, trade fairs, etc. 2) coordination of thecommunication of projects in order to achieve a uniform image andrecognition of the overall program.
The Federal Ministry for Economic Affairs and Energy funds Autonomics for Industry 4.0 program with a total of EUR 65 million. The individual projects could apply for funding up to EUR 40 million.
See more on the webpage: http://www.autonomik40.de/en/1559.php
The Industry 4.0 umbrella also covers programs supporting demonstration, testing and commercialisation of new technologies, among others, within four demonstration factories. The most ambitious of these initiatives is Smart Factory KL.
The purpose of Smart Factory KL is to support the development and application of state-of-the-art automation technology in different sectors, as well as providing a basis for their diffusion across industries. See box 6.14.

Nordic Production 101
Box 6.14. Smart Factory KL
Smart Factory KL was founded in 2005 as a public-private partnership between vendors and users of modern automation technology, as well as representatives of public interests.
The factory contains several modular pilot plants where both state-of-the-art technologies and cutting-edge research results can be developed and adapted into market-ready products.
The factory provides a number of services to its partners, including:
• Realistic research and demonstration plants that allow initial tests of newtechnologies, control architectures, and components.
• Coordination of collaborative research and development by 1) identifyingresearch interests 2) checking possibilities for project funds 3) formingcompetent project consortia 4) recruiting experienced experts and/orthesis students in the implementation of the project.
• Consulting services focusing on the transfer of results achieved inapplication-oriented research projects into industrial practice.
• Realization of industry 4.0 business models by initiating and supportingnational and international projects that draw up the first publicly availableICT standards.
• Promoting knowledge on current research and ideas by organizing publicactivities such as trade fair appearances, conference papers, scientificpublications, and press work.
Smart Factory KL has received a subsidy of EUR 220 mill. from the Federal Ministry of Economic Affairs and Technology and the Federal Ministry of Education and Research.
See more on the webpage: http://www.smartfactory-kl.de
Furthermore, Germany contains several regional clusters and initiatives that address elements of Industry 4.0 and are co-financed by federal cluster programs. The most ambitious regional initiative, measured by the number of actors involved and the amount of funding available for collaborative innovation, is the It’s Owl project.
It’s Owl is an extensive regional technology network that aims to secure the OstWestfalenLippe region a leading position among the global competitors in the field of intelligent technical systems, and furthermore realizing the vision of Industry 4.0.

102 Nordic Production
Box 6.15. It’s Owl
It’s Owl was founded in 2011. The network consists of 174 businesses, universities and research institutions working together on 46 projects. The primary activities of It’s Owl evolve around initiating three types of projects:
• Cross-sectorial projects where universities, research institutes, andbusinesses are developing new technologies and methods for intelligenttechnical systems.
• Innovation projects in which companies and research institutes areworking together to create new market-ready products, productionsystems and services based on the technologies and methods developed inthe cross sectional projects.
• Sustainability initiatives to ensure that the development process (achievedthrough the above-mentioned projects) does not lose momentum oncefunding has expired, thus helping companies to become more competitive.
Aside from the 46 projects, It’s Owl provides a number of services, including project coordination, technology transfer services and diffusion of knowledge from the projects through conferences and events.
Its Owl receives an annual support of EUR 40 mill. from the Federal Ministry of Education and Research over a period of five years.
See more on the webpage: http://www.its-owl.com/home/
6.9 Summary and discussion
6.9.1 Summary
The review of national policies furthering digitalisation and automation in manufacturing shows a lot of variation in the approaches. Unfortunately, only very few evaluations have been made yet, which makes it difficult to compare and assess the different approaches and initiatives.
Moreover, differences in industrial structure and specialisation indicate that specific approaches might work better in some countries than in others.
In the following, we sum up the most important differences between the seven countries.

Nordic Production 103
Magnitude of efforts First of all there are huge differences in the magnitude of the economic efforts. Compared to the size of the economies, Finland invests by far the most in programmes and initiatives stimulating automation and digitalisation. The three most important initiatives in Finland (DIGILE, Industrial Internet and 5th Gear) receive approximately EUR 200 mill. from TEKES. To compare this, the three key initiatives in Denmark receive EUR 15 mill. in public support (including EU funds). The Swedish key initiatives received a little more in public funds than the Danish initiatives.
Germany and UK also invest a lot of the public funds in digitalisation and automation (compared to the size of their economies). In UK, the public funding has been allocated to invest in state-of-the-art technology and equipment in the Catapult centres.
Focus As illustrated in section 6.1, clear differences in the focus of the policies exist.
All countries invest a high proportion of their means in activities that are relevant for early adopters. Thus, access to test and demonstration facilities, as well as funds for projects with the objective to develop concrete technical solutions to be applied in sectors and companies, are a common feature in all countries.
Denmark and UK are the only countries that supply programmes specific geared towards digital followers. The main target groups of “Manufacturing Advisory Services” in UK and “Vækstløft” in Denmark are a wide range of companies that consider investments in new technologies at a mature stage.
On the other hand, Finland and Germany concentrate on applied research within digitalisation and automation that mainly have innovators as participants. However, it is important to mention that these means are used in programmes that also focus on diffusion and communication of results to a broader part of the business sector.
Furthermore, among countries there exist differences in the scope. Finland invests a great part of the public means in new digital business concepts like Industrial Internet and Internet-of-things. At the same time, the competitiveness of the Finnish ICT-sector is a key focus in the overall strategy and thinking.
In the other countries, a broad focus on manufacturing is combined with more distinctive projects and schemes focusing on, among others, Internet-of-things and different industrial strongholds.

104 Nordic Production
Means The review has also shown some differences in the use of means.
Some of these differences are, of course, closely linked to the differences in focus. Advisory services and use of diagnostic tools are common in Denmark and UK due to the focus on followers in these two countries. Competitive means for applied research are used in most of the programmes in Germany and Finland.
A distinct feature of the initiatives in Germany and UK is the effort to build up a strong infrastructure and knowledge centres that build up and accumulate knowledge. The Nordic countries invest more in temporary programmes, in which more insecurity exist regarding implementation and use of the accumulated knowledge after the expiration date of the programmes.
As the only country, Denmark has made use of tailor made education and technical schools in the efforts to build up competences and spurring digitalised or automated investments among followers (KOMP-AD).
Finally, the use of cluster organisations as operators is common in some of the countries. Especially Norway supports digitalisation and automation through projects defined and facilitated by cluster organisations. The use of cluster organisations have a regional perspective in some countries – for instance Process IT Innovation in Sweden that focus on digitalisation in strong sectors in the Northern part of Sweden. Cluster organisations might have better preconditions for identifying early adopters and for diffusing and communication results to other companies.
6.9.2 Discussion and perspectives
This section discusses the key findings of the review and outlines areas where mutual learning and cooperation might be of relevance for the Nordic countries.
The discussion is structured according to the three main target groups – followers, early adopters and innovators.
6.9.3 Technology diffusion among the followers
According to the analysis in chapter 4 (see table 4.1), most Nordic countries can potentially obtain 20 percent gain in productivity through a more widespread exploitation of existing digitalisation and automation technologies in the manufacturing sector.

Nordic Production 105
It is important to keep in mind that a significant fraction of the manufacturing companies in the Nordic countries is at a low or basic level of digitalisation. Especially in Finland, Norway and Sweden.
Thus, a deliberate policy that focus on expansion of the group of followers by accelerating technology diffusion might play a key role in realising productivity gains, as well as strengthening the competiveness of a broad range of SMEs.
Limited policy focus on technology diffusion among followers As described in chapter 5 the key barriers for digitalisation and automation among followers are 1) scares management resources, 2) access to capital and 3) lack of ICT-skills.
The review of policies showed that only few countries have a dedicated focus on expanding the group of technological followers.
This may be somewhat surprising keeping in mind 1) that the potential societal gains are significant and 2) the barriers, which prevent followers from investing in new technology, may be relatively easy to overcome.
Among the Nordic countries, Denmark stands out as having the strongest policy focus on technology diffusion. Here, a number of nationally funded and regionally anchored initiatives focus on stimulating SMEs to apply existing digital technologies to a larger extent. Also UK is characterised by a strong focus on technology diffusion through the Manufacturing Advisory Service program (MAS).
In both Denmark and UK, the programmes target the group of followers and supply free, neutral advisory services that focus on both general business development issues, and digitalisation and automation issues. In UK the MAS programmes have been evaluated as successful.
It is important to notice that digitalisation and automation are often connected to other issues, and development of new business is a driver for digitalisation (see chapter 2). Thus, future advisory service should have a broad scope, in order to secure digital investments are integrated into other business decisions perspectives.
Key areas for further Nordic collaboration related to followers The combination of significant economic potentials in all Nordic countries and a diverse policy focus across the Nordic countries indicate that stronger collaboration and exchange of experiences on how to motivate further investments in digitalisation and automation and stimulate technology diffusion could be beneficial.

106 Nordic Production
Enhanced collaborative efforts in the Nordic countries could evolve around issues like:
• Access to ICT-skills: Access to relevant ICT-skills is a key challenge fordigitalisation and automation in manufacturing across all Nordiccountries (see chapter 4).Regional knowledge institutions should play a key role in supplyingup-to-date technology skills in order to enhance digitalisation,competitiveness and job-creation – also in the more rural areas.In general, initiatives that address the need for ICT-skills inmanufacturing industries are few.Thus, it might be relevant to engage in closer cooperation at theNordic level to figure out how regional education institutions canplay a more prominent role in supplying with competences and skillsneeded. Joint effort at the Nordic level could be on issues like:o How to motivate more young people to acquire competences
within technology, engineering and business development.o How to develop vocational training and advisory services on
digitalisation and automation for managers in manufacturingSMEs.
• Effective advisory services: Focus could be on joint analyses andcapacity building focusing on issues like;o Good practice in approaching and motivating manufacturing
companies to apply existing technologies, e.g. focus on diagnostictools, competencies of suppliers, design of relevant services.
o Mapping of potentials for automation and digitalisation acrosskey manufacturing industries.
o Common evaluations or development of common evaluationpractise.
• Joint training programmes for practitioners working in the fieldrelated to technology diffusion. Focus could be on;o Workshops and seminars that emphasise the importance of
developing common diagnostic tools and to share experiencesand approaches to coach SMEs.
o Joint study trips for Nordic policymakers and practitioners.’

Nordic Production 107
6.9.4 Test and demonstration for early adoptors
All Nordic countries strive to maintain a strong position among EU-countries regarding digitalisation and automation in the manufacturing sector.
Staying at the digital forefront requires a critical mass of early adoptors, specialised knowledge partners, test facilities, experienced investors etc. Thus, a key challenge for the Nordic countries is to set up efficient framework conditions for developing, testing and applying new technologies among early adopters.
As highlighted in chapter 5 key barriers and challenges among early adoptors are related to establishing convincing business cases, access to risk capital, issues on data and data security, access to ICT specialists and access to prototyping facilities.
All Nordic countries have initiated policies that support technological development of companies that enhance the transformation of firms into early adopters.
The review of policies that target this group shows significant cross-country differences in policy design. The policies differ on a number of key parameters:
• Funding: Huge variation in the amount of funding exists across theNordic countries (see section 6.9.1).
• Target group: In some countries, policy initiatives focus on specificindustries or technologies (e.g. “5th Gear” in Finland). Othercountries have a broader scope and initiatives are open for earlyadopters from all sort of industries (e.g. “MADE” in Denmark)
• Means: Some initiatives exclusively provide funding, while otherinitiatives provide support services and are actively engaged infacilitating collaboration among companies from different parts ofthe value chain and relevant researchers. Furthermore, someinitiatives are focused at developing physical facilities (test beds,pilot factories, etc.) providing equipment and digital expertiseaddressing needs among early adoptors.
• Organisation: Some programmes are administered by nationalagencies. In other cases, a cluster organisation or a researchinstitution is responsible for the management of grants.
Most of the initiatives, which address early adopters, have been initiated recently, hence only few initiatives have yet been subject for evaluation.

108 Nordic Production
Thus, we generally know very little about the strengths and weaknesses of the different policy designs, and about the characteristics of efficient initiatives addressing the needs of early adopters.
The fact that all Nordic countries are actively engaged in the creation of strong ecosystems, that accelerate development among early adoptors, and because this is a relatively novel policy area, there might be significant potential in sharing experiences regarding best practice policy in this field.
Enhanced collaborative efforts among the Nordic countries could evolve around issues like:
1. Efficient ecosystems for early adopters A common key challenge in the Nordic countries is to find the right mix of policy means and efficient policy designs to facilitate the development of ecosystems of knowledge, expertise, test facilities and risk funding for the group of early adopters. This is especially a challenge in the less densely populated regions.
Joint Nordic initiatives could centre on how national and regional initiatives most efficiently can support facilities for test and design of convincing business cases, engage local investors and business angels, securing ICT-expertise, prototyping facilities, etc. outside the big cities.
2. Formalised exchange of experiences and good practice across the Nordic countries Joint initiatives in this field could be related to issues like:
• Good practice in grant management, funding principles,
competences and resources needed in order to spur test and demonstration among early adopters.
• Development of common evaluation designs for all Nordic countries, focusing on both programme evaluation and benchmarking of programmes.
3. A Nordic strategy for the development and expansion of test and demonstration facilities The strategy could focus on:
• Possibilities for “smart specialisation” among Nordic test and
demonstration facilities. • Guidelines for how to share expertise and resources across Nordic
test facilities.

Nordic Production 109
6.9.5 Applied research and development targeted innovators
Investments in applied research and development in digitalisation and automation in the Nordic countries are at a relatively modest level – except for Finland. It is questionable if the Nordic countries, like Sweden, Denmark and Norway, invest sufficiently to fulfil their ambitions and economic potentials.
The two benchmark countries invest huge amounts of money in technology development and state-of-the-art equipment in order to develop and define the general-purpose technologies for Industry 4.0.
In many cases, the Nordic countries are too small and the public funding too limited in order to engage in direct competition with the world’s largest industrial nations in this field.
Thus, the Nordic countries share a common challenge in defining the niches where they have a potential to become world leaders.
Typically, this requires policymakers and leading innovative companies to agree in joint strategies for applied research and development that combine manufacturing strongholds and research in new digital technologies.
A number of areas for enhanced collaboration among the Nordic countries exist in order to build the foundation for future manufacturing strongholds.
Enhanced collaborative efforts among the Nordic countries could evolve around issues like:
• Collaborative effort among Nordic manufacturers, researchers etc. inorder to attract research, development, and innovation funding underEUs Horizon 2020 programme.Collaboration could be on issues like;o Means for strategic alignment of research priorities among
researchers and manufacturing enterprises.o Alignment of national strategies for investments in Industry 4.0
across the Nordic countries.o Joint applications for EU funding to research and development
under Horizon2020.• Joint Nordic collaboration with international “technology-hotspots”
related to Industry 4.0.o Nordic partnerships with Catapult Centres in UK and Pilot
Factories in Germany.


Literature
Denmark Kromann, L. & Sørensen, A. (2013). Hvor automatiseret er den danske
fremstillingsindustri?. Frederiksberg: CEBR og CBS. Web:http://www.cbs.dk/files/ cbs.dk/call_to_action/resnote_-_hvor_automatiseret_er_den_danske_ fremstillingsindustri_-_v3_bred_1.pdf
Dansk produktionsunivers A/S (2015). Styrket Automatisering og Digitalisering af Små og Mellemstore Virksomheders Produktionsprocesser. Web: http://www.danskproduktionsunivers.dk/wp-content/uploads/2015/11/Rapport.pdf
Lyngsø Madsen, A. (2014). Stort potentiale for flere robotter i industrien. Dansk Metal. Web:http://www.industriensuddannelser.dk/public/dokumenter/Seminar/2014/Konference/DM-analyse%20Stort%20potentiale%20for%20flere%20robotter% 20i%20industrien.pdf
Werner Andersen, C. & Kristensen, S. & Vind, I. (2013). Industriens udvikling 2000-2012. Danmarks Statistik. Web: http://www.dst.dk/da/Statistik/ Publikationer/VisPub?cid=19571
IDA (2014). Automatisering i industrien. Web: https://ida.dk/sites/prod.ida.dk/ files/ida_analyse_-_automatisering_i_industrien.pdf
IRIS Group (2015). Når produkter og service smelter sammen. Web:https://www.lo.dk/kontakt/Bestilpublikationer/Erhvervspolitik_forskn_Innovation/~/media/Publikationer/Publikations%20filer/Erhvervspolitik/3200_Når%20produkter%20og%20service%20smelter%20sammen_2015.ashx
IRIS Group (2013). Digitalisering af dansk erhvervsliv. Web:http://irisgroup.dk/wp-content/uploads/2013/04/Digitalisering-i-dansk-erhvervsliv-final.pdf
IRIS Group (2013). Big data som vækstfaktor i dansk erhvervsliv. Web: https://erhvervsstyrelsen.dk/sites/default/files/big-data-som-vaekstfaktor.pdf
Produktionspanelet (2015). Gode jobs. Web: https://www.evm.dk/nyheder/ 2015/15-05-13-produktionspanel-anbefalinger
IRIS Group og Syddansk Universitet (2012). Fremtidens industri i Danmark. Udarbejdet for Reg-Lab. Web: http://www.viauc.dk/hoejskoler/tmh/ virksomheder/Documents/fif/fremtidens-industri-i-danmark-reglab-rapport.pdf
Teknologisk Institut (2013). De skjulte helte – Produktivitetssucceser i dansk industri. Web: http://ufm.dk/publikationer/2013/filer-2013/de-skjulte-helte-020913.pdf
Finland Digile (2014). Digibarometri 2014. Web: http://digibarometri.fi/files/2014/02/
Digibarometri-2014.pdf
European Commission (2015). Country Report Finland. Web: http://ec.europa.eu/economy_finance/eu/countries/finland_en.htm
European Commission (2015). Digital Economy and Society Index. Country Profile Finland. Web: https://ec.europa.eu/digital-agenda/en/desi

112 Nordic Production
FIMECC (2012), Competitiveness through cooperative research. Strategic research agenda for Finnish metals and engineering competence cluster. Web: http://www.fimecc.com/sites/www.fimecc.com/files/FIMECC_SRA2012_300112_0.pdf
Federation of Finnish Technology Industries (2014). Finnish Industrial Internet Forum. Technology growth paths for Finnish companies. Web: http://www.tekes.fi/ globalassets/global/ohjelmat-ja-palvelut/ohjelmat/teollinen-internet/iot-slush-2014/1_ismovessonen.pdf
Holmström, B., Korkman, S. & Pohjola, M. (2014). The nature of Finland’s economic crisis and the prerequisites for growth. Web: http://vnk.fi/documents/10616/ 339615/The+nature+of+Finland’s+economic+crisis+and+the+prerequisites+for+growth+-memorandum/07f3b69a-25cb-4347-a713-b0f91c23a931
Iskanius, P. & Muhos, M. (2013). ERP implementation in manufacturing SMEs – An empirical study. University of Oulu, Finland. Web: http://www.researchgate.net/ publication/253340744_ERP_implementation_in_manufacturing_SMEs_-_An_empirical_study
Lanz, M.(2014). Urban manufacturing digitalised – regional views. Web: http://www.lets2014.eu/fileadmin/content/presentations/02_Ppt_LET'S_Future_MinnaLanz.pdf
Ministry of Employment and the Economy (2013). Industrial competitiveness approach. Measures to guarantee economic growth in Finland in the 2010s. Web: https://www.tem.fi/files/37744/TEMjul_9_2013_web_17102013.pdf
TIEKE (2009). ICT cluster Finland review 2009. Web: https://www.tekes.fi/ globalassets/julkaisut/ictcluster09_net5b15d.pdf
Iceland Sigurdardóttir, R., Vignisdóttir, K. A., Isberg, G., Thórdarson, J., Alfredsdóttir, L. &
Gudmunds H. (2014). Economy of Iceland. Central Bank of Iceland. Web: http://www.cb.is/library/Skraarsafn---EN/Economy-of-Iceland/2014/ Heildarskjal_1.pdf
Einarsson, B. G., Emilsson, G., Haraldsdóttir, S.J., Klemensson, O. Q., Pétursson, T. P. & Sveinsdóttir, R. B (2013). The production and export structure of the Icelandic economy: An international comparison. Central Bank of Iceland. Web: http://www.cb.is/library/Skraarsafn---EN/Working-Papers/WP60_net.pdf
European Commission (2011). Screening report Iceland. Web: http://ec.europa.eu/ enlargement/pdf/iceland/key-documents/screening_report_26_is_internet_en.pdf
McKinsey (2012). Charting a growth path for Iceland. Web: http://www.mckinsey.com/ global_locations/europe_and_middleeast/denmark/en/latest_thinking
Norway IKT-Norge (n.d.). Digitalisering=produktivitet. Web:
http://produktivitetskommisjonen.no/files/2015/01/ikt_norge1.pdf
IMF (2013). Country Report, Norway. Web: https://www.imf.org/external/ pubs/ft/scr/2013/cr13272.pdf

Nordic Production 113
Logistikk & Ledelse (2015). Ny industry-revolusjon: Molde tar styringen. Nr. 7 – 2015, 28. årgang. Web: http://www.forskningsradet.no/servlet/ Satellite?blobcol=urldata&blobheader=application%2Fpdf&blobheadername1=Content-Disposition%3A&blobheadervalue1=+attachment%3B+filename%3D% 22240915FMIndustri40HIMBrunvoll15-07Pages(002).pdf%22&blobkey= id&blobtable=MungoBlobs&blobwhere=1274507091174&ssbinary=true
NCE Subsea (n.d). Oljeteknologiinudstrien – Norges nye fastlandsindustri. Web: http://www.bluemaritimecluster.no/download.aspx?object_id=D94E0CDD61CC45BE83BC8AF9049144FE.pdf
Rålm, P. C. (2014). Mat og industri 2014, Status og utvikling i norsk matindustri. NILF. Web: http://nilf.no/publikasjoner/Andre_publikasjoner/Mat_og_industri/ 2014/mat_og_industri_2014._status_og_utvikling_i_norsk_matindustri
Norsk Industri (2015). Konjunkturrapporten 2015. Web: http://docplayer.no/ 261837-Konjunkturrapport-norsk-industri-2015.html
Sintef (2009). Industriudvikling I Nordnorge frem mot 2030. Web: https://www.sintef.no/globalassets/upload/konsern/media/2009-08-21-industriutvikling-i-nord-norge-frem-mot-2030.pdf
Teknologirådet (2013). Made in Norway. Web: http://teknologiradet.no/wp-content/uploads/sites/19/2013/08/MadeinNorway_IX2OX.pdf
Quartz+co. (2012). Er industrien i Norge offensiv i bruken av virkemidler for å styrke egen konkurransekraft?. Web: http://docplayer.no/551414-Er-industrien-i-norge-offensiv-i-bruken-av-virkemidler-for-a-styrke-egen-konkurransekraft.html
Sweden Boston Consulting Group (2015). Launching a new Digital Agenda – How Sweden can
become the global leader in digitization and technology. Web: http://www.bcg.dk/documents/file191290.pdf
Boston Consulting Group (2014). Nordic Agenda – Transforming for the next wave of success. Web: http://www.bcg.fi/documents/file177061.pdf
Boston Consulting Group (2013). Digital Sweden. How consumers are setting the pace and creating opportunities for businesses. Web: http://www.bcg.dk/documents/file136019.pdf
Larsson, Ö. (2015). Future Smart Industry Perspektiv på industriomvandling. Blue Institute. Web: http://www.vinnova.se/upload/EPiStorePDF/vr_15_04_t.pdf
European Commission (2015). Country Report Sweden. Web: http://ec.europa.eu/europe2020/pdf/csr2015/cr2015_sweden_en.pdf
Fokus Industri (2014). Industrilandet Sverige. Web: https://www.ifmetall.se/ifmetall/ home/resources.nsf/vRes/if_metall_1299580918718_1webb_industrilandet_sverige_160x240_pdf/$File/1webb_Industrilandet%20sverige_160x240.pdf
Kommerskollegium (2011). Servicification of Swedish manufacturing. Web: http://www.kommers.se/Documents/dokumentarkiv/publikationer/2010/skriftserien/report-2010-1-servicification-of-swedish-manufacturing.pdf
MC Kinsey (2012). Growth and renewal in the Swedish Economy. Web: http://www.mckinsey.com/insights/europe/growth_and_renewal_in_the_swedish_economy

114 Nordic Production
Palludan, U. (2012). Danmark & Sverige – danskere og svenskere. Web: http://www.skane.se/Public/Skanes_utveckling/Interregional%20avdelning/Danmark-og-Sverige-Uffe-Palludan.pdf
PWC (2015). The Smart Manufacturing Industry – The Industrial Internet creates new opportunities for Swedish manufacturing companies. Web: http://www.pwc.se/sv/verkstad/assets/the-smart-manufacturing-industry.pdf
Switzerland Global Enterprise (n.d.) Sweden’s ICT market report. Web: http://www.s-ge.com/sites/default/files/private_files/ BBK_ICT_Market_Sweden_11_2013_1.pdf
Teknikföretagen, Swedish Production Academy, Swerea IVF, Chalmers KTH & IF Metall (2013). Made in Sweden 2030. Strategic Agenda for Innovation in Production. Web: http://www.vinnova.se/PageFiles/750915348/ Made%20in%20Sweden%202030-eng.pdf
Transverse literature Boston Consulting Group (2013). Revitalizing Nordic Manufacturing. Web:
http://www.bcg.dk/documents/file144513.pdf Jacobsen, J., Sørensen, A. & Junge, M. (2011). Digitalization and Productivity. CEBR. Web:
https://erhvervsstyrelsen.dk/sites/default/files/digitaliseringoproduktivitet.pdf
Kromann, L., Skaksen, J. R. & Sørensen, A. (2013). Automation og arbejdsproduktivitet. Web: http://www.aimprojekt.dk/files/automation-og-arbejdsproduktivitet.pdf
Deloitte (2015). The Internet of Things Ecosystem: Unlocking the Business Value of Connected Devices. Web: http://www2.deloitte.com/content/dam/Deloitte/global/ Documents/Technology-Media-Telecommunications/gx-tmt-Iotecosystem.pdf
Deloitte (2014). Industry 4.0 – Challenges and solutions for the digital transformation and use of exponential technologies. Web: http://www2.deloitte.com/content/ dam/Deloitte/ch/Documents/manufacturing/ch-en-manufacturing-industry-4-0-24102014.pdf
European Commission (2014). Digital Agenda Scoreboard. Web: http://ec.europa.eu/digital-agenda/en/digital-agenda-scoreboard
European Commission (2014). The EU ICT sector and its R&D performance. Web: https://ec.europa.eu/digital-agenda/en/news/scoreboard-2014-eu-ict-sector-and-its-rd-performance-2014
Germany Trade and Invest (2014). Industrie 4.0 – Smart manufacturing for the future. Web: http://www.gtai.de/GTAI/Content/EN/Invest/_SharedDocs/Downloads/ GTAI/Brochures/Industries/industrie4.0-smart-manufacturing-for-the-future-en.pdf
Hansen, M. T. & Birkinshaw, J. (2011). The Innovation Value Chain. Harvard Business Review. Web: https://hbr.org/2007/06/the-innovation-value-chain
INSEAD and World Economic Forum (2015). The Global Information Technology Report. Web: http://www3.weforum.org/docs/WEF_Global_IT_Report_2015.pdf
IRIS Group (2014). Vidensamarbejde under lup – evaluering af universiteternes erhvervssamarbejde og teknologioverførsel. Web: http://ufm.dk/publikationer/2014/filer-2014/vidensamarbejde-under-lup.pdf

Nordic Production 115
Lindholm, M. R. (2009). Scandinavian management model makes good bottom lines. Mandag Morgen. Web: https://www.mm.dk/scandinavian-management-model-makes-good-bottom-lines
MC Kinsey Global Institute (2012). Manufacturing the Future: The next era of global growth and innovation. Web: http://www.mckinsey.com/insights/manufacturing/ the_future_of_manufacturing
Manyika, J., Sinclair, J., Strube, G., Dobbs, R., Rassey, L., Mischke, J., Remes, J., Roxburgh, C., George, K., O´Halloran, D. & Ramaswamy, S. (2015). Compendium of Productivity Indicators. OECD. Web: http://www.mckinsey.com/insights/ manufacturing/the_future_of_manufacturing
Pilat, D., Cimper, A., Olsen, K. & Webb, C. (2006). The changing nature of manufacturing in OECD economies. OECD. Web: http://www.oecd.org/ science/inno/37607831.pdf
UK Government Office (2013). The Future of Manufacturing. Web: https://www.gov.uk/government/uploads/system/uploads/attachment_data/file/255922/13-809-future-manufacturing-project-report.pdf
UNIDO (2013). Industrial Development Report 2013 - Sustaining Employment Growth: The Role of Manufacturing and Structural Change. Web: https://www.unido.org/ fileadmin/user_media/Research_and_Statistics/UNIDO_IDR_2013_main_report.pdf
Roland Berger Strategy Consultants (2014). The digital transformation of industry. How important is it? Who are the winners? What must be done now? Web: http://docplayer.net/2139517-The-digital-transformation-of-industry.html

Digitalisation and automation in the Nordic manufacturing sector– Status, potentials and barriers
Ved Stranden 18DK-1061 Copenhagen Kwww.norden.org
Since the beginning nineties, the total employment in Nordic manufacturing has fallen with app. 500,000 persons. In spite of this fall in the employment level, manufacturing still has considerable importance for the Nordic countries. This shows for example in exports, research and development, growth in productivity and the development of rural areas. The report points that manufacturing is on the brink of a new era, called “Industry 4.0.” Tomorrow’s successful manufacturing business will be characterized by the way they are able to integrate new advanced production technology, especially digitalisation and automation. The report goes through status, barriers and political initiatives taken concerning digitalisation and automation in all of the Nordic countries. The report also brings recommendations to common Nordic initiatives and opportunities for co-operation on the area.
Digitalisation and automation in the Nordic manufacturing sector
TemaN
ord 2015:578
TemaNord 2015:578ISBN 978-92-893-4406-7 (PRINT)ISBN 978-92-893-4422-7 (PDF)ISBN 978-92-893-4408-1 (EPUB)ISSN 0908-6692
TemaN
ord 2015:578
TN2015578 omslag.indd 2 04-12-2015 11:07:08