Vattenfall 9M and Q3 Results 2021
27
Vattenfall 9M and Q3 Results 2021 28 October 2021
Transcript of Vattenfall 9M and Q3 Results 2021

Vattenfall 9M and Q3 Results 2021
28 October 2021

Vattenfall 9M Results 2021
2
• Higher electricity prices due to lower hydrological balance, lower wind speeds and
rising fuel and CO2 prices
• Higher electricity and gas prices resulted in temporary high cash inflows due to
increased margin calls received
• Inauguration of Scandinavia’s largest wind farm, Kriegers Flak in Denmark
• Underlying EBIT increased by SEK 4.3 bn to SEK 22.1 bn:
• Higher electricity production from nuclear and hydro power
• Strong contribution from the trading operations
• New wind power capacity in operation
• Profit for the period increased by SEK 39.9 bn to SEK 41.9 bn. Impact from
compensation for early shutdown of nuclear power in Germany, unrealised
changes in market value for energy derivatives and inventories and capital gain
from sale of Stromnetz Berlin
In brief

Vattenfall 9M Results 2021Overview
Result development Financial targets
Electricity production (TWh)
3
Customer sales (TWh)
SEK BN 9M 2021 9M 2020 Δ
Net Sales 116.6 114.8 2%
EBITDA 65.6 34.4 91%
Underlying operating profit (EBIT) 22.1 17.8 24%
EBIT 52.5 10.0 424%
Profit for the period 41.9 2.0 2007%
9M 2021 9M 2020
Return on capital employed (≥8%) 22.4% 4.7%
FFO/adjusted net debt (22-27%) 182.7% 27.9%
86.6
37.9
9.3
88.5
39.8
10.5
Electricity Gas Heat
9M 2020 9M 2021
16.5
28.4 29.3
7.8
0.2
13.4
29.0 30.5
7.5
0.2
Fossil power Nuclear power Hydro power Wind power Biomass, waste
9M 2020 9M 2021
Total
9M 2021 80.6 TWh
9M 2020 82.2 TWh
Customers & Solutions
Highlights Key data
4
Retail sales development Charging points for electric vehicles (thousand)
9M 2020
26.1
9M 2021
20.3
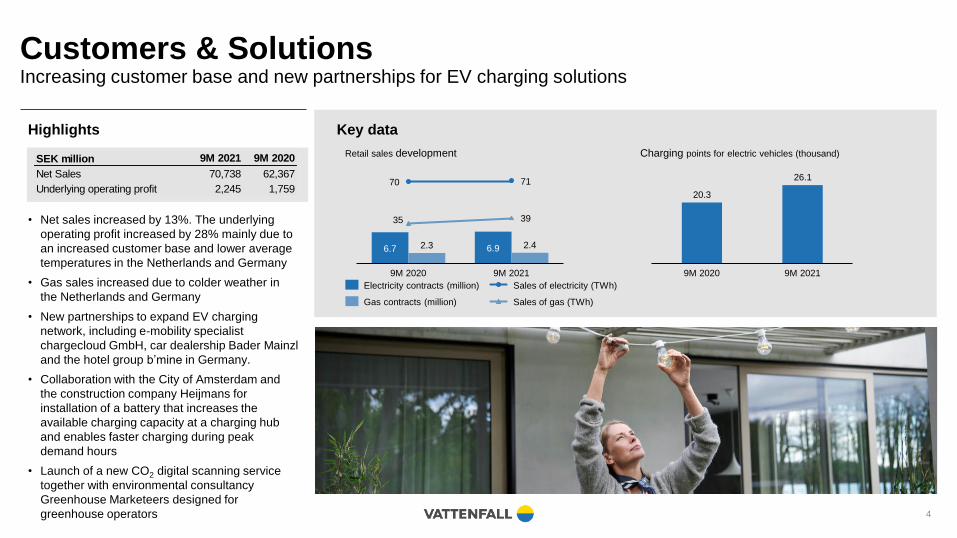
Increasing customer base and new partnerships for EV charging solutions
SEK million 9M 2021 9M 2020
Net Sales 70,738 62,367
Underlying operating profit 2,245 1,75970 71
35 39
9M 2020
6.96.7
9M 2021
2.3 2.4
Sales of gas (TWh)Gas contracts (million)
Electricity contracts (million) Sales of electricity (TWh)
• Net sales increased by 13%. The underlying
operating profit increased by 28% mainly due to
an increased customer base and lower average
temperatures in the Netherlands and Germany
• Gas sales increased due to colder weather in
the Netherlands and Germany
• New partnerships to expand EV charging
network, including e-mobility specialist
chargecloud GmbH, car dealership Bader Mainzl
and the hotel group b’mine in Germany.
• Collaboration with the City of Amsterdam and
the construction company Heijmans for
installation of a battery that increases the
available charging capacity at a charging hub
and enables faster charging during peak
demand hours
• Launch of a new CO2 digital scanning service
together with environmental consultancy
Greenhouse Marketeers designed for
greenhouse operators

0
20
40
60
80
100
120
140
EEX 2022 EEX 2023
ICE 2022 ICE 2023
NPX 2022 NPX 2023
Power GenerationIncreased hydro generation, higher availability for nuclear and higher electricity prices
Highlights Key data
5
Production and availability Nordic hydro balance and system price Electricity futures prices (EUR/MWh)
28.4 29.0
29.3 30.5
74.682.1
9M 2020 9M 2021
57.7 59.5
Nuclear availability (%)
Nuclear (TWh)
Hydro (TWh)
20210
200
400
600
800
1,000
-30
-20
-10
0
10
20
30
40
SYS (SEK/MWh, rhs)
Hydro Balance (TWh, lhs)
2020 2021
• Net sales increased by 13%. Underlying
operating profit increased by 34% mainly due to
higher realised trading result and increased
nuclear and hydro power generation. A lower
achieved price in the Nordic region, partly
affected by large price differences between
bidding areas in Sweden, had an offsetting
impact
• The average hedging price was EUR 6/MWh
lower and was partly mitigated by the spot price,
which was EUR 30/MWh higher following the
recent sharp rise in electricity prices
• Agreement with the chemicals company Nobian
to use its chlorine plant in Rotterdam to help
balance the electricity grid
• New power purchase agreement for the Arcadis
Ost 1 (250 MW) offshore wind farm in the Baltic
Sea
2020
SEK million 9M 2021 9M 2020
Net Sales 73,669 65,307
Underlying operating profit 14,398 10,729
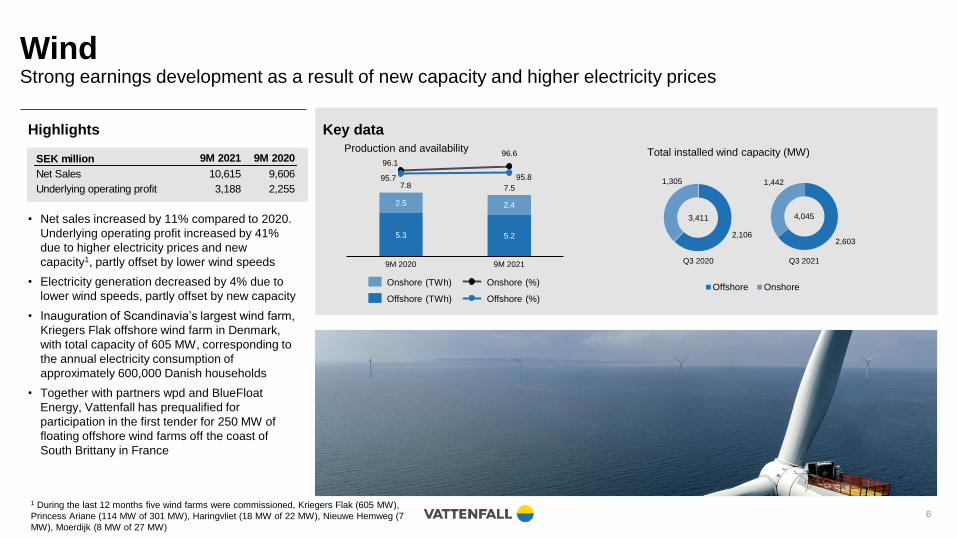
WindStrong earnings development as a result of new capacity and higher electricity prices
1 During the last 12 months five wind farms were commissioned, Kriegers Flak (605 MW),
Princess Ariane (114 MW of 301 MW), Haringvliet (18 MW of 22 MW), Nieuwe Hemweg (7
MW), Moerdijk (8 MW of 27 MW)
Highlights Key data
6
Offshore Onshore
Production and availability Total installed wind capacity (MW)
Q3 2020 Q3 2021
1,442
2,603
3,411 4,045
Onshore (TWh)
Offshore (TWh) Offshore (%)
Onshore (%)
5.3 5.2
2.5 2.4
96.1
96.6
95.7 95.8
9M 2020 9M 2021
7.8 7.51,305
2,106
• Net sales increased by 11% compared to 2020.
Underlying operating profit increased by 41%
due to higher electricity prices and new
capacity1, partly offset by lower wind speeds
• Electricity generation decreased by 4% due to
lower wind speeds, partly offset by new capacity
• Inauguration of Scandinavia’s largest wind farm,
Kriegers Flak offshore wind farm in Denmark,
with total capacity of 605 MW, corresponding to
the annual electricity consumption of
approximately 600,000 Danish households
• Together with partners wpd and BlueFloat
Energy, Vattenfall has prequalified for
participation in the first tender for 250 MW of
floating offshore wind farms off the coast of
South Brittany in France
SEK million 9M 2021 9M 2020
Net Sales 10,615 9,606
Underlying operating profit 3,188 2,255

Heat
Highlights Key data
7
Spreads1 (EUR/MWh)Sales and production
1.8 1.8
16.7
13.6
10.59.3
9M 20219M 2020
Customer base (million)
Heat sales (TWh)
Electricity generation (TWh)
-30
-20
-10
0
10
20
30
2020 2021
Clean Spark Spread NL Clean Dark Spread DE
Continued steps toward expansion of district heating networks
• Net sales increased by 22%. Underlying operating
profit increased by 232% as a result of the end of
commercial operation at the Moorburg plant,
higher sales of heat owing to lower temperatures
and a growing customer base
• In the Netherlands, Vattenfall will increase the
transfer capacity between AEB’s waste
incineration plant in Amsterdam and the partly
owned district heating network Westpoort Warmte
(WPW). The capacity will increase from 115 MW
to 255 MW.
• Vattenfall entered into a cooperation agreement
with Cory Environmental, one of the leading waste
management companies in the UK. The
agreement ensures access to 60 MW heat in
southeast London.
• In August the first district heat from the Carpe
Futurum district heating plant (112 MW heat) in
Uppsala was delivered.
1 CSS NL with 52% efficiency, CDS DE with 38% efficiency
SEK million 9M 2021 9M 2020
Net Sales 19,640 16,049
Underlying operating profit 638 192

Distribution
Highlights Key data
8
Service level (SAIDI, min)1 Customers and volumes Investments (SEK mn)
143
209
110
69
9M 2020 9M 2021
3,711
2,996
1,113781
99 63
9M 2020 9M 2021
Sweden
Germany
Network SolutionsSweden North
Sweden South
3,348
971
61.3 60.4
9M 20219M 2020
Transited volume (TWh)
Customer base (thousands)
1 All outages longer than 1 second in medium and low voltage networks are included.
Vattenfall’s Swedish network covers both urban areas and large rural areas.
Lower earnings due to price reductions and higher costs for the transmission network
• Net sales decreased by 12%. Underlying
operating profit decreased by 30% as a result of
lower gross margin in the Swedish operations,
mainly due to price reductions in local networks,
higher costs for the transmission networks and
network losses caused by higher electricity
prices
• Continued high inflow of connection requests,
both for the local and regional grids
• Ruling by European Court of Justice strengthens
position for Swedish electricity distribution
companies in ongoing legal process. It is now
clear that national regulatory authorities are to
have an uninfringed right to decide on tariff
structures
• A second pilot concluded ahead of the major
roll-out of new electricity meters to Vattenfall’s
900,000 customers, which will continue until
2025
Reduction in customer base due to
divestment of Stromnetz Berlin on 1 July 2021
SEK million 9M 2021 9M 2020
Net Sales 13,833 15,662
Underlying operating profit 2,693 3,870
Financials

Vattenfall 9M Results 2021Financial highlights
1 Last 12-month values
Key data Key developments
10
• Net sales increased by SEK 1.8 bn to SEK 116.6 bn due
to higher spot prices and higher sales volumes in the
Nordics and Germany
• Underlying EBIT increased by SEK 4.3 bn mainly due to
increased earnings in segment Power Generation due to
higher realised trading result and increased nuclear and
hydro power generation. Lower achieved prices in the
Nordics had an offsetting impact
• Profit for the period increased to SEK 41.9 bn, mainly
due to the agreement on compensation for the closure of
nuclear power in Germany, unrealised change in market
value for energy derivatives and inventories and capital
gain from sale of Stromnetz Berlin
• ROCE increased to 22.4% mainly due to unrealised
changes in market value for energy derivatives and
inventories, the agreement on compensation for the
closure of nuclear power in Germany and the capital
gain from Sale of Stromnetz Berlin. ROCE 9M 2020 was
negatively affected by impairments
• FFO/Adjusted net debt increased to 182.7%, mainly as a
result of a significant decrease in adjusted net debt
largely driven by a positive net change in margin calls for
commodity hedging activities
SEK bn 9M 2021 9M 2020
Net Sales 116.6 114.8
EBITDA 65.6 34.4
Underlying operating profit (EBIT) 22.1 17.8
EBIT 52.5 10.0
Profit for the period 41.9 2.0
Funds from Operations (FFO) 27.5 23.7
Cash flow operating activities 96.0 26.8
Net debt -47.3 58.9
Adjusted net debt 21.3 126.3
Adjusted net debt/EBITDA1 (times) 0.3 2.9
Financial targets
ROCE1 (≥8%) 22.4 4.7
FFO/adjusted net debt1 (22-27%) 182.7 27.9

Development of underlying EBIT 9M 2021Increase from Power Generation, Wind, Customers & Solutions and Heat partly offset by lower earnings in Distribution
Change in 9M 2021 vs. 9M 2020 Highlights
11
1.8
2.2
10.7
2.3
0.2
-1.0
3.9
9M 2020
14.4
3.2
0.6
17.8
2.7
Other -1.1
9M 2021
Customers & Solutions
Power Generation
Wind
Heat
Distribution
22.1
Underlying EBIT 9M 2021
17.8
Power Generation
0.5Customers & Solutions
3.7
0.9
0.4
-0.1
Distribution
Net other effects
22.1
-1.2
Heat
Wind
Underlying EBIT 9M 2020
Breakdown per operating segmentSEK bn SEK bn
• Customers & Solutions: increased customer
base and lower average temperatures in the
Netherlands and Germany
• Power Generation: higher nuclear and hydro
power generation and a higher realised
trading result countered by lower achieved
prices
• Wind: higher electricity prices and new
capacity, partly offset by lower wind speeds
• Heat: closure of the Moorburg plant, higher
sales of heat owing to lower temperatures
and a growing customer base
• Distribution: lower gross margin in the
Swedish operations, mainly due to price
reductions in local networks, higher costs for
the transmission networks and network losses
caused by higher electricity prices

Cash flow development 9M 2021Positive working capital development mainly related to changes in margin calls
1 ”Other” includes non-cash items included in EBITDA, mainly changes in fair value of
commodity derivatives12
-2.2
EBITDA
97.5
65.6
Change in WC
68.5
-24.5
Other1 Cash flow from
operating activities
-7.2
Maintenance
and replacement
investments
-10.688.8
Capital
gains/
losses, net
Growth
investments
-8.6
19.3
27.5
Divestments, net Cash flow before
financing activities
FFOInterest
paid/received, net
96.0
Tax paid
-2.7
Free cash flow
SEK bn
Main effects
• Change in working capital mainly driven by changes related to net change in margin calls received for commodity hedging activities (SEK 78.9 bn) following sharp price
increases for gas and electricity on the Continent. Increase in inventories (SEK -4.0 bn) and changes related to CO2 emission allowances (SEK -2.2 bn) had an
offsetting impact
• Growth investments mainly related to wind power

Capital expendituresMajority of investments directed to renewables and electricity networks
Investments per category, 9M 2021
13
54%
22%
5%
5%
8%
Wind, solar, biomass &
waste
Nuclear
Heat networks
Electricity
networks
Other1
3%
Fossil
Hydro3%
Detailed overview of investments, 9M & Q3 2021
SEK 17.3 bn
1 Mainly pretains to investments in immaterial assets
SEK bn 9M 2021 9M 2020 Q3 2021 Q3 2020
Hydro 0.5 0.6 -16% 0.2 0.2 -18%
Nuclear 0.8 1.4 -39% 0.3 0.4 -18%
Fossil 0.6 1.0 -46% 0.3 0.2 35%
Wind, solar, biomass &
waste9.3 5.4 72% 2.7 2.9 -7%
Electricity networks 3.8 4.9 -22% 1.0 1.6 -39%
Heat networks 0.9 0.8 12% 0.3 0.3 16%
Other 1.4 1.6 -15% 0.7 0.6 16%
Total 17.3 15.7 10% 5.4 6.1 -11%

Overview of key figures 9M and Q3 2021
1 Last 12-month values14
Amounts in SEK bn unless indicated
otherwise9M 2021 9M 2020 Q3 2021 Q3 2020
Net sales 116.6 114.8 36.1 35.4
EBITDA 65.6 34.4 27.3 9.2
EBIT 52.5 10.0 22.9 4.7
Underlying operating profit (EBIT) 22.1 17.8 4.8 4.8
Profit for the period 41.9 2.0 18.3 3.6
Electricity generation (TWh) 80.6 82.2 21.8 25
Sales of electricity (TWh) 123.2 120.1 37.8 37.9
- of which, customer sales (TWh) 88.5 86.6 28.2 26.9
Sales of heat (TWh) 10.5 9.3 1.3 1.4
Sales of gas (TWh) 39.8 37.9 5.3 5.9
Return on capital employed (≥8%) 22.4 4.7 22.4 4.7
FFO/adjusted net debt (22-27%) 182.7 27.9 182.7 27.9

Appendix

Development of adjusted net debt YTD 2021
1 Nuclear provision increased net by SEK 0.1 bn, whereof in Sweden by 1.3 offset by decrease in Germany by 1.2.2 SEK weakened against EUR (from 10.03 to 10.17); translation of EUR denominated net debt into SEK leads to increase in adjusted net debt
16
SEK bn
121.5
21.2
5.2
Adjusted net
debt Q4 2020
Cash flow from
operations
-96.0-1.5
Cash flow from
investments
-3.9
Provisions Dividend Other
1.0
Exchange rate diff
-5.1
Adjusted net
debt Q3 2021
-82%
Decrease due to
positive cash flow
from operating
activities (96.0),
mainly related to
net changes in
margin calls
received
Decrease due to
positive cash flow
from investments
(1.5)
Decrease due to
decreased pension
provisions (4.6) offset
by increase in
environmental
provision (0.6) and
nuclear provisions
(net 0.1) 1
Adjusted net debt decrease mainly due to positive cashflow after investments and decrease in provisions.
Decrease due to
other changes
(5.1)
Increase due to
weakened SEK;
Net debt
decrease (1.0) 2
Increase due to
dividend to
owners (4.0) and
minority owners
(1.2)

Debt maturity profile1
1 Short term debt (Repo’s and Commercial paper: 1.5), loans from associated companies,
minority owners, margin calls received (CSA) and valuation at fair value are excluded. Currency
derivatives for hedging debt in foreign currency are included.17
30 Sep.
2021
31 Dec.
2020
Duration (years) 4.6 3.8
Average time to maturity (years) 6.5 5.1
Average interest rate (%) 2.9 3.4
Net debt (SEK bn) -47.3 48.2
Available group liquidity (MSEK) 127.6 50.8
Undrawn committed credit facilities
(MSEK)20.3 23.1
Cumulative maturities excl. undrawn back-up facilities
2021-
2023
2024-
2026
From
2027
Debt incl. hybrid capital 12.4 15.4 38.0
% of total 19% 23% 58%
3.8
10.2
6.5
0.8
5.4
4.13.4
0.3
5.2 5.1 5.1 5.5
0.51.0
8.9
20.3
2021 2023 2025 2027 2029 2031 2033 2035 2037 2039 2041
Hybrid capital (first call date) Lease Debt (excl. hybrid cap) Undrawn back-up facilities
SEK bn

Price hedging
1 Nordic: SE, DK, FI2 Achieved prices from the spot market and hedges. Includes Nordic (SE, DK, FI) hydro, nuclear and wind power
generation18
Estimated Nordic1 hedge ratio (%) and indicative prices
69%
78%
41%
20222021 2023Average
indicative
Nordic hedge
prices in
EUR/MWh
28 29 28
Market quoted+/- 10% price impact on future profit before
tax, MSEK4
Observed yearly
volatility2022 2023 2024
Electricity +/- 606 +/- 1,382 +/- 1,252 19% - 25%
Coal -/+ 33 -/+ 43 -/+ 30 21% - 22%
Gas -/+ 39 -/+ 1,238 -/+ 972 16% - 33%
CO2 -/+ 34 -/+ 440 -/+ 446 38% - 39%
Sensitivity analysis – Continental3 portfolio
YTD 2021 YTD 2020 Q3 2021 Q3 2020 FY 2020 LTM
30 31 28 38 31 30
Achieved prices2 - Nordic portfolio
3 Continental: DE, NL, UK. 4 The denotation +/- entails that a higher price affects operating profit favorably, and -/+ vice
versa
Vattenfall continuously hedges its future electricity generation through sales in the forward and futures markets. Spot prices
therefore have only a limited impact on Vattenfall’s earnings in the near term

Liquidity position
1 German nuclear ”Solidarvereinbarung” 1.2 SEK bn, Margin calls paid (CSA) 1.8 SEK bn,
Insurance “Provisions for claims outstanding” 0.8 SEK bn2 Excluding loans from minority owners and associated companies 19
Group liquidity SEK bn
Cash and cash equivalents 67.6
Short term investments 63.8
Reported cash, cash equivalents & short
term investments
131.4
Unavailable liquidity1 -3.9
Available liquidity 127.6
Committed credit facilities
Facility size,
EUR bn SEK bn
RCF (maturity Nov 2023) 2.0 20.3
Total undrawn 20.3
Debt maturities2 SEK bn
Within 90 days 4.9
Within 180 days 3.2
91.987.2
97.5 93.8
84.288.3
99.6 101.793.8
97.6
113.8 114.8108.5 104.8
91.8 89.784.4
56.8 59.364.4
57.8
42.447.7
72.5 72.5
59.664.3
81.6
71.6
58.9
48.243.9
32.3
-47.3
113.3
124.4130.9
125.2
109.3 112.3
134.4 137.2
125.3132.0
148.3140.3
126.3121.5 122.2
104.5
21.3
-50
0
50
100
150
30.09.17 31.12.17 31.03.18 30.06.18 30.09.18 31.12.18 31.03.19 30.06.19 30.09.19 31.12.19 31.03.20 30.06.20 30.09.20 31.12.20 31.03.21 30.06.21 30.09.21
20
Net debtGross debt Adjusted net debt
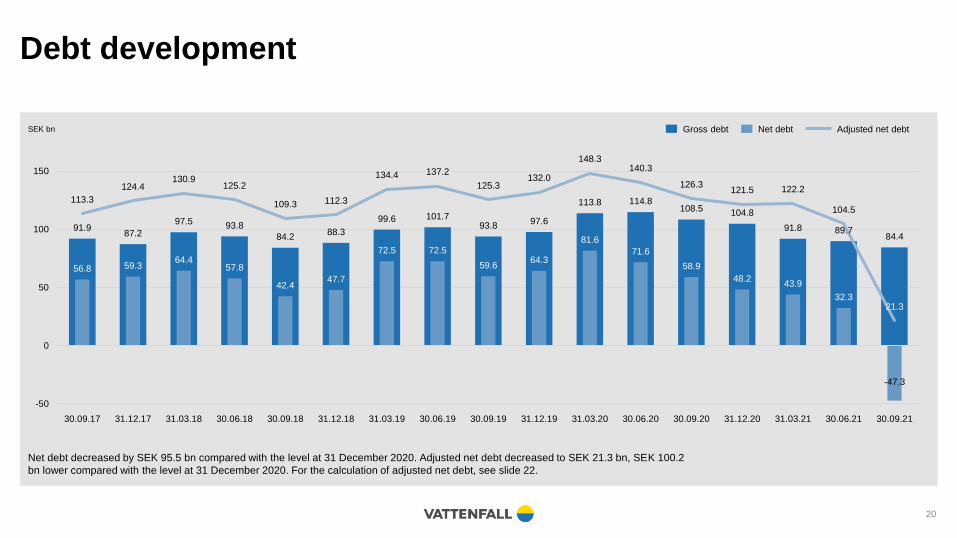
Net debt decreased by SEK 95.5 bn compared with the level at 31 December 2020. Adjusted net debt decreased to SEK 21.3 bn, SEK 100.2
bn lower compared with the level at 31 December 2020. For the calculation of adjusted net debt, see slide 22.
SEK bn
Debt development
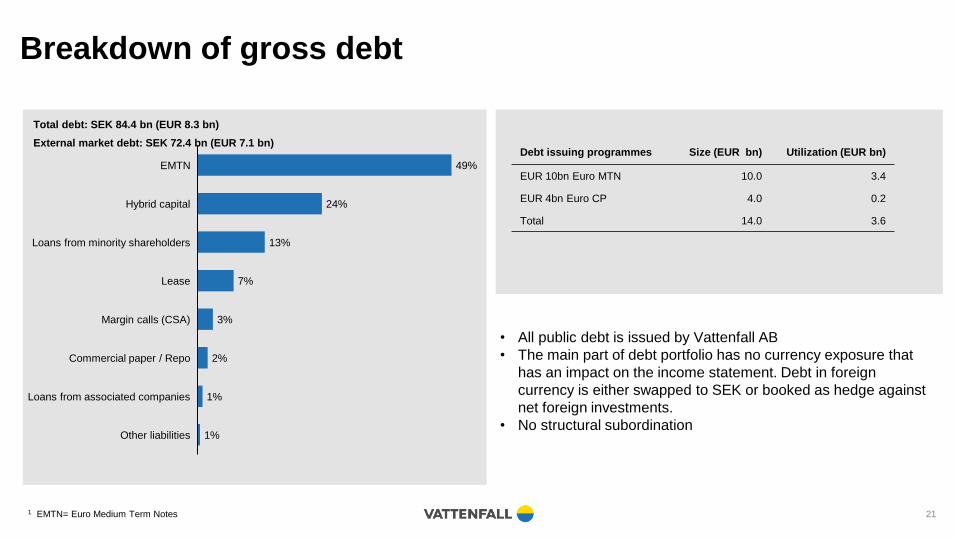
Breakdown of gross debt
1 EMTN= Euro Medium Term Notes 21
• All public debt is issued by Vattenfall AB
• The main part of debt portfolio has no currency exposure that
has an impact on the income statement. Debt in foreign
currency is either swapped to SEK or booked as hedge against
net foreign investments.
• No structural subordination
Total debt: SEK 84.4 bn (EUR 8.3 bn)
External market debt: SEK 72.4 bn (EUR 7.1 bn)Debt issuing programmes Size (EUR bn) Utilization (EUR bn)
EUR 10bn Euro MTN 10.0 3.4
EUR 4bn Euro CP 4.0 0.2
Total 14.0 3.6
Margin calls (CSA)
Hybrid capital
EMTN
Loans from minority shareholders
Lease
Other liabilities
Commercial paper / Repo
49%
Loans from associated companies
24%
13%
7%
3%
1%
2%
1%

Reported and adjusted net debt
22
Reported net debt
(SEK bn)
30 Sep.
2021
31 Dec.
2020
Hybrid capital 20.1 19.3
Bond issues and liabilities to credit institutions 41.2 49.6
Commercial papers and Repos 1.5 13.3
Liabilities to associated companies 1.1 0.7
Liabilities to minority shareholders 10.9 10.9
Lease liabilities 6.2 6.0
Other liabilities 3.3 4.9
Total interest-bearing liabilities 84.4 104.8
Reported cash, cash equivalents & short-term
investments131.4 56.2
Loans to minority owners of foreign subsidiaries 0.3 0.4
Net debt -47.3 48.2
Adjusted net debt
(SEK bn)
30 Sep.
2021
31 Dec.
2020
Total interest-bearing liabilities 84.4 104.8
50% of Hybrid capital -10.1 -9.7
Present value of pension obligations 39.2 43.8
Wind & other environmental provisions 11.2 10.6
Provisions for nuclear power (net) 37.9 37.8
Margin calls received -2.9 -4.1
Liabilities to minority owners due to consortium
agreements-10.9 -10.9
= Adjusted gross debt 148.9 172.3
Reported cash, cash equivalents
& short-term investments131.4 56.2
Unavailable liquidity -3.9 -5.4
= Adjusted cash, cash equivalents & short-term
investments127.6 50.8
= Adjusted net debt 21.3 121.5

Nuclear provisions
23
Reactor1 Net capacity
(MW)
Start (year) Vattenfall share (%) Vattenfall provisions, SEK
bn (IFRS accounting)
Vattenfall provisions,
SEK bn (pro rata)
Sw nuclear waste fund
SEK bn (Vattenfall pro
rata share)
Ringhals 1 879 1976 70.4
Ringhals 2 809 1975 70.4
Ringhals 3 1,070 1981 70.4
Ringhals 4 942 1983 70.4 Total Ringhals: 38.5 Total Ringhals: 38.52
Forsmark 1 984 1980 66.0
Forsmark 2 1,120 1981 66.0
Forsmark 3 1,170 1985 66.0 Total Forsmark: 33.8 Total Forsmark: 22.3
Total Sweden 6,974 - 77.73 64.03 43.54
Brunsbüttel 771 1977 66.7 11.1 7.4
Brokdorf 1,410 1986 20.0 0 3.6
Krümmel 1,346 1984 50.0 6.8 6.8
Stade5 640 1972 33.3 0 0.7
Total Germany 4,167 - - 17.9 18.5
Total SE & DE 11,141 95.6 82.4
1 Five reactors are in commercial operation in Sweden; Ringhals 3 & 4
and Forsmark 1, 2 & 3. Brokdorf is in commercial operation in Germany
(to be closed by year-end 2021)2 Vattenfall has 100% liability of Ringhals decommissioning, while owning
only 70.4%
3 Total provisions in Sweden (IFRS accounting) include provisions of SEK 0.6 bn (pro rata SEK 0.6 bn) related to
Ågesta, and SEK 4.8 bn (pro rata SEK 2.6 bn) related to SVAFO4 Vattenfall’s share of the Nuclear Waste Fund. IFRS consolidated value is SEK 51.8 bn.5 Stade is being dismantled

Items affecting comparability
24
Jan-Sep Jan-Sep Jul-Sep Jul-Sep Full year Last 12
Amounts in SEK million 2021 2020 2021 2020 2020 months
Items affecting comparability 30,431 - 7,772 18,144 - 75 - 10,514 27,689
- of which, capital gains 8,803 215 8,762 — 301 8,889
- of which, capital losses - 167 - 57 - 25 - 17 - 241 - 351
- of which, impairment losses — - 10,533 — 68 - 12,980 - 2,447
- of which, provisions - 2,453 - 684 - 1 84 - 3,488 - 5,257
- of which, unrealised changes in the fair value of energy derivatives 10,537 2,786 7,792 - 201 4,753 12,504
- of which, unrealised changes in the fair value of inventories 1,801 58 1,645 335 476 2,219
- of which, restructuring costs — - 145 — - 50 - 854 - 709
- of which, other non-recurring items affecting comparability 11,910 588 - 29 - 294 1,519 12,841
Major items 9M 2021
• Compensation for closure of nuclear
power in Germany and sales of
related production rights (SEK 12.5
billion, reported in other non-recurring
items affecting comparability)
• Unrealised changes in market value
for energy derivatives and inventories
(SEK 12.3 billion)
• Capital gain related to the sale of
Stromnetz Berlin (SEK 8.4 billion)
Jan-Sep Jan-Sep Jul-Sep Jul-Sep Full year Last 12
Amounts in SEK million 2021 2020 2021 2020 2020 months
Operating profit (EBIT) 52,521 10,030 22,926 4,743 15,276 57,767
Depreciation, amortisation and impairment losses - 13,044 - 24,357 - 4,367 - 4,492 31,231 - 19,918
EBITDA 65,565 34,387 27,293 9,235 46,507 77,685
Items affecting comparability excl. impairment losses and reversed
impairment losses - 30,431 - 2,761 - 18,144 143 -2,466 - 30,136
Underlying EBITDA 35,134 31,626 9,149 9,378 44,041 47,549
Operating profit (EBIT) 52,521 10,030 22,926 4,743 15,276 57,767
Items affecting comparability - 30,431 7,772 - 18,144 75 10,514 - 27,689
Underlying EBIT 22,090 17,802 4,782 4,818 25,790 30,078
Calculation of EBITDA, underlying EBITDA and underlying EBIT

Impairment history 2009 – 2021
1 Impairment of goodwill 2 Impairment of assets and goodwill
25
SEK bn 2009 2010 2011 2012 2013 2014 2015 2016 2017 2018 2019 2020 2021 Total
The Netherlands
Thermal assets 4.31 0.42 8.62 14.7 2.6 2.8 0.7 34.1
Trading 6.51 10.01 0.7 17.2
Other 1.2 1.2 1.52 1.9 0.1 0.2 6.1
Germany
Thermal assets 0.3 4.3 5.7 19.2 26.1 0.1 11.3 67.0
Nuclear assets 10.5 10.5
Transmission 5.1 5.1
Other 0.1 1.1 0.3 2.3 0.4 1.2 5.4
The Nordic Countries
Renewable assets 1.4 0.1 0.2 1.6 3.3
Thermal assets 4.1 3.0 0.1 7.2
Nuclear assets 17.0 0.4 17.4
Other 0.3 0.3
UK Renewable assets 1.1 0.2 0.1 1.4
Other 0.1 0.1
Not allocated 0.2 0.5 0.1 0.8
Impairment Liberia 1.3 1.3
Impairments; shares in Enea S.A. Poland 2.4 2.4
Impairments; shares in Brokdorf and Stade1.1 1.1
Impairments 5.5 11.1 11.3 12.3 30.1 23.8 36.8 33.8 0.4 0.1 1.5 14.1 0.0 180.8
Reversed impairment losses -1.3 -1.3 -0.4 0.0 0.0 0.0 -0.5 -0.9 0.0 0.0 0.0 0.0 0.0 -4.4
Impairments (net) 4.2 9.8 10.9 12.3 30.1 23.8 36.3 32.9 0.4 0.1 1.5 14.1 0.0 176.4

Wind & Solar - Installed capacity (MW1) Q3 2021
1 Capacity in operation: total capacity of the wind farms that
Vattenfall has an ownership in. Minority shares included as 100%
26
1 Capacity in operation: total capacity of the wind farms that Vattenfall has an ownership in.
Minority shares included as 100%
2 One turbine remains to be installed
Solar Onshore Offshore Total
5 391 687 1.083 Thanet 300 Kriegers Flak 605 Princess Ariane 298
0 237 1.170 1.407 Ormonde (51%) 150 Horns Rev 3 407 Princess Alexia 122
70 576 0 647 Aberdeen 97 Horns Rev 1 (60%) 158 Haringvliet 38
0 218 110 328 Kentish Flats 90 Klim (98%) 67 Slufterdam 29
3 19 636 658 Kentish Flats Extension 50 Nørrekær Enge 1 (99%) 30 Haringvliet 18
Total (MW) 78 1.442 2.603 4.122 Pen Y Cymoedd 228 Rejsby Hede 23 Eemmeerdijk 17
Ray 54 Hagesholm 23 Irene Vorrink 17
Edinbane 41 Nørre Økse Sø 17 Nieuwe Hemweg 13
Clashindarroch 37 Tjæreborg Enge 17 Hoofdplaatpolder (70%) 10
Swinford 22 Hollandsbjerg 17 Reyndersweg (50%) 9
Solar Parc Cynog 4 Bajlum (89%) 15 Echteld 8
Onshore PV@Cynog 5 DræbyFed 9 Moerdijk 8
Offshore Pendine 5 Ryå 8 De Bjirmen 6
1.083 Ejsing (97%) 7 Oom Kees (12%) 6
Lyngmose 5 Oudendijk 5
1.407 Mariapolder 5
Lillgrund 110 Hiddum Houw 4
Stor-Rotliden 78 Eemshaven 6
Högabjär-Kärsås (50%) 38 DanTysk (51%) 288 Velsen 2
Höge Väg (50%) 37 Sandbank (51%) 288 Enkhuizen 2
Hjuleberg (50%) 36 alpha ventus (26%) 60 Hemweg 2
Juktan (50%) 29 Jänschwalde 12 Diemen 1
328 Westküste (20%) 7 Decentral Solar installations 21
Decentral Solar installations 3 647
658
United Kingdom
Denmark
The Netherlands
Sweden
Germany
The Netherlands – MEP/SDE(+)
Installed capacity (MW)
United Kingdom – ROC scheme
Installed capacity (MW)
Sweden – certificate scheme
Denmark – FIT scheme
Installed capacity (MW)
Installed capacity (MW)
Germany – EEG scheme
Installed capacity (MW)
2

Main renewables projects in our 5 core countries
27
Offshore Onshore Solar Batteries
Support
scheme
NL Hollandse Kust Zuid 1-4 1,520 - X - 50.5 2023 Offshore works started, Partnering with BASF
NL Moerdijk 27 SDE+ X 15 yrs 100 2021 Completed construction
NL Haringvliet 22 SDE+ X 15 yrs 100 2021 Commissioning ongoing
NL Nieuwe Hemweg 13 SDE+ X 15 yrs 100 2021 Completed construction
NL Ny Hiddum Houw 19 SDE+ X 15 yrs 100 2022 Under construction
UK South Kyle 240 - N/A - 100 2022 Under construction
NL Jaap Rodenburg 38 SDE+ X 15 yrs 100 2021 Completed construction
NL A16 20 SDE+ X 15 yrs 100 2022 Under construction
SE Blakliden + Fäbodberget 353 Certs N/A - 30 2022 Under construction
SE Grönhult 67 Certs N/A - 0 1 2023 FID received in Q1 2021
NL Haringvliet 38 SDE+ X 15 yrs 100 2020 Completed construction
DE Kögel cluster 28 EEG (X) 100 2021 Construction ongoing
NL Haringvliet 12 FCR* 100 2021 Completed construction
NL Windplan Blauw 77 SDE+ X 15 yrs 58 2023 FID received in Q3 2021
In construction 2,474
UK Norfolk projects 3,600 CfD 15 yrs 100 2027-2029 Planning consent revoked, preparing for CfD bid
DK Vesterhav 344 FIT X 50,000 hrs 100 2023/2024 Irrevocable permit received, FID in preparation
In development (in mature stage) 3,944
Owner-
ship (%)
Com-
missioningCurrent statusCountry Name
Capacity
(MW)Awarded
Duration
of support
1 The project has been sold but Vattenfall will build and operate the wind farm