Varma Annual Report 2007 - AaltoVarma secures pensions Varma Mutual Pension Insurance Company is the...
99
Annual Report 2007
Transcript of Varma Annual Report 2007 - AaltoVarma secures pensions Varma Mutual Pension Insurance Company is the...
Annual Report 2007
Annual General Meeting
Varma Mutual Pension Insurance Company will hold its Annual General Meeting on 27 March 2008, starting at 10 a.m., at the company head-quarters at Annankatu 18, Helsinki.
Annual report and other publications
Varma’s annual report is available in Finnish, Swedish and English. The annual report and Varma’s other publications can be ordered and printed at www.varma.fi.
2
Annual report 2007
The year 2007 in brief ......................................................... 4
CEO’s review .................................................................... 6
Core task and strategy ........................................................ 8
Responsible for managing pensions ........................................ 10
Client and insurance services ............................................... 12
Well-being at work and rehabilitation .................................... 16
Pension services ............................................................... 18
Investments .................................................................... 20
Personnel ....................................................................... 26
Corporate governance ........................................................ 28
Supervisory Board ............................................................. 31
Board of Directors ............................................................ 32
Executive Group............................................................... 36
Key terminology ............................................................... 40
Contact information .......................................................... 42
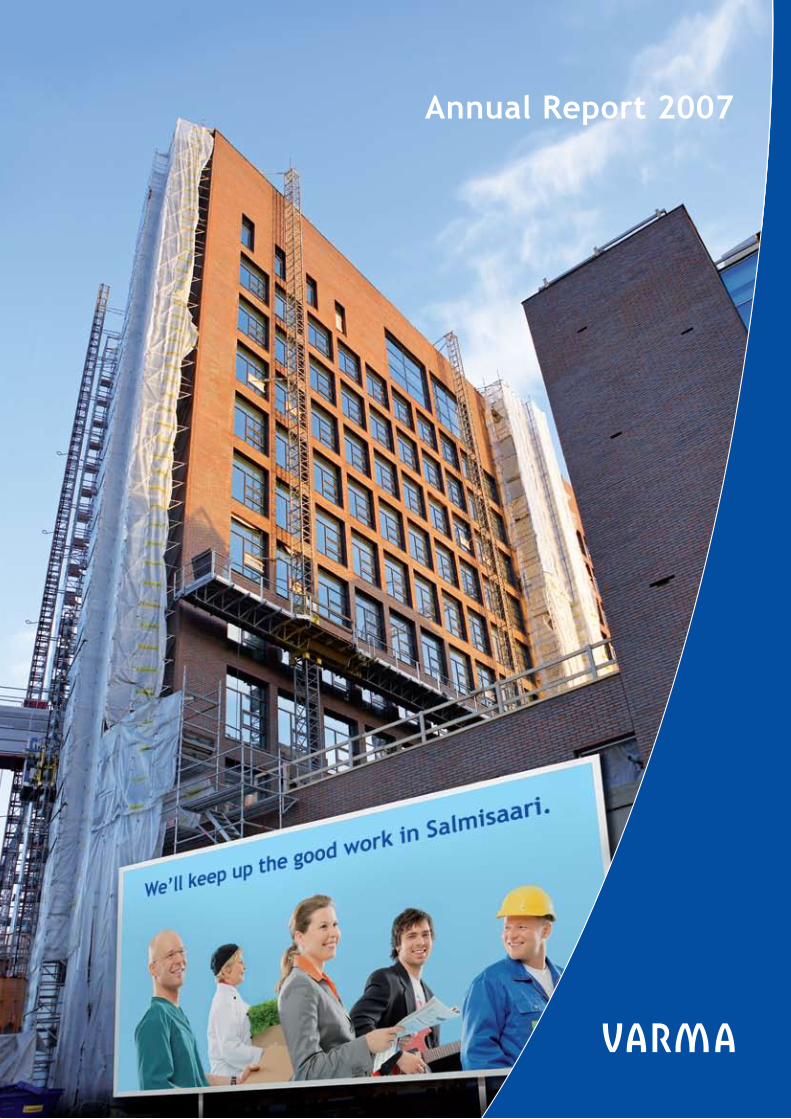
The cover shows the building site of Varma’s new office in the Salmisaari district of Helsinki. Good work creating opportunities for more good work.
CONTENTS

Varma secures pensions
Varma Mutual Pension Insurance Company is the largest
earnings-related pension insurer and investor in Finland. The
company is responsible for the statutory earnings-related
pension cover of more than 780,000 people. Premiums writ-
ten totalled €3.1 billion in 2007 and pension payments stood
at €3.1 billion. The value of the company’s investment assets
stood at €28.4 billion at the end of 2007.
1) Before the reduction of received
clearing of pay-as-you-go (PAYG) pensions.
2) Ratio calculated as a percentage of technical
provisions used in calculating the solvency limit.
3
2006
2,9832,886
426,00037,400
296,00026,8582,330
9.41,121
297278
0.623,7746,66632.12.1667
2007
3,1473,065
447,00037,300
302,00028,4181,632
6.0495277492
0.625,5717,03331.51.9635
Key figures (parent company)
Premiums written, € mill. Pension payments to pensioners, € mill. 1) TyEL insured 31 Dec. YEL policies Pensioners 31 Dec. Investment portfolio, € mill. Investment income, € mill. Return on invested capital, % Total result, € mill. Loading profit, € mill. Operating expenses in relation to loading income, %Transfer to client bonuses, € mill. % of TyEL payroll Technical provisions, € mill. Solvency capital, € mill. Solvency capital/technical provisions, % 2) Solvency capital/solvency limit Personnel 31 Dec.

THE YEAR 2007 IN BRIEF
The year 2007 in brief
Operating on a difficult investment market, Varma can nev-
ertheless be satisfied with the reasonable financial perform-
ance in 2007. The company posted an investment return of
6.0%, and though faced with new competitive challenges, it
was able to strengthen its position as Finland’s largest earn-
ings-related pension insurer.
Varma’s total result for 2007 amount-
ed to €495 (2006: 1,121) million. The
return on investments, calculated at
fair value, was 6.0% (9.4%) and the
market value of investments €28.4
(26.9) billion.
On a volatile investment market,
Varma’s performance was reason-
able. Diversification of its investment
assets outside traditional equity and
fixed-income markets in sectors such
as hedge funds (which generated a re-
turn of 11.4%) softened the impact of
a difficult end to 2007.
At the end of the year, Varma’s sol-
vency stood at €7,033 (6,666) million,
or 31.5% (32.1%) of technical provi-
sions.
Operating cost efficiency remained
good and the loading profit amounted
to €74 (72) million.
More competition
The new Employees Pensions Act
(TyEL) also widened the competitive
field for Varma. The earnings-related
pension insurance market, a sector
characterised by stability, become
livelier in 2007 as Etera lost its pen-
sion insurance monopoly on short-
term and temporary employment re-
lationships.
Varma did well in the new com-
petitive situation and was able to
strengthen its position as Finland’s
largest earnings-related pension in-
surer. Premiums written increased
by 5%, to €3.1 billion. The number of
insured employees and entrepreneurs
grew by 4%, to 484,000, and the figure
for account transfers was also good:
€45 (15) million.
In 2007, Varma reserved €92 (78)
million or 3.9% of the employees’ TyEL
contribution for client bonuses.
More pension decisions
Varma made some 23,200 new pen-
sion decisions during 2007, which was
5.9% more than in the previous year.
There was growth in all pension types,
as the age groups reaching the lower
age limits of different pension catego-
ries were larger than before.
The number of pensioners exceed-
ed 300,000 for the first time.
A new head office and pension records
Varma made preparations for send-
ing the first earnings-related pension
records to its individual clients. Start-
ing in 2008, private-sector employees
Insured
YELTyEL
500,000
450,000
400,000
350,000
300,000
250,000
200,000
150,000
100,000
50,000
003 04 05 06 07
Premiums written, € mill.
YELTyEL
03 04 05 06 07
3,000
2,500
2,000
1,500
1,000
500
0
YELTyEL
Pensioners
03 04 05 06 07
300,000
250,000
200,000
150,000
100,000
50,000
0
4
”Varma will send about
700,000 earnings-related
pension records to its
present and former
individual clients.”
and entrepreneurs will receive a pen-
sion record each year, detailing their
private-sector earnings and the pen-
sion accrued by the end of the previ-
ous year.
Varma will send about 700,000
pension records to its present and
former individual customers.
Varma will be moving to a new
head office in the Salmisaari district of
Helsinki in late summer 2008. Some
of the company’s present premises at
Annankatu were leased to the Euro-
pean Chemicals Agency in 2007.
*Result at fair value before change in provision for current and future bonuses and equalisation
provision, used mainly to strengthen solvency.
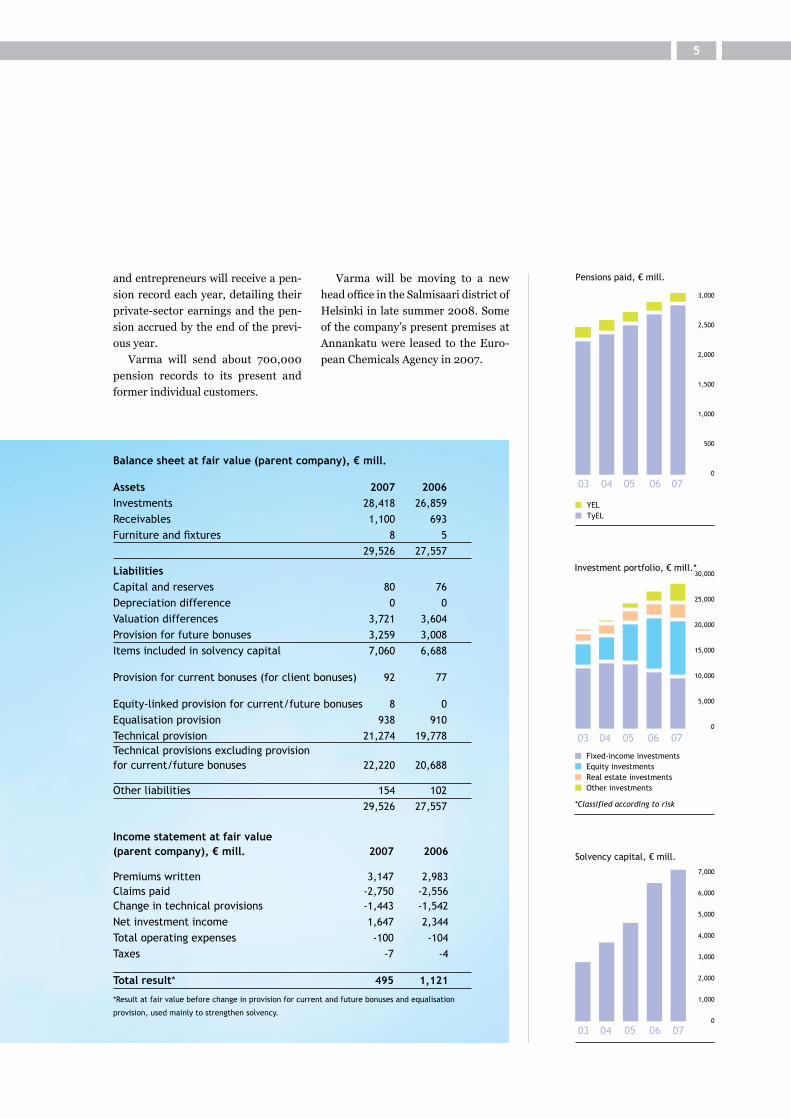
Balance sheet at fair value (parent company), € mill. Assets 2007 2006Investments 28,418 26,859Receivables 1,100 693Furniture and fixtures 8 5 29,526 27,557
LiabilitiesCapital and reserves 80 76Depreciation difference 0 0Valuation differences 3,721 3,604Provision for future bonuses 3,259 3,008Items included in solvency capital 7,060 6,688
Provision for current bonuses (for client bonuses) 92 77
Equity-linked provision for current/future bonuses 8 0Equalisation provision 938 910 Technical provision 21,274 19,778 Technical provisions excluding provision for current/future bonuses 22,220 20,688
Other liabilities 154 102 29,526 27,557
Income statement at fair value (parent company), € mill. 2007 2006 Premiums written 3,147 2,983Claims paid -2,750 -2,556Change in technical provisions -1,443 -1,542Net investment income 1,647 2,344Total operating expenses -100 -104Taxes -7 -4 Total result* 495 1,121
Pensions paid, € mill.
3,000
2,500
2,000
1,500
1,000
500
0
YELTyEL
03 04 05 06 07
Investment portfolio, € mill.*
Fixed-income investmentsEquity investmentsReal estate investmentsOther investments
03 04 05 06 07
*Classified according to risk
0
5,000
10,000
15,000
20,000
25,000
30,000
Solvency capital, € mill.
7,000
6,000
5,000
4,000
3,000
2,000
1,000
0
03 04 05 06 07
5
6 CEO’S REVIEW
Good results on a difficult market
Everybody was kept busy at Varma during 2007. Under the
new Employees Pensions Act, all private-sector employment
relationships were opened up to competition between
earnings-related pension insurance companies and the com-
pany updated its strategy for 2008–2012. Varma is Finland’s
largest earnings-related pension insurer, which makes us be-
have with humility and determination. We want to improve
and develop our services so that we can retain our position
and strengthen it in the most challenging customer sectors.
6
Many of Varma’s internal develop-ment projects not only last a long time but also involve a lot of work. They are based on our assessments concerning the developments in the Finnish economy and particularly in the country’s corporate and sectoral structures during the next few years. Varma and other players in theearnings-related pension sector can only maintain their high service levels if they carry out substantial invest-ment in information-system projects. The projects must also be imple-mented more efficiently than similar projects in the past. During the year under review, Varma managed to keep its operating cost efficiency at good le-vels in spite of the investment in the information systems. Varma’s opera-ting costs accounted for 74 per cent of the expense loading included in the insurance contributions.
There is a lot of debate about pen-sions in Finland these days. A smooth-ly-functioning earnings-related pen-sion system with a solid funding basis is a source of security for citizens in a rapidly changing and turbulent world. The fact is that, in terms of service le-vels and transparency, the earnings-related pension system funded by pri-vate companies operating in Finland and their employees is well ahead of similar systems in the public sector. A concrete example of this is the pen sion
record, which all private-sector em-ployees will receive during 2008. This year, Varma will for the first time be sending pension records to its 700,000 individual clients. The pension record project and putting all the necessary information about the recipients’ pen-sion cover in the documents will be a major challenge to Varma’s customer service and the information systems used by Finland’s earnings-related pension system. Varma’s insurance and pension services were making preparations for this huge project du-ring the year.
The number of Varma’s pensioners exceeded 300,000 in autumn 2007. At the end of the year, the company had a total of 484,000 insured em-ployees and entrepreneurs. At the start of 2007, short-time employment relationships and household employ-ment were opened up to competition between earnings-related pension in-surers. Varma managed to do well in the new situation.
Successful risk management on a difficult investment market
Varma’s investment return, 6 per cent, was reasonable considering the chal-lenging market situation during the last months of the year. At the same time, the company’s solvency remains
strong. The new provisions on mar-gins and solvency that came into effect at the start of the year have resulted in wider differences between portfolios held by different pension insurance companies. This helps in lowering the overall risk in the system. The avera-ge five-year (2003–2007) return on Varma’s investments was 8.5 per cent, which corresponds to a real return of 7.3 per cent. The fact that the compa-ny has diversified its investments out-side fixed-income and equity markets helped to increase returns. We are proposing to increase client bonuses to €92 million, which would be 0.64 per cent of the payroll of the insured. A series of good investment years has given Varma a high degree of solven-cy, which provides the company with a strong buffer against market uncer-tainties.
Listed companies must improve their administrative practices
As equity markets become more chal-lenging, more attention must be paid to market liquidity. During the year under review, Varma was actively in-volved in the development of Finland’s capital and investment markets. It made extensive use of its shareholder rights and will also continue to do so. Finnish equity markets and Finland’s listed companies must adopt better administrative practices so that inves-tors such as earnings-related pension insurers can invest more extensively in Finnish companies and broaden the range of their investments.
Finally, I would like to thank all Varma employees for their good work in 2007 and our customers for the confidence they have shown in our company.
Matti VuoriaPresident and CEO

7

CORE TASk ANd STRATEGY8
Performance means that each Varma employee is responsible for their own results and the company’s success. A good performance helps to make the earnings-related pen-sion system more efficient and smooth-functioning.
Customer orientation means identi-fying the needs of the customers and acting accordingly. Customer service at Varma is smooth and friendly.
Cooperation is based on openness and flexibility. Varma respects and values the work done by others.
VALuES: SuCCESS THROuGH CuSTOMER-ORIENTEd COOpERATION
VARMA'S CORE FuNCTION
We invest pension assetsprofitably and securely
We handle pensions correctlyand on time, and promote
well-being at work
Our operations are based onemployment in Finland and developingthe earnings-related pension scheme
We take care of our customers'earnings-related pension provision
efficiently and competitively
VARMASECURESPENSIONS

9
Securing pensions through good work
Varma’s strategy for the period 2008–2012 can be summed
up as follows: strenghtening the company’s market position
and safeguarding the earnings-related pensions and benefits
and their funding basis. In its day-to-day operations, Varma
is guided by its strategy and values.
Varma revised its strategy in autumn
2007. During the period 2008–2012
the company aims to strengthen its
market position in all customer groups
and, in accordance with its core task,
to safeguard the funding of earnings-
related pensions and other benefits.
As part of its strategy, Varma will
provide a more focused response to its
customers’ changing needs and supply
the services best tailored to the needs
of the earnings-related pension sector.
The emphasis will be on improving
online services.
Facing the prospect of an ageing
workforce, Finnish companies are
paying more attention to occupational
well-being. The rehabilitation and
well-being services offered by Varma
support working capacity and help to
keep pension costs under control.
Obtaining good returns on pension
assets will become more important
in the coming years. Good returns
will mean less pressure on pension
contributions. Varma is determined
to remain the leader in a changing
earnings-related pension sector by
carrying out its responsibility with
maximum efficiency.
Pensions are secured through good
work – for this reason Varma is setting
itself higher targets.
Varma aims to meet its strategic objectives by excelling in six areas
• Varma is Finland’s best pension investor.
Varma’s aim is to be Finland’s best pension investor and reach the top
European league. Varma manages its investments in a cost-efficient manner.
• Varma provides the best-tailored services.
By providing a range of tailored services Varma can meet the special needs
of different customer sectors. New services will be developed for enterprises
and small businesses.
• Varmaisthemostefficientearnings-relatedpensioninsurer.
To ensure cost-efficient management of earnings-related pensions Varma is
automating its processes and providing more electronic services.
• Partnershipsbringaddedvalue.
Partnerships will give Varma a competitive edge and help it to provide
flexible services tailored to its customers’ needs.
• Varmaistheleaderintheearnings-relatedpensionsector.
Varma is actively involved in the development of the earnings-related
pension system.
• Varmaisknownforitsgoodwork.
Varma is an active communicator, conveying its messages in
a transparent and easy-to-understand manner.
RESpONSIBLE FOR MANAGING pENSIONS10
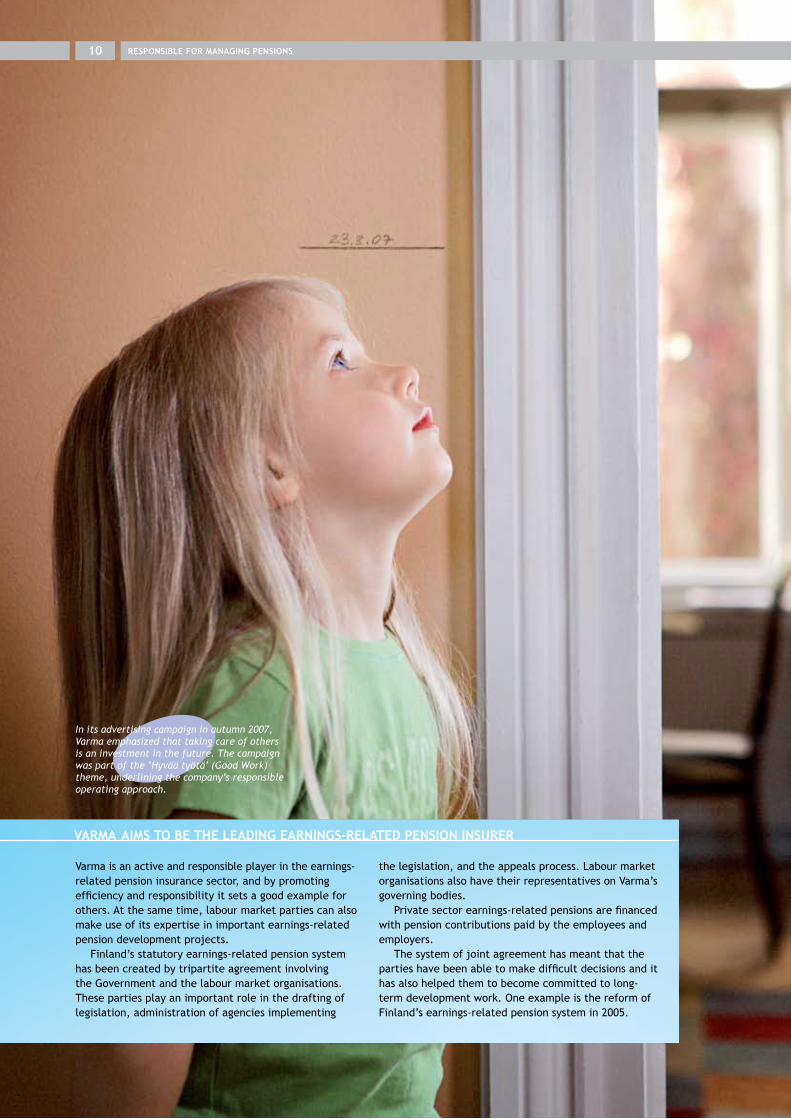
In its advertising campaign in autumn 2007, Varma emphasized that taking care of others is an investment in the future. The campaign was part of the ’Hyvää työtä’ (Good Work) theme, underlining the company’s responsible operating approach.
Varma is an active and responsible player in the earnings-related pension insurance sector, and by promoting efficiency and responsibility it sets a good example for others. At the same time, labour market parties can also make use of its expertise in important earnings-related pension development projects.
Finland’s statutory earnings-related pension system has been created by tripartite agreement involving the Government and the labour market organisations. These parties play an important role in the drafting of legislation, administration of agencies implementing
the legislation, and the appeals process. Labour market organisations also have their representatives on Varma’s governing bodies.
Private sector earnings-related pensions are financed with pension contributions paid by the employees and employers.
The system of joint agreement has meant that the parties have been able to make difficult decisions and it has also helped them to become committed to long-term development work. One example is the reform of Finland’s earnings-related pension system in 2005.
VARMA AIMS TO BE THE LEAdING EARNINGS-RELATEd pENSION INSuRER
Responsible for managing pensions
Varma’s financial responsibility can be summed up as efficient
operations and investment of pension assets. From the social
point of view, the crucial factor is the correctness of the
pension decisions, which is also a question of protecting the
legal rights of the insured.
Varma aims to be Finland’s most effi-
cient earnings-related pension insurer
and to offer the services best tailored
its customers’ needs. Dealing with the
insured, the policy holders and the
pension recipients in a responsible
manner means dealing in a transpar-
ent and accurate manner.
Financial responsibility is also reflected in investments
Pensions can only be paid if pension
assets are invested in a profitable
and secure manner. High investment
returns also help to ease the upward
pressures on pension contributions
caused by an aging population. Secu-
rity of investments is ensured by ef-
ficient diversification of the funds into
different asset classes and by meeting
solvency regulations. By having an in-
vestment portfolio with the right risk
level, Varma can adhere to its pension
promises in all market situations.
Managing pensions means tak-
ing a long-term perspective. This en-
ables Varma to put money in growth
companies and support society’s ba-
sic structures and competitiveness
through investments in such areas as
infrastructure modernisation.
Varma is an active and responsible
shareholder in companies in which it
has invested pension assets, and it ex-
pects them to observe good corporate
governance principles.
Pension assets are the property of
the insured and the policyholders, and
Varma aims to make its investments
more transparent and provide more
information about its investment
performance. In 2007, the company
started providing investment reports
on a quarterly basis.
Cost-efficiency is an important
competitive edge in the investment
of pension assets. Each year, Varma
commissions a survey on the costs of
its investments activities by an inde-
pendent agency specialising in assess-
ing the costs of pension investors on
an international basis. The surveys
have shown that Varma’s investments
are cost-efficient.
Social responsibility is based on law
There are detailed legal provisions cov-
ering the making of pension decisions,
paying of pensions, and collection of
pension contributions. Managing the
tasks in a responsible manner also re-
quires quick action, accuracy and effi-
cient dissemination of information.
Most of the disability pension ap-
plications (78%) are approved un-
changed. By law, employees are enti-
tled to vocational rehabilitation if their
working capacity is at risk. When mak-
ing pension decisions, Varma must
take a comprehensive approach and
act in accordance with the provisions
governing the sector.
Appeal systems help to ensure
that all the decisions are made on the
same basis. Varma keeps records on
the correctness of its decisions, on
the number of rejected applications
and the changes appeal bodies make
to them. In 2007, some 93% of all
decisions rejecting applications were
upheld. Each year, an independent
outside expert makes an assessment
of the disability pension applications
rejected by Varma and the way they
are handled.
In connection with her 2007 au-
dit, the Parliamentary Ombudsman
assessed how well Varma is adhering
to legal and good governance require-
ments in its statutory pension deci-
sions. The assessment was part of the
auditing of insurance companies and
social security appeal bodies. In her
statement, the Ombudsman conclud-
ed that Varma adheres to the princi-
ples of good governance and that the
company makes its pension decisions
quickly and in accordance with all re-
quirements.
11
”Managing pensions
means taking a long-term
perspective.”
CLIENT ANd INSuRANCE SERVICES12
More competition meant livelier markets
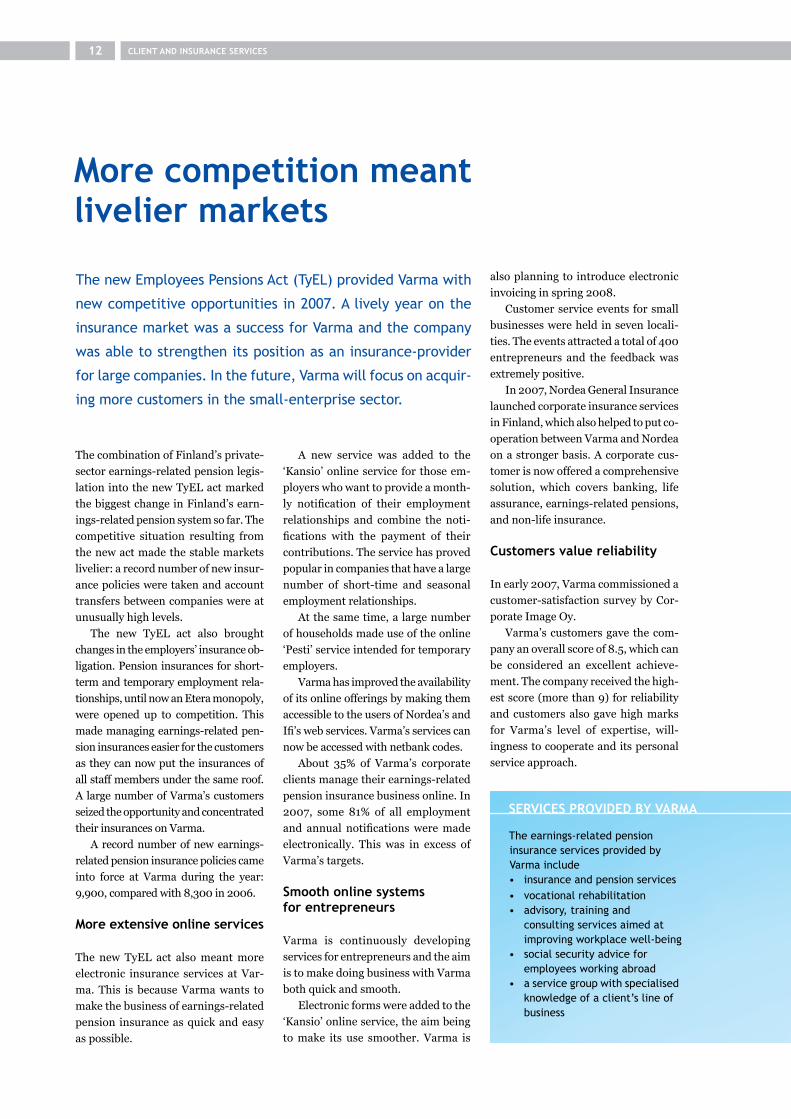
The new Employees Pensions Act (TyEL) provided Varma with
new competitive opportunities in 2007. A lively year on the
insurance market was a success for Varma and the company
was able to strengthen its position as an insurance-provider
for large companies. In the future, Varma will focus on acquir-
ing more customers in the small-enterprise sector.
The combination of Finland’s private-
sector earnings-related pension legis-
lation into the new TyEL act marked
the biggest change in Finland’s earn-
ings-related pension system so far. The
competitive situation resulting from
the new act made the stable markets
livelier: a record number of new insur-
ance policies were taken and account
transfers between companies were at
unusually high levels.
The new TyEL act also brought
changes in the employers’ insurance ob-
ligation. Pension insurances for short-
term and temporary employment rela-
tionships, until now an Etera monopoly,
were opened up to competition. This
made managing earnings-related pen-
sion insurances easier for the customers
as they can now put the insurances of
all staff members under the same roof.
A large number of Varma’s customers
seized the opportunity and concentrated
their insurances on Varma.
A record number of new earnings-
related pension insurance policies came
into force at Varma during the year:
9,900, compared with 8,300 in 2006.
More extensive online services
The new TyEL act also meant more
electronic insurance services at Var-
ma. This is because Varma wants to
make the business of earnings-related
pension insurance as quick and easy
as possible.
A new service was added to the
‘Kansio’ online service for those em-
ployers who want to provide a month-
ly notification of their employment
relationships and combine the noti-
fications with the payment of their
contributions. The service has proved
popular in companies that have a large
number of short-time and seasonal
employment relationships.
At the same time, a large number
of households made use of the online
‘Pesti’ service intended for temporary
employers.
Varma has improved the availability
of its online offerings by making them
accessible to the users of Nordea’s and
Ifi’s web services. Varma’s services can
now be accessed with netbank codes.
About 35% of Varma’s corporate
clients manage their earnings-related
pension insurance business online. In
2007, some 81% of all employment
and annual notifications were made
electronically. This was in excess of
Varma’s targets.
Smooth online systems for entrepreneurs
Varma is continuously developing
services for entrepreneurs and the aim
is to make doing business with Varma
both quick and smooth.
Electronic forms were added to the
‘Kansio’ online service, the aim being
to make its use smoother. Varma is
also planning to introduce electronic
invoicing in spring 2008.
Customer service events for small
businesses were held in seven locali-
ties. The events attracted a total of 400
entrepreneurs and the feedback was
extremely positive.
In 2007, Nordea General Insurance
launched corporate insurance services
in Finland, which also helped to put co-
operation between Varma and Nordea
on a stronger basis. A corporate cus-
tomer is now offered a comprehensive
solution, which covers banking, life
assurance, earnings-related pensions,
and non-life insurance.
Customers value reliability
In early 2007, Varma commissioned a
customer-satisfaction survey by Cor-
porate Image Oy.
Varma’s customers gave the com-
pany an overall score of 8.5, which can
be considered an excellent achieve-
ment. The company received the high-
est score (more than 9) for reliability
and customers also gave high marks
for Varma’s level of expertise, will-
ingness to cooperate and its personal
service approach.
The earnings-related pension insurance services provided by Varma include• insurance and pension services• vocational rehabilitation• advisory, training and consulting services aimed at improving workplace well-being • social security advice for employees working abroad• a service group with specialised knowledge of a client’s line of business
SERVICES pROVIdEd BY VARMA

A sensitive-skinned customer wearing a soothing facial mask at Terhi Nyman’s beauty salon at Kalevankatu in Helsinki. Nyman, a beautician, has been in the business for four years and has her YEL insurance at Varma.
13
SERVICES pROVIdEd BY VARMA
CLIENT ANd INSuRANCE SERVICES14
Varma is the first earnings-related pension insurer with a consultative committee of self-employed persons. The committee will start operations in 2008 and will, in addition to entrepreneurs, also have representatives from the most important organisations supervising their interests. With the new committee, Varma is in a bet-
ter position to listen to entrepreneurs’ concerns and to develop services tailored to their needs.
In addition to the consultative committee of self-employed persons, Varma also has a similar committee for employers, representing larger companies.
CONSuLTATIVE COMMITTEE OF SELF-EMpLOYEd pERSONS
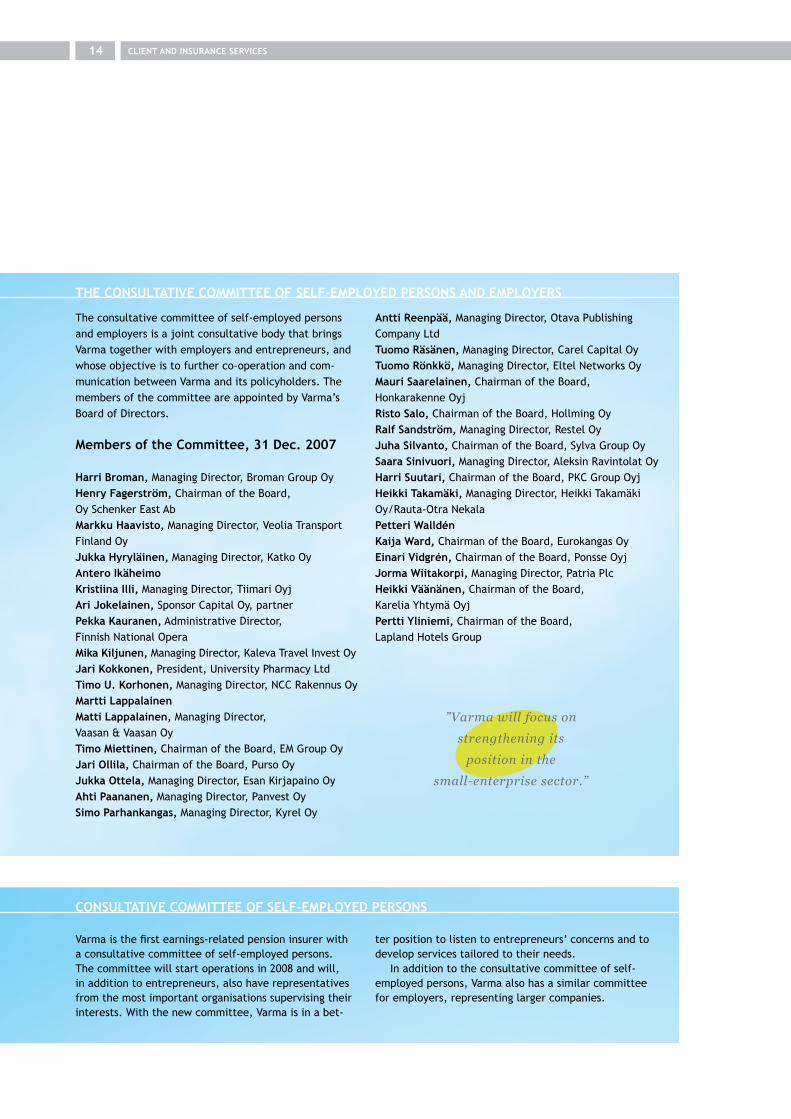
The consultative committee of self-employed persons and employers is a joint consultative body that brings Varma together with employers and entrepreneurs, and whose objective is to further co-operation and com-munication between Varma and its policyholders. The members of the committee are appointed by Varma’s Board of Directors.
Members of the Committee, 31 dec. 2007
Harri Broman, Managing Director, Broman Group Oy Henry Fagerström, Chairman of the Board, Oy Schenker East Ab Markku Haavisto, Managing Director, Veolia Transport Finland Oy Jukka Hyryläinen, Managing Director, Katko Oy Antero Ikäheimokristiina Illi, Managing Director, Tiimari Oyj Ari Jokelainen, Sponsor Capital Oy, partnerPekka Kauranen, Administrative Director, Finnish National Opera Mika Kiljunen, Managing Director, Kaleva Travel Invest Oy Jari Kokkonen, President, University Pharmacy Ltd Timo u. korhonen, Managing Director, NCC Rakennus Oy Martti LappalainenMatti Lappalainen, Managing Director, Vaasan & Vaasan Oy Timo Miettinen, Chairman of the Board, EM Group Oy Jari Ollila, Chairman of the Board, Purso Oy Jukka Ottela, Managing Director, Esan Kirjapaino Oy Ahti paananen, Managing Director, Panvest OySimo Parhankangas, Managing Director, Kyrel Oy
Antti Reenpää, Managing Director, Otava Publishing Company Ltd Tuomo Räsänen, Managing Director, Carel Capital Oy Tuomo Rönkkö, Managing Director, Eltel Networks Oy Mauri Saarelainen, Chairman of the Board, Honkarakenne Oyj Risto Salo, Chairman of the Board, Hollming Oy Ralf Sandström, Managing Director, Restel Oy Juha Silvanto, Chairman of the Board, Sylva Group Oy Saara Sinivuori, Managing Director, Aleksin Ravintolat Oy Harri Suutari, Chairman of the Board, PKC Group Oyj Heikki Takamäki, Managing Director, Heikki Takamäki Oy/Rauta-Otra Nekala petteri Walldén Kaija Ward, Chairman of the Board, Eurokangas Oy Einari Vidgrén, Chairman of the Board, Ponsse Oyj Jorma Wiitakorpi, Managing Director, Patria Plc Heikki Väänänen, Chairman of the Board, Karelia Yhtymä Oyj pertti Yliniemi, Chairman of the Board, Lapland Hotels Group
THE CONSuLTATIVE COMMITTEE OF SELF-EMpLOYEd pERSONS ANd EMpLOYERS
”Varma will focus on
strengthening its
position in the
small-enterprise sector.”
The survey showed that there is
still some room for improvement in
contacts, which according to the re-
spondents should be on a more active
and focused basis. The feedback has
helped Varma to improve such areas
as client communications.
Both premiums written and the number of new insurance policies up
Varma’s TyEL premiums written for
2007 totalled €3.0 (2.9) billion, which
was 5% more than in the previous
year. YEL premiums written increased
by 3%, to €129 million.
Insurance policies numbered
63,700, of which 37,300 were YEL
policies.
Sales of new TyEL and YEL policies
were at record levels in 2007. New poli-
cies numbered 9,488, a rise of 19.2%.
New premiums written totalled
€58.3 million, which was in keeping
with the euro-denominated target set
by the company. At the same time,
however, the rise in the number of new
premiums written was only 20.6%,
meaning that the numerical target of
a 24% increase was not met.
Excellent results in account transfers
Companies can transfer their TyEL and
YEL insurances from one insurance com-
pany to another on a quarterly basis.
Measured in terms of premiums
written, the net result in transfers was
€45 (15) million. The excellent result
helped Varma to increase its 34 per
cent market share by about 0.5%.
The result helped Varma to
strengthen its position as an insurance
provider for large companies. Meas-
ured in numerical terms, Varma won
789 TyEL policies from other compa-
nies, but at the same time it lost 1,038
YEL policies to other insurers.
It was agreed in December 2007
that the Nokia Pension Fund would
transfer its insurance operations
covering Nokia Siemens Networks to
Varma as of 1 March 2008. The funds
involved correspond to about 1.5% of
the earnings-related pension insur-
ance market and will increase the
15
pension assets managed by Varma by
almost €300 million in 2008.
Client bonuses
In 2007, Varma reserved a total of €92
(78) million, or 3.9% of the employers’
TyEL contributions, for client bonus-
es. The client bonuses provided by the
company are at extremely competitive
levels.
Aiming for the small-enterprise market
The sectoral changes in the Finnish
corporate sector, outsourcing and
corporate mergers are also reflected
in Varma’s operations.
Varma is determined to strengthen its
position as an earnings-related pension
insurer in such rapidly growing sectors
as business services, the retail and service
sector, and care and health care services.
Varma also wants to gain a stronger in-
surance foothold in the small-enterprise
sector, which would, however, require
closer cooperation with partners distri-
buting Varma’s products.
A client bonus is a rebate on an employer’s contribution granted by an earnings-related pension insurer.
The size of the client bonus depends on two factors: the results of the insurance company’s investment operations and its loading profit (savings in operating costs). Customers benefit when an earnings-related pen-sion insurer manages its investments both successfully and efficiently.
Successful investments accrue both the assets used to cover pension liabilities and the solvency capital, which provides a buffer against fluctuations in investment returns. In the future, 1.1% of the solvency capital will be transferred directly to client bonuses.
The pension contributions paid by companies always include an expense loading, which is intended to cover
the operating costs of an earnings-related pension insurer. The loading profit shows how large a proportion of the expense loading remains unused after the operat-ing costs of the insurance company have been covered (=how efficiently the earnings-related pension insurance company operates).
The bonus mechanism was changed in 2007, which means that half the loading profit is now automatically transferred to client bonuses.
Earnings-related pension insurers have five years to introduce the system described above. During the transitional period they can, instead of applying the new mechanism, transfer 1.2% of the solvency capital and 25% of the loading profit to client bonuses.
dETERMINING CLIENT BONuSES

A decade of experience in providing support for occupational well-being
The year 2007 marked the tenth anniversary of Varma’s
‘Evita’ well-being services. During the past decade, the serv-
ice has expanded considerably and became well-established.
It has provided thousands of Varma customers with help in
their occupational well-being projects.
Despite the anniversary year, Varma
did not rest on its laurels. Coopera-
tion projects carried out during 2007
involved more than 400 client busi-
nesses, and in consultations with indi-
vidual companies the emphasis was on
supervisor training, age management,
change management and disability
prevention.
A total of 13 seminars and training
sessions were organised for the cus-
tomers. The events, which were open
to all those interested, attracted more
than 700 participants.
Two major projects were complet-
ed early in the year: the occupational
well-being project for the wholesale
and retail sectors and a project cover-
ing supervisory work and changes at
the workplace. The skills learned by
the participants will also benefit client
companies in the future.
The impact of sector-specific char-
acters on occupational well-being was
examined in the wholesale and retail-
sector project. A tool for assessing
well-being at work was developed as
part of the project helping individual
employees to determine quickly their
own well-being. There was also a
seminar on the challenges in the sec-
tors, which attracted 60 professionals
from the wholesale, retail and service
branches.
A project on changes involved in
supervisory work was completed in
spring 2007. Varma published a report
on the project entitled ‘Esimiestyön
kipukohdat ja valopilkut muutostilan-
teessa’ (Dealing with the positive and
negative aspects of changes as part of
supervisory work).
The age-management project,
launched in 2006, continued in 2007.
This project also involves training, and
the extensive material on age manage-
ment produced by Varma was well re-
ceived.
Customer satisfaction through successful rehabilitation
The number of Varma’s customers
taking part in vocational rehabilitation
continued to increase. The percentage
of rejected rehabilitation applications
at Varma (14.8%) was lower than the
OCCupATIONAL WELL-BEING ANd REHABILITATION16
Jorma Vehviläinen at work as a supervisor of a group installing prefabricated concrete slabs at the construction company Palmberg.
sectoral average (18.1%). An increase
in the number of rehabilitation appli-
cations and the low proportion of re-
jections show that Varma’s long-term
approach to customer cooperation has
been successful.
On average, the rehabilitation ap-
plications are also handled much faster
at Varma than elsewhere in the sector.
A return to work or to the labour mar-
ket by about 70% of the participants
is an indication of the effectiveness of
rehabilitation provided by Varma.
During the year under review,
Varma has also been assessing the re-
habilitation services provided for its
individual clients. The assessment is
considered important because Varma
uses more outsourced services in help-
ing the participants to draw up reha-
bilitation programme and to plan for
a return to work than other earnings-
related pension insurers. Varma has
also been highly active in the develop-
ment of vocational rehabilitation serv-
ice products in Finland.
When necessary, Varma provides
the participants with local help and as-
sists them in the preparation and im-
plementation of return-to-work plans
if they are unable to return to their
former work. A survey was carried out
in spring 2007 examining the partici-
pants’ satisfaction with the rehabilita-
tion services purchased by Varma and
with their own situation. The results
show that 75% of the participants are
very satisfied or fairly satisfied with
the services purchased by Varma.
Making occupational well-being a success factor
Occupational well-being is becoming
an increasingly important success fac-
tor for companies. This is because the
workforce is aging, global competi-
tion is becoming tougher and operat-
ing environments are becoming more
networked.
By investing in occupational well-
being, companies can secure the sup-
ply of a skilled workforce in the future.
It also helps to boost the employees’
working capacity and keep them moti-
vated in a constantly changing operat-
ing environment.
17
”Occupational well-being
will become increasingly
important as a corporate
success factor in the future.”
Nordea is launching a new type of senior programme which has been drawn up in cooperation with Varma. The programme makes use of Varma’s Good Age tools.
The aim of the programme is to help Nordea to achieve its business targets by improving the well-being of its staff members and to keep them in working life longer. The focus is on the supervisors’ age management skills, appreciation of experience, and the securing of skills and working capacity. The programme will make use of the Good Age tools as part of the process of supervisor training, appraisal interviews and shaping attitudes.
According to Liisa Fågel from Nordea, the bank wants to do its share in the efforts to keep pension costs under
control and to ensure well-being for an aging population.Nordea has been prompted to take action by the fact
that its workforce is aging. Some 40% of the staff may retire by the end of the year 2017.
”We have a wide range of tools for dealing with the challenge. We want to keep expert staff on our payroll and increase the average retirement age. We do this by providing incentives to aging employees and pro-vide them with additional holidays as an alternative to part-time pensions, part-time work as an alternative to old-age pensions, and mentoring,” says Liisa Fågel.
According to Fågel, the purpose of Nordea’s senior programme is to increase understanding on the strengths and challenges brought by aging and experience.
NORdEA pROVIdES INCENTIVES FOR ExpERIENCEd STAFF MEMBERS

pENSION SERVICES18
700,000 Finns to receive pension record from Varma
Varma’s individual clients are increasingly turning to online
services when doing business with the company. Varma is in
the process of developing new electronic services and in the
future customers will also be able to check their earnings-
related pension records online. The first records will be sent
to the clients’ home addresses during 2008.
Varma’s individual clients are employ-
ees and entrepreneurs insured by the
company, and pensioners.
In 2007, Varma made preparations
for sending pension records to its cus-
tomers for the first time. Starting in
2008, all private-sector employees
and entrepreneurs living in Finland
will receive a pension record each year
detailing their private-sector earnings
and pension accrued by the end of the
previous year. Varma will be sending
some 700,000 records to its present
and former clients.
A number of system and online
service projects have helped Varma
to prepare for the new era. The first
pension records will be sent to the
recipients’ home addresses but in the
future clients will also be able to check
their pension situation online. The
construction of an electronic pension
record service is in progress.
Online services becoming more popular
In 2007, employees and entrepre-
neurs insured at Varma made a total of
52,100 online pension estimates. This
was 2.2 times more than the number
of pension estimates carried out at the
request of the client by Varma’s own
pension experts (23,500).
Using Varma’s online service, individ-
ual clients can estimate their own pen-
sion at various ages. Those over 53 can
also calculate their part-time pension.
Varma also has an electronic serv-
ice for applying for old-age pensions.
Services meeting client needs
Varma’s Advisory Services received
about 26,600 calls during the year,
while some 2,400 clients sought per-
sonal advice at the company’s cus-
tomer-service point at Annankatu in
Helsinki.
Varma Advisory Services organised
100 information sessions for employ-
ees and entrepreneurs and more than
3,000 clients took part in the events.
Most of the sessions provided basic
facts about pensions.
In 2007, some 10,600 people were
provided with information about their
supplementary pension cover and
9,800 of this number also received
an estimate of their total pension. To-
gether with the pension estimates, the
clients also received information about
how Varma invests its pension assets.
According to customer surveys, clients
consider such information necessary.
Pensioners are satisfied customers
Varma made some 23,200 new pen-
sion decisions in 2007, which was
5.9% more than in the previous year.
There was growth in all pension types,
as the age-groups reaching the lower
age limits of different pension catego-
ries were larger than before.
In disability pensions, the growth
remained below average. This is par-
tially a result of successful vocational
rehabilitation efforts.
Varma handles pension decisions
quickly. Almost 79% of all pensions
were paid in the month during which
the right to receive the pension com-
menced. Some 86% of all old age pen-
sions were paid in accordance with the
target schedule.
In 2007, Varma Pension Services
carried out a customer-satisfaction
survey among those who had received
a pension decision. More than 500
pensioners responded and gave the
company’s customer service an over-
all score of 9.3, which is an excellent
result. Personal service was highly
rated.
”In the future customers
will also be able to
check their pension
record online.”

Old
age
Dis
abili
ty
Surv
ivor
s'
Une
mpl
oym
ent
Part
-tim
e
Oth
er
Pension decisions according topension benefit 2006–2007
0
1,000
2,000
3,000
4,000
5,000
6,000
7,000
2006 2007
Calculations made at the PensionEstimate Service, 2003–2007
60,000
50,000
40,000
30,000
20,000
10,000
003 04 05 06 07
110,000
100,000
90,000
80,000
70,000
60,000
50,000
40,000
30,000
20,000
10,000
0
Contacts by individual clients,in 2003–2007
personal visitby telephoneby e-mailon line (pensions)
03 04 05 06 07
19
The Consultative Committee of the Insured is a consultative body that acts as an intermediary between Varma and the insured (TyEL). Its objec-tive is to further co-operation and communication between the company and employees insured by the company. The members are appointed by the Board of Directors, based on the proposals of major central employee organisations.
Members of the Committee, 31 dec. 2007
The Consultative Committee for pension Affairs is a body established for co-operation between Varma and labour market organisations. Its function is to make recommendations to the company regarding disability pensions and individual early retirement pensions. The members of the Consultative Committee are appointed by the Board of Directors.
Members of the Committee, 31 dec. 2007
Chairman Markku Hyvärinen, Executive Vice-president, VarmaVice Chairman Sakari Tola, Senior Physician, VarmaLasse Laatunen, Director, Confederation of Finnish Industries EKSinikka Näätsaari, Programme Manager, Central Organisation of Finnish Trade Unions SAKMervi Flinkman, Social and Health Policy Officer, Finnish Confederation of Salaried Employees, STTKAnja Uljas, Head of R&D, Finnish Association of Graduates in Economics and Business Administrationpetri Vanhala, Secretary General, Finnish Paperworkers’ UnionRiitta Wärn, Senior Advisor, Confederation of Finnish Industries EK
In the meetings of the Consultative Committee has also participated the following people from Varma: Jyrki Rasi, Pension Director, Marja Korpilahti, Head of Department and kari Ahtiainen, Ajudication Manager.
Representatives of the Central Organisation of Finnish Trade unions, SAkEllen Helo, Tradeka OyTeuvo kalso, Ovako Bar Oy AbKeijo Kekäläinen, Savon Sanomat OyJukka Mahlamäki, Meira OyHannu paronen, Versowood OyEero pennanen, Abloy OyAntero Raanoja, Stora Enso OyjJouni Suomalainen, Sokotel OySimo Virolainen, Honkarakenne Oyjkari Virtanen, Koiviston Auto OyTimo Virtanen, Metsä Tissue OyjKari Ylikauppila, Fortum Corporation
Representatives of the Finnish Confederation of Salaried Employees, STTk Timo Jaakkola, NCC Rakennus OyMatti Kangas, TietoEnator Corporation
pauli karhu, Wärtsilä CorporationKimmo Koskivaara, TS-Yhtymä OyIrma Kronlöf, Mehiläinen OySeppo Lampinen, Ovako Bar Oy AbJorma Malinen, Aker Yards OyJukka Nyberg, UPM-Kymmene CorporationKaija Roukala-Hyvärinen, Nordea Bank Finland PlcMarika Siren, If P&C Insurance
Representatives of the Confede-ration of unions for Academic Professionals in Finland, Akavakimmo Heinonen, Sunila OyJani Huhtamella, Elektrobit Wireless Communications LtdMarko Klapuri, Etteplan OyjAri Liesola, Aker Yards OyMatti Ollila, Elisa Corporation
INVESTMENTS
A difficult year – reasonable returns
Varma’s investments rose to €28.4 billion in 2007 and the
return on invested capital was 6.0%. The situation on the
markets was difficult, but Varma can be satisfied with the
result even though there was no repeat of the high returns
generated during the previous years.
Varma’s financial performance in
2007 was characterised by rising eq-
uity prices and good results during the
first half of the year, while during the
last months of 2007, prices fell as the
equity markets were affected by uncer-
tainties on the US mortgage and debt
markets. The difficult market situation
at the end of the year was balanced out
considerably by the company policy of
diversifying its investments outside
the traditional equity and fixed-
income sectors.
In 2007, Varma diversified its in-
vestments still further and put them
on a broader basis.
Varma’s investments are divided
as follows: fixed-income, equities, real
estate and other investments (hedge
funds). The classification is in accord-
ance with the risks involved and the
assets have also been diversified by
line of business, by geographical loca-
tion and according to company size.
Return on investment at 6.0%
Varma’s investment income for 2007
amounted to €1,632 million, which
meant a return of 6.0%. Adjusted for
inflation, the return was about 4%.
Considering the fact that Varma was
operating on a difficult market, the
results can be considered reason-
able. The company’s solvency stood
at 31.5%.
Equities accounted for €846 mil-
lion, hedge funds for €362 million,
real estate for €283 million and fixed-
income for €269 million of the total
returns.
Investment allocation
The market value of Varma’s invest-
ments at the end of 2007 stood at
€28.4 billion (2006: 26.9).
Guidelines for earnings-related
pension investments were changed in
2007. As a result, insurance compa-
nies are now able increase their equity
investments and diversify their assets
much better between different asset
classes. The changes are significant
and Varma has made extensive use
of the opportunities they have cre-
ated for diversifying its balance sheet
structure.
Varma manages its investment
portfolio actively within each asset
class. The company also uses deriva-
tives for investment risk management
though they are mainly utilised for
hedging and controlling the portfolio
risk level.
Fixed-income portfolio
At the end of the year, fixed-income
investments accounted for 36% (2006:
42%) of Varma’s investment portfolio.
It is mainly in the form of investments
in government-issued bonds though
one third of the portfolio are corpo-
rate loans.
The European Central Bank raised
its key interest rate twice during the
spring of 2007, which resulted in high-
er market rates. Because of growing
uncertainties, the US Federal Reserve
started lowering interest rates in early
autumn, which also led to falls in Eu-
20
• Varma’s mission is to accumulate and augment assets received as pension contributions in order to pay present and future pensions. The invested assets are used exclusively to secure pensions.
• Varma is the largest private investor in Finland. At the end of 2007 the market value of the company’s investments stood at €28.4 billion, the large portfolio making for efficient investment administration.
• Varma encourages those companies whose shares it owns to develop good governance practice. Varma’s principles of ownership policy are aimed at increasing the value of its assets in the long term.
• Varma’s principles of social-responsibility as applied to investment operations define the objectives of
responsible investment. Social responsibility also serves as a tool in seeking higher returns.
RESpONSIBLE LONG-TERM INVESTOR
21
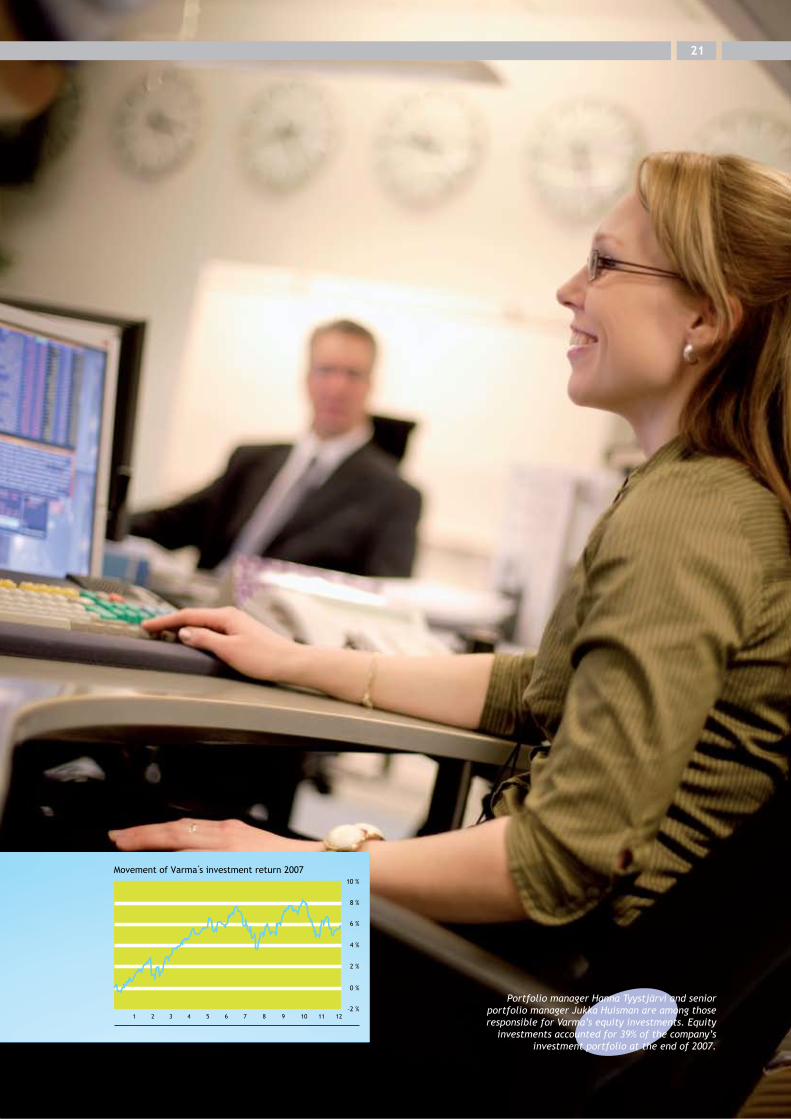
Portfolio manager Hanna Tyystjärvi and senior portfolio manager Jukka Huisman are among those responsible for Varma’s equity investments. Equity
investments accounted for 39% of the company’s investment portfolio at the end of 2007.
10 %
8 %
6 %
4 %
2 %
0 %
–2 %
Movement of Varma s investment return 2007
1 2 3 4 5 6 7 8 9 10 11 12
INVESTMENTS
ropean rates. During the last months
of the year, risk premiums of corpo-
rate loans increased significantly.
In absolute terms, fixed-income
investment generated only modest re-
turns (1.5%) though during the latter
half of the year, they increased signifi-
cantly. Overall, the return was at the
market level.
Varma has also made investments
outside the Euro zone in different as-
set classes. During the year the compa-
ny has, in accordance with its invest-
ment policy, hedged all currency risks.
The hedging against the dollar proved
particularly useful as the US currency
weakened vis-à-vis the euro.
Customer loans are included in
fixed-income assets. Demand for them
was low, though there was marked in-
crease in financing of different types of
corporate restructuring.
Equity portfolio
Equities accounted for 39% (2006:
39%) of Varma’s investment assets.
They comprised listed equities (35%),
private equities (3.2%) and unlisted
equities (1.6%).
The return on listed equities stood
at 5.0%. Dividends were an important
contributory factor as, after increas-
ing rapidly for many years, values rose
only modestly in 2007. Equity prices
rose until June, after which uncertain-
ties set in, causing prices to drop sub-
stantially during the last months of the
22
year. The performance and financial
position of companies still remained
strong.
Suomen Terveystalo Oyj and SRV
Yhtiöt Oyj, two companies in which
Varma holds shares, were listed on
the Helsinki Stock Exchange. Some
”Most of the funds in
Varma’s hedge fund portfolio
are low-risk funds generating
a steady return.”
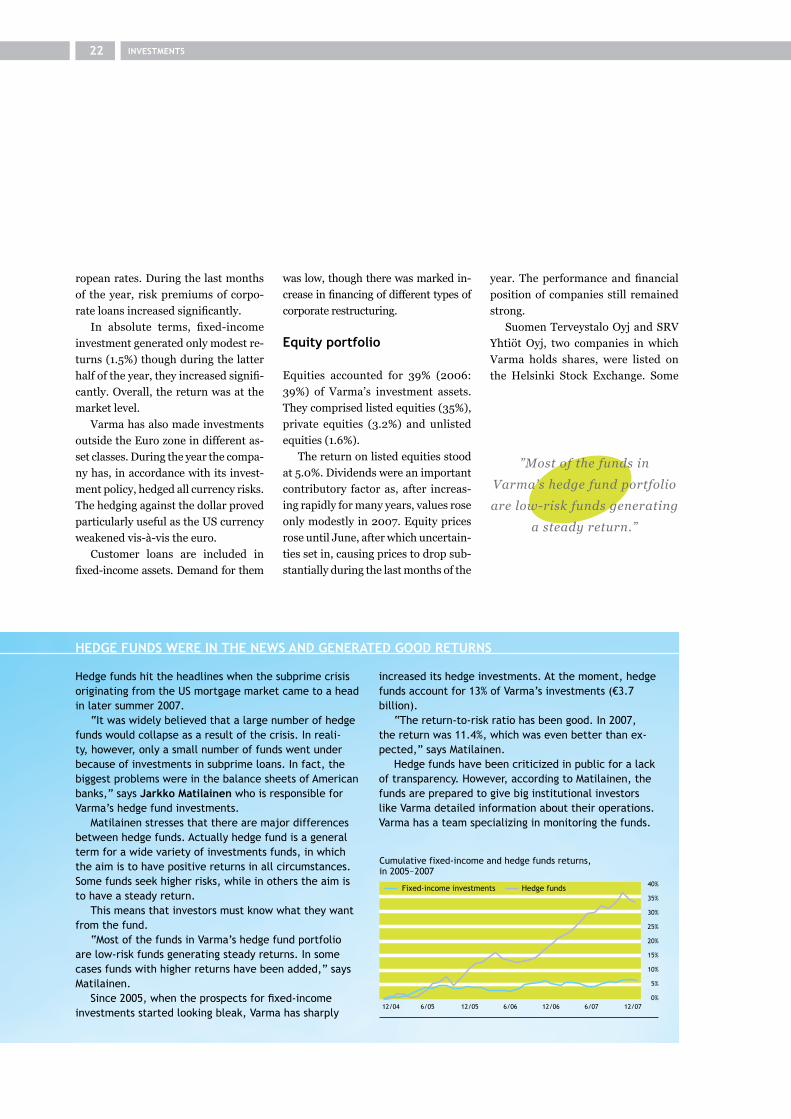
Hedge funds hit the headlines when the subprime crisis originating from the US mortgage market came to a head in later summer 2007.
“It was widely believed that a large number of hedge funds would collapse as a result of the crisis. In reali-ty, however, only a small number of funds went under because of investments in subprime loans. In fact, the biggest problems were in the balance sheets of American banks,” says Jarkko Matilainen who is responsible for Varma’s hedge fund investments.
Matilainen stresses that there are major differences between hedge funds. Actually hedge fund is a general term for a wide variety of investments funds, in which the aim is to have positive returns in all circumstances. Some funds seek higher risks, while in others the aim is to have a steady return.
This means that investors must know what they want from the fund.
“Most of the funds in Varma’s hedge fund portfolio are low-risk funds generating steady returns. In some cases funds with higher returns have been added,” says Matilainen.
Since 2005, when the prospects for fixed-income investments started looking bleak, Varma has sharply
increased its hedge investments. At the moment, hedge funds account for 13% of Varma’s investments (€3.7 billion).
“The return-to-risk ratio has been good. In 2007, the return was 11.4%, which was even better than ex-pected,” says Matilainen.
Hedge funds have been criticized in public for a lack of transparency. However, according to Matilainen, the funds are prepared to give big institutional investors like Varma detailed information about their operations. Varma has a team specializing in monitoring the funds.
HEdGE FuNdS WERE IN THE NEWS ANd GENERATEd GOOd RETuRNS
Cumulative fixed-income and hedge funds returns,in 2005–2007
40%
35%
30%
25%
20%
15%
10%
5%
0%12/04 6/05 12/05 6/06 12/06 6/07 12/07
Fixed-income investments Hedge funds
37% of the shares held by Varma are
listed on the Helsinki Stock Exchange,
about 31% on other European stock ex-
changes and the remaining 32% in the
United States, Japan and the emerging
markets. The shares on the emerging
markets generated the highest returns
(38.7%).
Private equity investments gener-
ated excellent returns (35%). Varma
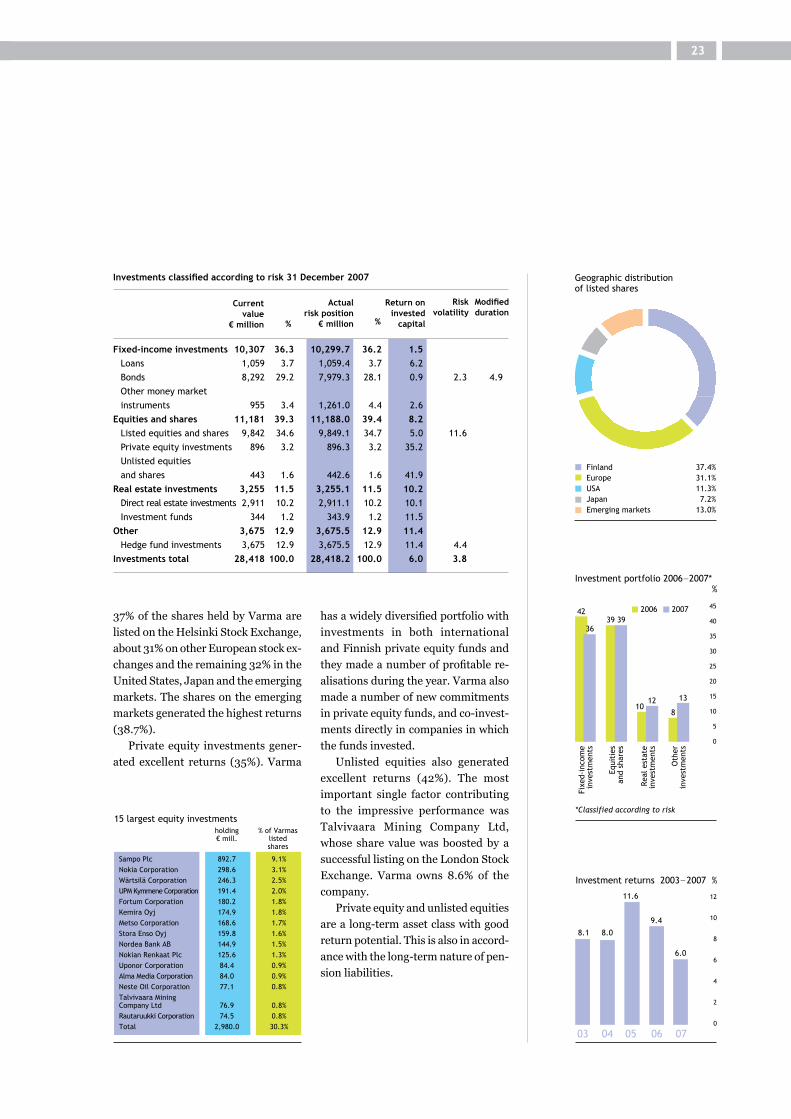
Investment portfolio 2006–2007* %
45
40
35
30
25
20
15
10
5
0
42
108
*Classified according to risk
12 13
3639 39
2006 2007
Fixe
d-in
com
ein
vest
men
ts
Equi
ties
and
shar
es
Real
est
ate
inve
stm
ents
Oth
erin
vest
men
ts
0
500
1000
1500
2000
2500
3000
3500
omistus % Varmanmilj.€ osake-
salkusta
Sampo Oyj 1 001,9 10,3 %YIT Oyj 147,9 1,5 %Nordea Bank AB 148,6 1,5 %Stora Enso Oyj A 143,7 1,5 %Fortum Oyj 123,8 1,3 %Uponor Oyj 113,4 1,2 %Metso Oyj 105,0 1,1 %Nokia Oyj 85,1 0,9 %BP Amoco Plc 83,0 0,9 %Total SA 76,6 0,8 %Vodafone Airtouch Plc 75,1 0,8 %Cargotec Oyj B 72,0 0,7 %Novartis 70,6 0,7 %Neste Oil Oyj 69,1 0,7 %Nokian Renkaat Oyj 68,7 0,7 %Yhteensä 2 384,5 24,5 %
15 suurinta osakesijoitusta
15 largest equity investments holding % of Varmas
€ mill. listedshares
Sampo Plc 892.7 9.1%Nokia Corporation 298.6 3.1%Wärtsilä Corporation 246.3 2.5%UPM Kymmene Corporation 191.4 2.0%Fortum Corporation 180.2 1.8%Kemira Oyj 174.9 1.8%Metso Corporation 168.6 1.7%Stora Enso Oyj 159.8 1.6%Nordea Bank AB 144.9 1.5%Nokian Renkaat Plc 125.6 1.3%Uponor Corporation 84.4 0.9%Alma Media Corporation 84.0 0.9%Neste Oil Corporation 77.1 0.8%Talvivaara MiningCompany Ltd 76.9 0.8%Rautaruukki Corporation 74.5 0.8%Total 2,980.0 30.3%
has a widely diversified portfolio with
investments in both international
and Finnish private equity funds and
they made a number of profitable re-
alisations during the year. Varma also
made a number of new commitments
in private equity funds, and co-invest-
ments directly in companies in which
the funds invested.
Unlisted equities also generated
excellent returns (42%). The most
important single factor contributing
to the impressive performance was
Talvivaara Mining Company Ltd,
whose share value was boosted by a
successful listing on the London Stock
Exchange. Varma owns 8.6% of the
company.
Private equity and unlisted equities
are a long-term asset class with good
return potential. This is also in accord-
ance with the long-term nature of pen-
sion liabilities.
23
0
2
4
6
8
10
12
Investment returns 2003–2007 %
03 04 05 06 07
8.1 8.0
11.6
9.4
6.0
Fixed-income investments 10,307 36.3 10,299.7 36.2 1.5 Loans 1,059 3.7 1,059.4 3.7 6.2 Bonds 8,292 29.2 7,979.3 28.1 0.9 2.3 4.9 Other money market instruments 955 3.4 1,261.0 4.4 2.6 Equities and shares 11,181 39.3 11,188.0 39.4 8.2 Listed equities and shares 9,842 34.6 9,849.1 34.7 5.0 11.6 Private equity investments 896 3.2 896.3 3.2 35.2 Unlisted equities and shares 443 1.6 442.6 1.6 41.9 Real estate investments 3,255 11.5 3,255.1 11.5 10.2 Direct real estate investments 2,911 10.2 2,911.1 10.2 10.1 Investment funds 344 1.2 343.9 1.2 11.5 Other 3,675 12.9 3,675.5 12.9 11.4 Hedge fund investments 3,675 12.9 3,675.5 12.9 11.4 4.4 Investments total 28,418 100.0 28,418.2 100.0 6.0 3.8
Geographic distributionof listed shares
Finland 37.4%Europe 31.1%USA 11.3%Japan 7.2%Emerging markets 13.0%
Investments classified according to risk 31 December 2007
Modified duration
Current value
€ million
Return on invested
capital
Risk volatility
% %
Actual risk position
€ million

INVESTMENTS
Real estate portfolio
A large number of real estate trans-
actions were made in Finland during
2007 and their value totalled about €6
billion.
Volatility on international money
markets also had an impact on Finnish
real estate markets. It meant higher
lending margins and less frequent use
of debt leverage.
Investors have become more criti-
cal and assess real estate risks more
carefully. Prices are no longer rising
but market liquidity remains good.
International investors are now active
as both sellers and buyers.
Occupancy rates have improved
and the rents of the best premises
have increased. Construction of busi-
ness premises remains brisk but the
number of new project starts has al-
ready peaked.
The market value of Varma’s real-
estate portfolio in 2007 totalled about
€2.9 billion, of which €127 million was
real estate used by the company for its
own purposes. The return on capital
employed in direct real-estate invest-
ments was 10.1%. The increase of
about €80 million in the market value
resulting from real-estate assessments
helped to increase the total return on
Varma’s real estate investments. The
vacancy rate of business premises at
the end of the year stood at 4.5%.
24
In 2007, the focus of Varma’s real
estate business was on construc-
tion and real-estate development.
A number of major new buildings will
be completed during 2008: Varma’s
new head office in the district of
Salmisaari in Helsinki, a shopping
centre in Tornio and the Flamingo
entertainment centre in Vantaa.
Most of the 6.0% return generated by Varma’s investment portfolio in 2007 came from equity investments. They contributed 52% of the total.
While producing high returns, equity investments also account for most of the market risk in Varma’s invest-ment portfolio. They were responsible for 96% of the market risk, even though their average share weight was well under 40%. The investment portfolio market risk means the volatility of actual returns, and for Varma the figure was 5.1% for 2007.
Fixed-income investments contributed 10% of Varma’s total portfolio returns. In addition to generating good returns, they have also helped to lower the market risk of the company’s investment portfolio. Returns on fixed-income investments have been highest when equity mar-kets have been in their steepest decline. Fixed-income investments have provided Varma with some protection against the volatility on the equity markets, though they have not been very effective in this respect.
Real estate investments generated a relatively steady cash flow throughout the year, and changes in values were moderate. Real estate investments contributed 16%
of Varma’s total portfolio returns, and their volatility (market risk) was fairly low.
Other investments are mostly hedge funds, which contributed 22% of Varma’s overall investment portfo-lio returns. Their risk contribution was relatively low, amounting to 7% of the investment portfolio’s market risk.
MOST OF THE pORTFOLIO’S MARkET RISk COMES FROM EquITY INVESTMENTS
”Varma supports work done
in Finland. In addition to
holding listed equities,
Varma is an active private-
equity investor on the
Finnish market.”
-20
0
20
40
60
80
100
Varma’s investment returns and market risksby asset class %
Return contributionRisk contribution
0
20
40
60
80
100
-10Fixed-incomeinvestments
Equities andshares
Real estateinvestments
Otherinvestments

Real estate portfolio 2007
Office premises 46%Residental 15%Business premises 19%Industrial facilities 9%Warehouse space 6%Other operating premises 3%Other 2%
Total €2.9 billion
25
In line with its ownership policy, Varma supports work done in Finland. In addition to holding listed equities, Varma is an active private-equity investor on the Finnish market. It knows Finnish companies well and is a preferred partner. Preference is given to investments in Finland if Varma’s return expectations and quality criteria are met.
As in previous years, there were a number of projects in progress during 2007. Varma made new investment commitments in private-equity funds and a number of direct investments in companies in the form of share capital, mezzanine financing and traditional corporate funding.
private-equity funds During the last two years, Varma has made new invest-ment commitments totalling some €200 million in Finnish private-equity funds. The company is a partner
in corporate acquisition funds investing in traditional sectors and in venture-capital funds involved in earlier stages of business development.
Mezzanine financing and investment in unlisted equitiesVarma is an active direct investor in unlisted Finnish firms, such as growth companies. It also makes invest-ments in connection with corporate restructurings and other corporate changes. Investments have been in the form of share capital and mezzanine instruments such as mezzanine loans.
Corporate fundingIn addition to traditional client lending, Varma is also actively involved in the financing of different types of corporate restructuring.
ACTIVE pRIVATE-EquITY INVESTOR IN FINLANd
Other investments
Varma’s other investments are in the
form of hedge funds, which accounted
for 13% of the company’s investments
during 2007 (2006: 8%). The return
was a very good 11.4%.
Because of weak return prospects
for fixed-income investments, Varma
continued to transfer assets from
fixed-income investments to hedge
funds during 2007. The return on
hedge funds exceeded that of fixed-in-
come investments and equities. Risks
remained at moderate levels because
the volatility or standard deviation of
the returns was substantially lower
than in equity investments.
About one fifth of Varma’s hedge
fund investments are in funds of funds,
while most are in 57 individual hedge
funds. The company has diversified its
fund portfolio into investments strate-
gies of very different types, and the fo-
cus is on low-risk and market-neutral
multi-strategies comprising a broad
range of investments.
Investment policy
Varma is a long-term investor. The aim
of its investment operations is to secure
the payment of pensions, which means
that every effort is made to obtain the
best possible return without endanger-
ing the company’s operations. For this
reason, the emphasis is on the broad
diversification of assets and a cautious
approach to risk taking.
Top-quality service through expertise
Changes in society and in customer needs are key considera-
tions when Varma develops its operating approaches, services
and staff competence. Customer satisfaction and the func-
tioning of Finland’s earnings-related pension system can only
be secured through efficient and successful operations.
The aim of Varma is to offer the best
service. In 2007, the focus in compe-
tence development was on expertise,
project skills, customer-service, and
the sharing of experiential knowledge.
Varma’s development work has
also produced results: in the 2007
customer satisfaction survey the com-
pany received particularly high marks
for its personal customer service, level
of expertise, a cooperative approach
and reliability.
Varma’s staff members also value
the competence-development work.
In an internal corporate image survey
carried out by Corporate Image Oy in
September 2007, the employees were
particularly satisfied with the induc-
tion and the adequacy of the training
opportunities provided by the em-
ployer.
Training for changes
Changes can affect occupational well-
being in many ways. In autumn 2008,
Varma will move to a new head office
in Salmisaari and a number of working
groups have been preparing the proc-
ess. To make the move and the chang-
es it involves smoother, the company
has also set up an occupational well-
being team.
The new approach is also evident
in Varma’s new strategy, which was
completed in autumn 2007. While
Varma will remain committed to its
core task, the securing of pensions, it
will also continue to develop its oper-
ating approaches in accordance with
the company strategy.
26 pERSONNEL
TyEL insurance expert Arja Lehikoinen (left) and network service expert Meri Savola are pleased with the broad range of topics covered during expert training.
”By combining and
sharing expertise, Varma
can provide the best
service in the sector.”
In 2007 Varma organised training for its experts in which the focus was on the sharing of expertise, networking, anticipation of the need to change, and the continuous development of skills.
The training helps Varma to achieve its aim of providing customers with top expertise and the best earnings-related pension services.
Among the Varma staff members taking part were Arja Lehikoinen, a TyEL insurance expert, and Meri Savola, a network service expert. They praise the training for being interesting and covering a broad range of topics.
According to Lehikoinen and Savola, the expert presentations covering different fields gave the participants a broader picture of the operating environment in the earnings-related pension sector. In their opinion, it is especially important for Varma to know how the client companies operate when it develops new customer-service approaches.
The training was a cooperative effort between Varma and Finva, an expert in financial and insurance training, and it will continue in 2008.
TRAINING HELpS TO IMpROVE THE SkILLS OF VARMA’S ExpERTS
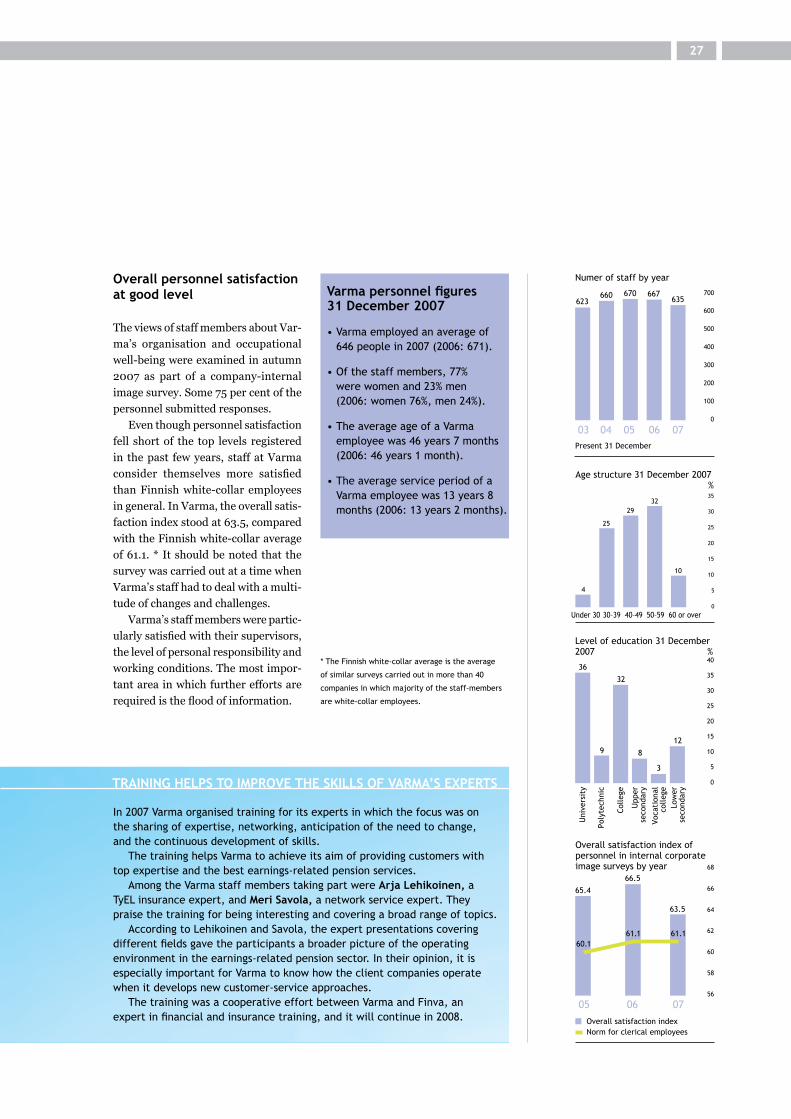
Overall personnel satisfaction at good level
The views of staff members about Var-
ma’s organisation and occupational
well-being were examined in autumn
2007 as part of a company-internal
image survey. Some 75 per cent of the
personnel submitted responses.
Even though personnel satisfaction
fell short of the top levels registered
in the past few years, staff at Varma
consider themselves more satisfied
than Finnish white-collar employees
in general. In Varma, the overall satis-
faction index stood at 63.5, compared
with the Finnish white-collar average
of 61.1. * It should be noted that the
survey was carried out at a time when
Varma’s staff had to deal with a multi-
tude of changes and challenges.
Varma’s staff members were partic-
ularly satisfied with their supervisors,
the level of personal responsibility and
working conditions. The most impor-
tant area in which further efforts are
required is the flood of information.
Numer of staff by year
03 04 05 06 07Present 31 December
623660 670 667
0
100
200
300
400
500
600
700635
Age structure 31 December 2007 %
Under 30 30–39 40–49 50–59 60 or over0
5
10
15
20
25
30
4
25
2932
10
35
Uni
vers
ity
Poly
tech
nic
Colle
ge
Upp
erse
cond
ary
Voca
tion
alco
llege
Low
erse
cond
ary
0
5
10
15
20
25
30
35
Level of education 31 December2007 %
36
9
32
8
3
12
40
Overall satisfaction index ofpersonnel in internal corporateimage surveys by year
05 06 0756
58
60
62
64
66
Overall satisfaction indexNorm for clerical employees
66.5
63.5
60.161.1 61.1
65.4
68
27
Varma personnel figures 31 december 2007
• Varma employed an average of 646 people in 2007 (2006: 671).
• Of the staff members, 77% were women and 23% men (2006: women 76%, men 24%).
• The average age of a Varma employee was 46 years 7 months (2006: 46 years 1 month).
• The average service period of a Varma employee was 13 years 8 months (2006: 13 years 2 months).
* The Finnish white-collar average is the average
of similar surveys carried out in more than 40
companies in which majority of the staff-members
are white-collar employees.

CORpORATE GOVERNANCE
Corporate governance
Corporate governance is an owner value for Varma. A key
objective is to ensure the transparency of the company’s
operations and administration, which in turn will contribute
to strengthening public confidence in the earnings-related
pension scheme.
Varma’s governance is based on the
Finnish Employee Pension Insurance
Companies Act, secondary provisions,
and the provisions of the Insurance
Companies Act and the Companies Act
specifically mentioned in the Employ-
ee Pension Insurance Act. Varma also
complies with the applicable provisions
of the Corporate Governance Recom-
mendation for Listed Companies.
The point of departure for Varma’s
corporate governance is the company’s
core task, that of securing pensions.
The statutory earnings-related pension
scheme was created by an agreement
concluded between the government
and labour market organisations, and
the tripartite model still plays a key
role in the development of the system.
Labour market organisations also par-
ticipate in the administration of earn-
ings-related pension companies.
Varma’s central executive organs
are the Annual General Meeting, the
Supervisory Board, the Board of Di-
rectors and the Managing Director.
Annual General Meeting
Policyholders and the personnel em-
ployed by them (the insured) are
Varma’s customers. Varma is a mu-
tual company. This means that the
policyholders and the insured have a
right based on a client relationship to
participate in decision making in the
Annual General Meeting; there is no
client relationship without the right to
participate.
In 2007, the Annual General Meet-
ing was held on 22 March.
Supervisory Board
As prescribed in the Finnish Employee
Pension Insurance Companies Act,
Varma has a Supervisory Board that is
responsible for supervising the com-
pany’s administration by the Board of
Directors and Managing Director.
The Supervisory Board has 28
members of which seven members
are elected from among the candi-
dates put forward by major employer
organisations; correspondingly, seven
members are representatives of major
employee organisations. In 2007 the
Supervisory Board convened three
t imes. Average attendance was
65.5%. The members of the Supervi-
sory Board are presented on page 31.
Remunerations to the Supervisory
Board are decided by the Annual Gen-
eral Meeting. In 2007, an annual re-
muneration of €5,000 was paid to the
Chairman of the Supervisory Board,
€3,800 to the Deputy Chairmen and
€2,500 to the members. The meeting
fee was €300 per meeting.
Board of directors
The job of the Board of Directors is
to manage Varma with professional
know-how and according to sound
business principles. The Board of
Directors shall take care of Varma’s
administration and operational or-
ganisation in an appropriate manner,
providing the Managing Director with
the necessary instructions.
Varma’s Board of Directors com-
prises 12 members and three deputy
members. Board members, deputy
members, the Chairman and the
Deputy Chairmen are elected by the
Supervisory Board. Three Board
members and one deputy member are
elected from among the candidates
put forward by major employer or-
ganisations; correspondingly, three
members and one deputy member are
representatives of major employee or-
ganisations. The rest, that is, half of
the members and one deputy member,
can be freely elected. The members of
the Board of Directors are presented
on pages 32–35.
The Board of Directors convened 12
times in 2007. Average attendance was
88.6 %, including deputy members.
Committees The presiding officers and the Manag-
ing Director convene when necessary
to prepare matters to be presented to
the Board of Directors. The presiding
officers are the Chairman and Deputy
Chairmen of the Board of Directors.
TheAuditCommittee supervis-
es, among other things, the company’s
financial and other reporting, and the
status of internal control. The com-
pany’s Supervisory Auditor is invited
to a Committee meeting at least once
a year. The director responsible for the
internal audit acts as the secretary of
the Committee. The Audit Committee
reports on its actions and observations
to the Board of Directors.
The Audit Committee met twice in
2007 and discussed such matters as
internal control and risk management
at Varma, and plans and reports com-
piled by the company auditors and in-
ternal auditing.
28

The Compensation and Ap-
pointment Committee prepares
both the company’s incentive systems
and the general principles of reward
for the management for the Board of
Directors. The proposals of the Com-
mittee are submitted for decision to
the Board of Directors. The Commit-
tee convened twice in 2007.
In its meeting held on 18 January
2007, the Board of Directors elected
Jyrki Juusela, Mikko Mäenpää, Bir-
gitta Kantola and Markku Pohjola as
members of the Audit Committee;
and Jyrki Juusela, Mikko Mäenpää
and Ole Johansson as members of
the Compensation and Appointment
Committee.
Remunerations Remunerations to the Board of Di-
rectors are decided by the Supervi-
sory Board. In 2007, an annual fee of
€22,000 was paid to the Chairman
of the Board, €16,500 to the Deputy
Chairman, €11,000 to the members
and €8,000 to the deputy members.
The meeting fee was €450 per meeting
to the Chairman, €400 to the Deputy
Chairmen, and €300 to members and
deputy members. Meeting fees for the
members of the Committees were the
same as those paid to the Board mem-
bers.
There are no members of the Ex-
ecutive Group on the Varma Board
of Directors. Neither have any of the
members of the Board of Directors
had an employment relationship with
or held a position in Varma in 2007 or
during the two years prior to that; nor
do any of them receive compensation
from Varma for services rendered or
other advice not connected with the
duties of the Board.
Managing Director and other management
The Managing Director is in charge of
Varma’s current administration as ad-
vised by the Board of Directors and is
responsible for the daily management
of the company.
Varma’s Managing Director is
Matti Vuoria. The Deputy Managing
Director is Markku Hyvärinen, Ex-
ecutive Vice-President. The Managing
Director and deputy to the Managing
Director are appointed by the Board of
Directors.
The Managing Director is assisted
in his task of managing the company
by the Executive Group, which com-
prises the Managing Director and
eight management representatives
and two employee representatives.
The mission of the Executive Group
is to steer and develop Varma’s op-
erations in order to reach the strategic
goals approved by the Board of Direc-
tors. Varma’s Executive Group is pre-
sented on pages 36–37.
29
Under the legislative reforms introduced in 2007, earnings-related pension companies must have an Elec-tion Committee, a new body, whose role is, in coopera-tion with the Supervisory Board, to draw up proposals for Supervisory Board and Board of Directors members. The Election Committee submits a proposal to the An-nual General Meeting on the election of new Supervisory Board members as successors for those with expiring terms, and their remunerations and a similar proposal to
the Supervisory Board concerning members of the Board of Directors.
Varma’s six-member Election Committee is chaired by Pekka Paasikivi, chairman of the Supervisory Board. Of the Committee members Martti Alakoski (deputy chair-man), Mikko Mäenpää and Veli-Matti Töyrylä represent the insured, while Ole Johansson and Tapio Kuula repre-sent the policyholders.
”By having transparent
administrative and
operational practices, Varma
helps to strengthen trust in
the pension system.”
THE ELECTION COMMITTEE
CORpORATE GOVERNANCE
Investment Committee
The Investment Committee deals with
major investment issues that are sub-
mitted for decision to the Managing
Director. The Committee prepares
investment proposals for the Board
of Directors and makes decisions on
matters in which it has the power of
decision (granted in the annually con-
firmed investment plan) and that have
not been delegated to a lower level in
the organisation. In addition, the Com-
mittee monitors investment risks.
The Investment Committee com-
prises the Managing Director and the
executives responsible for investment
operations.
Remunerations and pension plans
In 2007 the remunerations and fringe
benefits received by Managing Direc-
tor Matti Vuoria totalled €638,554. He
is set to retire at the age of 60 and his
pension will amount to 60% of the cal-
culated pensionable salary. The Man-
aging Director’s period of notice is six
months, in addition to which he is en-
titled to a compensation amounting to
six months’ salary. The remunerations
and fringe benefits of Executive Vice-
President Markku Hyvärinen totalled
€346,949 and his retirement age is 60
years.
The Board of Directors decides on
the salaries and benefits of the Manag-
ing Director, Deputy Managing Direc-
tor, and executives appointed by the
Board of Directors.
The total remuneration to the man-
agement consists of salary plus fringe
benefits, and a payment-by-results in-
centive set annually.
30
Internal control, risk management and internal auditing
Internal control means the procedures
that the company uses to ensure eco-
nomical, efficient and reliable opera-
tions. Risk management is a central
part of Varma’s internal control.
Overall responsibility for organis-
ing internal control lies with Varma’s
Board of Directors, which lays down
the internal control principles and
assesses the state of internal control
each year. The Audit Committee as-
sists the Board of Directors in matters
related to internal control. The com-
pany management is responsible for
carrying out internal control. Internal
auditing assists the Board of Directors,
the Audit Committee and the company
management by producing assess-
ments and development proposals on
internal control procedures.
Varma’s risk management and con-
trol systems are described in greater
detail in the financial statemens on
pages 41–46.
Auditing
The Annual General Meeting on 22
March 2007 elected Raija-Leena
Hankonen, Authorised Public Ac-
countant, and Jaakko Nyman, Author-
ised Public Accountant, as Varma’s
auditors, and KPMG Oy Ab and Paula
Pasanen, Authorised Public Account-
ant, as deputy auditors. The Supervi-
sory Auditor is Raija-Leena Hankonen
and the Deputy Supervisory Auditor is
Jaakko Nyman. In 2007, auditors’ re-
munerations amounted to €216,000.
In addition, the auditing companies
were paid €29,000 in consultation
fees.
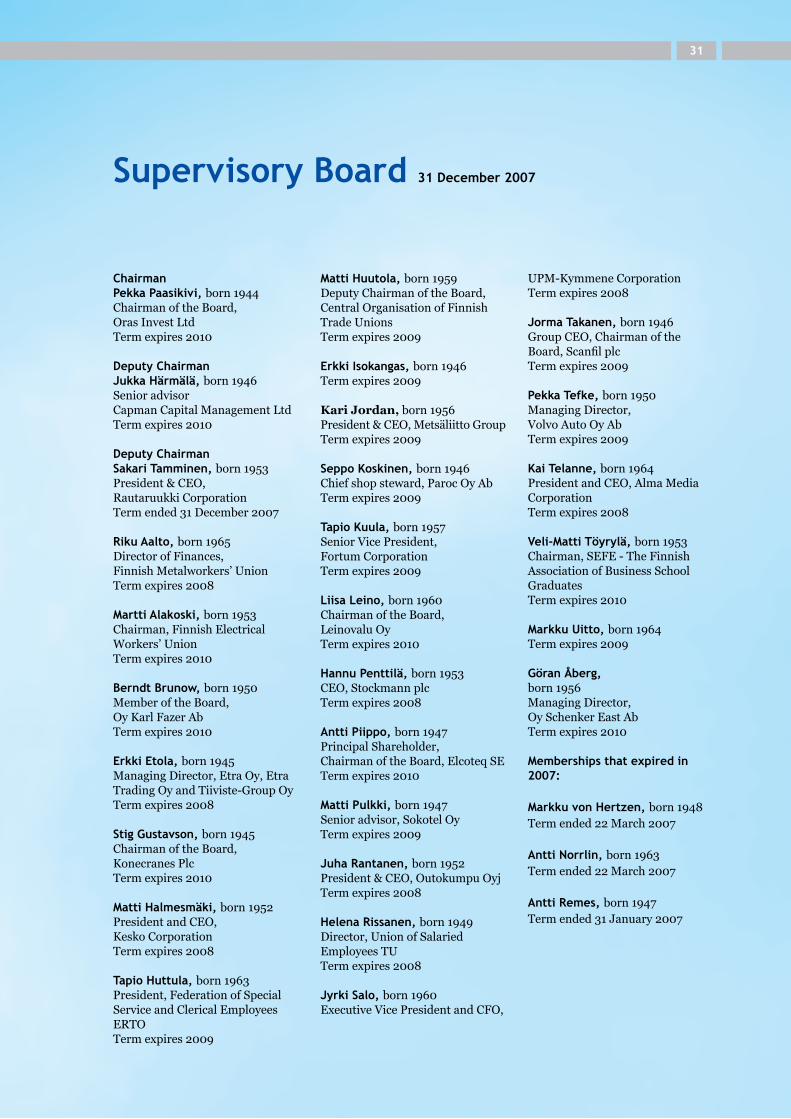
ChairmanPekka Paasikivi, born 1944Chairman of the Board, Oras Invest LtdTerm expires 2010
deputy ChairmanJukka Härmälä, born 1946Senior advisor Capman Capital Management LtdTerm expires 2010
deputy ChairmanSakari Tamminen, born 1953President & CEO, Rautaruukki CorporationTerm ended 31 December 2007
Riku Aalto, born 1965Director of Finances, Finnish Metalworkers’ UnionTerm expires 2008
Martti Alakoski, born 1953Chairman, Finnish Electrical Workers’ UnionTerm expires 2010
Berndt Brunow, born 1950Member of the Board, Oy Karl Fazer AbTerm expires 2010
Erkki Etola, born 1945Managing Director, Etra Oy, Etra Trading Oy and Tiiviste-Group OyTerm expires 2008
Stig Gustavson, born 1945Chairman of the Board,Konecranes PlcTerm expires 2010
Matti Halmesmäki, born 1952President and CEO, Kesko CorporationTerm expires 2008
Tapio Huttula, born 1963President, Federation of Special Service and Clerical Employees ERTOTerm expires 2009
Matti Huutola, born 1959Deputy Chairman of the Board, Central Organisation of Finnish Trade Unions Term expires 2009
Erkki Isokangas, born 1946 Term expires 2009
Kari Jordan, born 1956President & CEO, Metsäliitto GroupTerm expires 2009
Seppo Koskinen, born 1946Chief shop steward, Paroc Oy AbTerm expires 2009
Tapio kuula, born 1957Senior Vice President, Fortum CorporationTerm expires 2009
Liisa Leino, born 1960Chairman of the Board, Leinovalu OyTerm expires 2010
Hannu Penttilä, born 1953CEO, Stockmann plcTerm expires 2008
Antti piippo, born 1947Principal Shareholder, Chairman of the Board, Elcoteq SETerm expires 2010
Matti Pulkki, born 1947Senior advisor, Sokotel OyTerm expires 2009
Juha Rantanen, born 1952President & CEO, Outokumpu OyjTerm expires 2008
Helena Rissanen, born 1949Director, Union of Salaried Employees TUTerm expires 2008
Jyrki Salo, born 1960Executive Vice President and CFO,
UPM-Kymmene CorporationTerm expires 2008
Jorma Takanen, born 1946Group CEO, Chairman of the Board, Scanfil plcTerm expires 2009
Pekka Tefke, born 1950Managing Director, Volvo Auto Oy AbTerm expires 2009
kai Telanne, born 1964President and CEO, Alma Media CorporationTerm expires 2008
Veli-Matti Töyrylä, born 1953Chairman, SEFE - The Finnish Association of Business School GraduatesTerm expires 2010
Markku Uitto, born 1964Term expires 2009
Göran Åberg, born 1956Managing Director, Oy Schenker East AbTerm expires 2010
Memberships that expired in 2007:
Markku von Hertzen, born 1948Term ended 22 March 2007
Antti Norrlin, born 1963Term ended 22 March 2007
Antti Remes, born 1947Term ended 31 January 2007
Supervisory Board 31 december 2007
31
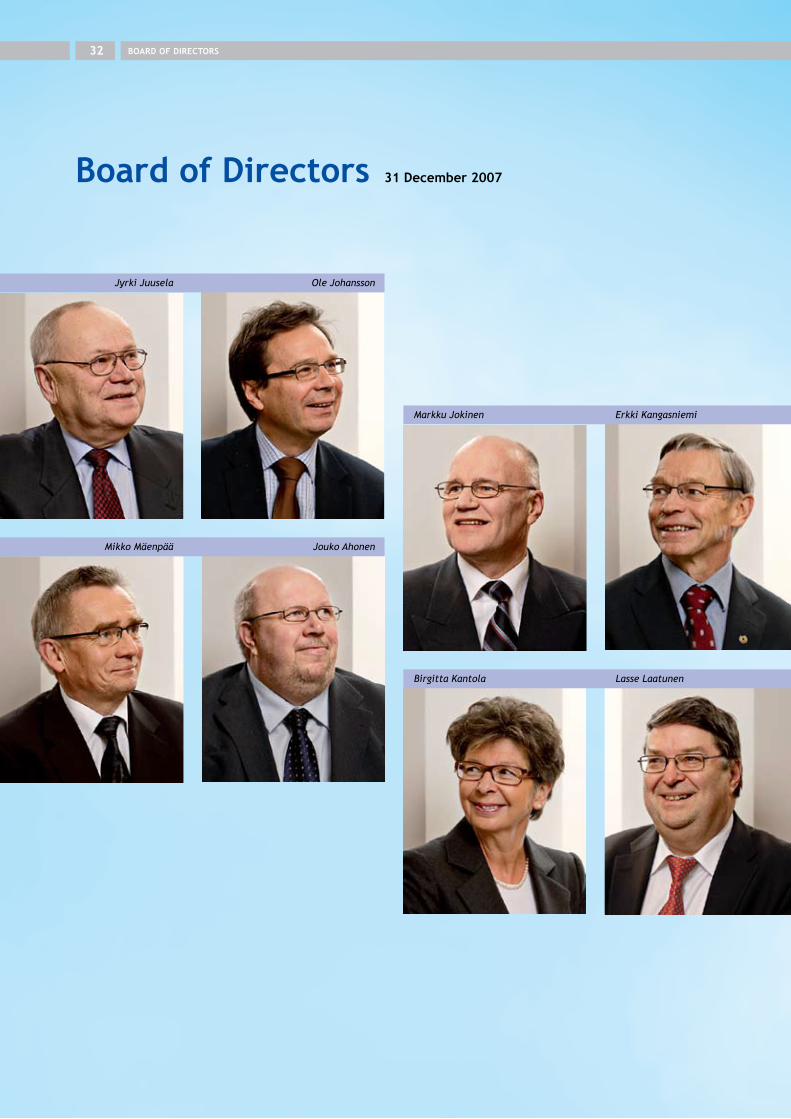
Board of directors 31 december 2007
BOARd OF dIRECTORS32
Jyrki Juusela
Mikko Mäenpää
Ole Johansson
Jouko Ahonen
Markku Jokinen
Birgitta Kantola
Erkki Kangasniemi
Lasse Laatunen

Birgitta Kantola, born 1948
Member as of 2004
Term expires 2009
Member of the Boards of Nordea
Bank AB, Fortum Corporation,
Stora Enso Oyj, Åbo Akademi,
Vasakronan AB and OMX AB.
Lasse Laatunen, born 1950
Director, Confederation of Finnish
Industries EK
Member as of 1998
Term expires 2009
Member of the Boards of the Finnish
Centre for Pensions, the Federation
of Accident Insurance Institutions
and the Social Insurance Institution
Elected on the proposal of the
Confederation of Finnish Industries
EK
ChairmanJyrki Juusela, born 1943
Member as of 2004
Term expires 2008
deputy ChairmanOle Johansson, born 1951
President & CEO,
Wärtsilä Corporation
Member as of 2005
Term expires 2010
Chairman of the Board of Technolo-
gy Industries of Finland, Vice Chair-
man of the Boards of Outokumpu
Oyj and the Confederation of Finnish
Industries EK
Elected on the proposal of the Con-
federation of Finnish Industries EK
deputy ChairmanMikko Mäenpää, born 1954
President, Finnish Confederation
of Salaried Employees STTK
Member as of 2000
Term expires 2009
Member of the Representatives of the
Finnish Centre for Pensions, member
of the Economic Council, member of
the Boards of Nordic Trade Unions
and the European Trade Union
Confederation ETUC
Elected on the proposal of the
Finnish Confederation of Salaried
Employees STTK
33
Jouko Ahonen, born 1954
Chairman, Finnish Paperworkers’
Union
Member as of 2003
Term expires 2008
Member of the Representatives of the
Finnish Centre for Pensions, member
of the Board of the Central Organi-
sation of Finnish Trade Unions SAK
Elected on the proposal of the Central
Organisation of Finnish Trade
Unions SAK
Markku Jokinen, born 1949
Managing Director, Sievin Jalkine
Oy, Sievi Marketing Oy, Sievi Tools
Oy and JJJ Capital Oy
Member as of 1998
Term expired 31 December 2007
Member of the Confederation of
Finnish Industries EK in SMI delega-
tion
Erkki Kangasniemi, born 1945
President, The Trade Union of
Education in Finland, OAJ
Member as of 1998
Term expires 2010
President of the Public Sector Negoti-
ating Commission JUKO, 1st Vice-
President of the Confederation of
Unions for Academic Professionals,
Vice Chairman of the Supervisory
Board of Kaleva Mutual Insurance
Company, member of the Supervi-
sory Board of Helsinki Op Bank Plc
Elected on the proposal of the Con-
federation of Unions for Academic
Professionals AKAVA
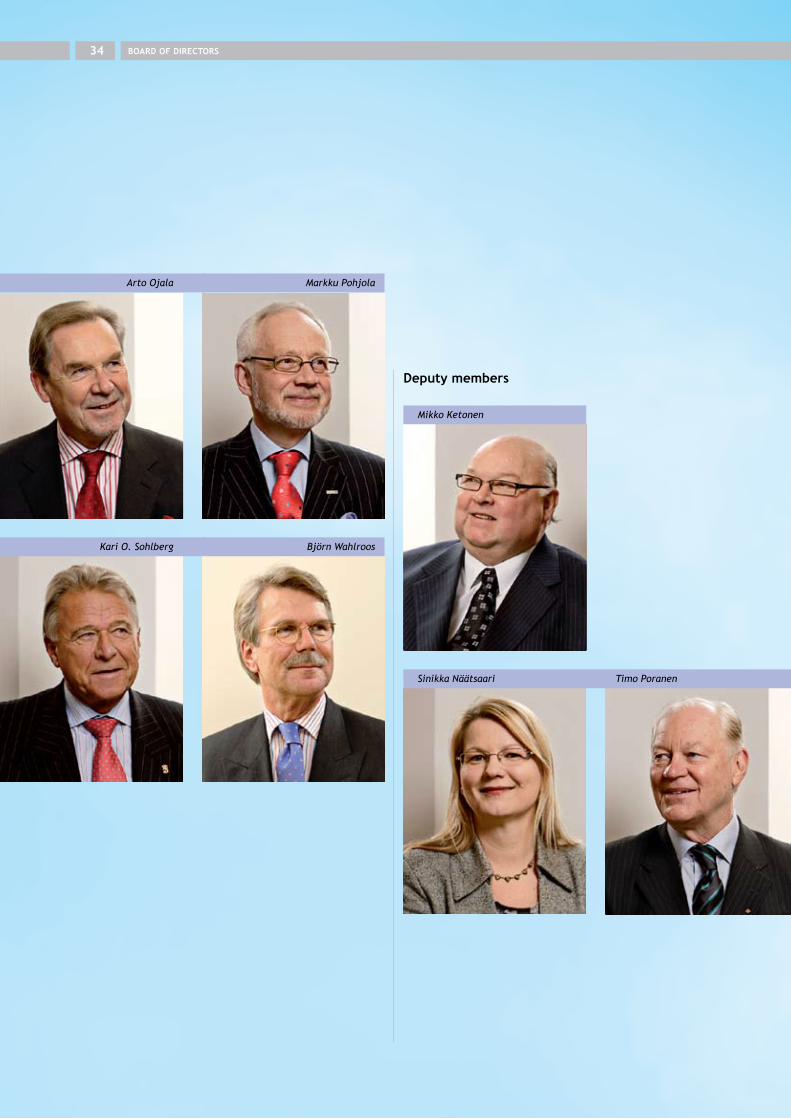
BOARd OF dIRECTORS34
Arto Ojala
Kari O. Sohlberg
Markku Pohjola
Björn Wahlroos
Mikko Ketonen
Timo PoranenSinikka Näätsaari
deputy members
35
More detailed information
about the work experience
of and positions of trust held
by the members of the Board
of Directors can be found at
www.varma.fi.
Arto Ojala, born 1944
Member as of 1999
Term expires 2008
Elected on the proposal of the
Confederation of Finnish
Industries EK
Markku Pohjola, born 1948
Deputy Group CEO,
Nordea Bank AB
Member as of 2004
Term expires 2009
Member of the Board of OMX AB
Kari O. Sohlberg, born 1940
Member as of 1998
Term expires 2008
Member of the Board of Oy G.W.
Sohlberg Ab
Björn Wahlroos, born 1952
President and Group CEO,
Sampo Plc
Member as of 2001
Term expired 31 December 2007
Member of the Board of Sampo plc
deputy members
Mikko Ketonen, born 1945
Chairman of the Board,
TS-Yhtymä Oy
Member as of 1998
Term expires 2010
Chairman of the Board of Priimus
Group Oy
Sinikka Näätsaari, born 1961
Programme Manager, Central
Organisation of Finnish
Trade Unions SAK
Member as of 2007
Term expires 2010
Member of the Board of the Social
Insurance Institution, member of
Sosiaaliturvan uudistamiskomitea,
member of the Board of The Federa-
tion of Accident Insurance Institu-
tions, deputy member of the Board of
the Finnish Centre for
Pensions
Elected on the proposal of the trade
union confederations
Timo poranen, born 1943
Member as of 1998
Term expired 31 December 2007
Member of the Board of
Konecranes Plc
Elected on the proposal of the
Confederation of Finnish
Industries EK
Arto kuusiola, born 1952
Director, Central Organisation
of Finnish Trade Unions SAK
Term expired 1 May 2007
Thefollowingnewmembers
areelectedasof1January2008
(decisionoftheSupervisory
Board4December2007):
Ordinary members:
Kari Stadigh, born 1955Group Deputy CEO, Sampo Plc
Term expires 2008
Sakari Tamminen, born 1953President & CEO,
Rautaruukki Corporation
Term expires 2010
Deputy member:
Anne Brunila, born 1957President and CEO, Finnish Forest
Industries Federation
Term expires 2010
ExECuTIVE GROup ANd OTHER MANAGEMENT36
Matti Vuoria President & CEOBorn 1951Work experience includes:Full-time Chairman of the Board of Directors,Fortum Corporation 1998–2003Secretary General, Ministry of Trade and Industry 1992–1998
Vice Chairman of the Board of Sampo plc, member of the Boards of Danisco A/S, Stora Enso Oyj and Wärtsilä Oyj Abp, Chairman of the Board of the Securi-ties Market Association and the Finnish Pension Alliance TELA and member of the Board of the Federation of Finnish Financial Services.
Member of the Executive Group since 2004
Markku Hyvärinen Executive Vice-PresidentBorn 1948Work experience includes:Managing Director, Sampo Pension 1996–1998General Secretary, The Finnish Social Democratic Party 1991–1996
Member of the Boards of If P&C Insur-ance Holding Ltd and Finnair Plc, Vice Chairman of the Board of Kaleva Mutual Insurance Company
Member of the Executive Group since 1998
Eija Kaipainen-Perttula Senior Vice-President, Development and Insurance Services Born 1958Work experience includes:Director of Insurance and Major Client Contacts, Varma 2006–2007Insurance Director, Varma 2002–2006
Member of the Executive Group since 2007
Member of the Boards of the Finnish Centre for Pensions, Foundation for the Advancement of Insurance Skills and Finnish Financial and Insurance Publishing Ltd FINVA
Executive Group 31 december 2007
Timo kaisanlahti Senior Vice-President, Administration, Chief Legal CounselBorn 1962Work experience includes:Ministerial Adviser, Ministry of Finance 2004–2005Ministerial Adviser, Ministry of Transport and Communications2003–2004Legal Counsel, KLegal Oy 2003 Legal Counsel, Varma-Sampo 2001–2002Ministerial Adviser, Ministry of Trade and Industry 1996–2000
Member of the Executive Group since 2007
Risto Murto Senior Vice-President, Chief Investment OfficerBorn 1963Work experience includes:Managing Director, Opstock Ltd 2000–2005Director, Opstock Ltd 1997-2000
Member of the Boards of VVO-yhtymä Oyj and NV Kiinteistösijoitus Oy
Member of the Executive Group since 2006
pasi Mustonen Senior Vice-President, Chief ActuaryBorn 1964Work experience includes:Actuary, Varma 1998–2001Actuary, Sampo Pension 1996–1998
Member of the Representatives of the Finnish Centre for Pensions, Chairman of the Board of the Actuarial Society of Finland
Member of the Executive Group since 2004
Jouko Oksanen Senior Vice-President, Chief Financial OfficerBorn 1951Work experience includes:Senior Vice-President, Pension-Varma 1990–1998
Member of the Boards of Tamfelt Corporation and Ahlström Capital Oy, Vice Chairman of the Board of Arek Oy
Member of the Executive Group since 1998
Irmeli Otava-Keskinen Senior Vice-President, Information ManagementBorn 1950Work experience includes:IT Director, Pension-Varma 1996–1998
Chairman of the Board of TietoEnator Esy Ltd
Member of the Executive Group since 2007
Jyrki Rasi Senior Vice-President, Pension ServicesBorn 1966Work experience includes:Department Manager, Varma 1999–2006Legal Counsel, Sampo Pension 1998
Member of the Executive Group since 2007
Hannu Tarvonen Senior Vice-President, Client ServicesBorn 1952Work experience includes:Senior Vice-President, Marketing, Sampo Pension 1996-1998
Member of the Boards of Kaleva Mutual Insurance Company and Fundservice RP Ltd
Member of the Executive Group since 1998
Merja Haikonen Employee representativeBorn 1950Work experience includes:Legal Counsel, Varma 2003–
Employee representative in the Executive Group 2002–2003, employee representa-tive in the Extended Executive Group 2004–2005, employee representative in the Executive Group from 2006
Sari kauppinenEmployee representative, Pensions SpecialistBorn 1970Work experience includes:Pensions Handler and Pensions Specialist, Varma 2000–
Employee representative in the Executive Group from 2007
37
Matti Vuoria Markku Hyvärinen
Eija Kaipainen-Perttula Timo Kaisanlahti
Risto Murto
Jyrki Rasi Hannu Tarvonen
Pasi Mustonen
Merja Haikonen Sari Kauppinen
Jouko Oksanen Irmeli Otava-Keskinen
ExECuTIVE GROup ANd OTHER MANAGEMENT38
Other management
Sakari Aaltonen, Administration Carina Geber-Teir, Communications Ralf Joutsenlahti, Corporate ClientsAsko Kinnunen, Development of Client ServicesMikko Koivusalo, Capital MarketsJorma Kuokkanen, Real Estate & Corporate FinanceMika Pitkälä, Distribution ChannelsJukka Ruuth, Internal AuditingSakari Tola, Medical Affairs
Employee representatives
Asta Häkkinen-Tolvanen, deputy for the employee representative Tuula Vailama, deputy for the employee representative as from November 2007Eija Åman, deputy for the employee representative as from November 2007
Consultant physicians
Mari Antti-Poika, born 1946Per-Henrik Groop, born 1956Tuula Kieseppä, born 1963Matti Klockars, born 1940Heikki Nikkilä, born 1955Pekka Palin, born 1950Ritva-Liisa Peltomäki, born 1953Henrik Riska, born 1945

39

kEY TERMINOLOGY40
Account transfer Policyholders may transfer their earn-ings-related pension insurance from one company to another. The account must be terminated at the latest on the last day of March, June, September or December, and it is then transferred to the new company in three months. The contract may only be transferred again after it has been held by the new company for a minimum of one year.
derivativeA financial investment instrument, the value of which is based on the future val-ue of another underlying security, index, currency, commodity or entitlement.
durationThe weighted maturity of a bond, based on the present values for all cash flows. Duration makes it possible to measure the bond’s interest rate risk in cases where the change in interest rate is fairly small.
Employees pensions Act TyELThe single private-sector earnings-related pension act entered into force in 2007. The new act replaced the Employ-ees Pensions Act TEL, the Temporary Employees’ Pensions Act LEL and the Pension Act for Performing Artists and Certain Groups of Employees TaEL.
Equalisation provision The amount of the provision for claims outstanding accumulated from the risk business result used to equalise any fluctuations in the technical un-derwriting result or, for example, for years when the number of new pen-sions granted is higher than estimat-ed at the time when the contributions were determined. The equalisation provision is divided into the following sub-sections: old age, disability and unemployment pensions, and unpaid contributions.
Equity-linked provision for current and future bonusesA buffer jointly maintained by earn-ings-related pension companies bear-ing some of the risks resulting from fluctuations in equity income. The proportion covered by the buffer may gradually increase in 2007–2011. It can be greatly affected by changes in equity values. When at its lowest, it may reduce technical provisions by 10%, while at its highest, it may cause technical provisions to increase by 5%. If it accounts for more than 5% of the technical provisions, the funding of old-age pensions will be increased by the amount exceeding the upper limit.
Investment surplusInvestment income at fair value can be calculated by deducting the return credited on technical provisions, which is based on the technical interest rate, from the net investment return and change in valuation differences.
kTI total returnThe sum of the annual net return per-centage and value adjustment percent-age of real estate calculated according to the portfolio index of the Institute for Real Estate Economics (KTI).
Life expectancy factorThe life expectancy factor will be used for the first time in 2009 in order to adjust the amount of old age pension in line with rising life expectancy. A pension will be multiplied by the life expectancy factor determined sepa-rately for each age group at the age of 62, based on the last five years’ mortal-ity statistics. While the application of the life expectancy factor will reduce pensions, this can be compensated for by staying at work longer.
LiquidityFor example, the ability of the securi-
ties market to handle large deals.
Loading income The expense loading included in the contribution plus the part of the disability-pension contribution com-ponent reserved for pension-decision expenses. Loading income covers the total operating expenses of an earn-ings-related pension company except for the costs resulting from maintain-ing working capacity, managing in-vestments, and statutory charges.
Loading profitLoading profit shows the amount of the expense loading not used for the company’s operating expenses. The ratio of operating expenses to the ex-pense loading reflects the company’s efficiency. The lower the usage rate, the higher the efficiency of opera-tions.
Market riskThe impact of the general price trend on the price of a single share.
pension recordA summary of an individual’s employ-ment history detailing the earnings accumulated in the private-sector and when self-employed, social benefits affecting the individual’s pension, and information about the earnings-related pension accrued by the end of the previous year. The pension record will be sent annually and individual customers of earnings-related pen-sion companies will receive it for the first time in 2008. Recipients should check the figures on the document as any omissions or errors may affect their future pensions.
provision for current bonusesPart of the provision for unearned pre-miums. Certain portions of the invest-ment surplus and loading profit have
Key terminology
41
been transferred to the provision for current bonuses on the basis of the company’s solvency status. Reserved for the payment of client bonuses.
provision for future bonusesPart of the provision for unearned premiums that is included in the com-pany’s solvency capital. The remaining investment surplus and loading profit (see Provision for current bonuses) are transferred to the provision for current bonuses, which is used as a measure to prepare for investment value fluctua-tions.
Solvency capital Net insurance company assets that are used as a measure to prepare for fluctuations in investment values. Sol-vency capital is the excess of assets at fair value over liabilities. It comprises capital and reserves, accumulated ap-propriations, the valuation difference and the provision for future bonuses.
Solvency requirementsSolvency requirements, or the mini-mum solvency capital, are calculated on the risks inherent in the invest-ments that make up the technical pro-visions margin. The minimum level and maximum level of the solvency capital are determined on the basis of the solvency limit. The minimum level of the solvency capital is two-thirds of the solvency limit and the maximum level is four times the solvency limit.
Statutory charges The operating expenses covering the costs of the Finnish Centre for Pen-sions, the Insurance Supervisory Au-thority and the Pension Appeal Court.
Technical interest rate The technical interest rate is used to determine the interest rate on a number of items such as insurance
contributions. The rate is determined biannually on the basis of the average solvency of earnings-related pension companies. For the first half of 2007 it stood at 5.5% and during the latter half of the year at 6.0%. As of 1 Janu-ary 2008, it has been 6.25%.
Technical provisionsAn estimate entered into the financial statements on the company’s future pension expenditure for the part that is funded. Technical provisions comprise provision for unearned premiums and provision for claims outstanding.
The provision for unearned pre-miums relates to the liabilities of the company for future contingencies for pensions that have accumulated by the end of the financial year. The provision for claims outstanding is the capital value of the funded components of fu-ture pensions in respect of contingen-cies that have already occurred.
Technical provisions to be coveredTechnical provisions plus liabilities in respect of pooled pension expenditure and policyholders, less the premium reserve for self-employed persons’ pension insurance.
Technical underwriting result For old age, disability and unemploy-ment pension business and unpaid contributions, the difference between the insurance contribution and claims expenditure. A positive balance on technical account adds to the equali-sation provision and a negative result reduces the provision.
TurnoverPremiums written before the deduc-tion of credit losses and the reinsurers’ share, plus the investment surplus, oth-er returns and realised valuation gains entered into the income statement.
TyEL (earnings-related pension) premium loanThe policyholder is entitled to borrow part of the technical provisions (loan fund), provided that the requirements of the insurance terms are met. The interest on the loan is quoted daily for different periods.
Return requirement on technical provisionsSince 2007 the return requirement on technical provisions has been de-termined on the basis of the fund rate used to calculate pension liabilities, a pension liability supplementary fac-tor approved by the Ministry of So-cial Affairs and Health and a return-on-equity component determined retroactively. The fund rate stands at 3%. During the first half of 2007 the supplementary factor was 2.46% and during the second half 2.96%. As of 1 January 2008, the supplementary factor has been 3.03%. In 2007, the return-on-equity component was ap-proximately 0.05%.
Valuation differenceThe difference between fair and book values of investments included in the solvency capital of an earnings-related pension company. Changes in valua-tion differences are added to the com-pany’s investment surplus.
Value-at-Risk The figure indicates the value of in-vestment loss risk at a selected prob-ability and period of time.

CONTACT INFORMATION42
Contact information
Varma Mutual pension Insurance CompanyTelephone +358 10 515 13
Fax +350 10 514 4752
www.varma.fi
postal addressPO Box 1, FI-00098 VARMA
Visiting address and domicileAnnankatu 18, Helsinki
(From 1 September 2008: Salmisaarenranta 11,
00180 Helsinki)
Business ID 0533297-9
Personal e-mail addresses are of the format
Communications +358 10 514 5033
International Services +358 10 514 7002
Capital Market InvestmentsBack Office +358 10 514 6988
Equities +358 10 514 6956
Fixed Income +358 10 514 6987
Private Equity +358 10 514 3230
Hedge Funds +358 10 514 3224
Real Estate Investments +358 10 514 5028
1588/04.08

Graphic design and layout: Euro RSCG Helsinki
Photographs: Nico Backström
Printed by: Frenckellin Kirjapaino Oy

Report of the Boardof Directors andFinancial Statements 2007

VARMA FINANCIAL STATEMENTS 20072
VARMA FINANCIAL STATEMENTS 2007 �
Varma Report of the Board of Directorsand financial statements 2007
Report of the Board of Directors .....................................4
Income statement ...................................................... 11
Balance sheet ............................................................ 12
Statement of source and application of funds ................. 14
Notes to the financial statements ................................ 15
Accountingprinciples............................................ 15 Groupcompanies.................................................. 17 Notestotheincomestatement................................ 19 Notestothebalancesheet...................................... 22 Varma’sbalancesheetand incomestatementatfairvalue................................. 38 Investmentsclassifiedaccordingtorisk..................... 40 Riskmanagement.................................................. 41 Corporategovernance........................................... 47 Keyfiguresandanalyses......................................... 48
Distribution of profit .................................................. 52
Auditors’ report ......................................................... 53
Statement by the Supervisory Board ............................ 53
Financial statementsThefinancialstatementsandconsolidatedfinancialstatementsfor2007areavailableatthecompanyheadquartersatAnnankatu18,Helsinki,Finland.
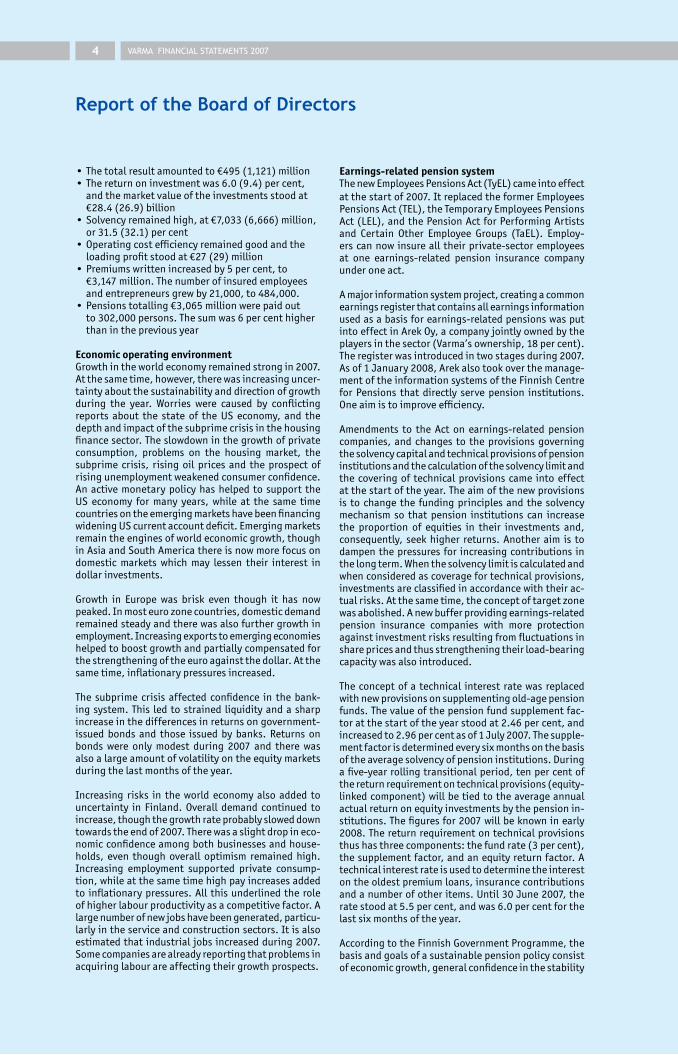
VARMA FINANCIAL STATEMENTS 2007�
•Thetotalresultamountedto€495(1,121)million•Thereturnoninvestmentwas6.0(9.4)percent, andthemarketvalueoftheinvestmentsstoodat €28.4(26.9)billion•Solvencyremainedhigh,at€7,033(6,666)million, or31.5(32.1)percent•Operatingcostefficiencyremainedgoodandthe loadingprofitstoodat€27(29)million•Premiumswrittenincreasedby5percent,to €3,147million.Thenumberofinsuredemployees andentrepreneursgrewby21,000,to484,000.•Pensionstotalling€3,065millionwerepaidout to302,000persons.Thesumwas6percenthigher thaninthepreviousyear
Economic operating environmentGrowthintheworldeconomyremainedstrongin2007.Atthesametime,however,therewasincreasinguncer-taintyaboutthesustainabilityanddirectionofgrowthduring the year. Worries were caused by conflictingreports about the state of the US economy, and thedepthandimpactofthesubprimecrisisinthehousingfinancesector.Theslowdowninthegrowthofprivateconsumption, problems on the housing market, thesubprime crisis, rising oil prices and the prospect ofrisingunemploymentweakenedconsumerconfidence.Anactivemonetarypolicyhashelped tosupport theUS economy for many years, while at the same timecountriesontheemergingmarketshavebeenfinancingwideningUScurrentaccountdeficit.Emergingmarketsremaintheenginesofworldeconomicgrowth,thoughinAsiaandSouthAmericathereisnowmorefocusondomestic markets which may lessen their interest indollarinvestments.
Growth in Europe was brisk even though it has nowpeaked.Inmosteurozonecountries,domesticdemandremainedsteadyandtherewasalsofurthergrowthinemployment.Increasingexportstoemergingeconomieshelpedtoboostgrowthandpartiallycompensatedforthestrengtheningoftheeuroagainstthedollar.Atthesametime,inflationarypressuresincreased.
The subprime crisis affected confidence in the bank-ingsystem.This ledtostrained liquidityandasharpincreaseinthedifferencesinreturnsongovernment-issued bonds and those issued by banks. Returns onbonds were only modest during 2007 and there wasalsoalargeamountofvolatilityontheequitymarketsduringthelastmonthsoftheyear.
Increasing risks in the world economy also added touncertainty in Finland. Overall demand continued toincrease,thoughthegrowthrateprobablysloweddowntowardstheendof2007.Therewasaslightdropineco-nomicconfidenceamongbothbusinessesandhouse-holds, even though overall optimism remained high.Increasing employment supported private consump-tion,whileatthesametimehighpayincreasesaddedto inflationarypressures.All thisunderlinedtheroleofhigherlabourproductivityasacompetitivefactor.Alargenumberofnewjobshavebeengenerated,particu-larlyintheserviceandconstructionsectors.Itisalsoestimatedthatindustrialjobsincreasedduring2007.Somecompaniesarealreadyreportingthatproblemsinacquiringlabourareaffectingtheirgrowthprospects.
Report of the Board of Directors
Earnings-related pension systemThenewEmployeesPensionsAct(TyEL)cameintoeffectatthestartof2007.ItreplacedtheformerEmployees PensionsAct(TEL),theTemporaryEmployeesPensionsAct(LEL),andthePensionActforPerformingArtistsand Certain Other Employee Groups (TaEL). Employ-erscannowinsurealltheirprivate-sectoremployeesat one earnings-related pension insurance companyunderoneact.
Amajorinformationsystemproject,creatingacommonearningsregisterthatcontainsallearningsinformationusedasabasisforearnings-relatedpensionswasputintoeffectinArekOy,acompanyjointlyownedbytheplayersinthesector(Varma’sownership,18percent).Theregisterwasintroducedintwostagesduring2007.Asof1January2008,Arekalsotookoverthemanage-mentoftheinformationsystemsoftheFinnishCentrefor Pensions that directly serve pension institutions.Oneaimistoimproveefficiency.
Amendments to the Act on earnings-related pensioncompanies, and changes to the provisions governingthesolvencycapitalandtechnicalprovisionsofpensioninstitutionsandthecalculationofthesolvencylimitandthecoveringof technicalprovisionscame intoeffectatthestartoftheyear.Theaimofthenewprovisionsis to change the funding principles and the solvencymechanism so that pension institutions can increasethe proportion of equities in their investments and,consequently, seek higher returns. Another aim is todampenthepressuresfor increasingcontributionsinthelongterm.Whenthesolvencylimitiscalculatedandwhenconsideredascoveragefortechnicalprovisions,investmentsareclassifiedinaccordancewiththeirac-tualrisks.Atthesametime,theconceptoftargetzonewasabolished.Anewbufferprovidingearnings-relatedpension insurance companies with more protectionagainstinvestmentrisksresultingfromfluctuationsinsharepricesandthusstrengtheningtheirload-bearingcapacitywasalsointroduced.
Theconceptofa technical interestratewasreplacedwithnewprovisionsonsupplementingold-agepensionfunds.Thevalueofthepensionfundsupplementfac-toratthestartoftheyearstoodat2.46percent,andincreasedto2.96percentasof1July2007.Thesupple-mentfactorisdeterminedeverysixmonthsonthebasisoftheaveragesolvencyofpensioninstitutions.Duringafive-yearrollingtransitionalperiod,tenpercentofthereturnrequirementontechnicalprovisions(equity-linkedcomponent)willbetiedtotheaverageannualactualreturnonequityinvestmentsbythepensionin-stitutions.Thefiguresfor2007willbeknowninearly2008.Thereturnrequirementontechnicalprovisionsthushasthreecomponents:thefundrate(3percent),thesupplementfactor,andanequityreturnfactor.Atechnicalinterestrateisusedtodeterminetheinterestontheoldestpremiumloans,insurancecontributionsandanumberofotheritems.Until30June2007,theratestoodat5.5percent,andwas6.0percentforthelastsixmonthsoftheyear.
AccordingtotheFinnishGovernmentProgramme,thebasisandgoalsofasustainablepensionpolicyconsistofeconomicgrowth,generalconfidenceinthestability

VARMA FINANCIAL STATEMENTS 2007 �
ofthesystem,justdivisionofresourcesbetweengen-erations, and longer working careers. Issues relatedtoearnings-relatedpensionswillbepreparedincon-sultationwiththemajorlabourmarketorganisations.Competitioninthefieldofearnings-relatedinsurancewillbepromotedbasedonthereportpreparedontheearnings-relatedpensionscheme.Thepossibilitiesoftransferringinsuranceportfoliosandrelatedsolvencymarginsbetweenallemployeepensioninstitutionswillbeinvestigated.Insuranceandfinancialsupervisiondu-tieswillbeassumedbyasingleagencythatwillstartitsworkatthebeginningof2009.Occupationalwell-beingprogrammeswillalsocontinue, thepurposebeingtoencouragepeopletoextendtheirworkingcareers.
Accordingtoareportonthecompetitionintheearn-ings-relatedpensionsectorsubmittedinJanuary2007,provisionsobligingpension institutions tocooperateshouldbereassessedandefficiencymeasuredatbothinstitutionandpension-schemelevel.Theobjectivesofdecentralisedimplementationandcompetitionshouldbecoordinatedsothatcompetitionwouldbringmorebenefitstopolicyholders.Atthesametime,thereshouldbelegislationencouraginggreateroperatingefficiencyinpensioninstitutions.Theworkinggroupappointedby earnings-related pension insurers also examinedwhethertechnicalbasesshouldbemorecompany-specific,whichwouldhelptomakethesectormoreeffi-cient.Aproposaldrawnupbytheearnings-relatedpen-sioninsurancecompaniesandsubmittedtotheMinistryofSocialAffairsandHealthon11January2008statesthatmanagingthecorefunctionoftheearnings-relatedpensioninsuranceschemedoesnotrequireuniformityintheexpenseloadingoftheinsurancecontribution,sothatinthatarea,company-specifictechnicalbasescouldbeadopted.Thesameappliestotechnicalbasestotheextentthattheyregulatethepartitioningoftheamounts transferred as client bonuses for the clientcompanies.
Thechanceofflexibleretirementattheageof63–68offeredbythe2005pensionreformhasnotcausedaretirementboom.Sofar,mostoftheobjectivesoftheearnings-related pension reform have been met, al-thoughrapideconomicgrowthandrehabilitationhavealsohelped.Theaverageretirementagehasincreasedbyaboutsixmonthsandemploymentratesamongtheagedhaveimprovedconsiderably.Oneoftheobjectivesofthepensionreformwastoincreasetheaverageretirementagebythreeyearsoverthelongterm.Infact,accordingtoasurveyonearnings-relatedpensionattitudes,peo-plewanttocontinueinworkinglifelongerthanbeforeandsomeemployeessaythattheymightstillbeworkingwhentheyareonanold-agepension.
Foremployeeswho,on1January2005,wereinanem-ploymentrelationshipthatwillcontinueuntilretirementandtheretirementwillbeno later than in2012, thepensionsarecalculatedusingaprotectiveregulation.Ifthepensioncalculatedinthismannerishigherthanthe pension calculated using the provisions in effectin2005,thedifferencewillbeaddedtothepension.Between1January2005and31October2007Varmamadeatotalof47,000decisionsonpensioncategoriestowhichtheprotectiveregulationapplied.Calculationsconcerningtheprotectiveregulationweremadeinabout
onefifthofthecases.Theprotectiveregulationaffectedthepensionin485casesandtheaverageimpactwas11.65euros.Eventhoughtheregulationhasonlyhadaminorimpact,therequiredcalculationshavebecomeveryexpensive,astheyhaveforcedVarmatointroducenewITapplications.
TheaverageTyELcontributionratewas21.6(21.6)percentofsalaries.Employeesbelowtheageof53contri-buted4.3(4.3)percentoftheirpay,whilethefigureforemployeesolderthan53was5.4(5.4)percent.Atthesametime,theaveragecontributionsweretemporar-ilyloweredby0.6(0.6)percentagepointssothatthesurplusgeneratedbypreviousyears’disabilitypensioncontributionscouldbeeliminated.Halfthereductionappliestoemployeecontributions,whiletheotherhalfappliestoemployers’contributionsthatarewhollyorinparttariff-based.TheYEL-contributionwas20.8(20.8)percentoftheconfirmedearningsforthosebelow53,and21.9(21.9)percentforthoseover53.
As of 1 January 2007, 25–50 per cent of the loadingprofithasbeentransferredtoclientsasbonusesimme-diatelyinthefollowingyear,inotherwordsmorerap-idlythanbefore.Atthesametime,theloadingincomecontainedininsurancecontributionswaschangedsothatineachcustomersegmenttheproportionbetweenoperatingcostsandtheloadingprofitwouldonaveragebemorebalanced.Theaimistoensurethatallearn-ings-relatedpensioninsurancecompanieswouldshowaloadingprofit.
The income-calculation working group of the FinnishPension Alliance TELA has issued a recommendationontheclassificationofinvestmentsaccordingtorisk.Theaimistoputtheinformationprovisionofearnings-relatedpensioninsurancecompaniesonamoreopenandtransparentbasis.Playersinthesectorhaveactedinaccordancewiththerecommendation.
Varma’s financial trendsVarma’sbalancesheetandincomestatementarecalcu-latedatbookvalue.Theprofit/lossforthefinancialyearforearnings-relatedpensioninsurancecompaniesmustbeapprovedinadvancebytheMinistryofSocialAffairsandHealth.Thenotesgivemoredetailedinformationonhowtheresultsarestructured,presentVarma’sbalancesheetandincomestatementatfairvalueandlisttheinvestmentsandtheirreturnsgroupedinaccordancewithriskdistribution.
Thoughlowerthanin2006,Varma’sresultfor2007wasreasonable.Afterfiveyearsofgrowth,internationaleq-uitymarketsexperiencedadownturnduringthefinalmonthsoftheyear.However,Varma’ssolvencycapitalcontinuedtoincreaseandthecompanyhadahighde-greeofsolvencyattheendoftheyear.
Varma’s total result according to the balance sheetandincomestatementshowninthenotesatfairvaluecameto€495(1,121)million.Forthemostpart, thepresentationisinaccordancewithIFRSstandards.Thelowertotalresult,comparedwiththepreviousyear,wasmainlycausedbylowerinvestmentsreturns.Thenotesgiveabreakdownofthetotalresultbycomparingtheinvestmentreturnsatfairvaluewiththereturnrequire-

VARMA FINANCIAL STATEMENTS 2007�
ment on technical provisions (‘investment surplus‘),operatingcostswiththeloadingincomecontainedintheinsurancecontributions(‘loadingprofit’)andtheclaimspaidwiththecorrespondingpremiumswritten(‘technicalunderwritingresult’).
The company’s investment returns totalled €1,632(2,330)millionatfairvalue,whichwas6.0(9.4)percent.Theinvestmentreturnsexceededtheinterestcred-ited on technical provisions by €435 (1,124) million.Varma’sinvestmentreturnsin2003–2007averaged8.5percent,correspondingtoarealreturnof7.3percent.Efficiencykeptoperatingcosts26(28)percentlowerthantheexpenseloadingcontainedininsurancecontri-butions,whiletheloadingprofitwas€27(29)million.Atemporaryreductioninthelevelofcontributionscausedtheclaimspaidtoexceedthecorrespondingpremiumswrittenandthusthetechnicalunderwritingresultwasestimatedat€34(-32)million.
Asaresultofitsgoodperformance,Varmawasabletoimproveitssolvencyby€367(1,067)million.Attheendof the year, solvency capital stood at €7,033 (6,666)million, or 31.5 (32.1) per cent of the technical pro-visions, which meant that on 31 December 2007, thesolvency capital was 1.9 (2.1) times higher than thesolvency limit.Thesolvencycapital requirement is inaccordancewiththerisklevelofthecompany’sinvest-ments.Theequalisationprovisioncoveringtherisksofnetclaimsincreasedby€28(-37)millionandtotalled€938(910)million.
Becauseofitsgoodperformance,Varmatransferred€92(78)milliontotheprovisionforcurrentbonuses,tobeusedasclientbonuses.Thetransferwasabout0.64(0.58)percentoftheestimatedpayrolloftheinsured.
Insurance businessVarmaisFinland’sbiggestprivate-sectorearnings-relatedpensioninsurer.TheTyELpayrollofthoseinsuredatthecompanyin2007totalledabout€14.4(13.4)bil-lionandisestimatedtohavegrownby7percentontheactual2006figure.Premiumswrittentotalled€3,147(2,984) million, of which TyEL accounted for €3,007(2,846)millionandYELinsurancefor€129(125)mil-lion.Attheendoftheyear,some484,280(463,450)individualswere insuredatVarma,whichwas20,830more than a year earlier. At the end of the year, thenumberofinsurancestotalled63,650,covering37,310entrepreneursand446,970employees.
As of 1 January 2007, private-sector employers havebeenabletoinsuretheirentirestaffatoneearnings-relatedpensioninsurancecompany.Thetotalmarketforearnings-relatedpensioninsurancesgrewstronglyasshort-timeemploymentrelationshipsfellwithinthesphereofTyELandEteralostitsmonopolyinthesector.Duringtheyear,atotalof4,434(2,944)newTyELinsur-ancesand5,416(5,311)newYELinsurancescameintoforceatVarma.Atthesametime,thenumberofTyELandYELinsurancesterminatedwas2,676(2,787)and3,506(3,288),respectively.Atotalof2,827(2,734)decisionsweremadeonchangesthatentrepreneurswantedmadeto their earnings. Employment notifications receivedduringtheyeartotalled937,000(869,000),ofwhich81.1 (80.7) per cent were received electronically. As
of1January2007,customershavealsobeenable tomanage matters concerning short-time employmentrelationships online using the ’Pesti’ temporary-employment service and the monthly notificationserviceintendedforcontractcustomers.Atotalofabout131,000(136,600)telephonecallswerereceivedbytheInsuranceServices.
Varmadidwellinaccounttransfers.ThenetprofitinTyELinsurances,measuredintermsofpremiumswritten,to-talled€45million,whichhelpedVarmato increase its34%-marketsharebyabout0.5percentagepoints.Varmawasabletostrengthenitspositionasaninsureroflargecompaniesandinthenextfewyears,theaimistogainastrongerfootholdinthesmall-enterprisesector,too.Inlargecompanies,casesofdisabilityhaveanimpactonthefinalcontributionsandVarmacan,incooperationwithitsclients,haveaneffectondisabilitycasesinareassuchasoccupationalwell-beingandvocationalrehabilitation.VarmaprovidespolicyholderswithservicesthroughitsownservicechannelsandthroughtheservicenetworksofIfP&CInsuranceLtdandtheNordeaGroup.
Atotalof€31millioninliabilitieswastransferredfromfourpensionfundstoVarma,while€51millionweretrans-ferredfromVarmatoonepensionfund.NokiaSiemensNetworkstransferred itsemployees’pension liabilities(about9,300insured)fromtheNokiaPensionFundtoVarmaasof1March2008,whichincreasedthepensionassetsmanagedbyVarmabyalmost€300million.
Occupationalwell-beingandagemanagementareim-portantinasituationwheremanysectorsarealreadysufferingfromashortageoflabour.Withtheexitofba-byboomersfromworkinglife,thesituationisexpectedto become even worse. The growth in the number ofdisabilitypensionswaslowerthanexpected,whichwasaresultofimprovementstohealth,economicgrowthand more extensive vocational rehabilitation. Abouttwo-thirdsofall thoseparticipating in rehabilitationreturnedtoworkinglifein2005–2006.Formanyyears,Varmahasbeenapioneerinvocationalrehabilitation,andthis isalsoevidentintheresults.ThenumberofapprovedrehabilitationdecisionsatVarmaisalreadymorethanonethousandeachyear.
In2007,atotalof€2,771(2,578)millionwaspaidoutinclaims.Attheendoftheyear,VarmawaspayingTyELandYELpensionstosome302,000(296,000)persons.TheprocessingofpensionclaimsatVarmawasfasterthanaverage.Atotalof23,185(21,902)newpensiondecisionsweremadeduringtheyear,whichwassixpercentmorethanin2006.Therewasgrowthinallpensiontypes,particularlyinpart-timepensions(13percent)andunemploymentpensions(12percent).Thegrowthinunemploymentpensionscanbeputdowntothefactthattheagegroupsentitledtothemhavebecomelarger.In2007,thenumberofpensiondecisionsincreasedbyfourpercentonthepreviousyearandtotalled45,164.Continuationdecisionstotalled5,100(4,943),whilethenumberofotherdecisionswas14,195(13,986).There-jectionrateforadisabilitypensionwasabout23percent,whichwasatthesamelevelasin2006.
InthePensionEstimateonlineservice,theinsuredcanobtainanestimateoftheirold-ageandpart-timepen-
VARMA FINANCIAL STATEMENTS 2007 7
sionsatvariousages.Varmacontinuedtheprocessoftransferringtheprovisionofpreliminaryestimateson-line.In2007,customersmadeatotalof52,000(41,000)onlinepensionestimates,whileatthesametime23,000estimatesweremadeatVarmaAdvisoryServices.ThePension Estimate service also gives customers an es-timate of how the new life expectancy factor will af-fecttheirfuturepensions.Thelifeexpectancyfactoriscalculatedforeachageclassattheageof62anditwillreducethepensionasthelifeexpectancyincreases.Thelifeexpectancyfactorwillnotaffectnewpensionsbefore2010andinitiallyitwillonlyhaveaminorimpact
Technical provisionsTechnicalprovisionsincreasedby7.6(8.9)percentdur-ingtheyear,to€25,571(23,774)million.Theycontainaprovisionof€92(77)millionforcurrentbonusesreservedforclientbonuses,aprovisionof€3,259(3,008)millionforfuturebonusescontainedinthesolvencycapital,and€8(-)millioninanequity-linkedprovisionforcurrentandfuturebonuses,whichactsasabufferfortheinvestmentreturnsofearnings-relatedpensioninsurancecompanies.Theequalisationprovisionamountedto€938(910)million.Atotalof€31millioninpensionliabilitieswastransferredfrompensionfoundationstoVarma,while€51millionwastransferredfromVarmatoapensionfund.Attheendoftheyear,assetscoveringthetechnicalprovisionswas115(111)percentofthetechnicalprovisions.
InvestmentsAttheendof2007,thevalueofVarma’investmentsto-
talled€28,418(26,858)millionandthereturnatfairvaluewas€1,632(2,330)millionor6.0(9.4)percent.Thenotesshowthebreakdownoftheinvestmentsandtheirreturnsbyinvestmentcategory,inaccordancewiththeappropriateprovisionsandinaccordancewiththerecommendations issued by the income calculationworking group of the Finnish Pension Alliance TELA,whichareusedbyearnings-relatedpensioninsurancecompanies.ThepurposeofTELA’sclassificationistoputtheinformationprovisionofearnings-relatedpensioninsurers on a more open and transparent basis. Thenotespresentthematchingbetweenthetwobreakdownapproaches.IntheReportoftheBoardofDirectors,theinformationoninvestmentsisgroupedinaccordancewiththerecommendationsofTELA.
Fixed-income investments totalled €10,307 (11,337)millionandtheyweredistributedasfollows:loanre-ceivables €1,059 (782), bonds €8,292 (10,531) andother money-market instruments €955 (25) million.Equityinvestmentstotalled€11,181(10,547)million.Ofthistotal,listedequitiesaccountedfor€9,842(9,661),private equity investments €896 (778), and unlistedequities €443 (108) million. Real estate investmentsamountedto€3,255(2,737)million.Ofthistotal,directrealestateinvestmentsaccountedfor€2,911(2,567)andrealestateinvestmentfunds€344(170)million.Other investments, totalling €3,675 (2,237) million,wereinvestmentsinhedgefunds.
The return on fixed-income investments stood at 1.5
31Dec.2007 31Dec.2006 Change
Numberofinsured
TyEL1) 446,970 426,090 20,880
YEL 37,310 37,360 -50
Total 484,280 463,450 20,830
1)TELsupplementarypensioninsurance 9,700 11,940 -2,240
Numberofinsurancepolicies
TyEL 26,340 25,200 1,140
Numberofpensioners2)
Oldagepension 175,563 171,390 4,173
Survivors’ pension 50,073 49,810 263
Disabilitypension 44,962 43,371 1,591
Unemploymentpension 11,875 11,513 362
Earlyoldagepension 13,755 13,639 116
Individualearlyretirementpension 717 1,339 -622
Part-timepension 5,151 5,322 -171
Total 302,096 296,384 5,712
2)ThosereceivingYELpension 28,506 28,303 2032)ThosereceivingTEL/YELsupplementarypension 38,364 37,374 990
VARMA FINANCIAL STATEMENTS 2007�
(1.1)percentandwasdividedasfollows:loanreceiva-bles6.2(4.3),bonds0.9(0.7)andothermoney-marketinstruments2.6(3.1)percent.Thereturnonequitieswas 8.2 (23.8) per cent and was divided as follows:listed equities 5.0 (23.6), private equity 35.2 (25.4)andunlistedequities41.9(31.5)percent.Thereturnonrealestateinvestmentswas10.2(8.0)percentandwasdividedasfollows:directrealestateinvestments10.1(7.9)andrealestateinvestmentfunds11.5(10.3)percent.Thereturnonotherinvestments(hedgefunds)stoodat11.4(8.0)percent.
Thenewregulationsonsolvencyandtechnicalprovi-sionsandastrongsolvencypositionenabledVarmatoincrease the risk level of its investment portfolio. Atthesametime, thisalsomeantstricter requirementsformanagingtheinvestmentrisk.Investmentsolvencyclassification is based on the actual investment risklevel.Decisionsonthesolvencyclassificationcriteriaare made by Varma’s Board of Directors, which alsomonitorsadherencetothemandtheirimpactoncom-panysolvency.Therealinvestmentriskleveliscarefullydeterminedbyusingbothquantitativeandqualitativemethods,andprudenceisalsoaconsiderationintheprocess.Classificationofinvestmentsaccordingtoac-tualriskattheendoftheyeardecreasedthesolvencylimitby€975millionor4.4percentagepoints,comparedwithstandardclassification.Classificationdifferencesare mainly caused by investments in hedge funds, inwhichtheaimistoachievepositivereturnsinallmarketconditions.
Varmacontinuedtolowertheweightoffixed-incomeinvestments,whileatthesametime,theweightofequi-tiesandhedgefundswasincreased.Diversifyinginvest-mentsoutsidetraditionalequityandfixed-incomemar-ketsprovedasuccess.ThesituationonthemarketswasdifficultbutVarmacanneverthelessbesatisfiedwithitsperformanceeventhoughtherewasnorepeatofthehighreturnsgeneratedduringthepastfewyears.
Varma’sfixed-incomeinvestmentsaremainlyingovern-ment-issuedbonds.TheEuropeanCentralBankraiseditskeyinterestratetwiceduringthespring2007,whichledtohighermarketrates.Becauseofgrowinguncertainty,theUSFederalReservestartedloweringinterestratesinearlyautumn,whichalsoledtolowerratesinEurope.Duringthelastfewmonthsoftheyear,theriskpremi-umsoncorporateloansincreasedsubstantially.Thoughfixed-incomeinvestmentsgeneratedonlylowreturns,atVarmatheywereabovethebenchmark.Theaveragerisk-weightedcreditratingforthebondportfoliowasA,orthesameasattheendofthepreviousyear.Attheendoftheyear,theaveragebondmaturitywas4.9(5.5)years.
Demandforcustomerloansremainedlowthoughtherewasamarkedincreaseinfinancingofdifferenttypesofcorporaterestructuring.Atotal€364(142)millioninnewloanswasraisedduringtheyear.
Equitypricesroseduringthefirsthalfof2007butduringthelastmonthsoftheyear,pricesplummetedastheequitymarketswereaffectedbyuncertaintyontheUSmortgageanddebtmarkets.Equityreturnswerereason-ableandinaccordancewithlong-termaverages.Varmahaddomesticlistedequitiesworth€3,868(3,180)mil-
lioninitsportfolio.Dividendswereanimportantcon-tributory factor because, after increasing rapidly foranumberofyears,valuesroseonlymodestlyin2007.Theperformanceandfinancialpositionofcompaniesremainedstrong.Inthelightofdevelopmentsonthemarket,Europeandtheemergingcountriesperformedwell,whilestockmarketsinFinland,theUnitedStatesandJapangeneratedonlymodestreturns.ThemarketvalueofVarma-ownedSamposhareswas€893millionandthereturnwas-5.2percent.
Privateequityinvestmentsandunlistedequitieshaveagoodreturnpotential.Theirlong-termnatureisalsoinkeepingwiththelong-termnatureofpensionliabilities.Privateequityinvestmentsgeneratedexcellentreturnsin2007.VarmahasawidelydiversifiedportfoliowithinvestmentsinbothinternationalandFinnishprivateequityfundsanditmadeanumberofprofitablerealisa-tions.Varmamadealargenumberofnewprivateequityinvestmentsduringtheyear,anditscommitmentstosubscribeforholdingsinprivateequityandrealestateinvestmentfundstotal€1,054(710)million.Varmaalsohasalargenumberofdirectco-investmentsinthecom-panies inwhichthefundsinvested.Unlistedequitiesalsogeneratedgoodreturns.Inparticular,thesharevalueoftheTalvivaaraMiningCompanyLtdwasboostedbyasuccessfullistingontheLondonStockExchange.
The turmoil generated by the US mortgage crisis oninternational money markets also had an impact ontheFinnishrealestatemarket.Lendingmarginsroseandlessusewasmadeofthedebtleverage.Realestateinvestorsbecamemorecriticalwhenassessinginvest-ment risks. Prices were no longer rising but marketliquidityremainedgood.Theoccupancyratesofbusi-nesspremisesimproved,andinthebestpremisesrentsalsoincreased.Theconstructionofbusinesspremisesremainedbriskthoughthenumberofnewproject-startsisabouttopeak.
RisesinrealestatevaluehelpedtoboostVarma’srealestatereturns.Varmahadanumberoflargebuildingprojects in progress: office buildings at Salmisaari inHelsinkiandatLeppävaarainEspoo(PanoramaTower),theentertainmentcentreFlamingoinVantaaandtheshoppingcentre ’Rajalla’ inTornio.Of the40,000m²floorareaatSalmisaari,about20,000m²willbetakenoverbyVarmaasitsheadofficeinsummer2008.ThepresentheadofficeinAnnankatuinHelsinkihasbeenleased to the European Chemicals Agency, which willmoveintothepremisesinstages.
Duringtheyear,Varmamadedirectrealestateinvest-mentsworth€375(198)million,andsoldrealestateworth€61(314)million.Investmentsindomesticrealestatefundstotalled€18(16)million,while€158(117)millionwereinvestedinforeignfunds.Thecompanyhasalsomadecommitmentstosubscribeforholdingsinrealestatefundsworth€559(517)million.Varma’sowner-shipinthehousinginvestmentanddevelopmentcom-panySATOroseto39.5percentinMay.
Attheendof2007,thelettablesurfaceareaoftherealestate owned by the Varma Group totalled about 1.9(1.9)millionsquaremetres.Thevacancyrateforoperat-ingpremiseswas4.5(5.2)percent.Splitupaccordingto

VARMA FINANCIAL STATEMENTS 2007 �
investedcapital,officeandbusinesspremisesaccountedfor63(61)percent,housingfor16(19)percent,indus-trialandwarehousefacilitiesfor17(18)percentandotherfacilitiesfor2(2)percentofthetotal.
Becauseofthepoorprospectsforreturnsonfixed-incomeinvestments,Varmacontinuedtotransferassetsfromfixed-incomeinvestmentstohedgefundsduring2007.Thereturnonhedgefundsexceededthereturnonfixed-incomeandequityinvestments.Varmahasmostofitshedgeinvestmentsinindividualfunds,whileaboutonefifthhasbeeninvestedinfundsoffunds.Thefundportfoliohasbeenwidelydiversified.Thesubprimecrisisattheendoftheyeardidnothaveanysignificantimpactonhedge-fundreturns.Varmahasmadesubscriptioncommitmentsinhedgefundsworth€706million.
Varmahedgedallforeigncurrencyrisksduringtheyear.The hedging against the dollar proved particularlybeneficialastheUSdollarweakenedvis-à-vistheeuro.
The increase inequity investments, inparticular,hasincreasedtheportfoliorisklevel.EquityinvestmentsarebyfarthemostsignificantsourceofrisksinVarma’sin-vestmentportfolio.Thecautiousapproachtorisk-takinghasprovedtherightchoiceinthelongrun.Varmahasinvestedheavilyinthemanagementoftheportfolioriskanditsmethods.TheVaR(Value-At-Risk)figure,whichmeasuresthetotalriskofVarma’sinvestments,grewby€209millionduringtheyearandstoodat€956(747)millionattheendof2007.VaRisthemaximumfallinthemarketvalueofthecompany’sinvestmentportfolioinnormalmarketconditionsoccurringoveraperiodofonemonthwithaprobabilityof97.5percent.
Forthethirdyearinarow,Varmatookpartinaninde-pendentinternationalinvestmentperformancesurvey.Accordingtotheresults,theprofitabilityandcost-eff iciency of Varma’s investment operations arehighlycompetitiveinternationally.
The central components in Varma’s ownership policyarehigh-qualitygovernanceinthecompaniesitowns,transparency of operations, active engagement, andincentive schemes for key personnel. During spring2007,Varma’srepresentativestookpartintheannualgeneralmeetingsofallthedomesticcompaniesinwhichitownedsharesandintheannualgeneralmeetingsof141foreigncompanies.
Operating expensesVarma used 74 (72) per cent of the expense loadingitreceivedtocoveroperatingexpenses.Asaresultofchangesintechnicalbases,theloadingprofitdecreased.The percentage indicating Varma’s cost-efficiency iscompetitive throughout the entire earnings-relatedpension sector. Cost-efficiency brings direct benefitstoVarma’scustomers.
Humanresourcesandinformationtechnologyaccountforalmost80percentofVarma’soperatingexpenses.Overalloperatingexpensesdroppedby4(+7)percentonthepreviousyear,totalling€100(104)million.Thecomparable rise, excluding non-recurring items anditems resulting from regulation-based regroupings,cametosixpercent.Theriseinexpensesduringtheyear
wasmainlyaresultofinformationsystemprojects.ArekOystartedchargingfortheintroductionoftheearningsregistersystemin2007andthebuildingcostsofthesys-temwillbeamortizedwithin10yearsofitscompletion.Thelargeinformation-processingprojectcoveringtheupgradingofthepension-applicationprocessings(’Veli’project),whichshouldbecomeoperationalin2011,willbedealtwithinthesamemanner.Varmaisalsowork-ingonprojectsinvolvinge-transactionsandcustomerservicesystems.Themostimportantoutsourcingpart-nersintheareaofinformationprocessingservicesareTietoEnatorPensionInsuranceOy,TietoEnatorEsyLtdandArekOy.Thelargenumberofdifferentpensionactsandreconcilingtheneedsofdifferentplayersaffectcostadministrationintheemploymentpensionsector.
TheaveragenumberofpersonnelintheVarmaGroupandthesalariespaidduringthefinancialyearareshowninthetablebelow.BecauseofthefiguresforTietoEnatorEsyLtd,figuresforthegrouparedifferentfromthosefortheparentcompany.Averagenumberof 2007 2006 2005personnelGroup 816 850 852ParentCompany 646 671 671 Salariesandfees,€millionGroup 33.6 32.2 31.3ParentCompany 33.6 32.2 31.3
Varmahasaperformance-basedrewardschemeapply-ingtoallstaffmembersandithasacompany-specificandapersonalcomponent.Thecompany-specificpartisinfluencedbyVarma’sinvestmentperformance,clientac-quisition,operating-costefficiencyandtheachievementofpension-handlingandinsurance-handlingtargets.
Efficiencyproposalsmadeinconnectionwithasurveycarried out at the company were incorporated into anumberofoperatingprocessesduringtheyear.Varmamust carry out its executive function efficiently andmanagetheassetsofpresentandfuturepensionersassuccessfullyaspossible.Theaimistocontinuereduc-tionsintheparentcompanystaff(32peoplein2007)primarilybyinternalreorganisation.VarmawillbemovingtoanewheadofficeatSalmisaariinHelsinkiinsummer2008,afterwhichthecompanywillhavepurpose-builtpremisesenablingittomakeitsopera-tionsmoreefficientandachievecostsavings.
Initsmarketingcommunications,Varmacontinuedthesuccessful ‘Hyväätyötä’(‘Goodwork’)campaign.Theaimistomakethegood,efficientworkdonebyVarmabetterknownandtoprovidemoreinformationaboutthe customer benefits the company offers, such asclientbonuses.
Accordingtotheupdatedcompanystrategy,Varmawillsafeguardthefundingforearnings-relatedpensionsandtheadequacyofbenefits,anditwillbecomethemarketleaderinitsoperations.
Group companies and associates Attheendof2007theVarmaGroupcomprised182(189)

VARMA FINANCIAL STATEMENTS 200710
subsidiariesand37(39)associates,mostofwhicharerealestatecompanies.ThemostimportantsubsidiariesandassociatesthatarenotrealestatecompaniesareTietoEnatorEsyLtd(50.1%),SiltaOy(39.1%)Garan-tiaInsuranceCompanyLtd(30.5%),SatoCorporation(39.5%)andNVKiinteistösijoitusOy(45%).TheVarmaGroupalsoowns50percentoftheguaranteecapitaloftheKalevaMutualInsuranceCompany.
GovernanceAtVarma’sAnnualGeneralMeeting,policyholdershaveabout78percent,theinsuredabout20percent,andtheSampoGroup(theowneroftheguaranteecapital)abouttwopercentofthevotes.
The Annual General Meeting on 22 March 2007 re-electedMarttiAlakoski,BerndtBrunow,StigGustavson,JukkaHärmälä,PekkaPaasikivi,AnttiPiippoandSakariTamminentoVarma’sSupervisoryBoard.MarkkuvonHertzenwasreplacedbyVeli-MattiTöyrylä,AnttiNorrlinbyLiisaLeino,MikaSeitovirtabyGöranÅberg,MattiKyytsönenbyKaiTelanneandAnttiRemesbyMarkkuUitto.TheSupervisoryBoardelectedPekkaPaasikiviasitschairmanandJukkaHärmäläandSakariTamminenasdeputychairmen.TheAnnualGeneralMeetingelectedAuthorisedPublicAccountantsRaija-LeenaHankonen(supervisoryauditor)jaJaakkoNymanascompanyaudi-torsandKPMGOyAbandAuthorisedPublicAccountantPaulaPasanenasdeputyauditors.
Atitsmeetingon4December2007,theSupervisoryBoardre-electedtotheBoardofDirectorsErkkiKangasniemi,OleJohanssonandJyrkiJuuselawhosetermswereex-piring.BjörnWahlrooswasreplacedbyKariStadigh,MarkkuJokinenbySakariTamminen,andTimoPoranen(asdeputymember)byAnneBrunila.TheBoardofDi-rectorswaschairedbyJyrkiJuusela,withOleJohans-sonandMikkoMäenpääactingasdeputychairmen.TheBoardofDirectorselectedJyrkiJuusela,MikkoMäen-pää,BirgittaKantolaandMarkkuPohjolaasmembersoftheAuditCommittee,andJyrkiJuusela,MikkoMäenpääjaOleJohanssonasmembersoftheCompensationandAppointmentCommittee.
TheElectionCommitteeischairedbyPekkaPaasikivi,chairmanoftheSupervisoryBoard,OftheCommitteemembers, Martti Alakoski (deputy chairman), MikkoMäenpääandVeli-MattiTöyrylärepresenttheinsured,while Ole Johansson and Tapio Kuula represent thepolicyholders.
ForamoredetailedpresentationofVarma’scorporategovernanceandriskmanagement,seethenotestothefinancialstatements.
OutlookAtthestartof2007,afteraperiodofsteadyeconomicgrowthandseveralyearsofsuccessfulinvestments,thesolvencyofFinland’searnings-relatedpensionschemewasstrongerthanever.Thecrucialissueforthelong-termsustainabilityofthepensionschemeistherateofgrowthininvestmentreturns.Theprospectsforgrowthintheworldeconomyareweakening,whileatthesametimethereismuchmoreuncertaintyaboutglobalrisks.The crisis affecting the financial markets has provedmoreseriousthanexpected,whichhasledtosharpfalls
instockmarketpricesduringthefirstmonthsof2008.Atthesametime,thereisconcernaboutthestateoftheUSfinancialmarketsandtheimpactsthecrisismighthaveelsewhere.Inasituationlikethis,solvencybuffersofearnings-relatedpensioninsurancecompanieshaveproveduseful.Furthermore,geopoliticaltensionsandalackofbalanceintheworldeconomycanalsothreateneconomicprospectsasacrisismightcauseinvestorstopanic.AslowdownintheUnitedStateshasbeencom-pensatedbystronggrowthintheemergingcountries.InFinland,too,prospectslookfairlygoodeventhoughgrowth has already peaked. At the same time, an in-creaseinemploymentisexpectedtocontinuethoughtherewillbefewernewjobsthanbefore.
The fact that Finns are retiring at an older age thanbeforeandemploymentratesamongthoseapproach-ingretirementhave increasedshowthatthepensionreform is working. Rehabilitation targets have alsobeenachieved.AsFinland’searnings-relatedpensioninsuranceschemeislargelyfinancedwithpensionin-surancecontributionspaidonthebasisofemploymentrelationships,ensuringgrowth inFinnish-basedeco-nomicoutput iscrucial.Productivitygrowth,keepingFinlandinternationallycompetitiveaftergenerouswageagreementsanddealingwithlabourshortagesarekeyissues.
ChangesintheoperatingenvironmentmeanthatVarmamustmakeitsinformationsystemsmoreefficientandprovideitsstaffwithmoreskills.Annualgrowthinthenumberofpensionapplicationswillkeepworkvolumeshighduringthenextfewyears.InMay-November2008,Varmawillsendabout700,000pensionrecordstothoseinsured at the company. The pension record, whichwillbesentannually, isasummaryofanindividual’semployment history detailing their earnings in theprivate sector and as an entrepreneur and the socialbenefitsaffectingthepension.Producingtherecords,providinginformationaboutthem,andthenecessarycustomerservicearrangementsmeanbothextracostsandchallenges.Thisisbecausetherecorddoesnotgiveanydetailsaboutsuchmattersaspublicsectoremploy-mentrelationshipsandpensions.Thepensionrecordswillhelpinmakingindividualsmoreawareoftheirpen-sioncover,increaseconfidenceintheearnings-relatedpensionschemeandputtheregisteredinformationonamoreaccuratebasis.Withchangesinsociety,moreattentionmustbepaidtorisingcostsbytheearnings-relatedpensionsector.
Varmaisanearnings-relatedpensioncompanycharac-terisedbyahighdegreeofsolvency.Asmarketleader,it focuses on improvements in customer service andoperationalefficiency.Thecompetitiveedgethiscre-ateswillmeanhigherclientbonuses.Themovetoanewheadofficeisachallenge,butitwillalsoenableVarmatoputitsoperationsonamoreefficientbasis.Varmaisdeterminedtomaintainitspositionasthelong-termleader in investment returns in the earnings-relatedpensionsector.

VARMA FINANCIAL STATEMENTS 2007 11
Income statement
PARENTCOMPANY GROUP
1Jan.–31Dec.€million 2007 2006 2007 2006
Technical accountPremiumswritten 3,146.8 2,983.3 3,146.8 2,983.3
Investmentincome 3,634.4 2,732.0 3,606.7 2,711.1
Claimsincurred
Claimspaid -2,770.7 -2,578.0 -2,770.7 -2,578.0Totalchangeinprovisionforclaimsoutstanding -1,121.8 -911.9 -1,121.8 -911.9Portfoliotransfer -17.7 -17.7Portfoliotransfer 9.2 1.2 9.2 1.2
-3,900.9 -3,488.7 -3,900.9 -3,488.7
Changeinprovisionforunearnedpremiums
Totalchange -675.0 -1,038.3 -675.0 -1,038.3
Portfoliotransfer -32.9 -32.9Portfoliotransfer 21.9 -2.5 21.9 -2.5
-686.0 -1,040.8 -686.0 -1,040.8
Operatingexpenses -63.9 -70.4 -63.9 -70.4
Investmentcharges -2,119.4 -1,100.9 -2,105.2 -1,088.1
Balance on technical account 11.1 14.6 -2.5 6.5
Non-technical accountBalanceontechnicalaccount 11.1 14.6 -2.5 6.5
Shareofassociatedcompanies’profit 11.6 4.2
Incometaxesonordinaryactivities
Taxesforthefinancialyear -6.8 -4.0 -6.8 -4.2
Profit on ordinary activities after taxes 4.3 10.6 2.3 6.5
Appropriations
Changeindepreciationdifference 0.2 0.2
Incometaxes
Taxesforthefinancialyear -0.0 -0.0
Minorityinterestintheresultforthefinancialyear 0.1 0.1
Profit for the financial year 4.4 10.7 2.3 6.6
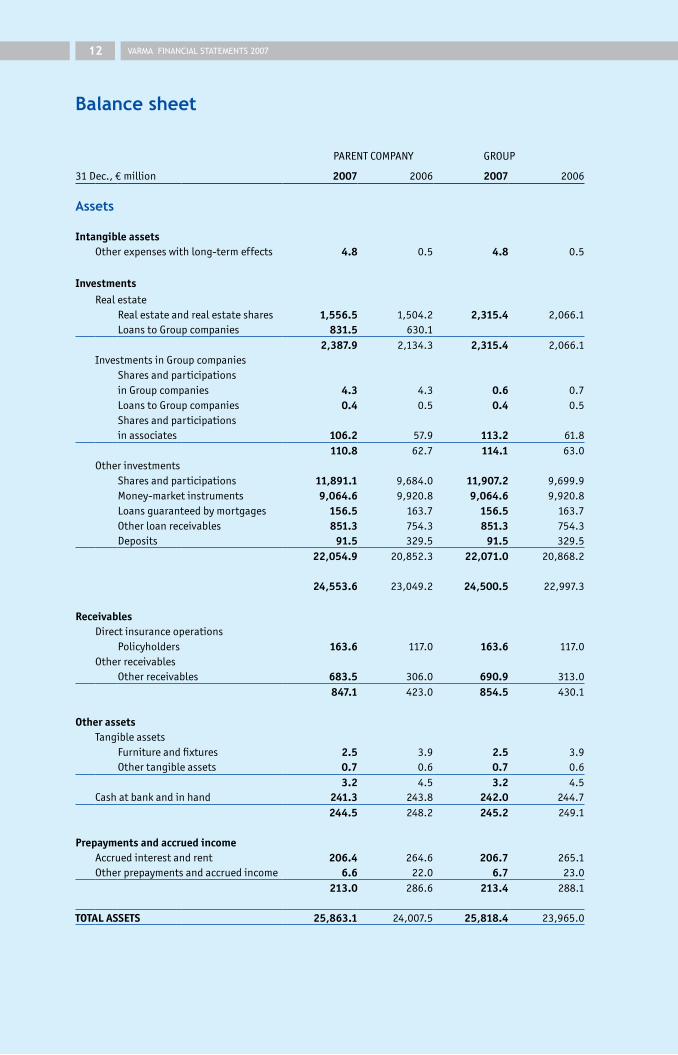
VARMA FINANCIAL STATEMENTS 200712
Balance sheet
PARENTCOMPANY GROUP
31Dec.,€million 2007 2006 2007 2006
Assets
Intangible assetsOtherexpenseswithlong-termeffects 4.8 0.5 4.8 0.5
InvestmentsRealestate
Realestateandrealestateshares 1,556.5 1,504.2 2,315.4 2,066.1LoanstoGroupcompanies 831.5 630.1
2,387.9 2,134.3 2,315.4 2,066.1InvestmentsinGroupcompanies
SharesandparticipationsinGroupcompanies 4.3 4.3 0.6 0.7LoanstoGroupcompanies 0.4 0.5 0.4 0.5Sharesandparticipationsinassociates 106.2 57.9 113.2 61.8
110.8 62.7 114.1 63.0Otherinvestments
Sharesandparticipations 11,891.1 9,684.0 11,907.2 9,699.9Money-marketinstruments 9,064.6 9,920.8 9,064.6 9,920.8Loansguaranteedbymortgages 156.5 163.7 156.5 163.7Otherloanreceivables 851.3 754.3 851.3 754.3Deposits 91.5 329.5 91.5 329.5
22,054.9 20,852.3 22,071.0 20,868.2
24,553.6 23,049.2 24,500.5 22,997.3
ReceivablesDirectinsuranceoperations
Policyholders 163.6 117.0 163.6 117.0Otherreceivables
Otherreceivables 683.5 306.0 690.9 313.0847.1 423.0 854.5 430.1
Other assetsTangibleassets
Furnitureandfixtures 2.5 3.9 2.5 3.9Othertangibleassets 0.7 0.6 0.7 0.6
3.2 4.5 3.2 4.5Cashatbankandinhand 241.3 243.8 242.0 244.7
244.5 248.2 245.2 249.1
Prepayments and accrued incomeAccruedinterestandrent 206.4 264.6 206.7 265.1Otherprepaymentsandaccruedincome 6.6 22.0 6.7 23.0
213.0 286.6 213.4 288.1
TOTAL ASSETS 25,863.1 24,007.5 25,818.4 23,965.0
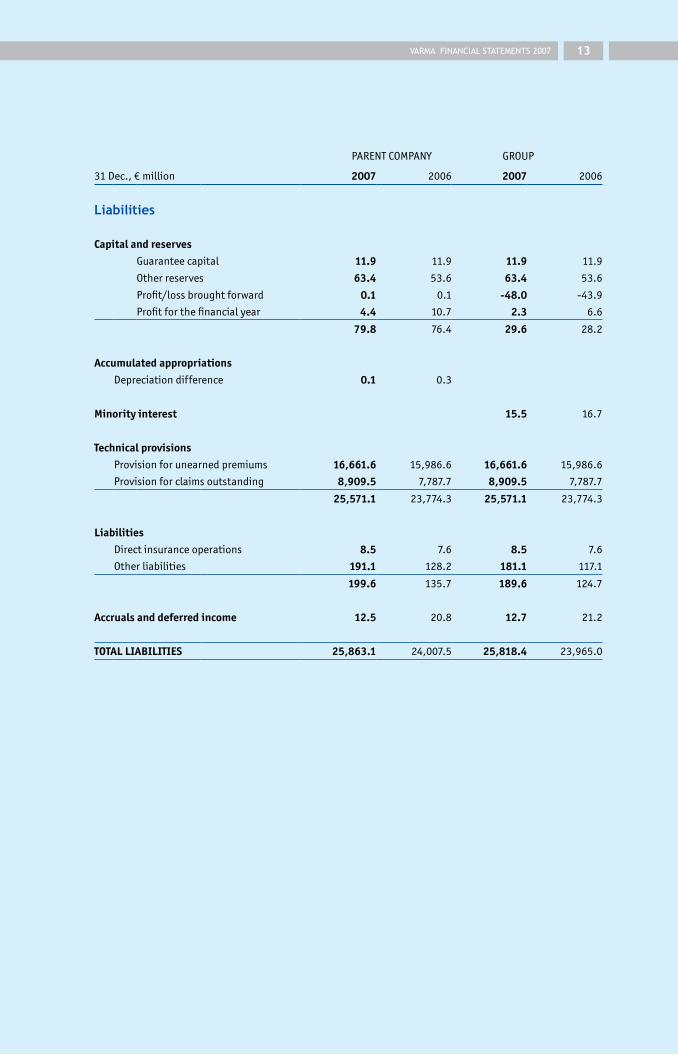
VARMA FINANCIAL STATEMENTS 2007 1�
PARENTCOMPANY GROUP
31Dec.,€million 2007 2006 2007 2006
Liabilities
Capital and reservesGuaranteecapital 11.9 11.9 11.9 11.9
Otherreserves 63.4 53.6 63.4 53.6
Profit/lossbroughtforward 0.1 0.1 -48.0 -43.9
Profitforthefinancialyear 4.4 10.7 2.3 6.6
79.8 76.4 29.6 28.2
Accumulated appropriationsDepreciationdifference 0.1 0.3
Minority interest 15.5 16.7
Technical provisionsProvisionforunearnedpremiums 16,661.6 15,986.6 16,661.6 15,986.6
Provisionforclaimsoutstanding 8,909.5 7,787.7 8,909.5 7,787.7
25,571.1 23,774.3 25,571.1 23,774.3
LiabilitiesDirectinsuranceoperations 8.5 7.6 8.5 7.6
Otherliabilities 191.1 128.2 181.1 117.1
199.6 135.7 189.6 124.7
Accruals and deferred income 12.5 20.8 12.7 21.2
TOTAL LIABILITIES 25,863.1 24,007.5 25,818.4 23,965.0
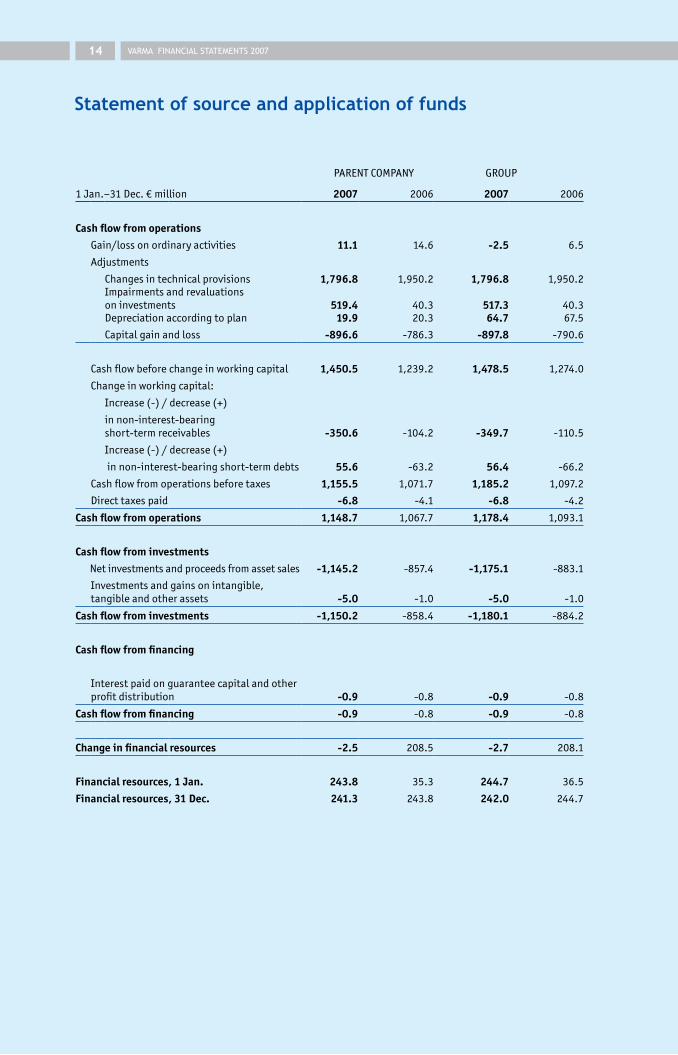
VARMA FINANCIAL STATEMENTS 20071�
Statement of source and application of funds
PARENTCOMPANY GROUP
1Jan.–31Dec.€million 2007 2006 2007 2006
Cash flow from operationsGain/lossonordinaryactivities 11.1 14.6 -2.5 6.5
Adjustments
Changesintechnicalprovisions 1,796.8 1,950.2 1,796.8 1,950.2Impairmentsandrevaluationsoninvestments 519.4 40.3 517.3 40.3Depreciationaccordingtoplan 19.9 20.3 64.7 67.5
Capitalgainandloss -896.6 -786.3 -897.8 -790.6
Cashflowbeforechangeinworkingcapital 1,450.5 1,239.2 1,478.5 1,274.0
Changeinworkingcapital:
Increase(-)/decrease(+)
innon-interest-bearingshort-termreceivables -350.6 -104.2 -349.7 -110.5
Increase(-)/decrease(+)
innon-interest-bearingshort-termdebts 55.6 -63.2 56.4 -66.2
Cashflowfromoperationsbeforetaxes 1,155.5 1,071.7 1,185.2 1,097.2
Directtaxespaid -6.8 -4.1 -6.8 -4.2
Cash flow from operations 1,148.7 1,067.7 1,178.4 1,093.1
Cash flow from investmentsNetinvestmentsandproceedsfromassetsales -1,145.2 -857.4 -1,175.1 -883.1
Investmentsandgainsonintangible,tangibleandotherassets -5.0 -1.0 -5.0 -1.0
Cash flow from investments -1,150.2 -858.4 -1,180.1 -884.2
Cash flow from financing
Interestpaidonguaranteecapitalandotherprofitdistribution -0.9 -0.8 -0.9 -0.8
Cash flow from financing -0.9 -0.8 -0.9 -0.8
Change in financial resources -2.5 208.5 -2.7 208.1
Financial resources, 1 Jan. 243.8 35.3 244.7 36.5
Financial resources, 31 Dec. 241.3 243.8 242.0 244.7

VARMA FINANCIAL STATEMENTS 2007 1�
Notes to the financial statementsAccounting principles
ThefinancialstatementsarepreparedinaccordancewiththeFinnishAccountingAct,CompaniesAct(previous),InsuranceCompaniesAct,EmployeePensionInsuranceCompaniesActandtheActonloweringthesolvencylimitandcoveringtechnicalprovisionsinpensioninstitutions.Inaddition,thedecreeoftheMinistryofSocialAffairsandHealthconcerningthefinancialstatementsandcon-solidatedfinancialstatementsofinsurancecompanies,aswellasthecalculationbasesconfirmedbytheMinis-tryofSocialAffairsandHealthandtheregulationsandguidelinesoftheInsuranceSupervisionAuthorityhavebeencompliedwith.
Consolidated financial statementsInadditiontotheparentcompany,thosecompaniesinwhichtheGroupholdsmorethan50%ofthevoteseitherdirectlyorindirectlyhavebeenconsolidatedinthecon-solidatedfinancialstatementsassubsidiaries.
Theparentcompanyhas180(187)realestatecom-paniesand2(2)othercompaniesassubsidiaries. ThecompaniesbelongingtotheGrouparelistedinthenotestothefinancialstatements.
The consolidated financial statements have beencompiledascombinationsoftheincomestatementandbalancesheetsoftheparentcompanyanditssubsidiar-ies,fromwhichintra-groupincomeandcharges,profitdistribution,amountsduetoorfromGroupcompaniesandcross-shareholdingshavebeeneliminated.However,TietoEnatorEsyLtdhasbeenconsolidatedusingtheeq-uitymethod.Subsidiariesacquiredduringtheyearhavebeenconsolidatedfromthemomentofacquisition.Theminorityinterestintheresultandthecapitalandreservesareshownundertheirownseparateheading.
Intra-groupcross-shareholdingshavebeeneliminatedusingtheacquisitionmethod.Theresultingconsolidationdifferenceisallocatedtosubsidiaries’assetitemswithinthelimitspermittedbytheirfairvalues,anddepreciatedinaccordancewiththedepreciationplansoftheseassetitems. Revaluations on Group shares are shown in theconsolidatedbalancesheetasarevaluationofrealestateownedbyasubsidiary.
Associatedcompaniesintendedforlong-termholdinginwhichtheGroupholds20–50%ofvotesareincludedintheconsolidatedfinancialstatementsusingtheequitymethod.Housingandrealestatecompanieshavenot,however,beentreatedasassociatedcompanies. Sincetheexpensesarisingfromthesecompaniesarecoveredbythemaintenancechargescollectedfromtheirowners,theirnon-inclusionhasaminimaleffectonGroupprofitandnon-restrictedcapitalandreserves.
Shareofassociatedcompanies’profitorlossisinclud-ed in the consolidated income statement. The Group’sshareoftheassociatedcompanies’profitorlossproducedafterthedayofacquisitionisaddedintheconsolidatedbalancesheettotheacquisitioncostoftheassociatedcompanyinquestion.
Investmentsinassociatesarelistedinthenotestothebalancesheet.
Copiesofthecompletesetofconsolidatedfinancialstatementsareavailableattheparentcompany’shead-quarters,atAnnankatu18,FI-00120Helsinki,Finland.
Valuation and deferral of investments and their fair valuesInvestments in real estate are entered at the lower ofacquisition cost less depreciation, plus revaluation or
fairvalue.ThefairvaluesofrealestateandrealestateshareshavebeenmeasureditembyitemasprovidedintheregulationsoftheInsuranceSupervisionAuthorityandonthebasisoftheopinionsofthecompany’sownandexternalexperts.Thefairvalueofinvestmentsinrealestateisestimatedannually.Norealestaterevaluationshavebeenenteredfortheyear2007.
Sharesandparticipationsareenteredinthebalancesheetatthelowerofacquisitioncostorfairvalue.Previ-ousvalueadjustmentsonsecuritiesareenteredintheincomestatementasvaluereadjustmentsinrespectofthevalueappreciation.Thelastavailablebuyingratesor,ifthesearenotavailable,closingpricesatthebalancesheetdateareusedasfairvaluesforlistedsecurities.Thefairvalueofotherequitiesisthepurchasepriceorthenetrealisablevalueorthenetassetvalue.Investmentsinprivateequityfundsareenteredinthebalancesheetatfairvalueestimatedbythemanagementcompanyor,ifthisisnotavailable,atacquisitioncost.Investmentsinmutualfundsareenteredatthelastavailablevalueofthesharecalculatedbythemanagementcompany.
Money-market instruments are entered in the bal-ancesheetatthelowerofacquisitioncostorfairvalue.Changes in value due to interest rate fluctuations arenotentered.Thedifferencebetweenthenominalvalueandacquisitioncostof themoneymarket instrumentsis allocated to interest income and its reduction overthematurityof the instrument.Thecounterpartentryfortheallocationsenteredasanincreaseordecreaseintheacquisitioncostisshowninthenotestothebalancesheet.Theacquisitioncostistheaveragepricecalculatedforeachinstrument.
Derivativecontractsforhedgingpurposesarevaluedtogetherwiththehedgeditem.Ifnochangeinvaluehasbeenentered in the income statement for thehedgedbalancesheetitem,noentryhasbeenrecordedintheincomestatementforthehedgingcontract,unlessthenegativevaluechangeexceedsthepositivevaluechangeinthehedgingcontract.Ifavaluereadjustmenthasbeenentered for the hedged item, the value change of thederivativeusedisenteredinitsentiretyasanexpense.Resulting income and expenses are entered as adjust-mentsinvalueadjustmentsandre-adjustments.
Negativevalueadjustmentsofderivativefinancialin-strumentsotherthanthosecreatedforpurposesofhedg-inghavebeenenteredthroughproditandloss.Theprofitsandlossesresultingfromtheterminationorexpirationofcontractsareenteredasincomeorexpensesforthefinancialyear.Incomeandexpensesfrominterestratederivativesareenteredunderinterestincome.
Currency derivatives treated in the financial state-ments as hedging instruments are treated in a corre-spondingmannerincontributionmarginaccountingforsolvencyandtechnicalprovisions.
Loanedsecuritiesareincludedinthebalancesheet.They are presented in the notes to the balance sheet.Theborroweristheclearingcompanythathasprovidedcollateralfortheloan.
Foreigncurrencydenominated investmentsareen-teredatthelowerofrateonthedateoftransactionorrateatthebalancesheetdate.Currencyconversiondifferenc-esareenteredasadjustmentstoincomeandexpenses.Currencyconversiondifferencesforcashatbankandinhandanddepositsanditemsthatcannotbeenteredasadjustmentstoincomeandexpenses,areenteredunderinvestment incomeandcharges.Whencalculating fair
VARMA FINANCIAL STATEMENTS 20071�
values,theEuropeanCentralBankaverageratequotedon31Decemberisused.
Premiumreceivablesandotherreceivablesarevaluedatthelowerofnominalvalueorprobablevalue.
Depreciation according to planTheacquisitioncostofbuildings,includingcomponentsinbuildings,movablepropertyandotherexpenseswithlong-termeffects,aredepreciatedaccordingtoplanovertheirusefullives.Revaluationofbuildingsenteredasin-comeisalsodepreciatedaccordingtoplan.Thestraight-linedepreciationmethodisappliedusingthefollowingeconomicusefullives:
Residential,officeandbusinesspremises,hotels 40–60yrsIndustrialpremisesandwarehouses 25–50yrsTechnicalequipmentinbuildings 10yrsComputerhardware 3yrsComputersoftware 5yrsMotorvehicles 5yrsFurnitureandfixtures 10yrsOfficemachines 7yrsOtherexpenseswithlong-termeffects 5–10yrs
Profit for the year, and capital and reserves Inanearnings-relatedpension insurancecompany,theparentcompany’sprofitaftertaxesintheincomestate-mentisdeterminedbycalculationbasesconfirmedbytheFinnishMinistryofSocialAffairsandHealth.Thedivisionoftheparentcompany’scapitalandreservesbetweentheinsuranceportfolioandtheownersoftheguaranteecapitalispresentedinthenotestothefinancialstatements.
Solvency capitalSolvencycapitaliscalculatedasthedifferencebetweentheassetsanddebtsvaluedatfairvalue.Itcomprisescapital and reserves, accumulated appropriations, thevaluationdifferenceandtheprovisionforfuturebonuses.Acalculatedmaximumlosshasbeendeductedfromthesolvencycapitalforderivativefinancialinstrumentsotherthanthoseusedtoreducerisk.
Thesolvencycapitalandsolvencyborderarepresent-edinthenotestothefinancialstatements.
TaxesTaxcomplyingwiththetaxcalculationofthetaxformisenteredastaxforthefinancialyearonanaccrualbasis.
Deferredtaxliabilitiesorassetshavenotbeencalcu-latedfortheaccrualofclosingaccounttransfersorothertemporarydifferencesbetweenbookvalueandtaxablevalue,becausethecompany’snetresult isdeterminedbycalculationbasesconfirmedbytheFinnishMinistryof Social Affairs and Health. Neither has the deferredtaxliabilityorreceivablebeencalculatedinthemutualrealestatecompaniesownedbytheGroup,becausetheyarenotsignificant for thecompany inquestionor theGroup. Closing account transfers and valuation differ-encesshowninthenotestothefinancialstatementswillbeenteredasincomeonlyagainstexpenseentries.
Operating expenses and depreciation by functionIntheincomestatement,theoperatingexpensesfromoperationsrelatedtocompensationsandoperationsforthe maintenance of working capacity are included inclaimspaid,andexpensesrelatedtoinvestmentmanage-
mentareincludedininvestmentcharges.Theexpensesofinsuranceoperationsandadministrationarepresentedasnetoperatingexpenses.
Pension plansThe pension coverage for the personnel is arrangedthrough TyEL insurance and supplementary pensioninsurance.ThepensionplansofthePresidentandCEOandhisdeputyareexplainedinthenotestothefinancialstatements.
Balance sheet and income statement at fair valuesInadditiontothe informationrequiredbytheregula-tions,theparentcompany’sincomestatementandbal-ancesheetatfairvaluesarepresentedinthenotestothefinancialstatement.Thepurposeofthisistoimprovethetransparencyoftheannualaccountinformationofanearnings-relatedpensioninsurancecompany.
Themaincomponentsofthesolvencycapitalshownseparatelyandmeasuringsolvencyinthebalancesheetarethecapitalandreserves,provisionforfuturebonuses,depreciationdifferenceandvaluationdifferencesofin-vestments.Theprovisionforcurrentbonusesreservedforthepaymentofclientbonuses,theequity-linkedprovi-sionforcurrent/futurebonusesandtheequalisationpro-visionareshownontheirownlines.Investmentsandtheirnetreturnareshownatfairvalue.Theinterestcreditedontechnicalprovisionsisincludedunderchangeintechnicalprovision.Thecompany’soperatingexpenseshavebeencombinedintoonelineintheincomestatement.
Key figures and analysesThekeyfiguresandanalysesdescribingfinancialdevel-opmentarecalculatedandpresentedinaccordancewiththestipulationsoftheInsuranceSupervisionAuthorityconcerningnotestothefinancialstatements.
Keyfiguresfor investmentoperationsandsolvencyarepresentedatfairvalues.
Net investment incomeat fairvaluesover investedcapitalhasbeencalculatedbytypeofinvestmentandforthetotalamountofinvestmentswithreferencetodailyormonthlytime-weightedcashoroutputflow.
ThereturnfortheperiodhasbeencalculatedusingamodifiedDietzformula(timeandmoneyweightedfor-mula) so that invested capital has been calculated byadding to the opening market value the cash flow forthe period (cash flow/output flow = purchases – sales–income+expenses)weightedbytherelativeshareofthelengthoftheperiodthatisleftfromthedateoftheeventtotheendoftheperiod.
ThetotalreturnonrealestateinaccordancewiththeInstituteforRealEstateEconomics(KTI)consistsofthenetreturn(income–maintenanceexpenses)adjustedbythechangeinmarketvalue.Thetotalreturniscalculatedontheaverageinvestedcapital,whichiscalculatedbyadjustingthemarketvalueatthebeginningoftheyearbyhalfoftheinvestmentsmadeduringtheyear,whichareassumedtobemadeatevenintervalsduringtheyear.The total return percentage consists of the net returnpercentage adjusted by the capital return percentage(capitalreturnpercentage=changeinvalueduringtheyearasapercentageofaverageinvestedcapital).

VARMA FINANCIAL STATEMENTS 2007 17
Notes to the financial statementsGroup companies
The following companies are included as new subsidiaries in Varma’s
consolidated financial statements:
KiinteistöOyHiihtäjäntie1
KiinteistöOyLappeenrannanKodinkeskus
KiinteistöOyLiike-jaAutokulma
KiinteistöOyRajalla
KiinteistöOyTavastkulla
AsuntoOyHelsinginKadetintie4
In addition, the Group comprises the following 176 subsidiaries:
AsuntoOyEspoonEmännäntie1
AsuntoOyEspoonEmännäntie2
AsuntoOyEspoonEmännäntie3
AsuntoOyEspoonKeijumäki
AsuntoOyEspoonKilonlemmikki
AsuntoOyEspoonKiskottajankuja4
AsuntoOyEspoonKyyhkysmäki14
AsuntoOyEspoonLintuvaarantie37-39
AsuntoOyEspoonPyölinpuisto
AsuntoOyEspoonRautiaisentie21
AsuntoOyHaukikoto
AsuntoOyHelsinginKaustisenpolku1
AsuntoOyHelsinginKimmontie3
AsuntoOyHelsinginKivihaanrinne
AsuntoOyHelsinginKlaneettitie
AsuntoOyHelsinginNäyttelijäntie22
AsuntoOyHelsinginPäijänteentie4-6
AsuntoOyHelsinginRoihuvuorentie20
AsuntoOyHelsinginRoihuvuorentie30
AsuntoOyJyväskylänKiramo4
AsuntoOyKatajaharjuntie22
AsuntoOyKokkovuori
AsuntoOyKorkeavuorenkatu2a
AsuntoOyKuokkalanTahkonkartano
AsuntoOyLahdenKulmakatu10
AsuntoOyLahdenKulmakatu12
AsuntoOyLahdenLahdenkatu39
AsuntoOyLahdenMassinhovi
AsuntoOyLahdenMassinpoiju
AsuntoOyLinnantie3
AsuntoOyMerihauki
AsuntoOyNeilikkatie
AsuntoOyNiittymaanpuisto
AsuntoOyNäkinkuja4
AsuntoOyOulunLehmuskuja
AsuntoOyPaatsamatie3
AsuntoOyParatiisintie
AsuntoOyRaisionTasontorni
AsuntoOyRovaniemenVälirakka
AsuntoOySiltavoudintie1
AsuntoOyTaivalpolku
AsuntoOyTampereenJankansampo
AsuntoOyTampereenKultaköynnös
AsuntoOyTampereenNäsijärvenkatu3
AsuntoOyTampereenPalatsinraitti1
AsuntoOyTampereenPuuvillatehtaankatu6
AsuntoOyTampereenSatakunnankatu22
AsuntoOyTampereenVihilahdenkontu
AsuntoOyTervahovinkatu12
AsuntoOyTurunItäinenRantakatu64
AsuntoOyTurunItäinenRantakatu70
AsuntoOyTurunLaivurinkatu2
AsuntoOyTurunMetallikatu
AsuntoOyVantaanKaivoslähde
AsuntoOyVantaanKäräjäkuja1
AsuntoOyVantaanVernissakatu5
AsuntoOyVäinämöisenkatu7
HakunilanKiinteistötOy
HelsinginKiinteistösijoitusOy
KiinteistöosakeyhtiöVarma
KiinteistöOyAhertajantie3
KiinteistöOyArabianParkki
KiinteistöOyAspius
KiinteistöOyAtomitalo
KiinteistöOyAviaPrima
KiinteistöOyEerikinkatu24
KiinteistöOyElocinkulma3
KiinteistöOyEspoonKamreerintie2
KiinteistöOyEspoonKiltakallionrinne
KiinteistöOyEspoonKomentajan-Varma
KiinteistöOyEspoonNiittyhaka
KiinteistöOyEspoonRuukinmestarintie2
KiinteistöOyFredrikinkatu42
KiinteistöOyFriisikeskus
KiinteistöOyGigahermia
KiinteistöOyHaunistenniitty
KiinteistöOyHeinolanLampikatu16
KiinteistöOyHelsinginHiilipiha
KiinteistöOyHelsinginHiiliranta
KiinteistöOyHelsinginItämerenkatu11-13
KiinteistöOyHelsinginLemuntie7
KiinteistöOyHelsinginLönnrotinkatu18
KiinteistöOyHelsinginMalminkatu28
KiinteistöOyHelsinginPutkitie3
KiinteistöOyHelsinginRatavartijankatu5
KiinteistöOyHelsinginRistipellontie16
KiinteistöOyHelsinginTapulikaupungintie13
KiinteistöOyHelsinginValimopolku4
KiinteistöOyHelsinginValimotie9-11
KiinteistöOyHelsinginValimotie16
KiinteistöOyHelsinkiNiittylänpolku10
KiinteistöOyHotelliTorni
KiinteistöOyHämeenkatu23
KiinteistöOyHämeentie135
KiinteistöOyItäinenRantakatu60
KiinteistöOyItälahdenkatu15-17
KiinteistöOyItälahdenkatu22A
KiinteistöOyJohnStenberginranta2
KiinteistöOyJuhanaHerttua3
KiinteistöOyJyväskylänmaalaisk.Kotikeskus
KiinteistöOyJyväskylänMattilanniemi
KiinteistöOyKaarenhanka
KiinteistöOyKaikukatu7
KiinteistöOyKangasalanVihervarpu
KiinteistöOyKeskustahotelli
KiinteistöOyKoirasaarentie1
KiinteistöOyKolmisopentie3
KiinteistöOyKoroppa
KiinteistöOyKoskikastanja
KiinteistöOyKouvolanLehtikaari3
KiinteistöOyKuparitie2
KiinteistöOyKuutosseppä
KiinteistöOyLahdenJussilankatu6
KiinteistöOyLahdenTupalankatu3
KiinteistöOyLahdenVirastotalo
KiinteistöOyLamminTyökeskus

VARMA FINANCIAL STATEMENTS 20071�
KiinteistöOyLappeenrannanPatria
KiinteistöOyLassilanlinna
KiinteistöOyLohjanSampotalo
KiinteistöOyLoimaanportti
KiinteistöOyLönnrotinkatu12
KiinteistöOyLönnrotinkatu12A
KiinteistöOyMenotie1
KiinteistöOyMetsäpojankuja1
KiinteistöOyMyyrkumpu
KiinteistöOyMälikkäläntalo
KiinteistöOyNummenvaara
KiinteistöOyNurmijärvenLiiketalo
KiinteistöOyOlarinluoma9
KiinteistöOyOulunKallisensuora5
KiinteistöOyOulunkyläntori1
KiinteistöOyOulunTulliväylä3
KiinteistöOyOulunTyrnäväntie6
KiinteistöOyPalokanvarma
KiinteistöOyPartolanKauppajätti
KiinteistöOyPharmaCity
KiinteistöOyPorel
KiinteistöOyPorinEteläväylä2
KiinteistöOyPorvoonKuninkaantie1
KiinteistöOyRajasampaanranta2
KiinteistöOyRastilanLiikekeskus
KiinteistöOySavonkatu21
KiinteistöOyScanaine
KiinteistöOySinihelmi
KiinteistöOySompasaarenTukoeka
KiinteistöOySpektrinTrio
KiinteistöOySuometsänkaari2
KiinteistöOyTampereenKalevanpaasi
KiinteistöOyTarhaajantie2
KiinteistöOyTeerivuorenkatu28
KiinteistöOyTeerivuorenpuisto
KiinteistöOyTekniikantie4
KiinteistöOyTeräslautelanrinne
KiinteistöOyTietotalo
KiinteistöOyTilkanPaletti
KiinteistöOyTurunAninkaistenkatu13
KiinteistöOyTurunAsemakeskus
KiinteistöOyVaasanMonopolFastighetsAb
KiinteistöOyVaasanSampotalo
KiinteistöOyVantaanMartintalo
KiinteistöOyVantaanRasti
KiinteistöOyVantaanSarkatie1
KiinteistöOyVantaanTasetie8
KiinteistöOyVarmantalo
KiinteistöOyVuorenvarma
KiinteistöOyVääksyntie4
OldMillOy
OsakevarmaOy
OyÄssäkeskusAb
PitäjänmäenKiinteistötOy
Talo-osakeyhtiöKuopionTulliportinkatu25
TampereenKiinteistöInvestOy
TietoEnatorEsyLtd
UpperLimitOy
VaasaHitecParkOy
VaasaTeknoParkOy
The following 12 subsidiaries exited the Group during
the year under review:
KiinteistöOyArinatie6
KiinteistöOyJämsänTorinkulma
KiinteistöOyKempeleenKurikkatie12
KiinteistöOyKoivuhaanportti10
LepinpellonkatuOy
KiinteistöOyKotkanSuursaarenkatu1
KiinteistöOyMiekkoniemenKauppakeskus
KiinteistöOyPappilanrinteenLiiketalo
KiinteistöOyÄänekoskenOstoskeskus
SatakunnanTeollisuustaloOy
TeräsporttiOy
ValuraudankujaOy
In addition, the Group comprises the following 37 associates:
AsuntoOyHarjavallankatu6
AsuntoOyHelsinginHaapaniemenkatu11
AsuntoOyKuusiniementie12
AsuntoOyLahdenRitaripiha
HaaganIIILiikekeskus
KamreerintienPysäköintitaloOy
KeminAsemakatu4
KiinteistöOyAlavudenRantakeskus
KiinteistöOyElocinkulma1
KiinteistöOyFriitalanLiiketalo
KiinteistöOyKarkkilanSähkökiinteistö
KiinteistöOyKevätkummunPalvelukeskus
KiinteistöOyLiikejalava
KiinteistöOyPuijonlaaksonPalvelukeskus
KiinteistöOySalpausseläntie
KiinteistöOySammontori
KiinteistöOySelloparkki
KiinteistöOySuursuonOstoskeskus
KiinteistöOyTurunAutopiha
KiinteistöOyZeppelininMarkkinapaikka
KoivulanLiikekeskusOy
KulosaarenOstoskeskusOy
LansantienLiikekiinteistöOy
MartinparkkiOy
NVKiinteistösijoitusOy
NäkinPihapuistikkoIIOy
OulunLehmusparkkiOy
Poha-PysäköintiOy
P-TurkuOy
RuohoparkkiOy
SatoOyj
SibyllaOy
SiltaOy
SpektriBusinessOy
Spektri-ParkOy
VakuutusosakeyhtiöGarantia
VaasanToripysäköintiOy
The following 3 associates exited the Group
during the year under review:
OveniaOy
PorinTaloOy
AsuntoOySaarnilaakso
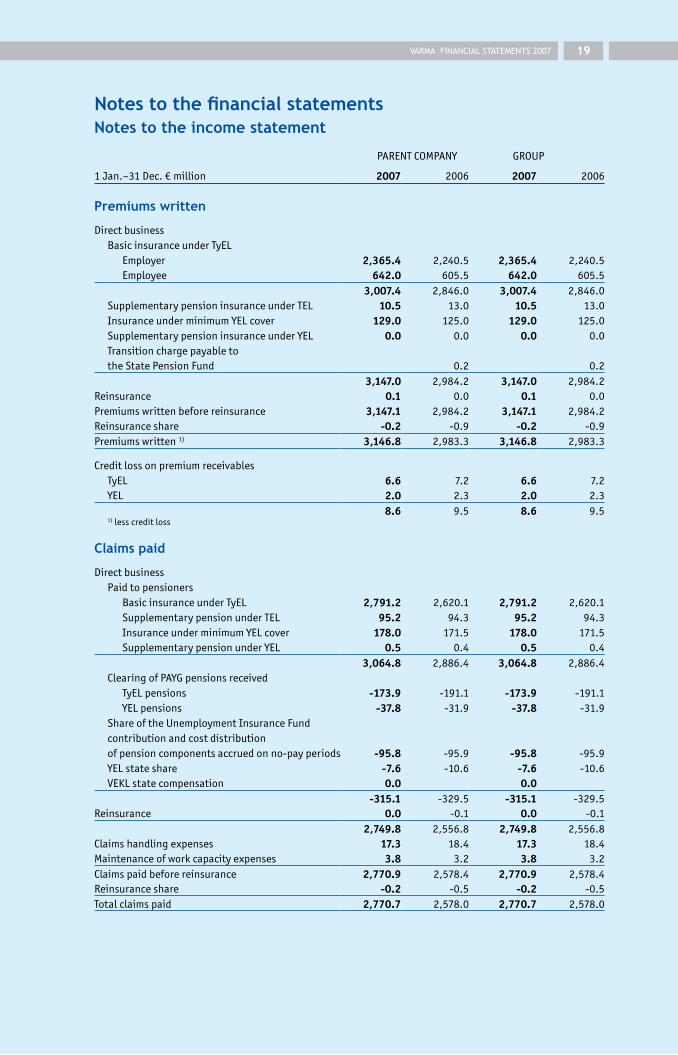
VARMA FINANCIAL STATEMENTS 2007 1�
Notes to the financial statementsNotes to the income statement
1Jan.–31Dec.€million 2007 2006 2007 2006
Premiums written
DirectbusinessBasicinsuranceunderTyEL
Employer 2,365.4 2,240.5 2,365.4 2,240.5Employee 642.0 605.5 642.0 605.5
3,007.4 2,846.0 3,007.4 2,846.0SupplementarypensioninsuranceunderTEL 10.5 13.0 10.5 13.0InsuranceunderminimumYELcover 129.0 125.0 129.0 125.0SupplementarypensioninsuranceunderYEL 0.0 0.0 0.0 0.0TransitionchargepayabletotheStatePensionFund 0.2 0.2
3,147.0 2,984.2 3,147.0 2,984.2Reinsurance 0.1 0.0 0.1 0.0Premiumswrittenbeforereinsurance 3,147.1 2,984.2 3,147.1 2,984.2Reinsuranceshare -0.2 -0.9 -0.2 -0.9Premiumswritten1) 3,146.8 2,983.3 3,146.8 2,983.3
CreditlossonpremiumreceivablesTyEL 6.6 7.2 6.6 7.2
YEL 2.0 2.3 2.0 2.38.6 9.5 8.6 9.5
1)lesscreditloss
Claims paid
DirectbusinessPaidtopensioners
BasicinsuranceunderTyEL 2,791.2 2,620.1 2,791.2 2,620.1SupplementarypensionunderTEL 95.2 94.3 95.2 94.3InsuranceunderminimumYELcover 178.0 171.5 178.0 171.5SupplementarypensionunderYEL 0.5 0.4 0.5 0.4
3,064.8 2,886.4 3,064.8 2,886.4ClearingofPAYGpensionsreceived
TyELpensions -173.9 -191.1 -173.9 -191.1YELpensions -37.8 -31.9 -37.8 -31.9
ShareoftheUnemploymentInsuranceFundcontributionandcostdistributionofpensioncomponentsaccruedonno-payperiods -95.8 -95.9 -95.8 -95.9YELstateshare -7.6 -10.6 -7.6 -10.6VEKLstatecompensation 0.0 0.0
-315.1 -329.5 -315.1 -329.5Reinsurance 0.0 -0.1 0.0 -0.1
2,749.8 2,556.8 2,749.8 2,556.8Claimshandlingexpenses 17.3 18.4 17.3 18.4Maintenanceofworkcapacityexpenses 3.8 3.2 3.8 3.2Claimspaidbeforereinsurance 2,770.9 2,578.4 2,770.9 2,578.4Reinsuranceshare -0.2 -0.5 -0.2 -0.5Totalclaimspaid 2,770.7 2,578.0 2,770.7 2,578.0
PARENTCOMPANY GROUP
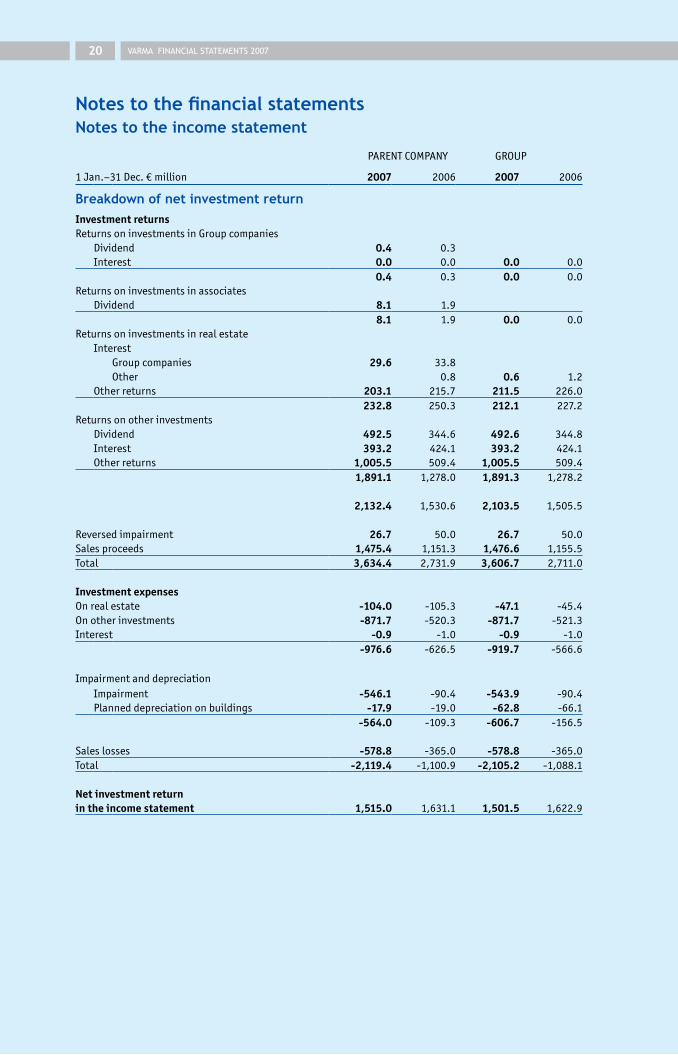
VARMA FINANCIAL STATEMENTS 200720
Notes to the financial statementsNotes to the income statement
PARENTCOMPANY GROUP
1Jan.–31Dec.€million 2007 2006 2007 2006
Breakdown of net investment returnInvestment returnsReturnsoninvestmentsinGroupcompanies
Dividend 0.4 0.3 Interest 0.0 0.0 0.0 0.0
0.4 0.3 0.0 0.0Returnsoninvestmentsinassociates
Dividend 8.1 1.98.1 1.9 0.0 0.0
ReturnsoninvestmentsinrealestateInterest
Groupcompanies 29.6 33.8Other 0.8 0.6 1.2
Otherreturns 203.1 215.7 211.5 226.0232.8 250.3 212.1 227.2
ReturnsonotherinvestmentsDividend 492.5 344.6 492.6 344.8Interest 393.2 424.1 393.2 424.1Otherreturns 1,005.5 509.4 1,005.5 509.4
1,891.1 1,278.0 1,891.3 1,278.2
2,132.4 1,530.6 2,103.5 1,505.5
Reversedimpairment 26.7 50.0 26.7 50.0Salesproceeds 1,475.4 1,151.3 1,476.6 1,155.5Total 3,634.4 2,731.9 3,606.7 2,711.0
Investment expensesOnrealestate -104.0 -105.3 -47.1 -45.4Onotherinvestments -871.7 -520.3 -871.7 -521.3Interest -0.9 -1.0 -0.9 -1.0
-976.6 -626.5 -919.7 -566.6
ImpairmentanddepreciationImpairment -546.1 -90.4 -543.9 -90.4Planneddepreciationonbuildings -17.9 -19.0 -62.8 -66.1
-564.0 -109.3 -606.7 -156.5
Saleslosses -578.8 -365.0 -578.8 -365.0Total -2,119.4 -1,100.9 -2,105.2 -1,088.1
Net investment returnin the income statement 1,515.0 1,631.1 1,501.5 1,622.9

VARMA FINANCIAL STATEMENTS 2007 21
1Jan.-31Dec.€milion 2007 2006 2007 2006
Operating expenses in the income statementInsurancepolicyacquisitioncosts Directbusinesscommissions 1.9 1.5 1.9 1.5 Otherinsurancepolicyacquisitioncosts 3.4 3.0 3.4 3.0
5.3 4.5 5.3 4.5Portfolioadministrationexpenses 41.0 36.8 41.0 36.8Administrativeexpenses
StatutorychargesFinnishCentreforPensionsshare 12.2 14.5 12.2 14.5Judicialadministrationfee 1.0 0.7 1.0 0.7InsuranceSupervisoryAuthoritysupervisionfee 0.5 0.5 0.5 0.5Otheritems -8.0 -8.0
5.6 15.7 5.6 15.7
Otheradministrativeexpenses 11.9 13.4 11.9 13.463.9 70.4 63.9 70.4
Overall operating expenses by function
Claimspaid Claimshandlingexpenses 17.3 18.4 17.3 18.4 Maintenanceofworkcapacityexpenses 3.8 3.2 3.8 3.2
21.2 21.6 21.2 21.6Operatingexpenses 63.9 70.4 63.9 70.4Investmentmanagementcharges
Expensesoninvestmentsinrealestate 4.2 3.6 4.2 3.6Expensesonotherinvestments 10.4 8.7 10.4 8.7
14.7 12.3 14.7 12.3
Totaloperatingexpenses 99.7 104.3 99.7 104.3
Personnel and members of company bodies
Personnel expenses
Salariesandremunerations 33.6 32.2 33.6 32.2Pensionexpenses 5.6 5.4 5.6 5.4Otherpersonnel-relatedexpenses 4.7 4.7 4.7 4.7Total 43.9 42.3 43.9 42.3
Management salaries and remunerationsPresidentandCEOandhisdeputy 1.0 0.9 1.0 0.9MembersanddeputymembersoftheBoardofDirectors 0.2 0.2 0.2 0.2MembersanddeputymembersoftheSupervisoryBoard 0.1 0.1 0.1 0.1Total 1.3 1.2 1.3 1.2
Averagenumberofpersonnelduringthefinancialyear 646 671 816 850
PresidentandCEOMattiVuoriawaspaid€639,000insalaryandfringebenefits.Hisretirementageis60yearsandhispensionwillbe60percentofthecalculatedpensionablesalary.MarkkuHyvärinen,hisdeputy,waspaid€347,000insalaryandfringebenefits.Hisretirementageis60yearsandhispensionwillbe60percentofthecalculatedpensionablesalary.
Income taxesDeferredtaxliabilitiesorassetsbasedonaccumulatedappropriationsorothertemporarydifferencesbetweenbookvalueandtaxablevalueshavenotbeenenteredinthebalancesheet,becausesuchdeferredtaxliabilitiesorassetsareunlikelytoberealisedinthefinancialstatementsofacompanyengagedinthestatutorypensioninsurancebusinessorofitsGroup.
PARENTCOMPANY GROUP

VARMA FINANCIAL STATEMENTS 200722
Investments at fair value and valuation differences, Parent CompanyRemaining acquisition
cost
2007
Book value
2007
Fair value
2007
Remainingacquisition
cost
2006
Bookvalue
2006
Fairvalue
200631Dec.,€million
Notes to the balance sheetNotes to the financial statements
InvestmentsinrealestateRealestate 552.4 569.0 713.6 487.6 504.2 611.2SharesinGroupcompanies 936.9 936.9 1,321.8 953.4 953.4 1,230.2Otherrealestateshares 52.3 52.3 56.3 46.6 46.6 49.4LoanstoGroupcompanies 520.3 520.3 520.3 517.0 517.0 517.0Loanstorealestatecompanies 309.4 309.4 309.4 113.1 113.1 113.1
InvestmentsinGroupcompaniesSharesandparticipations 4.3 4.3 4.3 4.3 4.3 4.3Loanreceivables 0.4 0.4 0.4 0.5 0.5 0.5
InvestmentinassociatesSharesandparticipations 106.2 106.2 137.7 57.9 57.9 59.9
OtherinvestmentsSharesandparticipations 11,867.2 11,867.2 15,270.2 9,674.8 9,674.8 12,844.5Money-marketinstruments 9,041.2 9,041.2 8,793.1 9,894.5 9,894.5 9,938.4Loansguaranteedbymortgages 156.5 156.5 156.5 163.7 163.7 163.7Otherloanreceivables 851.2 851.2 852.6 754.3 754.3 755.8Deposits 91.5 91.5 91.5 329.5 329.5 329.5
24,489.7 24,506.3 28,227.6 22,997.1 23,013.7 26,617.4
Theremainingacquisitioncostofmoney-marketinstrumentsincludes:-thedifferencebetweenthenominalvalue
andacquisitioncost,releasedorchargedtointerestincome-88.0 -91.3
-incomefromindex-boundloans 18.2
-88.0 -73.2
BookvalueincludesRevaluationsenteredasincome 16.6 16.6
Valuationdifference(differencebetweenfairvalueandbookvalue) 3,721.3 3,603.7

VARMA FINANCIAL STATEMENTS 2007 2�
Investments at fair value and valuation differences, Group
InvestmentsinrealestateRealestate 2,244.7 2,261.3 2,854.3 2,002.9 2,019.5 2,462.1Otherrealestateshares 52.3 52.3 56.3 46.6 46.6 49.4Loanstorealestatecompanies 1.8 1.8 1.8 0.0 0.0 0.0
InvestmentsinGroupcompaniesSharesandparticipations 0.6 0.6 0.6 0.7 0.7 0.7Loanreceivables 0.4 0.4 0.4 0.5 0.5 0.5
InvestmentsinassociatesSharesandparticipations 113.2 113.2 137.7 61.8 61.8 61.6
OtherinvestmentsSharesandparticipations 11,883.3 11,883.3 15,286.3 9,690.7 9,690.7 12,860.4Money-marketinstruments 9,041.2 9,041.2 8,793.1 9,894.5 9,894.5 9,938.4Loansguaranteedbymortgages 156.5 156.5 156.5 163.7 163.7 163.7Otherloanreceivables 851.2 851.2 852.6 754.3 754.3 755.8Deposits 91.5 91.5 91.5 329.5 329.5 329.5
24,436.6 24,453.2 28,231.1 22,945.2 22,961.7 26,622.3
Theremainingacquisitioncostofmoney-marketinstrumentsincludes:
-thedifferencebetweenthenominalvalue
andacquisitioncost,releasedorcharged tointerestincome -88.0 -91.3
-incomefromindex-boundloans 18.2
-88.0 -73.2
BookvalueincludesRevaluationsenteredasincome 16.6 16.6
Valuationdifference(differencebetweenfairvalueandbookvalue) 3,777.9 3,660.5
Remaining acquisition
cost
2007
Book value
2007
Fair value
2007
Remainingacquisition
cost
2006
Bookvalue
2006
Fairvalue
200631Dec.,€million
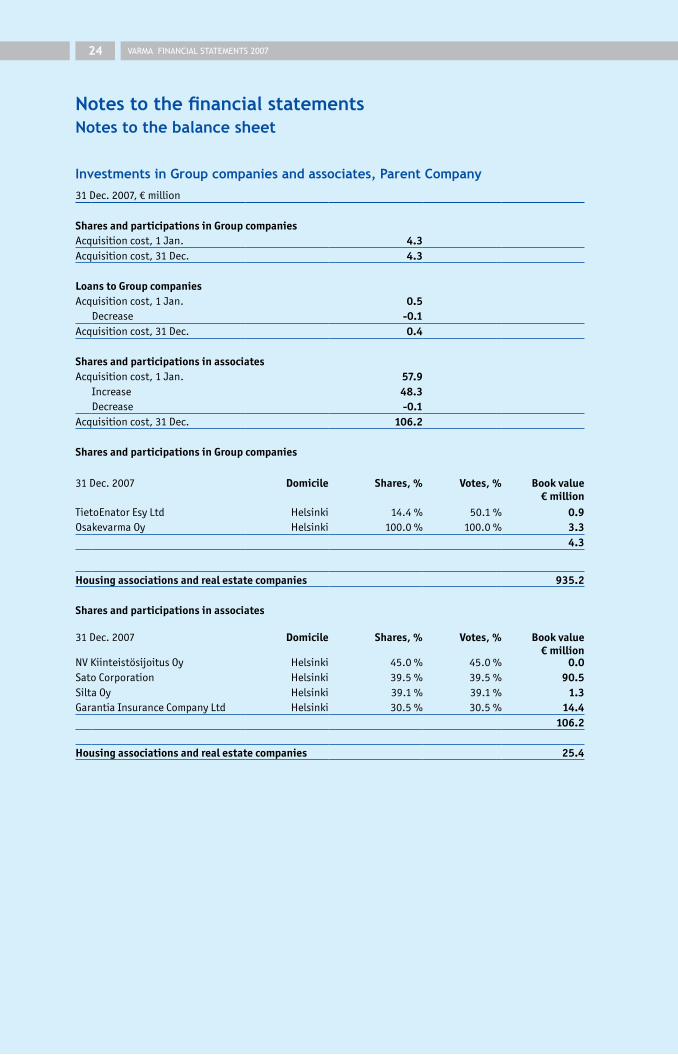
VARMA FINANCIAL STATEMENTS 20072�
Notes to the financial statements
Investments in Group companies and associates, Parent Company
Notes to the balance sheet
31Dec.2007,€million
Shares and participations in Group companies Acquisitioncost,1Jan. 4.3Acquisitioncost,31Dec. 4.3
Loans to Group companies Acquisitioncost,1Jan. 0.5
Decrease -0.1Acquisitioncost,31Dec. 0.4
Shares and participations in associates Acquisitioncost,1Jan. 57.9
Increase 48.3Decrease -0.1
Acquisitioncost,31Dec. 106.2
Shares and participations in Group companies
31Dec.2007 Domicile Shares, % Votes, % Book value€ million
TietoEnatorEsyLtd Helsinki 14.4% 50.1% 0.9OsakevarmaOy Helsinki 100.0% 100.0% 3.3
4.3
Housing associations and real estate companies 935.2
Shares and participations in associates
31Dec.2007 Domicile Shares, % Votes, % Book value€ million
NVKiinteistösijoitusOy Helsinki 45.0% 45.0% 0.0SatoCorporation Helsinki 39.5% 39.5% 90.5SiltaOy Helsinki 39.1% 39.1% 1.3GarantiaInsuranceCompanyLtd Helsinki 30.5% 30.5% 14.4
106.2
Housing associations and real estate companies 25.4
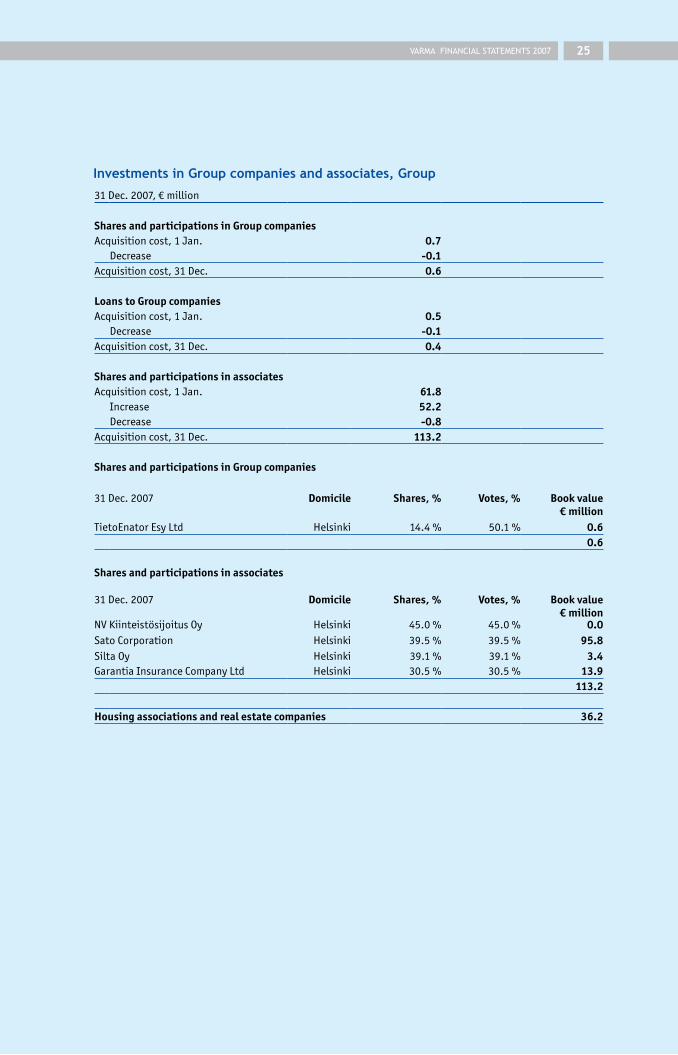
VARMA FINANCIAL STATEMENTS 2007 2�
Investments in Group companies and associates, Group
31Dec.2007,€million
Shares and participations in Group companiesAcquisitioncost,1Jan. 0.7
Decrease -0.1Acquisitioncost,31Dec. 0.6
Loans to Group companies Acquisitioncost,1Jan. 0.5
Decrease -0.1Acquisitioncost,31Dec. 0.4
Shares and participations in associates Acquisitioncost,1Jan. 61.8
Increase 52.2Decrease -0.8
Acquisitioncost,31Dec. 113.2
Shares and participations in Group companies
31Dec.2007 Domicile Shares, % Votes, % Book value€ million
TietoEnatorEsyLtd Helsinki 14.4% 50.1% 0.60.6
Shares and participations in associates
31Dec.2007 Domicile Shares, % Votes, % Book value€ million
NVKiinteistösijoitusOy Helsinki 45.0% 45.0% 0.0SatoCorporation Helsinki 39.5% 39.5% 95.8SiltaOy Helsinki 39.1% 39.1% 3.4GarantiaInsuranceCompanyLtd Helsinki 30.5% 30.5% 13.9
113.2
Housing associations and real estate companies 36.2

VARMA FINANCIAL STATEMENTS 20072�
Changes in investments in real estate
Notes to the balance sheet Notes to the financial statements
Loans to Group
companies
Real estate and real estate
shares
Loans to Group
companies
Real estate and real estate
shares
PARENTCOMPANY GROUP
31Dec.2007,€million
Acquisitioncost,1Jan. 1,780.2 630.1 2,764.0 0.0Increase 150.6 245.2 376.6 1.8Decrease -126.7 -43.8 -117.8
Acquisitioncost,31Dec. 1,804.2 831.5 3,022.8 1.8
Accumulateddepreciation,1Jan. -107.2 -568.1Accumulateddepreciationfromitemssold 2.4 13.3Depreciationforthefinancialyear -17.9 -62.8
Accumulateddepreciation,31Dec. -122.7 -617.7
Impairments,1Jan. -129.2 -93.4Impairmentsforthefinancialyear -18.4 -16.2Impairmentsonitemssold 6.0 1.8
Impairments,31Dec. -141.6 -107.8
Revaluations,1Jan. 16.6 16.6Revaluations,31Dec. 16.6 16.6
Bookvalue,31Dec. 1,556.5 831.5 2,313.9 1.8
Real estate in own use
31Dec.2007,€million PARENTCOMPANY GROUP
Remainingacquisitioncost 51.5 46.0Bookvalue 51.5 46.0Fairvalue 65.5 53.6
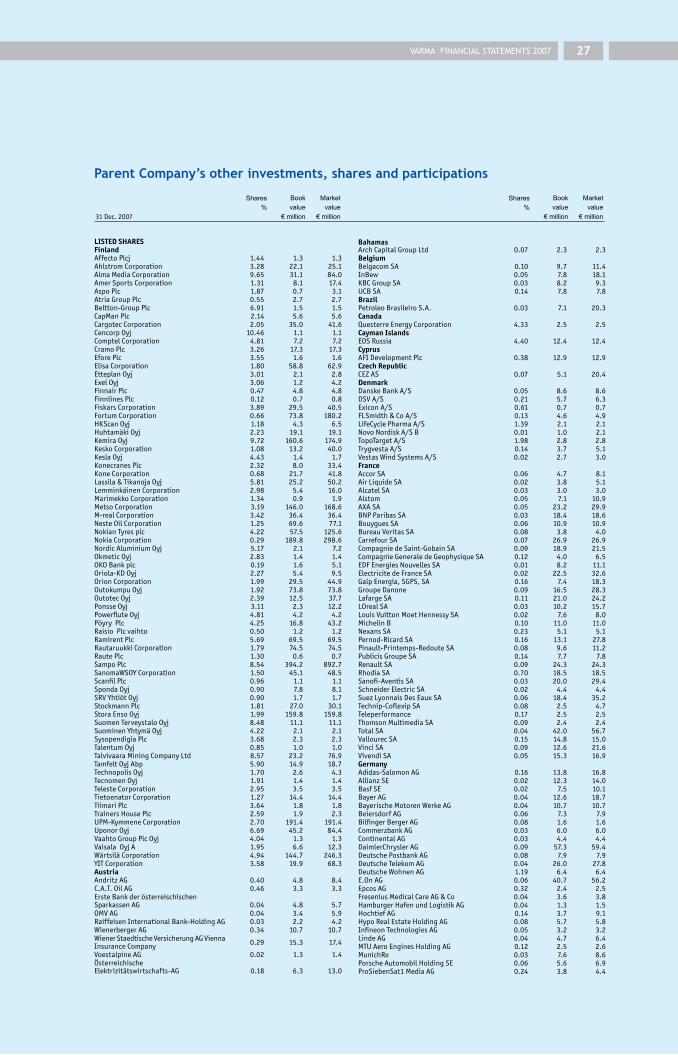
VARMA FINANCIAL STATEMENTS 2007 27
Parent Company’s other investments, shares and participations
Shares%
Book value
€ million
Market value
€ million31Dec.2007
Shares%
Book value
€ million
Market value
€ million
LISTED SHARESFinlandAffectoPlcj 1.44 1.3 1.3AhlstromCorporation 3.28 22.1 25.1AlmaMediaCorporation 9.65 31.1 84.0AmerSportsCorporation 1.31 8.1 17.4AspoPlc 1.87 0.7 3.1AtriaGroupPlc 0.55 2.7 2.7Beltton-GroupPlc 6.91 1.5 1.5CapManPlc 2.14 5.6 5.6CargotecCorporation 2.05 35.0 41.6CencorpOyj 10.46 1.1 1.1ComptelCorporation 4.81 7.2 7.2CramoPlc 3.26 17.3 17.3EforePlc 3.55 1.6 1.6ElisaCorporation 1.80 58.8 62.9EtteplanOyj 3.01 2.1 2.8ExelOyj 3.06 1.2 4.2FinnairPlc 0.47 4.8 4.8FinnlinesPlc 0.12 0.7 0.8FiskarsCorporation 3.89 29.5 40.5FortumCorporation 0.66 73.8 180.2HKScanOyj 1.18 4.3 6.5HuhtamäkiOyj 2.23 19.1 19.1KemiraOyj 9.72 160.6 174.9KeskoCorporation 1.08 13.2 40.0KeslaOyj 4.43 1.4 1.7KonecranesPlc 2.32 8.0 33.4KoneCorporation 0.68 21.7 41.8Lassila&TikanojaOyj 5.81 25.2 50.2LemminkäinenCorporation 2.98 5.4 16.0MarimekkoCorporation 1.34 0.9 1.9MetsoCorporation 3.19 146.0 168.6M-realCorporation 3.42 36.4 36.4NesteOilCorporation 1.25 69.6 77.1NokianTyresplc 4.22 57.5 125.6NokiaCorporation 0.29 189.8 298.6NordicAluminiumOyj 5.17 2.1 7.2OkmeticOyj 2.83 1.4 1.4OKOBankplc 0.19 1.6 5.1Oriola-KDOyj 2.27 5.4 9.5OrionCorporation 1.99 29.5 44.9OutokumpuOyj 1.92 73.8 73.8OutotecOyj 2.39 12.5 37.7PonsseOyj 3.11 2.3 12.2PowerfluteOyj 4.81 4.2 4.2PöyryPlc 4.25 16.8 43.2RaisioPlcvaihto 0.50 1.2 1.2RamirentPlc 5.69 69.5 69.5RautaruukkiCorporation 1.79 74.5 74.5RautePlc 1.30 0.6 0.7SampoPlc 8.54 394.2 892.7SanomaWSOYCorporation 1.50 45.1 48.5ScanfilPlc 0.96 1.1 1.1SpondaOyj 0.90 7.8 8.1SRVYhtiötOyj 0.90 1.7 1.7StockmannPlc 1.81 27.0 30.1StoraEnsoOyj 1.99 159.8 159.8SuomenTerveystaloOyj 8.48 11.1 11.1SuominenYhtymäOyj 4.22 2.1 2.1SysopendigiaPlc 3.68 2.3 2.3TalentumOyj 0.85 1.0 1.0TalvivaaraMiningCompanyLtd 8.57 23.2 76.9TamfeltOyjAbp 5.90 14.9 18.7TechnopolisOyj 1.70 2.6 4.3TecnomenOyj 1.91 1.4 1.4TelesteCorporation 2.95 3.5 3.5TietoenatorCorporation 1.27 14.4 14.4TiimariPlc 3.64 1.8 1.8TrainersHousePlc 2.59 1.9 2.3UPM-KymmeneCorporation 2.70 191.4 191.4UponorOyj 6.69 45.2 84.4VaahtoGroupPlcOyj 4.04 1.3 1.3VaisalaOyjA 1.95 6.6 12.3WärtsiläCorporation 4.94 144.7 246.3YITCorporation 3.58 19.9 68.3AustriaAndritzAG 0.40 4.8 8.4C.A.T.OilAG 0.46 3.3 3.3ErsteBankderösterreischischenSparkassenAG 0.04 4.8 5.7OMVAG 0.04 3.4 5.9RaiffeisenInternationalBank-HoldingAG 0.03 2.2 4.2WienerbergerAG 0.34 10.7 10.7WienerStaedtischeVersicherungAGViennaInsuranceCompany 0.29 15.3 17.4
VoestalpineAG 0.02 1.3 1.4ÖsterreichischeElektrizitätswirtschafts-AG 0.18 6.3 13.0
BahamasArchCapitalGroupLtd 0.07 2.3 2.3BelgiumBelgacomSA 0.10 9.7 11.4InBew 0.05 7.8 18.1KBCGroupSA 0.03 8.2 9.3UCBSA 0.14 7.8 7.8BrazilPetroleoBrasileiroS.A. 0.03 7.1 20.3CanadaQuesterreEnergyCorporation 4.33 2.5 2.5Cayman IslandsEOSRussia 4.40 12.4 12.4CyprusAFIDevelopmentPlc 0.38 12.9 12.9Czech RepublicCEZAS 0.07 5.1 20.4DenmarkDanskeBankA/S 0.05 8.6 8.6DSVA/S 0.21 5.7 6.3ExiconA/S 0.61 0.7 0.7FLSmidth&CoA/S 0.13 4.6 4.9LifeCyclePharmaA/S 1.39 2.1 2.1NovoNordiskA/SB 0.01 1.0 2.1TopoTargetA/S 1.98 2.8 2.8TrygvestaA/S 0.14 3.7 5.1VestasWindSystemsA/S 0.02 2.7 3.0FranceAccorSA 0.06 4.7 8.1AirLiquideSA 0.02 3.8 5.1AlcatelSA 0.03 3.0 3.0Alstom 0.05 7.1 10.9AXASA 0.05 23.2 29.9BNPParibasSA 0.03 18.4 18.6BouyguesSA 0.06 10.9 10.9BureauVeritasSA 0.08 3.8 4.0CarrefourSA 0.07 26.9 26.9CompagniedeSaint-GobainSA 0.09 18.9 21.5CompagnieGeneraledeGeophysiqueSA 0.12 4.0 6.5EDFEnergiesNouvellesSA 0.01 8.2 11.1ElectricitedeFranceSA 0.02 22.5 32.6GalpEnergia,SGPS,SA 0.16 7.4 18.3GroupeDanone 0.09 16.5 28.3LafargeSA 0.11 21.0 24.2LOrealSA 0.03 10.2 15.7LouisVuittonMoetHennessySA 0.02 7.6 8.0MichelinB 0.10 11.0 11.0NexansSA 0.23 5.1 5.1Pernod-RicardSA 0.16 13.1 27.8Pinault-Printemps-RedouteSA 0.08 9.6 11.2PublicisGroupeSA 0.14 7.7 7.8RenaultSA 0.09 24.3 24.3RhodiaSA 0.70 18.5 18.5Sanofi-AventisSA 0.03 20.0 29.4SchneiderElectricSA 0.02 4.4 4.4SuezLyonnaisDesEauxSA 0.06 18.4 35.2Technip-CoflexipSA 0.08 2.5 4.7Teleperformance 0.17 2.5 2.5ThomsonMultimediaSA 0.09 2.4 2.4TotalSA 0.04 42.0 56.7VallourecSA 0.15 14.8 15.0VinciSA 0.09 12.6 21.6VivendiSA 0.05 15.3 16.9GermanyAdidas-SalomonAG 0.16 13.8 16.8AllianzSE 0.02 12.3 14.0BasfSE 0.02 7.5 10.1BayerAG 0.04 12.6 18.7BayerischeMotorenWerkeAG 0.04 10.7 10.7BeiersdorfAG 0.06 7.3 7.9BilfingerBergerAG 0.08 1.6 1.6CommerzbankAG 0.03 6.0 6.0ContinentalAG 0.03 4.4 4.4DaimlerChryslerAG 0.09 57.3 59.4DeutschePostbankAG 0.08 7.9 7.9DeutscheTelekomAG 0.04 26.0 27.8DeutscheWohnenAG 1.19 6.4 6.4E.OnAG 0.06 40.7 56.2EpcosAG 0.32 2.4 2.5FreseniusMedicalCareAG&Co 0.04 3.6 3.8HamburgerHafenundLogistikAG 0.04 1.3 1.5HochtiefAG 0.14 3.7 9.1HypoRealEstateHoldingAG 0.08 5.7 5.8InfineonTechnologiesAG 0.05 3.2 3.2LindeAG 0.04 4.7 6.4MTUAeroEnginesHoldingAG 0.12 2.5 2.6MunichRe 0.03 7.6 8.6PorscheAutomobilHoldingSE 0.06 5.6 6.9ProSiebenSat1MediaAG 0.24 3.8 4.4
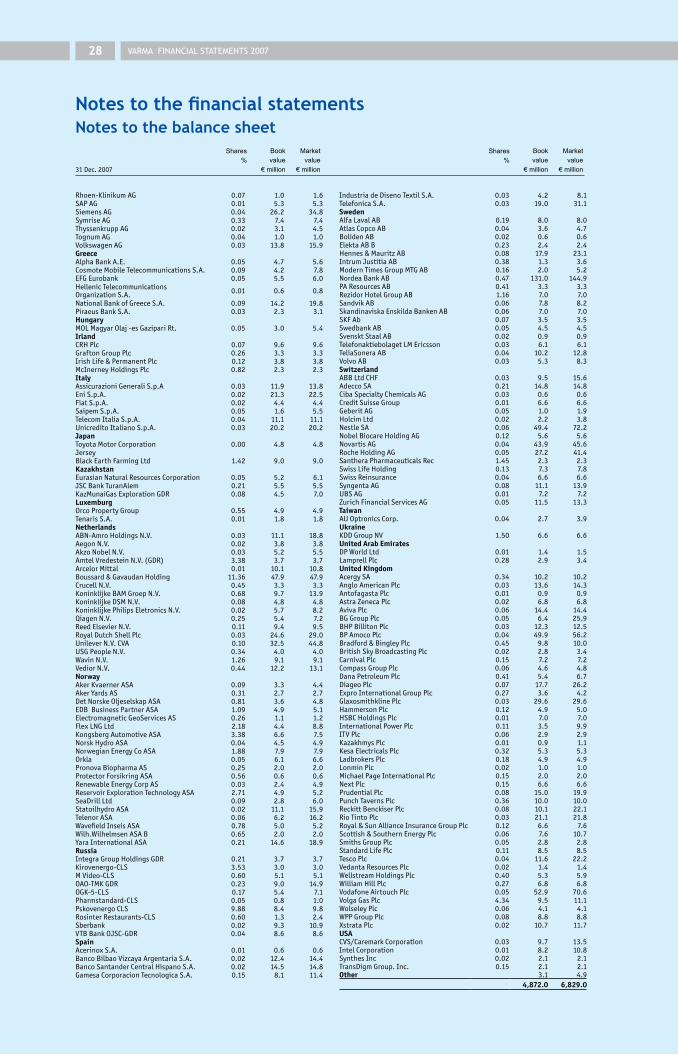
VARMA FINANCIAL STATEMENTS 20072�
Notes to the balance sheet Notes to the financial statements
Shares%
Book value
€ million
Market value
€ million31Dec.2007
Shares%
Book value
€ million
Market value
€ million
Rhoen-KlinikumAG 0.07 1.0 1.6SAPAG 0.01 5.3 5.3SiemensAG 0.04 26.2 34.8SymriseAG 0.33 7.4 7.4ThyssenkruppAG 0.02 3.1 4.5TognumAG 0.04 1.0 1.0VolkswagenAG 0.03 13.8 15.9GreeceAlphaBankA.E. 0.05 4.7 5.6CosmoteMobileTelecommunicationsS.A. 0.09 4.2 7.8EFGEurobank 0.05 5.5 6.0HellenicTelecommunicationsOrganizationS.A. 0.01 0.6 0.8
NationalBankofGreeceS.A. 0.09 14.2 19.8PiraeusBankS.A. 0.03 2.3 3.1HungaryMOLMagyarOlaj-esGazipariRt. 0.05 3.0 5.4IrlandCRHPlc 0.07 9.6 9.6GraftonGroupPlc 0.26 3.3 3.3IrishLife&PermanentPlc 0.12 3.8 3.8McInerneyHoldingsPlc 0.82 2.3 2.3ItalyAssicurazioniGeneraliS.p.A 0.03 11.9 13.8EniS.p.A. 0.02 21.3 22.5FiatS.p.A. 0.02 4.4 4.4SaipemS.p.A. 0.05 1.6 5.5TelecomItaliaS.p.A. 0.04 11.1 11.1UnicreditoItalianoS.p.A. 0.03 20.2 20.2JapanToyotaMotorCorporation 0.00 4.8 4.8JerseyBlackEarthFarmingLtd 1.42 9.0 9.0KazakhstanEurasianNaturalResourcesCorporation 0.05 5.2 6.1JSCBankTuranAlem 0.21 5.5 5.5KazMunaiGasExplorationGDR 0.08 4.5 7.0LuxemburgOrcoPropertyGroup 0.55 4.9 4.9TenarisS.A. 0.01 1.8 1.8NetherlandsABN-AmroHoldingsN.V. 0.03 11.1 18.8AegonN.V. 0.02 3.8 3.8AkzoNobelN.V. 0.03 5.2 5.5AmtelVredesteinN.V.(GDR) 3.38 3.7 3.7ArcelorMittal 0.01 10.1 10.8Boussard&GavaudanHolding 11.36 47.9 47.9CrucellN.V. 0.45 3.3 3.3KoninklijkeBAMGroepN.V. 0.68 9.7 13.9KoninklijkeDSMN.V. 0.08 4.8 4.8KoninklijkePhilipsEletronicsN.V. 0.02 5.7 8.2QiagenN.V. 0.25 5.4 7.2ReedElsevierN.V. 0.11 9.4 9.5RoyalDutchShellPlc 0.03 24.6 29.0UnileverN.V.CVA 0.10 32.5 44.8USGPeopleN.V. 0.34 4.0 4.0WavinN.V. 1.26 9.1 9.1VediorN.V. 0.44 12.2 13.1NorwayAkerKvaernerASA 0.09 3.3 4.4AkerYardsAS 0.31 2.7 2.7DetNorskeOljeselskapASA 0.81 3.6 4.8EDBBusinessPartnerASA 1.09 4.9 5.1ElectromagneticGeoServicesAS 0.26 1.1 1.2FlexLNGLtd 2.18 4.4 8.8KongsbergAutomotiveASA 3.38 6.6 7.5NorskHydroASA 0.04 4.5 4.9NorwegianEnergyCoASA 1.88 7.9 7.9Orkla 0.05 6.1 6.6PronovaBiopharmaAS 0.25 2.0 2.0ProtectorForsikringASA 0.56 0.6 0.6RenewableEnergyCorpAS 0.03 2.4 4.9ReservoirExplorationTechnologyASA 2.71 4.9 5.2SeaDrillLtd 0.09 2.8 6.0StatoilhydroASA 0.02 11.1 15.9TelenorASA 0.06 6.2 16.2WavefieldInseisASA 0.78 5.0 5.2Wilh.WilhelmsenASAB 0.65 2.0 2.0YaraInternationalASA 0.21 14.6 18.9RussiaIntegraGroupHoldingsGDR 0.21 3.7 3.7Kirovenergo-CLS 3.53 3.0 3.0MVideo-CLS 0.60 5.1 5.1OAO-TMKGDR 0.23 9.0 14.9OGK-5-CLS 0.17 5.4 7.1Pharmstandard-CLS 0.05 0.8 1.0PskovenergoCLS 9.88 8.4 9.8RosinterRestaurants-CLS 0.60 1.3 2.4Sberbank 0.02 9.3 10.9VTBBankOJSC-GDR 0.04 8.6 8.6SpainAcerinoxS.A. 0.01 0.6 0.6BancoBilbaoVizcayaArgentariaS.A. 0.02 12.4 14.4BancoSantanderCentralHispanoS.A. 0.02 14.5 14.8GamesaCorporacionTecnologicaS.A. 0.15 8.1 11.4
IndustriadeDisenoTextilS.A. 0.03 4.2 8.1TelefonicaS.A. 0.03 19.0 31.1SwedenAlfaLavalAB 0.19 8.0 8.0AtlasCopcoAB 0.04 3.6 4.7BolidenAB 0.02 0.6 0.6ElektaABB 0.23 2.4 2.4Hennes&MauritzAB 0.08 17.9 23.1IntrumJustitiaAB 0.38 1.3 3.6ModernTimesGroupMTGAB 0.16 2.0 5.2NordeaBankAB 0.47 131.0 144.9PAResourcesAB 0.41 3.3 3.3RezidorHotelGroupAB 1.16 7.0 7.0SandvikAB 0.06 7.8 8.2SkandinaviskaEnskildaBankenAB 0.06 7.0 7.0SKFAb 0.07 3.5 3.5SwedbankAB 0.05 4.5 4.5SvensktStaalAB 0.02 0.9 0.9TelefonaktiebolagetLMEricsson 0.03 6.1 6.1TeliaSoneraAB 0.04 10.2 12.8VolvoAB 0.03 5.3 8.3SwitzerlandABBLtdCHF 0.03 9.5 15.6AdeccoSA 0.21 14.8 14.8CibaSpecialtyChemicalsAG 0.03 0.6 0.6CreditSuisseGroup 0.01 6.6 6.6GeberitAG 0.05 1.0 1.9HolcimLtd 0.02 2.2 3.8NestleSA 0.06 49.4 72.2NobelBiocareHoldingAG 0.12 5.6 5.6NovartisAG 0.04 43.9 45.6RocheHoldingAG 0.05 27.2 41.4SantheraPharmaceuticalsRec 1.45 2.3 2.3SwissLifeHolding 0.13 7.3 7.8SwissReinsurance 0.04 6.6 6.6SyngentaAG 0.08 11.1 13.9UBSAG 0.01 7.2 7.2ZurichFinancialServicesAG 0.05 11.5 13.3TaiwanAUOptronicsCorp. 0.04 2.7 3.9UkraineKDDGroupNV 1.50 6.6 6.6United Arab EmiratesDPWorldLtd 0.01 1.4 1.5LamprellPlc 0.28 2.9 3.4United KingdomAcergySA 0.34 10.2 10.2AngloAmericanPlc 0.03 13.6 14.3AntofagastaPlc 0.01 0.9 0.9AstraZenecaPlc 0.02 6.8 6.8AvivaPlc 0.06 14.4 14.4BGGroupPlc 0.05 6.4 25.9BHPBillitonPlc 0.03 12.3 12.5BPAmocoPlc 0.04 49.9 56.2Bradford&BingleyPlc 0.45 9.8 10.0BritishSkyBroadcastingPlc 0.02 2.8 3.4CarnivalPlc 0.15 7.2 7.2CompassGroupPlc 0.06 4.6 4.8DanaPetroleumPlc 0.41 5.4 6.7DiageoPlc 0.07 17.7 26.2ExproInternationalGroupPlc 0.27 3.6 4.2GlaxosmithklinePlc 0.03 29.6 29.6HammersonPlc 0.12 4.9 5.0HSBCHoldingsPlc 0.01 7.0 7.0InternationalPowerPlc 0.11 3.5 9.9ITVPlc 0.06 2.9 2.9KazakhmysPlc 0.01 0.9 1.1KesaElectricalsPlc 0.32 5.3 5.3LadbrokersPlc 0.18 4.9 4.9LonminPlc 0.02 1.0 1.0MichaelPageInternationalPlc 0.15 2.0 2.0NextPlc 0.15 6.6 6.6PrudentialPlc 0.08 15.0 19.9PunchTavernsPlc 0.36 10.0 10.0ReckittBenckiserPlc 0.08 10.1 22.1RioTintoPlc 0.03 21.1 21.8Royal&SunAllianceInsuranceGroupPlc 0.12 6.6 7.6Scottish&SouthernEnergyPlc 0.06 7.6 10.7SmithsGroupPlc 0.05 2.8 2.8StandardLifePlc 0.11 8.5 8.5TescoPlc 0.04 11.6 22.2VedantaResourcesPlc 0.02 1.4 1.4WellstreamHoldingsPlc 0.40 5.3 5.9WilliamHillPlc 0.27 6.8 6.8VodafoneAirtouchPlc 0.05 52.9 70.6VolgaGasPlc 4.34 9.5 11.1WolseleyPlc 0.06 4.1 4.1WPPGroupPlc 0.08 8.8 8.8XstrataPlc 0.02 10.7 11.7USACVS/CaremarkCorporation 0.03 9.7 13.5IntelCorporation 0.01 8.2 10.8SynthesInc 0.02 2.1 2.1TransDigmGroup.Inc. 0.15 2.1 2.1Other 3.1 4.9 4,872.0 6,829.0
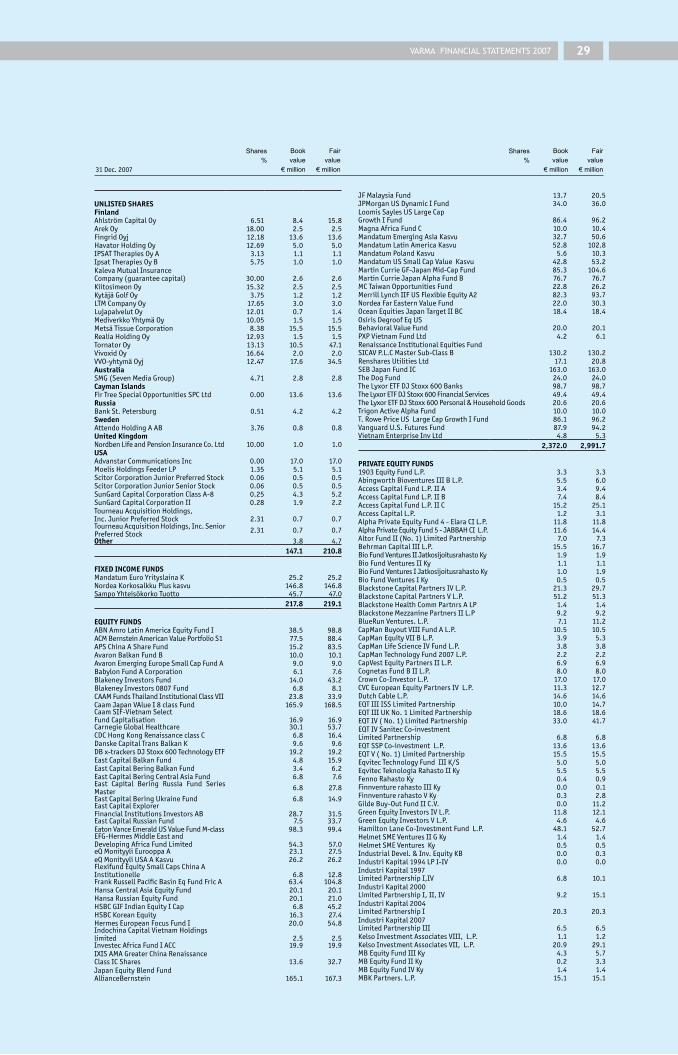
VARMA FINANCIAL STATEMENTS 2007 2�
Shares%
Book value
€ million
Fair value
€ million31Dec.2007
Shares%
Book value
€ million
Fair value
€ million
UNLISTED SHARESFinlandAhlströmCapitalOy 6.51 8.4 15.8ArekOy 18.00 2.5 2.5FingridOyj 12.18 13.6 13.6HavatorHoldingOy 12.69 5.0 5.0IPSATTherapiesOyA 3.13 1.1 1.1IpsatTherapiesOyB 5.75 1.0 1.0KalevaMutualInsuranceCompany(guaranteecapital) 30.00 2.6 2.6KiitosimeonOy 15.32 2.5 2.5KytäjäGolfOy 3.75 1.2 1.2LTMCompanyOy 17.65 3.0 3.0LujapalvelutOy 12.01 0.7 1.4MediverkkoYhtymäOy 10.05 1.5 1.5MetsäTissueCorporation 8.38 15.5 15.5RealiaHoldingOy 12.93 1.5 1.5TornatorOy 13.13 10.5 47.1VivoxidOy 16.64 2.0 2.0VVO-yhtymäOyj 12.47 17.6 34.5AustraliaSMG(SevenMediaGroup) 4.71 2.8 2.8Cayman IslandsFirTreeSpecialOpportunitiesSPCLtd 0.00 13.6 13.6RussiaBankSt.Petersburg 0.51 4.2 4.2SwedenAttendoHoldingAAB 3.76 0.8 0.8United KingdomNordbenLifeandPensionInsuranceCo.Ltd 10.00 1.0 1.0USAAdvanstarCommunicationsInc 0.00 17.0 17.0MoelisHoldingsFeederLP 1.35 5.1 5.1ScitorCorporationJuniorPreferredStock 0.06 0.5 0.5ScitorCorporationJuniorSeniorStock 0.06 0.5 0.5SunGardCapitalCorporationClassA-8 0.25 4.3 5.2SunGardCapitalCorporationII 0.28 1.9 2.2TourneauAcquisitionHoldings,Inc.JuniorPreferredStock 2.31 0.7 0.7TourneauAcquisitionHoldings,Inc.SeniorPreferredStock 2.31 0.7 0.7
Other 3.8 4.7 147.1 210.8
FIXED INCOME FUNDSMandatumEuroYrityslainaK 25.2 25.2NordeaKorkosalkkuPluskasvu 146.8 146.8SampoYhteisökorkoTuotto 45.7 47.0 217.8 219.1
EQUITY FUNDSABNAmroLatinAmericaEquityFundI 38.5 98.8ACMBernsteinAmericanValuePortfolioS1 77.5 88.4APSChinaAShareFund 15.2 83.5AvaronBalkanFundB 10.0 10.1AvaronEmergingEuropeSmallCapFundA 9.0 9.0BabylonFundACorporation 6.1 7.6BlakeneyInvestorsFund 14.0 43.2BlakeneyInvestors0807Fund 6.8 8.1CAAMFundsThailandInstitutionalClassVII 23.8 33.9CaamJapanVAlueI8classFund 165.9 168.5CaamSIF-VietnamSelectFundCapitalisation 16.9 16.9CarnegieGlobalHealthcare 30.1 53.7CDCHongKongRenaissanceclassC 6.8 16.4DanskeCapitalTransBalkanK 9.6 9.6DBx-trackersDJStoxx600TechnologyETF 19.2 19.2EastCapitalBalkanFund 4.8 15.9EastCapitalBeringBalkanFund 3.4 6.2EastCapitalBeringCentralAsiaFund 6.8 7.6East Capital Bering Russia Fund SeriesMaster 6.8 27.8
EastCapitalBeringUkraineFund 6.8 14.9EastCapitalExplorerFinancialInstitutionsInvestorsAB 28.7 31.5EastCapitalRussianFund 7.5 33.7EatonVanceEmeraldUSValueFundM-class 98.3 99.4EFG-HermesMiddleEastandDevelopingAfricaFundLimited 54.3 57.0eQMonityyliEurooppaA 23.1 27.5eQMonityyliUSAAKasvu 26.2 26.2FlexifundEquitySmallCapsChinaAInstitutionelle 6.8 12.8FrankRussellPacificBasinEqFundFricA 63.4 104.8HansaCentralAsiaEquityFund 20.1 20.1HansaRussianEquityFund 20.1 21.0HSBCGIFIndianEquityICap 6.8 45.2HSBCKoreanEquity 16.3 27.4HermesEuropeanFocusFundI 20.0 54.8IndochinaCapitalVietnamHoldingslimited 2.5 2.5InvestecAfricaFundIACC 19.9 19.9IXISAMAGreaterChinaRenaissanceClassICShares 13.6 32.7JapanEquityBlendFundAllianceBernstein 165.1 167.3
JFMalaysiaFund 13.7 20.5JPMorganUSDynamicIFund 34.0 36.0LoomisSaylesUSLargeCapGrowthIFund 86.4 96.2MagnaAfricaFundC 10.0 10.4MandatumEmergingAsiaKasvu 32.7 50.6MandatumLatinAmericaKasvu 52.8 102.8MandatumPolandKasvu 5.6 10.3MandatumUSSmallCapValueKasvu 42.8 53.2MartinCurrieGF-JapanMid-CapFund 85.3 104.6MartinCurrieJapanAlphaFundB 76.7 76.7MCTaiwanOpportunitiesFund 22.8 26.2MerrillLynchIIFUSFlexibleEquityA2 82.3 93.7NordeaFarEasternValueFund 22.0 30.3OceanEquitiesJapanTargetIIBC 18.4 18.4OsirisDegroofEqUSBehavioralValueFund 20.0 20.1PXPVietnamFundLtd 4.2 6.1RenaissanceInstitutionalEquitiesFundSICAVP.L.CMasterSub-ClassB 130.2 130.2RensharesUtilitiesLtd 17.1 20.8SEBJapanFundIC 163.0 163.0TheDogFund 24.0 24.0TheLyxorETFDJStoxx600Banks 98.7 98.7TheLyxorETFDJStoxx600FinancialServices 49.4 49.4TheLyxorETFDJStoxx600Personal&HouseholdGoods 20.6 20.6TrigonActiveAlphaFund 10.0 10.0T.RowePriceUSLargeCapGrowthIFund 86.1 96.2VanguardU.S.FuturesFund 87.9 94.2VietnamEnterpriseInvLtd 4.8 5.3 2,372.0 2,991.7
PRIVATE EQUITY FUNDS1903EquityFundL.P. 3.3 3.3AbingworthBioventuresIIIBL.P. 5.5 6.0AccessCapitalFundL.P.IIA 3.4 9.4AccessCapitalFundL.P.IIB 7.4 8.4AccessCapitalFundL.P.IIC 15.2 25.1AccessCapitalL.P. 1.2 3.1AlphaPrivateEquityFund4-ElaraCIL.P. 11.8 11.8AlphaPrivateEquityFund5-JABBAHCIL.P. 11.6 14.4AltorFundII(No.1)LimitedPartnership 7.0 7.3BehrmanCapitalIIIL.P. 15.5 16.7BioFundVenturesIIJatkosijoitusrahastoKy 1.9 1.9BioFundVenturesIIKy 1.1 1.1BioFundVenturesIJatkosijoitusrahastoKy 1.0 1.9BioFundVenturesIKy 0.5 0.5BlackstoneCapitalPartnersIVL.P. 21.3 29.7BlackstoneCapitalPartnersVL.P. 51.2 51.3BlackstoneHealthCommPartnrsALP 1.4 1.4BlackstoneMezzaninePartnersIIL.P 9.2 9.2BlueRunVentures.L.P. 7.1 11.2CapManBuyoutVIIIFundAL.P. 10.5 10.5CapManEquityVIIBL.P. 3.9 5.3CapManLifeScienceIVFundL.P. 3.8 3.8CapManTechnologyFund2007L.P. 2.2 2.2CapVestEquityPartnersIIL.P. 6.9 6.9CognetasFundBIIL.P. 8.0 8.0CrownCo-InvestorL.P. 17.0 17.0CVCEuropeanEquityPartnersIVL.P. 11.3 12.7DutchCableL.P. 14.6 14.6EQTIIIISSLimitedPartnership 10.0 14.7EQTIIIUKNo.1LimitedPartnership 18.6 18.6EQTIV(No.1)LimitedPartnership 33.0 41.7EQTIVSanitecCo-investmentLimitedPartnership 6.8 6.8EQTSSPCo-investmentL.P. 13.6 13.6EQTV(No.1)LimitedPartnership 15.5 15.5EqvitecTechnologyFundIIIK/S 5.0 5.0EqvitecTeknologiaRahastoIIKy 5.5 5.5FennoRahastoKy 0.4 0.9FinnventurerahastoIIIKy 0.0 0.1FinnventurerahastoVKy 0.3 2.8GildeBuy-OutFundIIC.V. 0.0 11.2GreenEquityInvestorsIVL.P. 11.8 12.1GreenEquityInvestorsVL.P. 4.6 4.6HamiltonLaneCo-InvestmentFundL.P. 48.1 52.7HelmetSMEVenturesIIGKy 1.4 1.4HelmetSMEVenturesKy 0.5 0.5IndustrialDevel.&Inv.EquityKB 0.0 0.3IndustriKapital1994LPI-IV 0.0 0.0IndustriKapital1997LimitedPartnershipI,IV 6.8 10.1IndustriKapital2000LimitedPartnershipI,II,IV 9.2 15.1IndustriKapital2004LimitedPartnershipI 20.3 20.3IndustriKapital2007LimitedPartnershipIII 6.5 6.5KelsoInvestmentAssociatesVIII,L.P. 1.1 1.2KelsoInvestmentAssociatesVII,L.P. 20.9 29.1MBEquityFundIIIKy 4.3 5.7MBEquityFundIIKy 0.2 3.3MBEquityFundIVKy 1.4 1.4MBKPartners.L.P. 15.1 15.1
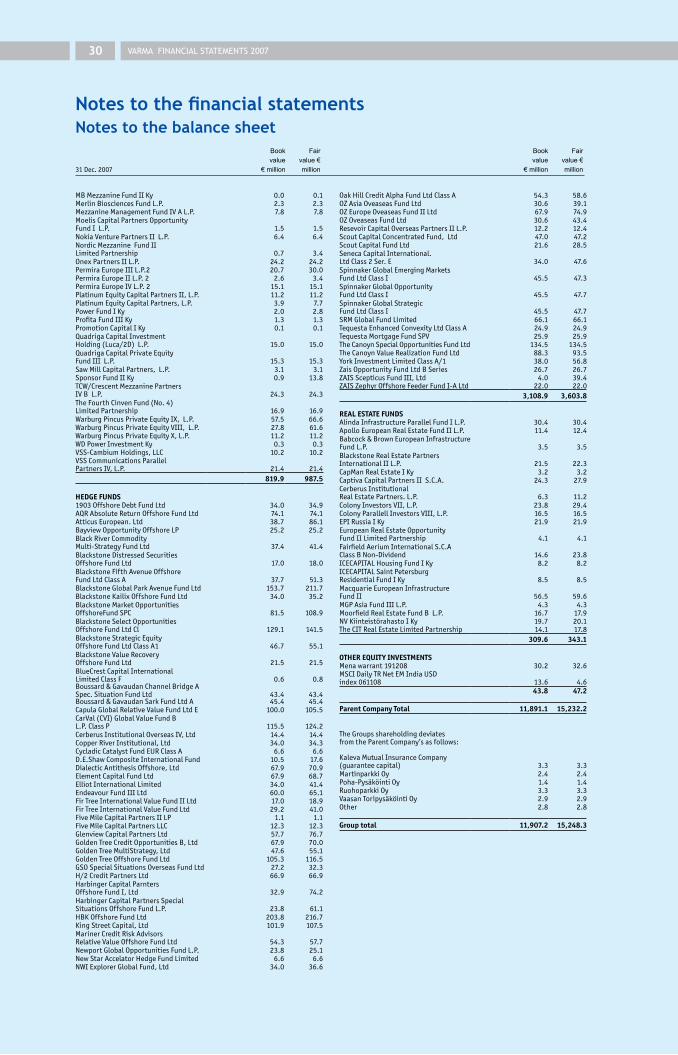
VARMA FINANCIAL STATEMENTS 2007�0
Notes to the balance sheet Notes to the financial statements
Book value
€ million
Fair value € million31Dec.2007
Book value
€ million
Fair value € million
MBMezzanineFundIIKy 0.0 0.1MerlinBiosciencesFundL.P. 2.3 2.3MezzanineManagementFundIVAL.P. 7.8 7.8MoelisCapitalPartnersOpportunityFundIL.P. 1.5 1.5NokiaVenturePartnersIIL.P. 6.4 6.4NordicMezzanineFundIILimitedPartnership 0.7 3.4OnexPartnersIIL.P. 24.2 24.2PermiraEuropeIIIL.P.2 20.7 30.0PermiraEuropeIIL.P.2 2.6 3.4PermiraEuropeIVL.P.2 15.1 15.1PlatinumEquityCapitalPartnersII,L.P. 11.2 11.2PlatinumEquityCapitalPartners,L.P. 3.9 7.7PowerFundIKy 2.0 2.8ProfitaFundIIIKy 1.3 1.3PromotionCapitalIKy 0.1 0.1QuadrigaCapitalInvestmentHolding(Luca/2D)L.P. 15.0 15.0QuadrigaCapitalPrivateEquityFundIIIL.P. 15.3 15.3SawMillCapitalPartners,L.P. 3.1 3.1SponsorFundIIKy 0.9 13.8TCW/CrescentMezzaninePartnersIVBL.P. 24.3 24.3TheFourthCinvenFund(No.4)LimitedPartnership 16.9 16.9WarburgPincusPrivateEquityIX,L.P. 57.5 66.6WarburgPincusPrivateEquityVIII,L.P. 27.8 61.6WarburgPincusPrivateEquityX,L.P. 11.2 11.2WDPowerInvestmentKy 0.3 0.3VSS-CambiumHoldings,LLC 10.2 10.2VSSCommunicationsParallelPartnersIV,L.P. 21.4 21.4 819.9 987.5
HEDGE FUNDS1903OffshoreDebtFundLtd 34.0 34.9AQRAbsoluteReturnOffshoreFundLtd 74.1 74.1AtticusEuropean.Ltd 38.7 86.1BayviewOpportunityOffshoreLP 25.2 25.2BlackRiverCommodityMulti-StrategyFundLtd 37.4 41.4BlackstoneDistressedSecuritiesOffshoreFundLtd 17.0 18.0BlackstoneFifthAvenueOffshoreFundLtdClassA 37.7 51.3BlackstoneGlobalParkAvenueFundLtd 153.7 211.7BlackstoneKailixOffshoreFundLtd 34.0 35.2BlackstoneMarketOpportunitiesOffshoreFundSPC 81.5 108.9BlackstoneSelectOpportunitiesOffshoreFundLtdCl 129.1 141.5BlackstoneStrategicEquityOffshoreFundLtdClassA1 46.7 55.1BlackstoneValueRecoveryOffshoreFundLtd 21.5 21.5BlueCrestCapitalInternationalLimitedClassF 0.6 0.8Boussard&GavaudanChannelBridgeASpec.SituationFundLtd 43.4 43.4Boussard&GavaudanSarkFundLtdA 45.4 45.4CapulaGlobalRelativeValueFundLtdE 100.0 105.5CarVal(CVI)GlobalValueFundBL.P.ClassP 115.5 124.2CerberusInstitutionalOverseasIV,Ltd 14.4 14.4CopperRiverInstitutional,Ltd 34.0 34.3CycladicCatalystFundEURClassA 6.6 6.6D.E.ShawCompositeInternationalFund 10.5 17.6DialecticAntithesisOffshore,Ltd 67.9 70.9ElementCapitalFundLtd 67.9 68.7ElliotInternationalLimited 34.0 41.4EndeavourFundIIILtd 60.0 65.1FirTreeInternationalValueFundIILtd 17.0 18.9FirTreeInternationalValueFundLtd 29.2 41.0FiveMileCapitalPartnersIILP 1.1 1.1FiveMileCapitalPartnersLLC 12.3 12.3GlenviewCapitalPartnersLtd 57.7 76.7GoldenTreeCreditOpportunitiesB,Ltd 67.9 70.0GoldenTreeMultiStrategy,Ltd 47.6 55.1GoldenTreeOffshoreFundLtd 105.3 116.5GSOSpecialSituationsOverseasFundLtd 27.2 32.3H/2CreditPartnersLtd 66.9 66.9HarbingerCapitalParntersOffshoreFundI,Ltd 32.9 74.2HarbingerCapitalPartnersSpecialSituationsOffshoreFundL.P. 23.8 61.1HBKOffshoreFundLtd 203.8 216.7KingStreetCapital,Ltd 101.9 107.5MarinerCreditRiskAdvisorsRelativeValueOffshoreFundLtd 54.3 57.7NewportGlobalOpportunitiesFundL.P. 23.8 25.1NewStarAccelatorHedgeFundLimited 6.6 6.6NWIExplorerGlobalFund,Ltd 34.0 36.6
OakHillCreditAlphaFundLtdClassA 54.3 58.6OZAsiaOveaseasFundLtd 30.6 39.1OZEuropeOveaseasFundIILtd 67.9 74.9OZOveaseasFundLtd 30.6 43.4ResevoirCapitalOverseasPartnersIIL.P. 12.2 12.4ScoutCapitalConcentratedFund,Ltd 47.0 47.2ScoutCapitalFundLtd 21.6 28.5SenecaCapitalInternational.LtdClass2Ser.E 34.0 47.6SpinnakerGlobalEmergingMarketsFundLtdClassI 45.5 47.3SpinnakerGlobalOpportunityFundLtdClassI 45.5 47.7SpinnakerGlobalStrategicFundLtdClassI 45.5 47.7SRMGlobalFundLimited 66.1 66.1TequestaEnhancedConvexityLtdClassA 24.9 24.9TequestaMortgageFundSPV 25.9 25.9TheCanoynSpecialOpportunitiesFundLtd 134.5 134.5TheCanoynValueRealizationFundLtd 88.3 93.5YorkInvestmentLimitedClassA/1 38.0 56.8ZaisOpportunityFundLtdBSeries 26.7 26.7ZAISScepticusFundIII,Ltd 4.0 39.4ZAISZephyrOffshoreFeederFundI-ALtd 22.0 22.0 3,108.9 3,603.8
REAL ESTATE FUNDSAlindaInfrastructureParallelFundIL.P. 30.4 30.4ApolloEuropeanRealEstateFundIIL.P. 11.4 12.4Babcock&BrownEuropeanInfrastructureFundL.P. 3.5 3.5BlackstoneRealEstatePartnersInternationalIIL.P. 21.5 22.3CapManRealEstateIKy 3.2 3.2CaptivaCapitalPartnersIIS.C.A. 24.3 27.9CerberusInstitutionalRealEstatePartners.L.P. 6.3 11.2ColonyInvestorsVII,L.P. 23.8 29.4ColonyParallellInvestorsVIII,L.P. 16.5 16.5EPIRussiaIKy 21.9 21.9EuropeanRealEstateOpportunityFundIILimitedPartnership 4.1 4.1FairfieldAeriumInternationalS.C.AClassBNon-Dividend 14.6 23.8ICECAPITALHousingFundIKy 8.2 8.2ICECAPITALSaintPetersburgResidentialFundIKy 8.5 8.5MacquarieEuropeanInfrastructureFundII 56.5 59.6MGPAsiaFundIIIL.P. 4.3 4.3MoorfieldRealEstateFundBL.P. 16.7 17.9NVKiinteistörahastoIKy 19.7 20.1TheCITRealEstateLimitedPartnership 14.1 17.8 309.6 343.1
OTHER EQUITY INVESTMENTSMenawarrant191208 30.2 32.6MSCIDailyTRNetEMIndiaUSDindex061108 13.6 4.6 43.8 47.2 Parent Company Total 11,891.1 15,232.2
TheGroupsshareholdingdeviatesfromtheParentCompany’sasfollows:
KalevaMutualInsuranceCompany(guaranteecapital) 3.3 3.3MartinparkkiOy 2.4 2.4Poha-PysäköintiOy 1.4 1.4RuohoparkkiOy 3.3 3.3VaasanToripysäköintiOy 2.9 2.9Other 2.8 2.8 Group total 11,907.2 15,248.3

VARMA FINANCIAL STATEMENTS 2007 �1
Changes in tangible and intangible assets, Parent Company
31Dec.2007,€million
Otherexpenseswithlong-term
effects
Futureandfixtures
Othertangible
assets
Total
Acquisitioncost,1Jan. 1.1 9.0 0.6 10.6Completelydepreciatedinthepreviousyear -0.1 -1.0 -1.1Increase 4.7 0.5 0.1 5.4Decrease -0.4 0.0 -0.4
Acquisitioncost,31Dec. 5.7 8.1 0.7 14.5
Accumulateddepreciation,1Jan. -0.6 -5.1 -5.7Completelydepreciatedinthepreviousyear 0.1 1.0 1.1Depreciationforthefinancialyear -0.4 -1.5 -1.9
Accumulateddepreciation,31Dec. -1.0 -5.6 -6.6
Bookvalue,31Dec. 4.8 2.5 0.7 8.0
GroupfiguresarethesameasthoseoftheParentCompany.
Loan receivables itemised by guarantee
PARENTCOMPANY GROUP31Dec.,€million 2007 2006 2007 2006
Bankguarantee 106.2 228.9 106.2 228.9Guaranteeinsurance 162.5 220.4 162.5 220.4Otherguarantee 582.6 304.2 582.6 304.2Remainingacquisitioncost,total 851.3 753.5 851.3 753.5
Total pension loan receivables itemised by balance sheet item
LoanstoGroupcompanies 0.4 0.5 0.4 0.5Loansguaranteedbymortgages 46.7 58.3 46.7 58.3Otherloanreceivables 169.6 344.6 169.6 344.6Remainingacquisitioncost,total 216.7 403.4 216.7 403.4
Loans to Group companies Otherreceivables 0.1 0.2 0.1 0.2
Derivatives
OtherreceivablesAdvancepaymentsforoptioncontracts 28.8 23.2 28.8 23.2
OtherliabilitiesAdvancepaymentsforoptioncontracts 6.7 4.4 6.7 4.4Valueadjustmentsofderivatives 47.3 35.5 47.3 35.5
AccrualsanddeferredincomeInterestliabilities 0.3 7.7 0.3 7.7

VARMA FINANCIAL STATEMENTS 2007�2
Notes to the balance sheet Notes to the financial statements
31Dec.,€million 2007 2006 2007 2006
Liabilities to Group companies
Otherliabilities 1.4 0.9 0.4 1.3
Technical provisions
ProvisionforunearnedpremiumsFuturepensions 13,302.8 12,900.9 13,302.8 12,900.9Provisionforfuturebonuses 3,258.6 3,008.4 3,258.6 3,008.4Provisionforcurrentbonuses 92.0 77.3 92.0 77.3Equity-linkedprovisionforcurrent/futurebonuses 8.2 8.2Totalprovisionforunearnedpremiums 16,661.6 15,986.6 16,661.6 15,986.6
ProvisionforclaimsoutstandingCurrentpensions 7,971.2 6,877.3 7,971.2 6,877.3Equalisationprovision 938.3 910.4 938.3 910.4Totalprovisionforclaimsoutstanding 8,909.5 7,787.7 8,909.5 7,787.7
Totaltechnicalprovisions 25,571.1 23,774.3 25,571.1 23,774.3
PARENTCOMPANY GROUP
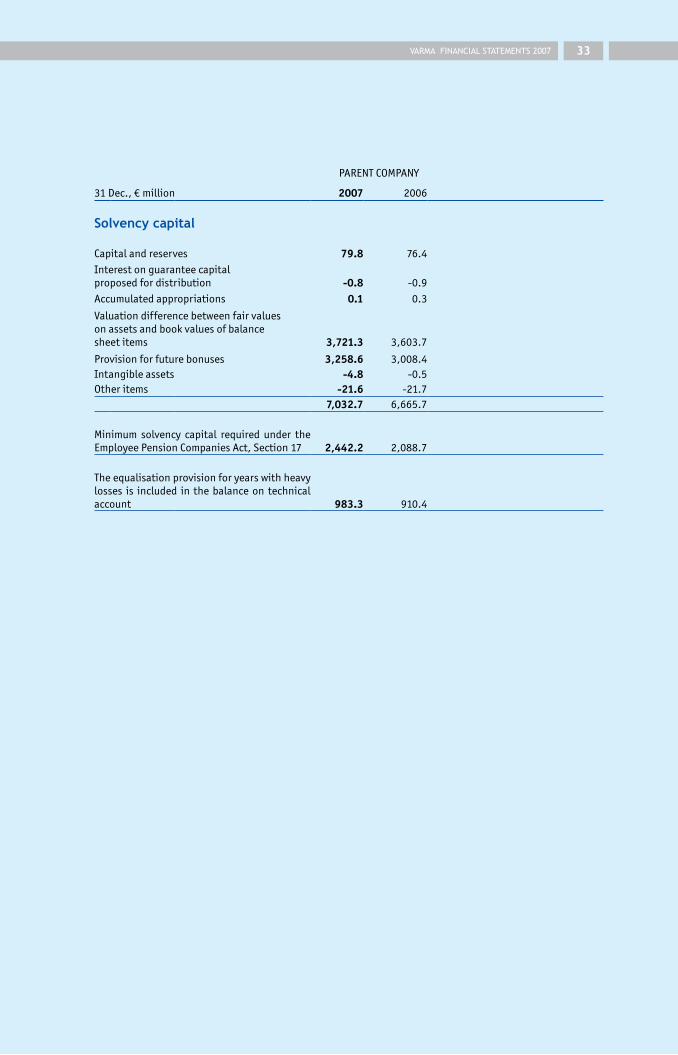
VARMA FINANCIAL STATEMENTS 2007 ��
31Dec.,€million 2007 2006
Solvency capital
Capitalandreserves 79.8 76.4
Interestonguaranteecapitalproposedfordistribution -0.8 -0.9
Accumulatedappropriations 0.1 0.3
Valuationdifferencebetweenfairvaluesonassetsandbookvaluesofbalancesheetitems 3,721.3 3,603.7
Provisionforfuturebonuses 3,258.6 3,008.4Intangibleassets -4.8 -0.5Otheritems -21.6 -21.7
7,032.7 6,665.7
Minimum solvency capital required under theEmployeePensionCompaniesAct,Section17 2,442.2 2,088.7
Theequalisationprovisionforyearswithheavylosses is included in thebalanceon technicalaccount 983.3 910.4
PARENTCOMPANY
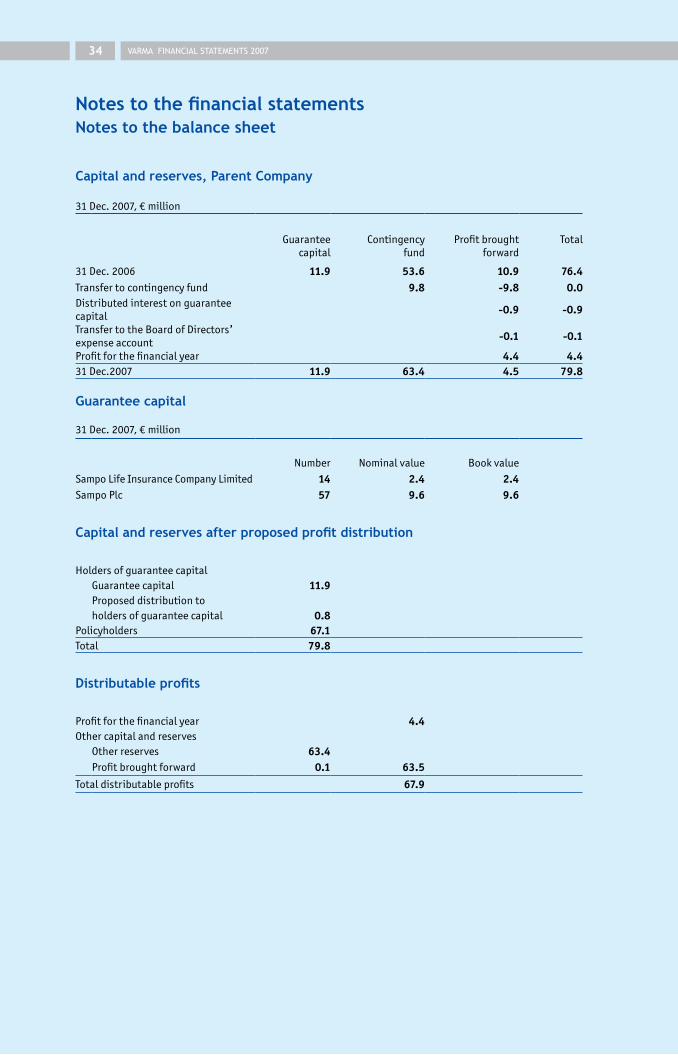
VARMA FINANCIAL STATEMENTS 2007��
Notes to the balance sheetNotes to the financial statements
Capital and reserves, Parent Company
31Dec.2007,€million
Guaranteecapital
Contingencyfund
Profitbroughtforward
Total
31Dec.2006 11.9 53.6 10.9 76.4Transfertocontingencyfund 9.8 -9.8 0.0Distributedinterestonguaranteecapital
-0.9 -0.9
TransfertotheBoardofDirectors’expenseaccount
-0.1 -0.1
Profitforthefinancialyear 4.4 4.431Dec.2007 11.9 63.4 4.5 79.8
Guarantee capital
31Dec.2007,€million
Number Nominalvalue Bookvalue
SampoLifeInsuranceCompanyLimited 14 2.4 2.4SampoPlc 57 9.6 9.6
Capital and reserves after proposed profit distribution
HoldersofguaranteecapitalGuaranteecapital 11.9Proposeddistributiontoholdersofguaranteecapital 0.8
Policyholders 67.1Total 79.8
Distributable profits
Profitforthefinancialyear 4.4Othercapitalandreserves
Otherreserves 63.4Profitbroughtforward 0.1 63.5
Totaldistributableprofits 67.9

VARMA FINANCIAL STATEMENTS 2007 ��
Capital and reserves, Group
31Dec.2007,€million
Guaranteecapital Contingencyfund Profitbrought Totalforward
31Dec.2006 11.9 53.6 -37.3 28.2Transfertocontingencyfund 9.8 -9.8 0.0Distributedinterestonguaranteecapital
-0.9 -0.9
TransfertotheBoardofDirectors’expenseaccount
0.1 -0.1
Profitforthefinancialyear 2.3 2.331Dec.2007 11.9 63.4 -45.7 29.6
Guarantee capital
31Dec.2007,€million
Number Nominalvalue BookvalueSampoLifeInsuranceCompanyLimited 14 2.4 2.4SampoPlc 57 9.6 9.6
Distributable profits
Profitforthefinancialyear 2.3OthercapitalandreservesOtherreserves 63.4Lossbroughtforward -48.0 15.3Accumulatedappropriations -1.9Totaldistributableprofits 15.7
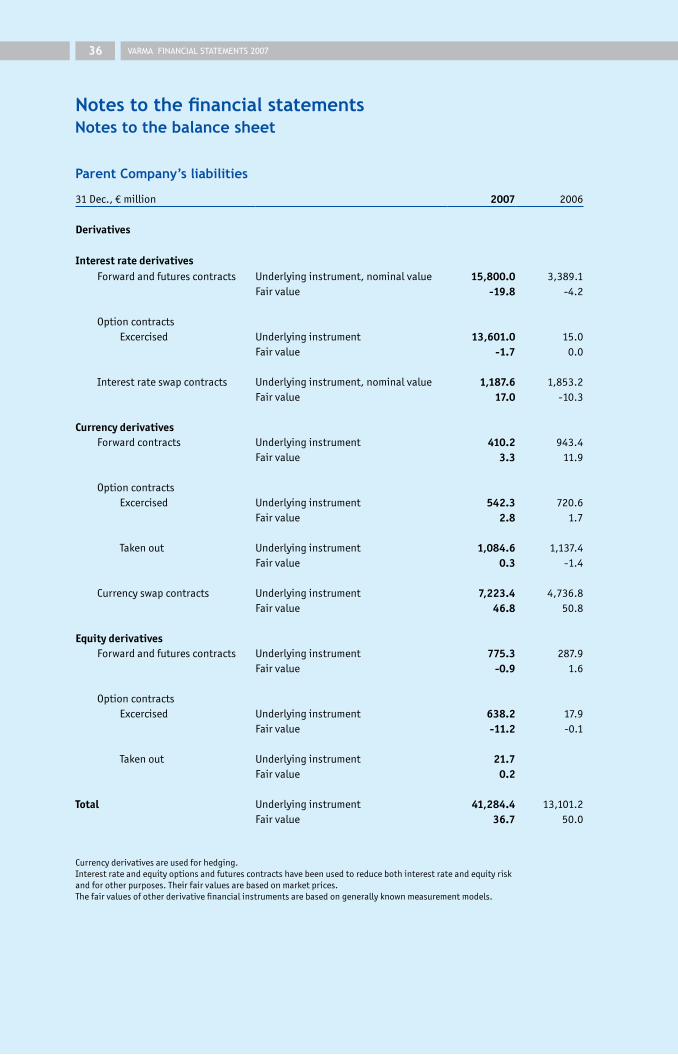
VARMA FINANCIAL STATEMENTS 2007��
Notes to the balance sheet Notes to the financial statements
Parent Company’s liabilities
31Dec.,€million 2007 2006
Derivatives
Interest rate derivativesForwardandfuturescontracts Underlyinginstrument,nominalvalue 15,800.0 3,389.1
Fairvalue -19.8 -4.2
OptioncontractsExcercised Underlyinginstrument 13,601.0 15.0
Fairvalue -1.7 0.0
Interestrateswapcontracts Underlyinginstrument,nominalvalue 1,187.6 1,853.2Fairvalue 17.0 -10.3
Currency derivativesForwardcontracts Underlyinginstrument 410.2 943.4
Fairvalue 3.3 11.9
OptioncontractsExcercised Underlyinginstrument 542.3 720.6
Fairvalue 2.8 1.7
Takenout Underlyinginstrument 1,084.6 1,137.4Fairvalue 0.3 -1.4
Currencyswapcontracts Underlyinginstrument 7,223.4 4,736.8Fairvalue 46.8 50.8
Equity derivativesForwardandfuturescontracts Underlyinginstrument 775.3 287.9
Fairvalue -0.9 1.6
OptioncontractsExcercised Underlyinginstrument 638.2 17.9
Fairvalue -11.2 -0.1
Takenout Underlyinginstrument 21.7Fairvalue 0.2
Total Underlyinginstrument 41,284.4 13,101.2Fairvalue 36.7 50.0
Currencyderivativesareusedforhedging.Interestrateandequityoptionsandfuturescontractshavebeenusedtoreducebothinterestrateandequityriskandforotherpurposes.Theirfairvaluesarebasedonmarketprices.Thefairvaluesofotherderivativefinancialinstrumentsarebasedongenerallyknownmeasurementmodels.
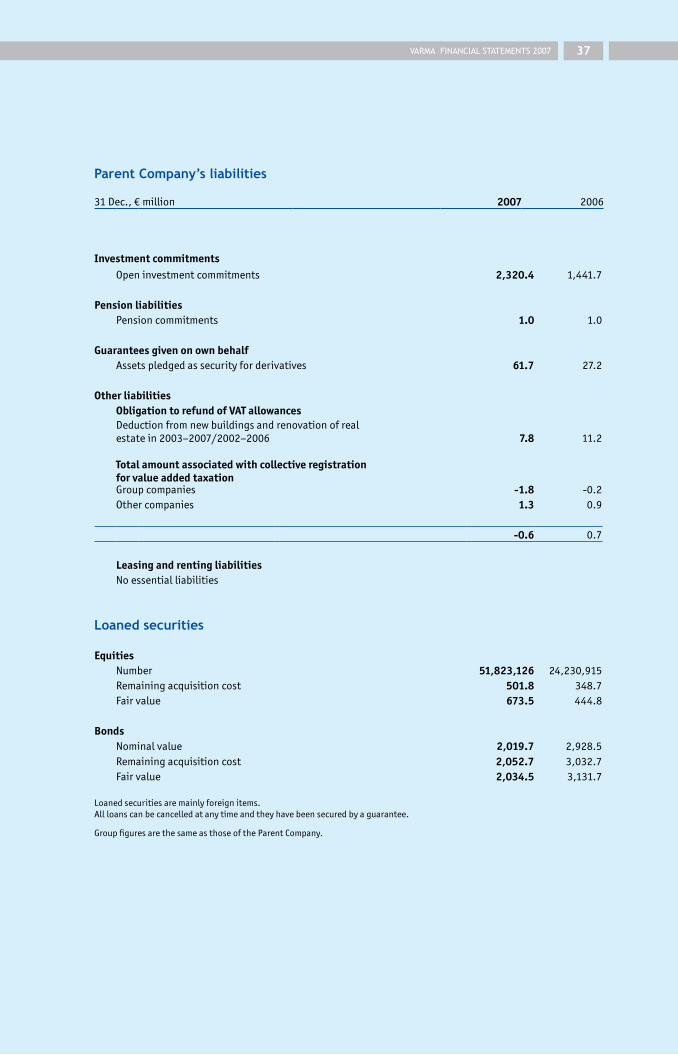
VARMA FINANCIAL STATEMENTS 2007 �7
31Dec.,€million 2007 2006
Investment commitments Openinvestmentcommitments 2,320.4 1,441.7
Pension liabilitiesPensioncommitments 1.0 1.0
Guarantees given on own behalfAssetspledgedassecurityforderivatives 61.7 27.2
Other liabilitiesObligation to refund of VAT allowances Deductionfromnewbuildingsandrenovationofrealestatein2003–2007/2002–2006 7.8 11.2
Total amount associated with collective registration for value added taxationGroupcompanies -1.8 -0.2Othercompanies 1.3 0.9
-0.6 0.7
Leasing and renting liabilities Noessentialliabilities
Loaned securities
EquitiesNumber 51,823,126 24,230,915Remainingacquisitioncost 501.8 348.7Fairvalue 673.5 444.8
BondsNominalvalue 2,019.7 2,928.5Remainingacquisitioncost 2,052.7 3,032.7Fairvalue 2,034.5 3,131.7
Loanedsecuritiesaremainlyforeignitems. Allloanscanbecancelledatanytimeandtheyhavebeensecuredbyaguarantee.
GroupfiguresarethesameasthoseoftheParentCompany.
Parent Company’s liabilities
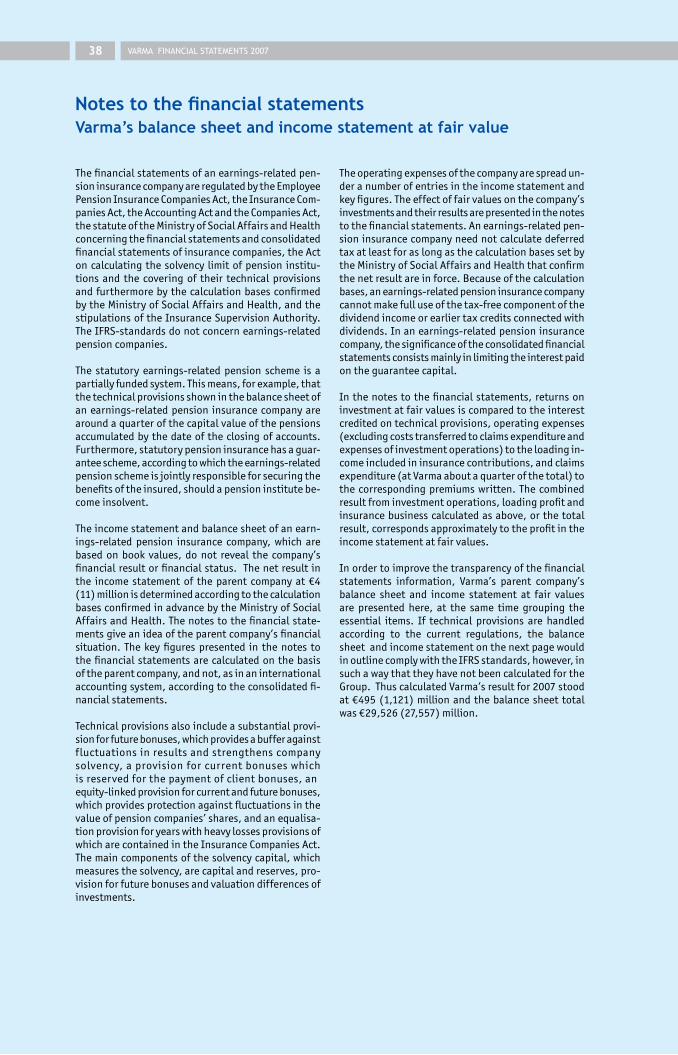
VARMA FINANCIAL STATEMENTS 2007��
Notes to the financial statements Varma’s balance sheet and income statement at fair value
Thefinancialstatementsofanearnings-relatedpen-sioninsurancecompanyareregulatedbytheEmployeePensionInsuranceCompaniesAct,theInsuranceCom-paniesAct,theAccountingActandtheCompaniesAct,thestatuteoftheMinistryofSocialAffairsandHealthconcerningthefinancialstatementsandconsolidatedfinancialstatementsofinsurancecompanies,theActoncalculatingthesolvency limitofpensioninstitu-tions and the covering of their technical provisionsandfurthermorebythecalculationbasesconfirmedbytheMinistryofSocialAffairsandHealth,andthestipulationsoftheInsuranceSupervisionAuthority.TheIFRS-standardsdonotconcernearnings-relatedpensioncompanies.
The statutory earnings-related pension scheme is apartiallyfundedsystem.Thismeans,forexample,thatthetechnicalprovisionsshowninthebalancesheetofanearnings-relatedpension insurancecompanyarearoundaquarterofthecapitalvalueofthepensionsaccumulatedbythedateoftheclosingofaccounts.Furthermore,statutorypensioninsurancehasaguar-anteescheme,accordingtowhichtheearnings-relatedpensionschemeisjointlyresponsibleforsecuringthebenefitsoftheinsured,shouldapensioninstitutebe-comeinsolvent.
Theincomestatementandbalancesheetofanearn-ings-related pension insurance company, which arebased on book values, do not reveal the company’sfinancialresultorfinancialstatus.Thenetresultinthe income statement of the parent company at €4(11)millionisdeterminedaccordingtothecalculationbasesconfirmedinadvancebytheMinistryofSocialAffairsandHealth.Thenotestothefinancialstate-mentsgiveanideaoftheparentcompany’sfinancialsituation. The key figures presented in the notes tothefinancialstatementsarecalculatedonthebasisoftheparentcompany,andnot,asinaninternationalaccountingsystem,accordingtotheconsolidatedfi-nancialstatements.
Technicalprovisionsalsoincludeasubstantialprovi-sionforfuturebonuses,whichprovidesabufferagainstfluctuationsinresultsandstrengthenscompanysolvency,aprovisionforcurrentbonuseswhichisreservedforthepaymentofclientbonuses,anequity-linkedprovisionforcurrentandfuturebonuses,whichprovidesprotectionagainstfluctuationsinthevalueofpensioncompanies’shares,andanequalisa-tionprovisionforyearswithheavylossesprovisionsofwhicharecontainedintheInsuranceCompaniesAct.Themaincomponentsofthesolvencycapital,whichmeasuresthesolvency,arecapitalandreserves,pro-visionforfuturebonusesandvaluationdifferencesofinvestments.
Theoperatingexpensesofthecompanyarespreadun-deranumberofentriesintheincomestatementandkeyfigures.Theeffectoffairvaluesonthecompany’sinvestmentsandtheirresultsarepresentedinthenotestothefinancialstatements.Anearnings-relatedpen-sioninsurancecompanyneednotcalculatedeferredtaxatleastforaslongasthecalculationbasessetbytheMinistryofSocialAffairsandHealththatconfirmthenetresultareinforce.Becauseofthecalculationbases,anearnings-relatedpensioninsurancecompanycannotmakefulluseofthetax-freecomponentofthedividendincomeorearliertaxcreditsconnectedwithdividends.Inanearnings-relatedpensioninsurancecompany,thesignificanceoftheconsolidatedfinancialstatementsconsistsmainlyinlimitingtheinterestpaidontheguaranteecapital.
Inthenotestothefinancialstatements,returnsoninvestmentatfairvaluesiscomparedtotheinterestcreditedontechnicalprovisions,operatingexpenses(excludingcoststransferredtoclaimsexpenditureandexpensesofinvestmentoperations)totheloadingin-comeincludedininsurancecontributions,andclaimsexpenditure(atVarmaaboutaquarterofthetotal)tothecorrespondingpremiumswritten.Thecombinedresultfrominvestmentoperations,loadingprofitandinsurancebusinesscalculatedasabove,orthetotalresult,correspondsapproximatelytotheprofitintheincomestatementatfairvalues.
Inordertoimprovethetransparencyofthefinancialstatements information, Varma’s parent company’sbalance sheet and income statement at fair valuesare presented here, at the same time grouping theessential items. If technical provisions are handledaccording to the current regulations, the balancesheetandincomestatementonthenextpagewouldinoutlinecomplywiththeIFRSstandards,however,insuchawaythattheyhavenotbeencalculatedfortheGroup.ThuscalculatedVarma’sresultfor2007stoodat€495(1,121)millionandthebalancesheet totalwas€29,526(27,557)million.
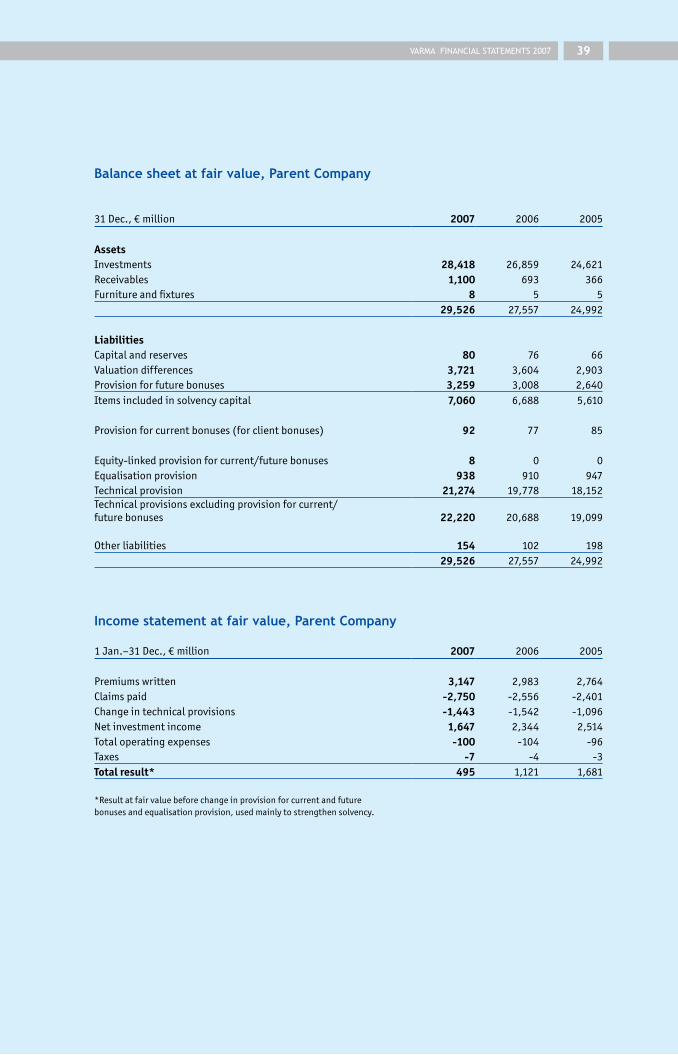
VARMA FINANCIAL STATEMENTS 2007 ��
Balance sheet at fair value, Parent Company
31Dec.,€million 2007 2006 2005
AssetsInvestments 28,418 26,859 24,621Receivables 1,100 693 366Furnitureandfixtures 8 5 5
29,526 27,557 24,992
LiabilitiesCapitalandreserves 80 76 66Valuationdifferences 3,721 3,604 2,903Provisionforfuturebonuses 3,259 3,008 2,640Itemsincludedinsolvencycapital 7,060 6,688 5,610
Provisionforcurrentbonuses(forclientbonuses) 92 77 85
Equity-linkedprovisionforcurrent/futurebonuses 8 0 0Equalisationprovision 938 910 947Technicalprovision 21,274 19,778 18,152Technicalprovisionsexcludingprovisionforcurrent/futurebonuses 22,220 20,688 19,099
Otherliabilities 154 102 19829,526 27,557 24,992
Income statement at fair value, Parent Company
1Jan.–31Dec.,€million 2007 2006 2005
Premiumswritten 3,147 2,983 2,764Claimspaid -2,750 -2,556 -2,401Changeintechnicalprovisions -1,443 -1,542 -1,096Netinvestmentincome 1,647 2,344 2,514Totaloperatingexpenses -100 -104 -96Taxes -7 -4 -3Total result* 495 1,121 1,681
*Resultatfairvaluebeforechangeinprovisionforcurrentandfuturebonusesandequalisationprovision,usedmainlytostrengthensolvency.

VARMA FINANCIAL STATEMENTS 2007�0
Notes to the financial statements Investments classified according to risk, 31 Dec. 2007
Market value
€ million %
Risk distri-bution
€ million %
Returnoninvested
capital%
Vola-tility
%
Modified duration
Fixed-income investments 10,307 36.3 10,300 36.2 1.5Loanreceivables 1,059 3.7 1,059 3.7 6.2Bonds 8,292 29.2 7,979 28.1 0.9 2.3 4.9Othermoney-marketinstruments 955 3.4 1,261 4.4 2.6
Equity investments 11,181 39.3 11,188 39.4 8.2Listedshares 9,842 34.6 9,849 34.7 5.0 11.6Privateequity 896 3.2 896 3.2 35.2Unlistedshares 443 1.6 443 1.6 41.9
Real estate investments 3,255 11.5 3,255 11.5 10.2Directrealestateinvestments 2,911 10.2 2,911 10.2 10.1Investmentfunds 344 1.2 344 1.2 11.5
Other investments 3,675 12.9 3,675 12.9 11.4Hedgefundinvestments 3,675 12.9 3,675 12.9 11.4 4.4Commodityinvestments 0 0.0 0 0.0Otherinvestments 0 0.0 0 0.0
Total investments 28,418 100.0 28,418 100.0 6.0 3.8
ClassificationofinvestmentsisinaccordancewiththerecommendationsissuedbytheFinnishPensionAllianceTELA’sworkinggroupforreturncalculation.
Investments classified according to regulations versus risk, 31 Dec. 2007
Investments classified Investments classifiedaccording according to regulations € mill. Change to risk *) € mill.
Loans 1,021 1,021
Money-marketinstruments 9,074 9,074
Creditrelatedtohedgefundinvestments -8Fixed-incomefunds 219
Fixed-incomeinvestments 10,307
Equities 15,412 15,412Hedgefundinvestments -3,668Realestateinvestmentfunds -344Fixed-incomefunds -219 Equityinvestments 11,181
Realestate 2,911 2,911Realestateinvestmentfunds 344
Realestateinvestments 3,255
Hedgefundinvestments 3,668Creditrelatedtohedgefundinvestments 8 Otherinvestments 3,675
Total 28,418 28,418
*)ClassifiedinaccordancewiththerecommendationsissuedbytheFinnishPensionAllianceTELA’sworkinggroupforreturncalculation. Thefairvaluesofinvestmentsincludeitemsfor€143millionclassifiedasPrepaymentsandaccruedincome,AccrualsanddeferredincomeandOtherliabilitiesinthebalancesheetaswellasdifferencebetweenfairvalueandbookvaluetoanamountof€3,721million.

VARMA FINANCIAL STATEMENTS 2007 �1
Risk management as an element of internal controlInternalcontrolisaprocessthataimstoensure1)theachievementofthegoalsandobjectivesset,2)econom-icalandefficientuseofresources,3)sufficientmanage-mentofoperationalrisks,4)reliabilityandcorrectnessof financial and other management information, 5)compliancewithlawsandregulations,and6)compli-ancewiththedecisionsofthecompany’sadministra-tivebodies,internalplans,regulationsandpractices.Riskmanagementisanelementofinternalcontrolandinvolvestheidentification,assessment,limitationandcontrolofrisksarisingfromandcloselyconnectedwiththecompany’sbusinessoperations.Internalcontrolisamanagementtoolhelpingthecompanytofunctionefficiently,economicallyandreliably.
Varmaismanagedinaprofessionalmannerandinaccordancewithsoundandcautiousbusinessprinci-ples.Thecompanyhasestablishedwrittenproceduresand quantitative and qualitative targets for its corefunctions. The Board of Directors follows a writtenworking order, which defines its core tasks and op-eratingprinciples.Aspartofthecompany’sinternalcontrol function, the Board deals with such mattersasthecompanystrategy,budgets,operationalplans,projects,andbasicstrategiesconnectedwithorgani-sationaldevelopmentandmanagement.
Risk management – organisation, responsibilities, supervision and reportingTheBoardofDirectorsapprovesanannualriskman-agementplanthatcoversalloperationsandassesseswhetherthecompany’sinternalcontrolisappropriatelyarranged.TheBoardofDirectors’AuditCommitteesu-pervises financial and other reporting and monitorsthestateofinternalcontrolby,forexample,trackingthe progress of internal and external auditing workandbyreviewingauditreports.ThePresidentandCEOmonitorsthecompany’srisksinaccordancewiththeprincipleslaiddownintheriskmanagement,invest-mentandemergencyplansapprovedbytheBoardofDirectors.
The Executive Group monitors the company’s in-ternal control and risk management processes andmaintains,developsandpreparesguidelinesforriskmanagementandemergencyplanning.
Risks are reported to the Audit Committee BoardofDirectorsatleasteverysixmonths.Thecompany’ssupervisory auditor and the person in charge of theinternalaudittakepartinthemeetingsdiscussingthematter.
Managers are responsible for organising internalcontrol,riskmanagement,thelegalcompliancefunc-tionandgoodgovernanceintheirareas.Thisensuresthatinternalcontrolisfullyintegratedintocompanyoperations.Risk-takinglimitsandtheindicatorsusedarelaiddownseparatelyforeachfunction.Eachfunc-tionisresponsibleforimplementingoperationalplans,budgets,operatingefficiencyandthesupervisionofoutsourcedoperations.
Thefunctionsresponsibleforpreparingandimple-mentinginvestmentdecisions(InvestmentOperations)
andsupervisionandreporting(FinancialAdministra-tionandActuaries)aretwoseparateentities.Thedeci-sion-makingpowersandrisklimitsoftheInvestmentOperationsarelaiddownintheinvestmentplan.Theriskmanagementfunction,whichisindependentoftheInvestmentOperations,isresponsibleforthelimit-typesupervisionofinvestmentrisksinaccordancewiththelimitssetbytheBoardofDirectors,financial-theoryandrisk-theorybasedassessmentofinvestmentrisksandthereportingofresultsaslaiddowninregulations.TheInvestmentOperationsalsohasitsownrisk-management function,whichmonitorsthetrendsoftheportfoliopositionvis-à-vistherisklimitsdefinedintheinvestmentplanandthebasicallocation,andreportsonthemonadailybasis.Theorganisationofthehandlingoftheinvestmentportfolioandoperativeinvestmentriskmanagementistheresponsibilityoftheinvestmentmanagement.TheInvestmentOperationsmonitorstheauthorisationscontinuously,bothbeforeandafterassignments.Observationsmadeduringthemonitoringareimmediatelyreportedtothecomplianceofficer,thosewhomadetheinvestmentdecisionandtheinvestmentmanagement.Inthesameconnection,decisionsarealsomadeonfurthermeasuressothattheconsequencesofaviolationcanbeminimised,anyfurtherviolationspreventedand,ifnecessary,changestoauthorisationsand/orrisklimitsimplemented.Sen-sitivityanalysesarecarriedoutbyInvestmentOpera-tionsandtheFinancialAdministrationandActuaries,andtheseareinaccordancewiththeBoardofDirectors’workingorder.
The officer responsible for investment risk man-agementintheActuariescalculatesthemaximumrisklevelinaccordancewiththeguidelinesapprovedbytheBoardofDirectors.Theofficermonitors thesecuritytargetslaiddownintheinvestmentplan,investmentliquiditytargetsandtheprinciplesgoverningthefor-eigncurrencybusiness.Theofficeralsogivesanopinionaboutanon-standardclassificationproposalsubmittedbytheportfolio-managementorganisationconcerningsolvency-limitcalculations.InvestmentrisksandtheimpactstheirrealisationwouldhaveonVarma’srisk-bearingcapacityaremonitored inamonthlyreport.Itemssuchasthetrendsinmaximumrisklevels,Value-at-Riskparametersbyassetcategory,andtheircontri-butionstototalriskarereportedonamonthlybasis.MoredetailedValue-at-Riskreportinggivesitemssuchasequityriskbysectorandinterestrateriskbydurationcategory.Italsoexaminescreditrisksandinterestraterisksasseparateentities,listsalternativeinvestmentsbyinvestmentcategoryandconsidersforeigncurrencyrisksseparately.Derivativesarealwaysincludedintheinvestmentportfolio.Riskreportsalsogivethecurrentmarketrisklevels,includingthelevelsofthemarkets’mostimportantvolatilityindicesandthetrendsinthecorrelationbetweenassetcategories.
TheFinancialAdministrationcoordinatestheiden-tificationandmanagementofoperationalrisksindif-ferentdepartments.Italsopreparesasummaryoftheriskchartsdrawnupbythedepartments.
TheFinancialAdministrationproducescalculationsof the company’s results and solvency several times
Risk management

VARMA FINANCIAL STATEMENTS 2007�2
eachmonth,whichenablesthenecessarymatchingstobedoneregularly.TheBoardofDirectorsreceivesmonthlyreportsontheinvestmentallocations,invest-mentreturnsandrisks,solvencypositionandtheim-pactoftheactualinvestmentriskonit,monitoringofresultsandtargets,margin,risk-limitmonitoringandtheuseofauthorisationstotheextentrequiredintheBoardofDirectors’workingorder.TheFinancialAdmin-istrationproducesamonthlymonitoringreportontheadherencetotheclassificationguidelinesconcerninginvestmentsconnectedwithtechnicalprovisionsandsolvencyapprovedbytheBoardofDirectors,areporton non-standard classifications and their impact onthesolvencylimit,andareportonthemonitoringoftheuseofderivativecontractsinaccordancewiththeprinciplesapprovedbytheBoardofDirectors.Inad-ditiontotheabove-mentionedreports,theBoardofDirectors receives, on a quarterly basis, the balancesheet and income statement at fair value, details ofinvestmentsasclassifiedaccordingtorisk,andareportonderivativeandforeigncurrencypositionsandriskconcentrations.TheBoardofDirectorsreceives,alsoonaquarterlybasis,moredetailedasset-categorybasedreportsoninvestmenttrendsandareviewofthecom-pany’sbusinessoperations.AmoreextensivereportoninternalcontrolandriskmanagementissubmittedtotheBoardDirectorsandtheAuditCommitteeatleasttwiceayear.
Thereadinessgroupisresponsibleforpreparinganemergencyplanandotherplansrelatedtoit(suchastherecoveryplanandthesecurityandrescueplan),fordrawingupthenecessaryinstructionsandtheconsi-derationofappropriatemeasures.Thereadinessgrouphasthemanagersofcorefunctionsanddepartmentsasitsmembers.Intheircapacityasfunction-specificcontacts,themanagersareresponsibleforemergencyplanningintheirareas.Detailedmemorandahavebeenpreparedonactionrequiredinemergencies.
Objectives and general risk management principlesRiskmanagementcoverstheessentialareasintherightproportiontotherisksinherentintheoperations.Risksconnectedwiththecompany’soperationsareidenti-fied,assessed,limitedandmonitoredonalong-termbasis. Risk management ensures that the realisationofinvestment,information,interruption,personnelorotherriskswillnotcausesignificantfinanciallosses,endangerVarma’scustomerserviceandotherservices,thecontinuityofotheroperationsortheattainmentofthecompany’sbusinesstargets,oraffecttrustinthecompany.Varmaappliesefficientandreliableoperat-ingprocesses.
Bothinitsownorganisationandwhendealingwithitspartners,Varmaappliesappropriateprocedures.Inordertoensureefficientriskmanagement, thecom-panyreliesoncarefulpreparationofdecisions,useofexperts,riskinsurance,detailedjobdescriptions,ap-provalroutines,decentralisationoffunctionsandtasks,physicalcontrol,dataprotectionandsecurity,person-neltraining,anefficientplanningprocess,maintenanceofdifferentbackuparrangements,andlimitingaccess
toconfidentialinformationtothosewhoneedit.Divisionoftasks,decision-makingpowersandre-
sponsibilitiesensuresthatnosinglepersonisallowedtodealwithamatterthroughouttheprocessingchainand prevents potentially dangerous work combina-tions.Therearealsoindependentsupervisionandap-provalmechanisms.Staffmembersarenotallowedtoparticipateinthepreparationofmattersordecisionsconcerningthemselves,theirfamiliesorfriends.Busi-nesstransactionsarehandledontime,correctlyandwithappropriateapprovals.Theplanningprocessanditsbalanced indicatorsalsocontributetosoundriskmanagementproceduresatVarma.
The drawing up and documentation of routinesensuringthecontinuityofthecompany’soperationsandsecuringtheassetsandinformationmanagedbythecompany,andthepossibletestingofbackupplansare carried out by each department, if necessary, inconjunctionwithotherdepartments.Thecompanyor-ganizesitsoperationssothatalossofakeyemployee’sworkinputdoesnotparalyseoperations.
Varma’sinformationprovisionisonatransparentbasis.Inthenotestothefinancialstatementsandthebi-annualinterimreports,thecompanygivesdetailsonhowtheresultsofearnings-relatedpensioninsurancecompaniesarestructuredandpresentsitsbalancesheetandincomestatementatfairvalueandtheinvestmentsasclassifiedaccordingto risk. Inmost respects, thepresentationisinaccordancewiththeIFRSstandards,if technicalprovisionsareshown inaccordancewithcurrentFinnishrequirements.TheInvestmentOpera-tionsalsopublishaquarterlyperformancereportde-tailingthecompany’ssolvencysituation.
Varmaalsoobservesgoodinsuranceprinciplesandtreatsallpolicyholdersinafairmanner.Allbusinesstransactionswithpolicyholdersareonmarketterms.Particularattentionispaidtotransactionscoveringthefinancingofapolicyholder’soperations,realestateandothertransactions,andleases.Whendealingwithitspolicyholders,Varmaonlymakesuseofarrangementsthatareconnectedwiththecompany’soperations.
Operational risks Thecompany’smainoperatingsectorsarepensionserv-ices,insuranceservices,clientservices,andinvestmentoperationsplusitssupportfunctions.
Essential risks involve investments and informa-tiontechnology.Varma’smostimportantoperationalrequirement is to manage all pension and insurancetransactionscorrectlyandontime.Financiallythemostimportantrisksarethoseconcerninginvestments.In-surancerisksincludethemanagementofthecomplexinformationsystemsthatmaintaintheproductionofservices,risksrelatedtothefunctioningofthecen-tralised earnings register and possible errors in theprocessing and payment of pensions. Challenges totheinformationsystemincludetheimplementationoflegislativechangesandthefunctioningofoutsourcedservices.Withonlineservicesexpanding,malfunctionsincompany’s internalsystemsandinfrastructuresinsocietyatlargewillaffecttheproductionofservices.
Other important risks are those connected with
Notes to the financial statements Risk management

VARMA FINANCIAL STATEMENTS 2007 ��
managementinformation,thecompany’sphysicalop-eratingenvironment,distributionchannels,clienteletrends,observanceofprovisionsandregulations,ef-ficientuseofresources,contractualandcounterpartymatters,insurancebusinessmanagedbythecompany,incorrecthandlingofconfidentialinformation,andthecorporateimage.Thepensionsystemmayalsobyaffectedbyrisksconnectedwithitsstructureandfunctioning,andthecountry’seconomy.
Varma has one head office, one operational area(Finland),asimplegroupstructure,statutoryproductsitshareswithitscompetitors,asmallnumberofstaffrelativetoitsturnover,andalownumberoftransac-tionsrelativetoitsinvestmentvolume.Varmaanalysesitsrisksfrombottomtotopandfromtoptobottomsothatitcanensurethatallcompanyrisksarecompre-hensivelycoveredfromdifferentperspectives.Varma’srisk management plan is mainly divided into invest-mentandotherrisks.Thecompanyalsoobservesgoodgovernanceprinciples,conductscomprehensiveself-assessmentsfromdifferentperspectivesandappliesasystematicplanningprocessthatincludesscorecards.IFRS,BaselIIandSolvencyIIprovisionsdonotapplytoearnings-relatedpensioninsurancecompanies.
Risks related to the earnings-related pensionscheme,suchassignificantstructuralchangesinthecapacityofthenationaleconomy,inpayrolltrendsandthepensionschememay,ifrealised,makeitmoredif-ficultforVarmatocarryoutitstasksinaccordancewithitsexecutivefunctionandtoadapttochangingcircum-stances.Inordertocontroltheserisks,thecompanymanagesitsexecutivefunctioninaprofessionalandefficientmannerandcontributestothedevelopmentof the earnings-related pension scheme throughoutitsexpertise.Varmacooperatescloselywithitsstake-holders and other players in the field. The companyalsodevelopsitsprocessessothatitcanreacttoanychangesintheearnings-relatedpensionschemeflex-iblyandontime.
Varma’sBoardofDirectorshasdrawnupanemer-gencyplan,whichissupplementedbydetailedplanspreparedbydifferentfunctions.Inexceptionalcircum-stances,Varmawillfulfilitsstatutoryandcontractualobligationsascomprehensivelyandaslongaspossible.Prioritywillbegiventosecuringservicesconnectedwiththecitizens’incomesecurity.Theaimisatamin-imum to keep basic care services operational, usingtheavailableresourcesandthe informationsystemsinproductionorsolutionsdevelopedforemergencies.Everyeffortwillbemadetosecurethepaymentandfinancingofpensions, receiptofpayments,process-ingofnewpensionsandclaims,accounting,technicalaccountsandcommunication.Inexceptionalcircum-stances,Varmawillfollowordersissuedbyauthoritiesandmakeeveryefforttointegrateitsoperationswiththepracticesofotherearnings-relatedpensioninsur-ancecompanies.Servicesmayalsobeaffectedbytheusabilityoftheinsuranceandbankservicesnetworks,theInternetandotherinfrastructures.
Significantrisksinexceptionalcircumstancesinclude:1)thepaymentofpensionsisjeopardised2)thefinancingofpensionismoredifficult3)thereisnoperiodofheightenedreadiness betweenthenormalsituationandfullreadiness4)banksystems(suchasinvestmenttrading systems)orotherinfrastructuresfailtowork5)thereareproblemswiththetelecommunications capacityandtheavailabilityofITservices (includingbackupsystems)6)theriskrelatedtointegratingtheoperations ofmajorpartnersandrisksconnectedwiththe managementofoutsourcedoperations.
Risks connected with insurance operations and technical provisions and covering them The TyEL component of the earnings-related pen-sion scheme is on a partially funded basis. Aroundonefifthofthepensionspaideachyearispreviouslyfunded, while the remaining part is what is called apooled component, which is covered by an annuallycollectedinsurancecontribution(pooledcomponentofthecontribution).Thefundedpensioncomponentsaretheresponsibilityofindividualpensioninsuranceinstitutions,whilethepooledcomponentsareajointresponsibilityofallpensioninsuranceinstitutions.Theequalisationprovisioncontainedinthetechnicalpro-visionactsasabufferforjointlymanagedinsurancebusiness.Theclearingsystemisbuiltsothatitelimi-natestheimpactsofthedifferencesintrendsbetweenindividualinsurancecompanies’activeportfolios.Thus,contributingtothecostsofthepooledcomponentsisrisk-freefortheindividualpensioninsuranceinstitu-tionsinvolved.ThebasicpensionspayableundertheSelf-EmployedPersons’PensionsAct(YEL)arefinancedentirelyusingtheinsurancecontributionscollectedan-nuallyaspartofthepay-as-you-gosystemandaStatecontribution.Thus,contributingtothefundingofthesepensionsisalsorisk-freeforindividualpensioninsur-anceinstitutions.
Earnings-related pensions are paid on a defined-benefitbasisandaretherefore,notdirectlydependentonthereturnonfundedpensionassets.Astatutoryjointandseveralliabilityforbankruptcyapplyingtoallearnings-relatedpensioninsuranceinstitutionsguar-anteesearnings-relatedpensionbenefitstoallinsuredandpensionrecipients.Thecostsofprovidingpensionsarebornebyemployersandemployeestogether.Eachyear, at the request of the earnings-related pensioninsurance companies, the Ministry of Social AffairsandHealthlaysdowncommontechnicalbases,whichallearnings-relatedpensioninsurancecompanieswilluseforcalculatinginsurancecontributionsandtech-nicalprovisions.Thetechnicalbasesincludetheactu-arialassumptionsusedinthecalculationoftechnicalprovisions,suchasmortalityanddisabilityincidencerates.UndertheTyELact,thetechnicalbasesmustbesecureand, should the base for technical provisionsproveinsufficientforallearnings-relatedpensionin-suranceinstitutions,thetechnicalprovisionscanbesupplementedwithaclearingsystem.
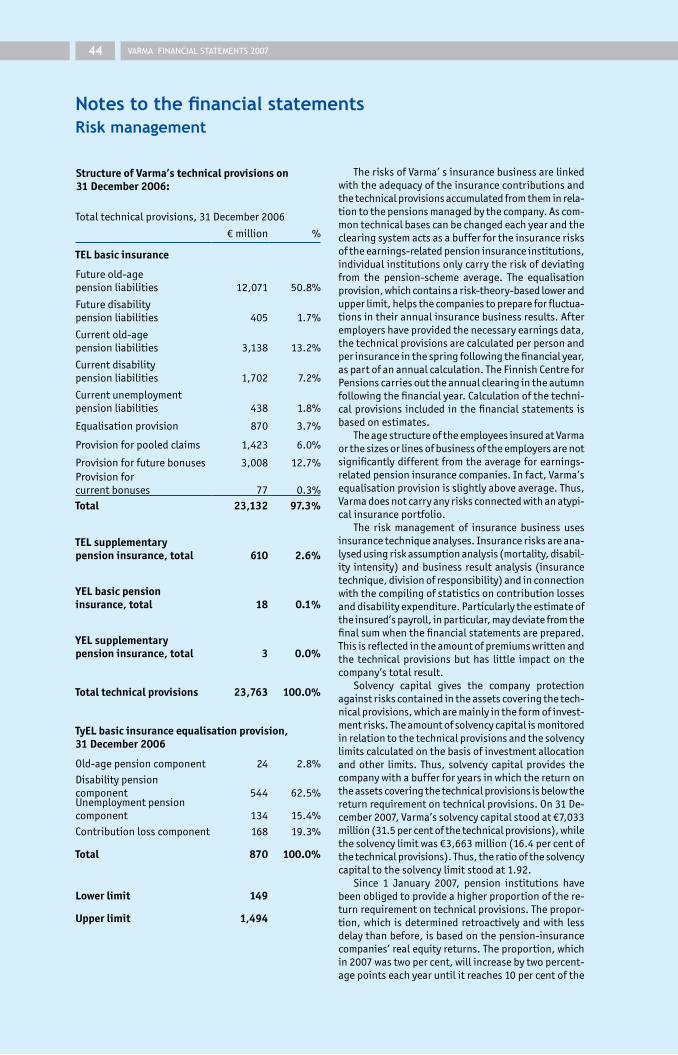
VARMA FINANCIAL STATEMENTS 2007��
TherisksofVarma’sinsurancebusinessarelinkedwiththeadequacyoftheinsurancecontributionsandthetechnicalprovisionsaccumulatedfromtheminrela-tiontothepensionsmanagedbythecompany.Ascom-montechnicalbasescanbechangedeachyearandtheclearingsystemactsasabufferfortheinsurancerisksoftheearnings-relatedpensioninsuranceinstitutions,individualinstitutionsonlycarrytheriskofdeviatingfrom the pension-scheme average. The equalisationprovision,whichcontainsarisk-theory-basedlowerandupperlimit,helpsthecompaniestoprepareforfluctua-tionsintheirannualinsurancebusinessresults.Afteremployershaveprovidedthenecessaryearningsdata,thetechnicalprovisionsarecalculatedperpersonandperinsuranceinthespringfollowingthefinancialyear,aspartofanannualcalculation.TheFinnishCentreforPensionscarriesouttheannualclearingintheautumnfollowingthefinancialyear.Calculationofthetechni-calprovisionsincludedinthefinancialstatementsisbasedonestimates.
TheagestructureoftheemployeesinsuredatVarmaorthesizesorlinesofbusinessoftheemployersarenotsignificantlydifferentfromtheaverageforearnings-relatedpensioninsurancecompanies.Infact,Varma’sequalisationprovisionisslightlyaboveaverage.Thus,Varmadoesnotcarryanyrisksconnectedwithanatypi-calinsuranceportfolio.
The risk management of insurance business usesinsurancetechniqueanalyses.Insurancerisksareana-lysedusingriskassumptionanalysis(mortality,disabil-ity intensity)andbusinessresultanalysis(insurancetechnique,divisionofresponsibility)andinconnectionwiththecompilingofstatisticsoncontributionlossesanddisabilityexpenditure.Particularlytheestimateoftheinsured’spayroll,inparticular,maydeviatefromthefinalsumwhenthefinancialstatementsareprepared.Thisisreflectedintheamountofpremiumswrittenandthe technical provisions but has little impact on thecompany’stotalresult.
Solvency capital gives the company protectionagainstriskscontainedintheassetscoveringthetech-nicalprovisions,whicharemainlyintheformofinvest-mentrisks.Theamountofsolvencycapitalismonitoredinrelationtothetechnicalprovisionsandthesolvencylimitscalculatedonthebasisofinvestmentallocationand other limits. Thus, solvency capital provides thecompanywithabufferforyearsinwhichthereturnontheassetscoveringthetechnicalprovisionsisbelowthereturnrequirementontechnicalprovisions.On31De-cember2007,Varma’ssolvencycapitalstoodat€7,033million(31.5percentofthetechnicalprovisions),whilethesolvencylimitwas€3,663million(16.4percentofthetechnicalprovisions).Thus,theratioofthesolvencycapitaltothesolvencylimitstoodat1.92.
Since 1 January 2007, pension institutions havebeenobligedtoprovideahigherproportionofthere-turnrequirementontechnicalprovisions.Thepropor-tion,whichisdeterminedretroactivelyandwith lessdelaythanbefore,isbasedonthepension-insurancecompanies’realequityreturns.Theproportion,whichin2007wastwopercent,willincreasebytwopercent-agepointseachyearuntilitreaches10percentofthe
Totaltechnicalprovisions,31December2006
€million %
TEL basic insurance
Futureold-agepensionliabilities 12,071 50.8%
Futuredisabilitypensionliabilities 405 1.7%
Currentold-agepensionliabilities 3,138 13.2%
Currentdisabilitypensionliabilities 1,702 7.2%
Currentunemploymentpensionliabilities 438 1.8%
Equalisationprovision 870 3.7%
Provisionforpooledclaims 1,423 6.0%
Provisionforfuturebonuses 3,008 12.7%Provisionforcurrentbonuses 77 0.3%Total 23,132 97.3%
TEL supplementary pension insurance, total 610 2.6%
YEL basic pension insurance, total 18 0.1%
YEL supplementary pension insurance, total 3 0.0%
Total technical provisions 23,763 100.0%
TyEL basic insurance equalisation provision, 31 December 2006
Old-agepensioncomponent 24 2.8%
Disabilitypensioncomponent 544 62.5%Unemploymentpensioncomponent 134 15.4%
Contributionlosscomponent 168 19.3%
Total 870 100.0%
Lower limit 149
Upper limit 1,494
Structure of Varma’s technical provisions on 31 December 2006:
Notes to the financial statements Risk management
VARMA FINANCIAL STATEMENTS 2007 ��
technical provisions. An equity-linked provision forcurrentandfuturebonuses,whichisbetween–10percentand+5percentofthetechnicalprovisions,helpstheinsurancecompaniestocarrytherisksinvolved.Ifapensioninstitution’sequityreturnsdifferfromtheaverage,itmuststillemployitssolvencycapitaltocarrytherisksthatthisinvolves.Whentheaverageequityreturniscalculated,theweightofthelargestpensioninstitutionsislimitedto15percent.
Trendsininvestmentrisksarealsomonitoredus-ing different types of calculation models, a margincalculationsystem,maximumrisklevelmeasurement,solvencyscenariosandVaRanalyses.Theaimistoen-suresecurity,returns,liquidityanddiversificationofassets.On31December2007,assetscoveringtechni-calprovisionsamountedto115percentoftechnicalprovisions.
Operational risksOperationalrisksinvolveadangerofloss,athreattothecontinuityofoperations,orreducedconfidenceinthe company caused by the company’s internal pro-cessesorbyunanticipatedexternalevents.
Thecompanymakeseveryefforttoeliminateanydefects in its supervisionsystemsthatwouldpermitunintentionalorintentionalerrorsormisuseconcern-ingsuchmattersasinsuranceorclaimshandling,in-vestments,reporting,monetarytransactions,registerdetails, data processing, division of work, partners’operations,ordocumentation.
Operationalrisksarechartedonaregularbasisandthepotentialimpactsandlikelihoodofidentifiedrisksareassessedonarisk-specificbasis.IdentifiedrisksarecompiledintoariskchartinwhichrisksareclassifiedonthebasisofanoverallevaluationandinaccordanceoftheirpotentialtothreatenVarma’ssuccessandthegoalsapprovedbytheBoardofDirectors.Acontinuityplanisdrawnupforfunctionsthat,accordingtotheriskchart,mayinvolvesubstantialrisks.Thepreparationoftheplanisatthediscretionofthelinemanagement.
Investment risksMarketrisksmeanthefluctuationofthevalueoftheinvestmentobjects.Thegreatestmarketriskisthatin-volvingequities.Othermarketrisksareinterestraterisk,foreigncurrencyrisk,andtheriskofchangeinthevalueofrealestateobjects.Theinterestrateriskmayberealisedasapricerisk,andearly repaymentofcapitalasreinvestmentrisk.Inflationriskinvolvestheloweringoftheactualvalueorreturnonassets.Creditriskmeansthedangeroflosscausedbythein-abilityofthecounterpartytohonouritscommitments.Inliquidityrisktheactualcashflowdiffersfromwhatwasexpected.Investmentsthatcannotbeconvertedintocashorthatcanonlybeconvertedatasubstantiallosscanalsoconstitutearisk.Modelriskmeansrisksinvolvingriskmeasurements.Whenmeasurementsarecarried out it is necessary to make assumptions andsimplificationsaboutcalculationmethodsandcalcula-tionmaterialthatmaydifferfromreality.
Investment risk management makes use of tech-nical bases and the regulations governing technical
provisionsandsolvency,whichhelpinthemonitoringandreportingofrisks inaccordancewithactualriskpositions. Management of investment risks involvesthedeterminationofacceptablerisklevelswithintheframework approved by the Board of Directors, con-tinuous risk measurement using selected methods,comparisonwithacceptablelevels,andreporting.Riskmanagement also involves continuous adaptation oftheinvestmentportfoliosothatacorrectrisk-returnratiocanbemaintained.Thenatureoftechnicalprovi-sionsandtheirreturnrequirementarealsotakenintoaccount when the time span and liquidity of invest-mentsareconsidered.
TheinvestmentplanapprovedbytheBoardofDirec-tors laysdownthegeneralsecuritygoals for invest-ments,investmentdiversificationandliquiditygoals,andtheprinciplesgoverningthecompany’sforeigncur-rencybusiness.TheBoardofDirectorsassesses,atleastonceayear,therisksinVarma’sinvestmentsinvolvingchangesinvalue,expectedreturns,security,andtheforeigncurrencybusiness,andthecompany’sshort-termandlong-termrisk-bearingcapacityintheareaofinvestmentsandthedevelopmentofthecompany’ssolvencyposition.Whencalculatingitssolvencylimitandcoveringthetechnicalprovisions,Varmatakesintoaccountactualinvestmentrisks.TheBoardofDirectorsmonitors adherence to the investment classificationcriteriaconcerningtechnicalprovisionsandsolvencyandtheimpacttheuseofnon-standardclassificationsandderivativeshaveonthesolvencylimit.
Thebasicallocationoftheinvestmentportfoliolaiddown in the investmentplanapprovedby theBoardofDirectorsalsolaysdownoutthebasiclevelforthetotalportfoliorisk.Theinvestmentportfoliomaydifferfromthebasicallocationwithintheallocationlimitsspecificallydefinedintheinvestmentplan.Everyeffortismadetomaximisereturnexpectationsattheoverallrisk level selected so that the investments generatemaximumreturnswithin thecompany’s risk-bearingcapacity.ActiverisktargetshavebeenlaiddownfordifferentassetcategoriesanditemswithinwhichVarmaismakingactiveinvestmenteffortstoproducereturnsabovethemarketindex.Theportfolio’srealisedmar-ketrisks,activerisksandreturnsgeneratedbyactiveinvestmentsareregularlymonitoredandreportedintheInvestmentOperations.
Thecompanyalsoadheres tosocially responsibleinvestmentallocationprinciplesandshare-ownershipprinciplesinwhichsuchconsiderationsashigh-qualitygovernance and operational transparency of Finnishandforeigncompaniesareusedasimportantinvest-mentcriteria.
The market risk of investments, which mainly in-volvesequities,constitutesthegreatestriskaffectingthe company’s result and solvency. The VaR (Value-At-Risk) figure describing the total risk of Varma’sinvestments,stoodat€956(747)millionattheendof2007.VaRisthemaximumfallinthemarketvalueofthecompany’sinvestmentportfolioinnormalmarketconditionsoccurringoveraperiodofonemonthwithaprobabilityof97.5percent.
Varmaadjustsitstotalinvestmentrisktoitsrisk-
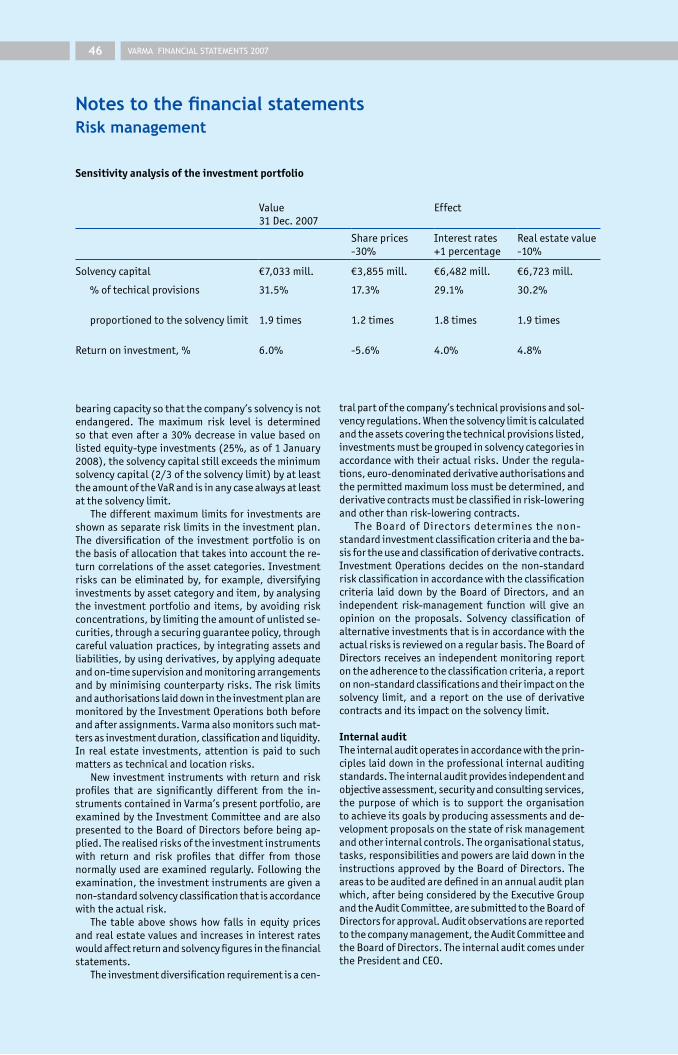
VARMA FINANCIAL STATEMENTS 2007��
bearingcapacitysothatthecompany’ssolvencyisnotendangered. The maximum risk level is determinedsothatevenaftera30%decreaseinvaluebasedonlistedequity-typeinvestments(25%,asof1January2008),thesolvencycapitalstillexceedstheminimumsolvencycapital(2/3ofthesolvencylimit)byatleasttheamountoftheVaRandisinanycasealwaysatleastatthesolvencylimit.
Thedifferentmaximumlimitsforinvestmentsareshownasseparaterisklimitsintheinvestmentplan.The diversification of the investment portfolio is onthebasisofallocationthattakesintoaccountthere-turncorrelationsoftheassetcategories.Investmentriskscanbeeliminatedby, forexample,diversifyinginvestmentsbyassetcategoryanditem,byanalysingthe investmentportfolioand items,byavoidingriskconcentrations,bylimitingtheamountofunlistedse-curities,throughasecuringguaranteepolicy,throughcarefulvaluationpractices,byintegratingassetsandliabilities,byusingderivatives,byapplyingadequateandon-timesupervisionandmonitoringarrangementsandbyminimisingcounterpartyrisks.TherisklimitsandauthorisationslaiddownintheinvestmentplanaremonitoredbytheInvestmentOperationsbothbeforeandafterassignments.Varmaalsomonitorssuchmat-tersasinvestmentduration,classificationandliquidity.Inrealestate investments,attention ispaidtosuchmattersastechnicalandlocationrisks.
Newinvestment instrumentswithreturnandriskprofiles that are significantly different from the in-strumentscontainedinVarma’spresentportfolio,areexaminedbytheInvestmentCommitteeandarealsopresentedtotheBoardofDirectorsbeforebeingap-plied.Therealisedrisksoftheinvestmentinstrumentswith return and risk profiles that differ from thosenormallyusedareexaminedregularly.Followingtheexamination,theinvestmentinstrumentsaregivenanon-standardsolvencyclassificationthatisaccordancewiththeactualrisk.
The table above shows how falls in equity pricesandrealestatevaluesandincreasesininterestrateswouldaffectreturnandsolvencyfiguresinthefinancialstatements.
Theinvestmentdiversificationrequirementisacen-
tralpartofthecompany’stechnicalprovisionsandsol-vencyregulations.Whenthesolvencylimitiscalculatedandtheassetscoveringthetechnicalprovisionslisted,investmentsmustbegroupedinsolvencycategoriesinaccordancewiththeiractualrisks.Undertheregula-tions,euro-denominatedderivativeauthorisationsandthepermittedmaximumlossmustbedetermined,andderivativecontractsmustbeclassifiedinrisk-loweringandotherthanrisk-loweringcontracts.
TheBoardofDirectorsdeterminesthenon-standardinvestmentclassificationcriteriaandtheba-sisfortheuseandclassificationofderivativecontracts.InvestmentOperationsdecideson thenon-standardriskclassificationinaccordancewiththeclassificationcriteria laid down by the Board of Directors, and anindependent risk-management function will give anopinion on the proposals. Solvency classification ofalternativeinvestmentsthatisinaccordancewiththeactualrisksisreviewedonaregularbasis.TheBoardofDirectorsreceivesanindependentmonitoringreportontheadherencetotheclassificationcriteria,areportonnon-standardclassificationsandtheirimpactonthesolvency limit,andareportontheuseofderivativecontractsanditsimpactonthesolvencylimit.
Internal auditTheinternalauditoperatesinaccordancewiththeprin-cipleslaiddownintheprofessionalinternalauditingstandards.Theinternalauditprovidesindependentandobjectiveassessment,securityandconsultingservices,the purpose of which is to support the organisationtoachieveitsgoalsbyproducingassessmentsandde-velopmentproposalsonthestateofriskmanagementandotherinternalcontrols.Theorganisationalstatus,tasks,responsibilitiesandpowersarelaiddownintheinstructionsapprovedbytheBoardofDirectors.Theareastobeauditedaredefinedinanannualauditplanwhich,afterbeingconsideredbytheExecutiveGroupandtheAuditCommittee,aresubmittedtotheBoardofDirectorsforapproval.Auditobservationsarereportedtothecompanymanagement,theAuditCommitteeandtheBoardofDirectors.TheinternalauditcomesunderthePresidentandCEO.
Sensitivity analysis of the investment portfolio
Value31Dec.2007
Effect
Shareprices-30%
Interestrates+1percentage
Realestatevalue-10%
Solvencycapital €7,033mill. €3,855mill. €6,482mill. €6,723mill.
%oftechicalprovisions 31.5% 17.3% 29.1% 30.2%
proportionedtothesolvencylimit 1.9times 1.2times 1.8times 1.9times
Returnoninvestment,% 6.0% -5.6% 4.0% 4.8%
Notes to the financial statements Risk management
VARMA FINANCIAL STATEMENTS 2007 �7
Corporate governance
Varma’sgovernanceisbasedontheFinnishEmployeePension Insurance Companies Act, secondary provi-sions,andtheprovisionsoftheInsuranceCompaniesActandtheCompaniesActmentionedintheEmployeePensionInsuranceCompaniesAct.VarmaalsocompileswiththeapplicableprovisionsoftheCorporateGovern-anceRecommendationforListedCompanies.Varma’scentralexecutiveorgansaretheAnnualGeneralMeet-ing,theSupervisoryBoard,theBoardofDirectorsandthePresidentandCEO.
Policyholdersandthepersonnelemployedbythem(theinsured)areVarma’scustomers.Thepolicyholders,theinsuredandtheguaranteecapitalownershavearighttoparticipateindecision-makingattheAnnual Gen-eral Meeting.
Thetaskofthe Supervisory Board electedbytheAnnualGeneralMeetingistosupervisetheadministrationofthecompanybytheBoardofDirectorsandthePresidentandCEO.TheSupervisoryBoardhas28members,sevenofwhomareelectedontherecommendationoftheElec-tionCommitteemembersrepresentingmajoremployerorganisations,sevenontherecommendationoftheElec-tionCommitteemembersrepresentingmajoremployeeorganisations,andtheremaining14onthejointrec-ommendationoftheElectionCommittee.In2007,theSupervisoryBoardconvenedthreetimes.Theaverageattendancewas65.5%.In2007,anannualremunerationof€5,000waspaidtotheChairoftheSupervisoryBoard,€3,800totheDeputyChairs,and€2,500tothemembers.Themeetingfeewas€300permeeting.
The Board of DirectorsistomanageVarmawithprofes-sional expertise and in accordance with sound busi-nessprinciples.TheBoardofDirectorsmusttakecareofVarma’sadministrationandoperationalorganisationinanappropriatemanner.Varma’sBoardofDirectorscomprises12membersandthreedeputymembers.ThemembersoftheBoardofDirectorsareelectedbytheSupervisoryBoardontherecommendationoftheElec-tionCommittee.ThreeofthemembersandoneofthedeputymembersareelectedontherecommendationoftheElectionCommitteemembersrepresentingmajoremployer organisations and three members and onedeputymemberontherecommendationof theElec-tionCommitteemembersrepresentingmajoremployeeorganisations.OthermembersandonedeputymemberareelectedonthejointrecommendationoftheElec-tionCommittee.
TheBoardofDirectorsconvened12timesin2007.Theaverageattendancewas88.6%,includingattendancebydeputymembers.AllmembersanddeputymembersoftheBoardofDirectorshaveparticipatedinself-assessmentofBoardwork.Duringtheyear,theBoardofDirectorshasworkedontheinvestmentplanandonin-vestmentingeneral,theorganisationofinterncontrolandriskmanagement,technicalbases,thestrategyandthemanagementandincentivesystemsofthecompany,thedevelopmentofthecompany’scorefunctions,andoperatingcost-effectiveness.
TheAuditCommitteesupervises,amongotherthings,thecompany’sfinancialandotherreporting,andthestatus of internal control. The Committee convenedtwicein2007.Themainissuesdiscussedwereriskman-agement,investmentsandtheAuditors’reportandthereport on the internal audit. The Compensation andAppointmentCommitteedevelopsfortheapprovaloftheBoardofDirectorsboththecompany’s incentivesystemandthegeneralprinciplesofrewardingman-agement.TheCommitteeconvenedtwicein2007.TheElectionCommitteedrawsupproposalsforthemembersof theBoardofDirectorsandtheSupervisoryBoardandtheirremunerations.TheElectionCommitteemettwiceduringtheyear.
In2007,anannualfeeof€22,000waspaidtotheChair,€16,500totheDeputyChair,€11,000tothemembers,and€8,000tothedeputymembers.Themeetingfeewas€450permeetingtotheChair,€400totheDeputyChairs,and€300tothemembersanddeputymembers.MeetingfeesforthemembersoftheCommitteeswerethesameasthosepaidtotheBoardmembers.TherearenomembersoftheExecutiveGroupontheVarmaBoardofDirectors.NoneofthemembersoftheBoardhavehadanemploymentrelationshipwithVarmain2007or inthetwoprecedingyears,nordoesanymemberreceivecompensationfromVarmaforservicesunrelatedtotheBoard’sFunctions.
The President and CEOisinchargeofVarma’scurrentadministrationasadvisedbytheBoardofDirectors.ThePresidentandCEOisassistedinhistaskofmanagingthecompanybytheExecutive Group,whichcomprisesthePresidentandCEOandeightmanagementrepresenta-tivesandtwoemployeerepresentatives.TheBoardofDirectorsdecidesonthesalariesandbenefitsofthePresidentandCEO,ExecutiveVice-President,andex-ecutivesappointedbytheBoardofDirectors.In2007theremunerationsandfringebenefitsreceivedbythePresidentandCEOtotalled€638,554.Heissettoretireattheageof60andhispensionwillamountto60%ofthecalculatedpensionablesalary.ThePresidentandCEO’s period of notice is six months, in addition towhichheisentitledtoacompensationamountingtosixmonths’salary.TheremunerationsandfringebenefitsoftheExecutiveVice-Presidenttotalled€346,949andhisretirementageis60years.Themaximummanage-mentperformance-basedreward,approvedeachyear,correspondto2–6months’salary.However,themaxi-mumrewardgrantedtothePresidentandCEOcorre-spondstoninemonths’salaryandthemaximumrewardgrantedtotheChiefInvestmentOfficercorrespondsto18months’salary.
Auditors’ remuneration
In2007,theremunerationpaidtoauditorsamountedto€216,000(210,000).Inaddition,theauditingcompa-nieswerepaid€29,000(43,000)inconsultationfees,thatisatotalof€245,000(253,000).

VARMA FINANCIAL STATEMENTS 2007��
Notes to the financial statements
Summary
Key figures and analyses
2007 2006 2005 2004 2003
Premiumswritten,€million 3,146.8 2,983.3 2,763.9 2,614.8 2,454.7
Pensionandotherpaymentsmade,€million1) 2,749.5 2,556.3 2,400.8 2,277.3 2,182.1
Netinvestmentincomeatfairvalue,€million 1,632.1 2,329.8 2,507.0 1,575.9 1,460.0
Returnoninvestedcapital,% 6.0 9.4 11.6 8.0 8.1
Turnover,€million 4,670.6 4,624.8 3,834.5 3,604.5 3,749.3
Totaloperatingexpenses,€million 99.7 104.3 96.3 91.0 84.0
ofturnover,% 2.1 2.3 2.5 2.5 2.2
Operatingexpensescoveredbytheexpenseloadingincludedininsurancecontributions 75.6 73.4 70.7 66.4 64.2
ofTyELandYELpayroll,% 0.5 0.5 0.5 0.5 0.6
Totalresult,€million 495.2 1,120.7 1,681.0 877.9 909.8
Technicalprovisions,€million 25,571.1 23,774.3 21,824.1 20,028.5 18,811.9
Solvencycapital,€million 7,032.7 6,665.7 5,599.3 3,986.3 3,193.4
oftechnicalprovision,%2) 31.5 32.1 29.2 22.8 19.4
inrelationtosolvencylimit 1.9 2.1 2.4 2.4 2.1
Equalisationprovision,€million 938.3 910.4 947.0 906.9 860.3
Pensionassets,€million3) 29,292.3 27,378.0 24,727.6 21,491.0 19,670.6
TransfertoclientbonusesofTyELpayroll,% 0.6 0.6 0.7 0.4 0.3
TyELpayroll,€million 14,388.7 13,402.2 12,275.4 11,784.2 11,045.7
YELpayroll,€million 669.1 648.3 620.0 597.7 579.0
TyELpolicies4) 26,300 25,200 25,200 25,600 25,300
TyELinsuredpersons 447,000 426,100 408,600 406,400 393,000
YELpolicies 37,300 37,400 36,700 36,300 36,000
Pensioners 302,100 296,400 293,000 285,600 284,000
1)Claimspaidinincomestatementexcludingcostsforoperationsrelatingtocompensationsandworkingcapacitymaintenance2)Ratiocalculatedasapercentageofthetechnicalprovisionsusedincalculatingthesolvencylimit3)Technicalprovisions+valuationdifferences 4)Policieswrittenbyemployerswithinsurancecontracts
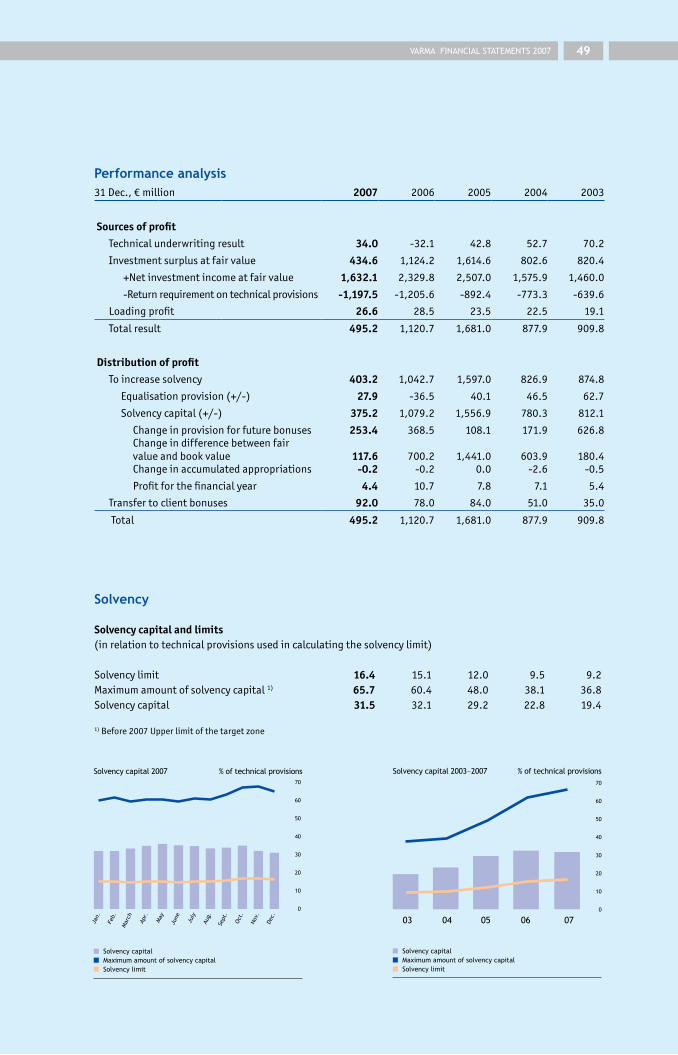
VARMA FINANCIAL STATEMENTS 2007 ��
Performance analysis 31Dec.,€million 2007 2006 2005 2004 2003
Sources of profitTechnicalunderwritingresult 34.0 -32.1 42.8 52.7 70.2
Investmentsurplusatfairvalue 434.6 1,124.2 1,614.6 802.6 820.4
+Netinvestmentincomeatfairvalue 1,632.1 2,329.8 2,507.0 1,575.9 1,460.0
-Returnrequirementontechnicalprovisions -1,197.5 -1,205.6 -892.4 -773.3 -639.6
Loadingprofit 26.6 28.5 23.5 22.5 19.1
Totalresult 495.2 1,120.7 1,681.0 877.9 909.8
Distribution of profitToincreasesolvency 403.2 1,042.7 1,597.0 826.9 874.8
Equalisationprovision(+/-) 27.9 -36.5 40.1 46.5 62.7
Solvencycapital(+/-) 375.2 1,079.2 1,556.9 780.3 812.1
Changeinprovisionforfuturebonuses 253.4 368.5 108.1 171.9 626.8Changeindifferencebetweenfairvalueandbookvalue 117.6 700.2 1,441.0 603.9 180.4Changeinaccumulatedappropriations -0.2 -0.2 0.0 -2.6 -0.5
Profitforthefinancialyear 4.4 10.7 7.8 7.1 5.4
Transfertoclientbonuses 92.0 78.0 84.0 51.0 35.0
Total 495.2 1,120.7 1,681.0 877.9 909.8
Solvency
Solvency capital and limits (inrelationtotechnicalprovisionsusedincalculatingthesolvencylimit)
Solvencylimit 16.4 15.1 12.0 9.5 9.2Maximumamountofsolvencycapital1) 65.7 60.4 48.0 38.1 36.8Solvencycapital 31.5 32.1 29.2 22.8 19.4
1)Before2007Upperlimitofthetargetzone
Solvency capital 2003–2007 % of technical provisions70
60
50
40
30
20
10
0
03 04 05 06 07
Solvency capitalMaximum amount of solvency capitalSolvency limit
Solvency capital 2007 % of technical provisions70
60
50
40
30
20
10
0
May
June
July
Aug.
Sept
.
Oct
.
Dec.
Apr.
Mar
ch
Feb.
Jan.
Nov
.
Solvency capitalMaximum amount of solvency capitalSolvency limit

VARMA FINANCIAL STATEMENTS 2007�0
Notes to the financial statements Key figures and analyses
Investment allocation at fair value 2007 2006 2005 2004 2003
€ mill. % €mill. % €mill. % €mill. % €mill. %
Loanreceivables1) 1,021.4 3.6 930.6 3.5 953.7 3.9 1,089.5 5.1 1,222.1 6.3Bonds1)2) 8,337.3 29.3 10,373.5 38.6 11,569.9 47.0 11,240.9 52.9 10,891.0 56.0*includesfixed-incomefunds 172.1 245.9 240.8 140.6
Othermoney-market
instrumentsanddeposits1)2)3) 955.4 3.4 389.2 1.4 619.9 2.5 838.3 3.9 142.5 0.7*includesfixed-incomefunds 47.0Sharesandparticipations 14,849.1 52.3 12,428.4 46.3 8,761.4 35.6 5,476.5 25.8 4,683.2 24.1Realestate4) 3,255.1 11.5 2,736.7 10.2 2,715.9 11.0 2,587.2 12.2 2,520.1 13.0*includesinvestmentstrustsandundertakingsforcollectiveinvestmentintransferablesecurities(UCITS) 343.1 227.0 54.4 14.7Totalinvestments 28,418.2 100.0 26,858.4 100.0 24,620.8 100.0 21,232.6 100.0 19,459.0 100.0
Modifieddurationofthebondportfolio 4.901)Accruedinterestincluded2)Offixed-incomefunds,long-termfundsareincludedinbondsandshort-termfundsinothermoney-marketinstruments3)Includesdepositsincludedininvestmentsinbalancesheet 4)IncludessharesininvestmenttrustsandinvestmentsincomparableUCITSfundsinvestinginrealestateandrealestatecommunities
Investment return specification and surplus
€million 2007 2006 2005 2004 2003
Direct net income 1,007.2 899.6 885.8 948.0 795.0Loanreceivables 49.6 44.0 43.4 55.6 56.0Bonds 362.1 431.5 479.8 476.7 505.3Othermoney-marketinstrumentsanddeposits 45.1 17.8 12.0 10.3 6.0Sharesandparticipations 438.4 277.6 208.3 294.3 119.9Realestate 139.6 155.8 153.7 132.0 123.1Unallocatedincome,costsandoperatingexpensesfrominvestmentactivities -27.6 -27.1 -11.3 -20.8 -15.2
Changes in book value 1) 507.3 730.0 172.1 13.7 485.4Sharesandparticipations 513.2 683.6 176.0 254.2 252.3Bonds 10.0 37.8 22.8 -203.4 253.8Realestate -15.9 8.7 -26.7 -37.1 -20.7Net investment income booked 1,514.6 1,629.6 1,057.8 961.8 1,280.4
Change in difference between fair value and book value 2) 117.6 700.2 1,441.0 603.9 180.4
Sharesandparticipations 255.9 1,039.7 1,402.8 306.9 255.1Bonds -297.6 -384.5 10.0 263.9 -103.5Realestate 159.3 45.0 27.5 33.5 29.6Otherinvestments 0.0 0.1 0.7 -0.3 -0.8Net investment income at fair value 1,632.1 2,329.8 2,498.8 1,565.7 1,460.8Return requirement on technical provision 1,197.5 1,205.6 892.4 773.3 639.6Investment surplus, book value 317.1 424.0 173.6 198.7 640.0Investment surplus at fair value 434.6 1,124.2 1,614.6 802.6 820.4Share of net investment income accounted for by derivatives 3) 631.4 290.5 -309.9 -157.7 161.5
1)Capitalgainsandlossesandotherchangesinbookvalue2)Changesinbookvaluenotincludedinthebalancesheet3)Includescurrencyhedges
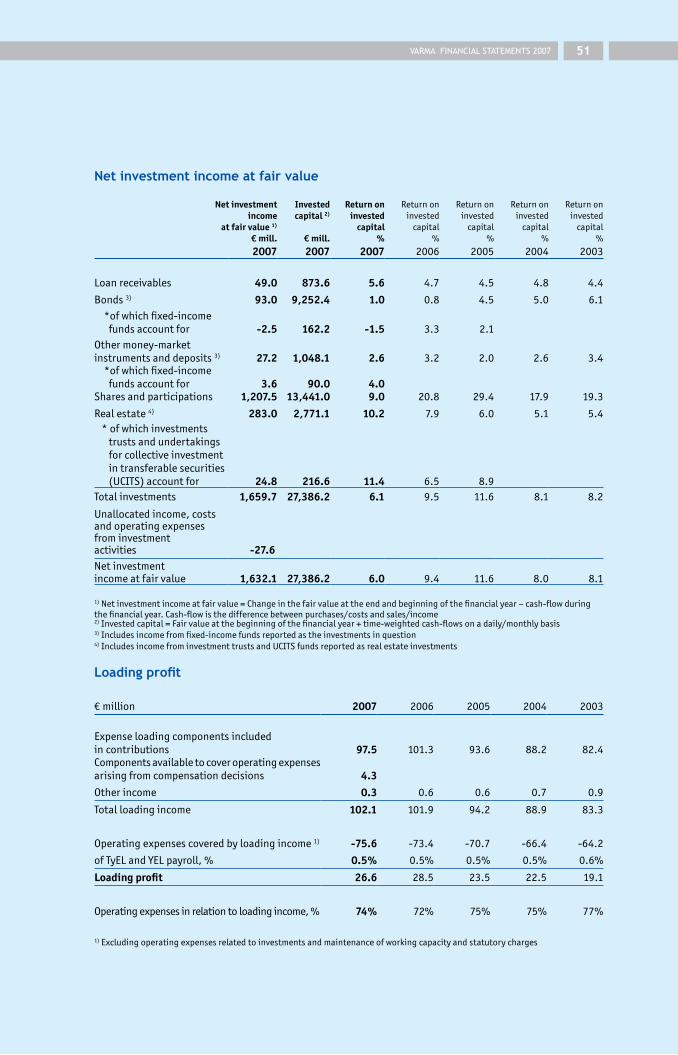
VARMA FINANCIAL STATEMENTS 2007 �1
Net investment income at fair value
Net investment Invested Return on Returnon Returnon Returnon Returnonincome capital 2) invested invested invested invested invested
at fair value 1) capital capital capital capital capital € mill. € mill. % % % % %
2007 2007 2007 2006 2005 2004 2003
Loanreceivables 49.0 873.6 5.6 4.7 4.5 4.8 4.4
Bonds3) 93.0 9,252.4 1.0 0.8 4.5 5.0 6.1
*ofwhichfixed-incomefundsaccountfor -2.5 162.2 -1.5 3.3 2.1Othermoney-marketinstrumentsanddeposits3) 27.2 1,048.1 2.6 3.2 2.0 2.6 3.4*ofwhichfixed-incomefundsaccountfor 3.6 90.0 4.0Sharesandparticipations 1,207.5 13,441.0 9.0 20.8 29.4 17.9 19.3
Realestate4) 283.0 2,771.1 10.2 7.9 6.0 5.1 5.4*ofwhichinvestmentstrustsandundertakingsforcollectiveinvestmentintransferablesecurities(UCITS)accountfor 24.8 216.6 11.4 6.5 8.9Totalinvestments 1,659.7 27,386.2 6.1 9.5 11.6 8.1 8.2
Unallocatedincome,costsandoperatingexpensesfrominvestmentactivities-27.6Netinvestmentincomeatfairvalue 1,632.1 27,386.2 6.0 9.4 11.6 8.0 8.1
1)Netinvestmentincomeatfairvalue=Changeinthefairvalueattheendandbeginningofthefinancialyear–cash-flowduringthefinancialyear.Cash-flowisthedifferencebetweenpurchases/costsandsales/income 2)Investedcapital=Fairvalueatthebeginningofthefinancialyear+time-weightedcash-flowsonadaily/monthlybasis3)Includesincomefromfixed-incomefundsreportedastheinvestmentsinquestion4)IncludesincomefrominvestmenttrustsandUCITSfundsreportedasrealestateinvestments
Loading profit
€million 2007 2006 2005 2004 2003
Expenseloadingcomponentsincludedincontributions 97.5 101.3 93.6 88.2 82.4Componentsavailabletocoveroperatingexpensesarisingfromcompensationdecisions 4.3Otherincome 0.3 0.6 0.6 0.7 0.9
Totalloadingincome 102.1 101.9 94.2 88.9 83.3
Operatingexpensescoveredbyloadingincome1) -75.6 -73.4 -70.7 -66.4 -64.2
ofTyELandYELpayroll,% 0.5% 0.5% 0.5% 0.5% 0.6%
Loading profit 26.6 28.5 23.5 22.5 19.1
Operatingexpensesinrelationtoloadingincome,% 74% 72% 75% 75% 77%
1)Excludingoperatingexpensesrelatedtoinvestmentsandmaintenanceofworkingcapacityandstatutorycharges
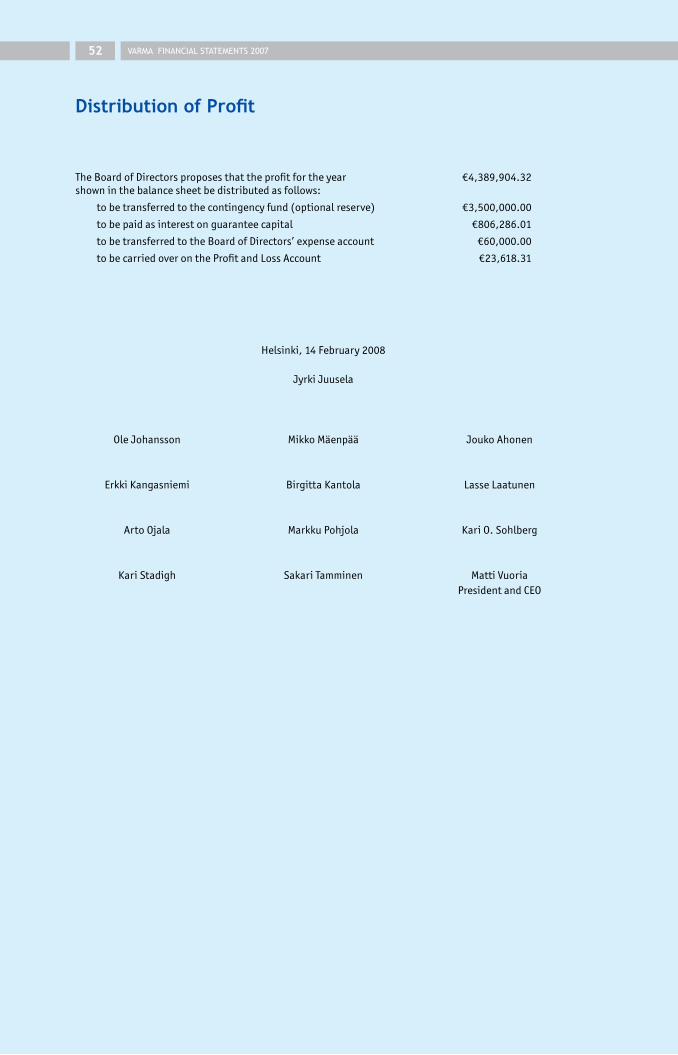
VARMA FINANCIAL STATEMENTS 2007�2
Distribution of Profit
Helsinki,14February2008
JyrkiJuusela
OleJohansson MikkoMäenpää JoukoAhonen
ErkkiKangasniemi BirgittaKantola LasseLaatunen
ArtoOjala MarkkuPohjola KariO.Sohlberg
KariStadigh SakariTamminen MattiVuoriaPresidentandCEO
TheBoardofDirectorsproposesthattheprofitfortheyearshowninthebalancesheetbedistributedasfollows:
€4,389,904.32
tobetransferredtothecontingencyfund(optionalreserve) €3,500,000.00
tobepaidasinterestonguaranteecapital €806,286.01
tobetransferredtotheBoardofDirectors’expenseaccount €60,000.00
tobecarriedoverontheProfitandLossAccount €23,618.31
VARMA FINANCIAL STATEMENTS 2007 ��
Distribution of Profit Auditors’ Report
Statement by the Supervisory Board
TotheownersofVarmaMutualPensionInsuranceCompany
Wehaveauditedtheaccountingrecords,thereportoftheBoardofDirectors,thefinancialstatementsandtheadministrationofVarmaMutualPensionInsuranceCompanyforthefinancialyearfrom1Januaryto31December2007.TheBoardofDirectorsandtheMan-agingDirectorhavepreparedthereportoftheBoardof Directors and the financial statements,which in-cludetheconsolidatedandparentcompany’sbalancesheets,incomestatements,statementsofsourceandapplicationoffunds,andnotestothefinancialstate-ments.Basedonourauditweexpressanopiniononthesefinancialstatements,aswellasonthereportoftheBoardofDirectorsandonthepensioninsurancecompany’sadministration.
Asupervisoryauditor’sreportdated18February2008hasbeenissuedonthesupervisoryauditcarriedoutunderthesupervisionofRaija-LeenaHankonen,Au-thorisedPublicAccountant.
WehaveconductedtheauditinaccordancewithFinnishStandardsonAuditing.Thosestandardsrequirethatweperformtheaudittoobtainreasonableassuranceofwhether thereportof theBoardofDirectorsandthefinancialstatementsarefreeofmaterialmisstate-ment.Anauditincludesexaminingonatestbasisevi-dencesupportingtheamountsanddisclosuresinthefinancialstatements,assessingtheoverallaccountingprinciplesusedandsignificantestimatesmadebythemanagementaswellasevaluatingtheoverallfinancial
statementspresentation.ThepurposeofourauditofadministrationistoexaminethatthemembersoftheSupervisoryBoard,BoardofDirectorsandtheManag-ingDirectorhavelegallycompliedwiththerulesoftheInsuranceCompaniesActandtheEmployeePensionInsuranceCompaniesAct.
Inouropinion,thereportoftheBoardofDirectorsandthefinancialstatementshavebeenprepared inaccordancewiththeFinnishAccountingActandoth-er rules and regulations governing the preparationoffinancialstatementsinFinland.ThereportoftheBoardofDirectorsandthefinancialstatementsgiveatrueandfairview,asdefinedintheAccountingAct,ofboththeconsolidatedandparentcompany’sresultofoperationsaswellasofthefinancialposition.ThereportoftheBoardofDirectorsisconsistentwiththefinancialstatements.ThefinancialstatementswiththeconsolidatedfinancialstatementscanbeadoptedandthemembersoftheSupervisoryBoard,theBoardofDirectorsandtheManagingDirectorof thepensioninsurance company can be discharged from liabilityfor the periodauditedbyus. Theproposalmade bytheBoardofDirectorsregardingthedistributionofprofit is in compliance with the Finnish InsuranceCompaniesAct.
Helsinki,28February2008
Raija-LeenaHankonen JaakkoNymanAuthorised AuthorisedPublicAccountant PublicAccountant
TheSupervisoryBoardhastodayreceivedthefinan-cialstatementsforVarmaMutualPensionInsuranceCompanyforthefinancialyear2007,togetherwiththeconsolidatedfinancialstatementsandauditors’reportconcerningthese
TheSupervisoryBoardstatestotheAnnualGeneralMeetingthatithasfoundnocauseforcriticismcon-cerningthefinancialstatements,consolidatedfinan-cial statements, report of the Board of Directors orauditors’report.
TheSupervisoryBoardrecommendsthattheBoardofDirectors’proposal for thedistributionof theprofitforthefinancialyearbeaccepted.
Helsinki,6March2008
FortheSupervisoryBoard
JukkaHärmäläVicechairmanoftheSupervisoryBoard

VARMA FINANCIAL STATEMENTS 2007��
Notes
....................................................................................................................................................................................................
....................................................................................................................................................................................................
....................................................................................................................................................................................................
....................................................................................................................................................................................................
....................................................................................................................................................................................................
....................................................................................................................................................................................................
....................................................................................................................................................................................................
....................................................................................................................................................................................................
....................................................................................................................................................................................................
....................................................................................................................................................................................................
....................................................................................................................................................................................................
....................................................................................................................................................................................................
....................................................................................................................................................................................................
....................................................................................................................................................................................................
....................................................................................................................................................................................................
....................................................................................................................................................................................................
....................................................................................................................................................................................................
....................................................................................................................................................................................................
....................................................................................................................................................................................................
....................................................................................................................................................................................................
....................................................................................................................................................................................................
....................................................................................................................................................................................................
....................................................................................................................................................................................................
....................................................................................................................................................................................................
....................................................................................................................................................................................................
....................................................................................................................................................................................................
....................................................................................................................................................................................................
....................................................................................................................................................................................................
....................................................................................................................................................................................................
....................................................................................................................................................................................................
....................................................................................................................................................................................................
....................................................................................................................................................................................................
....................................................................................................................................................................................................
....................................................................................................................................................................................................

VARMA FINANCIAL STATEMENTS 2007 ��
....................................................................................................................................................................................................
....................................................................................................................................................................................................
....................................................................................................................................................................................................
....................................................................................................................................................................................................
....................................................................................................................................................................................................
....................................................................................................................................................................................................
....................................................................................................................................................................................................
....................................................................................................................................................................................................
....................................................................................................................................................................................................
....................................................................................................................................................................................................
....................................................................................................................................................................................................
....................................................................................................................................................................................................
....................................................................................................................................................................................................
....................................................................................................................................................................................................
....................................................................................................................................................................................................
....................................................................................................................................................................................................
....................................................................................................................................................................................................
....................................................................................................................................................................................................
....................................................................................................................................................................................................
....................................................................................................................................................................................................
....................................................................................................................................................................................................
....................................................................................................................................................................................................
....................................................................................................................................................................................................
....................................................................................................................................................................................................
....................................................................................................................................................................................................
....................................................................................................................................................................................................
....................................................................................................................................................................................................
....................................................................................................................................................................................................
....................................................................................................................................................................................................
....................................................................................................................................................................................................
....................................................................................................................................................................................................
....................................................................................................................................................................................................
....................................................................................................................................................................................................
....................................................................................................................................................................................................

Varma Mutual Pension Insurance Company
Telephone +358 (0)10 515 13
Postal address PO Box 1, FI-00098 VARMA
Visiting address Annankatu 18, Helsinki
Domicile Helsinki, Finland
Business ID 0533297-9
Internet www.varma.fi