VARIATION OF MECHANICAL PROPERTIES IN LARGE …dtic.mil/dtic/tr/fulltext/u2/a025807.pdf ·...
68
*D i*r-9>r 5 0712 01016784 8 WVT-TR-75019 TECHNICAL _ LIBRARY VARIATION OF MECHANICAL PROPERTIES IN LARGE STEEL FORGINGS BENET WEAPONS LABORATORY WATERVLIET ARSENAL WATERVLIET. N.Y. 12189 'APRIL 1975. CHNICAL R^HH AMCMS No. 3297.16.7029 Pron No. Ml-2-23055(03)-M7-M7 APPROVED FOR PUBLIC RELEASE. DISTRIBUTION UNLIMITED
Transcript of VARIATION OF MECHANICAL PROPERTIES IN LARGE …dtic.mil/dtic/tr/fulltext/u2/a025807.pdf ·...

*D i*r-9>r 5 0712 01016784 8 WVT-TR-75019
TECHNICAL _ LIBRARY
VARIATION OF MECHANICAL PROPERTIES
IN LARGE STEEL FORGINGS
BENET WEAPONS LABORATORY WATERVLIET ARSENAL
WATERVLIET. N.Y. 12189
'APRIL 1975.
■CHNICAL R^HH
AMCMS No. 3297.16.7029
Pron No. Ml-2-23055(03)-M7-M7
APPROVED FOR PUBLIC RELEASE. DISTRIBUTION UNLIMITED

DISPOSITION
Destroy this report when it is no longer needed. Do not return it
to the originator.
DISCLAIMER
The findings in this report are not to be construed as an official
Department of the Army position unless so designated by other authorized
documents.

UNCLASSIFIED
SECURITY CLASSIFICATION OF THIS PACE (Whin Dmlm Bntmrmd)
REPORT DOCUMENTATION PAGE READ INSTRUCTIONS BEFORE COMPLETING FORM
1. REPORT NUMBER
WVT-TR-75019 2. 30VT ACCESSION NO 3. RECIPIENT'S CATALOG NUMBER
4. TITLE (mnd Subtlllo)
VARIATION OF MECHANICAL PROPERTIES IN LARGE STEEL FORGINGS
S. TYPE OF REPORT A PERIOD COVERED
6. PERFORMING ORG. REPORT NUMBER
7. AUTHOR^ Peter Thornton Vito J. Colangelo
8. CONTRACT OR GRANT NUMBERS
9- PERFORMING ORGANIZATION NAME AND ADDRESS
Benet Weapons Laboratory Watervliet Arsenal, Watervliet, NY 12189 SARWV-RDT
10. PROGRAM ELEMENT. PROJECT, TASK AREA A WORK UNIT NUMBERS
AMCMS No. 3297.16.7029 Pron No. Ml-2-23055(03)-M7-M7
It« CONTROLLING OFFICE NAME AND ADDRESS
U.S. Army Armament Command Rock Island, IL 61201
12. REPORT DATE
April 1975 13. NUMBER OF PAGES
J&2- 14. MONITORING AGENCY NAME ft AODRESSff/ dltfermnt from Controlling Ottlc») IS. SECURITY CLASS, (at thlm report)
Unciassifi fi£d TION/D IS*. DECLASSIFICATION/DOWNGRADING
SCHEDULE
16. DISTRIBUTION STATEMENT (ol thlm Report)
Approved for public release; distribution unlimited.
17. DISTRIBUTION STATEMENT (ol thm »bmtrmct mnfrod In Block 20, II dlttmrmnt from Report)
18. SUPPLEMENTARY NOTES
19. KEY WORDS (Contlnum on rmvorm» mid» II nocmmmmry mnd Identity by block number.)
Forging Mechanical Working Chemical Segregation Mechanical Properties Variations
Inclusions Carbon Guns Barrels Metallurgy
20. ABSTRACT (Contlnum on rmvrt» aldo It nmcommmry mnd Idmntity by block number)
In a continuing effort to determine the causes of mechanical property variation in large steel forgings, the effects of forging reduction on mechan- ical and metallurgical properties were examined. The related work previously conducted at Watervliet has been appropriately summarized in a recent report, WVT-TR-74001.
The present study deals specifically with the metallurgical consequence^ of solidification and mechanical working. Accordingly, the aspects of fSEE REVERSE SIDE1 |
DO ,5 FORM AN 73 1473 EDITION OF 1 NOV 65 IS OBSOLETE UNCLASSIFIED SECURITY CLASSIFICATION OF THIS PAGE (Whon Datm Entered)

UNCLASSIFIED SECURITY CLASSIFICATION OF THIS PAGEfWhmn Dmtm Entered)
BLOCK NO. 20 ABSTRACT (Continued)
nonmetallic inclusions, chemical homogeneity and microstructure were considered. For the range of forging reductions investigated (1.5:1 - 10:1)> a
reduction ratio of approximately 3:1 produced optimum average values in % RA, Charpy impact strength and fracture toughness. Also, the significant variations statistically determined in these parameters was accompanied by real variation in carbon concentration. Therefore, carbon segregation on a macroscale, is shown to be a major contributor to mechanical property variation in large steel forgings.
UNCLASSIFIED SECURITY CLASSIFICATION OF THIS PAGEfWhen Data Entered)

WVT-TR-75019 AD
VARIATION OF MECHANICAL PROPERTIES
IN LARGE STEEL FORGINGS
PETER THORNTON
VITO J. COLANGELO
BENET WEAPONS LABORATORY WATERVLIET ARSENAL
WATERVLIET, N.Y. 12189
APRIL 1975
TECHNICAL REPORT
AMCMS No. 3297.16.7029
Pron No. Ml-2-23055(03)-M7-M7
APPROVED FOR PUBLIC RELEASE DISTRIBUTION UNLIMITED

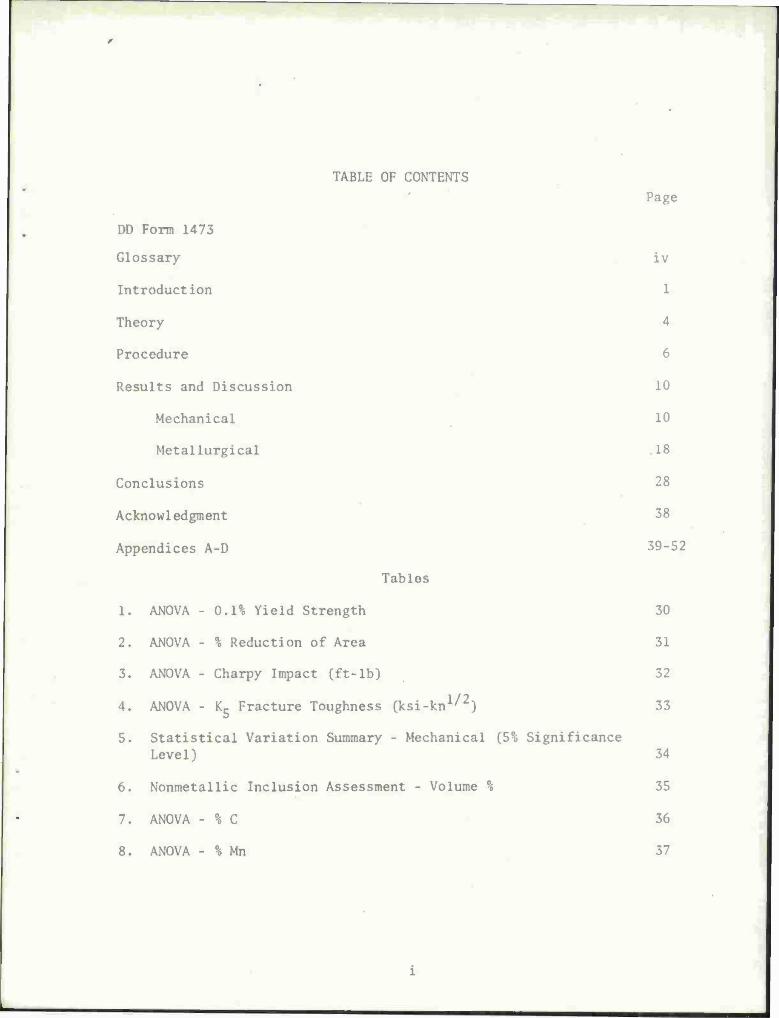
TABLE OF CONTENTS
DD Form 1473
Glossary
Introduction
Theory
Procedure
Results and Discussion
Mechanical
Metallurgical
Conclusions
Acknowledgment
Appendices A-D
Tables
1. ANOVA - 0.1% Yield Strength
2. ANOVA - % Reduction of Area
3. ANOVA - Charpy Impact (ft-lb)
4. ANOVA - K5 Fracture Toughness (ksi-kn1/2)
5. Statistical Variation Summary - Mechanical (5% Significance Level)
6. Nonmetallic Inclusion Assessment - Volume %
7. ANOVA - % C
8. ANOVA - % Mn
Page
iv
1
4
6
10
10
.18
28
38
39-52
30
31
32
33
34
35
36
37
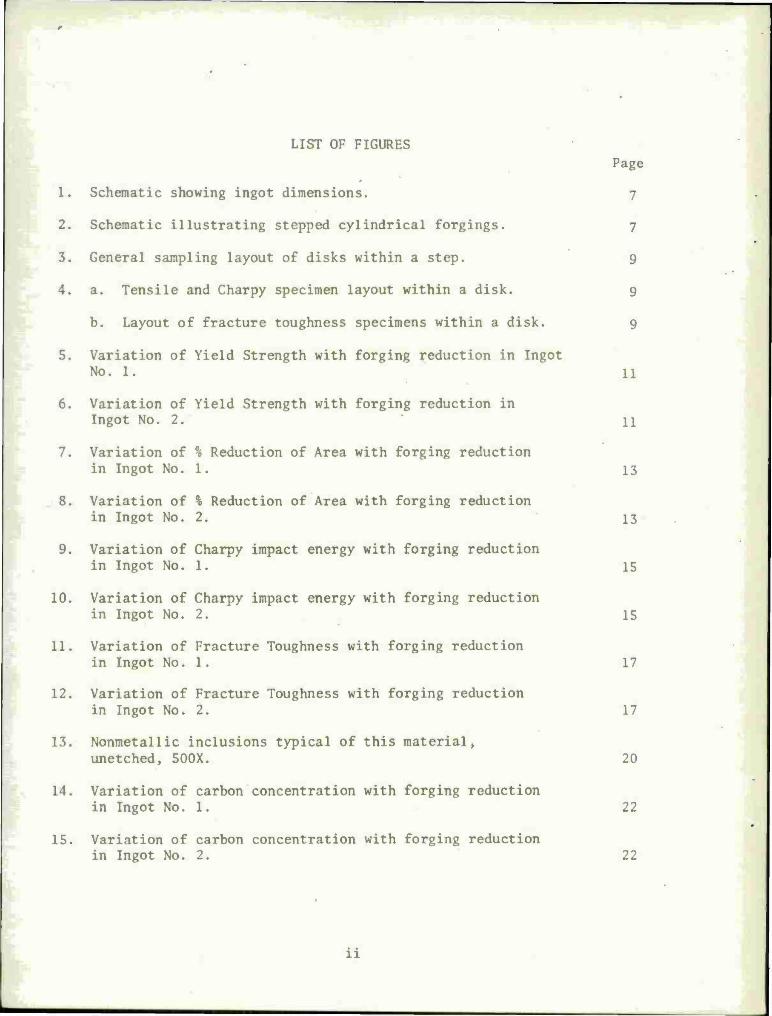
LIST OF FIGURES
Page
1. Schematic showing ingot dimensions. 7
2. Schematic illustrating stepped cylindrical forgings. 7
3. General sampling layout of disks within a step. 9
4. a. Tensile and Charpy specimen layout within a disk. 9
b. Layout of fracture toughness specimens within a disk. 9
5. Variation of Yield Strength with forging reduction in Ingot No. 1. 11
6. Variation of Yield Strength with forging reduction in Ingot No. 2. 11
7. Variation of % Reduction of Area with forging reduction in Ingot No. 1. 13
8. Variation of % Reduction of Area with forging reduction in Ingot No. 2. 13
9. Variation of Charpy impact energy with forging reduction in Ingot No. 1. 15
10. Variation of Charpy impact energy with forging reduction in Ingot No. 2. 15
11. Variation of Fracture Toughness with forging reduction in Ingot No. 1. 17
12. Variation of Fracture Toughness with forging reduction in Ingot No. 2. 17
13. Nonmetallic inclusions typical of this material, unetched, 500X. 20
14. Variation of carbon concentration with forging reduction in Ingot No. 1. 22
15. Variation of carbon concentration with forging reduction in Ingot No. 2. 22
11

Page
16. Variation of carbon concentration transverse to forging direction. 23 Fictitious ID approximates a bore surface in a gun tube. Step 1, Ingot 1.
17. Variation of carbon concentration transverse to forging 23 direction. Fictitious ID approximates a bore surface in a gun tube. Step 2, Ingot 1.
18. Variation of carbon concentration transverse to forging 24 direction. Fictitious ID approximates a bore surface in a gun tube. Step 3, Ingot 1.
19. Variation of carbon concentration transverse to forging 24 direction. Fictitious ID approximates a bore surface in a gun tube. Step 4, Ingot 1.
20. Variation of carbon concentration transverse to forging 25 direction. Fictitious ID approximates a bore surface in a gun tube. Step 1, Ingot 2.
21. Variation of carbon concentration transverse to forging 25 direction. Fictitious ID approximates a bore surface in a gun tube. Step 2, Ingot 2.
22. Variation of carbon concentration transverse to forging 26 direction. Fictitious ID approximates a bore surface in a gun tube. Step 3, Ingot 2.
23. Variation of carbon concentration transverse to forging 26 direction. Fictitious ID approximates a bore surface in a gun tube. Step 4, Ingot 2.
in

GLOSSARY
ANOVA
<r 2
s2
F
S.S.
M.S.
YS
UTS
El
RA
Cv
KIr
*5
D.F.
Analysis of Variance
Variance (universe)
Estimate of variance
Ratio of mean square in question to error mean square
Sum of squares
Mean Square
Yield Strength (ksi)
Ultimate Tensile Strength (ksi)
Elongation (%)
Reduction of Area (%)
Charpy Impact (ft-lb)
Plane Strain Fracture Toughness (Mode I Loading)
Fracture Toughness (at 5% Secant)
Degrees of Freedom
iv
J

INTRODUCTION
The variations encountered in mechanical properties of large steel
forgings have been a particularly troublesome problem for many years.
These aberrations are frequently responsible for high rejection rates,
and also contribute to the failure of structural components throughout
a broad spectrum of the steel making and steel fabricating industry.
As early as 1918, Georges Charpy concluded that the amount of de-
formation undergone at high temperature by a block of steel affects
the properties of the metal according to a complex law which involves
the initial stage of the ingot and all the subsequent deformations.
The chief characteristic of the deformation is to create strongly marked
heterogeneity. Moreover, he states that general rules are impossible
to apply to all forgings. For components operating under applied
transverse stresses, such as guns, longitudinal forging has an undoubtedly
injurious effect upon mechanical properties required for performance.
Post World War II studies of the transverse mechanical properties
in heat treated wrought steel products by Wells and Mehl2 demonstrated
that variation of quality (measured by Reduction in Area) within solid
forgings or tubes was much higher than generally recognized. A maximum
to minimum difference among 250 values for specimens taken from a single
forging was rarely less than 18% (RA), e.g., 30% RA minimum and 48% RA
maximum. Frequently, the differences amounted to 30% RA and occasionally
40% RA or higher.
1. Charpy, G., The Iron Age, April 24, 1919, p. 1079. 2. Wells, C. and Mehl, R.F., Trans. ASM, vol. 41, 1949, p. 715.

Appropriately enough, they also concluded that comparable size
tubes from a similar position in ingots cast from a single heat, usually
have about the same transverse RA quality. The quality of tubes coming
from the bottom thirds of ingots is generally slightly lower and occa-
sionally much lower than that of tubes coming from the middle or top
thirds of ingots. The implication drawn from this determination is
that solidification of the "primary casting" can affect the final properties
of the finished forging. Furthermore, these investigations concluded
that elongated nonmetallic inclusions and the heterogeneous distribution
of chemical elements in solution are together largely responsible for
the transverse ductility of forgings being lower than longitudinal
ductility.
More recently, several studies have been primarily concerned with the
variations in mechanical properties of low alloy steel forgings. The
significant findings of the first investigation (conducted on 38 gun
tubes) demonstrated that tensile ductility, Charpy impact energy and
fracture toughness (pre-cracked Charpy) varied considerably within a
single tube, within a disc from that tube, within a vendor's practice
and from vendor to vendor-*. Following this sweeping revelation, another
study attempted to determine the level and reproducibility of mechanical
properties in present gun tube material, quenched to a uniform micro-
structure of 100% martensite and tempered to yield strength ranges of
140-160 ksi and 160-180 ksi . The most important fact disclosed by this
3. Slawsky, M.L., Heiser, F.A. and Liuzzi, L., "The Variation of Mechanical Properties in 175mm Ml13 Gun Tubes", Watervliet Arsenal Technical Report, WVT-6734, July 1967.
4. Baldrey, D. and Lyons, T., "Variation in Mechanical Properties of Tempered Martensite Gun Steel", WVT-7020, March 1970.

work was that the variation in mechanical properties (excluding yield-
strength), found in the reheat treated test specimens was controlled
by some factor in the manufacturing process other than heat treatment.
Another recent investigation statistically analyzed the mechanical
property data from 9 full size gun tube forgings by an Analysis of
Variance technique (ANOVA) . Two of the conclusions are particularly
pertinent:
1) The percent RA attained in forgings of equivalent configuration
showed significant variation when the forgings resulted from different
ingot positions. Conversely, the % RA attained in similar forgings
exhibited insignificant variation when the forgings came from similar
ingot positions. This demonstrated the effect of solidification para-
meters on variation of mechanical properties in large forgings.
2) Also, significant variation was found in yield strength and room
temperature Charpy impact energy for similar forgings produced from
identical size ingots but different heats of steel, illustrating the effect
of melting variables upon the mechanical properties of the forgings.
Therefore, the object of our present examination was to evaluate the
effect of forging reduction on the mechanical properties of low alloy,
heavy, steel forgings. The analysis was conducted from both a statistical
and metallurgical standpoint. Consequently, significant variation in
mechanical properties can be defined and the material parameters that
accompany these variations determined.
5. Thornton, P.A., "On the Variation in Mechanical Properties of Large Caliber Gun Tube Forgings", WVT-7260, Oct. 1972.

THEORY
When two or more independent sources of variation operate, the
resulting variance is the sum of the separate variances.6 The two
types of errors which arise, when estimating the property of a bulk
material are:
2 Errors of sampling (variance denoted by 0*1)
2. Errors of analysis (variance denoted by 0*0)
These sources of error operate independently and the total variation
may be obtained by the addition of the two.
In order to separate and estimate the variances due to testing and
sampling an Analysis of Variance (ANOVA) can be conducted with the
experimental data. The ANOVA is essentially a method of separating the
variance to which a response (test measurement) is subject, into its
various components corresponding to the sources of variation which can
be identified. The details of this method can be briefly summarized
as follows:
Suppose there are k samples (disks) and n repeat analyses
on each, giving a total number of analyses N = kn. The analytical
error is responsible for the variation in the repeat analyses on each
sample, and its variance is denoted by O*o . This variance is estimated
by:
6. Davies, O.L., Statistical Methods in Research and Production, Oliver and Boyd, London, 1961, p. 100

• _ 2 % k n U.--X.)
TOTAL of the sums of squares about the sample means . _____ TOTAL of the degrees of freedom i*l J=l k(n-l)
where Xjj - individual responses (within disks)
x-JL - disk mean
2 Similarly, the sampling error variance denoted by cr 1 is estimated by:
k
n r (£- x)2 / (k-1) i=l
where x\ - disk mean
x - grand mean
The sums of squares and degrees of freedom "between disks","within disks"
and "total" may be set out in tabular form called the ANOVA table as
below: Quantity
Source of Degrees of Mean Estimated by Variation Sum of Squares Freedom Square Mean Square
Between disks n__"' (x-x)2 = SI k-1 SI/ (k-1) cr o2 = n or \2
i=l
kn n Within disks ^ } (x-jj-Xj )2»So k(n-l) So/k(n-l) cf o2
i=l j=l
k n
Total YZ YZ. Uij-x)2 nk-1 i=l j=l
The results of the Analysis of Variance can then be tested for
significance. This is accomplished by setting up the Null Hypothesis
2 that there is no disk to disk variation (Sj = 0). Consequently,

two independent estimates of SQ are realized; one from the mean square
within disks, and the other from the mean square between disks. To
test whether these two estimates differ significantly, i.e., whether
they differ by more than can be reasonably explained on the grounds
of errors in the estimates, the ratio of the mean square between
disks to the mean square within disks is calculated. This ratio (F)
is the measure of the variation caused by the effect divided by the
variation due to repeat tests. The resultant F value is then compared
with a table of variance ratio for the respective degrees of freedom,
and a particular significance level. A significant value of Fcajc
(Fcalc>F table) discredits the Null hypothesis and it can be concluded
that real variations exist in the property under consideration, from
disk to disk.
PROCEDURE
In order to evaluate the effects of forging on mechanical property
variation, two identical ingots were poured from the same heat of vacuum
degassed, low alloy steel (4335 modified with V). The heat (22 tons)
was melted in a basic electric-arc furnace. Ingot dimensions are given
in Figure 1. The ingots were then forged into stepped-down cylinders
to achieve the desired forging reductions as illustrated in Figure 2.
All tests were taken in the transverse orientation, which is equivalent
to the C-R orientation according to ASTM E399. The sampling plan is
shown in Figures 3 and 4. The following expression was employed in a
reiterative manner to arrive at a satisfactory sample size:

2U 3 H
Fig. 1 - Schematic showing ingot dimensions.
HEAT NO 86 m
20 15 16
5 I U
9U ! 2
I.?
31 I B
9U I 2"
nzy
\ -
INGOT 2
.'
1
09"
«a-
!
J MO
1 ?0"
k
STEP I IRR-I 5 n «48"
STEP 2
\
L_ «.,. IRR.J ll U8"
f- STEP 3
»»" (RR M II 60-
,0'' STEP« ' (RRilO: I) f — — l0"
Fig. 2 - Schematic illustrating stepped cylindrical forgings.

S/nl/2
foC - probability where: t - probability point"
(/I - 1 ■ fa degrees of freedom
X - sample mean (background)
^i - population grand mean (background)
(x -A) - error
S - sample std. deviation (background)
n - sample size required
The mechanical property data was statistically analyzed by the Analysis
of Variance technique to define any variations that may exist. This
analysis included yield strength, % RA, Charpy impact and fracture toughness.
Correspondingly, a metallurgical analysis consisting of microstructure,
chemistry and non-metallic inclusion assessment, was conducted to determine
the material parameters responsible for the mechanical behavior and any
attendant variation in the data. In regards to the non-metallic inclusion
content, a two-dimensional systematic point count was employed according
to Hilliard and Cahn.7 This analysis is based on the principle that the
fractional number of randomly or regularly dispersed points falling within
the boundaries of a two-dimensional feature on a plane, provides an un-
biased estimate of the volume fraction of the feature.
It should be noted that heat treatment of the steel was carried out on
the test specimen blanks, prior to finish machining, rather than the entire
forgings themselves. This allowed much closer control of the microstructure
and produced a tempered martensite structure in all specimens thereby
essentially eliminating heat treatment as a variable.
7. Hilliard, J.E. and Cahn, J.W. , Trans, AIME, 221_, p.344, 1961
8

I 12*
: S v
> ■ \ •.
l£ ft ~
TEH5ILE CHARPY ^*j\
.
FRACTURE TOUGHNESS
'Oi -
2 12 ITfR.
S I «" SO
2 1?
DISK 0 DISK 3 DISK A
Fig. 3 - General sampling layout of disks within a step.
APPROXIMATES EDGE
APPROXIMATES EDGE
APPROXIMATES CENTER
Fig. 4a. - Tensile and Charpy specimen layout within a disk.
Fig. 4b. - Layout of fracture toughness specimens within a disk.

RESULTS AND DISCUSSION
Mechanical:
The results of the mechanical property tests, which include 144
tensile, 144 Charpy impact and 60 compact tension fracture toughness
specimens are tabulated in Appendices A to C. Since yield strength,
% reduction of area, Charpy impact energy and fracture toughness are
widely accepted indicators of a steel's ability to perform in service,
we employed them in the statistical analysis portion of this investi-
gation. Accordingly, the same parameters will be addressed in the
overall discussion of mechanical behavior.
The results of the Analysis of Variance on the mechanical properties
are given in Tables 1-4. This information is summarized for the 5% sig-
nificance level in Table 5. The summary shows that the degree of forging
reduction (steps) is responsible for significant variation in all the
properties under consideration. No significant variance was evidenced
among disks and only one parameter out of four, Charpy impact, demon-
strated significant variation due to separate ingots. Figures 5-12
display the properties under consideration for both ingots. The plots
show the mean values for each disk and also the respective maximum and
minimum values. The yield strength (0.1% offest) for both step forgings
ranged from approximately 170-180 ksi. Unfortunately, the specimens
from Step 4*s were heat treated separately from the remaining test
specimens (Steps 1-3) and incurred yield strengths in the lower portion
of this range. Therefore, the trend of decreased yield strength for this
10

190 r
0 I V. TIELC STRENGTH
«• ,75
170 h
I« \-
\ •
'
HEAT NO. B5IU INGOT DC I
0 AVERAGE VALUE
'I * H
STEP I (PR : 5 II STEP ? IRR ? 3: l> STEP 3 if* U *: 11 STEP U IRR 10 i)
l€0 I 1 1 1 1 1 1 1 1 1 1 1 »
0 1« OB* OB«
FOGGING DIRECTION
L B *
Fig. 5 - Variation of Yield Strength with forging reduction in Ingot No. 1.
.90 r
180 0 I \
TIELC STRENGTH
.75
.70 V
IflB
•'
\
STEP I
I L-
HEAT NO BS.U
INÜOT NO 9
® AVERAGE VALUE
i T it • •
STEP ? • W i 3 11 IVJ
_-J 1 1 1 1 1
STEP U <W .0: II
__i I 1—
C B
FORGING «jlREfTl»
0 8 A
Fig. 6 - Variation of Yield Strength with forging reduction in Ingot No. 2.
11

step does not reflect the consequences of forging reduction alone.
Occasionally, small inconsistencies in the heat treating operation,
viz., furnace temperature fluctuation, time, placement or position
within the furnace, etc., manifest themselves in discrepancies in the
yield strength of a material. It appears that this was the case in
Step 4. However, since we were also concerned with property variation
within disks and between ingots, this data was included in the analysis.
Reduction of area for both step forgings displayed a peaking type of
trend with a maximum between 2:1 and 5:1 forging redaction. This effect
is shown in Figures 7 and 8. Very noteworthy was the spread within disks
at the lower end of the forging reduction scale. Differences as much as
37% RA were observed. There was a distinct tendency for this spread to
decrease with greater amounts of forging, but also the average values
tended to decrease after a forging reduction of about 4.5:1. This
particular phenomena does not coincide with the observations of Wells
and Mehl; in the present study the top end of the ingots displayed
slightly lower % RA and much greater variation than the middle and bottom
portions of the ingots. While the first inclination might be to suspect
a deleterious material condition at the top end of the ingots, this may
well be a consequence of insufficient working on this portion. This
possibility is being investigated by forging sections from the top end
of the ingot to the same forging reduction as step 4 (10:1). The results
of this evaluation will be reviewed in a future report.
12

50 •
*: PERCENT
KIT * C 4 $ 30.
20 -
-. _ 5 s
HE»T NO B5iu INGOT «0 I
STEP I II M , »4.5:11 STEP U IRR r 10: II
D 5 A
Fig. 7 -
t 3 t
FORGING riRECTION
Variation of % Reduction of Area with forging reduction in Ingot No. 1.
60-
"r - • ■Ol
C C PERCENT
30 L
?c\-
e © - T
1 i i> 9
1 [ 1
HEAT MO. 351U •NGOT NO. 2
STEP i II 1T£P 3 IR» -- n 5. M STEP »II», H) II
—
Fig. 8 - Variation of % Reduction of Area with forging reduction in Ingot No. 2.
13

Initially we anticipated no real mechanical property variation
due to identical size ingots. However, the data demonstrates that the
same size ingots poured from the same heat can experience variation in
Charpy impact behavior. Figures 9 and 10 display the trend in Charpy
data with forging reduction. Again we note the peaking type of curve
exhibiting slightly higher values in the vicinity of 3:1 forging re-
duction. However, this trend is upset by the data from both Step 4's.
Recalling the inadvertant yield strength increase due to heat treat-
ment, the Charpy impact data, consequently, reflects this deviation.
Although, if this discrepancy is examined in light of a general re-
lation developed by Wells and Mehl8, where impact values are increased
on the average by about 3 foot pounds when yield strength is lowered
by 5000 psi, our impact data coincides with the trend when corrected.
Therefore, in spite of the fact that these forgings were produced
by the same vendor, from identical size ingots, poured from the same
heat of steel, real variation was experienced in the Charpy impact
energy absorption. If we can assume that the solidification para-
meters are reasonably similar, then the melting variables such as
chemical heterogeneity in the melt, deoxidation and degassing practice,
etc., along with tapping and pouring practices, must be responsible
for observable variations in properties due to ingots.
8. Wells, C. and Mehl, R.F. Trans. ASM, 41, 1949, p. 803.
14

3Dr
a
CHAW»
IVPACT
ENERGY
n LB 15
- 9 (±> ?
10 -
I r • T t
f * ! HEAT NO 85IU
INQOT NO. I
® AVERAGE VALUE
STEP I <RR I S:'> STEP i» i»/ STEP 3 (RR U.5 i)
_JL -J_ — _L STEP U if* (0 II
_J I I
DBA OBA DBA
FORGING DIRECTION
D B A
Fig. 9 - Variation of Charpy Impact energy with forging reduction in Ingot No. 1.
MOf
CHARPY
twin ENERGY
FT-LB
<•> ¥ H "> \\ IT H£AT <c 85 iu
INGDT NO. 2
© AVERAGE VALUE
STEP • IRP i 5:11 STEP ; i RP ; STEP 3 i RP - STEP u IRR 10:11 I 1 I 1 1 1 ■ ' i ' ' »
D B DBA
«WGING DIRECTION —
DBA
Fig. 10 - Variation of Charpy Impact
energy with forging reduction in Ingot No. 2.
15

Plane strain fracture toughness, as measured according to ASTM
E-399, exhibited statistically significant variation due to forging
reduction and insignificant variation between ingots and disks within
a step. Individual fracture toughness values ranged from 111 ksi-in1'2
to 128 ksi-in1/2 for a 0.1% yield strength range of 180-188 ksi
(0.2% offset yield strength = 186-194 ksi). Average fracture tough-
ness values along with their respective maximum and minimum points
are shown in Figures 11 and 12. Analogous to tensile ductility, the
fracture toughness of this steel displays a trend for higher average
values in the vicinity of 2:1 - 5:1 forging reduction ratio. The
stepped forging produced from Ingot 1 shows this behavior much clearer
than its counterpart from Ingot 2 and exhibits less spread in data
within disks. Although no problem was encountered with the effect
of yield strength variations, it must be noted that the data from
both Step 4's is subject to some discrepancy because the test specimens
were of marginal validity as per ASTM E399. The diameters of Steps
1-3 were large enough to permit specimens of "valid" thickness (2T)
while Step 4 permitted 1.6T bars. Our experience with this particular
material is that bars of marginal validity will show slightly lower
K values (on the order of 5%) than those well within the valid range.
Accordingly, our analysis of variance reflects the data from
Steps 1-3. The variation results in Table 4 include the interactions
between factors (sources of variation), one of which exhibited
marginal variation (between steps). When Step 4 fracture toughness
data is included, an additional interaction occurs between the steps
and disks.
16

>4?K m
*? iy\w
•<»i
.-1 2 ' c( led
•/ i»
/^X'W
T
( > |
T
9
t
y
9
HEAT NO B5IU INGOT NO I
STB» I IRR 1.5:11 STEP 2 (RR ; 3; M STEP 3 IRR U b II STEP U IRR 10 I)
0 8 A 6 i I E i Ä D 8 I
FOGGING niRECTION —
Fig. 11. - Variation of Fracture Toughness with forging reduction in Ingot No. 1.
V,
MEAT NO. B5IU INGOT NO. 2
1 1
f $
STB» I (R* STEP 2 IP« S STEP 3 ifl» *.! STEP U(RR 10:11
/<?.0( 08> DBA D 3 * DBA 3A
FCPGIVG r-FcCT10H —
Fig. 12 - Variation of Fracture Tough- ness with forging reduction in Ingot No. 2.
17

Therefore, our observations concerning the marginally valid specimens
from Step 4(s) appear to be confirmed by the statistical analysis.
Furthermore, the introduction of another experimental variable, (specimen
size) at this stage of the investigation was not acceptable.
In summarizing the results at this point, Table 5 shows that signifi-
cant variation was witnessed in all the mechanical properties considered,
due to varying forging reduction from 1.5:1 up to 10:1. Based on the
literature and our own previous investigations, this outcome was not
surprising. Thus, our metallurgical investigation was directed toward
the factors that were affected by mechanical working. Two areas were
investigated thoroughly, non-metallic inclusion content and chemical
homogeneity. Fibering from crystallographic texturing was not considered
in this study.
Metallurgical
The evaluation of the non-metallic inclusion content was conducted on
two planes in these forgings; transverse and longitudinal (parallel) to
the direction of forging. This analysis attempted to detect any sizeable
difference in volume percent of inclusions between the two planes. The
volume percent estimations are compiled in Table 6. The amount of included
matter is relatively low, on the order of 0.05 v /o,well distributed and
shows no appreciable difference in the quantity between the two
orthogonal planes observed. The general range for both forgings is
roughly 0.04 to 0.07 volume percent with the exception of a minimum
determination of 0.03 and a maximum determination of 0.08. Inclusion
contents on this order are not unusual for this type steel. The
18

inclusion morphology and compositions, viz., globular oxides and
silicates, are typical of the nonmetallics obtained in this material.
Figure 13 illustrates these inclusions.
Therefore, for the purpose of this analysis, the nonmetallic in-
clusion content as estimated by volume percent, can be considered
relatively constant. In other words, the variation in mechanical
properties of the forgings is not the result of variation in the quantity
of nonmetallic inclusions. This is not to say that inclusions do not
contribute to mechanical property variation but that the observations
herein are based on a low, fairly uniform, nonmetallic inclusion level,
in the neighborhood of .05% - .07%.
In the area of chemical homogeneity, each disk was analyzed for
chemical concentration at seven locations across the diameter. The
elements assessed were based on the ladle analysis given as follows:
C ^L £ S Si^N^CrMoV
.35 .38 .010 .010 .21 3.02 .92 .61 .11
Our analyses are tabulated in Appendix D. Based on an examination of
the chemistry data, the elements carbon and manganese were subjected
to an Analysis of Variance to determine if any significant variation
existed in their concentrations throughout the forgings. The other
elements analyzed showed no appreciable differences throughout the
forgings.
19

Fig. 13 - Nonmetallic inclusions typical of this material, unetched, 500X.
20

The ANOVA results for %C and %Mn are displayed in Tables 7 and 8.
These data demonstrate that significant variation in carbon concentration
was experienced due to separate ingots and steps within an ingot. No
real variation in % manganese was displayed due to any of the three factors.
Therefore, considering the apparent variation in carbon distribution
in the forgings, Figures 14 and 15 display the average concentration with
maximum and minimum values for the seven analyses across each disk. The
variation between separate ingots can be observed by comparing the re-
spective average concentrations. For instance, the average carbon con-
centrations of Ingot 2 are all above the ladle analysis, while those of
Ingot 1 range above and below. Likewise, the variation due to steps
within ingots is dramatically demonstrated by comparing disk D-Step 2
and disk B-Step 4, in Ingot 2 (Figure 15). The spread in the former
being 0.34% to 0.37%, while in the latter case, the range is 0.30% to 0.39%.
This amount of carbon variation is an unfortunate circumstance because
the interstitial carbon is fundamental in determining the properties of
a steel especially in the heat treated condition . Logically, the more
uniform its distribution in the solid, the more uniform are the resultant
properties.
Furthermore, the areas chemically analyzed were selected symmetrically,
with respect to the center of each disk, on a line from edge to edge.
Hence, we have an approximation of the carbon distribution through the
forging at those particular cross sections. These profiles are illus-
trated in Figures 16-23, comparing the % C of respective disks and steps
9. Bain, E.C. and Paxton, H.W., Alloying Elements in Steel, ASM, Metals Park, Ohio, 1961 p. 127.
21

INGOT 1
O.MO © - AVERA6E
0 38
-
0 36 i> 1 ? 9 T A
Y I y ? 6
0 3H o
1 1 1
0 32
0 3C
LADLE ANALYSIS
*—- STEP I —f-» STEP 2 -4—— STEP 3 —-*- STEP U —*
C B AOB AOB AC 3 A
FCSGJNG 01 SECTION
Fig. 14 - Variation of carbon con- centration with forging reduction in Ingot No. 1.
0 38
0.36
INGOT 2 © - AVERAGE
LADLE ANALYSIS
^ - STEP I •*- . STEP 2 •+- STEP ? - ~»f» STEP U
D6 A 0 -3 A D 8 A C B A
FORGING DIRECTION
Fig. 15 - Variation of carbon con- centration with forging reduction in Ingot No. 2.
22

*C
"DISK •"
4
ft
M
E
<-
B
A?
«
V.C *
00 C.TR oc
OIMCTER OF FORGING
sro« i tNGOT I
-+ 1 •-
10* CT»
Ol»CTCR OF FORSING STfF t INQ0T I
:IIOUS
Fig. 16 - Variation of carbon concen- tration transverse to forging direction. Fictitious ID approximates a bore sur- face in a gun tube. Step 1, Ingot 1.
Fig. 17 - Variation of carbon concen- tration transverse to forging direction. Fictitious ID approximates a bore sur- face in a gun tube. Step 2, Ingot 1.

00
* -K-
,0* an n
OI*€TEROF FORGING
STEP 3 IKGOT I
00 on
•* -iC' -
CTR '
DIM4ETCR OF FORCING STB» K IMQ01 I
oc
Fig. 18 - Variation of carbon concen- tration transverse to forging direction. Fictitious ID approximates a bore sur- face in a gun tube. Step 3, Ingot 1.
Fig. 19 - Variation of carbon concen- tration transverse to forging direction. Fictitious ID approximates a bore sur- face in a gun tube, step 4, Ingot 1.

y,c
no
l
H
3D
N
30
<8
a
u
»
*
36
3»t
j 0-
v.c
«0.
"DISK D-
* ncrmous
iO* CTf <c
0I*H£TE« Of FORGING
STEP I INGOT ?
DO
•'-,v
9S£
•019 D<
tiOu.
o~ cm •
DI#CTER0F fORGIKG STB» 2
INGOT ?
Fig. 20 - Variation of carbon concen- tration transverse to forging direction. IFictitious ID approximates a bore sur- face in a gun tube, step 1, Ingot 2.
Fig. 21 - Variation of carbon concen- tration transverse to forging direction. Fictitious ID approximates a bore sur- face in a gun tube. Step 2, Ingot 2.

hi a-
3?
'*C 36
32
ota a-
Li» i D1 MR X
■*• nCi'tO*.-' OKHtTEP OF FORGING
STEP 3 INGOT 2
CC:
«
• D* CTR ' D
DIAMETER OF FORGING
STEP U
INGOT ?
Fig. 22 - Variation of carbon concen- tration transverse to forging direction. Fictitious ID approximates a bore sur- face in a gun tube. Step 3, ingot 2
Fig. 23 - Variation of carbon concen- tration transverse to forging direction. Fictitious ID approximates a bore sur- tace in a gun tube. Step 4, Ingot 2.

from both ingots. Two features are evident. First, there is a general*
similarity in carbon profile between corresponding disks and steps from
Ingots 1 and 2. This indicates that the solidification mechanisms in
each ingot are operating in a similar fashion (a reassuring observation).
Second and more important is the obvious heterogeneity of carbon con-
centration across the diameter of some cross sections. In other words,
we have a varying alloy from one side of the cylinder to the other.
Indubitably, the mechanical properties of the quenched and tempered
product will respond with a corresponding variation.
Recapitulating, we have observed statistically significant variation
in yield strength, % reduction of area, Charpy impact @ -40°F, and plane
strain fracture toughness, due to different reduction ratios within
the same forged ingot. In addition, the Charpy impact data also
exhibited real variation between identical size ingots poured from the
same heat of steel. Moreover, the carbon concentration exhibited
statistically significant variation due to both ingots and steps, plus
considerable variation within individual disks, revealing a tendency
for macro segregation. This may or may not be associated with the
differences in concentrations of the other alloying elements, viz.,
Mn, Cr, Mo. Some elements in steel tend to segregate more readily than
others. Sulphur segregates to the greatest extent while the following
elements also segregate, but to a somewhat lesser degree in descending
order: phosphorous, carbon, silicon and manganese10.
10. The Making, Shaping and Treating of Steel, United States Steel, 8th Edition, Pittsburgh, Pa., 1964, p. 550.
27

Chemical inhomogeneities on a macroscopic scale are the result of
differences in segregation due to long range transport of matter within
an ingot. The complexity of segregation in large ingots is augmented
by the fact that the liquid enriched with rejected solute can be moved
by five separate effects: (1) The motion of the liquid as it enters
the mold, (2) Convection caused by differences of density due to
temperature gradients, and (3) Convection caused by differences
of density due to variations in composition of the liquid as a result
of solute redistribution, (4) Motion caused by gravity, of crystals
that are growing in the liquid, and finally, (5) Motion of liquid
due to solidification shrinkage**. Therefore, the carbon segregation
measured in this steel cannot be predicted on just a diffusion or
redistribution basis alone. The motion of the fluid during solidifi-
cation of a large ingot must be considered when analyzing normal and
convective segregations of chemical elements.
Conclusions
Considering the results of this investigation in light of the
interaction between chemical segregation and mechanical working for
this material, we are permitted the following conclusions:
1. An approximate forging reduction ratio of 3:1 produced
optimum average values of % RA, Charpy impact and fracture toughness
in this material. This data holds for forging reductions produced on
ingots where the maximum work was given to the bottom of the ingots.
As was previously mentioned, a follow on study is being conducted to
investigate the effects of working the top of the ingot to a similar
reduction.
11. Chalmers, B., Principles of Solidification, John Wiley § Sons, Inc. New York, 1964, D. 283 Jjj

2. Real variation, that is, variation in excess of experimental
error variance, was determined in yield strength, % reduction of area,
Charpy impact energy and plane strain fracture toughness. This vari-
ation occurred between different forging reductions of the same ingot
in the range of 1.5:1 to 10:1.
3. Significant variation was also measured in Charpy impact
energy due to separate identical size ingots poured from the same heat.
4. Likewise, real variation in carbon concentration was measured
due to different forging reductions and separate ingots.
In view of the control exercised on this "full-size" experiment,
viz. uniform microstructures, nonmetallic inclusion contents, etc., we
must conclude that chemical inhomogeneity, in particular, carbon segre-
gation on a macroscale, is a major contributor to mechanical property
variation in the steel produced herein. The mechanical working alters
the segregation pattern but in no way eliminates it. This apparently
constitutes a solidification problem and the only method of correction
is to modify the solidification mechanisms, thereby preventing the flow
of solute-rich material. Currently this refinement is being achieved
in the electroslag remelting and vacuum arc remelting process. However
the ingot size in ESR is presently limited to approximately 20" in
diameter.
29

TABLE 1
ANOVA - - 0.1% Yield Strength
Source of Variation S.S. D.F. M.S. F exp. F(5%) Variation
A 6.17 1 6.17 .0032 3.9 Insignificant
B 168,844 3 56,281 29.2 2.7 Significant
C 2,832 2 1,416 0.73 19.5 Insignificant
SSE 62,951 137 1,927
A - Between Ingots
B - Between Steps (forging reduction)
C - Between disks within a step
SSE - Experimental error term (includes interactions)
30

TABLE 2
ANOVA - % Reduction of Area
Source of Variation S.S. D.F. M.S. F exp.
A 16,256 1 16,256 2.5
B 166,038 5 55,346 8.5
C 2,371 2 1,185 0.2
SSE 894,973 137 6,533
F(S%) Variation
3.9 Insignificant
2.7 Significant
19.5 Insignificant
A - Between Ingots
B - Between Steps (forging reduction)
C - Between Disks within a step
SSE - Experimental Error term (includes interactions)
31

TABLE 3
ANOVA - Charpy -Impact (ft-lb)
Source of Variation S.S. D.F. M.S. F exp. F(5%) Variation
A 5,476 1 5,476 15.6 3.9 Significant
B 32,446 3 10,815 30.9 2.7 Significant
c 928 2 464 1.3 3.1 Insignificant
SSE 47,893 137 350 •
A - Between Ingots
B - Between Steps (forging reduction)
C - Between Disks within a step
SSE - Experimental Error term (includes interactions)
32

TABLE 4
ANOVA - Kr Fracture Toughness (ksi-kn1/2)
Source of Variat: Lon S.S. D.F. M.S. F exp. F(5%) Variation
A 1.6 1 1.6 0.1 252 Insignificant
B 98.4 2 49.2 4.1 3.1 Significant
C 28.9 2 14.4 . 1.2 3.5 Insignificant
SSE 641.8 54 11.9
A - Between Ingots
B - Between Steps (forging reduction)
C - Between disks within a step
SSE - Experimental Error term (includes interactions)
33

TABLE 5
Statistical Variation Summary - Mechanical
(5% Significance Level)
Source of Variation
Ingots Steps Disks
Factor •
.1% Y.S. 1 S I
% RA I s I
-40° Cr S S I
Kc I s I
S - Significant variation
I - Insignificant variation
34

TABLE 6
NONMETALLIC INCLUSION ASSESSMENT - VOLUME %
INGOT 1
Spec No
1A1T1 .053 .069 1A1T4 .056 .068 1B1T1 .046 .049 1B1T4 .036 .063 1D1T1 .046 .059 1D1T4 .053 .056
1A2T1 .066 .050 1A2T4 .056 .061 1B2T1 .056 .046 1B2T4 .046 .040 1D2T1 .053 .059 1D2T4 .059 .050
1A3T1 .056 .050 1A3T4 .053 .046 1B3T1 .069 .063 1B3T4 .036 .030 1D3T1 .069 .040 1D3T4 .056 .076
1A4T1 .043 .050 1A4T4 .046 .063 1B4T1 .086 .073 1B4T4 .043 .053 1D4T1 .050 .056 1D4T4 .050 .043
INGOT 2
Spec. No. L T
2A1T1 .054 .050 2A1T4 .053 .056 2B1T1 .043 .046 2B1T4 .053 .053 2D1T1 .066 .069 2D1T4 .063 .050
2A2T1 .066 .040 2A2T4 .058 .073 2B2T1 .046 .063 2B2T4 .053 .043 2D2T1 .046 .063 2D2T4 .066 .053
2A3T1 .046 .044 2A3T4 .044 .053 2B3T1 .051 .063 2B3T4 .056 .082 2D3T1 .059 .056 2D3T4 .036 .050
2A4T1 .043 .046 2A4T4 .046 .059 2B4T1 .046 .046 2B4T4 .066 .069 2D4T1 .053 .059 2D4T4 .043 .050
L - longitudinal plane
T - transverse plane
35

TABLE 7
ANOVA - % C
Source of Variat: Ion S.S. D.F. M.S. F exp. F(5%) Variation
A 3,809 1 3,809 9.1 3.9 Significant
B 4,515 3 1,504 3.6 2.7 Significant
C 985 2 493 1.2 3.1 Insignificant
SSE 67,701 161 420 •
A - Between Ingots
B - Between Steps (forging reduction)
C - Between Disks within a step
SSE - Experimental Error term (includes interactions)
36

TA&LE 8
ANOVA - % Mn
Source of Variat: Lon S.S. D.F. M .S. F exp. F(5%) Variation
A 1,001 1 1 ,001 1.8 3.9 Insignificant
B 1,021 3 340 0.6 8.5 Insignificant
C 1,161 2 581 1.1 3.1 Insignificant
SSE 87,701 161 545
A - Between Ingots
B - Between Steps (forging reduction)
C - Between Disks within a step
SSE - Experimental Error term (includes interactions)
37

ACKNOWLEDGMENT
The authors wish to acknowledge the assistance of Mr. W. Lynch
during the metallurgical portion of this program.
38

APPENDIX A
Tensile Data
INGOT #1 Step 1
Code 0.1% YS (ksi)
1A1T1 178.2 T2 177.6 T3 175.0 T4 177.0 T5 177.7 T6 178.0
1B1T1 179.4 T2 179.1 T3 178.6 T4 177.4 T5 177.4 T6 179.5
1D1T1 179.0 T2 180.6 T3 182.2 T4 180.9 T5 178.6 T6 178.5
1A2T1 174.9 T2 176.5 T3 172.6 T4 172.0 T5 178.2 T6 177.4
1B2T1 178.9 T2 179.8 T3 176.2 T4 174.7 T5 177.6 T6 179.5
1D2T1 178.3 T2 177.1 T3 177.0 T4 176.8 T5 177.3 T6 181.3
YS (ksi) UTS (ksi) %E1 %RA
183.0 196.9 15.0 42.4 183.2 197.1 13.6 35.0 179.8 194.8 9.3 21.2 181.2 196.5 8.9 15.57 182.5 197.3 13.6 38.1 182.5 197.2 16.0 51.9 183.6 198.1 14.3 45.8 183.3 198.0 13.6 42.0 183.6 197.9 7.9 12.5 183.1 198.0 10.0 23.2 182.4 196.8 12.8 40.3 184.0 198.2 14.7 45.8 184.4 199.4 13.6 43.6 185.7 199.7 14.3 45.4 187.8 202.2 9.3 19.7 187.8 202.5 11.5 26.5 183.6 198.4 11.5 31.8 183.2 197.2 15.0 47.2
Step 2
180.8 196.0 13.6 54.2 182.1 197.0 13.2 40.3 177.6 192.4 12.1 36.8 177.4 ' 192.6 14.3 39.0 183.6 198.5 13.6 40.3 182.4 196.6 17.1 54.8 183.1 197.4 16.0 51.6 184.0 197.7 15.7 47.0 180.7 195.3 14.6 39.8 179.8 194.0 12.8 35.4 182.7 197.0 15.0 47.0 183.4 197.4 15.7 51.6 183.1 197.2 17.9 55.5 182.5 196.6 14.3 47.8 181.4 196.0 13.6 36.6 182.2 196.6 12.8 36.3 182.7 197.4 14.3 40.0 185.8 199.1 16.1 53.8
39

INGOT #1 Step 3
Code 0.1% YS (ksi) 0.2% YS (ksi) UTS (ksi) %E1 %RA
1A3T1 180.0 183.6 198.8 16.0 53.2 T2 177.6 181.6 ' 196.7 17.9 43.5 T3 173.8 179.1 192.9 17.9 47.2 T4 175.2 180.3 194.8 14.3 39.0 T5 178.3 182.8 197.4 15.4 42.4 T6 180.9 184.7 199.5 15.4 48.6
1B3T1 180.6 184.5 199.6 15.7 52.3 T2 180.1 184.9 199.3 15.0 42.4 T3 174.6 178.9 194.4 14.6 42.4 T4 174.6 178.5 193.8 14.0 42.4 T5 180.9 185.2 199.4 15.7 42.8 T6 180.4 185.1 199.2 16.4 50.2
1D3T1 180.9 184.7 199.3 16.0 52.3 T2 179.1 183.2 198.1 15.0 49.8 T3 175.2 180.6 195.8 13.6 42.4 T4 177.1 180.9 195.5 14.3 43.3 T5 179.2 183.4 198.2 14.3 45.4 Tb 181.4 185.1
Step 4
199.1 15.0 51.4'
1A4T1 172.9 176.4 189.8 15.0 44.4 T2 171.1 174.4 187.2 16.4 41.0 T3 168.4 173.1 186.4 15.7 41.8 T4 170.2 173.5 186.6 15.0 39.6 T5 170.5 174.1 187.3 15.4 40.3 T6 171.1 174.9 188.2 16.0 46.2
1B4T1 170.8 175.3 188.6 16.0 46.2 T2 173.2 176.4 189.6 16.0 45.2 T3 168.1 172.6 185.8 15.4 42.0 T4 168.6 173.2 187.0 15.0 35.8 T5 171.4 175.6 188.5 15.0 44.1 T6 171.1 175.9 189.0 15.7 45.8
1D4T1 171.5 175.6 189.1 14.3 41.5 T2 163.8 168.0 181.3 15.0 43.6 T3 167.4 171.7 184.9 13.6 40.7 T4 169.3 173.2 185.8 15.0 40.0 T5 170.8 174.7 188.0 14.3 42.6 T6 172.0 175.9 189.2 15.0 43.6
40

INGOT #2 Step 1
Code 0.1% YS (ksi) 0.2% YS Cksi) UTS (ksi) % El %RA
2A1T1 180.1 184.3 198.0 15.7 49.4 T2 177.4 182.2 197.3 13.6 45.4 13 174.4 179.8 195.4 7.2 11.7 T4 177.1 182.2 197.2 10.0 17.7 TS 176.4 182.2 197.6 15.7 44.4 T6 179.8 183.7 197.9 15.4 48.4
2B1T1 177.1 182.5 197.6 16.0 51.0 T2 177.4 182.5 197.0 15.7 35.0 T3 178.3 183.3 198.4 15.0 28.5 T4 177.9 183.5 198.3 12.4 31.5 T5 178.9 183.4 197.9 14.0 42.0 T6 179.5 183.7 198.2 14.6 47.4
2D1T1 179.5 183.7 197.9 14.6 46.6 T2 179.0 184.1 198.5 14.3 43.6 T3 180.4 186.5 201.9 11.8 25.4 T4 180.4 186.1 201.3 10.4 23.2 T5 178.5 183.6 198.4 14.3 46.6 T6 179.5 184.3
Step 2
198.1 15.7 48.8
2A2T1 177.4 181.8 196.9 16.4 53.0 T2 176.4 181.3 196.8 14.3 44.1 T3 173.2 178.3 193.1 12.1 33.2 T4 172.3 177.6 193.1 13.6 39.8 T5 177.4 182.1 196.6 11.5 32.4 T6 178.6 182.8 197.2 16.4 50.6
2B2T1 179.5 183.4 197.5 16.0 52.9 T2 170.2 176.1 190.8 12.1 31.8 T3 175.0 180.0 194.7 14.6 38.2 T4 174.1 179.5 194.0 13.6 37.7 TS 177.8 182.3 196.9 14.3 43.6 T6 178.0 182.2 196.5 16.4 55.1
2D2T1 180.1 184.3 197.6 15.0 48.0 T2 178.9 183.6 197.5 13.2 42.0 T3 175.6 180.0 196.4 13.2 36.0 T4 175.8 181.6 197.8 13.6 40.3 TS 176.2 181.0 196.5 14.3 41.6 T6 179.8 183.6 197.6 15.4 51.0
41

INGOT #2 Step 3 •
Code 0.1% YS (ksi) 0.2% YS (ksi) UTS (ksi) % El %RA
2A3T1 179.5 183.1 197.6 15.7 47.0 T2 179.4 184.2 198.8 12.4 36.8 T3 177.3 181.6 196.6 14.3 42.9 T4 176.4 180.9 195.9 13.6 40.0 T5 178.2 183.0 198.0 13.6 41.2 T6 181.5 185.7 199.3 15.7 49.8
2B3T1 179.5 183.4 198.3 15.4 49.0 T2 180.1 184.0 198.0 14.3 43.6 T3 176.1 180.4 195.5 13.6 37.2 T4 177.7 182.2 196.3 13.6 39.0 T5 179.5 183.7 198.2 15.7 45.6 T6 180.4 184.9 198.3 15.7 48.8
2D3T1 180.3 184.7 199.3 16.4 53.6 T2 180.3 183.9 198.0 15.4 47.7 T3 176.5 181.3 196.6 11.8 27.5 T4 177.1 181.8 197.3 13.6 39.0 T5 180.3 183.6 198.2 14.3 44.5 T6 179.4 184.2
Step 4
199.1 14.3 46.2
2A4T1 173.5 176.8 189.1 15.7 44.6 T2 171.3 174.4 187.4 13.6 39.1 T3 167.5 172.0 185.7 13.2 30.0 T4 168.1 172.3 185.1 12.8 33.8 T5 170.8 174.7 187.5 12.1 28.2 T6 171.1 176.2 189.8 15.0 42.0
2B4T1 172.9 176.2 189.7 14.0 40.7 T2 171.9 176.1 189.0 12.8 35.7 T3 165.7 170.1 182.4 12.1 34.0 T4 168.7 173.4 187.2 12.4 31.3 T5 173.1 176.2 188.5 12.1 29.2 T6 173.2 177.1 189.7 14.3 41.6
2D4T1 172.9 176.2 188.7 13.2 34.8 T2 169.8 174.0 187.0 12.4 37.5 T3 169.9 174.9 186.3 11.5 27.5 14 168.0 173.2 186.5 12.8 31.7 T5 167.6 172.3 186.3 12.8 35.9 T6 169.9 174.4 188.6 14.3 43.0
42

APPENDIX B
Charpy Impact Data (- -40°F ft- ■lb)
Step 1
1A1 1B1 1D1 2A1 2B1 2D1
Cl 24.5 24.9 23.3 23.3 23.1 20.9 C2 19.8 21.4 21.4 19.9 21.2 17.5 C3 19.2 19.6 16.5 19.9 18.0 17.5 C4 21.2 19.0 16.3 20.9 17.2 20.9 C5 21.5 20.0 22.1 20.5 20.6 21.8 C6 23.0 22.1 20.9
Step 2
23.3 24.1 22.7
1A2 1B2 1D2 2A2 2B2 2D2
Cl 25.2 23.8 24.8 21.1 20.7 21.3 C2 21.1 21.4 20.5 21.8 22.9 21.1 C3 23.2 21.7 20.0 21.3 20.7 20.2 C4 25.0 24.5 20.0 19.1 21.3 16.8 C5 19.8 21.9 21.6 20.9 19.8 18.1 C6 24.9 26.1 25.5
Step 3
22.9 23.4 20.5
1A3 1B3 1D3 2A3 2B3 2D3
Cl 23.2 20.7 22.6 19.2 19.2 20.3
C2 21.8 19.9 21.3 17.0 20.2 19.2
C3 19.2 22.0 19.8 17.9 16.9 18.3 CA 22.2 21.4 17.0 17.4 18.7 16.2
C5 22.3 17.8 25.9 18.1 18.6 20.7
C6 22.0 21.2 20.9
Step 4
20.2 19.9 21.8
1A4 1B4 1D4 2A4 2B4 2D4
Cl 23.2 23.2 25.2 23.0 25.0 22.5
C2 25.2 23.6 23.8 24.2 23.8 23.9
C3 24.8 23.2 25.1 26.2 22.1 23.8
C4 24.9 22.9 25.8 25.9 22.5 27.0
C5 24.5 24.0 23.0 23.2 23.2 22.1
C6 25.0 22.9 25.8 22.8 24.8 23.2
43

APPENDIX C
K5 Fracture Toughness Data (ksi-in1'2)
Step 1
1A1 1B1 1D1 2A1 2B1 2D1
1 118 121 116 124 120 123 2 119 117 116 118 117 122 3 125 122 117 128 120 122 4 122 115 121
Step 2
122 121 122
1A2 1B2 1D2 2A2 2B2 2D2
1 * 122 121 120 130 127 2 126 121 123 116 118 125 5 126 126 127 124 120 116 4 123 125 121
Step 3
126 125 120
1A3 1B3 1D3 2A3 2B3 2D3
1 121 122 125 122 114 118 2 126 123 117
Step 4
118 117 123
1A4 1B4 1D4 2A4 2B4 2D4
1 113 111 * 114 111 115 2 118 111 113 113 116 124
*Test invalid
44

APPENDIX D -
CHEMICAL ANALYSIS
STEP 1, INGOT 1
SPECIMEN C Mn P S Si Ni Cr Mo V
1D1 Cl .37 .44 .010 .007 .25 3.13 .94 .69
1D1 C2 .38 .42 .009 .26 3.00 .92 .67
1D1 C3 .385 .43 .008 .26 3.06 .92 .67
1D1 CTR .37 .40 .011 .005 .27 3.10 .92 .66
1D1 C4 .382 .43 .005 .26 3.07 .93 .68
1D1 C5 .385 .39 .006 .26 2.98 .92 .66 .10
1D1 C6 .35 .42 .009 .007 .27 3.16 .92 .68
1B1 Cl .37 .42 .010 .007 .27 3.06 .92 .69
1B1 C2 .35 .39 .009 .25 3.00 .93 .65
1B1 C3 .38 .37 .005 .24 3.04 .92 .65
1B1 CTR .37 .41 .012 .005 .27 3.11 .92 .60
1B1 C4 .32 .35 • .006 .23 3.05 .90 .62 .10
1B1 C5 .34 .40 .005 .25 3.05 .94 .65 .11
1B1 C6 .38 .39 .008 .007 .25 3.04 .91 .67 .10
1A1 Cl .37 .39 .009 .007 .25 2.95 .91 .66 .10
1A1 C2 .36 .39 .009 .26 2.96 .92 .67
1A1 C3 .37 .38 .008 .25 2.94 .92 .62
1A1 CTR .33 .38 .010 .005 .26 3.10 .91 .64
1A1 C4 .36 .40 .005 .23 2.92 .93 .64
1A1 C5 .34 .39 .008 .27 2.96 .93 .64
1A1 C6 .36 .39 .010 .007 .23 2.88 .91 .64 .10
45

STEP 1, INGOT 2
SPECIMEN C Mn P S Si Ni Cr Mo V
2D1 Cl .37 .43 .009 .006 .26 3.11 .92 .67 .11
2D1 C2 .38 .38 • .26 3.15 .90 .66 .10
2D1 C3 .395 .44 .26 3.14 .92 .69 .11
2D1 CTR .37 .42 .010 .005 .23 2.84 .98 .64 .11
2D1 C4 .35 .40 • .25 3.09 .92 .65 .11
2D1 C5 .35 .40 .26 3.09 .92 .65 .11
2D1 C6 .35 .42 .008 .006 .26 3.14 .92 .68 .11
2B1 Cl .36 .42 .012 .007 .26 3.04 .91 .66 .10
2B1 C2 .345 .41 .24 2.96 .92 .64 .10
2B1 C3 .39 .42 • .25 2.98 .94 .69 .11
2B1 CTR .38 .39 .011 .003 .26 3.14 .94 .67 .11
2B1 C4 .36 .40 .25 3.03 .92 .63 .10
2B1 C5 .39 .43 .22 2.92 .95 .66 .11
2B1 C6 .36 .42 .011 .007 .26 2.91 .91 .68 .10
2A1 Cl .36 .39 .010 .007 .25 2.98 .92 .67 .10
2A1 C2 .375 .42 .26 3.04 .95 .68 .10
2A1 C3 .385 .42 .26 3.08 .92 .67 .10
2A1 CTR .35 .39 .010 .002 .26 3.14 .92 .64 .12
2A1 C4 .375 .42 .26 3.00 .93 .67 .10
2A1 C5 .38 .42 .26 3.08 .93 .68 .10
2A1 C6 .35 .42 .009 .007 .26 3.11 .95 .72 .11
46

STEP 2, INGOT 1
SPECIMEN C Mn P S Si Ni Cr Mo V
1D2 Cl .36 .41 .008 .006 .29 3.00 .94 .65 .11
1D2 C2 .37 .40 .26 3.10 .93 .68 .11
1D2 C3 .35 .40 .26 3.03 .92 .67 .10
1D2 CTR .35 .43 .010 .004 .26 3.04 .96 .67 .12
1D2 C4 .33 .40 .26 3.10 .90 .66 .10
1D2 C5 .34 .40 .26 3.10 .92 .66 .11
1D2 C6 .37 .44 .009 .006 .26 3.07 .95 .66 .11
1B2 Cl .37 .40 .011 .007 .24 2.94 .93 .66 .11
1B2 C2 .385 .40 .26 3.00 .94 .66 .11
1B2 C3 .34 .40 .25 2.99 .91 .65 .10
1B2 CTR .34 .44 .010 .011 .26 3.00 .98 .68 .12
1B2 C4 .325 .39 .25 3.00 .91 .64 .10
1B2 C5 .37 .42 .27 3.05 .92 .68 .11
1B2 C6 .36 .43 .009 .009 .26 3.10 .95 .69 .12
1A2 Cl .36 .46 .009 .008 .26 2.91 .97 .68 .11
1A2 C2 .32 .40 .27 3.10 .95 .68 .11
1A2 C3 .34 .37 .25 2.96 .90 .61 .10
1A2 CTR .34 .35 .008 .004 .25 3.12 .91 .61 .11
1A2 C4 .38 .40 .27 3.10 .90 .66 .11
1A2 C5 .33 .39 .27 3.09 .93 .64 .11
1A2 C6 .36 .39 .010 .007 .25 2.94 .92 .66 .11
47

STEP 2, INGOT 2
SPECIMEN C Mn P S Si Ni Cr Mo V
2D2 Cl .37 .47 .008 .007 .28 3.19 .93 .66 .13
2D2 C2 .365 .39 *
.25 3.05 .90 .64 .10
2D2 C3 .36 .37 .24 3.14 .93 .66 .10
2D2 CTR .37 .39 .009 .005 .25 3.09 .93 .63 .11
2D2 C4 .34 .39 .26 3.15 .92 .64 .10
2D2 C5 .37 .38 .26 3.18 .93 .68 .11
2D2 C6 .36 .47 .007 .006 .27 3.23 .95 .67 .12
2B2 Cl .33 .40 .009 .006 .24 2.91 .92 .63 .10
2B2 C2 .38 .43 .25 3.06 .93 .65 .11
2B2 C3 .365 .41 .26 3.09 .93 .65 .11
2B2 CTR .36 .40 .010 .003 .25 3.03 .93 .63 .11
2B2 C4 .335 .38 .23 2.95 .93 .61 .10
2B2 C5 .39 .38 .24 3.03 .92 .66 .10
2B2 C6 .33 .44 .009 .007 .24 2.90 .94 .61 .11
2A2 Cl .36 .39 .008 .007 .23 2.89 .92 .65 .10
2A2 C2 .37 .39 .25 3.00 .93 .63 .11
2A2 C3 .35 .41 .26 2.99 .91 .64 .11
2A2 CTR .31 .37 .009 .003 .22 2.99 .92 .59 .10
2A2 C4 .32 .40 .26 3.03 .93 .65 .11
2A2 C5 .395 .39 .25 2.99 .94 .63 .11
2A2 C6 .36 .48 .009 .009 .27 3.01 .96 .66 .12
48

STEP 3 INGOT 1
SPECIMEN C m_ P s §i Nl Cr Mo V
1D3 Cl .34 .43 .010 .007 .27 3.04 .95 .68 .11
1D3 C2 .36 .38 .25 2.96 .93 .65 .10
1D3 C3 .34 .37 .24 2.96 .91 .60 .10
1D3 CTR .35 .36 .012 .007 .26 3.10 .90 .66 .11
1D3 C4 .377 .38 .25 3.00 .92 .63 .10
1D3 C5 .315 .37 .24 3.00 .92 .62 .10
1D3 C6 .36 .40 .010 .007 .26 3.09 .95 .68 .11
1B3 Cl .34 .41 .009 .005 .26 2.93 .93 .66 .11
1B3 C2 .37 .39 .25 3.05 .93 .64 .11
1B3 C3 .33 .39 .25 3.06 .92 .64 .11
1B3 CTR .36 .35 .011 .010 .25 3.06 .89 .65 .11
1B3 C4 .36 .38 .24 3.10 .91 .65 .11
1B3 C5 .36 .40 .25 3.10 .94 .66 .11
1B3 C6 .34 .40 .008 .006 .25 2.89 .90 .64 .11
1A3 Cl .36 .45 .009 .007 .24 2.79 .96 .66 .11
1A3 C2 .37 .45 .26 3.06 .93 .67 .11
1A3 C3 .34 .42 .24 3.06 .92 .63 .10
1A3 CTR .32 .35 .010 .006 .25 2.97 .90 .63 .10
1A3 C4 .34 .42 .24 3.06 .92 .62 .10
1A3 C5 .34 .42 .25 3.07 .94 .66 .11
1A3 C6 .37 .43 .010 .0097 .25 2.76 .96 .66 .11
49

STEP 3 INGOT 2
SPECIMEN C to P s §i. Ni Cr Mo V
2D3 Cl .34 .44 .007 .005 .27 3.09 .91 .64 12
2D3 C2 .395 .38 .26 3.14 .91 .66 10
2D3 C3 .385 .40 .27 3.20 .92 .69 11
2D3 CTR .37 .36 .009 .005 .26 3.08 .90 .66 11
2D3 C4 .395 .40 .27 3.16 .91 .68 11
2D3 C5 .365 .39 .27 3.19 .94 .68 11
2D3 C6 .34 .43 .008 .005 .28 3.15 .92 .66 11
2B3 Cl .36 .39 .009 .007 .25 2.94 .92 .66 10
2B3 C2 .385 .38 .21 3.02 .91 .60 10
2B3 C3 .35 .42 .24 3.00 .92 .64 10
2B3 CTR .40 .36 .010 .007 .26 2.94 .90 .64 10
2B3 C4 .37 .39 .25 3.02 .90 .63 .10
2B3 C5 .37 .40 .25 3.06 .90 .64 .10
2B3 C6 .35 .43 .011 .007 .25 3.00 .92 .66 .10
2A3 Cl .35 .45 .007 .005 .26 2.85 .96 .67 .11
2A3 C2 .33 .42 .26 3.05 .92 .68 .11
2A3 C3 .39 .43 .26 3.03 .93 .68 .11
2A3 CTR .35 .35 .008 .006 .25 3.03 .90 .66 .11
2A3 C4 .39 .41 .25 3.05 .93 .68 .11
2A3 C5 .33 .41 .26 3.07 .93 .68 .11
2A3 C6 .34 .43 .010 .006 .27 2.96 .95 .66 .11
50

STEP 4 INGOT 1
SPECIMEN C Nto P S Si_ Ni Cr Mo V
1D4 Cl .32 .38 .009 .005 .25 3.11 .95 .65 .11
1D4 C2 .385 .39 .25 3.06 .93 .65 .10
1D4 C3 .355 .36 .24 3.04 .92 .64 .10
1D4 CTR .32 .42 .012 .007 .25 3.09 .91 .65 .10
1D4 C4 .35 .40 .26 3.10 .96 .68 .11
1D4 C5 .344 .39 .25 3.01 .93 .66 .10
1D4 C6 .31 .38 .008 .004 .25 3.11 .94 .66 .11
1B4 Cl .33 .39 .008 .004 .25 2.88 .95 .64 .11
1B4 C2 .385 .40 .25 2.97 .94 .65 .10
1B4 C3 .34 .38 .25 2.98 .93 .65 .10
1B4 CTR .33 .43 .012 .009 .25 3.00 .91 .65 .10
1B4 C4 .33 .39 .25 3.05 .93 .64 .10
1B4 CS .382 .39 .25 2.99 .93 .65 .10
1B4 C6 .34 .42 .008 .005 .25 3.10 .96 .66 .11
1A4 Cl .37 .41 .010 .005 .26 3.16 .95 .64 .11
1A4 C2 .37 .40 .23 3.00 .91 .63 .10
1A4 C3 .32 .44 .25 3.12 .94 .67 .11
1A4 CTR .32 .43 .012 .012 .25 3.06 .91 .65 .10
1A4 C4 .33 .41 .24 3.05 .92 .66 .10
1A4 C5 .36 .42 .25 3.11 .92 .65 .11
1A4 C6 .35 .40 .009 .006 .26 3.18 .93 .65 .11
51

STEP 4 INGOT 2
SPECIMEN C Mn P s Si Ni_ Cr Kto V
2D4 Cl .34 .43 .007 .004 .28 3.16 .96 .62 .11
2D4 C2 .335 .38 .27 3.15 .92 .68 .11
2D4 C3 .375 .38 .27 3.13 .91 .68 .10
2D4 CTR .33 .42 .012 .008 .28 3.07 .91 .69 .10
2D4 C4 .36 .37 .27 3.04 .91 .66 .10
2D4 C5 .39 .39 .27 3.06 .92 .68 .11
2D4 C6 .36 .40 .007 .004 .25 3.03 .94 .60 .11
2B4 Cl .30 .39 .008 .004 .26 3.09 .95 .62 .11
2B4 C2 .39 .39 .26 3.10 .92 .68 .11
2B4 C3 .38 .38 .25 3.14 .90 .67 .10
2B4 CTR .34 .43 .013 .006 .25 3.12 .91 .68 .10
2B4 C4 .38 .39 .26 3.10 .91 .66 .10
2B4 C5 .39 .43 .26 3.14 .92 .68 .11
2B4 C6 .35 .40 .007 .004 .27 3.13 .94 .64 .11
2A4 Cl .34 .43 .008 .004 .28 3.16 .96 .62 .11
2A4 C2 .39 .40 .24 3.03 .92 .68 .11
2A4 C3 .37 .40 .24 3.00 .91 .67 .10
2A4 CTR .33 .42 .010 .008 .25 3.07 .91 .69 .10
2A4 C4 .345 .39 .23 3.00 .90 .61 .10
2A4 C5 .37 .41 .25 3.10 .91 .64 .10
2A4 C6 .36 .40 .008 .004 .25 3.03 .94 .60 .11
52

WATERVLIET ARSENAL INTERNAL DISTRIBUTION LIST May 1976
No. of Copies
COMMANDER 1
DIRECTOR, BENET WEAPONS LABORATORY 1
DIRECTOR, DEVELOPMENT ENGINEERING DIRECTORATE 1 ATTN: RD-AT 1
RD-MR 1 RD-PE 1 RD-RM 1 RD-SE 1 RD-SP 1
DIRECTOR, ENGINEERING SUPPORT DIRECTORATE 1
DIRECTOR, RESEARCH DIRECTORATE 2 ATTN: RR-AM 1
RR-C 1 RR-ME 1 RR-PS 1
TECHNICAL LIBRARY 5
TECHNICAL PUBLICATIONS $ EDITING BRANCH 2
DIRECTOR, OPERATIONS DIRECTORATE 1
DIRECTOR, PROCUREMENT DIRECTORATE 1
DIRECTOR, PRODUCT ASSURANCE DIRECTORATE 1
PATENT ADVISORS 1


EXTERNAL DISTRIBUTION LIST
1 copy to each May 1976
CDR US ARMY MAT § DEV READ. COMD ATTN: DRCRD
DRCRD-TC DRCRD-W
5001 EISENHOWER AVE ALEXANDRIA, VA 22304
OFC OF THE DIR. OF DEFENSE RSE ATTN: ASST DIRECTOR MATERIALS THE PENTAGON WASHINGTON, D.C. 20315
CDR US ARMY TANK-AUTMV COMD ATTN: AMDTA-UL
AMSTA-RKM MAT LAB WARREN, MICHIGAN 48090
CDR PICATINNY ARSENAL ATTN: SARPA-TS-S
SARPA-VP3 (PLASTICS TECH EVAL CEN)
DOVER, NJ 07801
CDR FRANKFORD ARSENAL ATTN: SARFA PHILADELPHIA, PA 19137
DIRECTOR US ARMY BALLISTIC RSCH LABS ATTN: AMXBR-LB ABERDEEN PROVING GROUND MARYLAND 21005
CDR US ARMY RSCH OFC (DURHAM) BOX CM, DUKE STATION ATTN: RDRD-IPL DURHAM, NC 27706
CDR WEST POINT MIL ACADEMY ATTN: CHMN, MECH ENGR DEPT WEST POINT, NY 10996
CDR US ARMY ARNfT COMD ATTN: AMSAR-PPW-IR
AMSAR-RD AMSAR-RDG
ROCK ISLAND, IL 61201
CDR US ARMY ARNfT COMD FLD SVC DIV ARMCOM ARNfT SYS OFC ATTN: AMSAR-ASF ROCK ISLAND, IL 61201
CDR US ARMY ELCT COMD FT MONMOUTH, NJ 07703
CDR REDSTONE ARSENAL ATTN: AMSMI-RRS
AMSMI-RSM ALABAMA 35809
CDR ROCK ISLAND ARSENAL ATTN: SARRI-RDD ROCK ISLAND, IL 61202
CDR US ARMY FGN SCIENCE § TECH CEN ATTN: AMXST-SD 220 7TH STREET N.E. CHARLOTTESVILLE, VA 22901
DIRECTOR US ARMY PDN EQ. AGENCY ATTN: AMXPE-NfT ROCK ISLAND, IL 61201
CDR HQ, US ARMY AVN SCH ATTN: OFC OF THE LIBRARIAN FT RUCKER, ALABAMA 36362

EXTERNAL DISTRIBUTION LIST (Cont)
1 copy to each
CDR US NAVAL WPNS LAB CHIEF, MAT SCIENCE DIV ATTN: MR. D. MALYEVAC DAHLGREN, VA 22448
DIRECTOR NAVAL RSCH LAB ATTN: DIR. MECH DIV WASHINGTON, D.C. 20375
DIRECTOR NAVAL RSCH LAB CODE 26-27 (DOCU LIB.) WASHINGTON, D.C. 20375
NASA SCIENTIFIC $ TECH INFO FAC PO BOX 8757, ATTN: ACQ BR BALTIMORE/WASHINGTON INTL AIRPORT MARYLAND 21240
2 copies to each
CDR US ARMY MOB EQUIP RSCH $ DEV COMD ATTN: TECH DOCU CEN FT BELVOIR, VA 22060
CDR US ARMY MAT RSCH AGCY ATTN: AMXMR - TECH INFO CEN WATERTOWN, MASS 02172
CDR WRIGHT-PATTERSON AFB ATTN: AFML/MXA OHIO 45433
CDR REDSTONE ARSENAL ATTN: DOCU $ TECH INFO BR ALABAMA 35809
DEFENSE METALS INFO CEN BATTELLE INSTITUTE 505 KING AVE COLUMBUS, OHIO 43201
MANUEL E. PRADO / G. STISSER LAWRENCE LIVERMORE LAB PO BOX 808 LIVERMORE, CA 94550
DR. ROBERT QUATTRONE CHIEF, MAT BR US ARMY RSS GROUP, EUR BOX 65, FPO N.Y. 09510
12 copies
CDR DEFENSE DOCU CEN ATTN: DDC-TCA CAMERON STATION ALEXANDRIA, VA 22314
NOTE: PLEASE NOTIFY CDR, WATERVLIET ARSENAL, ATTN: SARWV-RT-TP, WATERVLIET, N.Y. 12189, IF ANY CHANGE IS REQUIRED TO THE ABOVE,


DEPARTMENT OF THE ARMY WATERVLfET ARSENAL
WATERVLIET, N. Y. 12189
OFFICIAL BUSINESS
PENALTY FOR PRIVATE USE. $300
SARWV-RDT-TP
POSTAGE AND FEES PAID DEPARTMENT OF THE ARMY
D0D-3U
THIRD CLASS
. V M COMMANDER *_JJS_AFJIY FIELD SSRVTCFTTV^ ARaJOü A.T ■ oY3| ATTN. AM3AR-A3F ROCK ISLAND. ILLINOIS 61201
ARMAMENT COJID,
N TEMo OFFICE
V