Variation in the circularly polarized light reflection of...
9
rsif.royalsocietypublishing.org Research Cite this article: Carter IE, Weir K, McCall MW, Parker AR. 2016 Variation in the circularly polarized light reflection of Lomaptera (Scarabaeidae) beetles. J. R. Soc. Interface 13: 20160015. http://dx.doi.org/10.1098/rsif.2016.0015 Received: 7 January 2016 Accepted: 13 June 2016 Subject Category: Life Sciences–Physics interface Subject Areas: biomimetics, biophysics Keywords: scarab beetle, circular polarization, structural colour, chiral, birefringent, chitin Author for correspondence: I. E. Carter e-mail: [email protected] Electronic supplementary material is available at http://dx.doi.org/10.1098/rsif.2016.0015 or via http://rsif.royalsocietypublishing.org. Variation in the circularly polarized light reflection of Lomaptera (Scarabaeidae) beetles I. E. Carter 1 , K. Weir 1 , M. W. McCall 1 and A. R. Parker 2 1 The Blackett Laboratory, Imperial College London, Prince Consort Road, London SW7 2AZ, UK 2 Department of Life Sciences, Natural History Museum, Cromwell Road, London SW7 5BD, UK An extended spectroscopic study on the left-through-left circularly polarized reflection spectra of a large number of beetles from the Australasian Scrabaeidae:Cetoniinae of the Lomaptera genus was undertaken. We have obtained a five-category spectral classification. The principal spectral features, which even within the genus range from blue to infrared, are related to structural chirality in the beetle shells. The detailed features of each spectral classification are related to different structural perturbations of the helix, including various pitch values and abrupt twist defects. These spectral charac- teristics and associated shell structures are confirmed on the basis of simple modelling. An important conclusion from our study is that the simple helical structure resulting in a single symmetric Bragg peak is not the dominant spectral type. Rather the reality is a rich tapestry of spectral types. One intriguing specimen is identified via a scanning electron micrograph to consist of a double interstitial helix leading to a particular double-peak spectrum. 1. Introduction For over 100 years since Michelson’s discovery of the circularly polarized (CP) light mechanism responsible for iridescence in Scarabaeidae beetles [1], this has been a subject of study across a wide range of fields, including biology, optics and even engineering [2]. In 1924, Gaubert observed that these beetles appeared to reflect left circularly polarized (LCP) light [3]. It was later shown by Neville & Caveney [4] that a small minority of beetles reflected right circularly polar- ized (RCP) light. This prompts further interest as there are very few species in Nature which interact with CP light that include the marine stomatopod Odontodactylus and several species of firefly [5–8]. A general study on the reflection from a wide range of different beetles of the degree of CP light and colour was conducted by Pye, who found optically active (induces change in the polarization of incident light upon reflection) species in the Scarabaeidae and Hybosoridae families, which mainly reflected LCP light [9]. The advantages of this selective reflection are as yet not fully understood. It is however known that several species of Scarabaeidae can navigate using Rayleigh scattered (or polarized) light from the moon [10]. 2. The optical response of the beetle cuticle The beetles examined in this study have a very distinctive appearance. Typically, they are green (though other visible wavelengths have been observed) and they have an iridescent, metallic sheen. As previously mentioned, earlier studies have noted the distinctive polarization characteristics of the reflected light and, together with microscope examination of the structure of the beetle’s carapace, this has resulted in a simple model of the reflection mechanism. The beetle’s shell is taken to primarily consist of thin layers of thread-like molecules (chitin) with all the threads aligned parallel within a single layer. The anisotropy of the & 2016 The Authors. Published by the Royal Society under the terms of the Creative Commons Attribution License http://creativecommons.org/licenses/by/4.0/, which permits unrestricted use, provided the original author and source are credited. on June 6, 2018 http://rsif.royalsocietypublishing.org/ Downloaded from
Transcript of Variation in the circularly polarized light reflection of...
on June 6, 2018http://rsif.royalsocietypublishing.org/Downloaded from
rsif.royalsocietypublishing.org
ResearchCite this article: Carter IE, Weir K, McCall
MW, Parker AR. 2016 Variation in the circularly
polarized light reflection of Lomaptera
(Scarabaeidae) beetles. J. R. Soc. Interface 13:
20160015.
http://dx.doi.org/10.1098/rsif.2016.0015
Received: 7 January 2016
Accepted: 13 June 2016
Subject Category:Life Sciences – Physics interface
Subject Areas:biomimetics, biophysics
Keywords:scarab beetle, circular polarization, structural
colour, chiral, birefringent, chitin
Author for correspondence:I. E. Carter
e-mail: [email protected]
Electronic supplementary material is available
at http://dx.doi.org/10.1098/rsif.2016.0015 or
via http://rsif.royalsocietypublishing.org.
& 2016 The Authors. Published by the Royal Society under the terms of the Creative Commons AttributionLicense http://creativecommons.org/licenses/by/4.0/, which permits unrestricted use, provided the originalauthor and source are credited.Variation in the circularly polarized lightreflection of Lomaptera (Scarabaeidae)beetles
I. E. Carter1, K. Weir1, M. W. McCall1 and A. R. Parker2
1The Blackett Laboratory, Imperial College London, Prince Consort Road, London SW7 2AZ, UK2Department of Life Sciences, Natural History Museum, Cromwell Road, London SW7 5BD, UK
An extended spectroscopic study on the left-through-left circularly polarized
reflection spectra of a large number of beetles from the Australasian
Scrabaeidae:Cetoniinae of the Lomaptera genus was undertaken. We have
obtained a five-category spectral classification. The principal spectral features,
which even within the genus range from blue to infrared, are related to
structural chirality in the beetle shells. The detailed features of each spectral
classification are related to different structural perturbations of the helix,
including various pitch values and abrupt twist defects. These spectral charac-
teristics and associated shell structures are confirmed on the basis of simple
modelling. An important conclusion from our study is that the simple helical
structure resulting in a single symmetric Bragg peak is not the dominant
spectral type. Rather the reality is a rich tapestry of spectral types. One
intriguing specimen is identified via a scanning electron micrograph to consist
of a double interstitial helix leading to a particular double-peak spectrum.
1. IntroductionFor over 100 years since Michelson’s discovery of the circularly polarized (CP)
light mechanism responsible for iridescence in Scarabaeidae beetles [1], this has
been a subject of study across a wide range of fields, including biology, optics
and even engineering [2]. In 1924, Gaubert observed that these beetles appeared
to reflect left circularly polarized (LCP) light [3]. It was later shown by Neville
& Caveney [4] that a small minority of beetles reflected right circularly polar-
ized (RCP) light. This prompts further interest as there are very few species
in Nature which interact with CP light that include the marine stomatopod
Odontodactylus and several species of firefly [5–8].
A general study on the reflection from a wide range of different beetles of
the degree of CP light and colour was conducted by Pye, who found optically
active (induces change in the polarization of incident light upon reflection)
species in the Scarabaeidae and Hybosoridae families, which mainly reflected
LCP light [9]. The advantages of this selective reflection are as yet not fully
understood. It is however known that several species of Scarabaeidae can
navigate using Rayleigh scattered (or polarized) light from the moon [10].
2. The optical response of the beetle cuticleThe beetles examined in this study have a very distinctive appearance. Typically,
they are green (though other visible wavelengths have been observed) and they
have an iridescent, metallic sheen. As previously mentioned, earlier studies
have noted the distinctive polarization characteristics of the reflected light and,
together with microscope examination of the structure of the beetle’s carapace,
this has resulted in a simple model of the reflection mechanism. The beetle’s
shell is taken to primarily consist of thin layers of thread-like molecules (chitin)
with all the threads aligned parallel within a single layer. The anisotropy of the
½ pitchdistance
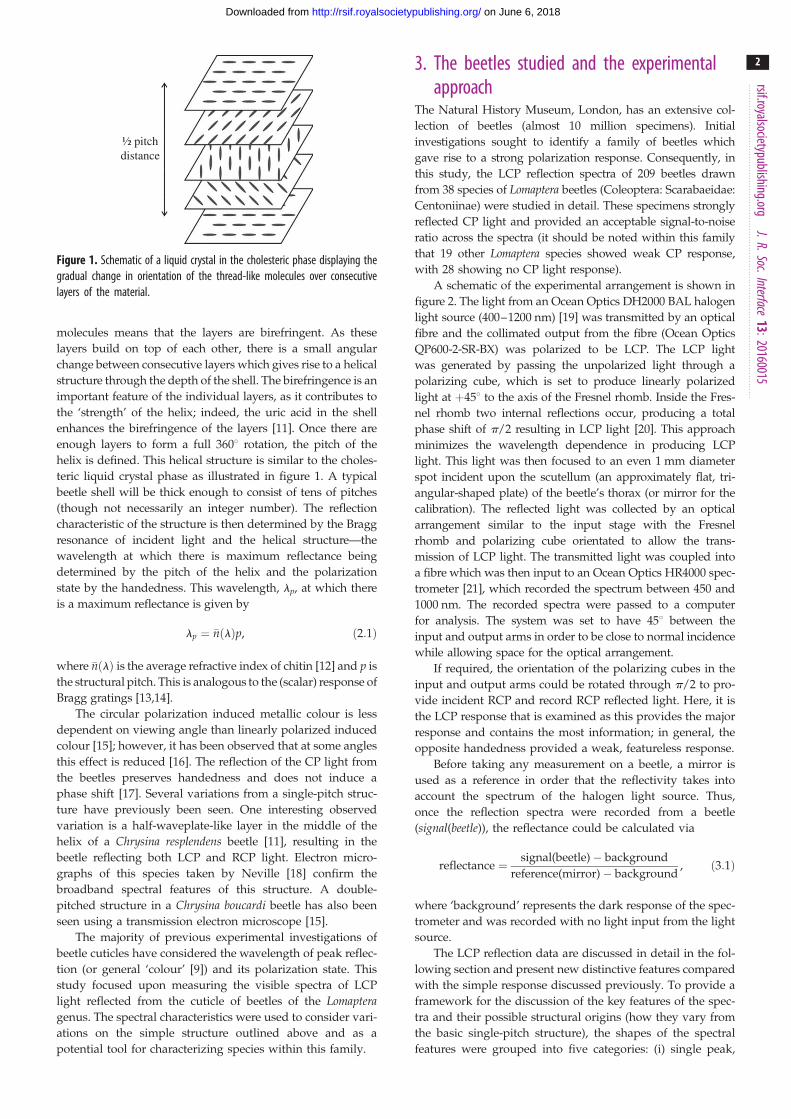
Figure 1. Schematic of a liquid crystal in the cholesteric phase displaying thegradual change in orientation of the thread-like molecules over consecutivelayers of the material.
rsif.royalsocietypublishing.orgJ.R.Soc.Interface
13:20160015
2
on June 6, 2018http://rsif.royalsocietypublishing.org/Downloaded from
molecules means that the layers are birefringent. As these
layers build on top of each other, there is a small angular
change between consecutive layers which gives rise to a helical
structure through the depth of the shell. The birefringence is an
important feature of the individual layers, as it contributes to
the ‘strength’ of the helix; indeed, the uric acid in the shell
enhances the birefringence of the layers [11]. Once there are
enough layers to form a full 3608 rotation, the pitch of the
helix is defined. This helical structure is similar to the choles-
teric liquid crystal phase as illustrated in figure 1. A typical
beetle shell will be thick enough to consist of tens of pitches
(though not necessarily an integer number). The reflection
characteristic of the structure is then determined by the Bragg
resonance of incident light and the helical structure—the
wavelength at which there is maximum reflectance being
determined by the pitch of the helix and the polarization
state by the handedness. This wavelength, lp, at which there
is a maximum reflectance is given by
lp ¼ �nðlÞp, ð2:1Þ
where �nðlÞ is the average refractive index of chitin [12] and p is
the structural pitch. This is analogous to the (scalar) response of
Bragg gratings [13,14].
The circular polarization induced metallic colour is less
dependent on viewing angle than linearly polarized induced
colour [15]; however, it has been observed that at some angles
this effect is reduced [16]. The reflection of the CP light from
the beetles preserves handedness and does not induce a
phase shift [17]. Several variations from a single-pitch struc-
ture have previously been seen. One interesting observed
variation is a half-waveplate-like layer in the middle of the
helix of a Chrysina resplendens beetle [11], resulting in the
beetle reflecting both LCP and RCP light. Electron micro-
graphs of this species taken by Neville [18] confirm the
broadband spectral features of this structure. A double-
pitched structure in a Chrysina boucardi beetle has also been
seen using a transmission electron microscope [15].
The majority of previous experimental investigations of
beetle cuticles have considered the wavelength of peak reflec-
tion (or general ‘colour’ [9]) and its polarization state. This
study focused upon measuring the visible spectra of LCP
light reflected from the cuticle of beetles of the Lomapteragenus. The spectral characteristics were used to consider vari-
ations on the simple structure outlined above and as a
potential tool for characterizing species within this family.
3. The beetles studied and the experimentalapproach
The Natural History Museum, London, has an extensive col-
lection of beetles (almost 10 million specimens). Initial
investigations sought to identify a family of beetles which
gave rise to a strong polarization response. Consequently, in
this study, the LCP reflection spectra of 209 beetles drawn
from 38 species of Lomaptera beetles (Coleoptera: Scarabaeidae:
Centoniinae) were studied in detail. These specimens strongly
reflected CP light and provided an acceptable signal-to-noise
ratio across the spectra (it should be noted within this family
that 19 other Lomaptera species showed weak CP response,
with 28 showing no CP light response).
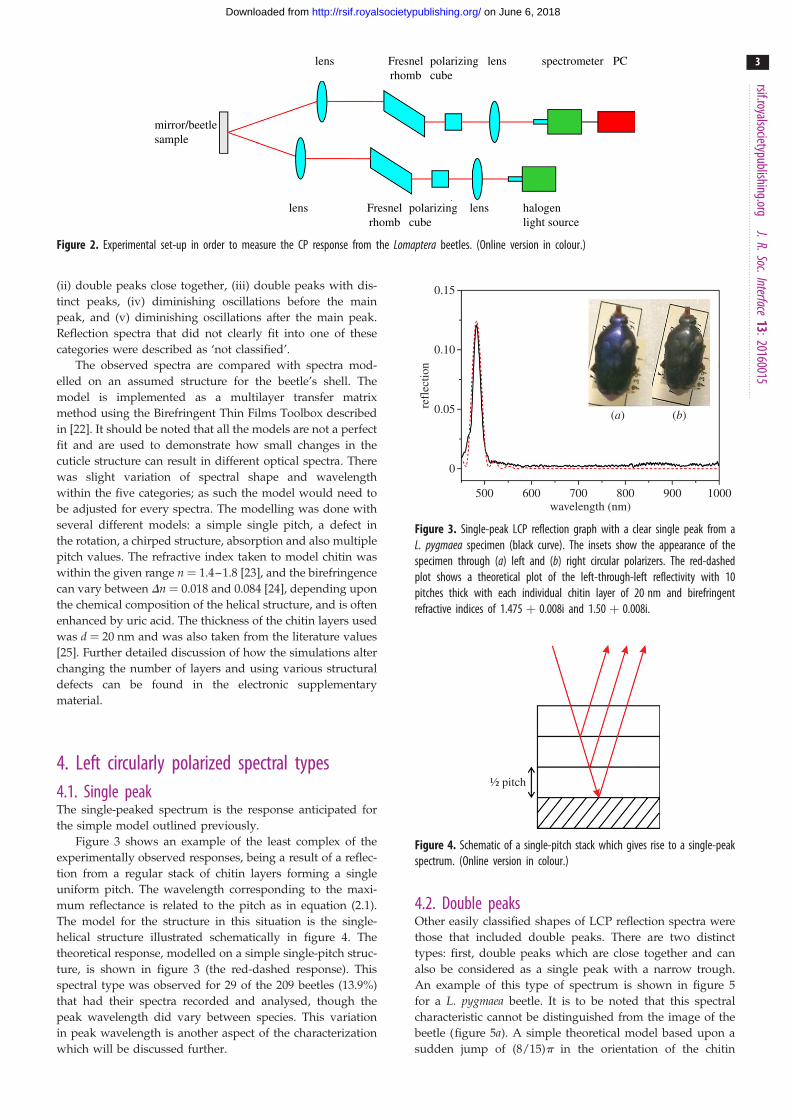
A schematic of the experimental arrangement is shown in
figure 2. The light from an Ocean Optics DH2000 BAL halogen
light source (400–1200 nm) [19] was transmitted by an optical
fibre and the collimated output from the fibre (Ocean Optics
QP600-2-SR-BX) was polarized to be LCP. The LCP light
was generated by passing the unpolarized light through a
polarizing cube, which is set to produce linearly polarized
light at þ458 to the axis of the Fresnel rhomb. Inside the Fres-
nel rhomb two internal reflections occur, producing a total
phase shift of p/2 resulting in LCP light [20]. This approach
minimizes the wavelength dependence in producing LCP
light. This light was then focused to an even 1 mm diameter
spot incident upon the scutellum (an approximately flat, tri-
angular-shaped plate) of the beetle’s thorax (or mirror for the
calibration). The reflected light was collected by an optical
arrangement similar to the input stage with the Fresnel
rhomb and polarizing cube orientated to allow the trans-
mission of LCP light. The transmitted light was coupled into
a fibre which was then input to an Ocean Optics HR4000 spec-
trometer [21], which recorded the spectrum between 450 and
1000 nm. The recorded spectra were passed to a computer
for analysis. The system was set to have 458 between the
input and output arms in order to be close to normal incidence
while allowing space for the optical arrangement.
If required, the orientation of the polarizing cubes in the
input and output arms could be rotated through p/2 to pro-
vide incident RCP and record RCP reflected light. Here, it is
the LCP response that is examined as this provides the major
response and contains the most information; in general, the
opposite handedness provided a weak, featureless response.
Before taking any measurement on a beetle, a mirror is
used as a reference in order that the reflectivity takes into
account the spectrum of the halogen light source. Thus,
once the reflection spectra were recorded from a beetle
(signal(beetle)), the reflectance could be calculated via
reflectance ¼ signal(beetle)� background
reference(mirror)� background, ð3:1Þ
where ‘background’ represents the dark response of the spec-
trometer and was recorded with no light input from the light
source.
The LCP reflection data are discussed in detail in the fol-
lowing section and present new distinctive features compared
with the simple response discussed previously. To provide a
framework for the discussion of the key features of the spec-
tra and their possible structural origins (how they vary from
the basic single-pitch structure), the shapes of the spectral
features were grouped into five categories: (i) single peak,
lens lens spectrometer PCFresnelrhomb
polarizingcube
halogenlight source
Fresnelrhomb
polarizingcube
lens lens
mirror/beetlesample
Figure 2. Experimental set-up in order to measure the CP response from the Lomaptera beetles. (Online version in colour.)
0.15
0.10
refl
ectio
n0.05
0
500 600 700wavelength (nm)
800 900
(a) (b)
1000
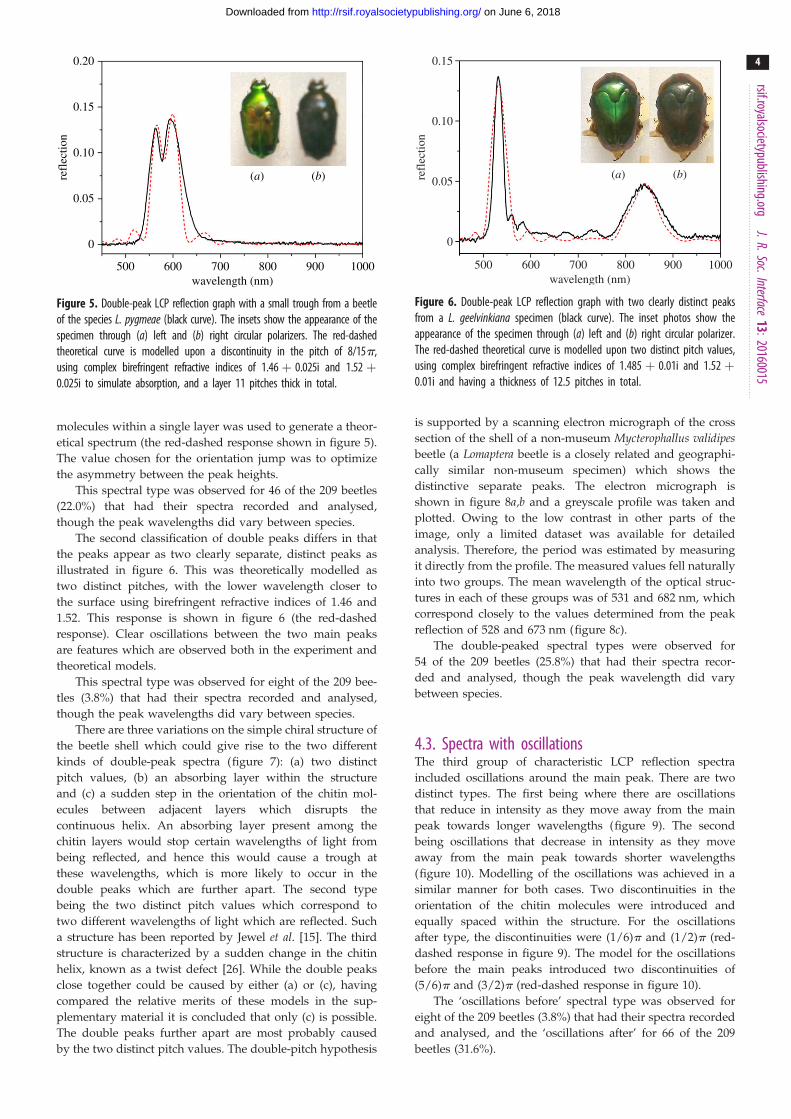
Figure 3. Single-peak LCP reflection graph with a clear single peak from aL. pygmaea specimen (black curve). The insets show the appearance of thespecimen through (a) left and (b) right circular polarizers. The red-dashedplot shows a theoretical plot of the left-through-left reflectivity with 10pitches thick with each individual chitin layer of 20 nm and birefringentrefractive indices of 1.475 þ 0.008i and 1.50 þ 0.008i.
rsif.royalsocietypublishing.orgJ.R.Soc.Interface
13:20160015
3
on June 6, 2018http://rsif.royalsocietypublishing.org/Downloaded from
(ii) double peaks close together, (iii) double peaks with dis-
tinct peaks, (iv) diminishing oscillations before the main
peak, and (v) diminishing oscillations after the main peak.
Reflection spectra that did not clearly fit into one of these
categories were described as ‘not classified’.
The observed spectra are compared with spectra mod-
elled on an assumed structure for the beetle’s shell. The
model is implemented as a multilayer transfer matrix
method using the Birefringent Thin Films Toolbox described
in [22]. It should be noted that all the models are not a perfect
fit and are used to demonstrate how small changes in the
cuticle structure can result in different optical spectra. There
was slight variation of spectral shape and wavelength
within the five categories; as such the model would need to
be adjusted for every spectra. The modelling was done with
several different models: a simple single pitch, a defect in
the rotation, a chirped structure, absorption and also multiple
pitch values. The refractive index taken to model chitin was
within the given range n ¼ 1.4–1.8 [23], and the birefringence
can vary between Dn ¼ 0.018 and 0.084 [24], depending upon
the chemical composition of the helical structure, and is often
enhanced by uric acid. The thickness of the chitin layers used
was d ¼ 20 nm and was also taken from the literature values
[25]. Further detailed discussion of how the simulations alter
changing the number of layers and using various structural
defects can be found in the electronic supplementary
material.
½ pitch
Figure 4. Schematic of a single-pitch stack which gives rise to a single-peakspectrum. (Online version in colour.)
4. Left circularly polarized spectral types4.1. Single peakThe single-peaked spectrum is the response anticipated for
the simple model outlined previously.
Figure 3 shows an example of the least complex of the
experimentally observed responses, being a result of a reflec-
tion from a regular stack of chitin layers forming a single
uniform pitch. The wavelength corresponding to the maxi-
mum reflectance is related to the pitch as in equation (2.1).
The model for the structure in this situation is the single-
helical structure illustrated schematically in figure 4. The
theoretical response, modelled on a simple single-pitch struc-
ture, is shown in figure 3 (the red-dashed response). This
spectral type was observed for 29 of the 209 beetles (13.9%)
that had their spectra recorded and analysed, though the
peak wavelength did vary between species. This variation
in peak wavelength is another aspect of the characterization
which will be discussed further.
4.2. Double peaksOther easily classified shapes of LCP reflection spectra were
those that included double peaks. There are two distinct
types: first, double peaks which are close together and can
also be considered as a single peak with a narrow trough.
An example of this type of spectrum is shown in figure 5
for a L. pygmaea beetle. It is to be noted that this spectral
characteristic cannot be distinguished from the image of the
beetle (figure 5a). A simple theoretical model based upon a
sudden jump of (8/15)p in the orientation of the chitin
0.15
0.20
0.10
refl
ectio
n
0.05
0
500 600 700wavelength (nm)
800 900
(a) (b)
1000
(a) (b)
Figure 5. Double-peak LCP reflection graph with a small trough from a beetleof the species L. pygmeae (black curve). The insets show the appearance of thespecimen through (a) left and (b) right circular polarizers. The red-dashedtheoretical curve is modelled upon a discontinuity in the pitch of 8/15p,using complex birefringent refractive indices of 1.46þ 0.025i and 1.52 þ0.025i to simulate absorption, and a layer 11 pitches thick in total.
0.15
0.10
refl
ectio
n
0.05
0
500 600 700wavelength (nm)
800 900
(a) (b)
1000
Figure 6. Double-peak LCP reflection graph with two clearly distinct peaksfrom a L. geelvinkiana specimen (black curve). The inset photos show theappearance of the specimen through (a) left and (b) right circular polarizer.The red-dashed theoretical curve is modelled upon two distinct pitch values,using complex birefringent refractive indices of 1.485 þ 0.01i and 1.52 þ0.01i and having a thickness of 12.5 pitches in total.
rsif.royalsocietypublishing.orgJ.R.Soc.Interface
13:20160015
4
on June 6, 2018http://rsif.royalsocietypublishing.org/Downloaded from
molecules within a single layer was used to generate a theor-
etical spectrum (the red-dashed response shown in figure 5).
The value chosen for the orientation jump was to optimize
the asymmetry between the peak heights.
This spectral type was observed for 46 of the 209 beetles
(22.0%) that had their spectra recorded and analysed,
though the peak wavelengths did vary between species.
The second classification of double peaks differs in that
the peaks appear as two clearly separate, distinct peaks as
illustrated in figure 6. This was theoretically modelled as
two distinct pitches, with the lower wavelength closer to
the surface using birefringent refractive indices of 1.46 and
1.52. This response is shown in figure 6 (the red-dashed
response). Clear oscillations between the two main peaks
are features which are observed both in the experiment and
theoretical models.
This spectral type was observed for eight of the 209 bee-
tles (3.8%) that had their spectra recorded and analysed,
though the peak wavelengths did vary between species.
There are three variations on the simple chiral structure of
the beetle shell which could give rise to the two different
kinds of double-peak spectra (figure 7): (a) two distinct
pitch values, (b) an absorbing layer within the structure
and (c) a sudden step in the orientation of the chitin mol-
ecules between adjacent layers which disrupts the
continuous helix. An absorbing layer present among the
chitin layers would stop certain wavelengths of light from
being reflected, and hence this would cause a trough at
these wavelengths, which is more likely to occur in the
double peaks which are further apart. The second type
being the two distinct pitch values which correspond to
two different wavelengths of light which are reflected. Such
a structure has been reported by Jewel et al. [15]. The third
structure is characterized by a sudden change in the chitin
helix, known as a twist defect [26]. While the double peaks
close together could be caused by either (a) or (c), having
compared the relative merits of these models in the sup-
plementary material it is concluded that only (c) is possible.
The double peaks further apart are most probably caused
by the two distinct pitch values. The double-pitch hypothesis
is supported by a scanning electron micrograph of the cross
section of the shell of a non-museum Mycterophallus validipesbeetle (a Lomaptera beetle is a closely related and geographi-
cally similar non-museum specimen) which shows the
distinctive separate peaks. The electron micrograph is
shown in figure 8a,b and a greyscale profile was taken and
plotted. Owing to the low contrast in other parts of the
image, only a limited dataset was available for detailed
analysis. Therefore, the period was estimated by measuring
it directly from the profile. The measured values fell naturally
into two groups. The mean wavelength of the optical struc-
tures in each of these groups was of 531 and 682 nm, which
correspond closely to the values determined from the peak
reflection of 528 and 673 nm (figure 8c).
The double-peaked spectral types were observed for
54 of the 209 beetles (25.8%) that had their spectra recor-
ded and analysed, though the peak wavelength did vary
between species.
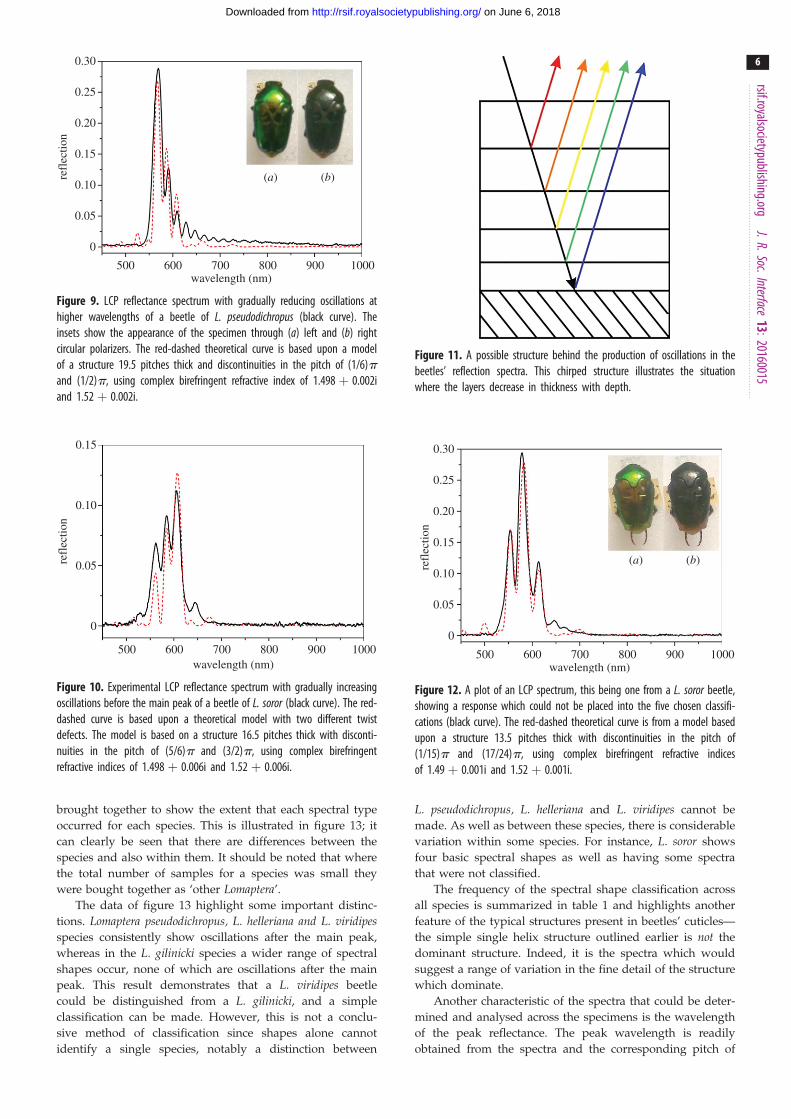
4.3. Spectra with oscillationsThe third group of characteristic LCP reflection spectra
included oscillations around the main peak. There are two
distinct types. The first being where there are oscillations
that reduce in intensity as they move away from the main
peak towards longer wavelengths (figure 9). The second
being oscillations that decrease in intensity as they move
away from the main peak towards shorter wavelengths
(figure 10). Modelling of the oscillations was achieved in a
similar manner for both cases. Two discontinuities in the
orientation of the chitin molecules were introduced and
equally spaced within the structure. For the oscillations
after type, the discontinuities were (1/6)p and (1/2)p (red-
dashed response in figure 9). The model for the oscillations
before the main peaks introduced two discontinuities of
(5/6)p and (3/2)p (red-dashed response in figure 10).
The ‘oscillations before’ spectral type was observed for
eight of the 209 beetles (3.8%) that had their spectra recorded
and analysed, and the ‘oscillations after’ for 66 of the 209
beetles (31.6%).

½pitch 1
(a) (b) (c)
½pitch 2 ½ pitch
absorbinglayer
Figure 7. Three different structures, which could cause double-peak structures in multi-layered structures: (a) a structure of two distinct pitches, (b) the structureincludes a layer which absorbs specific wavelengths or wavebands and (c) a chiral structure with a twist defect (a step in the orientation of the chitin moleculesbetween adjacent layers). (Online version in colour.)
refl
ectiv
ity
0.02
0.04
0.06
0.08
0.10
0.12
0.14
0.16
(a)
(b)
(c)
0500 600 700
wavelength (nm)
1 mmdistance (pixels)
grey
scal
e
00
10
20
30
100 200
800 900
(i) (ii)
1000
Figure 8. (a) Electron microscope image and cross-sectional image of the beetle Mycterophallus validipes’ scutellum. (b) A greyscale profile taken along the line onthe image in (a). (c) The associated optical spectrum of LCP light with image of beetle through (i) LCP filter and (ii) RCP filter. (Online version in colour.)
rsif.royalsocietypublishing.orgJ.R.Soc.Interface
13:20160015
5
on June 6, 2018http://rsif.royalsocietypublishing.org/Downloaded from
The gradually diminishing oscillations were previously
described as being caused by chirped structures, with oscil-
lations after the main peak indicative of increasing pitch
thickness the deeper into the beetle shell. However, oscil-
lations before the main peak were indicative of the situation
where the pitch thickness decreases away from the surface
(figure 11). Such a structure has previously been discussed
by Parker et al. [27].
4.4. Other spectraFinally, the ‘not classified’ LCP spectra were varied in their
features with most not being simple double-peaked or with
gradually increasing/decreasing oscillations, but somewhat
more complex (figure 12). A model was created based upon
two discontinuities, to describe a typical unclassified spec-
trum, with two discontinuities in the orientation of chitin
molecules of (1/24)p and (3/4)p, along with complex birefrin-
gent refractive indices, simulating absorption (red-dashed
trace in figure 12).
Fifty-two of the 209 beetles (24.9%) that had their spectra
recorded as not classified.
5. Spectral analysis and classificationAnalysis of the reflection spectra types was done within and
between species of the Lomaptera genus and the results
0.15
0.20
0.25
0.30
0.10
refl
ectio
n
0.05
0
(a) (b)
500 600 700wavelength (nm)
800 900 1000
Figure 9. LCP reflectance spectrum with gradually reducing oscillations athigher wavelengths of a beetle of L. pseudodichropus (black curve). Theinsets show the appearance of the specimen through (a) left and (b) rightcircular polarizers. The red-dashed theoretical curve is based upon a modelof a structure 19.5 pitches thick and discontinuities in the pitch of (1/6)pand (1/2)p, using complex birefringent refractive index of 1.498 þ 0.002iand 1.52 þ 0.002i.
0.15
0.10
refl
ectio
n
0.05
0
500 600 700wavelength (nm)
800 900 1000
Figure 10. Experimental LCP reflectance spectrum with gradually increasingoscillations before the main peak of a beetle of L. soror (black curve). The red-dashed curve is based upon a theoretical model with two different twistdefects. The model is based on a structure 16.5 pitches thick with disconti-nuities in the pitch of (5/6)p and (3/2)p, using complex birefringentrefractive indices of 1.498 þ 0.006i and 1.52 þ 0.006i.
Figure 11. A possible structure behind the production of oscillations in thebeetles’ reflection spectra. This chirped structure illustrates the situationwhere the layers decrease in thickness with depth.
0.15
0.20
0.25
0.30
0.10
refl
ectio
n
0.05
0
(a) (b)
500 600 700wavelength (nm)
800 900 1000
Figure 12. A plot of an LCP spectrum, this being one from a L. soror beetle,showing a response which could not be placed into the five chosen classifi-cations (black curve). The red-dashed theoretical curve is from a model basedupon a structure 13.5 pitches thick with discontinuities in the pitch of(1/15)p and (17/24)p, using complex birefringent refractive indicesof 1.49 þ 0.001i and 1.52 þ 0.001i.
rsif.royalsocietypublishing.orgJ.R.Soc.Interface
13:20160015
6
on June 6, 2018http://rsif.royalsocietypublishing.org/Downloaded from
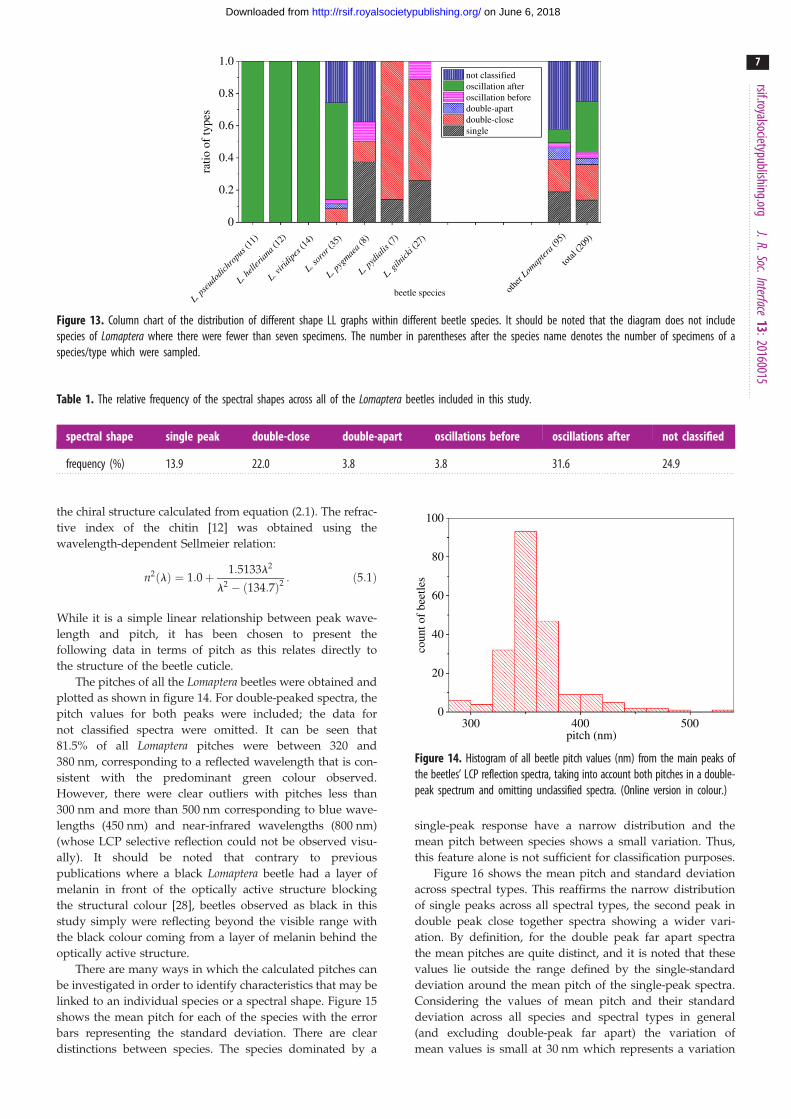
brought together to show the extent that each spectral type
occurred for each species. This is illustrated in figure 13; it
can clearly be seen that there are differences between the
species and also within them. It should be noted that where
the total number of samples for a species was small they
were bought together as ‘other Lomaptera’.
The data of figure 13 highlight some important distinc-
tions. Lomaptera pseudodichropus, L. helleriana and L. viridipesspecies consistently show oscillations after the main peak,
whereas in the L. gilinicki species a wider range of spectral
shapes occur, none of which are oscillations after the main
peak. This result demonstrates that a L. viridipes beetle
could be distinguished from a L. gilinicki, and a simple
classification can be made. However, this is not a conclu-
sive method of classification since shapes alone cannot
identify a single species, notably a distinction between
L. pseudodichropus, L. helleriana and L. viridipes cannot be
made. As well as between these species, there is considerable
variation within some species. For instance, L. soror shows
four basic spectral shapes as well as having some spectra
that were not classified.
The frequency of the spectral shape classification across
all species is summarized in table 1 and highlights another
feature of the typical structures present in beetles’ cuticles—
the simple single helix structure outlined earlier is not the
dominant structure. Indeed, it is the spectra which would
suggest a range of variation in the fine detail of the structure
which dominate.
Another characteristic of the spectra that could be deter-
mined and analysed across the specimens is the wavelength
of the peak reflectance. The peak wavelength is readily
obtained from the spectra and the corresponding pitch of
ratio
of
type
s
0
0.2
0.4
0.6
0.8
1.0
L. pse
udod
ichro
pus (
11)
L. hell
eria
na (1
2)
L. viri
dipe
s (14
)
L. sor
or (3
5)
L. pyg
maea (
8)
L. pyd
ialis
(7)
L. giln
icki (
27)
other
Lomap
tera (
95)
beetle species
single
not classifiedoscillation afteroscillation beforedouble-apartdouble-close
total
(209
)
Figure 13. Column chart of the distribution of different shape LL graphs within different beetle species. It should be noted that the diagram does not includespecies of Lomaptera where there were fewer than seven specimens. The number in parentheses after the species name denotes the number of specimens of aspecies/type which were sampled.
Table 1. The relative frequency of the spectral shapes across all of the Lomaptera beetles included in this study.
spectral shape single peak double-close double-apart oscillations before oscillations after not classified
frequency (%) 13.9 22.0 3.8 3.8 31.6 24.9
coun
t of
beet
les
0
20
40
60
80
100
300pitch (nm)400 500
Figure 14. Histogram of all beetle pitch values (nm) from the main peaks ofthe beetles’ LCP reflection spectra, taking into account both pitches in a double-peak spectrum and omitting unclassified spectra. (Online version in colour.)
rsif.royalsocietypublishing.orgJ.R.Soc.Interface
13:20160015
7
on June 6, 2018http://rsif.royalsocietypublishing.org/Downloaded from
the chiral structure calculated from equation (2.1). The refrac-
tive index of the chitin [12] was obtained using the
wavelength-dependent Sellmeier relation:
n2ðlÞ ¼ 1:0þ 1:5133l2
l2 � ð134:7Þ2: ð5:1Þ
While it is a simple linear relationship between peak wave-
length and pitch, it has been chosen to present the
following data in terms of pitch as this relates directly to
the structure of the beetle cuticle.
The pitches of all the Lomaptera beetles were obtained and
plotted as shown in figure 14. For double-peaked spectra, the
pitch values for both peaks were included; the data for
not classified spectra were omitted. It can be seen that
81.5% of all Lomaptera pitches were between 320 and
380 nm, corresponding to a reflected wavelength that is con-
sistent with the predominant green colour observed.
However, there were clear outliers with pitches less than
300 nm and more than 500 nm corresponding to blue wave-
lengths (450 nm) and near-infrared wavelengths (800 nm)
(whose LCP selective reflection could not be observed visu-
ally). It should be noted that contrary to previous
publications where a black Lomaptera beetle had a layer of
melanin in front of the optically active structure blocking
the structural colour [28], beetles observed as black in this
study simply were reflecting beyond the visible range with
the black colour coming from a layer of melanin behind the
optically active structure.
There are many ways in which the calculated pitches can
be investigated in order to identify characteristics that may be
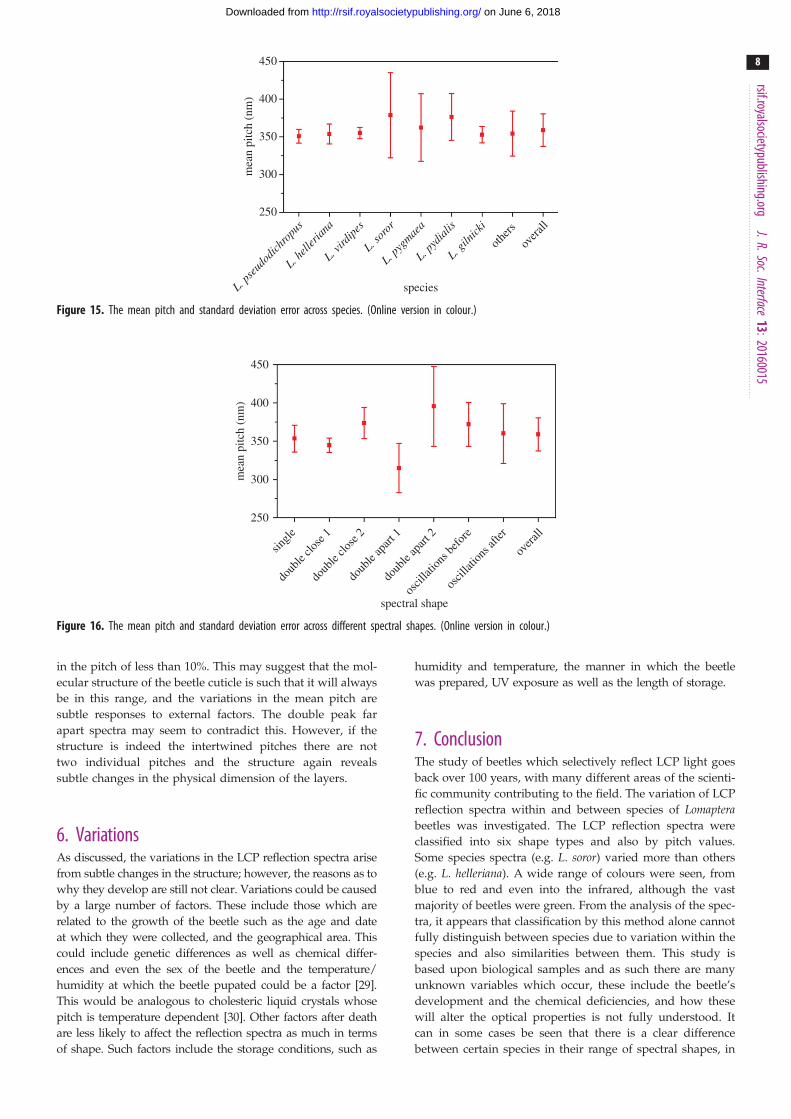
linked to an individual species or a spectral shape. Figure 15
shows the mean pitch for each of the species with the error
bars representing the standard deviation. There are clear
distinctions between species. The species dominated by a
single-peak response have a narrow distribution and the
mean pitch between species shows a small variation. Thus,
this feature alone is not sufficient for classification purposes.
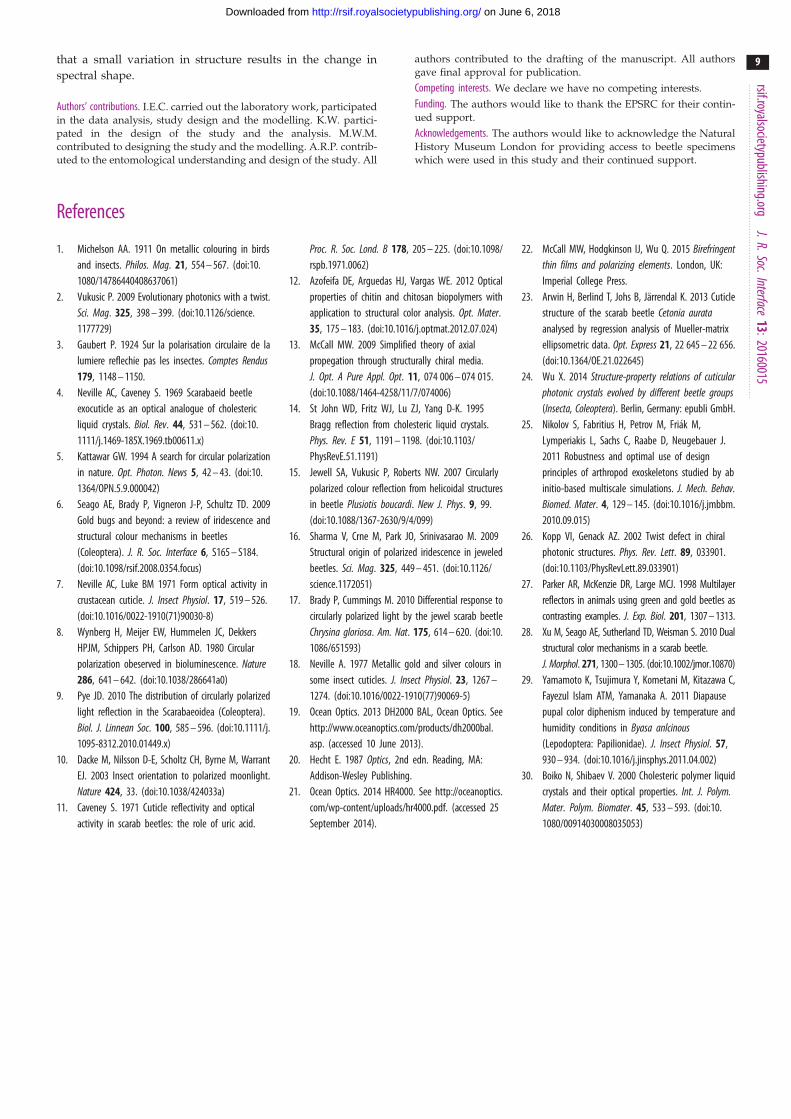
Figure 16 shows the mean pitch and standard deviation
across spectral types. This reaffirms the narrow distribution
of single peaks across all spectral types, the second peak in
double peak close together spectra showing a wider vari-
ation. By definition, for the double peak far apart spectra
the mean pitches are quite distinct, and it is noted that these
values lie outside the range defined by the single-standard
deviation around the mean pitch of the single-peak spectra.
Considering the values of mean pitch and their standard
deviation across all species and spectral types in general
(and excluding double-peak far apart) the variation of
mean values is small at 30 nm which represents a variation
mea
n pi
tch
(nm
)
300
250
350
400
450
L. pse
udod
ichro
pus
L. hell
eria
na
L. vird
ipes
L. sor
or
L. pyg
maea
L. pyd
ialis
L. giln
icki
others
species
overa
ll
Figure 15. The mean pitch and standard deviation error across species. (Online version in colour.)
mea
n pi
tch
(nm
)
300
250
350
400
450
single
doub
le clo
se 1
doub
le clo
se 2
doub
le ap
art 1
doub
le ap
art 2
oscil
lation
s befo
re
oscil
lation
s afte
r
spectral shape
overa
ll
Figure 16. The mean pitch and standard deviation error across different spectral shapes. (Online version in colour.)
rsif.royalsocietypublishing.orgJ.R.Soc.Interface
13:20160015
8
on June 6, 2018http://rsif.royalsocietypublishing.org/Downloaded from
in the pitch of less than 10%. This may suggest that the mol-
ecular structure of the beetle cuticle is such that it will always
be in this range, and the variations in the mean pitch are
subtle responses to external factors. The double peak far
apart spectra may seem to contradict this. However, if the
structure is indeed the intertwined pitches there are not
two individual pitches and the structure again reveals
subtle changes in the physical dimension of the layers.
6. VariationsAs discussed, the variations in the LCP reflection spectra arise
from subtle changes in the structure; however, the reasons as to
why they develop are still not clear. Variations could be caused
by a large number of factors. These include those which are
related to the growth of the beetle such as the age and date
at which they were collected, and the geographical area. This
could include genetic differences as well as chemical differ-
ences and even the sex of the beetle and the temperature/
humidity at which the beetle pupated could be a factor [29].
This would be analogous to cholesteric liquid crystals whose
pitch is temperature dependent [30]. Other factors after death
are less likely to affect the reflection spectra as much in terms
of shape. Such factors include the storage conditions, such as
humidity and temperature, the manner in which the beetle
was prepared, UV exposure as well as the length of storage.
7. ConclusionThe study of beetles which selectively reflect LCP light goes
back over 100 years, with many different areas of the scienti-
fic community contributing to the field. The variation of LCP
reflection spectra within and between species of Lomapterabeetles was investigated. The LCP reflection spectra were
classified into six shape types and also by pitch values.
Some species spectra (e.g. L. soror) varied more than others
(e.g. L. helleriana). A wide range of colours were seen, from
blue to red and even into the infrared, although the vast
majority of beetles were green. From the analysis of the spec-
tra, it appears that classification by this method alone cannot
fully distinguish between species due to variation within the
species and also similarities between them. This study is
based upon biological samples and as such there are many
unknown variables which occur, these include the beetle’s
development and the chemical deficiencies, and how these
will alter the optical properties is not fully understood. It
can in some cases be seen that there is a clear difference
between certain species in their range of spectral shapes, in
rsif.royalsocietypubl
9
on June 6, 2018http://rsif.royalsocietypublishing.org/Downloaded from
that a small variation in structure results in the change in
spectral shape.
Authors’ contributions. I.E.C. carried out the laboratory work, participatedin the data analysis, study design and the modelling. K.W. partici-pated in the design of the study and the analysis. M.W.M.contributed to designing the study and the modelling. A.R.P. contrib-uted to the entomological understanding and design of the study. All
authors contributed to the drafting of the manuscript. All authorsgave final approval for publication.
Competing interests. We declare we have no competing interests.
Funding. The authors would like to thank the EPSRC for their contin-ued support.
Acknowledgements. The authors would like to acknowledge the NaturalHistory Museum London for providing access to beetle specimenswhich were used in this study and their continued support.
ishing.org
ReferencesJ.R.Soc.Interface13:20160015
1. Michelson AA. 1911 On metallic colouring in birdsand insects. Philos. Mag. 21, 554 – 567. (doi:10.1080/14786440408637061)
2. Vukusic P. 2009 Evolutionary photonics with a twist.Sci. Mag. 325, 398 – 399. (doi:10.1126/science.1177729)
3. Gaubert P. 1924 Sur la polarisation circulaire de lalumiere reflechie pas les insectes. Comptes Rendus179, 1148 – 1150.
4. Neville AC, Caveney S. 1969 Scarabaeid beetleexocuticle as an optical analogue of cholestericliquid crystals. Biol. Rev. 44, 531 – 562. (doi:10.1111/j.1469-185X.1969.tb00611.x)
5. Kattawar GW. 1994 A search for circular polarizationin nature. Opt. Photon. News 5, 42 – 43. (doi:10.1364/OPN.5.9.000042)
6. Seago AE, Brady P, Vigneron J-P, Schultz TD. 2009Gold bugs and beyond: a review of iridescence andstructural colour mechanisms in beetles(Coleoptera). J. R. Soc. Interface 6, S165 – S184.(doi:10.1098/rsif.2008.0354.focus)
7. Neville AC, Luke BM 1971 Form optical activity incrustacean cuticle. J. Insect Physiol. 17, 519 – 526.(doi:10.1016/0022-1910(71)90030-8)
8. Wynberg H, Meijer EW, Hummelen JC, DekkersHPJM, Schippers PH, Carlson AD. 1980 Circularpolarization obeserved in bioluminescence. Nature286, 641 – 642. (doi:10.1038/286641a0)
9. Pye JD. 2010 The distribution of circularly polarizedlight reflection in the Scarabaeoidea (Coleoptera).Biol. J. Linnean Soc. 100, 585 – 596. (doi:10.1111/j.1095-8312.2010.01449.x)
10. Dacke M, Nilsson D-E, Scholtz CH, Byrne M, WarrantEJ. 2003 Insect orientation to polarized moonlight.Nature 424, 33. (doi:10.1038/424033a)
11. Caveney S. 1971 Cuticle reflectivity and opticalactivity in scarab beetles: the role of uric acid.
Proc. R. Soc. Lond. B 178, 205 – 225. (doi:10.1098/rspb.1971.0062)
12. Azofeifa DE, Arguedas HJ, Vargas WE. 2012 Opticalproperties of chitin and chitosan biopolymers withapplication to structural color analysis. Opt. Mater.35, 175 – 183. (doi:10.1016/j.optmat.2012.07.024)
13. McCall MW. 2009 Simplified theory of axialpropegation through structurally chiral media.J. Opt. A Pure Appl. Opt. 11, 074 006 – 074 015.(doi:10.1088/1464-4258/11/7/074006)
14. St John WD, Fritz WJ, Lu ZJ, Yang D-K. 1995Bragg reflection from cholesteric liquid crystals.Phys. Rev. E 51, 1191 – 1198. (doi:10.1103/PhysRevE.51.1191)
15. Jewell SA, Vukusic P, Roberts NW. 2007 Circularlypolarized colour reflection from helicoidal structuresin beetle Plusiotis boucardi. New J. Phys. 9, 99.(doi:10.1088/1367-2630/9/4/099)
16. Sharma V, Crne M, Park JO, Srinivasarao M. 2009Structural origin of polarized iridescence in jeweledbeetles. Sci. Mag. 325, 449 – 451. (doi:10.1126/science.1172051)
17. Brady P, Cummings M. 2010 Differential response tocircularly polarized light by the jewel scarab beetleChrysina gloriosa. Am. Nat. 175, 614 – 620. (doi:10.1086/651593)
18. Neville A. 1977 Metallic gold and silver colours insome insect cuticles. J. Insect Physiol. 23, 1267 –1274. (doi:10.1016/0022-1910(77)90069-5)
19. Ocean Optics. 2013 DH2000 BAL, Ocean Optics. Seehttp://www.oceanoptics.com/products/dh2000bal.asp. (accessed 10 June 2013).
20. Hecht E. 1987 Optics, 2nd edn. Reading, MA:Addison-Wesley Publishing.
21. Ocean Optics. 2014 HR4000. See http://oceanoptics.com/wp-content/uploads/hr4000.pdf. (accessed 25September 2014).
22. McCall MW, Hodgkinson IJ, Wu Q. 2015 Birefringentthin films and polarizing elements. London, UK:Imperial College Press.
23. Arwin H, Berlind T, Johs B, Jarrendal K. 2013 Cuticlestructure of the scarab beetle Cetonia aurataanalysed by regression analysis of Mueller-matrixellipsometric data. Opt. Express 21, 22 645 – 22 656.(doi:10.1364/OE.21.022645)
24. Wu X. 2014 Structure-property relations of cuticularphotonic crystals evolved by different beetle groups(Insecta, Coleoptera). Berlin, Germany: epubli GmbH.
25. Nikolov S, Fabritius H, Petrov M, Friak M,Lymperiakis L, Sachs C, Raabe D, Neugebauer J.2011 Robustness and optimal use of designprinciples of arthropod exoskeletons studied by abinitio-based multiscale simulations. J. Mech. Behav.Biomed. Mater. 4, 129 – 145. (doi:10.1016/j.jmbbm.2010.09.015)
26. Kopp VI, Genack AZ. 2002 Twist defect in chiralphotonic structures. Phys. Rev. Lett. 89, 033901.(doi:10.1103/PhysRevLett.89.033901)
27. Parker AR, McKenzie DR, Large MCJ. 1998 Multilayerreflectors in animals using green and gold beetles ascontrasting examples. J. Exp. Biol. 201, 1307 – 1313.
28. Xu M, Seago AE, Sutherland TD, Weisman S. 2010 Dualstructural color mechanisms in a scarab beetle.J. Morphol. 271, 1300 – 1305. (doi:10.1002/jmor.10870)
29. Yamamoto K, Tsujimura Y, Kometani M, Kitazawa C,Fayezul Islam ATM, Yamanaka A. 2011 Diapausepupal color diphenism induced by temperature andhumidity conditions in Byasa anlcinous(Lepodoptera: Papilionidae). J. Insect Physiol. 57,930 – 934. (doi:10.1016/j.jinsphys.2011.04.002)
30. Boiko N, Shibaev V. 2000 Cholesteric polymer liquidcrystals and their optical properties. Int. J. Polym.Mater. Polym. Biomater. 45, 533 – 593. (doi:10.1080/00914030008035053)