VARIASI PENGGUNAAN EMULSIFIER DAN SUBSTITUSI … · Berbagai macam roti manis yang dikenal umum,...
82
VARIASI PENGGUNAAN EMULSIFIER DAN SUBSTITUSI TEPUNG BERAS MERAH (Oryza sativa Linn) DALAM FORMULASI ROTI MANIS: EVALUASI SIFAT FISIK, KIMIA DAN SENSORIS VARIATION EMULSIFIERS AND BROWN RICE (Oryza sativa Linn) FLOUR SUBSTITUTION IN SWEET ROLLS FORMULATION : THE EVALUATION OF PHYSICAL, CHEMICAL AND SENSORY CHARACTERISTICS S K R I P S I Diajukan untuk memenuhi sebagian syarat-syarat guna memperoleh gelar Sarjana Teknologi Pangan Oleh : THERESIA DEWIYANTI PRANATA 01.70. 0025 PROGRAM STUDI TEKNOLOGI PANGAN FAKULTAS TEKNOLOGI PERTANIAN UNIVERSITAS KATOLIK SOEGIJAPRANATA S E M A R A N G 2005
-
Upload
truonglien -
Category
Documents
-
view
237 -
download
2
Transcript of VARIASI PENGGUNAAN EMULSIFIER DAN SUBSTITUSI … · Berbagai macam roti manis yang dikenal umum,...

VARIASI PENGGUNAAN EMULSIFIER DAN SUBSTITUSI TEPUNG BERAS MERAH (Oryza sativa Linn) DALAM FORMULASI ROTI MANIS:
EVALUASI SIFAT FISIK, KIMIA DAN SENSORIS
VARIATION EMULSIFIERS AND BROWN RICE (Oryza sativa Linn)
FLOUR SUBSTITUTION IN SWEET ROLLS FORMULATION : THE EVALUATION OF PHYSICAL, CHEMICAL AND SENSORY
CHARACTERISTICS
S K R I P S I
Diajukan untuk memenuhi sebagian syarat-syarat guna memperoleh gelar
Sarjana Teknologi Pangan
Oleh :
THERESIA DEWIYANTI PRANATA
01.70. 0025
PROGRAM STUDI TEKNOLOGI PANGAN
FAKULTAS TEKNOLOGI PERTANIAN
UNIVERSITAS KATOLIK SOEGIJAPRANATA
S E M A R A N G
2005

RINGKASAN Roti merupakan salah satu produk bakery yang banyak disukai oleh masyarakat. Pada penelitian ini dilakukan pembuatan roti manis dengan menggunakan 2 jenis emulsifier (alami dan sintetis). Tujuan penggunaan 2 jenis emulsifier tersebut adalah untuk membandingkan pengaruh dari masing-masing emulsifier terhadap perubahan sifat fisik, kimia dan sensoris roti manis yang dihasilkan. Masyarakat modern sekarang ini memiliki kecenderungan untuk mengkonsumsi makanan yang praktis, namun mengandung nilai gizi yang rendah, yaitu mempunyai kadar lemak dan gula yang tinggi. Pola makan tersebut menyebabkan timbulnya berbagai jenis penyakit seperti kanker, diabetes, jantung, obesitas dan sebagainya. Untuk mengurangi terjadinya penyakit tersebut, pada penelitian ini juga dilakukan substitusi tepung beras merah. Hal ini bertujuan untuk meningkatkan kadar serat roti manis. Konsentrasi tepung beras merah yang disubstitusikan sebesar 10%, 20% dan 30%. Pada penelitian ini dilakukan analisa fisik, kimia dan sensoris. Pada formulasi roti manis dengan menggunakan emulsifier alami pada substitusi tepung beras merah 30%, meningkatkan kadar serat sebesar 55.52% dan menurunkan kadar lemak sebesar 23.64%. Sedangkan pada roti manis dengan emulsifier sintetis meningkatkan kadar serat sebesar 43.49% dan menurunkan kadar lemak sebesar 21.31%. Dari hasil analisa sensoris yang dilakukan, menunjukkan bahwa tingkat kesukaan panelis terhadap rasa, aroma, warna dan tekstur roti manis semakin menurun seiring dengan semakin banyaknya konsentrasi tepung beras merah yang disubstitusikan. Berdasarkan penilaian secara keseluruhan terhadap rasa, aroma, dan tekstur menunjukkan bahwa substitusi tepung beras merah sebesar 20% masih dapat diterima oleh panelis. Namun pada parameter warna substitusi tepung beras merah 30% lebih disukai daripada roti manis dengan substitusi tepung beras merah 10% dan 20%.

SUMMARY Breads is a bakery product preffered by consumen. In this research, I made sweet roll with 2 variation emulsifiers (natural and synthetic). The aim of this research was to compared influences of that emulsifiers to physical, chemical and sensory characteristics or sweet roll. Nowadays, people tends to consume instant food, but it contains high sugar and fat. The tendency causes degenerative diseases, like cancer, diabetes, heart disease, obesity, etc. To reduce that diseases, in this research was done substitution of brown rice to increases dietary fiber in sweet roll. The treatment used brown rice substitution in 10%, 20%, and 30%. The observation of sweet rolls were physical, chemical, and sensory characteristics. Brown rice substitution 30% in sweet rolls with natural emulsifier caused increasing dietary fiber 55.52% and decreasing fat 23.64%. In sweet roll with synthetic emulsifier at brown rice substitution 30% caused increasing dietary fiber 43.49% and decreasing fat 21.31%. Preference test result of the panelist showed that more brown rice flour substitution decreased panelist preference. The conclusion were 20% brown rice substitution sweet rolls still acceptable panelist but 30% brown rice substitution sweet rolls dislike panelist. But in parameter of color, 30% brown rice flour substitution was more preffered than 10% and 20% brown rice flour substitution in sweet rolls.

DAFTAR ISI Halaman
RINGKASAN ……………………………………………………………………………. i SUMMARY ………………………………………………………………………………. ii KATA PENGANTAR ……………………………………………………………………iii DAFTAR ISI …………………………………………………………………………….. v DAFTAR TABEL ……………………………………………………………………….. vi DAFTAR GAMBAR ……………………………………………………………………. vi 1. PENDAHULUAN ……………………………………………………………………. 1 2. MATERI DAN METODA ………………………………………………………….. 7 2.1. Bahan …………………………………………………………………………... 7 2.2. Pembuatan Tepung Beras Merah ………………………………………………. 7 2.3. Uji Pendahuluan ……………………………………………………………….. 7 2.4. Pembuatan Roti Manis ………………………………………………………… 8 2.5. Formulasi Roti Manis …………………………………………………………. 9
2.6. Analisa Kimia …………………………………………………………………. 9 2.6.1. Pengujian Kadar Air ……………………………………………………. 9
2.6.2. Kadar Lemak …………………………………………………………… 10 2.6.3. Analisa Kadar Serat Kasar …………………………………………….. 10 2.6.4. Analisa Kadar Protein ……………………………………………... …… 10 2.7. Analisa Fisik ……………………………………………………………… …… 11 2.7.1. Persentase Pengembangan Volume ……………………………….…….. 11 2.7.2. Kekerasan ………………………………………………………….. ……. 12 2.7.3. Porositas Roti Manis ………………………………………………. ……. 12 2.8 Evaluasi Sensoris ………………………………………………………… ……. 12 2.9 Pengolahan Data ………………………………………………………………… 12 3. HASIL PENELITIAN ……………………………………………………………… 13 3.1. Analisa Kimia …………………………………………………………………… 13 3.2. Analisa Fisik …………………………………………………………………….. 15 3.3. Analisa Sensoris ………………………………………………………………… 17
3.3.1. Roti manis dengan emulsifier sintetis.. …………………………………… 19 3.3.2. Roti manis dengan emulsifier alami.. …………………………………….. 23
4.PEMBAHASAN ……………………………………………………………………… 27 4.1. Analisa Kimia …………...………………………………………………………. 27 4.2. Analisa Fisik …………………………………………………………………….. 29 4.3. Analisa Sensoris …….. …………………………………………………….……. 33
5. KESIMPULAN ……………………………………………………………………… 36 6. DAFTAR PUSTAKA ……………………………………………………………….. 37 LAMPIRAN ……………………………………………………………………………. 39

1. PENDAHULUAN
Roti adalah makanan yang dibuat dari tepung terigu yang difermentasikan dengan bakers
yeast (Sacharomyces cerevisiae) dan dipanggang dengan atau tanpa penambahan bahan
makanan lain dan bahan tambahan makanan yang diijinkan. Bahan-bahan yang
ditambahkan ke dalam adonan roti adalah garam, gula, susu, lemak, bahan pengawet dan
bahan penambah flavor (SNI 01-3840-1995). Menurut Ma’roef (1999), roti manis
merupakan roti yang rasanya manis dan mengandung gula sekurang-kurangnya 10%.
Berbagai macam roti manis yang dikenal umum, misalnya roti coklat, kismis dan keju.
Bahan-bahan dasar yang digunakan untuk membuat roti adalah tepung terigu, gula, garam,
air dan yeast (Tenbergen, 1999). Tepung terigu yang digunakan dalam pembuatan roti
umumnya merupakan terigu dengan kandungan protein yang relatif tinggi yaitu ± 11-13%
(Arpah, 1993). Tepung ini mempunyai persentase protein relatif tinggi sehingga gluten
dalam adonan mengembang sangat kuat dan bersifat elastis (Bennion & Hughes, 1970).
Menurut Shewry et al., (2001) tepung ini sering digunakan oleh industri komersial produk
bakery pada roti yang menggunakan yeast sebagai bahan pengembangnya. Karena
pembuatan roti manis sangat dipengaruhi pengembangan adonan, maka protein dalam
tepung sangat penting untuk menentukan kenampakan adonan, viskositas, karakteristik,
elastisitas, serta volume produk yang dihasilkan (Hoseney, 1994). Kandungan zat gizi
tepung terigu dan tepung beras merah dapat dilihat pada Tabel 1.
Tabel 1. Komposisi Zat Gizi Rata-Rata Tepung Terigu dan Tepung Beras Merah per 100 g Komposisi Gizi Tepung Terigu Tepung Beras Merah Energi (kal) 333 352 Protein (g) 9 7.3 Lemak (g) 1 0.9 Serat (g) 0.3 0.8 Abu (g) 1 1 Hidrat arang total (g) 77.2 76.2 Kalsium (mg) 22 15 Pospor (mg) 150 257 Besi (mg) 1.3 42 Vitamin B1 (mg) 0.1 0.34
Sumber : Puslitbang Gizi Departemen Kesehatan (1990).

Protein gandum ada 2 macam, yaitu protein pembentuk adonan dan protein yang bukan
pembentuk adonan. Protein pembentuk adonan terdiri dari gliadin dan glutenin yang
apabila bercampur dengan air akan membentuk gluten. Sifat gluten antara lain :
1. Membentuk massa elastis yang terikat dengan komponen-komponen roti lainnya seperti
: pati, lemak, protein, dsb.
2. Membentuk lapisan tipis. Pengadukan massa elastis menyebabkan terbentuknya
benang-benang lapisan tipis yang menahan gas CO2 yang timbul sehingga dapat
membentuk struktur remah roti.
3. Thermosetting. Apabila massa gluten yang sudah terhidrasi dipanaskan di atas suhu
80oC maka akan menggumpal tanpa merusak struktur roti.
(Matz, 1992).
Reaksi gliadin dan glutenin dengan air (hidrasi) akan membentuk massa elastis yang sering
disebut gluten yang bersifat mengikat gas. Gluten merupakan bagian dari protein gandum
dimana ketika hidrasi tidak dapat dilarutkan dalam air. Selain itu, gluten merupakan protein
gandum yang sangat penting peranannya dalam menentukan sifat dan hasil akhir adonan
tepung gandum. Gluten berfungsi untuk menahan gas hasil fermentasi pada roti akibat
penggunaan yeast dan menyebabkan roti mengembang. Semakin tinggi prosentase protein
gandum dalam suatu tepung, maka massa elastis yang terbentuk akan semakin kuat
sehingga kemampuan untuk menahan gas semakin besar (Bennion & Hughes, 1970).
Jenis yeast yang ditambahkan dalam adonan roti adalah Saccharomyces cerevisiae
(Bennion & Hughes, 1970). Kemampuan bakers yeast untuk memfermentasi adonan tepung
gandum dihubungkan dengan jumlah gula dalam tepung, termasuk maltosa yang dihasilkan
dari hirolisis pati. Yeast dapat memfermentasi gula dalam adonan roti sehingga dihasilkan
gas CO2 dan ethil alkohol. Fermentasi yeast dalam adonan roti menyebabkan dinding sel
atau struktur gluten terbuka. Yeast juga dapat berfungsi untuk memberikan rasa dan aroma
yang khas pada adonan roti manis (Fardiaz, 1992).
Telur mengandung lemak yang teremulsifikasi dalam kuning telur. Kuning telur adalah
emulsi lemak dalam air dengan susunan kurang lebih 1/3nya berupa lemak, 1/2 nya berupa
air dan 1/6nya adalah protein (Gaman & Sherrington, 1994). Kuning telur berfungsi sebagai
pengemulsi dan pengempuk. Sedangkan putih telur berperan dalam pembentukan cita rasa
dan warna (Subagio et al., 2003). Komposisi telur dapat dilihat pada Tabel 2.

Tabel 2. Komposisi Telur Nilai Gizi Telur utuh (%) Putih telur (%) Kuning telur (%)
Protein 12 9 16 Lemak 11 Sangat sedikit 31
Karbohidrat 8 0 0 Air 75 88 51
Vitamin dan mineral 1 1 1 Sumber : Gaman & Sherrington, (1994).
Kuning telur berfungsi sebagai pengemulsi karena kuning telur mengandung lesithin.
Lesithin merupakan fosfolipid yang mempunyai gugus lipid polar dan non-polar. Gugus
lipid polar akan membentuk kompleks dengan fraksi pati sehingga dapat memperlambat
laju terjadinya hidrasi pati. Adanya gugus lipid non-polar dapat memperpanjang hidrasi
granula pati. Reaksi tersebut dapat memperbaiki reaksi penahan gas dan struktur adonan
sehingga roti yang dihasilkan mempunyai volume, tekstur dan elastisitas remah roti yang
lebih baik. Lesithin juga dapat berfungsi untuk meningkatkan efek shortening di dalam
adonan, meningkatkan aerasi dan menghambat laju proses stalling (Stear, 1990).
Sedangkan putih telur mengandung albumin yang mampu membentuk busa (foaming).
Foaming terjadi jika ada udara atau gas yang terperangkap di dalamnya, hal ini ditunjukkan
dengan pengembangan volumenya (Widianarko et al., 2002). Menurut Merlin (2005),
shortening dapat berfungsi untuk melumasi struktur internal adonan sehingga adonan dapat
mengembang lebih baik, memperbaiki tekstur produk, mengempukkan dan memudahkan
pengirisan (slicing).
Tahap-tahap pembuatan roti yaitu pencampuran adonan (tepung, gula, garam, air, yeast),
fermentasi adonan dan pemanggangan. Pada saat terjadi fermentasi adonan, karbohidrat
diubah menjadi CO2 dan etanol serta sejumlah kecil senyawa-senyawa yang jika bergabung
dengan protein dapat berperan sebagai precursor flavor. Selain itu, juga terjadi improving
dan leavening. Pada suhu pemanggangan 60-80oC, terjadi gelatinasi pati dan denaturasi
protein sehingga terbentuk produk yang ringan, berpori dan mudah dicerna. Selama
pemanggangan, kandungan air pada permukaan roti menjadi lebih rendah daripada bagian
tengah. Pada kondisi suhu yang tinggi menyebabkan tekstur kulit (crust) berbeda dengan
remah roti (crumb) (Wang & Sun, 2001).
Stalling merupakan suatu proses yang berhubungan dengan rekristalisasi atau retrogradasi
molekul pati yang tergelatinasi selama proses pemanggangan. Hilangnya air dan daya
kohesi remah roti menyebabkan remah roti tersebut menjadi lebih kering dan keras. Air
merupakan salah satu bahan yang berperan penting dalam proses stalling karena pelunakan
roti dan pengerasan remah roti berhubungan dnegan redistribusi air selama penyimpanan

(Lent & Grant, 2001). Proses stalling dapat dihambat dengan cara menurunkan laju
dehidrasi remah roti. Hal ini lebih baik daripada meningkatkan kadar air roti, namun
pengerasan roti tidak dapat dicegah dengan cara menghilangkan migrasi air (Brandt, 2003).
Emulsifier merupakan molekul kompleks yang larut air dan lemak. Emulsifier yang
umumnya digunakan dalam roti mengandung monogliserida dan digliserida. Emulsifier
dapat berfungsi untuk meningkatkan pengembangan volume, memperlambat proses
stalling, dan melembutkan adonan (Tenbergen, 1999). Menurut Harris (2005), emulsifier
dapat berfungsi untuk mengembangkan adonan karena mempunyai kemampuan untuk
menahan gas lebih banyak dalam gelembung-gelembung yang lebih kecil. Emulsifier juga
dapat mengurangi waktu proofing, melembutkan dan membentuk tekstur roti serta dapat
memperpanjang umur simpan produk (roti manis).
Roti merupakan salah satu produk yang mempunyai umur simpan yang pendek. Kualitas
roti ditentukan oleh beberapa parameter, antara lain bentuk dan volume (loaf volume &
shape), warna kulit roti (crust colour), stabilitas remah roti (crumb stability), kekerasan
remah roti (crumb firmness), daya lenting remah roti (crumb resilience), struktur remah roti
(bentuk dan ukuran sel, ketebalan dinding sel, keragaman sel), aroma (flavor) dan tingkat
kontaminiasi (FAO, 1998). Menurut Subagio et al (2003), faktor-faktor yang
mempengaruhi keberhasilan suatu produk dipengaruhi pada kemampuan pembentukan
matrik protein, penyerapan dan pengikatan air serta pengemulsi yang dapat meningkatkan
mutu produk yang dihasilkan.
Kekerasan merupakan respon bahan terhadap penekanan dengan bahan tertentu sampai
terjadi perubahan bentuk pada bahan. Pengembangan berkorelasi negatif dengan tingkat
kekerasan. Semakin besar tingkat pengembangan roti maka tingkat kekerasannya semakin
kecil. Apabila tepung yang digunakan memiliki kandungan gluten yang tinggi, adonan
yang mengandung kadar air tinggi mempunyai struktur yang terbuka dan pori-pori yang
lebih besar (Fance, 1964).
Perubahan pola makan masyarakat modern ternyata sangat mempengaruhi kesehatan.
Masyarakat memiliki kecenderungan untuk mengkonsumsi makanan ringan dan praktis
untuk dibawa seperti flakes dan biskuit. Pada umumnya, jenis makanan tersebut tidak
mengandung komposisi gizi yang dibutuhkan namun mengandung kadar lemak, pati dan
gula yang tinggi. Pola makan tersebut dapat menyebabkan timbulnya berbagai jenis
penyakit degeneratif seperti kanker, diabetes, jantung dan obesitas. Untuk mencegah

terjadinya hal ini maka dilakukan suatu upaya untuk meningkatkan konsumsi serat
(Kristiani, 2004).
Serat makanan mengandung substansi yang kompleks seperti : sellulosa, lignin,
hemiselulosa, gum, pektin dan sebagainya. Dalam sistem pencernaan manusia, serat ini
tidak dapat dicerna oleh enzim non-mikrobia. Serat dapat dikelompokkan menjadi 2
menurut kelarutannya dalam air, yaitu serat yang dapat larut (soluble fiber) dan serat yang
tidak dapat larut (unsoluble fiber). Yang termasuk serat larut antara lain pektin, gum yang
terdapat pada buah-buahan, sayuran dan sebagainya. Sedangkan serat tidak dapat larut
antara lain selulosa, hemiselulosa dan lignin. Substansi-substansi tersebut dapat diperoleh
dari wheat bran (Kristiani, 2004). Menurut Gaman & Sherrington (1994), sellulosa
merupakan polisakarida yang tidak dapat dicerna, namun mempunyai fungsi yang penting
bagi kesehatan yaitu untuk mengatur peristaltic usus dan mencegah terjadinya konstipasi.
Sedangkan hemiselulosa berperan untuk menyerap sejumlah air.
Di negara-negara industri di Barat terjadi kenaikan serangan penyakit saluran pencernaan
seperti diverticulosis, kanker usus besar dan hernia. Penyakit ini berkaitan dengan sembelit
dan lambatnya makanan bergerak ke dalam saluran pencernaan. Susunan makanan yang
mengandung banyak serat akan memperlambat kecepatan absorpsi glukosa dan lemak dari
usus halus sehingga mengurangi risiko diabetes dan penyakit-penyakit pembuluh darah.
Sayur-sayuran penting dalam susunan makanan karena kandungan karbohidrat tak
tercernanya (sebagian besar selulosa) yang menyediakan serat. Salah satu sumber serat
adalah beras merah (Gaman & Sherrington, 1994).
Pada penelitian ini dilakukan pembuatan roti manis dengan menggunakan 2 jenis emulsifier
(alami dan sintetis). Tujuan penggunaan emulsifier tersebut adalah untuk membandingkan
pengaruh dari masing-masing emulsifier terhadap perubahan sifat fisik, kimia dan sensoris
roti manis yang dihasilkan. Sedangkan substitusi tepung beras merah dalam formulasi roti
manis bertujuan untuk meningkatkan kadar serat pada roti manis tersebut. Selain itu juga
untuk mengurangi penggunaan tepung terigu dalam pembuatan roti manis dengan tepung
beras merah yang harganya lebih murah daripada tepung terigu.

2. MATERI DAN METODA 2.1. Pelaksanaan Penelitian
Penelitian ini dilakukan di Bogasari Baking Centre, Laboratorium Ilmu Pangan,
Laboratorium Pengawasan Mutu, Fakultas Teknologi Pertanian Universitas Katolik
Soegijapranata Semarang selama 3 bulan dari bulan November 2004 sampai Januari 2005.
2.2. Bahan
Bahan-bahan yang digunakan dalam penelitian ini adalah tepung terigu berkadar protein
tinggi yang diperoleh dari Bogasari Flour Mills dan tepung beras merah yang dibeli dari
Pasar Jatingaleh. Bahan tambahan lainnya yang dibutuhkan untuk membuat roti manis yaitu
gula pasir, garam, yeast instan, margarin, emulsifier sintetis (ovalet), emulsifier alami
(telur), improver dan air.
2.3. Pembuatan Tepung Beras Merah
Beras merah yang dipilih masih mempunyai kulit ari berwarna merah. Beras merah tersebut
dicuci dengan air bersih, ditiriskan dan dikeringanginkan. Beras merah tersebut selanjutnya
dihancurkan dengan menggunakan blender kemudian diayak dengan ayakan 625 mesh
sehingga diperoleh tepung beras merah.
2.4. Uji Pendahuluan
Uji pendahuluan dilakukan untuk menentukan formulasi roti manis dengan menggunakan
emulsifier sintetis dan variasi konsentrasi lemak yang terbaik dengan membandingkan
konsentrasi emulsifier sintetis sebanyak 0%, 1%, dan 2% dan konsentrasi lemak sebesar
5%, 10% dan 15%. Selanjutnya, roti manis dengan beberapa perlakuan tersebut dianalisa
secara fisik, meliputi persentase volume pengembangan, kekerasan (hardness) dan
porositas. Pada uji pendahuluan ini juga dilakukan pembuatan roti manis kontrol (dengan
penambahan telur). Dari hasil analisa fisik tersebut dapat diketahui formulasi roti manis
terbaik dan membandingkannya dengan roti manis kontrol. Setelah diperoleh formulasi roti
manis terbaik (mengandung lemak 10% dan emulsifier sintetis 2%), formulasi ini
digunakan untuk pembuatan roti manis berkadar serat tinggi, yaitu dengan substitusi tepung
beras merah ke dalam adonan roti manis. Konsentrasi tepung beras merah yang
disubstitusikan yaitu sebesar 10%, 20% dan 30%.

2.3. Pembuatan Roti Manis
Roti manis dibuat dengan metode Batch Process. Metode ini memiliki keunggulan karena
waktu yang digunakan lebih singkat dan ketepatan komposisinya yang lebih tinggi (Matz,
1992). Pembuatan roti manis dapat dilihat pada Gambar 1.
Dicampur hingga merata dengan kecepatan rendah
Air ditambahkan sedikit-demi sedikit
Ditambahkan kemudian adonan diaduk hingga menyatu dan kalis
(±± 12 menit)
Adonan diistirahatkan selama ± 30 menit
Dibagi dan dibulatkan
Diistirahatkan kembali (± 15 menit)
Disusun di loyang yang telah diolesi margarin olex
Diistirahatkan hingga adonan cukup mengembang
(dalam proofing box, ± 60 menit)
Dipanggang dalam oven
(Suhu 180oC, ± 18 menit)
Gambar 1. Proses Pembuatan Roti Manis
Keterangan : * Roti manis dengan emulsifier sintetis ** Roti manis dengan emulsifier alami (Stear, 1990).
- Tepung terigu - Tepung beras merah - Gula pasir - Garam - Yeast - Improver
Emulsifier sintetis (ovalet) & Margarin*
Emulsifier alami (telur) & Margarin **
M argarin **

2.5. Formulasi Roti Manis
Roti Manis A1) Roti Manis B2)
Tepung Beras Merah (%) Tepung Beras Merah (%)
Variabel
Bahan 0% 10% 20% 30% 0% 10% 20% 30%
Tepung terigu
Tepung beras merah
Emulsifier
Telur
Margarin
Gula pasir
Garam
Yeast
Improver
Air
500
0
10
-
50
150
5
15
2
260
450
50
10
-
50
150
5
15
2
260
400
100
10
-
50
150
5
15
2
260
350
150
10
-
50
150
5
15
2
260
500
0
-
50
75
150
5
15
2
210
450
50
-
50
75
150
5
15
2
210
400
100
-
50
75
150
5
15
2
210
350
150
-
50
75
150
5
15
2
210
Keterangan : 1) menggunakan emulsifier sintetis 2) menggunakan emulsifier alami
2.6. Analisa Kimia
2.6.1. Pengujian Kadar Air (Metode Thermogravimetri)
Sampel ditimbang dalam cawan porselen yang telah diketahui berat konstannya. Cawan
porselen yang berisi sampel basah tersebut dikeringkan dalam oven pada suhu 100-105oC
selama 3-5 jam, kemudian didinginkan dalam desikator dan ditimbang sampai beratnya
konstan. Pengurangan berat merupakan banyaknya air dalam bahan.
Perhitungan :
W1 = berat sampel (gram) W2 = berat sampel setelah dikeringkan (gram) W3 = banyaknya air yang hilang = W1 – W2 Ka (dry basis) = W3 x 100% W2 Ka (wet basis) = W3 x 100% W1 (Soedarmadji et al., 1997).
2.6.2 Kadar Lemak (Metode Soxhlet) 2 gram sampel dibungkus dengan kertas saring yang telah diketahui beratnya. Sampel
tersebut dimasukkan dalam labu Soxhlet dan ditambahkan pelarut ether sampai 1/3 bagian
labu, lalu diekstraksi selama ± 4 jam. Selanjutnya, sampel dikeringkan dalam oven
kemudian ditimbang sampai beratnya konstan.
Perhitungan :
W lemak = berat awal – berat akhir
% Lemak = W lemak x 100% W awal (Apriyantono et al., 1989).
2.6.3. Analisa Kadar Serat Kasar
Sampel yang telah diekstrak lemaknya dimasukkan dalam erlenmeyer dan ditambahkan
antibuih dan batu didih. 200 ml H2SO4 0.25 N ditambahkan ke dalam erlenmeyer dan
dididihkan selama 30 menit. Residu yang terbentuk selanjutnya dicuci dan disaring dengan
aquades panas. Residu tersebut selanjutnya dimasukkan dalam erlenmeyer dengan
menambahkan NaOH 0.25 N sebanyak 200 ml, kemudian dididihkan kembali selama 30
menit. Setelah itu, residu disaring dengan kertas saring yang telah diketahui beratnya,
kemudian residu yang berada pada kertas saring dicuci dengan menggunakan 5 ml Sodium
sulfat 10% dan 15 ml alkohol 95%. Setelah itu kertas saring tersebut dikeringkan dan
ditimbang beratnya.
Perhitungan : Berat residu = berat serat kasar (gram) % serat kasar = berat serat kasar x 100% berat awal (Apriyantono et al., 1989).
2.6.4. Analisa Kadar Protein (Metode Kjeldahl)
0.25 gram sampel dimasuikkan ke dalam labu Kjeldahl, kemudian ditambahkan 7.5 ml
K2SO4 ; 0.35 HgO ; 15 ml H2SO4 pekat dan batu didih dalam labu Kjeldahl dan dipanaskan
sampai diperoleh larutan yang jernih (selama 3-4 jam). Setelah itu, labu berisi larutan
didinginkan dan dipindahkan dalam labu destilasi sambil dibilas dengan 100 ml aquades
dingin. Larutan yang telah dibilas dipindahkan dalam labu destilasi dan ditambah dengan
15 ml Na2S2O3 4% ; 50 ml NaOH 50% dingin dan 0.2 gram Zn. Pada erlenmeyer
penampung destilat diisi dengan 50 ml HCl 0.1 N, kemudian diletakkan di bawah
kondensor dengan ujung kondensor tercelup, kemudian dilakukan destilasi selama 1 jam
sampai dihasilkan ± 75 ml destilat. Kemudian destilat yang terbentuk ditetesi dengan
indicator methyl red dan dititrasi dengan NaOH 0.1 N sampai tercapai TAT hingga
berwarna kuning. Proses yang sama juga dilakukan untuk blanko.
Perhitungan :
% N = ml NaOH (blanko – sampel) x N NaOH x 14.008 x 100% berat sampel % Protein = % N x Faktor konversi
Faktor konversi tepung terigu = 5.7
Faktor konversi tepung beras merah = 5.95
(Soedarmadji et al., 1997).
2.7. Analisa Fisik
2.7.1. Persentase Pengembangan Volume Roti Manis
Pengembangan roti manis dihitung dengan cara mengukur volume sebelum dan setelah
proses pemanggangan. Volume adonan sebelum proses pemanggangan diukur dengan
menggunakan jangka sorong yang meliputi pengukuran diameter dan panjang adonan.
Sedangkan volume roti manis dihitung dengan mengukur luas permukaan irisan roti manis
menggunakan metode Simpson (1993), yaitu :
a
Luas = 1/3 a (h0 + 4h1+2h2+4h3+h4)
h0 h1 h2 h3 h4
Untuk mendapatkan volume roti manis setelah pemanggangan, yaitu dengan mengalikan
luas permukaan roti manis dengan panjang roti manis.
Persentase volume pengembangan diuji dengan 3 kali ulangan dengan rumus :
% Volume Pengembangan = Volume roti manis – Volume adonan roti manis x 100%
Volume adonan roti manis
(Ribotta et al., 2001).
2.7.2. Kekerasan (Hardness) Roti Manis
Kekerasan roti manis diukur dengan menggunakan alat hardness tester berkapasitas 1 kg
(Ibrani et al., 2003). Pengujian kekerasan roti manis ini dilakukan dengan 3 kali ulangan.

2.7.3. Porositas Roti Manis
Untuk mengukur porositas roti manis, irisan roti manis difotokopi perbesar 2 x lipat,
kemudian diukur diameter semua pori-pori yang terdapat pada bidang luas tertentu.
Kemudian hasil dari pengukuran seluruh pori-pori tersebut dirata-rata.
2.8. Evaluasi Sensoris
Analisis sensoris yang dilakukan bertujuan untuk mengetahui tingkat kesukaan konsumen
terhadap produk meliputi warna, rasa, aroma dan tekstur dengan menggunakan 20 panelis
tak terlatih (Marsono & Astanu, 2000). Kuisioner organoleptik dapat dilihat pada Lampiran
2.
2.9. Pengolahan Data
Data hasil analisa fisik dan kimia dianalisa menggunakan perangkat lunak SPSS for
Window versi 11.5, yaitu dengan menggunakan anova satu arah (one way anova) dan
dilanjutkan dengan uji DMRT dengan tingkat signifikansi 0,05 (Stone & Sidel, 1985).
Sedangkan data hasil uji organoleptik dianalisa dengan menggunakan model
crosstabulation
3. HASIL PENELITIAN
Analisa yang dilakukan dalam penelitian ini meliputi analisa kimia, fisik dan sensoris.
Analisa kimia yang dilakukan adalah kadar air, protein, lemak dan serat kasar. Sedangkan
analisa fisik yang dilakukan meliputi persentase volume pengembangan, tingkat kekerasan
(hardness) dan porositas roti manis. Analisa sensoris dilakukan untuk mengetahui tingkat
kesukaan panelis terhadap rasa, aroma, warna dan tekstur roti manis.
3.1. Analisa Kimia
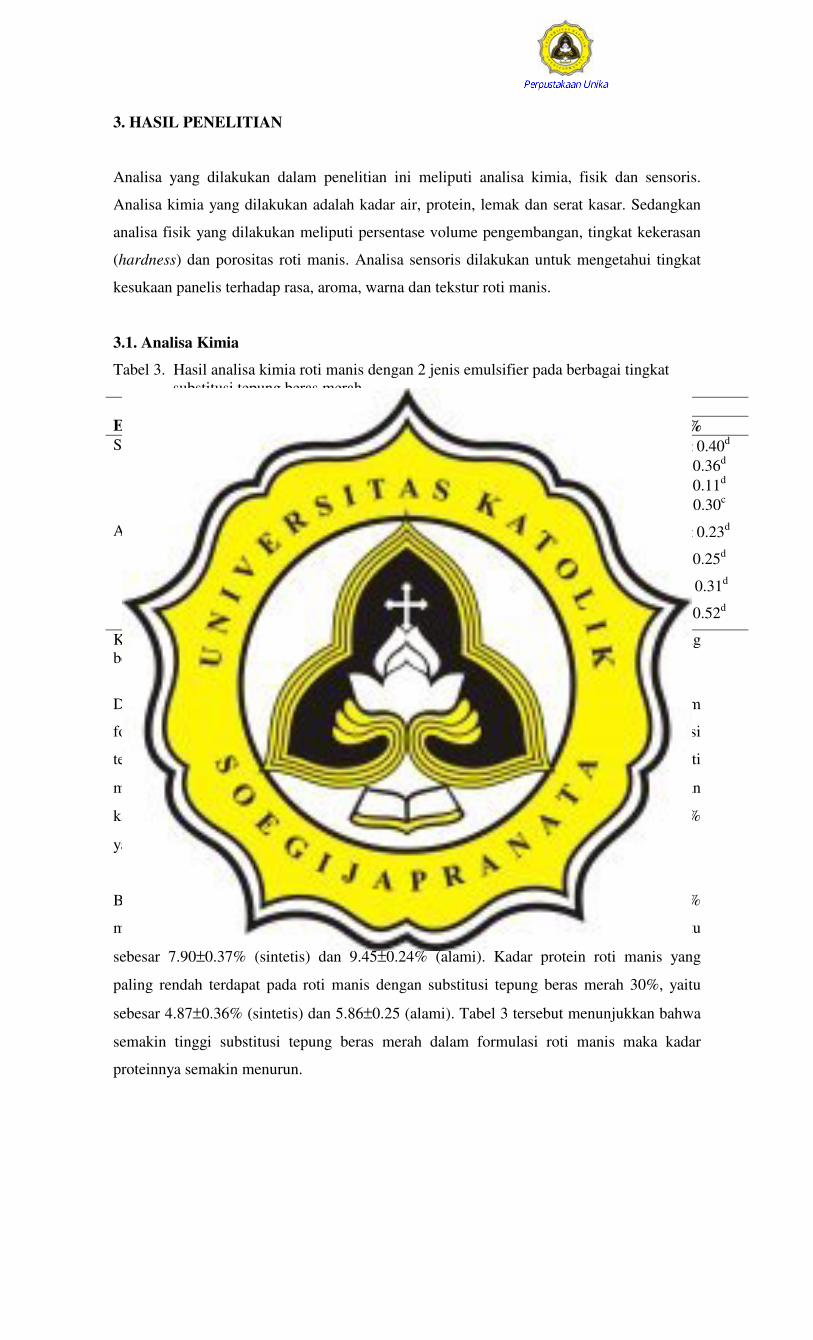
Tabel 3. Hasil analisa kimia roti manis dengan 2 jenis emulsifier pada berbagai tingkat substitusi tepung beras merah
Tepung Beras Merah Jenis Emulsifier
Parameter 0% 10% 20% 30%
Sintetis Kadar air (%) 26.64 ± 0.39a 28.09 ± 0.66b 29.83 ± 0.64c 31.25 ± 0.40d Protein (%) 7.90 ± 0.37a 6.56 ± 0.18b 5.62 ± 0.17c 4.87 ± 0.36d Lemak (%) 9.43± 0.28a 8.54 ± 0.33b 7.99 ± 0.19c 7.42 ± 0.11d Serat Kasar (%) 6.07 ± 0.50a 8.18 ± 0.61b 8.46 ± 0.90bc 8.71 ± 0.30c
Alami Kadar air (%) 21.79 ± 0.60a 24.00 ± 0.43b 24.81 ± 0.29c 25.89 ± 0.23d
Protein (%) 9.45 ± 0.24a 8.35 ± 0.26b 7.19 ± 0.26c 5.86 ± 0.25d
Lemak (%) 13.58 ± 0.32a 12.32 ± 0.22b 11.48 ± 0.26c 10.37± 0.31d
Serat Kasar (%) 5.71± 0.29a 7.53 ± 0.50b 8.49 ± 0.66c 8.88 ± 0.52d
Keterangan : Tanda superscript yang berbeda tiap baris menunjukkan adanya data yang berbeda nyata (p<0.05) berdasarkan Duncan’s Multiple Range Test
Dari Tabel 3, terlihat bahwa semakin banyak substitusi tepung beras merah dalam
formulasi roti manis maka kadar airnya semakin meningkat. Roti manis dengan substitusi
tepung beras merah 0% mempunyai kadar air paling rendah dan berbeda nyata dengan roti
manis lainnya, yaitu sebesar 26.64±0.39% (sintetis) dan 21.79±0.6% (alami). Sedangkan
kadar air paling besar dihasilkan oleh roti manis dengan substitusi tepung beras merah 30%
yaitu sebesar 31.25±0.40% (sintetis) dan 25.89±0.23% (alami).
Berdasarkan Tabel 3, terlihat bahwa roti manis dengan substitusi tepung beras merah 0%
mempunyai kadar protein paling tinggi dan berbeda nyata dengan roti manis lainnya yaitu
sebesar 7.90±0.37% (sintetis) dan 9.45±0.24% (alami). Kadar protein roti manis yang
paling rendah terdapat pada roti manis dengan substitusi tepung beras merah 30%, yaitu
sebesar 4.87±0.36% (sintetis) dan 5.86±0.25 (alami). Tabel 3 tersebut menunjukkan bahwa
semakin tinggi substitusi tepung beras merah dalam formulasi roti manis maka kadar
proteinnya semakin menurun.

Penambahan tepung beras merah dalam formulasi roti manis menyebabkan terjadinya
penurunan kadar lemak secara nyata. Dari Tabel 3, terlihat bahwa roti manis dengan
substitusi tepung beras merah 0% mempunyai kadar lemak paling besar dan berbeda nyata
dengan roti manis lainnya, yaitu sebesar 9.43±0.28% (sintetis) dan 13.58±0.32% (alami).
Sedangkan roti manis dengan substitusi tepung beras merah 30% mempunyai kadar lemak
paling rendah dan berbeda nyata dengan roti manis lainnya, yaitu sebesar 7.42±0.11%
(sintetis) dan 10.37±0.31% (alami). Semakin tinggi konsentrasi tepung beras merah yang
disubstitusikan dalam formulasi roti manis maka kadar lemaknya semakin menurun.
Dari Tabel 3 terlihat bahwa penambahan tepung beras merah dalam formulasi roti manis
berpengaruh secara nyata terhadap kadar serat kasar roti manis yang dihasilkan. Semakin
banyak substitusi tepung beras merah yang dilakukan maka semakin tinggi pula serat kasar
roti manis tersebut. Kadar serat kasar paling rendah dihasilkan dari roti manis dengan
substitusi tepung beras merah 0%, yaitu sebesar 6.07±0.50% (sintetis) dan berbeda nyata
dengan roti manis lainnya. Roti manis dengan substitusi tepung beras merah 10%
mempunyai kadar serat kasar sebesar 8.18±0.61% dan tidak memiliki beda nyata dengan
roti manis pada substitusi tepung beras merah 20%, yaitu sebesar 8.46±0.29%. Roti manis
dengan substitusi tepung beras merah 20% ini juga tidak berbeda nyata dengan roti manis
pada substitusi tepung beras merah 30%, yaitu sebesar 8.71±0.30%. Kadar serat kasar
terbesar dihasilkan oleh roti manis dengan substitusi tepung beras merah 30%, yaitu sebesar
8.71±0.30%. Semakin tinggi substitusi tepung beras merah, maka kadar serat kasar yang
dihasilkan semakin besar.
Dari Tabel 3 tersebut juga menunjukkan bahwa roti manis dengan emulsifier alami pada
substitusi tepung beras merah 0% mempunyai kadar serat paling rendah, yaitu sebesar
5.71±0.29% dan berbeda nyata dengan roti manis lainnya. Sedangkan roti manis dengan
substitusi tepung beras merah 30% memiliki kadar serat kasar paling besar dan berbeda
nyata dengan roti manis lainnya, yaitu sebesar 8.88 ± 0.52%. Semakin tinggi substitusi
tepung beras merah, maka kadar serat kasar yang dihasilkan semakin besar.

3.2. Analisa Fisik
Analisa fisik yang dilakukan terhadap roti manis meliputi persentase pengembangan
volume, kekerasan (hardness) dan porositas. Persentase volume pengembangan
dipengaruhi oleh substitusi tepung beras merah. Semakin besar konsentrasi tepung beras
merah yang disubstitusikan menyebabkan persentase volume pengembangannya semakin
kecil (Gambar 2).
Keterangan : TBM = Tepung beras merah
Gambar 2. Perbandingan Pengembangan Roti Manis Pada Berbagai Tingkat Substitusi Tepung Beras Merah

Tabel 4. Hasil Analisa Fisik Roti Manis dengan 2 Jenis Emulsifier pada Berbagai Tingkat Substitusi Tepung Beras Merah
Tepung Beras Merah Jenis Emulsifier
Parameter 0% 10% 20% 30%
Sintetis Volume Pengembang(%)
409.39± 6.88a 404.11± 4.81a 390.29± 10.91b 249.10 ± 8.47c
Porositas (mm) 0.55 ± 0.24a 0.87 ± 0.02b 1.15 ± 0.10c 1.76 ± 0.05d Hardness (N) 0.10 ± 0.00a 0.20 ± 0.00b 0.30 ± 0.00c 0.40 ± 0.00d Alami Volume
Pengembang(%) 402.94± 10.54a 391.36± 8.95b 285.56 ± 5.63c 186.05 ± 4.22d
Porositas (mm) 0.40 ± 0.01a 0.62 ± 0.014b 0.91 ± 0.27c 1.33 ± 0.94d
Hardness (N) 0.20 ± 0.00a 0.30 ± 0.00b 0.40 ± 0.00c 0.50 ± 0.00d
Keterangan : Tanda superscript yang berbeda tiap baris menunjukkan adanya data yang berbeda nyata (p<0.05) berdasarkan Duncan’s Multiple Range Test
Dari Tabel 4 diatas terlihat bahwa substitusi tepung beras merah berpengaruh secara nyata
terhadap sifat fisik roti manis yang dihasilkan, yaitu persentase volume pengembangan,
porositas dan kekerasan (hardness) roti manis. Semakin banyak substitusi tepung beras
merah dalam formulasi roti manis tersebut menyebabkan volume pengembangan roti manis
semakin menurun. Volume pengembangan roti manis terbesar dihasilkan oleh roti manis
dengan substitusi tepung beras merah 0%, yaitu sebesar 409.39±6.88% (sintetis) dan
402.94±10.54% (alami) serta berbeda nyata dengan roti manis lainnya. Roti manis dengan
menggunakan emulsifier sintetis pada substitusi tepung beras merah 0% dan 10% tidak
memiliki beda nyata satu sama lain. Namun, roti manis dengan substitusi tepung beras
merah 20% berbeda nyata dengan roti manis lainnya. Roti manis dengan substitusi tepung
beras merah 30% memiliki pengembangan volume yang paling rendah dan berbeda nyata
dengan roti manis lainnya, yaitu sebesar 186.05±4.22% (sintetis) dan 186.05±4.22%
(alami).
Tabel 4 diatas juga menunjukkan bahwa penambahan tepung beras merah berpengaruh
secara nyata terhadap kekerasan (hardness) roti manis yang dihasilkan. Semakin besar
tepung beras merah yang disubstitusikan dalam formulasi roti manis menyebabkan
hardness roti manis semakin besar. Roti manis dengan substitusi tepung beras merah 0%
mempunyai hardness paling kecil dan berbeda nyata dengan roti manis lainnya, yaitu
sebesar 0.10 N (sintetis) dan 0.20 N (alami). Sedangkan tingkat kekerasan roti manis
terbesar dihasilkan oleh roti manis dengan substitusi tepung beras merah 30%, yaitu sebesar
0.4 N (sintetis) dan 0.50 N (alami).

Dari Tabel 4 terlihat bahwa penambahan tepung beras merah akan berpengaruh secara
nyata pada ukuran diameter pori-pori (porositas) roti manis yang dihasilkan. Porositas roti
manis terbesar dihasilkan oleh roti manis dengan substitusi tepung beras merah 30%, yaitu
sebesar 1.76±0.05 mm (sintetis) sedangkan 1.33±0.94 mm (alami) dan berbeda nyata
dengan roti manis lainnya. Sedangkan porositas roti manis yang paling kecil dihasilkan
oleh roti manis dengan substitusi tepung beras merah 0%, yaitu sebesar 0.55±0.24 mm
(sintetis) dan 0.40±0.01 mm (alami). Semakin banyak konsentrasi tepung beras merah yang
disubstitusikan maka ukuran pori-pori (porositasnya) menjadi semakin besar.

3.3 Analisa Sensoris
Analisa sensoris roti manis dilakukan dengan uji kesukaan panelis terhadap parameter rasa,
aroma, warna dan tekstur. Tingkat kesukaan panelis terhadap roti manis dengan berbagai
konsentrasi substitusi tepung beras merah dapat dilihat pada Tabel 5.
Tabel 5. Tingkat Penerimaan Panelis Terhadap Sifat Sensoris Roti Manis Dengan
Menggunakan 2 Jenis Emulsifier Pada Berbagai Tingkat Substitusi Tepung Beras Merah
Formulasi Parameter Skala Penerimaan 1 2 3 4 5 6 7 8
sts 0 0 0 0 0 0 0 20 ts 0 0 10 55 0 0 25 65 s 15 55 85 45 40 70 75 15 ss 55 30 5 0 45 25 0 0
Rasa
sss 30 15 0 0 15 5 0 0 sts 0 0 0 0 0 0 5 20 ts 0 0 35 95 0 0 20 70 s 45 70 65 5 55 85 75 10 ss 30 25 0 0 20 15 0 0
Aroma
sss 25 5 0 0 25 0 0 0 sts 0 0 5 0 0 0 5 5 ts 0 50 45 40 0 70 50 15 s 10 45 40 45 20 25 40 55 ss 40 5 5 10 30 5 5 20
Warna
sss 50 0 5 5 50 0 0 5 sts 0 0 0 10 0 0 0 35 ts 0 5 5 90 0 0 10 55 s 35 65 75 0 25 60 80 10 ss 30 25 20 0 40 40 10 0
Tekstur
sss 35 5 0 0 35 0 0 0 Keterangan : sss = sangat suka sekali , ss = sangat suka, s = suka, ts = tidak suka, sts = sangat tidak suka TBM= tepung beras merah Formulasi : 1 = kontrol ; 2 = 10% TBM ; 3 = 20% TBM ; 4 = 30% TBM (emulsifier sintetis) 5 = kontrol ; 6 = 10% TBM ; 7 = 20% TBM ; 8 = 30% TBM (emulsifier alami)

MAAF…..
BAB 4 – Daftar Pustaka
Tidak Bisa Dibaca
(File Rusak)

i
LAMPIRAN 1. KUISIONER UJI ORGANOLEPTIK
KUISIONER Nama panelis : Jenis kelamin : Umur : Tanggal pengujian : Dihadapan anda tersedia produk roti manis dan anda diminta untuk mmberikan penilaian terhadap rasa, aroma, warna dan tekstur dengan dasar penilaian sebagai berikut :
1. : sangat tidak suka 2. : tidak suka 3. : suka 4. : sangat suka 5. : sangat suka sekali
Kode Rasa Aroma Warna Tekstur 527 793 486 295 381 954 651 283
ϑ TERIMAKASIH, GOD BLESS YOU ϑ
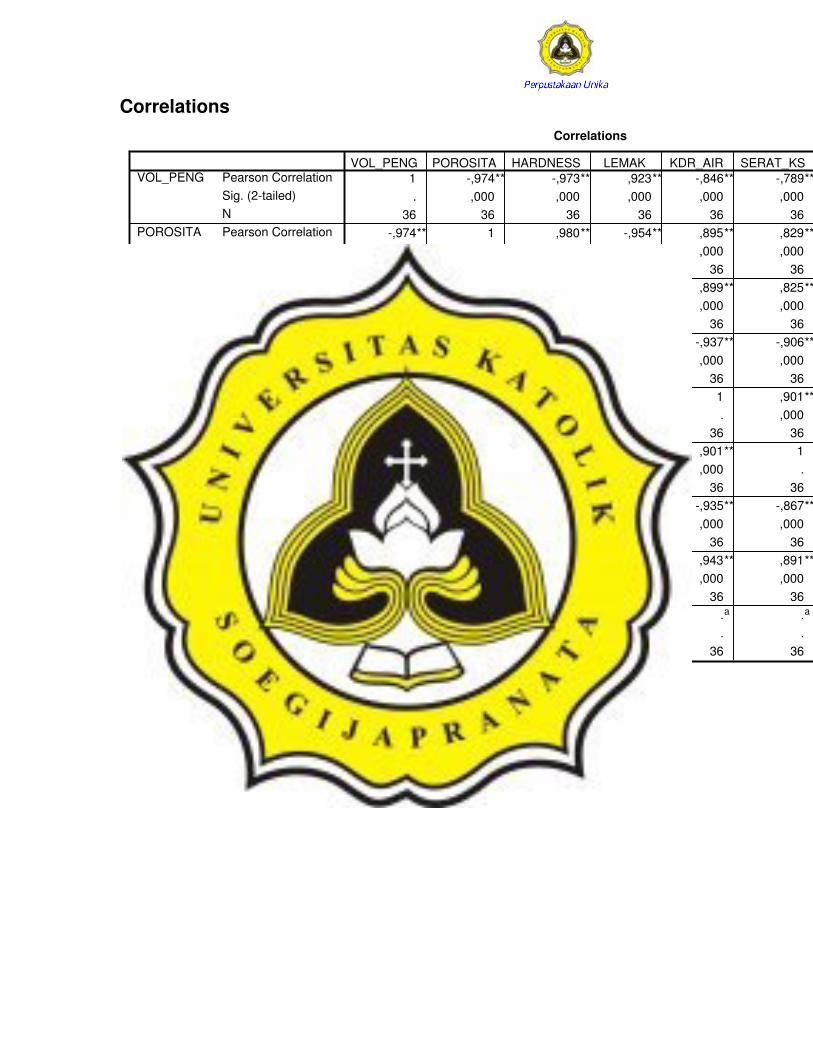
Correlations Correlations
1 -,974** -,973** ,923** -,846** -,789**. ,000 ,000 ,000 ,000 ,000
36 36 36 36 36 36-,974** 1 ,980** -,954** ,895** ,829**,000 . ,000 ,000 ,000 ,000
36 36 36 36 36 36-,973** ,980** 1 -,952** ,899** ,825**,000 ,000 . ,000 ,000 ,000
36 36 36 36 36 36,923** -,954** -,952** 1 -,937** -,906**,000 ,000 ,000 . ,000 ,000
36 36 36 36 36 36-,846** ,895** ,899** -,937** 1 ,901**,000 ,000 ,000 ,000 . ,000
36 36 36 36 36 36-,789** ,829** ,825** -,906** ,901** 1,000 ,000 ,000 ,000 ,000 .
36 36 36 36 36 36,952** -,969** -,971** ,955** -,935** -,867**,000 ,000 ,000 ,000 ,000 ,000
36 36 36 36 36 36-,957** ,980** ,979** -,973** ,943** ,891**,000 ,000 ,000 ,000 ,000 ,000
36 36 36 36 36 36.a .a .a .a .a .a
. . . . . .36 36 36 36 36 36
Pearson CorrelationSig. (2-tailed)NPearson CorrelationSig. (2-tailed)NPearson CorrelationSig. (2-tailed)NPearson CorrelationSig. (2-tailed)NPearson CorrelationSig. (2-tailed)NPearson CorrelationSig. (2-tailed)NPearson CorrelationSig. (2-tailed)NPearson CorrelationSig. (2-tailed)NPearson CorrelationSig. (2-tailed)N
VOL_PENG
POROSITA
HARDNESS
LEMAK
KDR_AIR
SERAT_KS
PROTEIN
KONSENTR
PERLAKUA
VOL_PENG POROSITA HARDNESS LEMAK KDR_AIR SERAT_KS
Correlation is significant at the 0.01 level (2-tailed).**.
Cannot be computed because at least one of the variables is constant.a.

Correlations Correlations
.a .a .a .a .a .
. . . . . .36 36 36 36 36 36
.a 1 -,829** ,977** ,971** -,948
. . ,000 ,000 ,000 ,00036 36 36 36 36 36
.a -,829** 1 -,900** -,834** ,750
. ,000 . ,000 ,000 ,00036 36 36 36 36 36
.a ,977** -,900** 1 ,964** -,917
. ,000 ,000 . ,000 ,00036 36 36 36 36 36
.a ,971** -,834** ,964** 1 -,902
. ,000 ,000 ,000 . ,00036 36 36 36 36 36
.a -,948** ,750** -,917** -,902** 1
. ,000 ,000 ,000 ,000 .36 36 36 36 36 36
.a ,960** -,799** ,922** ,932** -,933
. ,000 ,000 ,000 ,000 ,00036 36 36 36 36 36
.a ,812** -,493** ,747** ,726** -,798
. ,000 ,002 ,000 ,000 ,00036 36 36 36 36 36
.a -,965** ,737** -,922** -,913** ,902
. ,000 ,000 ,000 ,000 ,00036 36 36 36 36 36
Pearson CorrelationSig. (2-tailed)NPearson CorrelationSig. (2-tailed)NPearson CorrelationSig. (2-tailed)NPearson CorrelationSig. (2-tailed)NPearson CorrelationSig. (2-tailed)NPearson CorrelationSig. (2-tailed)NPearson CorrelationSig. (2-tailed)NPearson CorrelationSig. (2-tailed)NPearson CorrelationSig. (2-tailed)N
PERLAKUA
KONSENTR
VOL_PENG
POROSITA
HARDNESS
LEMAK
KDR_AIR
SERAT_KS
PROTEIN
PERLAKUA KONSENTR VOL_PENG POROSITA HARDNESS LEMAK
Correlation is significant at the 0.01 level (2-tailed).**.
Cannot be computed because at least one of the variables is constant.a.
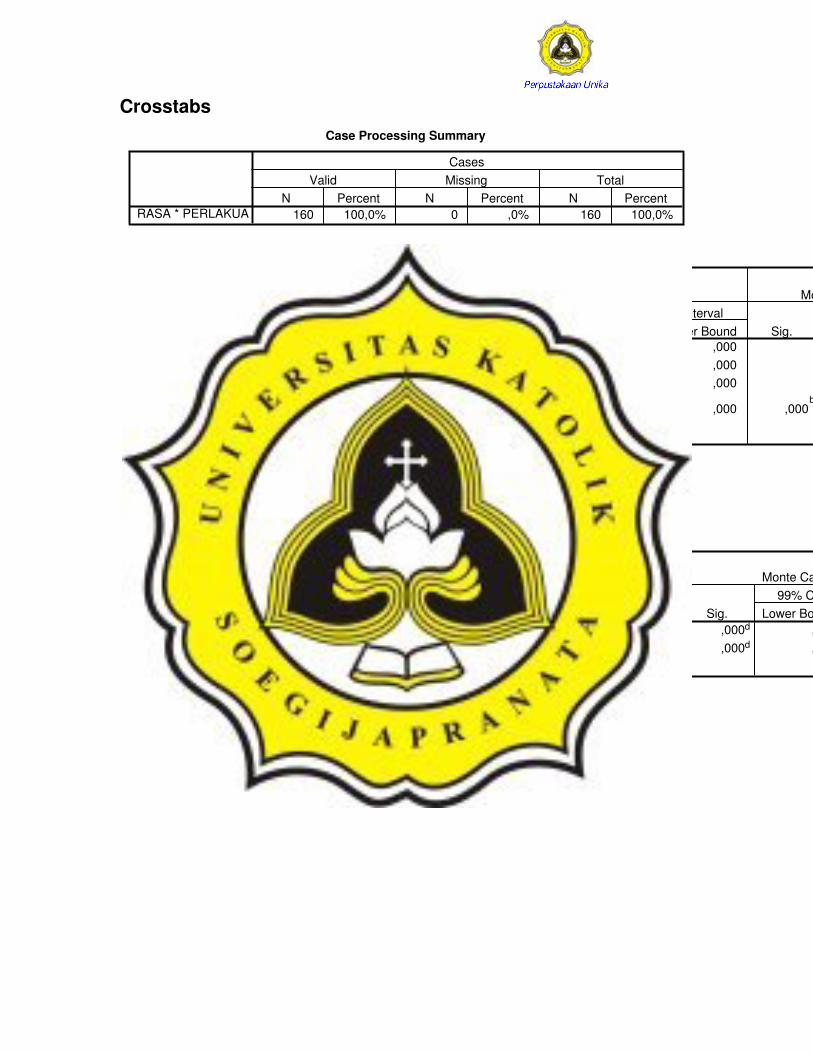
Crosstabs Case Processing Summary
160 100,0% 0 ,0% 160 100,0%RASA * PERLAKUAN Percent N Percent N Percent
Valid Missing TotalCases
Chi-Square Tests
153,569a 28 ,000 ,000b ,000 ,000156,010 28 ,000 ,000b ,000 ,000122,739 ,000b ,000 ,000
43,243c
1 ,000 ,000b
,000 ,000 ,000b
160
Pearson Chi-SquareLikelihood RatioFisher's Exact TestLinear-by-LinearAssociationN of Valid Cases
Value dfAsymp. Sig.
(2-sided) Sig. Lower Bound Upper Bound99% Confidence Interval
Monte Carlo Sig. (2-sided)
Sig.
Monte Carlo Sig. (1-sided)
32 cells (80,0%) have expected count less than 5. The minimum expected count is ,50.a.
Based on 10000 sampled tables with starting seed 2000000.b.
The standardized statistic is -6,576.c.
Symmetric Measures
-,522 ,056 -7,683 ,000c ,000d ,000-,521 ,064 -7,675 ,000c ,000d ,000
160
Pearson's RInterval by IntervalSpearman CorrelationOrdinal by Ordinal
N of Valid Cases
ValueAsymp.
Std. Errora Approx. Tb Approx. Sig. Sig. Lower Bound99% Confidence Interval
Monte Carlo Sig.
Not assuming the null hypothesis.a.
Using the asymptotic standard error assuming the null hypothesis.b.
Based on normal approximation.c.
Based on 10000 sampled tables with starting seed 2000000.d.

RASA
sangat suka sekali (
sangat suka (ss)
suka (s)
tidak suka (ts)
sangat tidak suka (s
Cou
nt
20
10
0
Tanpa Telor(ovalet)_
TBM10%
Tanpa Telor(ovalet)_
TBM20%
Tanpa Telor(ovalet)_
TBM30%
Dengan Telor_TBM0%
Dengan Telor_TBM10%
Dengan Telor_TBM20%
Dengan Telor_TBM30%
Crosstabs
Warnings
The Tests for Homogeneity of the Odds Ratio table and the Mantel-HaenszelCommon Odds Ratio Estimate table are not computed for RASA * PERLAKUA,because either (1) the group variable does not have exactly two distinct non-missingvalues or/and (2) the response variable does not have exactly two distinctnon-missing values.
Case Processing Summary
160 100,0% 0 ,0% 160 100,0%RASA * PERLAKUAN Percent N Percent N Percent
Valid Missing TotalCases
Chi-Square Tests
153,569a 28 ,000156,010 28 ,000
43,243 1 ,000
160
Pearson Chi-SquareLikelihood RatioLinear-by-LinearAssociationN of Valid Cases
Value dfAsymp. Sig.
(2-sided)
32 cells (80,0%) have expected count less than 5. Theminimum expected count is ,50.
a.
Directional Measures
,761,530
RASA DependentPERLAKUA Dependent
EtaNominal by IntervalValue

Symmetric Measures
-,442 ,055 -7,649 ,000-,521 ,064 -7,675 ,000c
-,522 ,056 -7,683 ,000c
160
Kendall's tau-bSpearman Correlation
Ordinal byOrdinal
Pearson's RInterval by IntervalN of Valid Cases
ValueAsymp.
Std. Errora Approx. Tb Approx. Sig.
Not assuming the null hypothesis.a.
Using the asymptotic standard error assuming the null hypothesis.b.
Based on normal approximation.c.
RASA
sangat suka sekali (
sangat suka (ss)
suka (s)
tidak suka (ts)
sangat tidak suka (s
Cou
nt
20
10
0
Tanpa Telor(ovalet)_
TBM10%
Tanpa Telor(ovalet)_
TBM20%
Tanpa Telor(ovalet)_
TBM30%
Dengan Telor_TBM0%
Dengan Telor_TBM10%
Dengan Telor_TBM20%
Dengan Telor_TBM30%
Crosstabs
Warnings
The Tests for Homogeneity of the Odds Ratio table and the Mantel-HaenszelCommon Odds Ratio Estimate table are not computed for AROMA * PERLAKUA,because either (1) the group variable does not have exactly two distinct non-missingvalues or/and (2) the response variable does not have exactly two distinctnon-missing values.
Case Processing Summary
160 100,0% 0 ,0% 160 100,0%AROMA * PERLAKUAN Percent N Percent N Percent
Valid Missing TotalCases
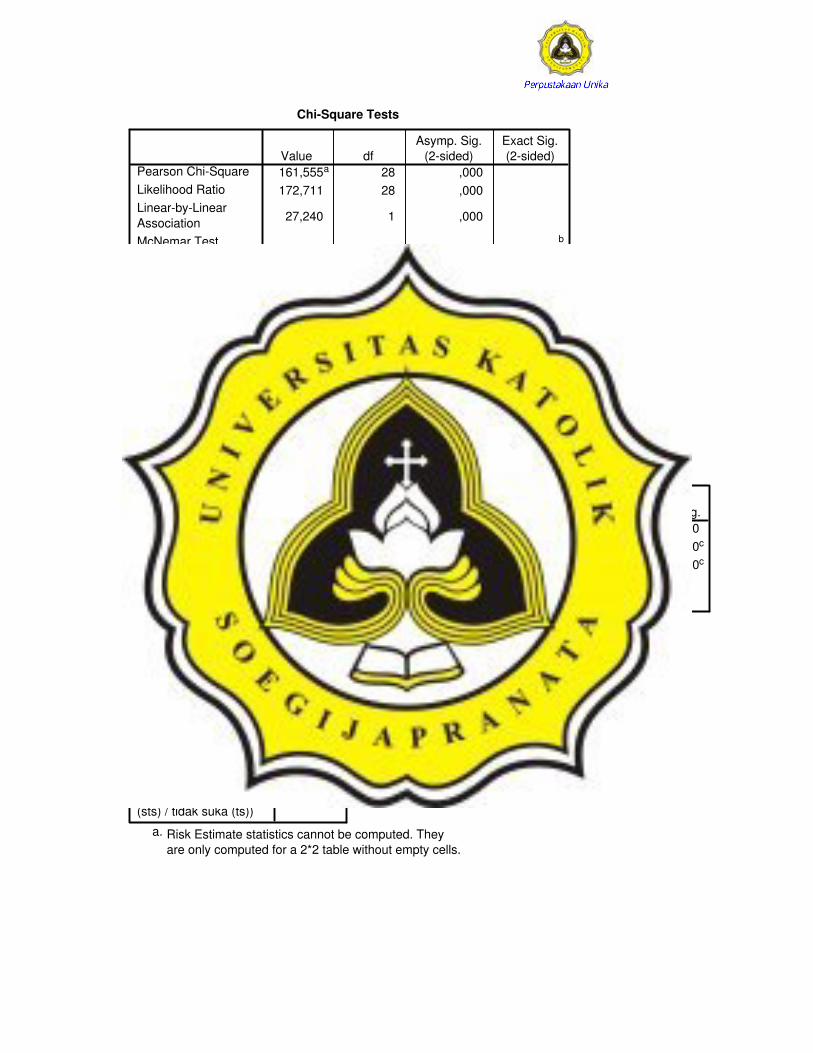
Chi-Square Tests
161,555a 28 ,000172,711 28 ,000
27,240 1 ,000
.b
160
Pearson Chi-SquareLikelihood RatioLinear-by-LinearAssociationMcNemar TestN of Valid Cases
Value dfAsymp. Sig.
(2-sided)Exact Sig.(2-sided)
24 cells (60,0%) have expected count less than 5. The minimumexpected count is ,63.
a.
Computed only for a PxP table, where P must be greater than 1.b.
Directional Measures
,753,435
AROMA DependentPERLAKUA Dependent
EtaNominal by IntervalValue
Symmetric Measures
-,349 ,057 -5,869 ,000-,410 ,070 -5,657 ,000c
-,414 ,060 -5,715 ,000c
.d
160
Kendall's tau-bSpearman Correlation
Ordinal by Ordinal
Pearson's RInterval by IntervalKappaMeasure of Agreement
N of Valid Cases
ValueAsymp.
Std. Errora Approx. Tb Approx. Sig.
Not assuming the null hypothesis.a.
Using the asymptotic standard error assuming the null hypothesis.b.
Based on normal approximation.c.
Kappa statistics cannot be computed.They require a symmetric 2-way table in which the valuesof the first variable match the values of the second variable.
d.
Risk Estimate
aOdds Ratio for AROMA(sangat tidak suka(sts) / tidak suka (ts))
Value
Risk Estimate statistics cannot be computed. Theyare only computed for a 2*2 table without empty cells.
a.
AROMA
sangat suka sekali (
sangat suka (ss)
suka (s)
tidak suka (ts)
sangat tidak suka (s
Cou
nt
20
10
0
Tanpa Telor(ovalet)_
TBM10%
Tanpa Telor(ovalet)_
TBM20%
Tanpa Telor(ovalet)_
TBM30%
Dengan Telor_TBM0%
Dengan Telor_TBM10%
Dengan Telor_TBM20%
Dengan Telor_TBM30%
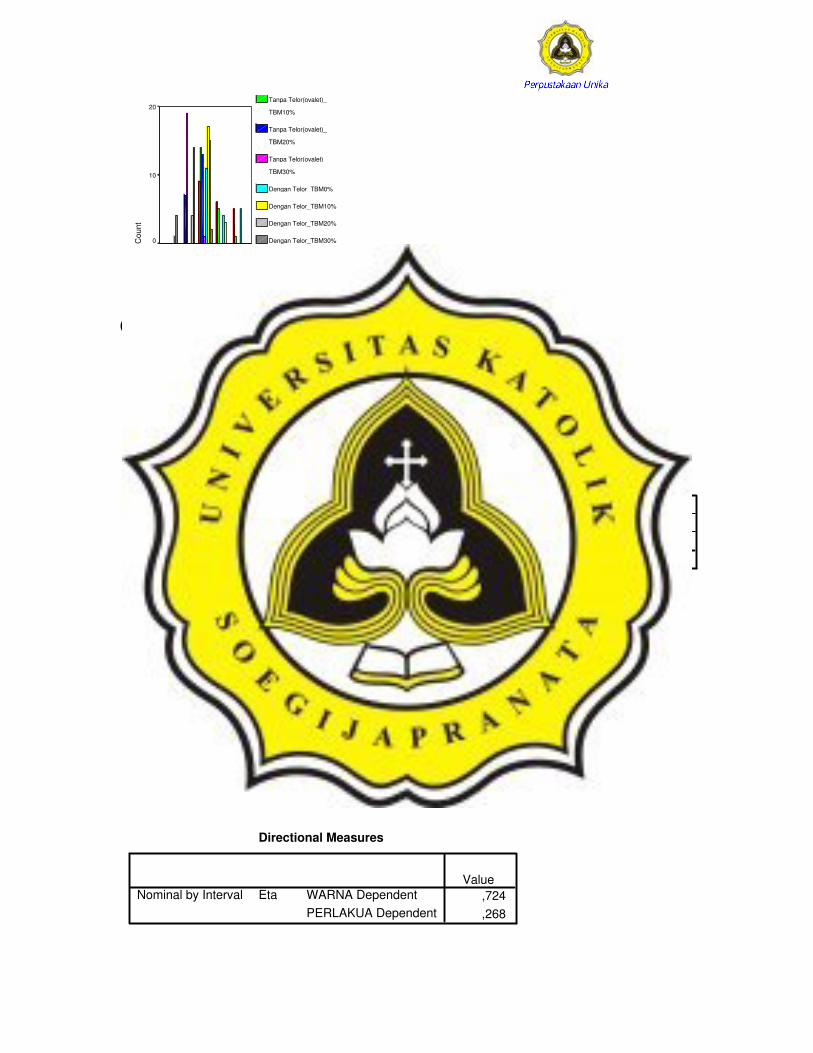
Crosstabs
Warnings
The Tests for Homogeneity of the Odds Ratio table and the Mantel-HaenszelCommon Odds Ratio Estimate table are not computed for WARNA * PERLAKUA,because either (1) the group variable does not have exactly two distinct non-missingvalues or/and (2) the response variable does not have exactly two distinctnon-missing values.
Case Processing Summary
160 100,0% 0 ,0% 160 100,0%WARNA * PERLAKUAN Percent N Percent N Percent
Valid Missing TotalCases
Chi-Square Tests
106,566a 28 ,000114,902 28 ,000
8,833 1 ,003
.b
160
Pearson Chi-SquareLikelihood RatioLinear-by-LinearAssociationMcNemar TestN of Valid Cases
Value dfAsymp. Sig.
(2-sided)Exact Sig.(2-sided)
24 cells (60,0%) have expected count less than 5. The minimumexpected count is ,38.
a.
Computed only for a PxP table, where P must be greater than 1.b.
Directional Measures
,724,268
WARNA DependentPERLAKUA Dependent
EtaNominal by IntervalValue

Symmetric Measures
-,163 ,062 -2,601 ,009-,212 ,078 -2,732 ,007c
-,236 ,073 -3,049 ,003c
.d
160
Kendall's tau-bSpearman Correlation
Ordinal by Ordinal
Pearson's RInterval by IntervalKappaMeasure of Agreement
N of Valid Cases
ValueAsymp.
Std. Errora Approx. Tb Approx. Sig.
Not assuming the null hypothesis.a.
Using the asymptotic standard error assuming the null hypothesis.b.
Based on normal approximation.c.
Kappa statistics cannot be computed.They require a symmetric 2-way table in which the valuesof the first variable match the values of the second variable.
d.
Risk Estimate
aOdds Ratio for WARNA(sangat tidak suka(sts) / tidak suka (ts))
Value
Risk Estimate statistics cannot be computed. Theyare only computed for a 2*2 table without empty cells.
a.
WARNA
sangat suka sekali (
sangat suka (ss)
suka (s)
tidak suka (ts)
sangat tidak suka (s
Cou
nt
16
14
12
10
8
6
4
2
0
Tanpa Telor(ovalet)_
TBM10%
Tanpa Telor(ovalet)_
TBM20%
Tanpa Telor(ovalet)_
TBM30%
Dengan Telor_TBM0%
Dengan Telor_TBM10%
Dengan Telor_TBM20%
Dengan Telor_TBM30%
Crosstabs
Warnings
The Tests for Homogeneity of the Odds Ratio table and the Mantel-HaenszelCommon Odds Ratio Estimate table are not computed for TEKSTUR * PERLAKUA,because either (1) the group variable does not have exactly two distinct non-missingvalues or/and (2) the response variable does not have exactly two distinctnon-missing values.

Case Processing Summary
160 100,0% 0 ,0% 160 100,0%TEKSTUR * PERLAKUAN Percent N Percent N Percent
Valid Missing TotalCases
Chi-Square Tests
199,568a 28 ,000192,783 28 ,000
24,027 1 ,000
.b
160
Pearson Chi-SquareLikelihood RatioLinear-by-LinearAssociationMcNemar TestN of Valid Cases
Value dfAsymp. Sig.
(2-sided)Exact Sig.(2-sided)
32 cells (80,0%) have expected count less than 5. The minimumexpected count is 1,13.
a.
Computed only for a PxP table, where P must be greater than 1.b.
Directional Measures
,804,406
TEKSTUR DependentPERLAKUA Dependent
EtaNominal by IntervalValue
Symmetric Measures
-,322 ,057 -5,526 ,000-,374 ,072 -5,070 ,000c
-,389 ,063 -5,303 ,000c
.d
160
Kendall's tau-bSpearman Correlation
Ordinal by Ordinal
Pearson's RInterval by IntervalKappaMeasure of Agreement
N of Valid Cases
ValueAsymp.
Std. Errora Approx. Tb Approx. Sig.
Not assuming the null hypothesis.a.
Using the asymptotic standard error assuming the null hypothesis.b.
Based on normal approximation.c.
Kappa statistics cannot be computed.They require a symmetric 2-way table in which the valuesof the first variable match the values of the second variable.
d.
Risk Estimate
aOdds Ratio for TEKSTUR(sangat tidak suka (sts) /tidak suka (ts))
Value
Risk Estimate statistics cannot be computed. Theyare only computed for a 2*2 table without empty cells.
a.
TEKSTUR
sangat suka sekali (
sangat suka (ss)
suka (s)
tidak suka (ts)
sangat tidak suka (s
Cou
nt
20
10
0
Tanpa Telor(ovalet)_
TBM10%
Tanpa Telor(ovalet)_
TBM20%
Tanpa Telor(ovalet)_
TBM30%
Dengan Telor_TBM0%
Dengan Telor_TBM10%
Dengan Telor_TBM20%
Dengan Telor_TBM30%
Descriptives
Descriptive Statistics
36 240,1526 420,1750 13075,89 363,2193 67,639839536 ,5348 1,8289 38,9264 1,081290 ,453950636 ,0100 ,0380 ,8198 ,022772 ,009653836 7,2676 9,9474 300,4182 8,344949 ,784579336 25,9115 31,9562 1042,3569 28,954358 1,840951336 5,2046 9,3466 282,8392 7,856645 1,144290736 4,2848 8,4173 224,5896 6,238599 1,182684236
VOL_PENGPOROSITAHARDNESSLEMAKKDR_AIRSERAT_KSPROTEINValid N (listwise)
N Minimum Maximum Sum Mean Std. Deviation
Descriptives
Descriptive Statistics
36 179,9595 418,5253 11393,24 316,4789 89,662958536 ,3796 1,4681 29,3395 ,814986 ,352193236 ,0210 ,0480 1,2073 ,033535 ,008995336 9,8539 13,9524 429,6869 11,935748 1,218486736 20,7608 26,2709 868,4222 24,122838 1,572802736 5,2908 9,5605 275,4869 7,652415 1,332310236 5,5907 9,8233 277,6282 7,711894 1,374246136
VOL_PENGPOROSITAHARDNESSLEMAKKDR_AIRSERAT_KSPROTEINValid N (listwise)
N Minimum Maximum Sum Mean Std. Deviation
Explore Case Processing Summary
36 100,0% 0 ,0% 36 100,0%VOL_PENGN Percent N Percent N Percent
Valid Missing TotalCases
Descriptives
363,2193 11,27331340,3333
386,1053
366,9800400,59894575,14867,63984240,1526420,1750180,0224112,2498
-1,147 ,393-,598 ,768
MeanLower BoundUpper Bound
95% ConfidenceInterval for Mean
5% Trimmed MeanMedianVarianceStd. DeviationMinimumMaximumRangeInterquartile RangeSkewnessKurtosis
VOL_PENGStatistic Std. Error
M-Estimators
395,717472 401,6906 401,348326 401,69211VOL_PENG
Huber'sM-Estimatora
Tukey'sBiweightb
Hampel'sM-Estimatorc
Andrews'Waved
The weighting constant is 1,339.a.
The weighting constant is 4,685.b.
The weighting constants are 1,700, 3,400, and 8,500c.
The weighting constant is 1,340*pi.d.
Tests of Normality
,347 36 ,000 ,674 36 ,000VOL_PENGStatistic df Sig. Statistic df Sig.
Kolmogorov-Smirnova Shapiro-Wilk
Lilliefors Significance Correctiona.
Stem-and-Leaf Plots VOL_PENG Stem-and-Leaf Plot Frequency Stem & Leaf 5,00 2 . 44444

4,00 2 . 5556 ,00 3 . 8,00 3 . 78888899 19,00 4 . 0000000000001111112 Stem width: 100,0000 Each leaf: 1 case(s)
Normal Q-Q Plots Normal Q-Q Plot of VOL_PENG
Observed Value
500400300200
Exp
ecte
d N
orm
al
2
1
0
-1
-2
Detrended Normal Q-Q Plots
Detrended Normal Q-Q Plot of VOL_PENG
Observed Value
500400300200
Dev
from
Nor
mal
1,0
,5
0,0
-,5
-1,0
-1,5
36N =
VOL_PENG
500
400
300
200

Explore Case Processing Summary
36 100,0% 0 ,0% 36 100,0%VOL_1N Percent N Percent N Percent
Valid Missing TotalCases
Descriptives
-77,1635 60,61870-200,2260
45,8990
-79,1404-94,9251132286,6
363,71221-771,56686,52
1458,08436,9270
,178 ,393-,007 ,768
MeanLower BoundUpper Bound
95% ConfidenceInterval for Mean
5% Trimmed MeanMedianVarianceStd. DeviationMinimumMaximumRangeInterquartile RangeSkewnessKurtosis
VOL_1Statistic Std. Error
M-Estimators
-97,6057 -107,6099 -91,2439 -109,7672VOL_1
Huber'sM-Estimatora
Tukey'sBiweightb
Hampel'sM-Estimatorc
Andrews'Waved
The weighting constant is 1,339.a.
The weighting constant is 4,685.b.
The weighting constants are 1,700, 3,400, and 8,500c.
The weighting constant is 1,340*pi.d.
Tests of Normality
,160 36 ,020 ,955 36 ,152VOL_1Statistic df Sig. Statistic df Sig.
Kolmogorov-Smirnova Shapiro-Wilk
Lilliefors Significance Correctiona.
Stem-and-Leaf Plots VOL_1 Stem-and-Leaf Plot Frequency Stem & Leaf 4,00 -0 . 6777

1,00 -0 . 4 6,00 -0 . 223333 15,00 -0 . 000000001111111 2,00 0 . 01 3,00 0 . 222 4,00 0 . 4555 1,00 Extremes (>=687) Stem width: 1000,00 Each leaf: 1 case(s)
Normal Q-Q Plots Normal Q-Q Plot of VOL_1
Observed Value
8006004002000-200-400-600-800
Exp
ecte
d N
orm
al
2
1
0
-1
-2
Detrended Normal Q-Q Plots
Detrended Normal Q-Q Plot of VOL_1
Observed Value
8006004002000-200-400-600-800
Dev
from
Nor
mal
,6
,4
,2
0,0
-,2
-,4
36N =
VOL_1
1000
0
-1000
8
Oneway
Descriptives
VOL_1
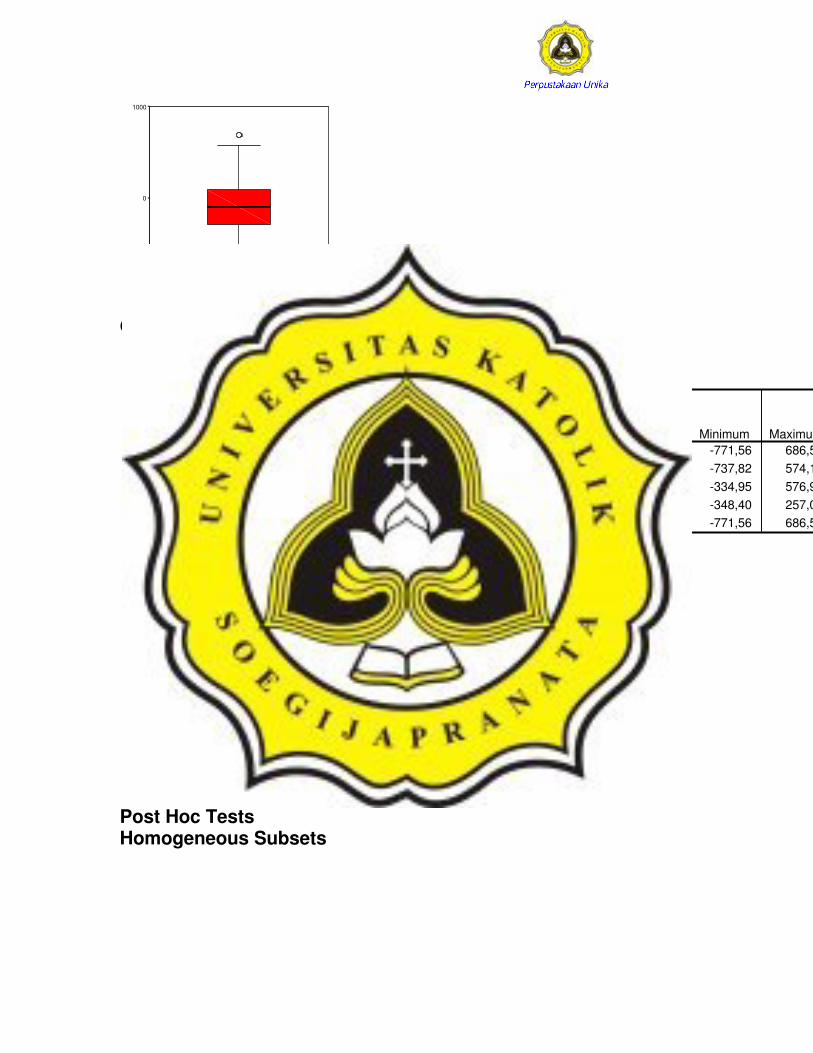
9 -183,9576 430,23233 143,41078 -514,6635 146,7482 -771,56 686,529 -181,1483 438,74673 146,24891 -518,3989 156,1023 -737,82 574,119 122,8243 307,42866 102,47622 -113,4863 359,1349 -334,95 576,959 -66,3722 191,10798 63,70266 -213,2708 80,5264 -348,40 257,08
36 -77,1635 363,71221 60,61870 -200,2260 45,8990 -771,56 686,52
TBM 0%TBM 10%TBM 20%TBM 30%Total
N Mean Std. Deviation Std. Error Lower Bound Upper Bound
95% Confidence Interval forMean
Minimum Maximum
Test of Homogeneity of Variances
VOL_1
1,151 3 32 ,344
LeveneStatistic df1 df2 Sig.
ANOVA
VOL_1
560964,5 3 186988,182 1,471 ,2414069065 32 127158,2964630030 35
Between GroupsWithin GroupsTotal
Sum ofSquares df Mean Square F Sig.
Post Hoc Tests Homogeneous Subsets
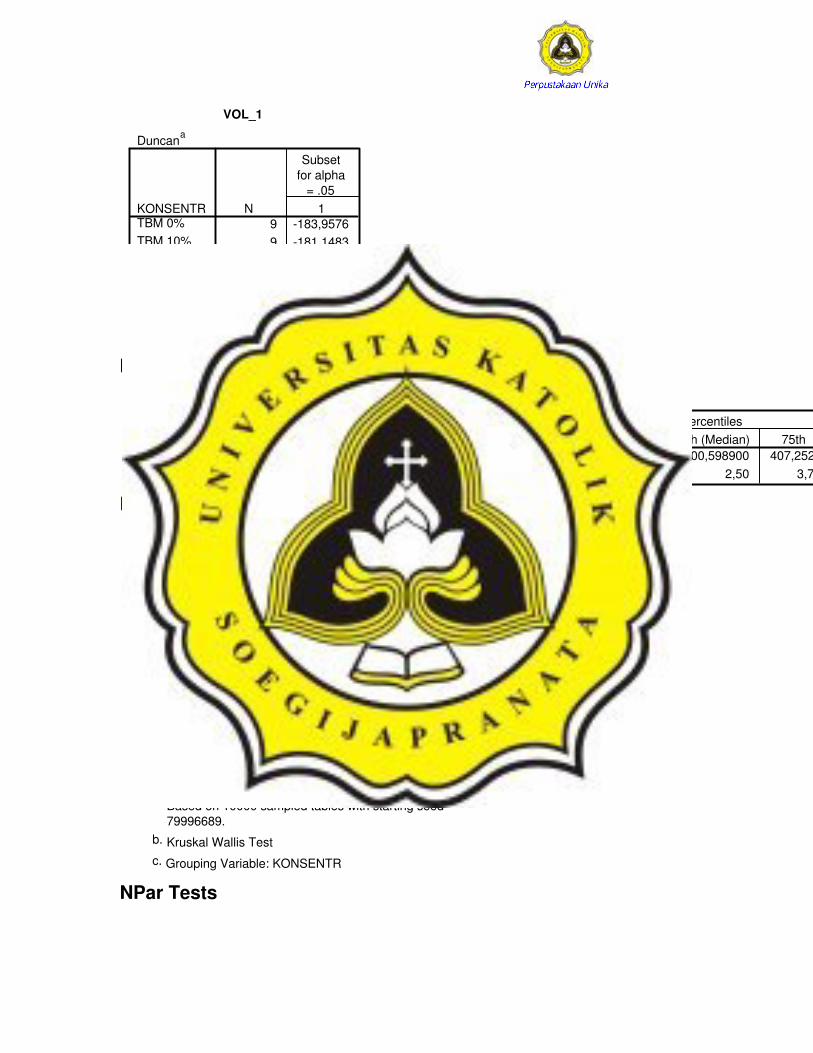
VOL_1
Duncana
9 -183,95769 -181,14839 -66,37229 122,8243
,104
KONSENTRTBM 0%TBM 10%TBM 30%TBM 20%Sig.
N 1
Subsetfor alpha
= .05
Means for groups in homogeneous subsets are displayed.Uses Harmonic Mean Sample Size = 9,000.a.
NPar Tests
Descriptive Statistics
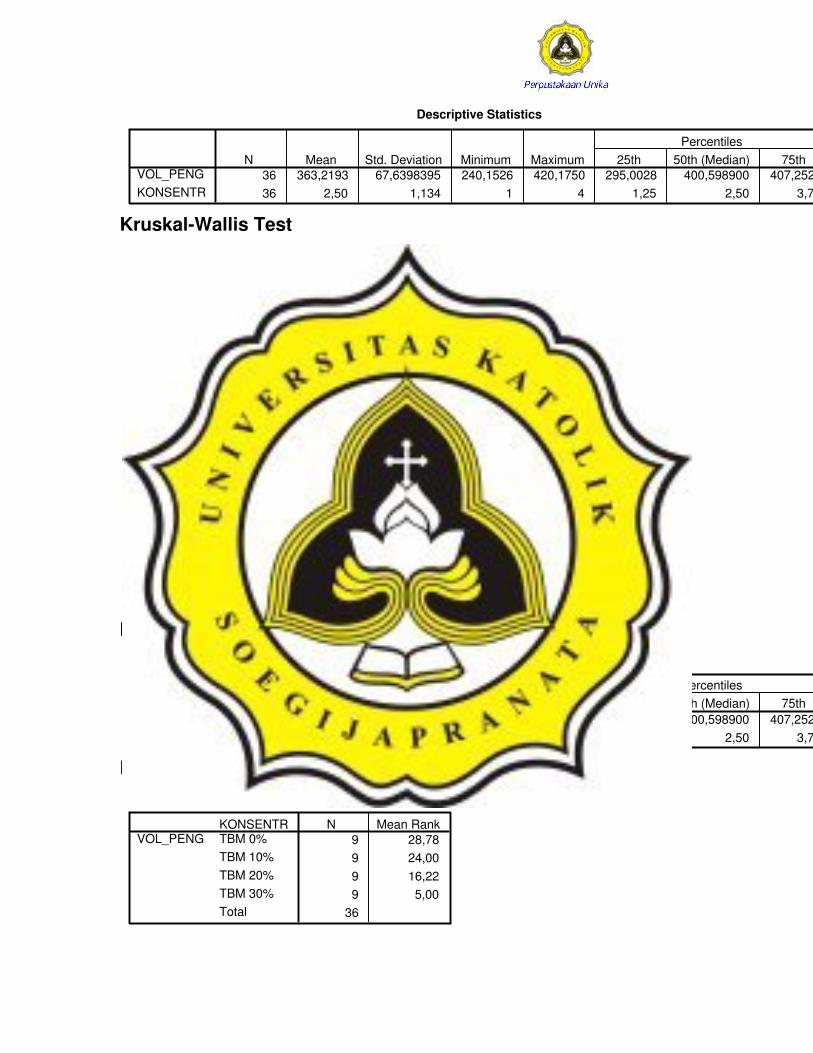
36 363,2193 67,6398395 240,1526 420,1750 295,0028 400,598900 407,252636 2,50 1,134 1 4 1,25 2,50 3,75
VOL_PENGKONSENTR
N Mean Std. Deviation Minimum Maximum 25th 50th (Median) 75thPercentiles
Kruskal-Wallis Test
Ranks
9 11,449 7,56
18
KONSENTRTBM 0%TBM 10%Total
VOL_PENGN Mean Rank
Test Statisticsb,c
2,3881
,122,131a
,122,139
Chi-SquaredfAsymp. Sig.
Sig.Lower BoundUpper Bound
99% ConfidenceInterval
Monte CarloSig.
VOL_PENG
Based on 10000 sampled tables with starting seed79996689.
a.
Kruskal Wallis Testb.
Grouping Variable: KONSENTRc.
NPar Tests
Descriptive Statistics
36 363,2193 67,6398395 240,1526 420,1750 295,0028 400,598900 407,252636 2,50 1,134 1 4 1,25 2,50 3,75
VOL_PENGKONSENTR
N Mean Std. Deviation Minimum Maximum 25th 50th (Median) 75thPercentiles
Kruskal-Wallis Test
Ranks
9 19,789 15,009 7,22
27
KONSENTRTBM 0%TBM 10%TBM 20%Total
VOL_PENGN Mean Rank
Test Statisticsb,c
11,4742
,003,001a
,000,002
Chi-SquaredfAsymp. Sig.
Sig.Lower BoundUpper Bound
99% ConfidenceInterval
Monte CarloSig.
VOL_PENG
Based on 10000 sampled tables with starting seed375159495.
a.
Kruskal Wallis Testb.
Grouping Variable: KONSENTRc.
NPar Tests Descriptive Statistics
36 363,2193 67,6398395 240,1526 420,1750 295,0028 400,598900 407,252636 2,50 1,134 1 4 1,25 2,50 3,75
VOL_PENGKONSENTR
N Mean Std. Deviation Minimum Maximum 25th 50th (Median) 75thPercentiles
Kruskal-Wallis Test
Ranks
9 28,789 24,009 16,229 5,00
36
KONSENTRTBM 0%TBM 10%TBM 20%TBM 30%Total
VOL_PENGN Mean Rank
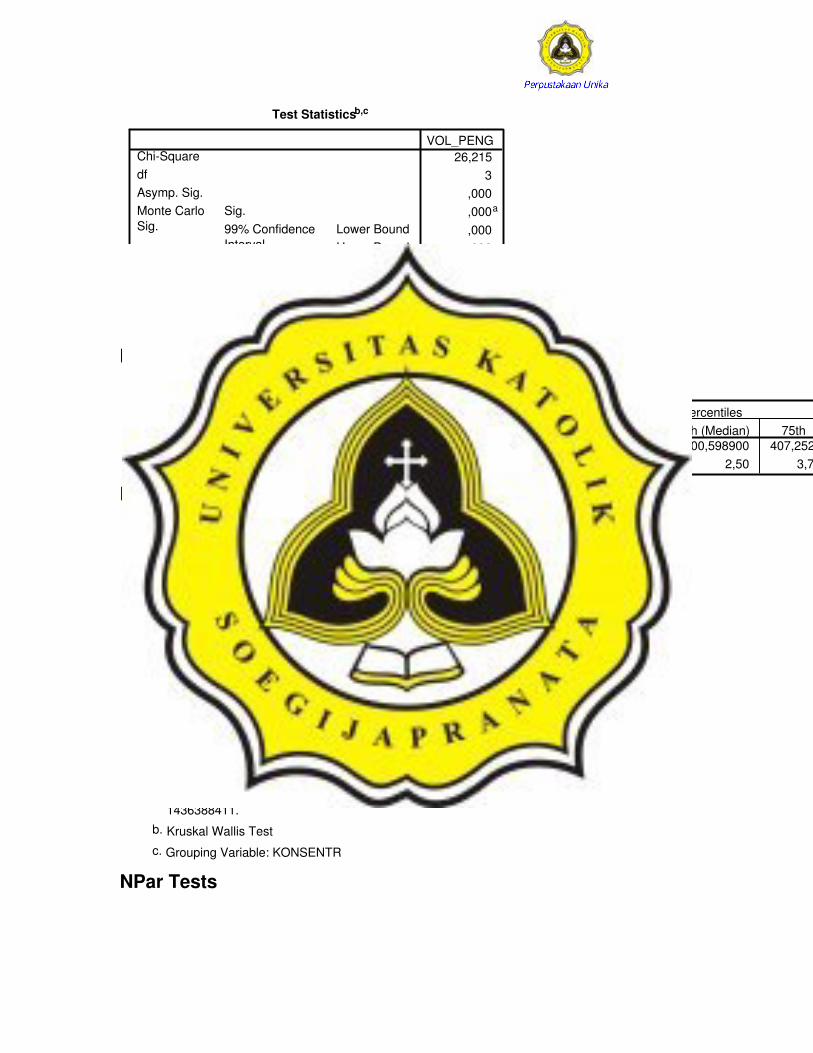
Test Statisticsb,c
26,2153
,000,000a
,000,000
Chi-SquaredfAsymp. Sig.
Sig.Lower BoundUpper Bound
99% ConfidenceInterval
Monte CarloSig.
VOL_PENG
Based on 10000 sampled tables with starting seed619230322.
a.
Kruskal Wallis Testb.
Grouping Variable: KONSENTRc.
NPar Tests Descriptive Statistics
36 363,2193 67,6398395 240,1526 420,1750 295,0028 400,598900 407,252636 2,50 1,134 1 4 1,25 2,50 3,75
VOL_PENGKONSENTR
N Mean Std. Deviation Minimum Maximum 25th 50th (Median) 75thPercentiles
Kruskal-Wallis Test
Ranks
9 12,449 6,56
18
KONSENTRTBM 10%TBM 20%Total
VOL_PENGN Mean Rank
Test Statisticsb,c
5,4761
,019,021a
,017,025
Chi-SquaredfAsymp. Sig.
Sig.Lower BoundUpper Bound
99% ConfidenceInterval
Monte CarloSig.
VOL_PENG
Based on 10000 sampled tables with starting seed1436388411.
a.
Kruskal Wallis Testb.
Grouping Variable: KONSENTRc.
NPar Tests

Descriptive Statistics
36 363,2193 67,6398395 240,1526 420,1750 295,0028 400,598900 407,252636 2,50 1,134 1 4 1,25 2,50 3,75
VOL_PENGKONSENTR
N Mean Std. Deviation Minimum Maximum 25th 50th (Median) 75thPercentiles
Kruskal-Wallis Test
Ranks
9 21,449 15,569 5,00
27
KONSENTRTBM 10%TBM 20%TBM 30%Total
VOL_PENGN Mean Rank
Test Statisticsb,c
19,8342
,000,000a
,000,000
Chi-SquaredfAsymp. Sig.
Sig.Lower BoundUpper Bound
99% ConfidenceInterval
Monte CarloSig.
VOL_PENG
Based on 10000 sampled tables with starting seed1634676757.
a.
Kruskal Wallis Testb.
Grouping Variable: KONSENTRc.
NPar Tests Descriptive Statistics
36 363,2193 67,6398395 240,1526 420,1750 295,0028 400,598900 407,252636 2,50 1,134 1 4 1,25 2,50 3,75
VOL_PENGKONSENTR
N Mean Std. Deviation Minimum Maximum 25th 50th (Median) 75thPercentiles
Kruskal-Wallis Test
Ranks
9 21,449 15,569 5,00
27
KONSENTRTBM 10%TBM 20%TBM 30%Total
VOL_PENGN Mean Rank

Test Statisticsb,c
19,8342
,000,000a
,000,000
Chi-SquaredfAsymp. Sig.
Sig.Lower BoundUpper Bound
99% ConfidenceInterval
Monte CarloSig.
VOL_PENG
Based on 10000 sampled tables with starting seed1724717747.
a.
Kruskal Wallis Testb.
Grouping Variable: KONSENTRc.
NPar Tests Descriptive Statistics
36 363,2193 67,6398395 240,1526 420,1750 295,0028 400,598900 407,252636 2,50 1,134 1 4 1,25 2,50 3,75
VOL_PENGKONSENTR
N Mean Std. Deviation Minimum Maximum 25th 50th (Median) 75thPercentiles
Kruskal-Wallis Test
Ranks
9 14,009 5,00
18
KONSENTRTBM 20%TBM 30%Total
VOL_PENGN Mean Rank
Test Statisticsb,c
12,7891
,000,000a
,000,000
Chi-SquaredfAsymp. Sig.
Sig.Lower BoundUpper Bound
99% ConfidenceInterval
Monte CarloSig.
VOL_PENG
Based on 10000 sampled tables with starting seed1509375996.
a.
Kruskal Wallis Testb.
Grouping Variable: KONSENTRc.
Explore Case Processing Summary
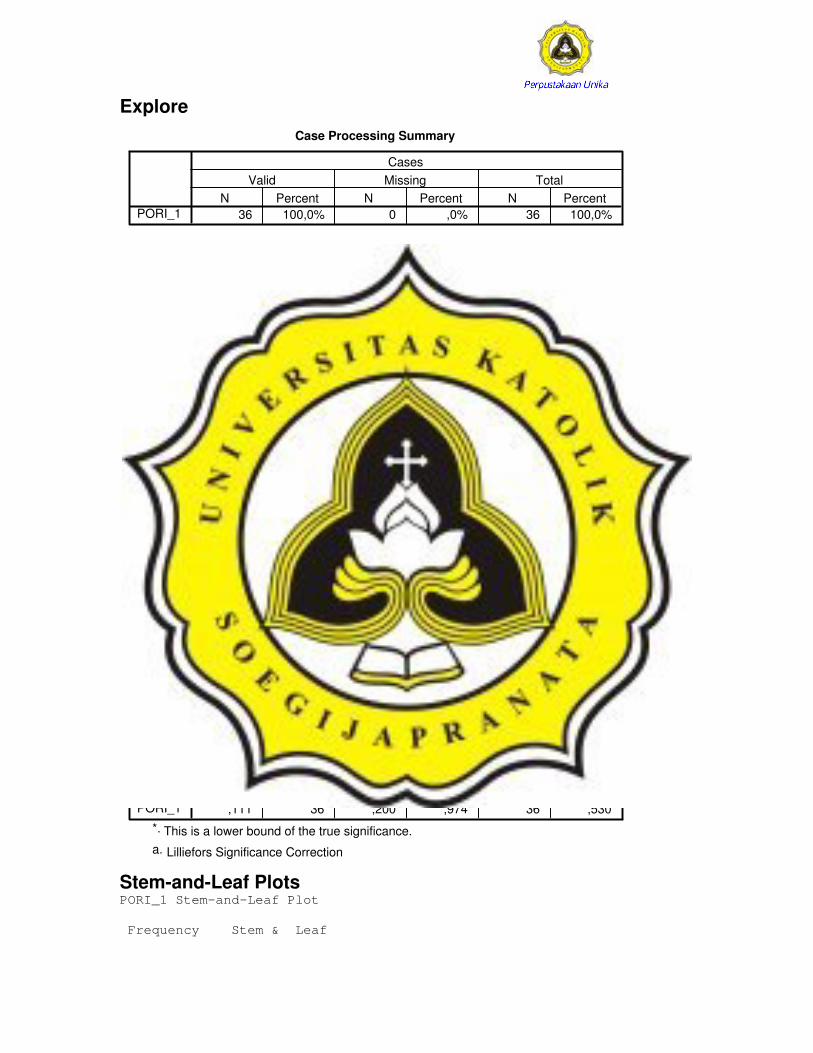
36 100,0% 0 ,0% 36 100,0%PORI_1N Percent N Percent N Percent
Valid Missing TotalCases
Descriptives
,0849 ,22734-,3766
,5464
,1192,04421,861
1,36405-3,723,016,73
1,5211-,331 ,3931,056 ,768
MeanLower BoundUpper Bound
95% ConfidenceInterval for Mean
5% Trimmed MeanMedianVarianceStd. DeviationMinimumMaximumRangeInterquartile RangeSkewnessKurtosis
PORI_1Statistic Std. Error
M-Estimators
,0897 ,1264 ,1121 ,1261PORI_1
Huber'sM-Estimatora
Tukey'sBiweightb
Hampel'sM-Estimatorc
Andrews'Waved
The weighting constant is 1,339.a.
The weighting constant is 4,685.b.
The weighting constants are 1,700, 3,400, and 8,500c.
The weighting constant is 1,340*pi.d.
Tests of Normality
,111 36 ,200* ,974 36 ,530PORI_1Statistic df Sig. Statistic df Sig.
Kolmogorov-Smirnova Shapiro-Wilk
This is a lower bound of the true significance.*.
Lilliefors Significance Correctiona.
Stem-and-Leaf Plots PORI_1 Stem-and-Leaf Plot Frequency Stem & Leaf

1,00 Extremes (=<-3,7) 2,00 -2 . 15 2,00 -1 . 03 12,00 -0 . 111334566778 12,00 0 . 000234678889 4,00 1 . 0279 2,00 2 . 24 1,00 3 . 0 Stem width: 1,00 Each leaf: 1 case(s)
Normal Q-Q Plots Normal Q-Q Plot of PORI_1
Observed Value
43210-1-2-3-4
Expected Normal
2
1
0
-1
-2
Detrended Normal Q-Q Plots
Detrended Normal Q-Q Plot of PORI_1
Observed Value
43210-1-2-3-4
Dev from Normal
,4
,2
0,0
-,2
-,4
-,6
-,8
-1,0

PORI_1
4
2
0
-2
-4
-6
NPar Tests
Descriptive Statistics
36 363,2193 67,6398395 240,1526 420,1750 295,0028 400,598900 407,252636 1,081290 ,4539506 ,5348 1,8289 ,630084 ,963833 1,578602
VOL_PENGPOROSITA
N Mean Std. Deviation Minimum Maximum 25th 50th (Median) 75thPercentiles
Kruskal-Wallis Test
Ranks
18 9,5018a
POROSITA1,0000Total
VOL_PENGN Mean Rank
There is only one non-empty group.Kruskal-Wallis Test cannot be performed.
a.
NPar Tests
Warnings
There are not enough valid cases to perform the Kruskal-Wallis Test for VOL_PENG* POROSITA (2,0000, 3,0000). No statistics are computed.
Descriptive Statistics
36 363,2193 67,6398395 240,1526 420,1750 295,0028 400,598900 407,252636 1,081290 ,4539506 ,5348 1,8289 ,630084 ,963833 1,578602
VOL_PENGPOROSITA
N Mean Std. Deviation Minimum Maximum 25th 50th (Median) 75thPercentiles
NPar Tests
Warnings
There are not enough valid cases to perform the Kruskal-Wallis Test for VOL_PENG* POROSITA (2,0000, 4,0000). No statistics are computed.
Descriptive Statistics
36 363,2193 67,6398395 240,1526 420,1750 295,0028 400,598900 407,252636 1,081290 ,4539506 ,5348 1,8289 ,630084 ,963833 1,578602
VOL_PENGPOROSITA
N Mean Std. Deviation Minimum Maximum 25th 50th (Median) 75thPercentiles
NPar Tests
Warnings
There are not enough valid cases to perform the Kruskal-Wallis Test for VOL_PENG* POROSITA (3,0000, 4,0000). No statistics are computed.

Descriptive Statistics
36 363,2193 67,6398395 240,1526 420,1750 295,0028 400,598900 407,252636 1,081290 ,4539506 ,5348 1,8289 ,630084 ,963833 1,578602
VOL_PENGPOROSITA
N Mean Std. Deviation Minimum Maximum 25th 50th (Median) 75thPercentiles
Explore
Case Processing Summary
36 100,0% 0 ,0% 36 100,0%SERAT_1N Percent N Percent N Percent
Valid Missing TotalCases
Descriptives
-,9488 1,21185-3,4090
1,5113
-,7555,2210
52,8697,27110
-21,6013,0834,67
7,6915-,625 ,393,761 ,768
MeanLower BoundUpper Bound
95% ConfidenceInterval for Mean
5% Trimmed MeanMedianVarianceStd. DeviationMinimumMaximumRangeInterquartile RangeSkewnessKurtosis
SERAT_1Statistic Std. Error
M-Estimators
-,1395 ,1349 -,2045 ,1299SERAT_1
Huber'sM-Estimatora
Tukey'sBiweightb
Hampel'sM-Estimatorc
Andrews'Waved
The weighting constant is 1,339.a.
The weighting constant is 4,685.b.
The weighting constants are 1,700, 3,400, and 8,500c.
The weighting constant is 1,340*pi.d.

Tests of Normality
,132 36 ,116 ,961 36 ,228SERAT_1Statistic df Sig. Statistic df Sig.
Kolmogorov-Smirnova Shapiro-Wilk
Lilliefors Significance Correctiona.
Stem-and-Leaf Plots SERAT_1 Stem-and-Leaf Plot Frequency Stem & Leaf 1,00 Extremes (=<-22) 6,00 -1 . 000022 ,00 -0 . 10,00 -0 . 1111333344 15,00 0 . 001111222334444 2,00 0 . 79 2,00 1 . 13 Stem width: 10,00 Each leaf: 1 case(s)
Normal Q-Q Plots Normal Q-Q Plot of SERAT_1
Observed Value
20100-10-20-30
Expected Normal
2
1
0
-1
-2
Detrended Normal Q-Q Plots

Detrended Normal Q-Q Plot of SERAT_1
Observed Value
20100-10-20-30
Dev from Normal
,4
,2
0,0
-,2
-,4
-,6
-,8
-1,0
SERAT_1
20
10
0
-10
-20
-30
Explore
Case Processing Summary
36 50,0% 36 50,0% 72 100,0%HARD_1N Percent N Percent N Percent
Valid Missing TotalCases

Descriptives
,0023 ,00652-,0110
,0155
,0030,0016
,002,03913
-,10,08,18
,0449-,258 ,393,749 ,768
MeanLower BoundUpper Bound
95% ConfidenceInterval for Mean
5% Trimmed MeanMedianVarianceStd. DeviationMinimumMaximumRangeInterquartile RangeSkewnessKurtosis
HARD_1Statistic Std. Error
M-Estimators
,0021 ,0032 ,0030 ,0032HARD_1
Huber'sM-Estimatora
Tukey'sBiweightb
Hampel'sM-Estimatorc
Andrews'Waved
The weighting constant is 1,339.a.
The weighting constant is 4,685.b.
The weighting constants are 1,700, 3,400, and 8,500c.
The weighting constant is 1,340*pi.d.
Tests of Normality
,095 36 ,200* ,978 36 ,693HARD_1Statistic df Sig. Statistic df Sig.
Kolmogorov-Smirnova Shapiro-Wilk
This is a lower bound of the true significance.*.
Lilliefors Significance Correctiona.
Stem-and-Leaf Plots HARD_1 Stem-and-Leaf Plot Frequency Stem & Leaf 1,00 Extremes (=<-,10) 2,00 -0 . 67 1,00 -0 . 4 6,00 -0 . 222223 6,00 -0 . 000011 10,00 0 . 0000000111 4,00 0 . 2233 3,00 0 . 445 2,00 0 . 67

1,00 0 . 8 Stem width: ,10 Each leaf: 1 case(s)
Normal Q-Q Plots Normal Q-Q Plot of HARD_1
Observed Value
,10,08,06,04,020,00-,02-,04-,06-,08
Expected Normal
2
1
0
-1
-2
Detrended Normal Q-Q Plots
Detrended Normal Q-Q Plot of HARD_1
Observed Value
,10,08,06,04,020,00-,02-,04-,06-,08
Dev from Normal
,4
,3
,2
,1
-,0
-,1
-,2
-,3
HARD_1
,1
0,0
-,1
-,2

Explore Case Processing Summary
36 50,0% 36 50,0% 72 100,0%PORI_1N Percent N Percent N Percent
Valid Missing TotalCases
Descriptives
-,2993 ,07461-,4507
-,1478
-,3005-,2877
,200,44769
-,97,38
1,35,9102-,063 ,393
-1,288 ,768
MeanLower BoundUpper Bound
95% ConfidenceInterval for Mean
5% Trimmed MeanMedianVarianceStd. DeviationMinimumMaximumRangeInterquartile RangeSkewnessKurtosis
PORI_1Statistic Std. Error
M-Estimators
-,2864 -,2935 -,3016 -,2935PORI_1
Huber'sM-Estimatora
Tukey'sBiweightb
Hampel'sM-Estimatorc
Andrews'Waved
The weighting constant is 1,339.a.
The weighting constant is 4,685.b.
The weighting constants are 1,700, 3,400, and 8,500c.
The weighting constant is 1,340*pi.d.
Tests of Normality
,148 36 ,046 ,909 36 ,006PORI_1Statistic df Sig. Statistic df Sig.
Kolmogorov-Smirnova Shapiro-Wilk
Lilliefors Significance Correctiona.
Stem-and-Leaf Plots PORI_1 Stem-and-Leaf Plot Frequency Stem & Leaf 9,00 -0 . 888999999

,00 -0 . 9,00 -0 . 444444445 ,00 -0 . 9,00 -0 . 000011111 1,00 0 . 1 8,00 0 . 22222333 Stem width: 1,00 Each leaf: 1 case(s)
Normal Q-Q Plots Normal Q-Q Plot of PORI_1
Observed Value
1,0,50,0-,5-1,0-1,5
Exp
ecte
d N
orm
al
2
1
0
-1
-2
Detrended Normal Q-Q Plots
Detrended Normal Q-Q Plot of PORI_1
Observed Value
,4,20,0-,2-,4-,6-,8-1,0
Dev
from
Nor
mal
,6
,4
,2
-,0
-,2
-,4
-,6

Explore Case Processing Summary
36 100,0% 0 ,0% 36 100,0%HARD_1N Percent N Percent N Percent
Valid Missing TotalCases
Descriptives
-,0038 ,00405-,0121
,0044
-,0050-,0062
,001,02432
-,04,06,10
,0338,631 ,393,104 ,768
MeanLower BoundUpper Bound
95% ConfidenceInterval for Mean
5% Trimmed MeanMedianVarianceStd. DeviationMinimumMaximumRangeInterquartile RangeSkewnessKurtosis
HARD_1Statistic Std. Error
M-Estimators
-,0060 -,0072 -,0061 -,0073HARD_1
Huber'sM-Estimatora
Tukey'sBiweightb
Hampel'sM-Estimatorc
Andrews'Waved
The weighting constant is 1,339.a.
The weighting constant is 4,685.b.
The weighting constants are 1,700, 3,400, and 8,500c.
The weighting constant is 1,340*pi.d.
Tests of Normality
,105 36 ,200* ,956 36 ,165HARD_1Statistic df Sig. Statistic df Sig.
Kolmogorov-Smirnova Shapiro-Wilk
This is a lower bound of the true significance.*.
Lilliefors Significance Correctiona.
Stem-and-Leaf Plots HARD_1 Stem-and-Leaf Plot Frequency Stem & Leaf

1,00 -4 . 2 4,00 -3 . 0347 6,00 -2 . 035689 4,00 -1 . 0129 6,00 -0 . 555679 7,00 0 . 1567888 3,00 1 . 158 2,00 2 . 46 1,00 3 . 9 ,00 4 . 2,00 5 . 25 Stem width: ,01 Each leaf: 1 case(s)
Normal Q-Q Plots Normal Q-Q Plot of HARD_1
Observed Value
,06,04,020,00-,02-,04-,06
Expected Normal
2
1
0
-1
-2
Detrended Normal Q-Q Plots
Detrended Normal Q-Q Plot of HARD_1
Observed Value
,06,04,020,00-,02-,04-,06
Dev from Normal
,8
,6
,4
,2
0,0
-,2
-,4

HARD_1
,08
,06
,04
,02
0,00
-,02
-,04
-,06
Explore
Case Processing Summary
36 50,0% 36 50,0% 72 100,0%VOL_1N Percent N Percent N Percent
Valid Missing TotalCases
Descriptives
-79,0780 55,11942-190,9764
32,8204
-81,0238-74,8870109373,4
330,71653-736,62648,65
1385,27333,4167
,012 ,393,250 ,768
MeanLower BoundUpper Bound
95% ConfidenceInterval for Mean
5% Trimmed MeanMedianVarianceStd. DeviationMinimumMaximumRangeInterquartile RangeSkewnessKurtosis
VOL_1Statistic Std. Error
M-Estimators
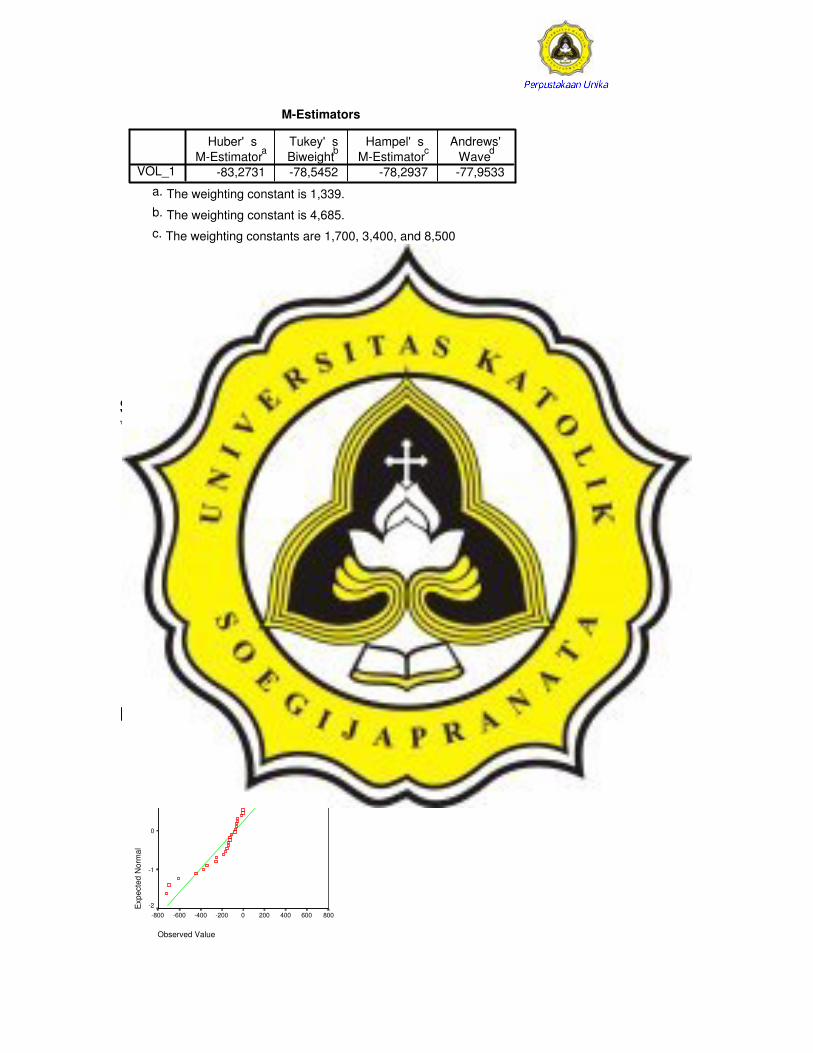
-83,2731 -78,5452 -78,2937 -77,9533VOL_1
Huber'sM-Estimatora
Tukey'sBiweightb
Hampel'sM-Estimatorc
Andrews'Waved
The weighting constant is 1,339.a.
The weighting constant is 4,685.b.
The weighting constants are 1,700, 3,400, and 8,500c.
The weighting constant is 1,340*pi.d.
Tests of Normality
,151 36 ,038 ,958 36 ,183VOL_1Statistic df Sig. Statistic df Sig.
Kolmogorov-Smirnova Shapiro-Wilk
Lilliefors Significance Correctiona.
Stem-and-Leaf Plots VOL_1 Stem-and-Leaf Plot Frequency Stem & Leaf 3,00 Extremes (=<-699) 1,00 -0 . 6 1,00 -0 . 4 4,00 -0 . 2233 17,00 -0 . 00000000011111111 3,00 0 . 011 4,00 0 . 2233 1,00 0 . 4 2,00 Extremes (>=552) Stem width: 1000,00 Each leaf: 1 case(s)
Normal Q-Q Plots Normal Q-Q Plot of VOL_1
Observed Value
8006004002000-200-400-600-800
Exp
ecte
d N
orm
al
2
1
0
-1
-2
Detrended Normal Q-Q Plots Detrended Normal Q-Q Plot of VOL_1
Observed Value
8006004002000-200-400-600-800
Dev
from
Nor
mal
,4
,2
-,0
-,2
-,4
-,6
36N =
VOL_1
800
600
400
200
0
-200
-400
-600
-800
-1000
1665
13
8
Explore
Case Processing Summary
36 50,0% 36 50,0% 72 100,0%KDRAIR_1N Percent N Percent N Percent
Valid Missing TotalCases

Descriptives
-3,5977 4,24817-12,2220
5,0265
-3,8731-5,1076649,689
25,48900-45,1043,8288,91
42,4331,153 ,393
-,892 ,768
MeanLower BoundUpper Bound
95% ConfidenceInterval for Mean
5% Trimmed MeanMedianVarianceStd. DeviationMinimumMaximumRangeInterquartile RangeSkewnessKurtosis
KDRAIR_1Statistic Std. Error
M-Estimators
-4,4527 -4,2346 -4,2579 -4,2283KDRAIR_1
Huber'sM-Estimatora
Tukey'sBiweightb
Hampel'sM-Estimatorc
Andrews'Waved
The weighting constant is 1,339.a.
The weighting constant is 4,685.b.
The weighting constants are 1,700, 3,400, and 8,500c.
The weighting constant is 1,340*pi.d.
Tests of Normality
,081 36 ,200* ,966 36 ,316KDRAIR_1Statistic df Sig. Statistic df Sig.
Kolmogorov-Smirnova Shapiro-Wilk
This is a lower bound of the true significance.*.
Lilliefors Significance Correctiona.
Stem-and-Leaf Plots KDRAIR_1 Stem-and-Leaf Plot Frequency Stem & Leaf 3,00 -4 . 345 4,00 -3 . 1127 3,00 -2 . 556 6,00 -1 . 034778 3,00 -0 . 458 6,00 0 . 015688 5,00 1 . 07777 2,00 2 . 17 2,00 3 . 79
2,00 4 . 03 Stem width: 10,00 Each leaf: 1 case(s)
Normal Q-Q Plots Normal Q-Q Plot of KDRAIR_1
Observed Value
6040200-20-40-60
Expected Normal
2
1
0
-1
-2
Detrended Normal Q-Q Plots
Detrended Normal Q-Q Plot of KDRAIR_1
Observed Value
6040200-20-40-60
Dev from Normal
,4
,3
,2
,1
-,0
-,1
-,2
-,3
KDRAIR_1
60
40
20
0
-20
-40
-60

Correlations Correlations
1 -,974** -,973** ,923** -,846** -,789**. ,000 ,000 ,000 ,000 ,000
36 36 36 36 36 36-,974** 1 ,980** -,954** ,895** ,829**,000 . ,000 ,000 ,000 ,000
36 36 36 36 36 36-,973** ,980** 1 -,952** ,899** ,825**,000 ,000 . ,000 ,000 ,000
36 36 36 36 36 36,923** -,954** -,952** 1 -,937** -,906**,000 ,000 ,000 . ,000 ,000
36 36 36 36 36 36-,846** ,895** ,899** -,937** 1 ,901**,000 ,000 ,000 ,000 . ,000
36 36 36 36 36 36-,789** ,829** ,825** -,906** ,901** 1,000 ,000 ,000 ,000 ,000 .
36 36 36 36 36 36,952** -,969** -,971** ,955** -,935** -,867**,000 ,000 ,000 ,000 ,000 ,000
36 36 36 36 36 36-,957** ,980** ,979** -,973** ,943** ,891**,000 ,000 ,000 ,000 ,000 ,000
36 36 36 36 36 36.a .a .a .a .a .a
. . . . . .36 36 36 36 36 36
Pearson CorrelationSig. (2-tailed)NPearson CorrelationSig. (2-tailed)NPearson CorrelationSig. (2-tailed)NPearson CorrelationSig. (2-tailed)NPearson CorrelationSig. (2-tailed)NPearson CorrelationSig. (2-tailed)NPearson CorrelationSig. (2-tailed)NPearson CorrelationSig. (2-tailed)NPearson CorrelationSig. (2-tailed)N
VOL_PENG
POROSITA
HARDNESS
LEMAK
KDR_AIR
SERAT_KS
PROTEIN
KONSENTR
PERLAKUA
VOL_PENG POROSITA HARDNESS LEMAK KDR_AIR SERAT_KS
Correlation is significant at the 0.01 level (2-tailed).**.
Cannot be computed because at least one of the variables is constant.a.
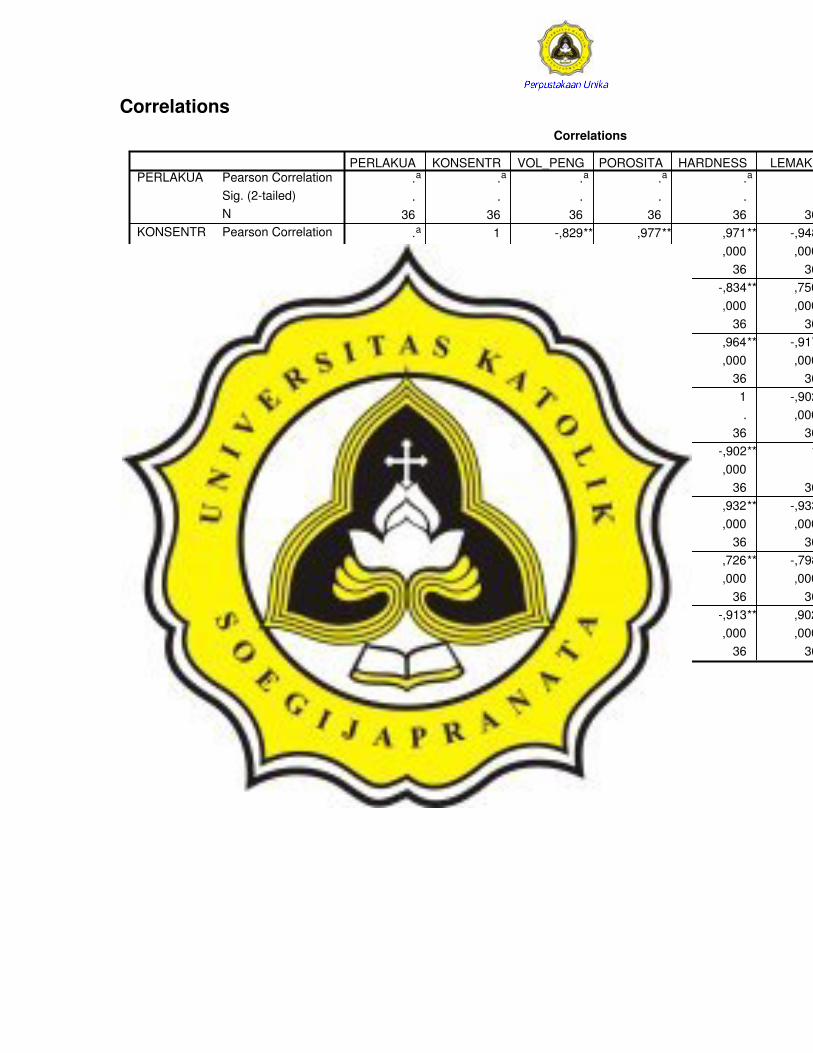
Correlations Correlations
.a .a .a .a .a .
. . . . . .36 36 36 36 36 36
.a 1 -,829** ,977** ,971** -,948
. . ,000 ,000 ,000 ,00036 36 36 36 36 36
.a -,829** 1 -,900** -,834** ,750
. ,000 . ,000 ,000 ,00036 36 36 36 36 36
.a ,977** -,900** 1 ,964** -,917
. ,000 ,000 . ,000 ,00036 36 36 36 36 36
.a ,971** -,834** ,964** 1 -,902
. ,000 ,000 ,000 . ,00036 36 36 36 36 36
.a -,948** ,750** -,917** -,902** 1
. ,000 ,000 ,000 ,000 .36 36 36 36 36 36
.a ,960** -,799** ,922** ,932** -,933
. ,000 ,000 ,000 ,000 ,00036 36 36 36 36 36
.a ,812** -,493** ,747** ,726** -,798
. ,000 ,002 ,000 ,000 ,00036 36 36 36 36 36
.a -,965** ,737** -,922** -,913** ,902
. ,000 ,000 ,000 ,000 ,00036 36 36 36 36 36
Pearson CorrelationSig. (2-tailed)NPearson CorrelationSig. (2-tailed)NPearson CorrelationSig. (2-tailed)NPearson CorrelationSig. (2-tailed)NPearson CorrelationSig. (2-tailed)NPearson CorrelationSig. (2-tailed)NPearson CorrelationSig. (2-tailed)NPearson CorrelationSig. (2-tailed)NPearson CorrelationSig. (2-tailed)N
PERLAKUA
KONSENTR
VOL_PENG
POROSITA
HARDNESS
LEMAK
KDR_AIR
SERAT_KS
PROTEIN
PERLAKUA KONSENTR VOL_PENG POROSITA HARDNESS LEMAK
Correlation is significant at the 0.01 level (2-tailed).**.
Cannot be computed because at least one of the variables is constant.a.

Crosstabs Case Processing Summary
160 100,0% 0 ,0% 160 100,0%RASA * PERLAKUAN Percent N Percent N Percent
Valid Missing TotalCases
Chi-Square Tests
153,569a 28 ,000 ,000b ,000 ,000156,010 28 ,000 ,000b ,000 ,000122,739 ,000b ,000 ,000
43,243c
1 ,000 ,000b
,000 ,000 ,000b
160
Pearson Chi-SquareLikelihood RatioFisher's Exact TestLinear-by-LinearAssociationN of Valid Cases
Value dfAsymp. Sig.
(2-sided) Sig. Lower Bound Upper Bound99% Confidence Interval
Monte Carlo Sig. (2-sided)
Sig.
Monte Carlo Sig. (1-sided)
32 cells (80,0%) have expected count less than 5. The minimum expected count is ,50.a.
Based on 10000 sampled tables with starting seed 2000000.b.
The standardized statistic is -6,576.c.
Symmetric Measures
-,522 ,056 -7,683 ,000c ,000d ,000-,521 ,064 -7,675 ,000c ,000d ,000
160
Pearson's RInterval by IntervalSpearman CorrelationOrdinal by Ordinal
N of Valid Cases
ValueAsymp.
Std. Errora Approx. Tb Approx. Sig. Sig. Lower Bound99% Confidence Interval
Monte Carlo Sig.
Not assuming the null hypothesis.a.
Using the asymptotic standard error assuming the null hypothesis.b.
Based on normal approximation.c.
Based on 10000 sampled tables with starting seed 2000000.d.
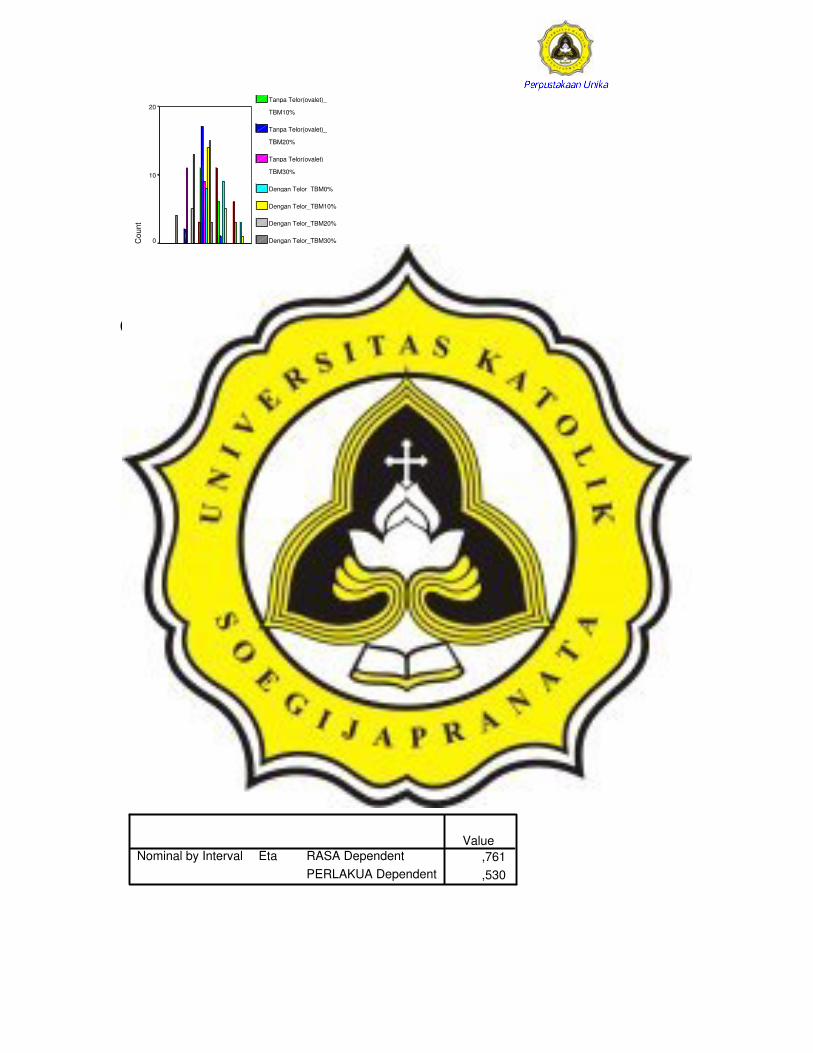
RASA
sangat suka sekali (
sangat suka (ss)
suka (s)
tidak suka (ts)
sangat tidak suka (s
Cou
nt
20
10
0
Tanpa Telor(ovalet)_
TBM10%
Tanpa Telor(ovalet)_
TBM20%
Tanpa Telor(ovalet)_
TBM30%
Dengan Telor_TBM0%
Dengan Telor_TBM10%
Dengan Telor_TBM20%
Dengan Telor_TBM30%
Crosstabs
Warnings
The Tests for Homogeneity of the Odds Ratio table and the Mantel-HaenszelCommon Odds Ratio Estimate table are not computed for RASA * PERLAKUA,because either (1) the group variable does not have exactly two distinct non-missingvalues or/and (2) the response variable does not have exactly two distinctnon-missing values.
Case Processing Summary
160 100,0% 0 ,0% 160 100,0%RASA * PERLAKUAN Percent N Percent N Percent
Valid Missing TotalCases
Chi-Square Tests
153,569a 28 ,000156,010 28 ,000
43,243 1 ,000
160
Pearson Chi-SquareLikelihood RatioLinear-by-LinearAssociationN of Valid Cases
Value dfAsymp. Sig.
(2-sided)
32 cells (80,0%) have expected count less than 5. Theminimum expected count is ,50.
a.
Directional Measures
,761,530
RASA DependentPERLAKUA Dependent
EtaNominal by IntervalValue

Symmetric Measures
-,442 ,055 -7,649 ,000-,521 ,064 -7,675 ,000c
-,522 ,056 -7,683 ,000c
160
Kendall's tau-bSpearman Correlation
Ordinal byOrdinal
Pearson's RInterval by IntervalN of Valid Cases
ValueAsymp.
Std. Errora Approx. Tb Approx. Sig.
Not assuming the null hypothesis.a.
Using the asymptotic standard error assuming the null hypothesis.b.
Based on normal approximation.c.
RASA
sangat suka sekali (
sangat suka (ss)
suka (s)
tidak suka (ts)
sangat tidak suka (s
Cou
nt
20
10
0
Tanpa Telor(ovalet)_
TBM10%
Tanpa Telor(ovalet)_
TBM20%
Tanpa Telor(ovalet)_
TBM30%
Dengan Telor_TBM0%
Dengan Telor_TBM10%
Dengan Telor_TBM20%
Dengan Telor_TBM30%
Crosstabs
Warnings
The Tests for Homogeneity of the Odds Ratio table and the Mantel-HaenszelCommon Odds Ratio Estimate table are not computed for AROMA * PERLAKUA,because either (1) the group variable does not have exactly two distinct non-missingvalues or/and (2) the response variable does not have exactly two distinctnon-missing values.
Case Processing Summary
160 100,0% 0 ,0% 160 100,0%AROMA * PERLAKUAN Percent N Percent N Percent
Valid Missing TotalCases

Chi-Square Tests
161,555a 28 ,000172,711 28 ,000
27,240 1 ,000
.b
160
Pearson Chi-SquareLikelihood RatioLinear-by-LinearAssociationMcNemar TestN of Valid Cases
Value dfAsymp. Sig.
(2-sided)Exact Sig.(2-sided)
24 cells (60,0%) have expected count less than 5. The minimumexpected count is ,63.
a.
Computed only for a PxP table, where P must be greater than 1.b.
Directional Measures
,753,435
AROMA DependentPERLAKUA Dependent
EtaNominal by IntervalValue
Symmetric Measures
-,349 ,057 -5,869 ,000-,410 ,070 -5,657 ,000c
-,414 ,060 -5,715 ,000c
.d
160
Kendall's tau-bSpearman Correlation
Ordinal by Ordinal
Pearson's RInterval by IntervalKappaMeasure of Agreement
N of Valid Cases
ValueAsymp.
Std. Errora Approx. Tb Approx. Sig.
Not assuming the null hypothesis.a.
Using the asymptotic standard error assuming the null hypothesis.b.
Based on normal approximation.c.
Kappa statistics cannot be computed.They require a symmetric 2-way table in which the valuesof the first variable match the values of the second variable.
d.
Risk Estimate
aOdds Ratio for AROMA(sangat tidak suka(sts) / tidak suka (ts))
Value
Risk Estimate statistics cannot be computed. Theyare only computed for a 2*2 table without empty cells.
a.

AROMA
sangat suka sekali (
sangat suka (ss)
suka (s)
tidak suka (ts)
sangat tidak suka (s
Cou
nt
20
10
0
Tanpa Telor(ovalet)_
TBM10%
Tanpa Telor(ovalet)_
TBM20%
Tanpa Telor(ovalet)_
TBM30%
Dengan Telor_TBM0%
Dengan Telor_TBM10%
Dengan Telor_TBM20%
Dengan Telor_TBM30%
Crosstabs
Warnings
The Tests for Homogeneity of the Odds Ratio table and the Mantel-HaenszelCommon Odds Ratio Estimate table are not computed for WARNA * PERLAKUA,because either (1) the group variable does not have exactly two distinct non-missingvalues or/and (2) the response variable does not have exactly two distinctnon-missing values.
Case Processing Summary
160 100,0% 0 ,0% 160 100,0%WARNA * PERLAKUAN Percent N Percent N Percent
Valid Missing TotalCases
Chi-Square Tests
106,566a 28 ,000114,902 28 ,000
8,833 1 ,003
.b
160
Pearson Chi-SquareLikelihood RatioLinear-by-LinearAssociationMcNemar TestN of Valid Cases
Value dfAsymp. Sig.
(2-sided)Exact Sig.(2-sided)
24 cells (60,0%) have expected count less than 5. The minimumexpected count is ,38.
a.
Computed only for a PxP table, where P must be greater than 1.b.
Directional Measures
,724,268
WARNA DependentPERLAKUA Dependent
EtaNominal by IntervalValue
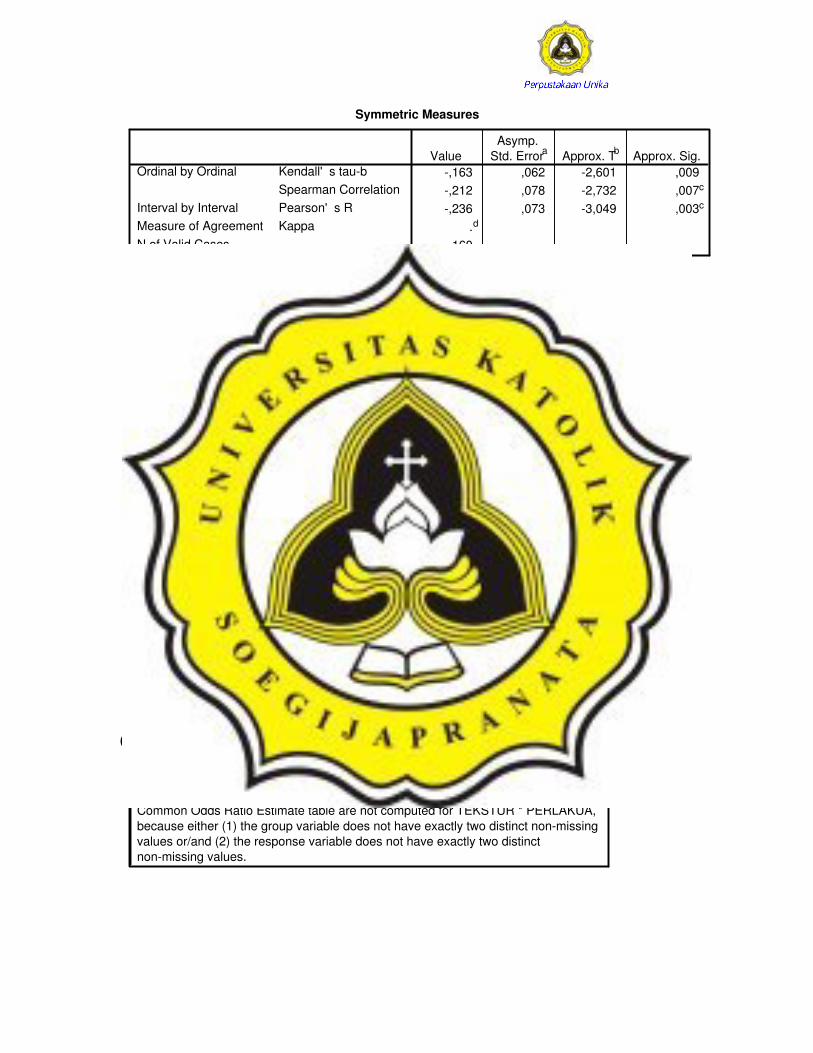
Symmetric Measures
-,163 ,062 -2,601 ,009-,212 ,078 -2,732 ,007c
-,236 ,073 -3,049 ,003c
.d
160
Kendall's tau-bSpearman Correlation
Ordinal by Ordinal
Pearson's RInterval by IntervalKappaMeasure of Agreement
N of Valid Cases
ValueAsymp.
Std. Errora Approx. Tb Approx. Sig.
Not assuming the null hypothesis.a.
Using the asymptotic standard error assuming the null hypothesis.b.
Based on normal approximation.c.
Kappa statistics cannot be computed.They require a symmetric 2-way table in which the valuesof the first variable match the values of the second variable.
d.
Risk Estimate
aOdds Ratio for WARNA(sangat tidak suka(sts) / tidak suka (ts))
Value
Risk Estimate statistics cannot be computed. Theyare only computed for a 2*2 table without empty cells.
a.
WARNA
sangat suka sekali (
sangat suka (ss)
suka (s)
tidak suka (ts)
sangat tidak suka (s
Cou
nt
16
14
12
10
8
6
4
2
0
Tanpa Telor(ovalet)_
TBM10%
Tanpa Telor(ovalet)_
TBM20%
Tanpa Telor(ovalet)_
TBM30%
Dengan Telor_TBM0%
Dengan Telor_TBM10%
Dengan Telor_TBM20%
Dengan Telor_TBM30%
Crosstabs
Warnings
The Tests for Homogeneity of the Odds Ratio table and the Mantel-HaenszelCommon Odds Ratio Estimate table are not computed for TEKSTUR * PERLAKUA,because either (1) the group variable does not have exactly two distinct non-missingvalues or/and (2) the response variable does not have exactly two distinctnon-missing values.

Case Processing Summary
160 100,0% 0 ,0% 160 100,0%TEKSTUR * PERLAKUAN Percent N Percent N Percent
Valid Missing TotalCases
Chi-Square Tests
199,568a 28 ,000192,783 28 ,000
24,027 1 ,000
.b
160
Pearson Chi-SquareLikelihood RatioLinear-by-LinearAssociationMcNemar TestN of Valid Cases
Value dfAsymp. Sig.
(2-sided)Exact Sig.(2-sided)
32 cells (80,0%) have expected count less than 5. The minimumexpected count is 1,13.
a.
Computed only for a PxP table, where P must be greater than 1.b.
Directional Measures
,804,406
TEKSTUR DependentPERLAKUA Dependent
EtaNominal by IntervalValue
Symmetric Measures
-,322 ,057 -5,526 ,000-,374 ,072 -5,070 ,000c
-,389 ,063 -5,303 ,000c
.d
160
Kendall's tau-bSpearman Correlation
Ordinal by Ordinal
Pearson's RInterval by IntervalKappaMeasure of Agreement
N of Valid Cases
ValueAsymp.
Std. Errora Approx. Tb Approx. Sig.
Not assuming the null hypothesis.a.
Using the asymptotic standard error assuming the null hypothesis.b.
Based on normal approximation.c.
Kappa statistics cannot be computed.They require a symmetric 2-way table in which the valuesof the first variable match the values of the second variable.
d.

Risk Estimate
aOdds Ratio for TEKSTUR(sangat tidak suka (sts) /tidak suka (ts))
Value
Risk Estimate statistics cannot be computed. Theyare only computed for a 2*2 table without empty cells.
a.
TEKSTUR
sangat suka sekali (
sangat suka (ss)
suka (s)
tidak suka (ts)
sangat tidak suka (s
Cou
nt
20
10
0
Tanpa Telor(ovalet)_
TBM10%
Tanpa Telor(ovalet)_
TBM20%
Tanpa Telor(ovalet)_
TBM30%
Dengan Telor_TBM0%
Dengan Telor_TBM10%
Dengan Telor_TBM20%
Dengan Telor_TBM30%
Descriptives
Descriptive Statistics
36 240,1526 420,1750 13075,89 363,2193 67,639839536 ,5348 1,8289 38,9264 1,081290 ,453950636 ,0100 ,0380 ,8198 ,022772 ,009653836 7,2676 9,9474 300,4182 8,344949 ,784579336 25,9115 31,9562 1042,3569 28,954358 1,840951336 5,2046 9,3466 282,8392 7,856645 1,144290736 4,2848 8,4173 224,5896 6,238599 1,182684236
VOL_PENGPOROSITAHARDNESSLEMAKKDR_AIRSERAT_KSPROTEINValid N (listwise)
N Minimum Maximum Sum Mean Std. Deviation
Descriptives
Descriptive Statistics
36 179,9595 418,5253 11393,24 316,4789 89,662958536 ,3796 1,4681 29,3395 ,814986 ,352193236 ,0210 ,0480 1,2073 ,033535 ,008995336 9,8539 13,9524 429,6869 11,935748 1,218486736 20,7608 26,2709 868,4222 24,122838 1,572802736 5,2908 9,5605 275,4869 7,652415 1,332310236 5,5907 9,8233 277,6282 7,711894 1,374246136
VOL_PENGPOROSITAHARDNESSLEMAKKDR_AIRSERAT_KSPROTEINValid N (listwise)
N Minimum Maximum Sum Mean Std. Deviation

Explore Case Processing Summary
36 100,0% 0 ,0% 36 100,0%PORI_1N Percent N Percent N Percent
Valid Missing TotalCases
Descriptives
,0849 ,22734-,3766
,5464
,1192,04421,861
1,36405-3,723,016,73
1,5211-,331 ,3931,056 ,768
MeanLower BoundUpper Bound
95% ConfidenceInterval for Mean
5% Trimmed MeanMedianVarianceStd. DeviationMinimumMaximumRangeInterquartile RangeSkewnessKurtosis
PORI_1Statistic Std. Error
M-Estimators
,0897 ,1264 ,1121 ,1261PORI_1
Huber'sM-Estimatora
Tukey'sBiweightb
Hampel'sM-Estimatorc
Andrews'Waved
The weighting constant is 1,339.a.
The weighting constant is 4,685.b.
The weighting constants are 1,700, 3,400, and 8,500c.
The weighting constant is 1,340*pi.d.
Tests of Normality
,111 36 ,200* ,974 36 ,530PORI_1Statistic df Sig. Statistic df Sig.
Kolmogorov-Smirnova Shapiro-Wilk
This is a lower bound of the true significance.*.
Lilliefors Significance Correctiona.
Stem-and-Leaf Plots PORI_1 Stem-and-Leaf Plot Frequency Stem & Leaf

1,00 Extremes (=<-3,7) 2,00 -2 . 15 2,00 -1 . 03 12,00 -0 . 111334566778 12,00 0 . 000234678889 4,00 1 . 0279 2,00 2 . 24 1,00 3 . 0 Stem width: 1,00 Each leaf: 1 case(s)
Normal Q-Q Plots Normal Q-Q Plot of PORI_1
Observed Value
43210-1-2-3-4
Expected Normal
2
1
0
-1
-2
Detrended Normal Q-Q Plots
Detrended Normal Q-Q Plot of PORI_1
Observed Value
43210-1-2-3-4
Dev from Normal
,4
,2
0,0
-,2
-,4
-,6
-,8
-1,0

PORI_1
4
2
0
-2
-4
-6
NPar Tests
Descriptive Statistics
36 363,2193 67,6398395 240,1526 420,1750 295,0028 400,598900 407,252636 1,081290 ,4539506 ,5348 1,8289 ,630084 ,963833 1,578602
VOL_PENGPOROSITA
N Mean Std. Deviation Minimum Maximum 25th 50th (Median) 75thPercentiles
Kruskal-Wallis Test
Ranks
18 9,5018a
POROSITA1,0000Total
VOL_PENGN Mean Rank
There is only one non-empty group.Kruskal-Wallis Test cannot be performed.
a.
NPar Tests
Descriptive Statistics
36 363,2193 67,6398395 240,1526 420,1750 295,0028 400,598900 407,252636 1,081290 ,4539506 ,5348 1,8289 ,630084 ,963833 1,578602
VOL_PENGPOROSITA
N Mean Std. Deviation Minimum Maximum 25th 50th (Median) 75thPercentiles
Kruskal-Wallis Test
Ranks
18 9,5018a
POROSITA1,0000Total
VOL_PENGN Mean Rank
There is only one non-empty group.Kruskal-Wallis Test cannot be performed.
a.
NPar Tests
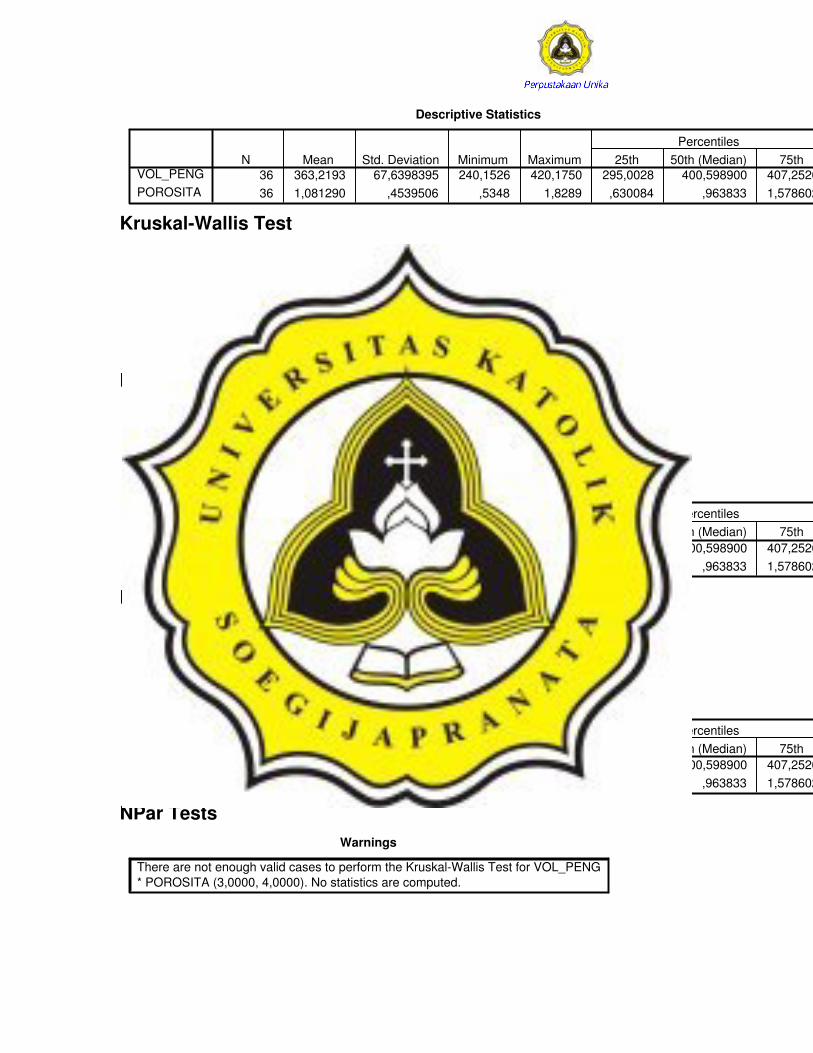
Descriptive Statistics
36 363,2193 67,6398395 240,1526 420,1750 295,0028 400,598900 407,252636 1,081290 ,4539506 ,5348 1,8289 ,630084 ,963833 1,578602
VOL_PENGPOROSITA
N Mean Std. Deviation Minimum Maximum 25th 50th (Median) 75thPercentiles
Kruskal-Wallis Test
Ranks
18 9,5018a
POROSITA1,0000Total
VOL_PENGN Mean Rank
There is only one non-empty group.Kruskal-Wallis Test cannot be performed.
a.
NPar Tests
Warnings
There are not enough valid cases to perform the Kruskal-Wallis Test for VOL_PENG* POROSITA (2,0000, 3,0000). No statistics are computed.
Descriptive Statistics
36 363,2193 67,6398395 240,1526 420,1750 295,0028 400,598900 407,252636 1,081290 ,4539506 ,5348 1,8289 ,630084 ,963833 1,578602
VOL_PENGPOROSITA
N Mean Std. Deviation Minimum Maximum 25th 50th (Median) 75thPercentiles
NPar Tests
Warnings
There are not enough valid cases to perform the Kruskal-Wallis Test for VOL_PENG* POROSITA (2,0000, 4,0000). No statistics are computed.
Descriptive Statistics
36 363,2193 67,6398395 240,1526 420,1750 295,0028 400,598900 407,252636 1,081290 ,4539506 ,5348 1,8289 ,630084 ,963833 1,578602
VOL_PENGPOROSITA
N Mean Std. Deviation Minimum Maximum 25th 50th (Median) 75thPercentiles
NPar Tests
Warnings
There are not enough valid cases to perform the Kruskal-Wallis Test for VOL_PENG* POROSITA (3,0000, 4,0000). No statistics are computed.

Descriptive Statistics
36 363,2193 67,6398395 240,1526 420,1750 295,0028 400,598900 407,252636 1,081290 ,4539506 ,5348 1,8289 ,630084 ,963833 1,578602
VOL_PENGPOROSITA
N Mean Std. Deviation Minimum Maximum 25th 50th (Median) 75thPercentiles
Explore
Case Processing Summary
36 100,0% 0 ,0% 36 100,0%SERAT_1N Percent N Percent N Percent
Valid Missing TotalCases
Descriptives
-,9488 1,21185-3,4090
1,5113
-,7555,2210
52,8697,27110
-21,6013,0834,67
7,6915-,625 ,393,761 ,768
MeanLower BoundUpper Bound
95% ConfidenceInterval for Mean
5% Trimmed MeanMedianVarianceStd. DeviationMinimumMaximumRangeInterquartile RangeSkewnessKurtosis
SERAT_1Statistic Std. Error
M-Estimators
-,1395 ,1349 -,2045 ,1299SERAT_1
Huber'sM-Estimatora
Tukey'sBiweightb
Hampel'sM-Estimatorc
Andrews'Waved
The weighting constant is 1,339.a.
The weighting constant is 4,685.b.
The weighting constants are 1,700, 3,400, and 8,500c.
The weighting constant is 1,340*pi.d.

Tests of Normality
,132 36 ,116 ,961 36 ,228SERAT_1Statistic df Sig. Statistic df Sig.
Kolmogorov-Smirnova Shapiro-Wilk
Lilliefors Significance Correctiona.
Stem-and-Leaf Plots SERAT_1 Stem-and-Leaf Plot Frequency Stem & Leaf 1,00 Extremes (=<-22) 6,00 -1 . 000022 ,00 -0 . 10,00 -0 . 1111333344 15,00 0 . 001111222334444 2,00 0 . 79 2,00 1 . 13 Stem width: 10,00 Each leaf: 1 case(s)
Normal Q-Q Plots Normal Q-Q Plot of SERAT_1
Observed Value
20100-10-20-30
Expected Normal
2
1
0
-1
-2
Detrended Normal Q-Q Plots

Detrended Normal Q-Q Plot of SERAT_1
Observed Value
20100-10-20-30
Dev from Normal
,4
,2
0,0
-,2
-,4
-,6
-,8
-1,0
SERAT_1
20
10
0
-10
-20
-30
Explore
Case Processing Summary
36 50,0% 36 50,0% 72 100,0%HARD_1N Percent N Percent N Percent
Valid Missing TotalCases

Descriptives
,0023 ,00652-,0110
,0155
,0030,0016
,002,03913
-,10,08,18
,0449-,258 ,393,749 ,768
MeanLower BoundUpper Bound
95% ConfidenceInterval for Mean
5% Trimmed MeanMedianVarianceStd. DeviationMinimumMaximumRangeInterquartile RangeSkewnessKurtosis
HARD_1Statistic Std. Error
M-Estimators
,0021 ,0032 ,0030 ,0032HARD_1
Huber'sM-Estimatora
Tukey'sBiweightb
Hampel'sM-Estimatorc
Andrews'Waved
The weighting constant is 1,339.a.
The weighting constant is 4,685.b.
The weighting constants are 1,700, 3,400, and 8,500c.
The weighting constant is 1,340*pi.d.
Tests of Normality
,095 36 ,200* ,978 36 ,693HARD_1Statistic df Sig. Statistic df Sig.
Kolmogorov-Smirnova Shapiro-Wilk
This is a lower bound of the true significance.*.
Lilliefors Significance Correctiona.
Stem-and-Leaf Plots HARD_1 Stem-and-Leaf Plot Frequency Stem & Leaf 1,00 Extremes (=<-,10) 2,00 -0 . 67 1,00 -0 . 4 6,00 -0 . 222223 6,00 -0 . 000011 10,00 0 . 0000000111 4,00 0 . 2233 3,00 0 . 445 2,00 0 . 67
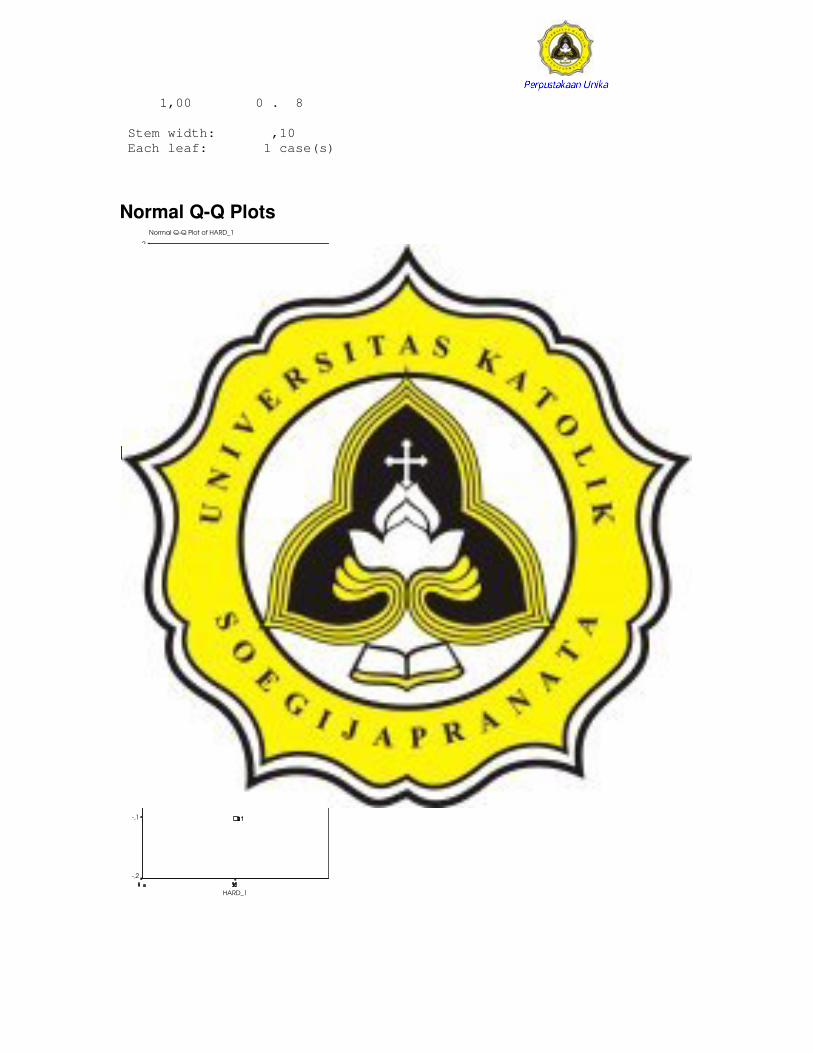
1,00 0 . 8 Stem width: ,10 Each leaf: 1 case(s)
Normal Q-Q Plots Normal Q-Q Plot of HARD_1
Observed Value
,10,08,06,04,020,00-,02-,04-,06-,08
Expected Normal
2
1
0
-1
-2
Detrended Normal Q-Q Plots
Detrended Normal Q-Q Plot of HARD_1
Observed Value
,10,08,06,04,020,00-,02-,04-,06-,08
Dev from Normal
,4
,3
,2
,1
-,0
-,1
-,2
-,3
HARD_1
,1
0,0
-,1
-,2
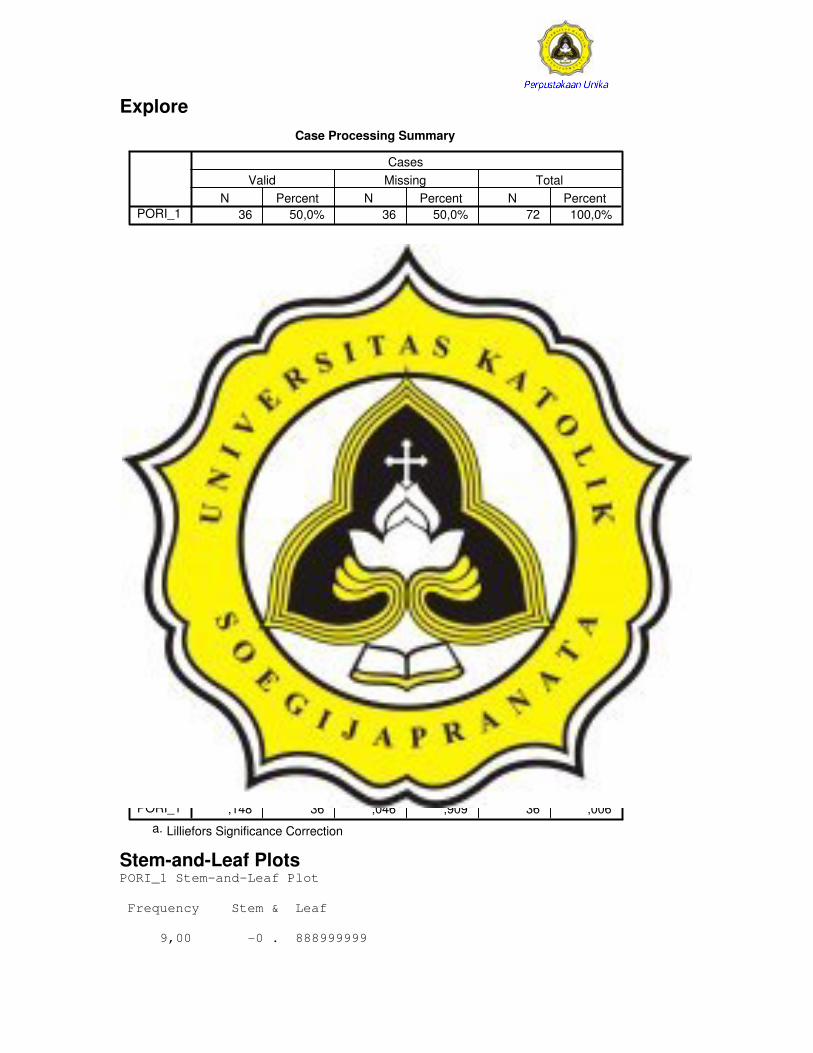
Explore Case Processing Summary
36 50,0% 36 50,0% 72 100,0%PORI_1N Percent N Percent N Percent
Valid Missing TotalCases
Descriptives
-,2993 ,07461-,4507
-,1478
-,3005-,2877
,200,44769
-,97,38
1,35,9102-,063 ,393
-1,288 ,768
MeanLower BoundUpper Bound
95% ConfidenceInterval for Mean
5% Trimmed MeanMedianVarianceStd. DeviationMinimumMaximumRangeInterquartile RangeSkewnessKurtosis
PORI_1Statistic Std. Error
M-Estimators
-,2864 -,2935 -,3016 -,2935PORI_1
Huber'sM-Estimatora
Tukey'sBiweightb
Hampel'sM-Estimatorc
Andrews'Waved
The weighting constant is 1,339.a.
The weighting constant is 4,685.b.
The weighting constants are 1,700, 3,400, and 8,500c.
The weighting constant is 1,340*pi.d.
Tests of Normality
,148 36 ,046 ,909 36 ,006PORI_1Statistic df Sig. Statistic df Sig.
Kolmogorov-Smirnova Shapiro-Wilk
Lilliefors Significance Correctiona.
Stem-and-Leaf Plots PORI_1 Stem-and-Leaf Plot Frequency Stem & Leaf 9,00 -0 . 888999999

,00 -0 . 9,00 -0 . 444444445 ,00 -0 . 9,00 -0 . 000011111 1,00 0 . 1 8,00 0 . 22222333 Stem width: 1,00 Each leaf: 1 case(s)
Normal Q-Q Plots Normal Q-Q Plot of PORI_1
Observed Value
1,0,50,0-,5-1,0-1,5
Exp
ecte
d N
orm
al
2
1
0
-1
-2
Detrended Normal Q-Q Plots
Detrended Normal Q-Q Plot of PORI_1
Observed Value
,4,20,0-,2-,4-,6-,8-1,0
Dev
from
Nor
mal
,6
,4
,2
-,0
-,2
-,4
-,6