Variant selection of Allotriomorphic Ferrite in Steels
193
Thesis for Doctor of Philosophy Variant selection of Allotriomorphic Ferrite in Steels Kim, Dae Woo (金 旲 優) Computational Metallurgy Graduate Institute of Ferrous Technology Pohang University of Science and Technology 2011
Transcript of Variant selection of Allotriomorphic Ferrite in Steels
Thesis for Doctor of Philosophy
Variant selection of Allotriomorphic Ferrite in Steels
Kim, Dae Woo (金 旲 優)
Computational Metallurgy
Graduate Institute of Ferrous Technology
Pohang University of Science and Technology
2011

Variant selection of Allotriom
orphic Ferrite in Steels 2011 K
im, D
ae Woo

철계 다상 페라이트의 결정방위 선택 Variant selection of Allotriomorphic
Ferrite in Steels

Variant selection of Allotriomorphic Ferrite in Steels
by
Kim, Dae Woo
Department of Ferrous Technology (Computational Metallurgy)
Graduate Institute of Ferrous Technology Pohang University of Science and Technology
A thesis submitted to the faculty of Pohang University of
Science and Technology in partial fulfillments of the requirements for the degree of Doctor of Philosophy in the Graduate Institute of Ferrous Technology (Computational Metallurgy)
Pohang, Korea
December 3th, 2010
Approved by Prof. Bhadeshia, H.K.D.H. Prof. Suh, Dong-Woo
Major Advisor Co-advisor

Variant selection of Allotriomorphic Ferrite in Steels
Kim, Dae Woo This dissertation is submitted for the degree of Doctor of Philosophy at
the Graduate Institute of Ferrous Technology of Pohang University of
Science and Technology. The research reported herein was approved
by the committee of Thesis Appraisal
December 3th, 2010
Thesis Review Committee Chairman: Prof. Bhadeshia, H.K.D.H
(Signature)
Member: Prof. Suh, Dong-Woo
(Signature)
Member: Prof. Lee, Hu-Chul
(Signature)
Member: Prof. Lee, Jae-Sang
(Signature)
Member: Dr. Um, Kyung-Keun
(Signature)

i
Preface
This dissertation is submitted for the degree of Doctor of Philosophy at Pohang
University of Science and Technology. The research described herein was carried
out under the supervision of Professor H. K. D. H. Bhadeshia, Professor of
Computational Metallurgy in the Graduate Institute of Ferrous Technology, Pohang
University of Science and Technology and Professor of Physical Metallurgy,
University of Cambridge, between March 2007 and February 2011.
This work is to the best of my knowledge original, except where suitable references
are made to previous work. Neither this, nor any substantially similar dissertation
has been or is being submitted for any degree, diploma or other qualification at any
other university or institution. This dissertation does not exceed 60,000 words in
length.
The research has been published as follows:
Kim, D.W., R.S. Qin, and H.K.D.H. Bhadeshia, Transformation texture of allotriomorphic ferrite. Jamshedpur India, 2008 Microstructure and Texture in Steels, 2008
Kim, D.W., R.S. Qin, and H.K.D.H. Bhadeshia, Transformation texture of allotriomorphic ferrite in steel. Materials Science and Technology, 2009. 25(7): p. 892-895. Kim, D.W., Suh, D.W and H.K.D.H. Bhadeshia, Dual orientation and variant selection during diffusional transformation of austenite to allotriomorphic ferrite. Journal of Materials Science, 2010. 45(15): p. 4126-4132.
Kim, D.W., Suh, D.W and H.K.D.H. Bhadeshia, Plastic strain and variant selection
during diffusional transformation. Houston USA, 2010 Materials Science and
Technology Conference, 2010

ii
Kim, D.W., Suh, D.W and H.K.D.H. Bhadeshia, Plastic strain and variant selection
during diffusional transformation in steels. to be submitted.
Kim, D.W., Ryu, J.H, Suh, D.W and H.K.D.H. Bhadeshia, Texture prediction by
artificial neural netwrok approach. to be submitted.
iii
MFT 20081010
Kim, Dae Woo Variant selection of Allotriomorphic Ferrite in Steels, Department of Ferrous Technology (Computational Metallurgy) 2010 Advisor: Bhadeshia, H. K. D. H.; Prof. Suh, Dong-Woo Text in English
Abstract
The orientation of crystals of allotriomorphic ferrite in austenite has been
investigated in order to understand the mechanism by which particular relationships
are favoured over others via a process known as “variant selection”. This kind of
selection in the context of diffusional transformations contrasts with displacive
products where the interaction of transformation plasticity with an external field is
the dominant selection criterion. With diffusional reactions the local environment of
the growing crystal controls its crystallography. Variables such as the location of
the nucleation site, the number and orientation of parent grains with which the site
is in contact, interfacial velocity and impingement effects have been identified here
to play a systematic role in variant selection.
It is conceivable that an allotriomorph may seek to adopt an orientation which
matches well with all the adjacent austenite grains. Such simultaneous lattice
matching has been investigated theoretically in order to predict the probability of
such events as a function of polycrystalline aggregates of austenite grains which
themselves may be textured. It is found that both using the theory, and through
experimental determinations, that the probability of simultaneous matching depends
not only on the intensity of texture in the austenite, but also the presence of

iv
appropriate low-angle grain boundaries.
In addition, a new type of simultaneous matching has been discovered a special
coincidence site lattice (CSL) boundaries. Quantitative analysis has been carried out
to confirm that such matching is more probable when the ferrite forms at particular
CSL boundaries.
To explain many macroscopic texture observations, it is necessary not only to
consider the role of the nucleation site, but also the fact that subsequent growth can,
through hard impingement with other growing grains, stifle some grains and hence
diminish their contributions to the intensity of texture. A theory has been developed
for such growth selection. A heterogeneous distribution of stored energy in
austenite grains plays a significant role on the growth selection process. The model
is validated on measured data.
With the help of an artificial neural network model, the development of
transformation texture due to allotriomorphic ferrite has been predicted in
“interstitial-free” steels. The method includes the influence of several parameters
including chemical composition, cold rolling reduction and annealing temperature
and has been compared with expectations from published data.

v
Contents
PREFACE I
ABSTRACT III
CONTENTS V
NOMENCLATURE IX
CHAPTER 1: INTRODUCTION AND AIM 1
CHAPTER 2: REVIEW OF ALLOTRIOMORPHIC FERRITE 5
2.1 Introduction 5
2.2 Thermodynamics 6
2.3 Nucleation kinetics 10
2.4 Crystallography of allotriomorphs 16
2.5 Summary 18
CHAPTER 3: TRANSFORMATION TEXTURE IN STEELS 23
3.1 Introduction 23
3.2 Geometry of crystallography 26 3.2.1 Crystal structure and definition of a basis 26 3.2.2 Representation of rotation axis 28 3.2.3 Representation of macroscopic textures 32
3.3 Texture inheritance during transformation 34
3.4 Variant selection by different transformation mechanism 36 3.4.1 Definition of variant selection 36 3.4.2 Variant selection in displacive transformation 37 3.4.3 Variant selection during reconstructive mechanism 41
3.5 Comment on variant selection in diffusional transformation 44
vi
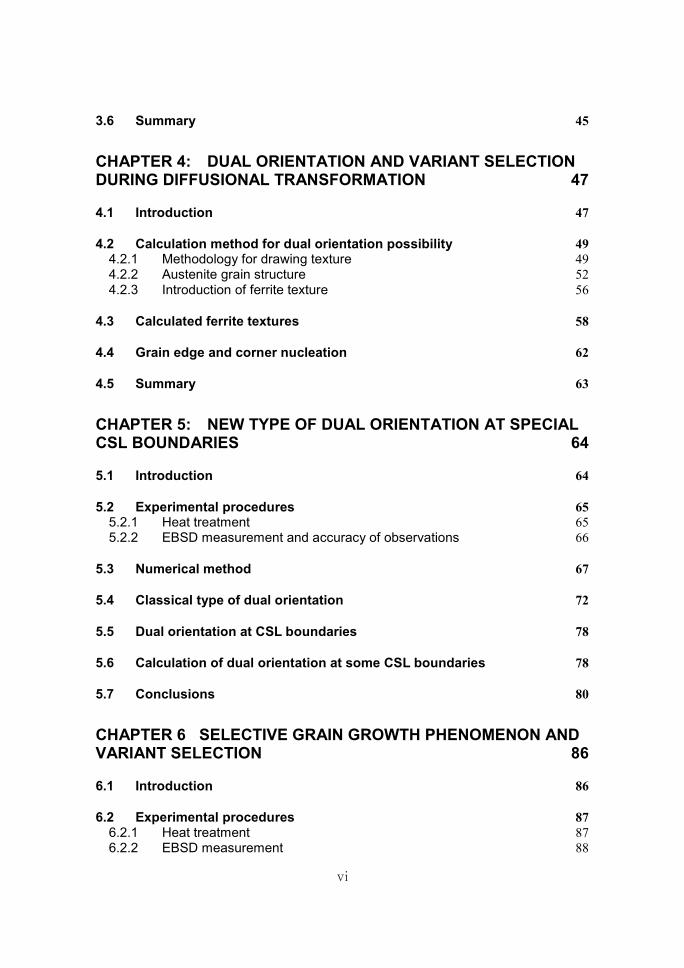
3.6 Summary 45
CHAPTER 4: DUAL ORIENTATION AND VARIANT SELECTION DURING DIFFUSIONAL TRANSFORMATION 47
4.1 Introduction 47
4.2 Calculation method for dual orientation possibility 49 4.2.1 Methodology for drawing texture 49 4.2.2 Austenite grain structure 52 4.2.3 Introduction of ferrite texture 56
4.3 Calculated ferrite textures 58
4.4 Grain edge and corner nucleation 62
4.5 Summary 63
CHAPTER 5: NEW TYPE OF DUAL ORIENTATION AT SPECIAL CSL BOUNDARIES 64
5.1 Introduction 64
5.2 Experimental procedures 65 5.2.1 Heat treatment 65 5.2.2 EBSD measurement and accuracy of observations 66
5.3 Numerical method 67
5.4 Classical type of dual orientation 72
5.5 Dual orientation at CSL boundaries 78
5.6 Calculation of dual orientation at some CSL boundaries 78
5.7 Conclusions 80
CHAPTER 6 SELECTIVE GRAIN GROWTH PHENOMENON AND VARIANT SELECTION 86
6.1 Introduction 86
6.2 Experimental procedures 87 6.2.1 Heat treatment 87 6.2.2 EBSD measurement 88

vii
6.2.3 Evaluation of stored energy in deformed austenite grains 88
6.3 Orientation of allotriomorphic ferrite to adjacent austenite grains 92 6.3.1 Undeformed sample 92 6.3.2 Deformed sample: nucleation at high energy boundaries 96 6.3.3 Deformed sample: nucleation at twin boundaries 105
6.4 A Model for growth control 107 6.4.1 Representation of interface velocity 107 6.4.2 A condition for growth controlling 117
6.5 Analysis from the calculation results 118
6.6 Conclusions 120
CHAPTER 7 TEXTURE PREDICTION BY ARTIFICIAL NEURAL NETWORK APPROACH 128
7.1 Introduction 128
7.2 Details of modeling 129
7.3 Results and discussions 129
7.4 Summary 134
APPENDIX A TEXTURE DEVELOPMENT DURING REVERSE TRANSFORMATION 143
A.1 Introduction 143
A.2 Experimental procedures 144
A.3 Results and discussions 144
A.4 Conclusions 149
APPENDIX B FORTRAN PROGRAM 152
REFERENCES 156
ACKNOWLEDGEMENTS 174

viii
CURRICULUM VITAE 178

ix
Nomenclature
mole fraction of carbon in bulk austenite xag mole fraction of carbon in ferrite in equilibrium with austenite xga mole fraction of carbon in austenite in equilibrium with ferrite Ae1 equilibrium g + a / a + Fe3C phase boundary Ae3 equilibrium g / g + a phase boundary Ωa equilibrium ferrite fraction by level rule Ωg equilibrium austenite fraction by level rule chemical potentials of iron in ferrite chemical potentials of iron in austenite chemical potentials of carbon in ferrite chemical potentials of carbon in austenite → free energy change for transformation from austenite to ferrite free energy of austenite free energy of ferrite free energy of enriched austenite {} activity of carbon in austenite evaluated at the composition x {} activity of carbon in ferrite evaluated at the composition x {} activity of iron in austenite evaluated at the composition x {} activity of iron in ferrite evaluated at the composition x Δ maximum driving force for nucleation total free energy change between parent and product phases ∗ critical nucleus radius for stability during nucleation ∗ critical activation free energy barrier for nucleation r radius of new nucleus during nucleation the number of critical size nuclei N total number of atoms in the initial phase Boltzmann constant (1.380×10⁻²³ J K-1) Absolute temperature nucleation rate per unit volume collision frequency number of atoms per unit volume Zeldovich non-equilibrium factor for nucleation Activation energy for atoms crossing matrix/nucleus interface , , Site factor expressing fraction of active nucleation sites on grain
boundary faces, edges and corners , , shape factor expressing fraction of active nucleation sites on grain boundary faces, edges and corners φ, Φ, φ three Euler angles
[A; u] arbitrary u vector with respect to the basis A

x
(A J B) rotation matrix transforming the components of vectors referred to the A basis to those referred to the B basis
(A J’ B) inverse matrix of (A J B) (a J g) rotation matrix transforming the components of vectors in
austenite to those in ferrite g crystal orientation dV(g) total volume of grain between g and g+∆g V0 total volume fraction of specimen interfacial energy per unit area austenite matrix/ ferrite nucleus interfacial energy per unit area a allotriomorphic ferrite g austenite ∆max maximum permitted deviation from exact rational low energy
orientation relationship ∑ number of coincidence site lattice boundary average dislocation density in austenite grains dislocation density for fully recrystallized grains maximum flow stress mean Taylor factor Taylor factor having grain orientation, temperature dependent shear modulus magnitude of Burgers vector intrinsic stored energy in an austenite grain, i ∆ chemical driving force for phase transformation ∆ average stored energy of austenite grains interface mobility pre-exponent in interface mobility activation energy for migration of iron atom across the interface interface moving velocity of incoherent boundaries toward gm interface moving velocity of semi-coherent boundaries toward gm initial distance between two adjacent nuclei ℎ Plank constant (6.626×10⁻³⁴ J s) δ atomic spacing

1
Chapter 1: Introduction and Aim
The crystallographic theory of martensite [1-3] is probably one of the most
complete formulations in the field of materials science because of the clear and
distinguishing characteristics of the shape deformation which on a macroscopic
scale has the characteristics of invariant-plane strains. Since there is a pronounced
interaction between these strains during transformation and externally imposed
stresses or strains [4-8], the criteria for crystallographic variant selection have been
well-established and the classic Patel and Cohen analysis [9], which gives the
mechanical driving force due to this interaction, has been successful in explaining
the selection of crystallographic variants in the context of martensitic or bainitic
transformation in steels [4, 10, 11].
However, there is no equivalent model or established theory for reconstructive
transformations such as allotriomorphic ferrite formation because at relatively high
temperatures, long-range atomic diffusion can permit strain energy to be relaxed. So,
macroscopic variant selection during diffusional transformation does not seem to be
influenced by external stresses or strains [12]. However, some possibilities for local
variant selection in diffusional transformation come from features associated with
nucleation and grain growth phenomena.
It is favorable for ferrite to have a lattice correspondence with austenite with
which it is in contact in order to reduce the activation energy for nucleation.
Precipitations, therefore, have a low energy orientation relationship with at least one
2
of the adjacent austenite grains. These low energy orientation relationships are often
assumed to be close to Kurdjumov-Sachs [13] or Nishiyama-Wassermann [14],
whence densely packed planes and corresponding close-packed directions from the
two lattices are approximately parallel. Since the specific variants of the orientation
relationship may be selected randomly among all possibilities, there will be no
favoured variants. However, circumstances may arise in which a few precipitations
satisfy a low energy orientation relationship with both the austenite lattices which it
is in contact. This is one type of local variant selection during diffusional
transformation, dual orientation phenomenon.
The activation energy for the nucleation of ferrite could also be decreased by
reducing the interfacial energy. According to the report by Lee and Aaronson [15,
16], interfacial energy decreases as the inclination angle between a facetted
interface and the grain boundary plane of austenite decreases. Since a facetted
interface of ferrite is corelated with a close-packed plane and direction of each
phase, only variants satisfying the closest inclination angle would be favoured for
nucleation. So, the grain boundary plane orientation is an important factor
determining variant selection during diffusional transformation.
Variant selection by dual orientation and interfacial energy minimization are
limited to the nucleation stage. However, hard impingement between particles
during grain growth can also lead to variant selection. The impingement may occur
due to relative differences in interface moving velocity due to the heterogeneous
distribution of stored energy in each austenite grains and growth of certain ferrite
3
grain could be severely restricted by other ferrite grains. So, texture intensity of
ferrite varies with grain size and major texture intensity would be determined by
growth selection.
Variant selection during diffusional transformation could be determined by any of
three criteria: dual orientation, grain boundary plane orientation and growth
selection. For example, variant selection would be more influenced by grain
boundary plane orientation than impingement if the stored energy difference
between two adjacent austenite grains is quite small. Moreover, variant s hard to be
observed when ferrite nucleates at low angle boundary because the dual orientation
possibility itself is quite low [17, 18].
The emphasis therefore in this present research is on clarifying all possible
situations which can affect variant selection during diffusional transformation to
ferrite:
- Based on fundamental crystallographic theories, the dual orientation
possibility has been calculated numerically for a variety of conditions
- A new type of simultaneous lattice matching has been discovered at
specific coincidence site lattice (CSL) boundaries and has been compared
with the classical dual orientation phenomenon
- A theory has been developed according to various stored energy conditions
in austenite to explain growth selection.
- A series of Electron Back Scattered Diffraction (EBSD) experiments have
been conducted to prove the calculation results or suggestions.

4
In addition, a neural network model was used to study the effect of
metallurgical parameters such as chemical composition, rolling-reduction rate,
annealing temperature etc. on texture development in “interstitial free” steels.
The transformation texture development during reverse transformation in
aluminum added TRIP steels is described briefly in the appendix.
5
Chapter 2: Review of Allotriomorphic Ferrite
2.1 Introduction
Allotriomorphic ferrite is one of the most important phases in low-alloy steels. It
is the first phase to form from austenite at temperatures below Ae3 and thus it
determines the composition and amount of austenite remaining for subsequent
transformations. The term ‘allotriomorph’ implies that the shape of the particle does
not respect its internal crystalline symmetry [19]; the ferrite nucleates at an
austenite grain boundary and its morphology is determined by the contours of the
boundary, which represents an easy diffusion path.
However, the morphology can sometimes be facetted with the interfaces
corresponding to low energy phase between the parent and product phases. In such
cases the shape is more likely to reflect the symmetry of the g-a bicrystal [20]. It
has been known that the ability of growing ferrite to form facets depends not just on
the orientation dependence of interfacial energy but also on the driving force for
transformation [21]. For example, particular variants which reduce the interfacial
energy should be favoured among all possible low energy orientation relationships.
Moreover, ferrite formed at high temperatures (low super-saturations) could appear
facetted while that formed at lower temperature where the driving force is large may
not (Figure 2.1).
Consequently, it is necessary to investigate the fundamental transformation
theories of ferrite nucleation for a clear understanding of crystallographic

6
orientations and variant selection mechanisms in the context of allotriomorphic
ferrite. This Chapter therefore addresses the basic thermodynamics and nucleation
mechanisms for transformation.
2.2 Thermodynamics
The driving force for the transformation from austenite to ferrite is the reduction
in the free energy of the total system obtained when lattice of austenite transforms a
more stable mixture of austenite and ferrite. A schematic diagram illustrating this
free energy change is shown in Figure 2.2, where austenite having bulk composition can reduce the total free energy of system when ferrite forms with composition of
xag leaving the austenite composition of xga. The austenite is enriched by the carbon
partitioning as ferrite grains grow. In equilibrium conditions, the composition of
austenite follows the Ae3 line until the eutectoid temperature is reached. xag is the
carbon mole fraction in the ferrite which is in equilibrium with austenite of
composition xga.
These mole fractions of ferrite (Ωa) and austenite (Ωg) at certain temperature
between Ae3 and Ae1 can be determined from the application of the lever rule in the
phase diagram as follows:
Ω = − − (2.1)
Ω = − − (2.2)

7
Since equilibrium between two phases means that the chemical potentials () of the
components in each phase are identical, the chemical potentials of Fe and C should
be same in austenite and ferrite. = (2.3) = (2.4)
Meanwhile, the driving force, ∆Gg→g'+a can be determined by the difference
between original free energy of austenite phase, Gg and free energy of product
phases ferrite, Ga as well as carbon enriched austenite, Gg' Considering the mole
fraction of each phase, this relationship could be represented by: → = + − (2.5)
The energy of each phase as: = {} + (1 − ) {} (2.6) = { } + (1 − ) { } (2.7) = {} + (1 − ) {} (2.8)
where {} represents the chemical potential of carbon in austenite when carbon
concentration is equal to and similarly for other chemical potentials. From
Equations 2.6 to 2.8, Equation 2.5 can be expressed as: → = { }−{} − (1 − ) { }− {} (2.9)
Writing the chemical potential term as m = G + RTlna produces the results:
→ = ln { }{} − (1 − )ln { } {} (2.10)
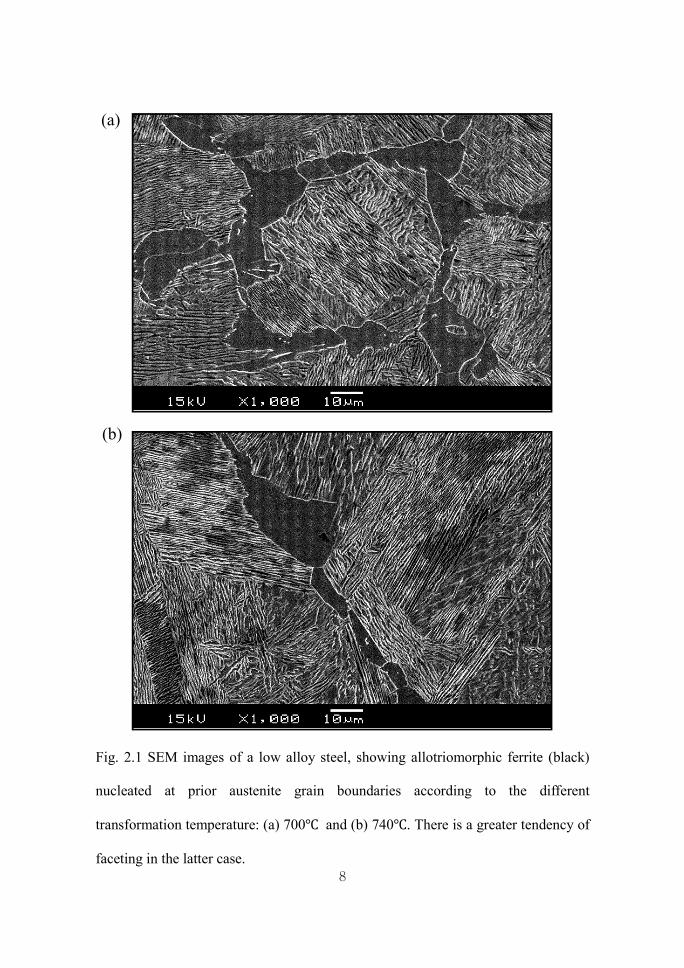
Fig. 2.1 SEM images of a low alloy steel, showing allotriomorphic ferrite (black)
nucleated at prior austenite grain boundaries according to the different
transformation temperature: (a) 700℃ and (b) 740
faceting in the latter case.
(b)
(a)
8
steel, showing allotriomorphic ferrite (black)
nucleated at prior austenite grain boundaries according to the different
and (b) 740℃. There is a greater tendency of

9
Fig. 2.2 Schematic free energy-composition diagram at temperature, T (a) and the
corresponding section of the Fe-C phase diagram (b).
a g
a
g
a+g
∆Gg→g+a
(a)
(b)
0 xag xga
0 xag xga
Carbon concentration
Carbon concentration
T
T
Ae3
x
x

10
where {} is the carbon activity in austenite evaluated at concentration xga and
similar definition apply to the other activity terms. To evaluate the free energy
change for the austenite to ferrite transformation, the equilibrium phase boundary
compositions and activities should be determined.
As it mentioned in Chapter 1, the crystallographic orientation of ferrite is
determined mostly in early nucleation stage. The initial distance between
neighboring nuclei is one of the important concepts in macroscopic growth selection
governed by hard impingement effects. So, it is necessary to consider the driving
force for ferrite nucleation which is different from the ∆Gg→g'+a described
previously.
In a binary solution, the energy can be obtained using the double tangent
construction illustrated in Figure 2.3 [22]. It is assumed that ferrite formation
produces a very small change in the bulk composition of austenite when the nucleus
volume is very small. As this small value tends to 0, the austenite composition tends
towards the bulk composition, . xm is the nucleus composition and it is obtained
when free energy change is maximized. So, ∆Gm is evaluated when the two
tangents are parallel:
= {}{} (2.11)
2.3 Nucleation kinetics
According to the classical nucleation theories, for a pure system, the overall

11
driving force for the nucleation is expressed by the difference in the free energies
between initial and final stages of the assembly. If the nucleus is constrained by the
phase in which it nucleates then there will be an additional strain energy component
in the overall free energy. The energy increase due to the formation of new interface
also has to be considered in the total free energy change. During the homogeneous
nucleation of a new ferrite phase in a solid austenite matrix, assuming a spherical
nucleus of radius r, the total net free energy change is:
= − 43 ( − ) + 4 (2.12)
where is the interfacial energy per unit area between ferrite and austenite, ΔG
is − and is the strain energy per unit volume. The critical free energy
barrier for nucleation by thermal fluctuation is represented by G* and it is the value
when free energy change is a maximum. This relationship can be
expressed by: () = −4( − ) + 8 = 0 (2.13)
The radius of nuclei satisfying Equation 2.12 is called critical radius r* and is:
∗ = 2( − ) (2.14)
Substituting it into Equation 2.13 again, we can obtain critical free energy barrier as:
∗ = 16 3( − ) (2.15)
Figure 2.4 shows this total free energy changes according to the radius of nucleus.
When the radius is smaller than the critical value, the total free energy can be

12
decreased by the dissolution of the nucleus but it can be reduction occurs beyond ∗.
If we assume existence of stationary distribution of nuclei of size r < r*, the number
of critical size nuclei present, nc can be represented as a probability of such a
nucleus being formed multiplied by the total number of atoms in the initial phase
(vapor), N:
= exp − ∗ (2.16)
nc is a statistical distribution function for nuclei of critical size. Then, the nucleation
rate is represented by combination of nc and the probability of a vapor atom
condensing to a critical nucleus in unit time (a collision frequency). Thus, the
nucleation rate per unit volume, Iv is:
= exp − ∗ (2.17)
where is defined as collision frequency and is number of atoms per unit
volume. Considering the gradual decrease of distribution function in r > r*, it has
been modified by multiplication of the pre-exponential factor in Equation 2.15 with
a parameter Z, known as the Zeldovich factor where:
= 1∗ ∗3. (2.18)
Since assumption of all these results based on the kinetics of gaseous collisions
which is not applicable in real case, concepts of atomic vibration frequency (kBt/ h)
and activation energy for the transfer of atoms across the a/ g interface, Q was
considered. Consequently, nucleation rate per unit volume, Iv is represented as:

13
= ℎ exp − ( + ∗) (2.19)
In heterogeneous nucleation, Equation 2.17 can be modified by [23, 24]:
= ℎ exp − ∗ + (2.20)
where is a density of sites factor, representing the number of sites of a particular
type available for nucleation and is equal to {/}. is a effective grain
boundary thickness and is the grain size of austenite. is a shape factor for
the sites of different dimensionality j. j=3 for for homogeneous nucleation, 2 for
faces, 1 for edges and 0 for corners. Equation 2.17 was modified again by Reed and
Bhadeshia [25] by considering the shape and sites factor:
= ℎ exp − ∗ + (2.21)
where is the shape factor and 1/ is total possible number of sites per unit
area. Values of site factor, and shape factor, are listed in Table 2.1

14
Table 2.1 Values of site factor and shape factor according to the nucleation site [25]
Site Site factor Shape factor
Face
Edge
Corner
6.9×10⁸
1.3×10⁸
1.2×10⁸
6.9×10⁸
1.3×10⁸
1.2×10⁸

15
Fig. 2.3 Evaluation of driving force for nucleation, ∆ in free energy-
composition diagram.
Fig. 2.4 The free energy change associated with the homogeneous nucleation of a
spherical nucleus of radius r.

16
2.4 Crystallography of allotriomorphs
The properties of interfaces between austenite and ferrite depend on the relative
dispositions of the crystals and the ferrite morphology is also severely influenced by
the crystallography via the orientation dependence of the interfacial energy.
Therefore, an understanding of the crystallography of each phase and orientation
correlations between ferrite and austenite is an important feature of materials
research.
Although many investigations including experiments and calculations have been
carried out to study the crystallography of allotriomorphs during transformation [17,
18, 26-30], perhaps, the most important experimental observation is that orientation
relationship between precipitations and matrix found during phase transformations
is usually not random [26-29]. This frequency of occurrence of a particular
orientation relationship usually exceeds the probability obtained by simply taking
two separate crystals and joining them up in an arbitrary way. This indicates there
are relationships between two phases [19].
In general, it has been known that this non-random orientation relationship exists
to minimize the strain energy when nuclei form by the homogeneous deformation so
that there is a coordinated movement of atoms. On the other hand, it can occur in
order to reduce the interfacial energy and hence the activation energy for nucleation.
Thermally activated embryos that comply with low-energy orientation would find it
relatively easy to grow into successful nuclei, thus resulting in a non-random
orientation distribution. The former case corresponds to the bainitic or martensitic

17
transformation by a displacive mechanism and the latter one corresponds to
allotriomorphs by reconstructive transformation which is concerned in this thesis.
Although the concept of displacements leading to crystal structure change is not
appropriate for allotriomorphic ferrite, diffusional transformations also show similar
low energy orientation relationship. Ryder and Pitsch [26, 27] proposed that a/ g
orientation relationship lie nearby Bain orientation [31] and we can see that their
experimental results in Figure 2.5 are in good accordance with their suggestion.
King and Bell [28] conducted a detailed study of the crystallography of
allotriomorphic ferrite in a Fe-0.47C wt % alloy isothermally transformed above the
eutectoid temperature. In most cases they analyzed, ferrite was found to have
Kurdjumov-Sachs (KS) [13] or Nishiyama-Wasserman (NW) [14] orientation
relationship whose range was more restricted than the 11° of the Bain orientation.
The orientations tended to cluster at and around the KS and to a lesser extent the
NW relations. It was always possible to find a close-packed plane of austenite
which was within 2° of a closet-packed plane of ferrite; within these planes, a
close-packed direction of austenite could always be found within 8° of a similar
direction in the ferrite as shown in Figure 2.6.
Similar investigations also have been carried out by Babu and Bhadeshia with
high silicon steels [30]. They produced complex microstructures consisting of
bainitic ferrite, allotriomorphic ferrite and retained austenite, which permitted the
direct observation of orientation relationship between ferrite and austenite in room
temperature. Table 2.2 represents the experimental results and classical type of KS

18
or NW orientation relationships were observed. They also found a comparatively
large number of random orientation relationship with both adjacent austenite grains
(number 3, 6~14 in the table). In order to avoid a large activation barrier, the ferrite
must nucleate with a good match with at least one of the austenite grains. Their
results were therefore, quite different from traditional tendency of orientation
relationship. However, it could be well explained by assumption of allotriomorphic
ferrite growth into region far from their original nucleation sites and Purdy [32] also
showed similar results in his TEM studies when ferrite growth occurred along grain
boundary with high mobility.
2.5 Summary
Many crystallographic observations have shown that allotriomorphic ferrite has a
particular non-random orientation relationship with at least one of adjacent austenite
grains even though it is transformed from austenite by long range diffusion of atoms.
Unlike the displacive mechanism, this tendency arise from endeavor of the embryo
to reduce the interfacial energy per unit volume; are hence the finally activation
energy during formation into nuclei.
This non-random crystallographic orientation is normally regarded as Bain,
Kurdjumov-Sachs or Nishiyama-Wasserman orientation relationship and it is
determined in the early stages of nucleation. It is therefore, important to understand
the fundamental theories of thermodynamics as well as nucleation kinetics.
Although many investigations have been carried out and show that the

19
development of low energy orientation relationship during allotriomorphic ferrite
transformation is almost similar to that in displacive transformation, reconstructive
transformation seems to be further complicated in predicting orientation relationship
precisely including variants selection since the ferrite grows by the uncoordinated
movements of atoms and its growth is consequently not limited to the grain in
which it originally nucleated.

Fig. 2.5 (a) and (b) is bright field and dark f
observation of grain boundary precipitation in Co+20 vol. % Fe. (c) is (100) poles
of ferrite represented in circle with respect to the austenite grain. Dotted lines
indicate the Bain orientation regions [26
(a)
(b)
(b)
20
is bright field and dark field images respectively in TEM
observation of grain boundary precipitation in Co+20 vol. % Fe. (c) is (100) poles
of ferrite represented in circle with respect to the austenite grain. Dotted lines
26].

21
Fig. 2.6 (a) is a (100)g standard projection illustrating a variant of the Kurdjumov-
Sachs orientation relationship and (b) is orientation relationship observed
from experiments [28].
(a)
(b)

22
Table 2.2 Ferrite-austenite orientation relationship: θ is the angle between {111}
plane of austenite and {110} of ferrite. φ is the angle between <110> direction of
austenite and <111> direction of ferrite [30]
Number θ φ Approximate orientation relationship
1a 1b 2a 2b 3a 3b 4a 4b 5a 5b 6a 6b 7a 7b 8a 8b 9a 9b 10a 10b 11a 11b 12a 12b 13a 13b 14a 14b 15a 15b
4.04 27.6 0.0
18.1 15.1 13.7 0.0
19.9 35.3 2.0
20.5 15.0 18.9 8.7
24.5 5.7
28.9 0.0
24.3 18.7 26.4 14.4 25.5 28.5 21.4 30.3 24.4 0.0 2.7 3.0 6.9
3.2 22.0 5.0 32.1 4.9 13.6 5.3 15.8 33.5 5.5 16.4 1638 22.5 10.7 10.1 23.5 28.5 19.8 10.6 11.3 26.4 17.0 23.8 21.4 30.8 24.4 26.8 8.9 28.7 5.8 5.3
KS/ NW -
NW - - -
NW - -
KS/ NW - - - - - - - - - - - - - - - - - - -
KS/ NW KS/ NW

23
Chapter 3: Transformation texture in Steels
3.1 Introduction
The processes which generate textures and texture changes in steels consist
mainly of deformation, recrystallization and transformation. Transformation texture
plays a minor role in providing the initial orientation information for cold rolled and
recrystallized steels when most processing is carried out in the ferrite phase after
phase transformation. For example, interstitial free (IF) steels shows strengthening
of intensity in the α-fiber texture component after severe deformation and γ-fiber
texture become dominant over all texture components (Figure 3.1) [33]. Since the
excellent formability of IF steels results especially from the formation of this strong
g-fiber texture, the effect of texture changes due to the phase transformation on the
mechanical properties is insignificant.
However, steels can also be employed in the normalized or hot-rolled conditions, in
which cases the texture changes accompanying transformation play a bigger role in
influencing mechanical properties due to the particular texture developments. Some
of these steels pass through a controlled rolling procedure, in which reductions are
applied in the unrecrystallised austenite region or intercritical region before cooling
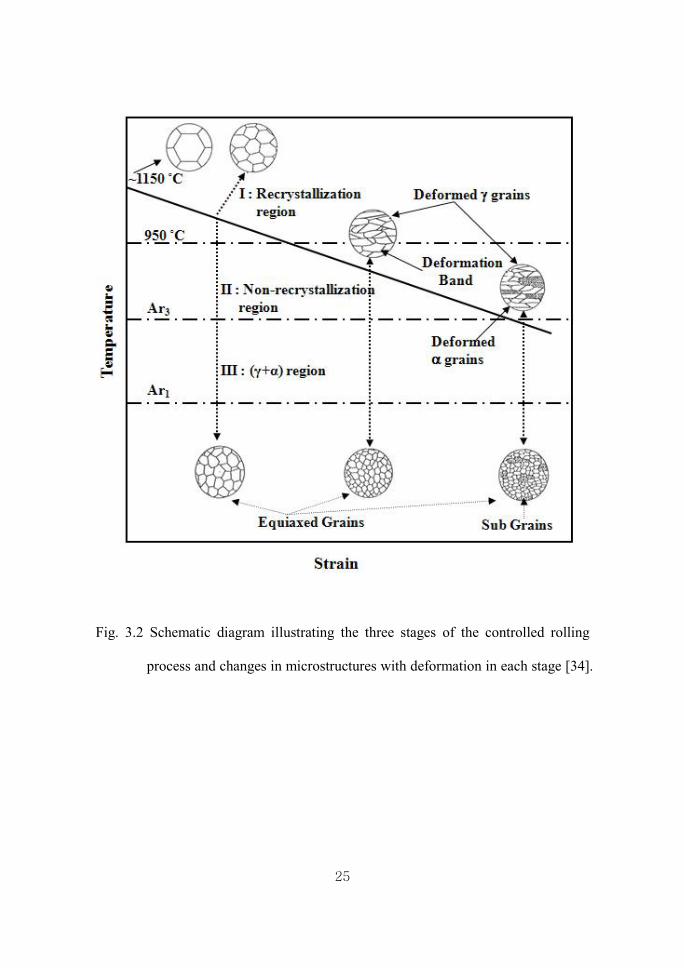
to room temperature [34]. Figure 3.2 shows a schematic diagram of this controlled
rolling process. Microstructure changes according to deformation in each stage were
illustrated and it can be expected that the texture in the final product is largely
influenced by texture changes due to the phase transformation in these processing

24
Fig. 3.1 Φ=45° sections of ODF of the studied steels in [33]: (a) hot rolled, (b) 80%
cold rolled, (c) 80% cold rolled and annealed at 700℃ and (d) 80% cold
rolled and annealed at 800℃.
(a) (b)
(c) (d)
25
Fig. 3.2 Schematic diagram illustrating the three stages of the controlled rolling
process and changes in microstructures with deformation in each stage [34].
26
conditions.
Since there are particular orientation relationships between precipitates and the
matrix, development of transformation texture in ferrite is always correlated with
the orientation of austenite. Thus it is important to understand the variables which
affect the inheritance of texture from austenite to ferrite for clarifying the overall
mechanism of texture development. In this section, various orientation relationships
have been surveyed based on the fundamental concepts in the geometry of
crystallography according to the variety of transformation conditions. The variant
selection mechanism has been considered in depth for both the displacive and
reconstructive mechanisms.
3.2 Geometry of crystallography
3.2.1 Crystal structure and definition of a basis
Throughout this thesis the vector and matrix notation due to MacKenzie and
Bowles [2, 35] is used because is particularly good at avoiding confusion between
frames of reference. Figure 3.1 shows a unit cell of austenite which has a face-
centered cubic crystal structure. To specify the direction and magnitude of a vector
for example u in the figure, it is necessary to have a reference set of coordinates.
The frame of this crystal coordinate system can be represented by three orthogonal
vectors a1, a2, a3 which lie along the three sides of the unit cell. These three vectors
which are parallel to the unit cell edges and of magnitude equal to the austenite

27
lattice parameter form the crystallographic basis.
The set of vectors ai (i =1, 2, 3) are called the basis vectors and the basis itself
can be identified by a basis symbol A. Now, any vector u in the structure can then
be written as: = + + (3. 1)
where u1, u2 , u3 are its components in the basis A.
In the special case when all these vectors are mutually perpendicular and of unit
length the basis is called orthonormal. Any column vector u = [u1 u2 u3] can be
represented as [A; u]. For instance in Figure 3.3 u vector can be expressed with
respect to the basis A by: [A; ] = [1 1 1] (3. 2)
A single row matrix (u1 u2 u3) with round brackets can also be used to represent
the vector u, which is (u; A) = (u1 u2 u3). Notice that the column matrix [A; u] is the
transpose of row matrix (u; A). An arbitrary vector in one basis also can be
represented in another by using a 3×3 transformation matrix, which is written as (B
J A). It transforms the components of vectors referred to the A basis to those
referred to the B basis. The matrices (A J B) and (A J′ B) represent the inverse and
transpose of the (B J A) respectively. Since the directions of these basis vectors are
different in every grain, it is necessary to show this information according to the
unified criterion and the specimen coordinate system is usually used because it is
determined by the external shape of the specimen. For rolled sheet steel, it is normal
to choose a coordinate system S whose axes s1, s2 and s3 lie along the rolling

28
direction (RD), transverse direction (TD) and normal direction (ND) of the sheet,
respectively, as shown in Figure 3.4. The preference of crystallographic orientation
of each grain within the sample is the essence of texture. There are several ways to
represent texture and they will be discussed later in this chapter.
3.2.2 Representation of rotation axis
For an orthonormal basis, a new unit vector which is parallel to an arbitrary
vector, u = [u1, u2, u3] can be obtained as:
+ + , + + , + + = [cos, cos, cos] (3. 3)
where , , are angles between u and a1, a2, a3. Here the second basis B can be
represented by specifying the direction cosigns of its three axes b1, b2, b3 in basis A,
that is: = cos × + cos × + cos × = cos × + cos × + cos × = cos × + cos × + cos × (3. 4)
where , , (i=1~3) are defined as angles between and , and , and respectively.
This relationship indicates the transformation from basis A to basis B which can
be expressed by 3×3 matrix (A J B) as mentioned in 3.2.1:

29
Fig. 3.3 An unit cell of face-centered cubic (FCC) and crystal coordinate system
Fig. 3.4 Schematic diagram for sample reference frame. RD: rolling direction, TD:
transverse direction, ND: normal direction.
a1
a2
a3
u

30
(A J B) = cos cos coscos cos coscos cos cos (3. 5)
Thus an arbitrary vector u in base B can be expressed according to the base A: [A; ] = (A J B)[B; ] (3. 6) [B; ] = (B J A)[A; ] (3. 7)
where (B J A) is a transverse matrix of (A J B). This rotation matrix can be
expressed by an axis-angle pairs which has been well derived by Bunge [36] as:
uu(1 − m) + m uu(1 − m) + um uu(1 − m) + unuu(1 − m) + un uu(1 − m) + m uu(1 − m) + unuu(1 − m) + un uu(1 − m) + un uu(1 − m) + m (3. 8)
where m=cos, n=sin and is the corresponding right-handed rotation angle and
it can be obtained from the fact that: J + J + J = 1 + 2cosθ (3. 9)
and the components of the vector u along the axis of rotation are given by: u = (J − J )/ 2sinθ u = (J − J )/ 2sinθ u = (J − J )/ 2sinθ (3. 10)
The rotation matrix also can be represented by using Euler angles as shown in
Figure 3.5 First, φabout the normal direction ND (x3 in the figure), transforming
the transverse direction TD (x2 in the figure) into TD’ and the rolling direction RD
(x1 in the figure) into RD’ as shown in (a). ϕ rotation in (b) is about RD’ and
finally make φ rotation about ND’’, where these φ, ϕ, φ are Euler angles.

31
Fig. 3.5 Diagram showing how rotation through the Euler angles describes the
rotation between the specimen and crystal axes
(a) φ about the normal direction ND
(b) ϕ about the axis RD’(in its new orientation)
(c) φ about ND’’ in its new orientation)
(d) Sample coordinates (x1, x2, x3) rotation to crystal coordinate (xc1, xc
2, xc3)
(a)
(c)
(b)
(d)

32
3.2.3 Representation of macroscopic textures
X-ray or neutron diffraction has been introduced as common techniques to
determine macroscopic textures and pole figures, inverse pole figures and
orientation distribution functions (ODF). There are perhaps the most popular
methods to express orientation information from polycrystalline structures. The pole
figures plots poles of a certain crystal direction with respect to the specimen
coordinate on a stereographic projection. The orientation can be also described by
poles of the specimen coordinate system with respect to those of the crystal
coordinate system in stereographic projection, which yields the inverse pole figure.
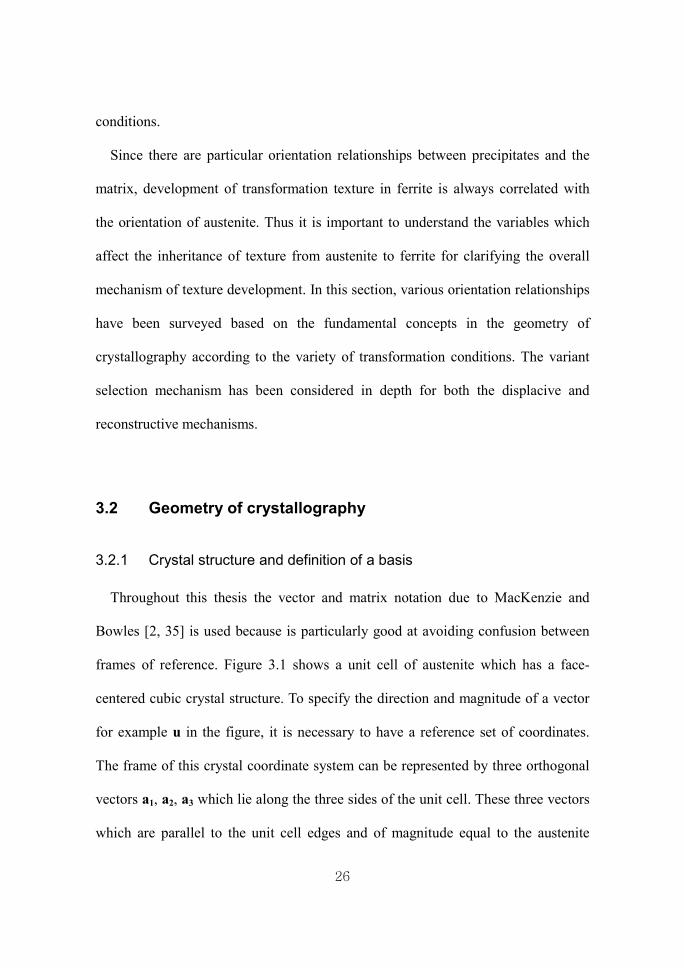
For instance, orientation of (124)[210] cubic crystal was expressed using pole
figure and inverse pole figure in Figure 3.6 (a) and (b) respectively.
Both of them has been widely used for convenience and simplicity of the
stereographic projection, but the projection of the three-dimensional orientation
distribution onto a two dimensional pole figure causes a loss in information.
Therefore, to permit quantitative evaluation of the texture, it is necessary to describe
the orientation density of grains in a polycrystalline in an appropriate three
dimensional representation, i.e. in terms of its orientation distribution function, f(g)
which is normally represented as [37, 38]: () = () (3. 11)
where g is a crystal orientation and () is total volume of grain between g and
g+∆g. is the total volume of specimen.
33
Fig. 3.6 (a) shows (100), (110) and (111) pole figures of (124)[210] cubic crystal
and (b) illustrates inverse pole figure of (124)[2 1 0]. (c) is a three
dimensional view of Euler space with locations of some important ideal
orientations and fibers
(a)
(b)
(c)

34
By using Bunge’s spherical harmonics [36], information of orientation density is
obtained quantitatively and it is expressed as a multiple of volume fraction in
random distribution in Euler space. So, if the value of density is 2, then the volume
of certain orientation will be double than the volume of random distribution. Even
though the orientation density distribution can be represented by using contour
plane, particular section when φ=45° is usually taken to the representative of
characteristic texture components. Some important texture components including a
and g fiber textures were illustrated in Figure 3.6 (c).
3.3 Texture inheritance during transformation
It is often assumed that the orientation relationship between austenite and
martensite is close to some rational orientation relationship. Table 3.1 shows some
of these rational orientation relationships and they can be also described using the
Euler angles shown in Table 3.2. By consideration of the symmetry of the parent
crystal a certain number of possibilities present themselves in order to arrange
symmetry equivalent planes and directions of both phases parallel to each other.
These possibilities are 24 variants for the Kurdjumov-Sachs relationship, 12 for the
Nishiyama-Wasserman relationship as well as Pitsch, 3 for the Bain orientation
relationship. Table 3.2 is a calculation results from these Euler angles and shows
misorientation angles between the rational orientation relationships. However, it has
been known that the true orientation relationship must be irrational [1, 4, 39, 40]. It
has been assumed that the orientation difference between the rational and irrational

35
Table 3.1 List of some selected rational orientation relationship commonly used to
describe the a/ g interface
Orientation relationship Variants
Kurdjumov-Sachs
Nishiyama-Wasserman
Pitsch
Bain
{110}a //{111}g, <111>a //<110>g
{110}a //{111}g, <001>a //<011>g
{011}a //{001}g, <111>a //<110>g
{011}a //{001}g, <100>a //<100>g
Table 3.2 Euler angles by Bunge notation given for the transformation from
austenite to ferrite and ferrite to austenite
Orientation relationship g → a a → g φ ϕ φ φ ϕ φ
Kurdjumov-Sachs
Nishiyama-Wasserman
Pitsch
Bain
5.77°
9.74°
0°
0°
48.19°
45°
45°
45°
5.77°
0°
9.74°
0°
5.77°
0°
9.74°
0°
48.19°
45°
45°
45°
5.77°
9.74°
0°
0°
Table 3.3 Misorientation angle between rational orientation relationships
KS NW Pitsch Bain
KS
NW
Pitsch
Bain
-
5.26°
5.26°
11.07°
5.26°
-
7.44°
9.74°
5.26°
7.44°
-
9.74°
11.07°
9.74°
9.74v
-

36
may seem less than a few degrees but is essential because rational orientation
cannot lead to the existence of an invariant line which is a condition for martensitic
transformation. In this point of view, it is noticeable that orientation relationship
between matrix and precipitations during reconstructive transformation has been
also observed to be irrational [30, 41-43]. It has been known that this is due to
minimize the growth strains and maximize the condition for crystallographic relief
of those strains [43].
3.4 Variant selection by different transformation mechanism
3.4.1 Definition of variant selection
As mentioned in section 3.3, there are particular orientation relationships between
precipitates and the matrix. The development of transformation texture in ferrite is
therefore always correlated with the original orientation of austenite grains. These
relationships can be expressed in terms of the parallelism of certain planes and
directions between ferrite and austenite as {ℎ}⟨ℎ⟩, {}⟨⟩, where the scripts 1 and 2 refer to the parent and product structures. This variant
from the same family of planes and directions and symmetry dictates the total
number of variants possible. Sometimes, however, particular variants among them
are favoured by some factors such as external stresses or strains etc., which is called
‘variant selection’.

37
3.4.2 Variant selection in displacive transformation
Martensite formation is generally accompanied by a change in volume and a
significant transformation shear while reconstructive contains a mixing up of atoms
as well as absence of the shape deformation shown in Figure 3.7. It can therefore,
be anticipated that the course of the transformation is likely to be affected by the
elastic and plastic deformations which result from these phenomenon. Experimental
results conducted by Gey et al. [44] show good examples of variant selection during
martensitic transformation. Figure 3.8 represents the experimentally determined
Cube textured austenite pole figure and ferrite pole figure from the austenite. The
experimentally obtained ferrite texture is different from that calculated
corresponding to (c) and this clearly shows specific variants should be favoured
during transformation.
Based on extreme experimental work, variant selection models have been
proposed over the past few decades and some important models and remarks are
summarized in Table 3.4. Although detail conditions for variant selection vary, they
have a common assumption that martensite variants are favoured when there are
externally imposed strains or stresses. This is because the transformation reflect a
physical deformation

38
Table 3.4 Variant selection models in displacive transformation
Model Remarks or conditions for variant selection
Shape deformation (SD) model [9] Work by interaction between applied
stress and displacive shear should be
maximized
Bokros-Parker (BP) model [45, 46] Habit plane should be nearly
perpendicular to the active slip plane
Active slip system (AS) model [47] Particular slip systems subjected to the
largest shear stresses during rolling
before transformation
Twining shear (TS) model [5, 8, 48, 49] Double shear mechanism of
martensite crystallography
Bain strain (BS) model [50] Interaction between applied stress of
rolling and the Bain strain

39
Fig. 3.7 Schematic illustration of mechanisms of displacive and reconstructive
transformations [40].

40
Figure 3.8 (a) Cube type deformation texture in austenite (b) Transformation texture
of martensite formed from Cube textured austenite with variant selection. (c)
Calculated martensite texture from Cube type austenite texture (without imposing
variant selection) [44].
(a) (b)
(c)

41
3.4.3 Variant selection during reconstructive mechanism
Figure 3.9 shows a comparison between experimentally obtained ODFs of ferrite
variants and that theoretically calculated assuming a Kurdjumov-Sachs orientation
relationship between the austenite and ferrite [12]. Hot rolling was finished at 815℃
after 80% reduction. As is illustrated in the figure, all variants seem to form in
approx equal proportions. Consequently, it describes that there are no favoured
ferrite variants due to transformation during hot rolling. This is because
transformation by reconstructive mechanism does not lead to a shape deformation
so that external stress or strains cannot directly effect on the texture inheritance
from austenite to ferrite.
From a microscopic point of view, however, it has been shown that there is local
variant selection in the diffusional transformation [51-54]. As mentioned before,
low energy orientation relationships in diffusional transformation are due to the
minimization of activation energy for nucleation by reducing interfacial energy. So,
local variants selection must be related to an interfacial energy minimization
criterion. Lee and Aaronson [15, 16] calculated the interfacial energy in various
type of ferrite grain formed at austenite grain boundary and Figure 3.10 shows the
results according to the inclination angle between a facetted interface and a grain
boundary. They suggested that the ferrite whose facetted interface with austenite
was closest to the grain boundary would be favored because the activation energy
for nucleation decreased as the inclined angle of facetted interface decreased.

42
Figure 3.9 (a) ODFs (Roe notation) of ferrite obtained in hot rolled 0.12C-1.47Mn-
0.05Nb steel and (b) analytically predicted ODF for ferrite calculated from austenite
[12].
(a)
(b)

43
Figure 3.10 Schematic diagram of grain boundary precipitates: (a) one low energy
interface and (b) two low energy interfaces. (c) is a change of activation energy for
nucleation as a function of a tilt angle to the closest grain boundary of a low energy
interface [16].
(a)
(c)
(b)

44
3.5 Comment on variant selection in diffusional transformation
The suggestion by Lee and Aaronson has been consistent with variant selection in
diffusional transformation in defined range of inclination angle. However,
according to recent reports [42, 51], the criterion leads to difficulties in describing
variant selection of precipitates when the inclination angle is larger than in
Figure 3.10 (c). From calculations, interfacial energy becomes saturated when the
inclination is larger than this critical angle. Since there are few benefits in reducing
inclination angle when ≥ in terms of activation energy minimization, it
should not affect variant selection.
Adachi et al. [51] have also conducted similar calculations of activation energy
due to various nucleation conditions and tried to observed the orientation
relationship with respect to the boundary plane orientation. Figure 3.11 shows their
calculation results. The activation energy curve shows a similar tendency with
results by Lee and Aaronson. They have suggested that precipitates can have a KS
orientation relationship even in ≥ if ferrite has two low energy interfaces
(facetted interfaces) because having two such interfaces decreases the activation
energy for nucleation. Some 70 allotriomorphic ferrite have been observed in their
report and 18 showed double KS orientation relationship. In other words, having
two KS orientation relationship which is also called as dual orientation relationship
is determined by orientation relationship between adjacent austenite grains and in
normal high angle boundary, it is almost impossible to obtain dual orientation [17,
18]. Detain about dual orientation will be discussed in the next chapter.

45
3.6 Summary
Several methods in representing texture and rotation axis have been surveyed. An
arbitrary vector was expressed in different crystal coordinates using a rotation
matrix, Euler angles as well as axis-angle pairs. To represent macroscopic textures,
pole figures, inverse pole figures and orientation distribution functions (ODFs) have
been introduced.
Based on a literature review, it is possible to notice that there are certain
orientation relationships between austenite and ferrite which are close to a rational
relationship such as Kurdjumov-Sachs, Nishiyama-Wasserman, Pitsch and Bain
orientation relationships. However, in real cases, there should be an irrational
orientation relationship which lead to an invariant line in the interface, because this
is necessary to permit glissile interfaces between g and a’ or because the
coherency correlated with the invariant line leads to a reduction in interfacial
energy. Basically symmetrical variants have equal possibility of occurrence
however; we could see that sometimes particular variants are favoured due to the
effect of externally imposed stresses or strains on the shape deformation during
transformation. Since reconstructive transformation occurs by long-range atomic
diffusion without invariant plane strains, there were no effects of external
deformation on the variant selection only except local variant selection by activation
energy minimization. However, criteria based on the Lee and Aaronson’s
calculation have proven to be inexact for certain large facet interface inclination

46
Figure 3.11 Schematic diagrams of grain boundary precipitates and a change of
activation energy for nucleation as a function of a tilt angle.

47
Chapter 4: Dual Orientation and Variant Selection during Diffusional Transformation
4.1 Introduction
With the advent and popularity of electron backscattered diffraction and
orientation imaging microscopy [55-57], there has been renewed interest in the
concept of crystallographic grain size as opposed to the metallographic grain size.
The latter is a measure of the amount of grain surface per unit volume, irrespective
of the misorientations between adjacent grains as long as the boundaries can be
detected by the metallographic method used.
The former on the other hand, indicates distances over which there is little
variation in crystallographic orientation in spite of intervening grain boundaries.
The crystallographic grain size is particularly relevant in understanding the
toughness of steels because it determines the percolation and roughness of cracks
through the structure [58-63]. Whereas a great deal is known about the control of
the metallographic grain size, work on crystallographic grain size control is in its
infancy. The mathematical framework needed to do this would rely on the ability to
calculate transformation textures.
In the case of displacive transformations such as bainite and martensite, the set
consisting of the orientation relationship, shape deformation and habit plane is
uniquely defined by the phenomenological theory of martensite [1, 2, 35, 64]. It
follows that given the orientation distribution of the austenite grains that of each
48
martensite plate can be calculated relative to the sample reference frame in order to
estimate the crystallographic texture, including the effects of variant–selection due
to an externally imposed system of stresses [4, 65-67]. An interesting simplification
is that because martensite plates are confined to the grains in which they grow, it is
not necessary to identify the relative physical locations of individual austenite
grains in order to calculate the texture; the calculations can be done independently
for each austenite grain and then summed to give the overall texture.
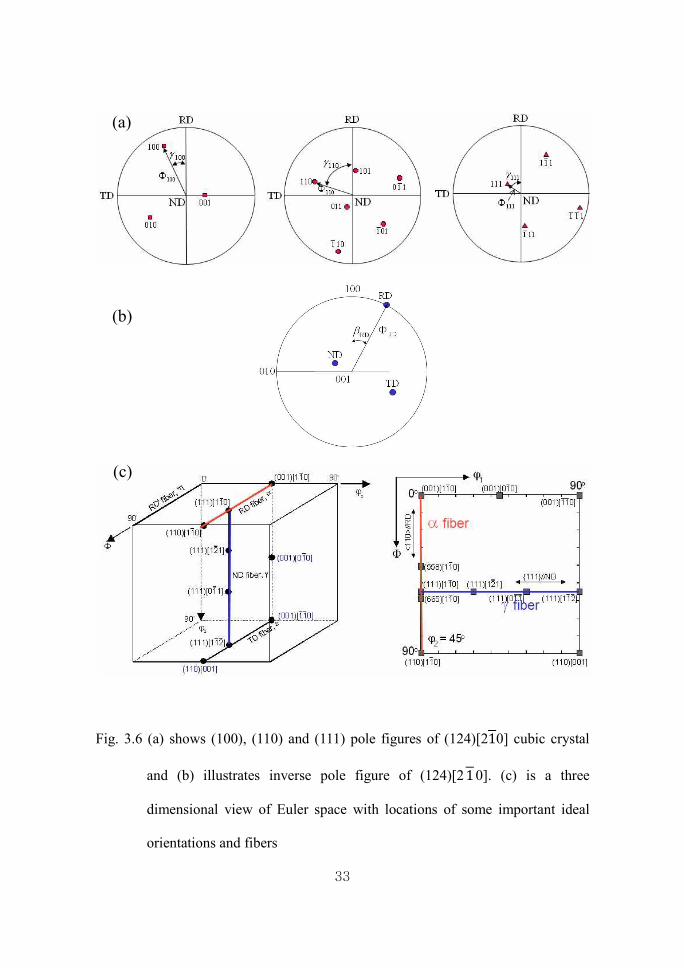
The situation is rather different for transformations which involve the diffusion of
all atoms (allotriomorphic ferrite, pearlite), because the transformation products are
then able to traverse austenite grain boundaries [19, 68] as illustrated in Figure 4.1.
The conventional wisdom is that an allotriomorph (a) will nucleate at an austenite
grain boundary with a low–energy orientation relationship with one of the austenite
(a /g 2) grains and a random orientation with the other grain (a /g 1) with which it
has contact. One side of the allotriomorph will then have a facetted appearance and
the other should exhibit a curved boundary. There is, however, long–standing
evidence to suggest that an allotriomorph may have a low–energy orientation with
both the adjacent austenite grains [28, 30, 69, 70].
These conclusions naturally depend on the degree of deviation from the low–
energy orientation. The purpose of the present work was to examine theoretically
the chances of an allotriomorph simultaneously achieving a low–energy orientation
with both the adjacent austenite grains, as a function of the texture of the original
austenite and the precision with which a low–energy orientation is defined. Unlike

49
martensite, it is necessary in such a model to define the neighbors and orientations
of each austenite grain.
4.2 Calculation method for dual orientation possibility
4.2.1 Methodology for drawing texture
As it mentioned in section 3.2.3, pole figure which is one of the most popular
methods to express macroscopic orientation is a representation of particular planes
in the crystal coordinate with respect to the sample coordinate system using the
stereographic projection. Therefore, orientation of particular variants in crystal can
be represented due to the sample coordinate if we know the geometrical position of
projected pole in RD (rolling direction) – TD (transverse direction) plane. When
crystal is positioned in the center of sphere as illustrated in Figure 4.2 (a), a pole of
certain plane P makes its projection in x-y plane (b). For example, we assume this
x-y plane corresponds to the RD-TD plane and express all possible poles of {111}
planes in positive and negative hemispheres, these poles are projected at 4 points in
RD-TD plane. Supposing the sphere has unit radius, then pole P’ can be expressed
by a unit vector with components [u, v, w]. Due to the similar figure of triangle in
(d), OP’’ is same as 1/ (1+w) and 1/ (1-w) when P’ is in the positive and negative
hemisphere respectively. Thus, P’’ is represented in RD-TD with [u/ (1±w), v/
(1±w)].
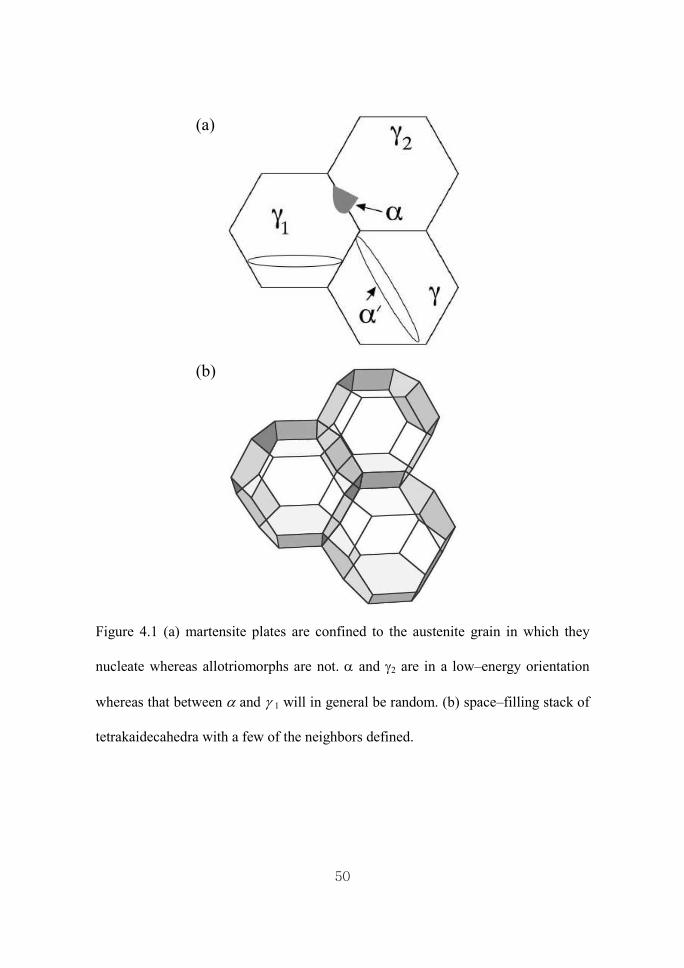
Figure 4.1 (a) martensite plates are confined to the austenite grain in which they
nucleate whereas allotriomorphs are not.
whereas that between a and g 1 will in general be random. (b)
tetrakaidecahedra with a few of the neighbors
(b)
(a)
50
artensite plates are confined to the austenite grain in which they
allotriomorphs are not. a and g2 are in a low–energy orientation
will in general be random. (b) space–filling stack of
the neighbors defined.

Figure 4.2 (a) a pole P’ shows particular plane in crystal and (b) P
of P’ in x-y plane. (c) 4 variants of {111} plane in crystal projected in
RD-TD planes and (d) methods to obtain the geometrical position of P
in RD-TD plane.
(a)
(c)
51
shows particular plane in crystal and (b) P’’ is a projection
y plane. (c) 4 variants of {111} plane in crystal projected in
TD planes and (d) methods to obtain the geometrical position of P’’
(b)
(d)

52
4.2.2 Austenite grain structure
Austenite grains are conveniently represented as a stack of identical, space–filling
Kelvin tetrakaidecahedra [71-75], each of which consists of eight hexagonal and six
square faces, with 36 equal edges, as illustrated in Figure 4.1 (b). For ferrite
nucleation at austenite grain surfaces, there are therefore 14 face–sites per grain.
The computer algorithm was constructed so that for each grain orientation
relative to the sample frame of reference, it was possible to access the orientations
of the fourteen neighboring grains. A total of 1700 austenite grains were created in
this way, with one of the grains having its crystallographic axes exactly parallel to
those of the sample. The relationship between the sample and austenite crystal axes
can be described using Euler angles φ, ϕ and φ. These are the three angles by
which the sample reference frame must be rotated in order to coincide with that of
the crystal. The rotation matrix relating the frames is given by:
− + − − − + (4.1)
To generate a random set of austenite grain orientations, the Euler angles φ
and φ (ranging from 0 to 2π) and the value of (between ±1) were selected
using a random number generator [36]. Non–random austenite textures were
generated relative to the sample axes by setting the first austenite grain to the exact
required texture, and then choosing relative to this grain, random rotation axes but

Figure 4.3 Modeled austenite Cube textures as a function of the limiting value
The (100) pole figures are all plotted relative to the sample axis 53
austenite Cube textures as a function of the limiting value of θ.
The (100) pole figures are all plotted relative to the sample axis ‘S’.
[010]s
[100]s

Figure 4.4 Modeled austenite Goss textures as a function of the limiting value
The (100) pole figures are all plotted relative to the sample axis
45°
25°
5°
54
austenite Goss textures as a function of the limiting value of θ.
The (100) pole figures are all plotted relative to the sample axis ‘S’.
[010]s
[100]s
35°
15°

Figure 4.4 Modeled austenite Copper textures as a function of the limiting value θ. The (100) pole figures are all plotted relative to the sample axis
45°
25°
5°
55
austenite Copper textures as a function of the limiting value of
. The (100) pole figures are all plotted relative to the sample axis ‘S’.
35°
15°
[010]s
[100]s

56
with the right–handed rotation angle limited to the range θ=0~45°[4]; the Goss,
Cube and Copper textures were generated in this way and the effect of the limiting
value of θ is illustrated in Figure 4.3 to Figure 4.5.
4.2.3 Introduction of ferrite texture
In the previous chapter, we could confirm that any grain of martensite or bainite
will always have a strict low energy orientation relationship, (a JLE g) where JLE
marks a low-energy orientation coordinate transformation. It has been assumed
deviation angle between rational orientation such as Kurdjumov Sachs and
irrational orientation seems less than a few degrees, but it has been known to be
essential for displacive transformation due to existence of invariant planes and
directions. As it mentioned in section 3.3, however, the most coherent relationships
even in reconstructive transformations are likely to be irrational perhaps due to the
difference of lattice parameters. We therefore, adopt as the low-energy orientation,
one predicted by the crystallographic theory of martensite in order to ensure this
irrational orientation relationship between a and g:
( γ J α ) = 0.579356 0.542586 0.1025370.014470 0.133650 −0.788984−0.5520000 0.572979 0.086936 (4.1)
Thus, 111 = (0.012886 0.981915 0.978457) (4.2)
(011) = (0.53753 0.706629 0.702048) (4.3)

57
This means that 111 is 0.54° from (011) and very nearly parallel though
not exactly parallel to (011) and 111 is 6.91° from 111. This is close to
the Kurdjumov–Sachs orientation but is irrational and allows for the existence of a
coherent line between the two lattices.
When ferrite was allowed to form on a face between two austenite grains with
relative orientation (g1 J g 2), Figure 4.1 (a), the corresponding orientations with the
ferrite are (g1 J a) and (g2 JLE a) where the latter is the low–energy variant. It
follows that ( γ J α ) = ( γ J γ) γ J α (4.4)
Both the matrices on the right–hand side of this equation are known because the
austenite orientations are set initially and (g2 JLE a) is given by Equation 4.1. Ferrite
was allowed to nucleate on all 14 faces of each austenite grain. The ferrite in all
cases had a low–energy orientation with one austenite grain; since there are 24
crystallographically equivalent such orientations for any given austenite grain, the
selection of the particular variant was made at random from the 24 available. The
possibility that (g1 J a) is close to a low–energy orientation was investigated by
studying its deviation from all 24 variants of (g1 JLE a). This is done by calculating ( γ ΔJ γ ) = ( γ J α) α J γ (4.5)
where (a JLE g1) is the inverse of (g1 JLE a). The axis–angle pair corresponding to ∆J
was calculated; because of the symmetry of the cubic system, for each axis–angle
pair there are 23 crystallographically equivalent sets. The particular set with the

58
lowest angle of rotation (∆) was selected to assess the closeness of the orientation
(g1 J a) to the low–energy case. The case where ferrite grain has an exact low–
energy orientation with one austenite grain, and at the same time an approximately
low–energy orientation (as defined by the maximum permitted deviation ∆ = ∆max)
with the adjacent austenite grain is henceforth referred to as a dual orientation for
convenience. The procedure was repeated for every single ferrite grain and the
resulting transformation texture studied alongside the probability of finding a dual
orientation.
4.3 Calculated ferrite textures
It is important to note that the issue is to find the probability of the dual
orientation phenomenon. The ferrite orientations are therefore studied relative to
those of the austenite grains. In contrast, the texture of the austenite prior to
transformation is defined relative to the sample frame of reference. The orientation
of the austenite texture relative to the sample axes is not relevant to the prediction of
the transformation texture relative to the austenite frame of reference. For this
reason, the results presented in Figure 4.5 and Tables 4.1, 4.2 are almost identical
for all three varieties of austenite texture (Goss, Cube and Copper), any differences
arising because of the stochastic process of generating the initial austenite textures.
It is worth pointing out that in Table 4.1, the percentage of dual orientation is
exceptionally large when ∆max ≥ θ. This is expected since the the misorientations

59
Figure 4.5 Modeled ferrite textures as a function of the limiting value of θ. The
(100) pole figures are all plotted relative to the austenite axis ‘g’.
45°
25°
5°
35°
15°
Exact KS

60
Table 4.1 Calculated percentages of dual orientation as a function of the strength of
the austenite texture (related to the angle θ). The dual orientation is here defined for
all orientations within ∆max =15° of the low energy orientation
Rotation angle, θ Dual orientation possibility (%)
Random Cube Goss Copper
5
15
25
35
45
1.53
100
45.6
20.7
11.4
7.6
100
45.3
21.5
11.4
7.1
100
45.0
21.2
12.2
7.3
Table 4.2 Calculated percentages of dual orientation as a function of the strength of
the austenite texture (related to the angle θ). The dual orientation is here defined for
all orientations within ∆max =5° of the low energy orientation
Rotation angle, θ Dual orientation possibility (%)
Random Cube Goss Copper
5
15
25
35
45
0.05
45.8
7.3
2.8
1.6
0.8
45.3
7.3
2.7
1.7
0.8
45.6
7.3
2.8
1.7
0.8

61
between austenite grains are then smaller than the spread allowed in the definition
of the state of dual orientation. The results are interesting because the chance of
obtaining a dual orientation when the austenite grains are randomly disposed is
found to be negligible. The probability naturally increases as the polycrystalline
aggregate tends towards a stronger texture (lower θ), i.e., towards a single crystal.
It should be emphasized that a value of ∆max as large as 15° is a substantial
deviation from the low–energy orientation and in general cannot be capable of
sustaining an invariant line between the g and a. The same applies to ∆max = 5° so
the concept of dual orientation should not be taken to imply that both sides of the
allotriomorph (i.e., a/ g1 and a/ g2) are capable of developing into displacive
transformation products such as Widmanstätten ferrite [76, 77] as is sometimes
implied [68, 78]. Displacive transformation requires the existence of the invariant–
line. This means that any observation of Widmanstätten ferrite developing from the
deviant a/ g1 side of the allotriomorph will have a low–misorientation boundary
between the Widmanstätten ferrite and allotriomorphic ferrite. Such misorientations
should be detectable using electron backscattered diffraction methods.
In order to decide on the significance of a particular kind of dual orientation
associated with a specific value of ∆max, it is necessary to define a purpose for
calculating or measuring the probability of dual orientations. For example, when
considering the percolation of cracks through the polycrystalline aggregate, it is the
parallelism of cleavage planes in different grains along the crack path that matters.
The angle through which the cleavage plane must deviate in order to arrest or

62
significantly retard its propagation can be used to decide on an appropriate value of
∆max.
4.4 Grain edge and corner nucleation
When ferrite nucleates at austenite grain edges it is in contact with three austenite
grains. Since the assumption is that the ferrite has a low–energy orientation with one
of these austenite grains, the chance of obtaining a dual orientation with at least one
of the remaining two austenite grain doubles. Thus in Table 4.1, all of the
percentages can be doubled to represent edge nucleation. In the case of corner
nucleation, the ferrite grain is in contact with four austenite grains so that the
possibility of dual orientation triples. This means that when ∆max ≥2θ, the chance
becomes 100%, although as emphasized previously, the relevance of a dual
orientation diminishes as ∆max increases relative to the strength of the austenite
texture. Although the activation energy for heterogeneous nucleation decreases in
the order face→edge→corner, the number density of nucleation sites also decreases
in the same order. For this reason, corner nucleation dominates at low undercoolings
below the equilibrium transformation temperature and grain–face nucleation at large
undercoolings [24]. It follows that the chances of obtaining dual orientations are
larger when transformations are carried out at low undercoolings or at very slow
cooling rates during continuous cooling.
63
4.5 Summary
If the concept of dual orientation is taken to imply that exact variants of a strict
low–energy orientation relationship exists between an allotriomorph and more than
one adjacent austenite grain, then the probability of this happening is negligibly
small even in strongly textured austenite. However, if the definition is less exacting
with deviations of 5° or more permitted, then there is a detectable chance of finding
such allotriomorphs. Care must be exercised in setting the level of deviation by
identifying the purpose of the work so that the interpretation of the outcome can be
treated in context. The calculations here do not allow for experimental error in the
determination of orientation relationships, which must add to the chances of falsely
detecting dual orientations. It is suggested therefore that any experimental study of
the dual orientation phenomenon should report the parameters ∆max, θ and the error
of the experimental method used.

64
Chapter 5: New type of Dual Orientation at Special CSL boundaries
5.1 Introduction
An allotriomorph (a) will in general adopt a low-energy orientation relationship
with one of the austenite grains and a random orientation with the other grain with
which it has contact. There is, however, long-standing evidence to suggest that of
the 24 ferrite-orientations possible in a given austenite crystal, that which is
favoured is the one which is able to simultaneously match with both the adjacent
austenite grains [28, 30, 69, 70]. In contrast, probability of the dual orientation has
been demonstrated by calculation as a function of the deviation angle from rational
orientation, ∆max and the strength of austenite texture which is related to the rotation
angle, θ (Chapter 4) that the probability of simultaneous matching is small even
when the parent austenite exhibits macroscopic crystallographic texture.
Ferrite, which is able to achieve a low-energy orientation with both austenite
grains, is said to exhibit a ‘dual orientation’, and such simultaneous matching can
only occur for some of the 24 possible orientations; this then provides a mechanism
for variant selection during phase transformation. Note that there is a certain amount
of subjectivity in claiming the existence of dual orientations because of
experimental error and because it is necessary first to define an acceptable level of
deviation from an ideal low-energy orientation [18]. In the course of some
crystallographic investigations, another phenomenon has been discovered which
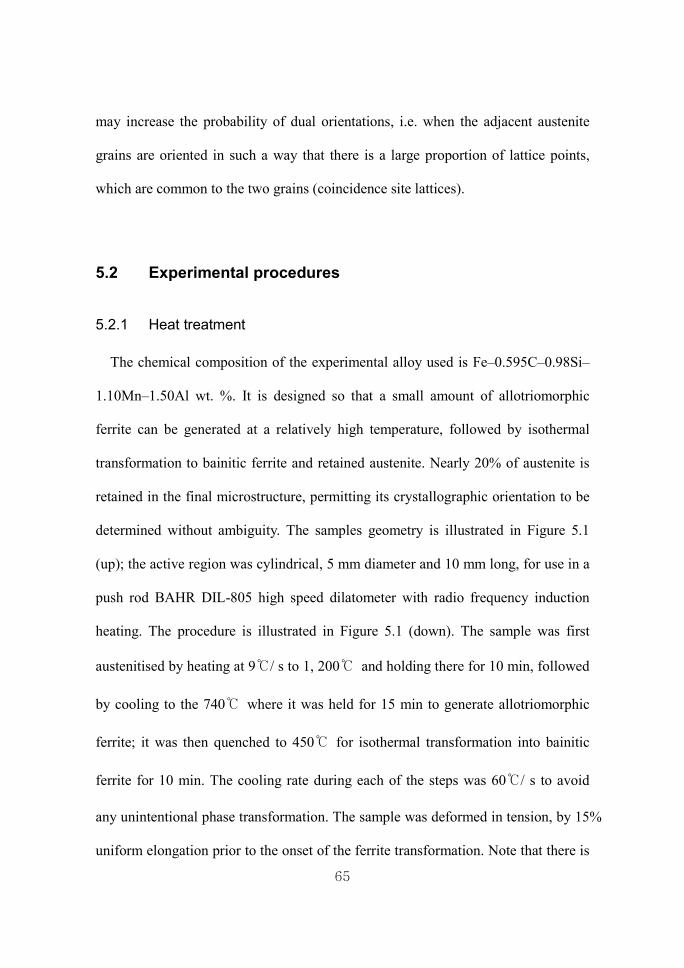
65
may increase the probability of dual orientations, i.e. when the adjacent austenite
grains are oriented in such a way that there is a large proportion of lattice points,
which are common to the two grains (coincidence site lattices).
5.2 Experimental procedures
5.2.1 Heat treatment
The chemical composition of the experimental alloy used is Fe–0.595C–0.98Si–
1.10Mn–1.50Al wt. %. It is designed so that a small amount of allotriomorphic
ferrite can be generated at a relatively high temperature, followed by isothermal
transformation to bainitic ferrite and retained austenite. Nearly 20% of austenite is
retained in the final microstructure, permitting its crystallographic orientation to be
determined without ambiguity. The samples geometry is illustrated in Figure 5.1
(up); the active region was cylindrical, 5 mm diameter and 10 mm long, for use in a
push rod BAHR DIL-805 high speed dilatometer with radio frequency induction
heating. The procedure is illustrated in Figure 5.1 (down). The sample was first
austenitised by heating at 9℃/ s to 1, 200℃ and holding there for 10 min, followed
by cooling to the 740℃ where it was held for 15 min to generate allotriomorphic
ferrite; it was then quenched to 450℃ for isothermal transformation into bainitic
ferrite for 10 min. The cooling rate during each of the steps was 60℃/ s to avoid
any unintentional phase transformation. The sample was deformed in tension, by 15%
uniform elongation prior to the onset of the ferrite transformation. Note that there is

66
a significant time gap between the end of deformation and the beginning of ferrite
formation.
5.2.2 EBSD measurement and accuracy of observations
All samples were etched with 2 vol. % nital solution and areas were identified
using microhardness indents for further examination in a scanning electron
microscope. The surface of the sample is usually deformed during metallographic
preparation, so the indented samples were polished using colloidal silica for 3 min.
The orientations of allotriomorphic ferrite and austenite were measured using
electron back scattered diffraction (EBSD) on a ZEISS SUPRATM scanning
electron microscope.
It is important to comment on the accuracy of the EBSD observations as applied
in the present work so as to avoid over-interpretation of the experimental data.
Figure 5.3 and 5.4 show stereograms where for perfect and very large crystals, each
pole would effectively be a point. However, the retained austenite is in a finely
divided state and that contributes to a broadening of diffracted beams; it also will
contain dislocations generated by the formation of bainite [79] which result in strain
broadening.
Figure 5.3 (a) shows that the angular spread of the individual poles of austenite is
much larger than that of the allotriomorphic ferrite, Figure 5.3 (b), which is
expected since the ferrite is relatively coarse and grows by diffusional
transformation and hence does not inherit the defect structure of the parent phase.

67
The diffraction from the austenite deteriorates further when it is plastically
deformed at 740 ℃, as illustrated in Figure 5.4 (a). We estimate that the poles of
austenite are in fact spread over about 5° and those of ferrite over 2°. These values
indicate the precision of the measurements reported below and any interpretations
must be made in that context.
5.3 Numerical method
Whereas the Kurdjumov–Sachs and Nishiyama–Wasserman type orientations are
frequently quoted as the orientation adopted by allotriomorphic ferrite, the actual
observations usually assume that a {110}a plane is exactly parallel to a {111}g plane.
However, techniques such as conventional electron diffraction and EBSD do not
have sufficient precision to reach this conclusion. The relationship selected here to
represent a low-energy orientation is Kurdjumov–Sachs, simply for the pragmatic
reason that it represents a more general case with 24 crystallographic variants per
austenite grain, whereas the exact Nishiyama–Wasserman relation only results in 12
such variants. Since the actual orientation relation is likely to be irrational, one must
expect 24 variants; the methodology used in this work applies whatever the actual
orientation relationship. A specific variant (say number 1) of the Kurdjumov–Sachs
orientation can be represented by a rotation matrix:
γ J α = 0.741582 −0.66667 0.0749150.649813 0.741582 −0.1666670.166667 0.074915 0.983163 (5.1)
The other i = 2 to 24 variants can be generated by applying the symmetry operations

68
Figure 5.1 The thermo-mechanical procedure for the dilatometric experiments. The
deformation step was in some cases omitted for comparison purposes. Austenite,
allotriomorphic ferrite and bainitic ferrite are represented by the symbols g, a and
ab, respectively. The point ‘a’ marks the beginning of the deformation. The arrow
marks the point where allotriomorphic ferrite begins to form during isothermal
holding at 740 ℃.
10mm
5 mm
4mm
Threads Threads
4mm
g
a
ab
‘a’

69
Figure 5.2 Electron back scattered diffraction (EBSD) on a ZEISS SUPRATM
scanning electron microscope with Field Emission Gun used in the experiments.
Aperture and working distance was set to 120mm and 20mm respectively.
Acceleration voltage was 20kV.

70
Figure 5.3 (a) {110} and {111} poles from grains of undeformed austenite of the
sample illustrated in Figure 5.4. (b) Corresponding {110} pole figure and (c) {111}
pole figure of allotriomorphic ferrite that grows from deformed austenite.
(a)
(c)
(b)
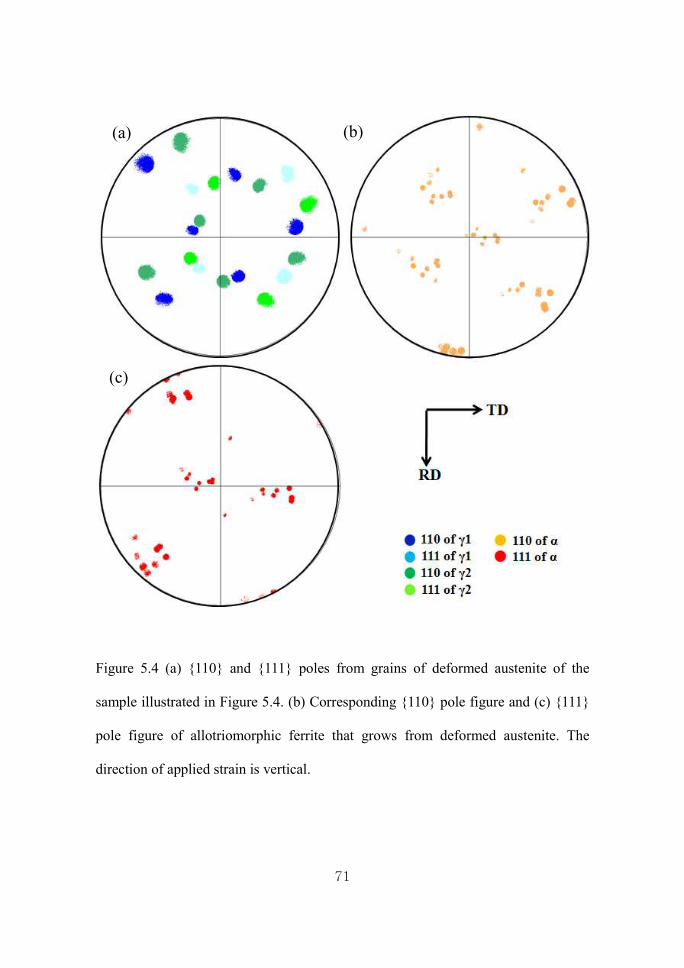
71
Figure 5.4 (a) {110} and {111} poles from grains of deformed austenite of the
sample illustrated in Figure 5.4. (b) Corresponding {110} pole figure and (c) {111}
pole figure of allotriomorphic ferrite that grows from deformed austenite. The
direction of applied strain is vertical.
(a)
(c)
(b)
72
of the cubic lattice. Suppose that the ith variant of ferrite forms at a grain boundary
between two austenite crystals g1 and g2, the given (g1 JiKS a), it follows that ( γ J α ) = ( γ J γ) γ J α (5.2)
where (g1 JiKS a) is the inverse of (a Ji
KS g1) and (g2 J g1) describes how the two
crystals of austenite are related. In order to determine whether the ferrite
simultaneously exhibits a low-energy orientation with both of the austenite grains, it
is necessary to determine how close (g2 J a) is to a Kurdjumov–Sachs orientation.
This can be done by defining a ‘difference’ matrix as follows: (γ ∆J γ) = ( γ J α)α J γ (5.3)
This difference matrix can also be expressed as a right-handed rotation h about a
specific axis of rotation. Because of the symmetry of the cubic system, there are 24
equivalent axis–angle pairs and the one corresponding to the smallest rotation is
chosen here to represent the deviation from an exact Kurdjumov–Sachs orientation.
5.4 Classical type of dual orientation
Figure 5.5 shows four ferrite grains at an austenite grain boundary. It is clear
from the orientation image that each ferrite grain is related only to one of the
adjacent austenite grains, and the data presented in Table 5.1 confirm this. The last
column indicates the ∑ coincidence site lattice (CSL) number for the austenite
grain boundary at which the ferrite nucleates; an absence of a number indicates that
the g/ g orientation does not coincide with a CSL orientation. It is noticeable that the

73
ferrite grains grow as layers along the austenite grain boundaries. One reason for
this is a small nucleation rate, which then allows the few grains that form to develop
along the austenite grain surfaces and these further limits the number density of
ferrite grains. Since the focus of the present work is to look at crystallography, it
would be useful to increase the nucleation rate.
Not surprisingly, Figure 5.7 shows that the overall rate at which allotriomorphic
ferrite forms in a sample, which is deformed prior to transformation, is greater than
one in which the ferrite grows from undeformed austenite. It is well known that
deformation of the austenite increases the nucleation rate at the austenite grain
boundaries. Figure 5.6 shows that this is indeed achieved when the transformation
occurs from deformed austenite, with a relatively large number density of ferrite
grains at the austenite grain boundaries.
The grains have colours in the orientation image, which are similar to those of the
bainite on either side of the grain boundary. Table 5.2 shows that deviation from the
exact Kurdjumov–Sachs orientation is significant but small, an indication that each
ferrite grain attempts to lattice match with both of the adjacent austenite crystals.
Further studies were focused on deformed samples. It is not possible to comment on
the generality of this result without extensive observations, but the possibility of
such matching must increase when the orientation difference between the adjacent
austenite grains is small [18]. It has been pointed out that [30] the small chance of
finding a dual orientation relation may be related to the fact allotriomorphic ferrite
can grow rapidly into surrounding grains with which it is randomly oriented.

74
(a) (b)
Figure 5.5 Transformation in undeformed sample. (a) Phase map with yellow
corresponding to austenite and green to allotriomorphic or bainitic ferrite and (b)
orientation map of scanned area.
25mm
a1
a2
a3
a4

75
(a) (b)
Figure 5.6 Transformation in undeformed sample. (a) Phase map with yellow
corresponding to austenite and green to allotriomorphic or bainitic ferrite and (b)
orientation map of scanned area
25mm
a1 a2 a3 a4 a5 a6
a7 a8
a9
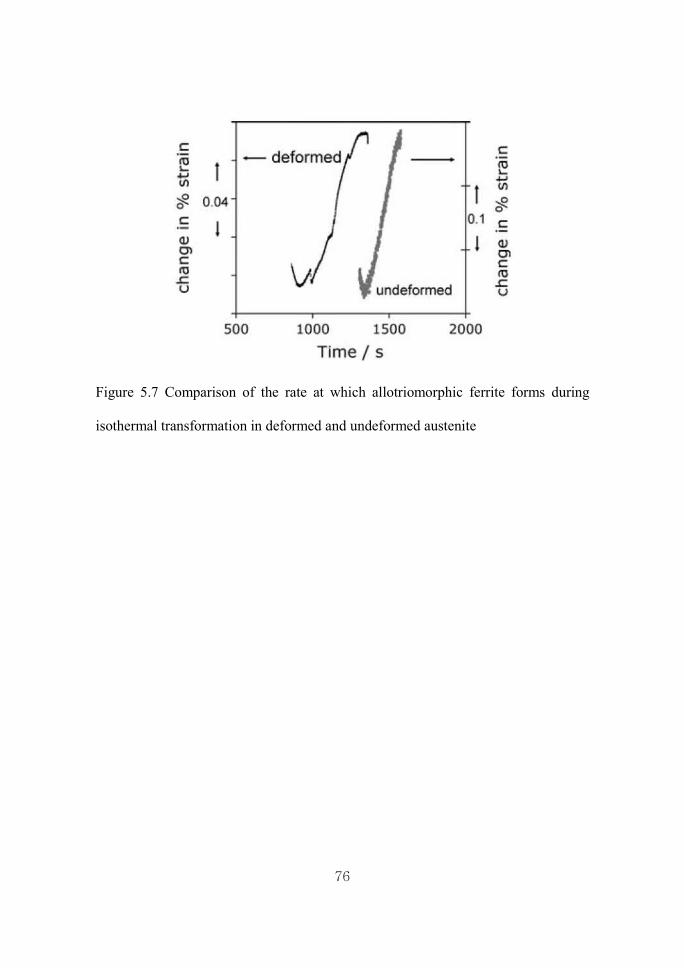
76
Figure 5.7 Comparison of the rate at which allotriomorphic ferrite forms during
isothermal transformation in deformed and undeformed austenite

77
Table 5.1 Deviation from the exact Kurdjumov-Sachs orientation for the ferrite
grains illustrated in Figure 5.5
Ferrite grains
Deviation axis - angle pairs for (g ∆J g) Σ
Adjacent γ 1 Adjacent γ 2
a1 [-0.567, -0.659, -0.493] 1.6° [0.984, 0.085, -0.153] 22.0°
- a2 [-0.696, 0.717, 0.014] 4.5° [-0.034, -0.996, -0.074] 17.0°
a3 [0.087, -0.289, -0.953] 1.3° [-0.743, 0.042, 0.667] 20.4° a4 [0.578, 0.531, 0.618] 30.4° [-0.590, 0.734, 0.331] 2.3° g1 [-0.530, 0.013, -0.848] 37.2
- g2 [-0.530, 0.013, -0.848] 37.2 -
Table 5.2 Deviation from the exact Kurdjumov-Sachs orientation for the ferrite
grains illustrated in Figure 5.6
Ferrite grains
Deviation axis - angle pairs for (g ∆J g) Σ
Adjacent γ 1 Adjacent γ 2
α1 [0.903, -0.221, -0.365] 4.1° [0.956, -0.289, -0.011] 13.8°
-
α2 [0.560, 0.781, -0.272] 10.1° [-0.699, -0.567, 0.434] 5.2° α3 [-0.159, 0.985, 0.061] 14.6° [0.016, 0.972, -0.230] 4.4° α4 [-0.527, 0.821, -0.216] 14.4° [-0.847, 0.289, -0.444] 2.9°
α5 [0.6817, -0.726, 0.086] 18.9° [-0.406, -0.898, -0.165] 4.8°
α6 [0.863, 0.503, 0.042] 12.9° [0.292, 0.934, 0.202] 4.4° α7 [0.010, -0.744, -0.667] 9.9° [0.577, -0.096, 0.810] 10.1° α8 [-0.369, -0.613, -0.697] 4.3° [-0.872, 0.302, -0.383] 10.4° α9 [0.716, -0.671, 0.189] 3.8° [0.958, 0.220, -0.178] 9.6° γ 1 - [-0.444, 0.893, -0.079] 22.4
- γ 2 [-0.444, 0.893, -0.079] 22.4 -

78
However, the greatly increased nucleation rate in deformed austenite confines the
ferrite grains by impingement so that the chance of observing dual orientations is
greatly increased.
5.5 Dual orientation at CSL boundaries
Figure 5.8 shows a large number of equiaxed ferrite grains, the crystallographic
data for which are listed in Table 5.3, classified into three groups. The interesting
feature of the data is that two of the austenite grain boundaries correspond closely to
the ∑ = 3 and ∑ = 11 g/ g orientation. The former of course corresponds to the
highest number density of coincidence points and hence a relatively low interfacial
energy per unit area; it is not surprising therefore that there is an absence of ferrite
grains at the boundary. The first two groups listed in Table 5.3 are grains that have
nucleated at the ∑ = 11 boundary and it is particularly noticeable that most of
these ferrite crystals are able to match fairly well to both of the austenite grains
related across the ∑ = 11 grain boundary. In contrast, the ferrite nucleated at the
general boundary between g3/ g6 do not fit well with the dual orientation concept.
These observations led us to believe that nucleation at austenite grains related by
low ∑ values would be worth investigating theoretically to see whether such g/ g
orientations favour the formation of dual orientation ferrite grains.
5.6 Calculation of dual orientation at some CSL boundaries
Assuming a specific g1/ g2 orientation relationship defined by an exact ∑ value,

79
and ferrite forming with an exact Kurdjumov–Sachs orientation with g1, it was
possible to assess for all 24 variants of ferrite possible in g1 to calculate how far the
ferrite grain deviates from the Kurdjumov–Sachs orientation with g2. The results are
illustrated in Figure 5.8 and show clearly that the propensity for developing dual
orientations is large for ∑ = 11; even when ∆max which means the maximum
deviation permitted from the exact Kurdjumov-Sachs orientation relationship is set
to a low value.
When larger values of ∆max are permitted in the definition of dual orientations,
other ∑ boundaries show significant increases in the ability for ferrite to
simultaneously match both of the adjacent austenite grains (Table 5.4). Notice that ∑ = 3 features as the most favoured for the development of dual orientations, but
the g/ g interfacial energy corresponding to this CSL is very low and hence such
boundaries are relatively ineffective as heterogeneous nucleation sites for ferrite.
What this also emphasizes is that any model for the prediction of transformation
texture, which is based on the selection of variants, which lead to dual orientations,
must at the same time take into account the interfacial energy per unit area of the
austenite grain boundaries available in the microstructure.
Finally, it is worth noting that there is considerable activity in a related field, that
of grain boundary engineering, where efforts are made to introduce a large density
of coincidence site boundaries in order to control the properties of steels [80, 81]. If
such steels transform to allotriomorphic ferrite, then variant selection should play an
exaggerated role in the development of crystallographic texture. Finally, it is worth

80
pointing out that even when the ferrite has a low-energy orientation relationship
with austenite, and it displays the same color in an orientation image as the bainite,
it remains to be proven that these two phases have the same crystallography. This is
because an irrational orientation relation is necessary in the case of a displacive
transformation such as bainite, but not necessarily so for diffusional transformations
such as allotriomorphic ferrite.
5.7 Conclusions
In earlier work in Chapter 4, it was demonstrated that the probability of ferrite
nucleating with good lattice matching with more than one austenite grain with
which it is in contact (dual orientations), is small. This conclusion was not changed
significantly by introducing common macroscopically defined crystallographic
textures into the austenite (for example, Goss, Cube etc.). However, the
macroscopic texture descriptions of the kind considered do not uniquely reflect the
orientations between adjacent austenite grains as described, for example, by the
coincidence site lattice. It is found in the present work that certain coincidence site
lattices favour the development dual orientations. This has been verified both
experimentally and theoretically and may explain early work where the probability
of observing dual orientations was noted to be significant. It also appears that the
chance of observing dual orientations increases when transformation occurs from
deformed austenite since the associated high rate of nucleation prevents the spread
of allotriomorphic ferrite. It would be useful in future work to build up a three-

81
dimensional picture of the crystallography, one which includes the indices of the
grain boundary plane. This could be done using serial sectioning based on focused
ion beam machining.

Figure 5.8 Transformation in sample of same condition with Figure 5.6. (a) phase
map with yellow corresponding to austenite and green to allotriomorphic or bainitic
ferrite, and (b) orientation map, (c) image quality map of scanned area.
γ1
γ2
γ3
γ4
γ6
γ5
a1
(a)
(c)
a2 a3
a4 a5 a6 a7 a8
a15
a9~a14
82
Transformation in sample of same condition with Figure 5.6. (a) phase
map with yellow corresponding to austenite and green to allotriomorphic or bainitic
ferrite, and (b) orientation map, (c) image quality map of scanned area.
Grain boundaries
Σ=11 boundaries
Σ=3 boundaries
(b)

83
Table 5.3 Deviation from the exact Kurdjumov-Sachs orientation for the ferrite
grains illustrated in Figure 5.8. Notice that the axis-angle pairs relating g1/ g2 and g2/
g4 correspond quite closely to that expected from ∑ = 11 at a 50.5° about <011>
Group 1
Deviation axis - angle pairs for (g ∆J g) Σ
With respect to γ1 With respect to γ3
α1 α2 α3 α4 α5 γ 1 γ 3
[0.903, -0.221, -0.365] [0.843, 0.138, -0.519] [-0.048, -0.989, 0.133] [0.028, -0.713, -0.700] [0.742, -0.334, -0.580]
- [0.004, 0.745, 0.667]
4.1° 4.8° 3.9° 4.9° 1.9°
47.4°
[0.206, -0.866, 0.454] [0.618, -0.749, 0.234] [-0.851, 0.497, 0.165]
[-0.047, -0.697, -0.714] [-0.285, 0.925, -0.249] [0.004, 0.745, 0.667]
-
3.1° 2.5° 4.6° 6.8° 4.2°
47.4°
11 11
Group 2
Deviation axis - angle pairs for (g ∆J g) Σ
With respect to γ2 With respect to γ4
α6
α7
α8
α9
α10
α11
α12
α13
α14
α15
γ 2
γ 4
[0.643, 0.752, -0.154]
[0.410, -0.911, -0.001]
[-0.112, -0.278, -0.953]
[0.748, 0.662, 0.032]
[-0.450, 0.438, -0.777]
[0.917, 0.094, 0.386]
[-0.908, 0.285, 0.304]
[-0.300, -0.679, -0.669]
[-0.992, 0.095, 0.073]
[0.712, -0.564, 0.416]
-
[-0.059, 0.699, -0.713]
11.2°
7.8°
4.6°
5.4°
5.3
27.3°°
5.5°
7.3°
5.2°
8.5°
50.3°
[0.507, -0.856, 0.097]
[-0.442, 0.680, 0.583]
[0.319, 0.926, -0.197]
[0.286, 0.306, -0.907]
[-0.259, 0.275, -0.925]
[-0.827, -0.365, 0.426]
[-0.739, 0.656, -0.147]
[0.935, -0.343, 0.084]
[-0.752, 0.425, 0.501]
[0.585, 0.511, 0.629]
[-0.059, 0.699, -0.713]
-
30.9°
3.4°
5.1°
2.9°
17.6°
5.4°
20.3°
9.6°
19.4°
10.3°
50.3°
11
11

84
Group 3
Deviation axis - angle pairs for (g ∆J g) Σ
With respect to γ3 With respect to γ6
α16
α17
α18
α19
α20
α21
α22
α23
γ 3
γ 6
[0.968, 0.205, 0.139]
[0.097, -0.928, 0.359]
[-0.947, -0.302, -0.101]
[0.988, 0.053, -0.138]
[0.167, 0.540, -0.824]
[-0.282, 0.835, -0.470]
[0.879, -0.240, 0.411]
[0.032, -0.845, -0.532]
-
[0.809, 0.498, 0312]
1.6°
12.3°
25.5°
22.5°
5.2°
3.8°
2.9°
16.3°
31.2 °
[0.824, -0.018, 0.565]
[-0.292, -0.715, -0.635]
[-0.850, 0.473, -0.229]
[-0.634, -0.659, -0.404]
[-0.107, -0.986, 0.123]
[0.121, -0.991, 0.041]
[-0.698, 0.621, 0.354]
[0.476, 0.214, -0.852]
[0.809, 0.498, 0312]
-
24.1°
5.6°
3.4°
1.8°
12.4°
8.0°
13.4°
4.9°
31.2 °
-
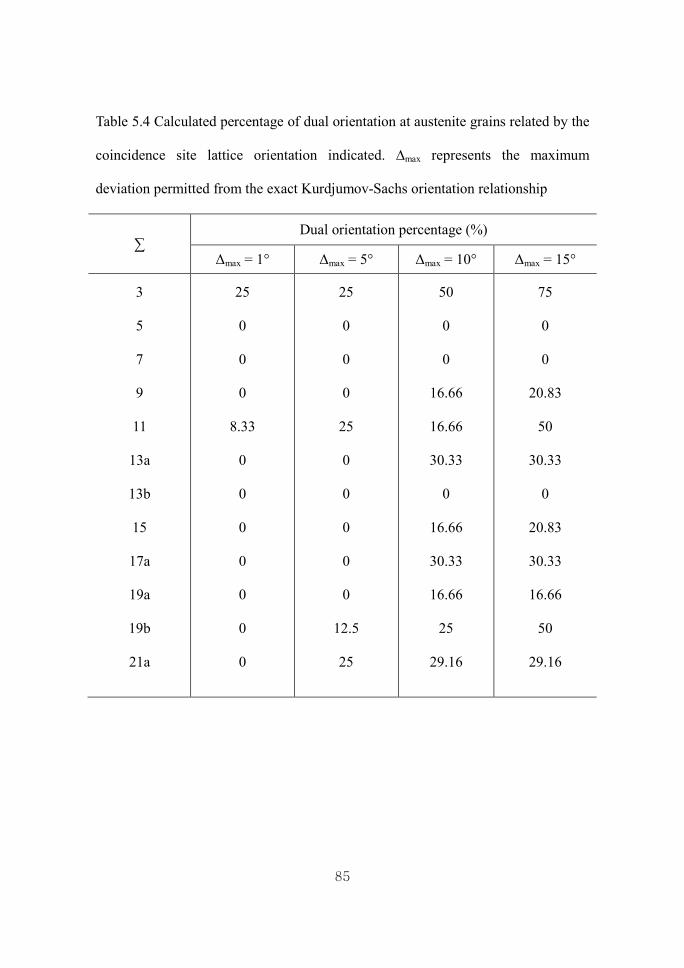
85
Table 5.4 Calculated percentage of dual orientation at austenite grains related by the
coincidence site lattice orientation indicated. ∆max represents the maximum
deviation permitted from the exact Kurdjumov-Sachs orientation relationship
∑ Dual orientation percentage (%)
Δmax = 1° Δmax = 5° Δmax = 10° Δmax = 15°
3
5
7
9
11
13a
13b
15
17a
19a
19b
21a
25
0
0
0
8.33
0
0
0
0
0
0
0
25
0
0
0
25
0
0
0
0
0
12.5
25
50
0
0
16.66
16.66
30.33
0
16.66
30.33
16.66
25
29.16
75
0
0
20.83
50
30.33
0
20.83
30.33
16.66
50
29.16

86
Chapter 6 Selective Grain Growth Phenomenon and Variant Selection
6.1 Introduction
The influence of interfacial and strain energy on the activation energy for
nucleation varies with transformation mechanism [40]. For displacive
transformations, the product phase always has a coherent or semi-coherent interface
with the parent phase but the transformation is accompanied by a large shape
deformation, which so that strain energy dominates nucleation. On the other hand,
diffusional nucleation and growth at relatively high temperatures, as in
allotriomorphic ferrite formation relaxes strains so that interfacial energy dominates
the process.
It was confirmed in section 3.4 that variant selection is related to both interfacial
and strain energies accompanying the transformation. For displacive transformation,
variant selection is dominated by an interaction between shape strain and external
stress or strain [4, 5, 9, 45, 48, 82]. Interfacial energy as a function of the
crystallographic orientation of parent and product phases seems to control variant
selection in the case of reconstructive transformations. However, as it mentioned in
section 3.5, the suggestion by Lee and Aaronson [15, 16] based on interfacial energy
minimization has been consistent with variant selection only in limited
circumstances.
Their interpretation on variant selection based on interfacial energy assumes

87
intrinsically that the orientations of precipitates are determined at nucleation stage,
and does not change during the growth. However, when precipitates evolve at the
grain boundaries of the deformed parent phase, their growth can be affected by the
difference in stored energy between adjacent parent phase grains as well as the
characteristics of interface. It follows that a consideration of the crystallography in
terms of growth as well as nucleation may reveal the true mechanism for diffusional
transformations.
In this chapter, the effect of transformation from deformed austenite on the
selection of variants of ferrite has been investigated. The effect of stored energy
differences in influencing these phenomena is revealed.
6.2 Experimental procedures
6.2.1 Heat treatment
The chemical composition of alloy used this experiments is Fe-0.595C-0.98Si-
1.10Mn-1.50Al wt. % for heat treatment on a deformation dilatometer. Cylindrical
samples 5 mm in diameter and 10 mm in length were heated at 9 ℃/s to 1200℃
and held for 10 min., followed by cooling to the 740℃ with -70 ℃/s to hold for 15
min. to form allotriomorphic ferrite. If necessary, approximately 30 % compressive
strain was applied after cooling to 740℃ before ferrite formation starts. The sample
was then quenched to 425℃ and austempered for 10 min. followed by cooling to
ambient temperature. The fraction of retained austenite was about 20% due to the

88
suppression of cementite by Si and Al. The contents enable the direct analysis of
orientation relationship between austenite and ferrite. Figure 6.1 (a) shows the heat-
treatment path and corresponding dilatation strains.
6.2.2 EBSD measurement
Samples were polished using the standard specimen preparation method and
etched with 2 vol. % nital solution for analysis using optical microscope. Specific
areas for EBSD mapping was marked with micro-indentation. Then the surface of
samples were polished again with colloidal silica for 3 min. Crystallographic
orientations of austenite and ferrite were measured using electron back scattered
diffraction (EBSD) on a ZEISS SUPRATM scanning electron microscope. Step size
for orientation mapping was 0.05 μm.
6.2.3 Evaluation of stored energy in deformed austenite grains
The pattern quality (or image quality) of the orientation map can be a measure of
the stored energy because it is associated with the density of defects such as
dislocations [83] , but it is also affected by the sample preparation method or by
lattice distortion during bainitic and martensitic transformation. Another method to
evaluate the stored energy is utilizing the average dislocation density from
following relationship with maximum flow stress [84]:
= (6. 1)
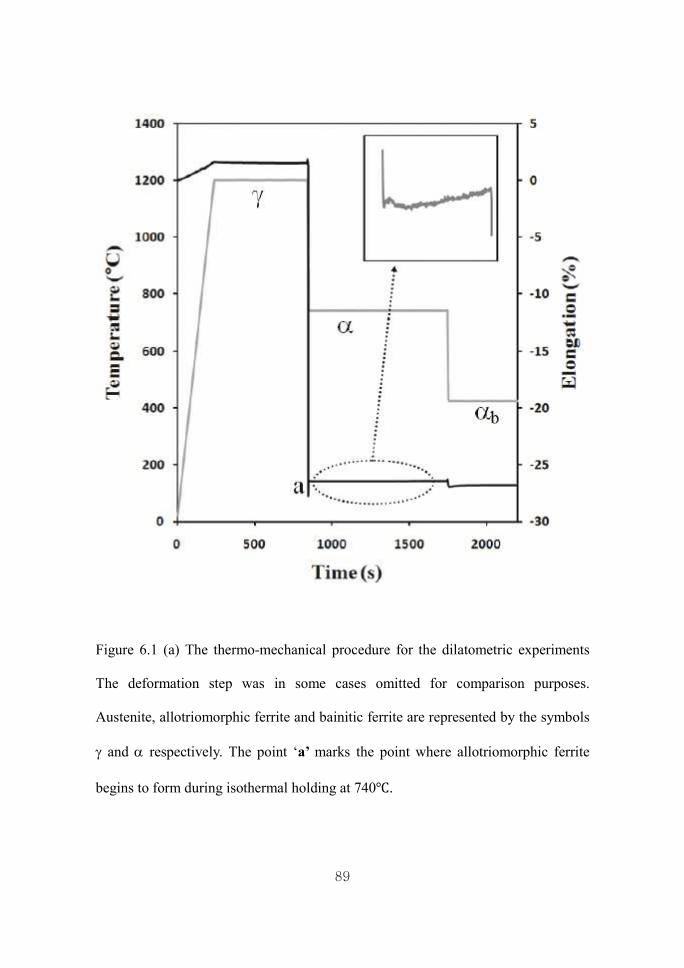
89
Figure 6.1 (a) The thermo-mechanical procedure for the dilatometric experiments
The deformation step was in some cases omitted for comparison purposes.
Austenite, allotriomorphic ferrite and bainitic ferrite are represented by the symbols
g and a respectively. The point ‘a’ marks the point where allotriomorphic ferrite
begins to form during isothermal holding at 740℃.

90
Figure 6.1 (b) The flow curve for 30% compressive deformation step corresponding
to (a) at 740℃. The maximum flow stress was evaluated as about 220MPa.

91
where is a constant to be 0.15, M is taken as 3.11 for mean Taylor factor. The
maximum flow stress was evaluated as 220MPa during 30% compressive
deformation at 740℃ (Figure 6.1 (b)). is a temperature dependent shear
modulus:
= 1 + − 300 ∙ ∙ (6. 2)
In austenite, =1810 K, ∙ = -0.91 and =8.1×10¹⁰ Jm. Since the
energy per unit length of dislocation line is approximately equal to 0.5, the
stored energy per unit volume due to the new dislocations introduced by the plastic
deformation can be expressed as:
= 0.5( − ) (6. 3)
where is about 1012 m for fully recrystallized austenite and b is 2.5×10¹⁰ m
for the magnitude of Burgers vector. The Taylor factor is usually mentioned as the
slip resistance or the sum of shears required attaining a given deformation. So, a
higher Taylor factor indicates a greater plasticity and hence dislocation density
inside the grain [85-87]. With these assumptions the stored energy is proportional to
the Taylor factor and can be evaluated as follows:
= (6. 4)
where is Taylor factor for grain j having grain orientation and is the
mean Taylor factor value of the aggregate.

92
6.3 Orientation of allotriomorphic ferrite to adjacent austenite
grains
6.3.1 Undeformed sample
Figure 6.2 shows phase and orientation maps of ferrite formed at a grain boundary.
Without prior deformation of austenite, the allotriomorphic ferrite has a layer-like
morphology when the driving force for nucleation is small, as shown in Figure 6.2.
The orientation relationship between austenite and ferrite is summarized in Table 1.
It gives a representative behavior that ferrite has an orientation relationship with one
of adjacent austenite grains. Figure 6.3 (a) shows the trace of the grain boundary
plane and {111}g, {110}g poles together with the {111}g plane which is most parallel
to the grain boundary, marked as a circle. According to Lee et al., as the close-
packed plane in the austenite becomes parallel to the grain boundary plane, the
activation energy for nucleation of ferrite is reduced. Table 6.1 indicates that all
ferrite grains have an orientation relationship with the g2 grain which has {111}
plane closest to the grain boundary plane, which agrees well with Lee et al [51-54].
This kind selection of variant is known to be sensitive to the curvature of boundary
plane, but above results confirm that the orientation relationship between ferrite and
austenite is dominated by orientation of grain boundary plane and thus the
interfacial energy between ferrite and austenite.

93
Figure 6.2 Transformation in un-deformed sample. (a) phase map with blue
corresponding to the austenite and white to allotriomorphic ferrite or bainitic ferrite,
and (b) orientation map.

Table 6.1 Deviation from the exact Kurdjumov
grains illustrated in Figure 6.2
94
Deviation from the exact Kurdjumov-Sachs orientation for the ferrite

95
Figure 6.3 (a) {110} and {111} pole figure from two adjacent austenite grains of un-
deformed sample illustrated in Figure 6.2. (b) {110} pole figure and (c) {111} pole
figure from ferrite nucleated at boundaries. The trace of grain boundary plane
indicates the locus of grain boundary plane normal.

96
6.3.2 Deformed sample: nucleation at high energy boundaries
Figure 6.4 represents EBSD mapping around ferrite grains nucleated at a grain
boundary in deformed austenite. The stored energy in austenite is evaluated with
Equation 6.4. Both austenite grains in Figure 6.4 has similar stored energy of 20
Jmol and Figure 6.5 (a) indicates that the {111} plane of g1 grain is almost
parallel to the grain boundary plane. In this case, all ferrite grains in grain boundary
have KS orientation relationship with g1 grain as shown in Table 6.2. This confirms
that the crystallographic variant is controlled by the interfacial energy. Another
EBSD mapping in the vicinity of ferrite grains is given in Figure 6.6. The stored
energy of deformed austenite grain is evaluated to be 27 Jmol and 19 Jmol
for g1 and g2 grains, respectively. From the grain boundary plane and {111} plane of
adjacent austenite grain in Figure 6.7 (a), it is presumed that ferrite prefer to have an
orientation relationship with g1 grain which has closest parallel {111} plane to the
grain boundary plane. But surprisingly, 13 of 15 ferrite grains have an orientation
relationship with g2 (Table 6.3). This contradicts what is expected from the
minimization of interfacial energy, which would favour low-energy orientation
relationship with g1.
From the analysis of orientation relationship in Figures 6.2 to 6.6, it is notable
that the interfacial energy has a substantial effect on the orientation characteristics
of ferrite unless there are large differences in stored energy of adjacent austenite
grains. Given much a difference, it may be favorable for ferrite to grow in the
austenite grain with higher stored energy if interface characteristics at both sides are

97
equivalent. Generally, ferrite in grain boundary has a semi-coherent interface with
one of adjacent austenite grain representing the orientation relationship and
incoherent interface with the other austenite grain.
The movement of incoherent interface is faster than semi-coherent one. As shown
in Figure 6.8, let us assume two ferrite grains (am and an) growing into austenite
grain (gm and gm). Since am and an has incoherent interface with gm and gn,
respectively, faster growth direction of am is toward gm and an is toward gn. Then, if
the difference in stored energy of gm and gn is large enough to make the growth of
am overwhelm that of an, eventually the am will block an.
In this case, the apparent orientation of ferrite grain will dominated by the
difference in relative growth rate rather than the contribution from interfacial energy.
For instance, ferrite grain of a8 in Figure 6.6 has an orientation relationship with g1,
which will give it advantage in interfacial energy; however, it is surrounded by large
ferrite grains due to the sluggish growth. It may be attributed to the slower growth
of a8 into the g2 which has lower stored energy than g1 into which other ferrite
grains grow. Furthermore, it is noted that 13 of 15 ferrite grains in Figure 6.6 have
orientation relationship with g2 austenite, which allow them to grow into the g1
austenite that has higher stored energy and thus possibly provides faster growth
kinetics.
Figure 6.9 shows the influence of stored energy difference between adjacent
austenite grains on the deviation angle from low energy orientation relationship,
which verifies more clearly that local variant selection in deformed sample is

98
determined by growth control when stored energy is big enough. Since g1 has close
packed plane whose (111) plane is closest to the grain boundary plane and grain
boundary plane normal pole is far away from (111) variant of g2, ferrite should have
low energy orientation relationship with g1. Irrational orientation relationship
between ferrite and austenite showed very small deviation angles from (a JLE g1) but
huge deviations from (a JLE g2) when stored energy difference were negligible.
However, ferrite shows low energy orientation relationship with g1 whose stored
energy is smaller than g2 when energy difference is more than 10 J/mol and it
corresponds to experimental results in black and gray colored ellipsoidal regions in
the figure 6.9. It was also possible to observe the shifting of these two different
tendencies when stored energy differences are 5 J/mol and 7 J/mol therefore, ferrite
had low energy orientation relationship with g1 as well as g1. Consequently, we can
see from these results that local variant selection during diffusional transformation
is determined by growth selection when stored energy difference between two
adjacent austenite grains is big enough and controlled by nucleation selection when
there was no stored energy difference (ferrite nucleation in un-deformed austenite)
or energy difference is very small.
The Lee et al. model involves ‘nucleation selection’, whereas the present work
also indicates growth selection whose transformation occurs from heterogeneously
deformed austenite.

99
Figure 6.4 Transformation of ferrite nucleated at high angle boundaries when
calculated stored energy of 1 and 2 are almost same as 20 Jmol (a) image quality
map, (b) phase map with blue corresponding to the austenite and white to
allotriomorphic ferrite or bainitic ferrite, (c) orientation map and (d) Taylor factor
map.
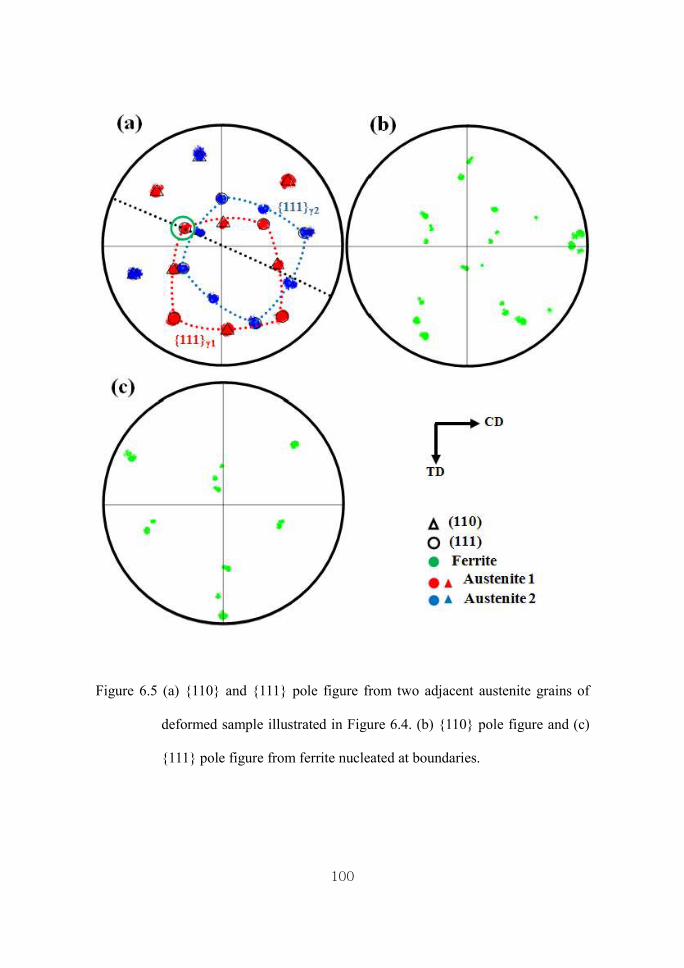
100
Figure 6.5 (a) {110} and {111} pole figure from two adjacent austenite grains of
deformed sample illustrated in Figure 6.4. (b) {110} pole figure and (c)
{111} pole figure from ferrite nucleated at boundaries.

101
Figure 6.6 Transformation of ferrite nucleated at high angle boundaries when
calculated stored energy of 1 and 2 are 27 Jmol and 19 Jmol respectively. (a)
image quality map, (b) phase map with blue corresponding to the austenite and
white to allotriomorphic ferrite or bainitic ferrite, (c) orientation map and (d) Taylor
factor map.

102
Figure 6.7 (a) {110} and {111} pole figure from two adjacent austenite grains of
deformed sample illustrated in Figure 6.6. (b) {110} pole figure and (c)
{111} pole figure from ferrite nucleated at boundaries.
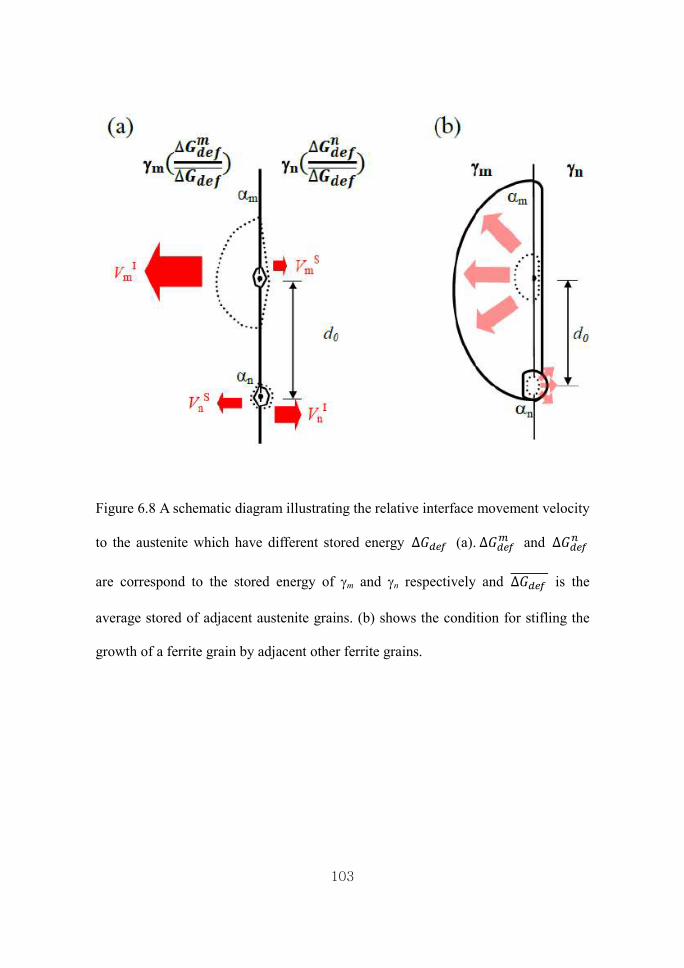
103
Figure 6.8 A schematic diagram illustrating the relative interface movement velocity
to the austenite which have different stored energy ∆ (a). ∆ and ∆
are correspond to the stored energy of gm and gn respectively and ∆ is the
average stored of adjacent austenite grains. (b) shows the condition for stifling the
growth of a ferrite grain by adjacent other ferrite grains.

104
Figure 6.9 The deviation angles from Kurdjumov-Sachs orientation relationship
with various stored energy difference between adjacent two austenite grains, g1 and
g2.

105
6.3.3 Deformed sample: nucleation at twin boundaries
When grain boundary nucleated ferrite has an orientation relationship with both
adjacent austenite grains, it is said to possess ‘dual orientation’ and g/ a interfaces
on both sides tend to be semi-coherent. Since dual-orientated ferrite can minimize
the interfacial energy compared with the ferrite having orientation relationship with
one of the austenite grains, the nucleation of dual oriented ferrite is energetically
favorable. However, the chance for ferrite to have dual-orientation is strongly
dependent on the orientation of adjacent austenite grains. It was shown in the
previous Chapter 5 that the possibility of dual orientation can be increased when
neighboring austenite grains have certain CSL orientation relationship such as Σ
=11 or Σ=3. Both semi-coherent interface of dual oriented ferrite will have similar
interface velocity, which is slower than that of incoherent interface.
Figure 6.10 shows an EBSD map of ferrite nucleated at a twin boundary. Ferrite
group 1 and group 2 show the grains nucleated at g1/ g2 and g2/ g3 boundaries. Group
A and B correspond to the marked regions A and B respectively in Figure 6.10 (c)
and Figure 6.11 (a) and (b) represent the details. Ferrite grains which belong to the
same group show a similar morphology as well as crystallographic orientation. The
twin boundary trace and {111}g, {110}g poles in Figure 6.12 indicate that both
austenite grains have {111}g plane nearly parallel to grain boundary plane, which
permits the dual orientation of ferrite. Even for ferrite nucleated between austenite
grains having different stored energies by deformation, dual orientation is still
preferred. Figure 6.13 shows ferrite grains formed at a twin boundary where the

106
stored energy of adjacent austenite grains g1 and g2 is 26 Jmol and 18 Jmol,
respectively. Figure 6.14 shows that one can find {111}g plane in both adjacent
austenite grain almost parallel to the grain boundary plane, which enables ferrite to
have dual orientation with both austenite. In this case, it is difficult to observe the
effect of stored energy on orientation characteristics of ferrite because the interfaces
between austenite and ferrite in both sides possibly have semi-coherent boundary,
therefore a difference in migrating velocity is difficult to expect.
Meanwhile, Figure 6.15 shows ferrite formed in austenite boundary and its
surroundings. The orientation of both austenite grains in Table 6.4 indicates they are
twin-related. But the {111}g poles in austenite and the locus of grain boundary plane
in Figure 6.16 show that the grain boundary plane is not parallel to twin plane. This
means that the ferrite forms in incoherent twin boundary and thus has difficulty to
have the dual orientation. One of {111}g planes of g2 grain is approximately parallel
to the trace of the boundary plane, which implies that ferrite having orientation
relationship with g2 will be favorable with respect to the interfacial energy. However,
Table 6.4 indicates that most of ferrite grains have KS relationship with g1 grain. It
is noted that the stored energy of g1 and g2 grains by deformation is evaluated to be
18 Jmol and 28 Jmol. This suggests that ferrite grains having incoherent
interface with g2 grain can have beneficial effect in growth from the difference in
stored energy. The other side of g/ a interface of that ferrite is likely to be semi-
coherent interface representing the orientation relationship. The orientation
characteristics of ferrite in Figure 6.15 reflects growth controlled orientation

107
characteristics of ferrite can occurs at incoherent twin boundary as well as general
high angle boundary provided that sufficient difference in stored energy between
adjacent austenite grain is given. Figure 6.17 summarizes analysis results on the
orientation characteristics of ferrite which forms along austenite grain boundary.
6.4 A Model for growth control
Growth controlled orientation characteristics of ferrite is analogous to the strain-
induced selective grain growth during recrystallization in steels in the context of
anisotropic growth of product phase [88-90]. However, since the structural
transformation is a different process from recrystallization, a separate analysis is
necessary to examine quantitatively the effect of anisotropic growth of ferrite on the
orientation characteristics. In this section, a simple model is proposed for growth
controlling by taking into account the g/ a interface migration velocity as a function
of stored energy in austenite and calculating a critical time for fast growing grain to
block the growth of other grain.
6.4.1 Representation of interface velocity
During the growth of ferrite, the movement of a/g interfaces is represented as [91] : = ∆ + ∆ (6. 5)
where ∆ is the chemical driving force and interface-controlled growth is
implicitly assumed. M is the interface mobility expressed as follows:

108
Figure 6.10 Transformation of ferrite nucleated at twin angle boundaries when
calculated stored energy of g1 and g2 are 22 Jmol and 21 Jmol respectively. (a)
image quality map, (b) phase map with blue corresponding to the austenite and
white to allotriomorphic ferrite or bainitic ferrite, (c) orientation map and (d) Taylor
factor map.

109
Figure 6.11 Orientation map of magnified area. (a) and (b) corresponds to the
section A and B respectively in Figure 6.9 (c).

110
Figure 6.12 (a) {110} and {111} pole figure from two adjacent austenite grains of
deformed sample illustrated in Figure 6.10. (b) and (c) are {110} and {111} pole
figure from ferrite in section A and section B respectively. Notice that the
orientation of 1 and 3 are almost same.

111
Figure 6.13 Transformation of ferrite nucleated at twin angle boundaries when
calculated stored energy of 1 and 2 are 26 Jmol and 18 Jmol respectively. (a)
image quality map, (b) phase map with blue corresponding to the austenite and
white to allotriomorphic ferrite or bainitic ferrite, (c) orientation map and (d) Taylor
factor map.

112
Figure 6.14 {110} and {111} pole figure from two adjacent austenite grains of
deformed sample illustrated in Figure 6.12. (b) {110} and {111} pole figure of
ferrite.

113
Figure 6.15 Transformation of ferrite nucleated at incoherent twin angle boundaries
when calculated stored energy of g1 and g2 are 18 Jmol and 28 Jmol
respectively. (a) image quality map, (b) phase map with blue corresponding to the
austenite and white to allotriomorphic ferrite or bainitic ferrite, (c) orientation map
and (d) Taylor factor map.

114
Figure 6.16 (a) {110} and {111} pole figure from two adjacent austenite grains of
deformed sample illustrated in Figure 6.14. (b) {110} pole figure and (c) {111} pole
figure from ferrite nucleated at boundaries.
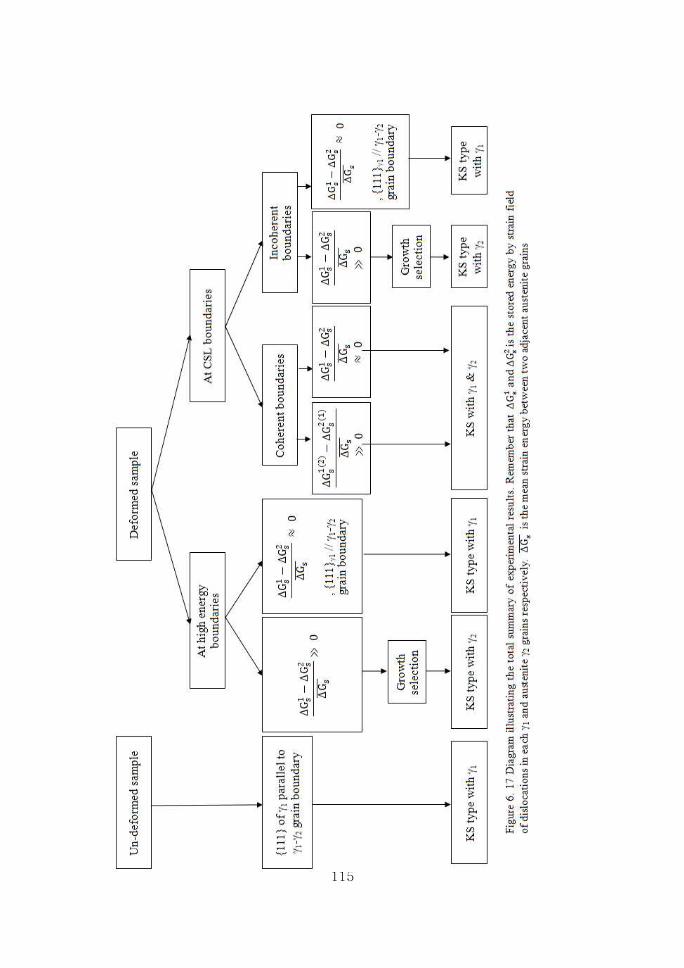
115

116
= exp − (6. 6)
Here, is pre-exponent and is the activation energy for migration of iron
tom across the interface. Combining 6.5 and 6.6 will give the interface velocity as:
= exp − ∆ + ∆ (6. 7)
∆ is a combination of a intrinsic stored energy during deformation(negative
value) and a plastic lattice misfit strain energy (positive value). If there is 0.6%
misfit during ferrite transformation at 700℃, elastic strain energy is calculated as
about 10 MJm [92]. Since ideal plastic strain energy is around a tenth of elastic
strain energy [93, 94], the total plastic strain energy during deformation is close to 1
MJm. Considering the normal intrinsic stored energy in heavily worked austenite
is about 180 J/mol (25 MJm), plastic strain energy by lattice misfit can be
negligible so, only intrinsic stored energy was regarded as total deformation energy.
The pre-exponential factor M0 is reported to be around 58 and 29 mm mol J s
for incoherent and semi-coherent interfaces [91, 95] respectively. is known to
be about 140 kJ/mol for the incoherent boundary [96, 97] but there are few available
values for the semi-coherent interface. Recently, Santofimia et al [98] reported that
180 kJ/mol for the semi-coherent boundary showed a good agreement with
experimental results in calculating the phase fraction. So the same value is assumed
here.

117
6.4.2 A condition for growth controlling
The growth controlling of orientation characteristics of ferrite in Figure 6.8
suggests a possibility that the growth of an can be blocked by am which has faster
growth kinetics due to the difference in stored energy of adjacent austenite grains.
As shown in Figure 6.8 (b), assuming d0 is a distance between two ferrite nuclei, the
critical time (tc) for faster growing am to successfully block its neighbor will be
given as: ( − ) ≥ (6. 8)
The number of precipitates per unit area of grain boundary can be calculated from
the nucleation rate per unit area boundary and time for nucleation. = (6. 9)
For t=1s (site saturation of ferrite nuclei was over within 1s), is:
= 1 (6. 10)
According to the classical approach to the nucleation rate explained on section 2.3, I
per unit area of boundary can be expressed as follows:
= ℎ exp − ∗ + (6.11)
where is a site factor representing the density of nucleation sites per unit area of
boundary, which is given by:
= 1 2δ (6.12)

118
where δ means atomic spacing and taken as 2.5×10⁻¹⁰m [29]. is a factor
expressing the fraction of the total number of face sites set as 6.9×10⁻⁸ and is a
shape factor affecting the g/ a interface boundary energy per unit area taken as
2.6×10⁻³. Q is an activation energy for self diffusion of iron, 240 kJ/mol [25]. The
critical free energy barrier, ∗, is given by:
∗ = 163∆ + ∆ (6.13)
Here, is interfacial energy which is supposed to be 0.992 J/m2 [99] for
incoherent boundary and 0.03 Jm for a semi-coherent interface [91]. The molar
chemical driving force ∆ represented in figure. 2.3 was calculated as -209
Jmol by using MatCalc software package [100] when Ae3 temperature is 835℃.
Combining Equation 6.10 to 6.13 will bring the critical time which is necessary, as
mentioned for ferrite which has faster growth kinetics to obstruct the neighboring
ferrite grains. The change of the critical time will describe a relative possibility of
growth controlling depending on the difference in stored energy of adjacent
austenite grains or the grain boundary characteristics of austenite.
6.5 Analysis from the calculation results
In equation 6.8, we can calculate the critical time for variant selection, tc by
growth control when growth length of am is equal to d0 added growth length of am
This value can be used as a criterion to evaluate the possibility of growth control by

119
comparing the time with total transformation time of allotriomorphic ferrite. If tc is
quite smaller than transformation time, it would be acceptable to think that local
variant selection during diffusional transformation is determined by growth control.
Figure 6.18 shows the change of critical time for growth controlling at
conventional high angle boundary as a function of the stored energy difference and
chemical driving force. It indicates that an increase in stored energy difference will
shorten the critical time, making growth control occur readily. Figure 6.18 also
indicates an increase of chemical driving force will decrease the critical time,
promoting the occurrence of growth controlled orientation selection. This is quite
different from the effect of chemical driving force on orientation characteristics of
bainite and martensite. For displacive transformations, the orientation of product
phase is influenced by the interaction between shape deformation and externally
applied stress or strain and the orientation is more strongly affected by the
interaction as the ratio of chemical driving force to overall driving force
(△Gchem/(△Gchem+△Gdef)) decreases [67]. The effect of chemical driving force on
growth controlled orientation selection comes from the change of the distance
between ferrite nuclei, d0. When △Gchem is 200, 150, 100, 50 Jmol , d0 is
calculated to be 0.03, 0.05, 0.12 and 0.57mm. It is because fewer nucleation sites are
activated as the driving force is decreased. Consequently, for given stored energy
difference, smaller chemical driving force will require more time for faster growing
ferrite to block the neighboring ferrite. In other words, unlike to the displacive

120
mechanism, growth controlled orientation selection will readily occur as the
chemical driving force increases.
It is confirmed experimentally that the growth controlled orientation characteristics
is hardly observed even with difference in stored energy provided that ferrite can
make a dual orientation with both austenite grains. This situation is captured in
calculation by regarding all interfaces between ferrite and austenite as semi-
coherent interface, assuming M0 and QM in Equation 6.6 to be 29 mm mol J s,
180 kJmol. The calculation results in Figure 6.19 show similar trend on the effect
of stored energy difference and chemical driving force compared with previous
figure. But it is noted that the critical time for growth controlling is drastically
prolonged. The calculated critical time implies that the growth controlling is
actually difficult to occur. This indicates that the difference in stored energy is not
that effective when ferrite has the dual orientation because the slower growth
kinetics of semi-coherent boundary makes it difficult to utilize the energetic
advantage and that is why we cannot observe the growth controlled orientation
characteristics of ferrite nucleated along coherent twin boundary of austenite.
6.6 Conclusions
The orientation characteristics of ferrite nucleated along a grain boundary have
been investigated. It is confirmed that orientation is affected by that of the boundary
plane relative with respect to the close-packed planes in the adjacent austenite
grains and the deformation of austenite prior to ferrite formation. The following

121
conclusions can be drawn:
(1) When transformation is from undeformed cases, the orientation of g/ g grain
boundary plane has a major influence on that of ferrite. Ferrite adopts an
orientation relationship in which the {111}g plane becomes the most parallel to
that of the grain boundary, consistent with Lee et al.
(2) The orientation characteristics of allotriomorphic ferrite which forms from
deformed austenite can be classified into two classes. When the stored energy of
adjacent austenite grain is negligible, orientation of ferrite is mainly influenced
by the orientation of grain boundary plane, i.e. the close-packed plane is nearly
parallel to the grain boundary plane. Meanwhile, when difference of the stored
energy is remarkable, the criterion by orientation of grain boundary plane does
not describe well the orientation characteristics of ferrite. The orientation
analysis indicates that the ferrite is likely to have the orientation relationship
with austenite grain with lower stored energy. It allows the ferrite to have
incoherent interface with the other austenite grain with higher stored energy,
which possibly provides energetic advantage in growth. At coherent twin
boundary along which the ferrite can have a dual orientation with both austenite
grain, the orientation characteristics of ferrite is mostly governed by the dual
orientation phenomena regardless the difference in stored energy of austenite
grains.
(3) A model for growth controlled orientation selection is proposed. The calculation
results successfully capture the influence of the stored energy difference of
122
adjacent austenite as well as the grain boundary characteristics on the
occurrence of growth controlled orientation selection in allotriomorph ferrite
formation.
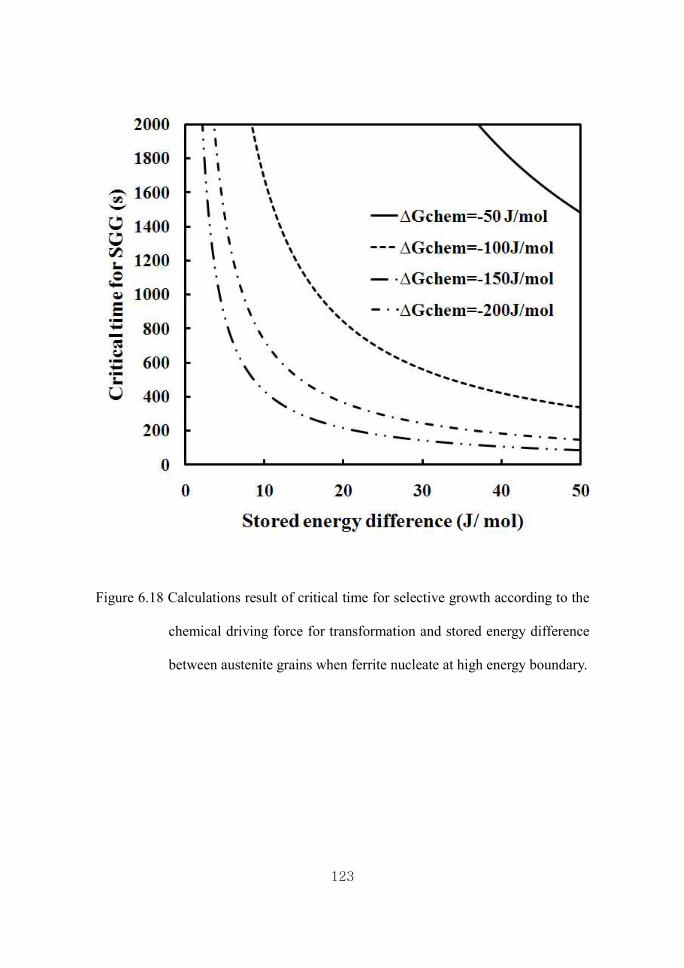
123
Figure 6.18 Calculations result of critical time for selective growth according to the
chemical driving force for transformation and stored energy difference
between austenite grains when ferrite nucleate at high energy boundary.

124
Figure 6.19 Calculations result of critical time for selective growth according to the
chemical driving force for transformation and stored energy difference
between austenite grains when ferrite nucleate at twin boundary.

125
Table 6.2 Deviation from the exact Kurdjumov-Sachs orientation for the ferrite
grains illustrated in Figure 6.4

Table 6.3 Deviation from the exact Kurdjumov
grains illustrated in Figure 6.6
126
Deviation from the exact Kurdjumov-Sachs orientation for the ferrite
ure 6.6
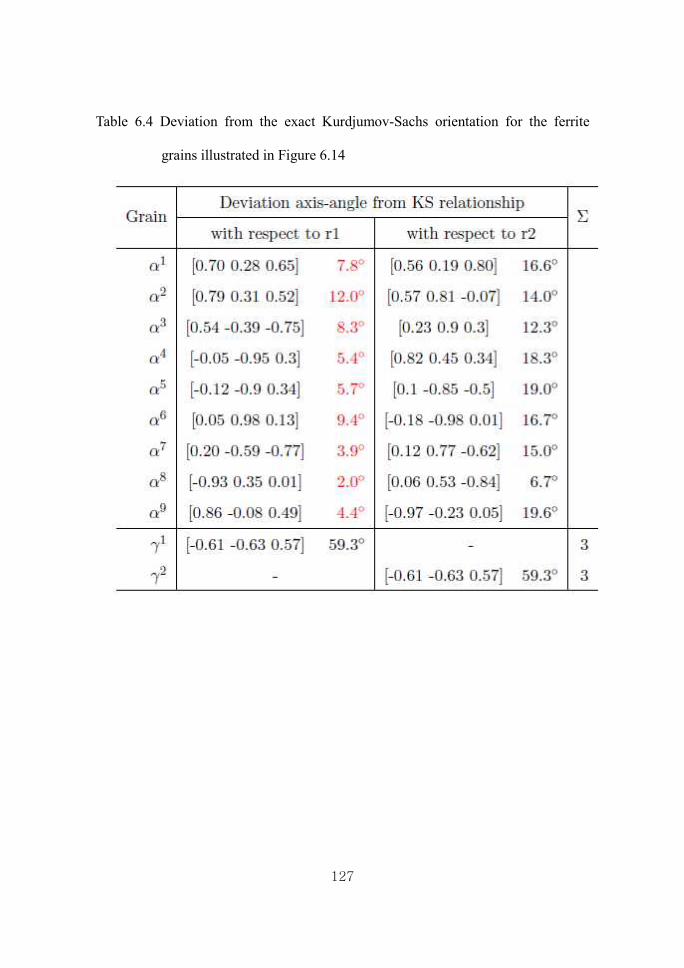
127
Table 6.4 Deviation from the exact Kurdjumov-Sachs orientation for the ferrite
grains illustrated in Figure 6.14

128
Chapter 7 Texture Prediction by Artificial Neural Network Approach
7.1 Introduction
Interstitial free (IF) steels have been used widely in the automotive industry for
last couple of decades because of their excellent formability which enables
automobile body panels to be manufactured in complicated shapes. With the
ongoing necessity for weight reduction, recent trends on IF steels have focused on
stronger varieties to create category designed interstitial free high-strength steels
(IFHS). However, a deterioration of deep drawability has been reported [101, 102]
due to P and Mn addition which solution strengthens.
Deep drawability related with the existence of the g-fibre texture (ND// {111}a)
development during recrystallization stage, known to be controlled by the chemical
composition and processing route, especially the extent of cold rolling [103-106]. It
is therefore important to understand the effect of each alloying element and cold
rolling condition on the formation of g-fibre texture. The precipitation behavior in
IFHS steels has been studied [33, 101, 102, 107, 108] however, quantitative analysis
in terms of according to the Mn, P and Ti contents was not carried out. The effect of
cold rolling condition on the g-fibre texture has been comparatively well-
investigated but, the mechanism for texture development is known to be different
according to the amount of reduction [104, 109, 110]. With this in mind, the present
study focused on the prediction of g-fibre texture using artificial neural network.

129
7.2 Details of modeling
A neural network is a parameterized nonlinear model and its flexibility makes it
able to discover more complex relationships in data than traditional statistical
models [111]. Bayesian probability theory was used to provide a unifying
framework for data modeling which offers several benefits in solving over fitting
problem and handling uncertainty as natural manner [112-115]. The variables
included in the dataset accumulated for analysis are listed in Table 7.1 along with
the means and standard deviations. The full 1064 set consisted of experiments
collected from published data. The comparison of measured values and calculated
values using fully trained committee of model is illustrated in Figure 7.1 in terms of
texture intensity. It shows almost a linear fit to the entire data set, which indicates
fully trained committee-models in this work, is in accord with the real experimental
data.
7.3 Results and discussions
To investigate the g-fibre texture development after recrystallization according to
the amount of strains, different cold rolling reduction rate was applied for
calculation and Figure 7.2 shows the calculated intensity. The average uncertainty
value of predicted was about 9.94(×random). Under the severe reduction rate over
85%, results showed the general tendency that g-fibre texture intensity continuously
and gradually increased all over the section as reduction rate increased.
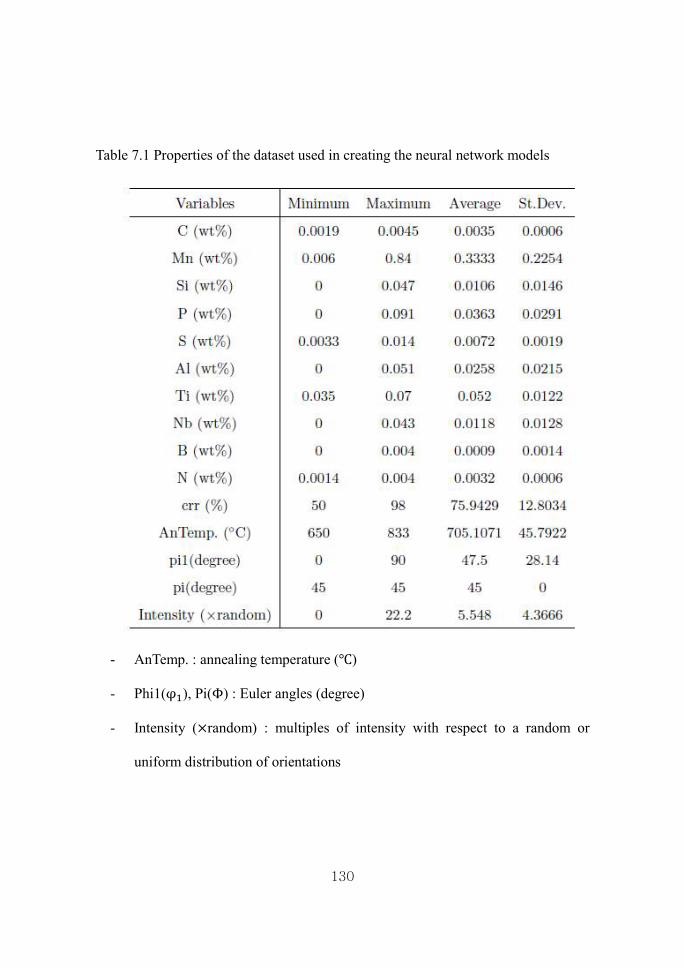
130
Table 7.1 Properties of the dataset used in creating the neural network models
- AnTemp. : annealing temperature (℃)
- Phi1(φ), Pi(Φ) : Euler angles (degree)
- Intensity (×random) : multiples of intensity with respect to a random or
uniform distribution of orientations
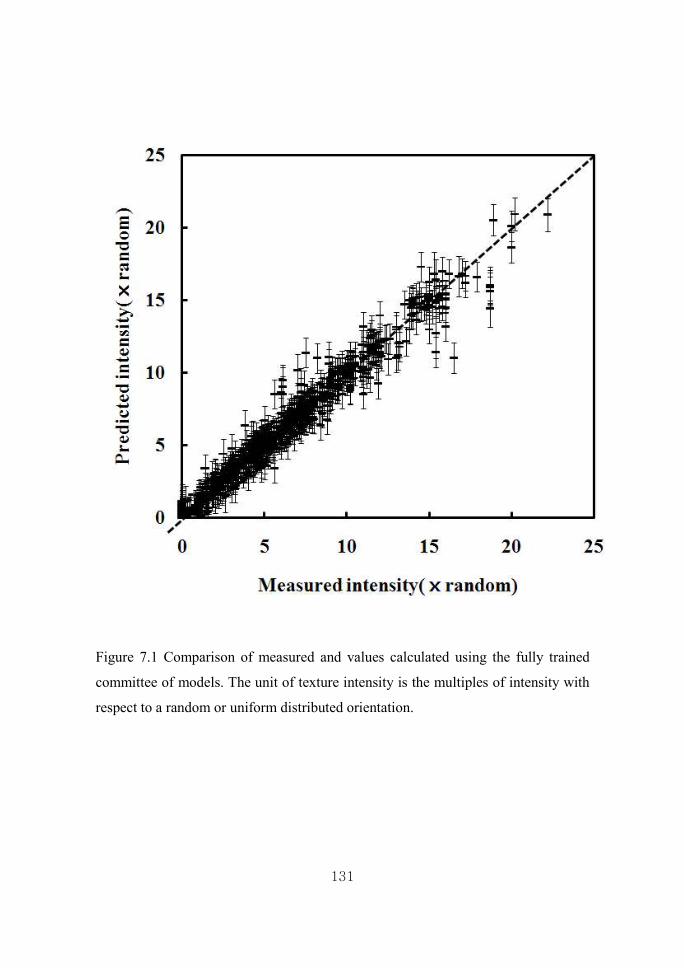
131
Figure 7.1 Comparison of measured and values calculated using the fully trained
committee of models. The unit of texture intensity is the multiples of intensity with
respect to a random or uniform distributed orientation.

132
As reduction rate decrease however, it was observed that there was no significant
changes in {111}⟨110⟩ component and maximum intensity moved toward
{111}⟨110⟩ from {111}⟨112⟩. Since {112}⟨110⟩ component of a-fibre texture into
which {111}⟨112⟩ component can selectively grow is developed by the increase of
cold rolling reduction rate [116], it would be reasonable to think that the change of
{111}⟨110⟩ become smaller and smaller as the cold rolling reduction rate decreases.
Another important factor in g-fibre texture would be an influence of
recrystallization temperature because it is not only directly involved in the growth
velocity of recrystallized grain but also closely connected with the formation of
various types of precipitation. Figure 7.3 shows the formation of various Ti
compounds according to the temperature change for recrystallization. Fe(Ti+Nb)P is
known to be harmful for {111} texture development because it brings the
consumption of Ti and Nb leading to the reduction of stabilizing elements in alloys
to fix the C and N. For different reasons, TiC is known to sharpen the intensity of g-
fibre texture [108]. The prediction in Figure 7.4 clarifies this temperature-dependent
texture change. The uncertainty of the result at 700℃ which was used for data set
was calculated as 0.95 and the maximum intensity was 7.1 for this temperature.
Since there was lack of data in the range from 720℃ to 780℃, the predicted
intensity had quite higher uncertainty as 5.0 than 700℃. However, predicted results
showed very good accordance with the microscopic observation results in Figure
7.3 that texture intensity especially in {111}⟨112⟩ component decrease dramatically

133
as annealing temperature decrease when temperature 720℃.
Since these precipitates have different chemical compositions, P, Mn and Ti may
also affect to change of g-fibre texture. Based on the model, texture intensity was
calculated according to the P and Mn contents as well as Ti contents and the results
are displayed in Figure 7.5. The annealing temperature and cold rolling reduction
was assumed to be 700℃ and 55% respectively. P content was changed from 0.051
wt. % to 0.091 wt. % in Figure 7.5 (a) and Mn from 0.04 wt. % to 0.84 wt. % in
Figure 7.5 (b). Both calculated results shows similar trends that texture intensity
decrease sharply as P and Mn contents increase. This is thought to be related with
the diffusivity of carbon according to the P and Mn contents. It is well known that
both Mn and P strongly interact with C [117] and so, decrease the diffusivity of C in
the matrix. Consequently, TiS formed in high temperature in Figure 7.3 would not
be transformed into Ti4C2S2 and TiC which have benefit to make {111} texture
[108]. It is noticeable here that the absolute value of maximum intensity change
according to the Mn content is much larger than one of P content, which implies the
interaction of Mn with C is exceedingly stronger than P.
Ti effect has been well explained in many studies [118-120]. Generally it has
been known that FeTiP always formed before the formation of TiC in high Ti steel
whose Ti content is around 0.06 wt. % however, in low Ti steel, weight percent of
TiC precipitation increase at the temperature over 700℃. So, g-fibre texture
intensity was assumed to be increased according to the Ti content only in the low Ti
content range. Texture intensity was calculated when Ti content changes from 0.027%

134
to 0.067 wt. % and the result in Figure 7.5 (c) properly coincide with the suggestion
from previous works. The intensity increased up to the 0.047 wt. % and after that, it
decreased. Differently from the previous result, however if we changes the P
contents from 0.0086 wt. % to 0.0012 wt. % (Figure 7.5 (d)), it was shown that the
intensity increased up to the high level of Ti content, which was different result
from previous one. Although detail thermodynamic analysis was not carried out in
this work, it is not difficult to presume from Figure 7.5 that high Ti content increase
amount of TiS during reheating and weight percent of Ti4C2S2 and TiC will also be
increased but they would not have chance to be transformed into FeTiP due to the
low level of P content.
7.4 Summary
An artificial neural network has been used to investigate the effect of complex
thermo-mechanical processing parameters on the g-fibre texture after
recrystallization. The model used input data in form of chemical composition, cold
rolling reduction, recrystallization temperature and texture intensities. The output of
this model was represented in terms of texture intensities. Especially the
investigation has been focused on texture changes according to the cold rolling
reduction as well as Mn, P and Ti contents known to mostly affect to {111}
recrystallization texture. From the calculation results we could confirm that high
cold rolling reduction rate and low Mn as well as P contents appears to improve the
g-fibre texture after recrystallization. Moreover, it was shown that Ti content change

135
have differently influence on the texture according to the P contents. In high P
content region, high level of Ti was harmful for development of the g-fibre texture
but texture intensity was increased as Ti content increase in low P content region.

136
Figure 7.2 Calculated -fibre texture intensity according to various cold rolling
reduction rate from 75%-95%. The fundamental condition for chemical
composition and annealing temperature was assumed to be same as
[121]

137
Figure 7.3 Schematic illustration of stability of various Ti precipitations according
to the temperature [108]
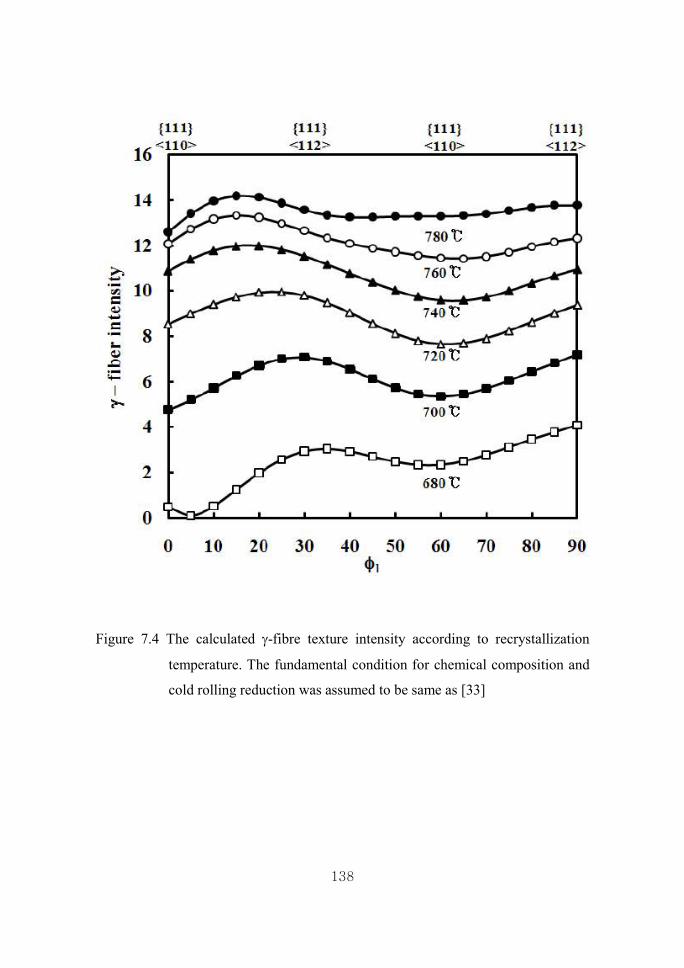
138
Figure 7.4 The calculated g-fibre texture intensity according to recrystallization
temperature. The fundamental condition for chemical composition and
cold rolling reduction was assumed to be same as [33]

139
Figure 7.5 Calculated -fibre texture intensity according to P content (a), Mn content
(b), Ti content with 0.086 wt. % P (c) and Ti content with 0.0012 wt. % P
(d). The fundamental condition for cold rolling reduction as well as
annealing temperature was assumed to be same as
140
Chapter 8 Conclusions
In the case of displacive transformations, the set consisting of the orientation
relationship, shape deformation and habit plane is uniquely connected by the
phenomenological theory of martensite; crystallographic texture including variant
selection can therefore be estimated theoretically as a function of an externally
imposed system of stresses. Although efforts has been also made to demonstrate the
effect of external stresses or strains the orientation of allotriomorphic ferrite during
diffusional transformation, there is no direct influence perceived due to the easy
relaxation of strain energy. Nonetheless, some variant selection has been observed
resulting from the so-called ‘dual orientation’, and factors which make nucleation
easier.
Favoured variants of ferrite are those which achieve simultaneous lattice
matching with two or more adjacent austenite grains. To predict the theoretical
possibility of such dual orientations at grain faces, edges and corners, calculations
has been performed to reveal sensitivity to the parameters and ∆max which
indicate right-handed rotation angle and tolerance angle for rational orientations.
The probability of this happening by pure chance has been forward to be small,
even in strongly textured austenite.
However, it is discovered that the chance of observing dual orientations is
significant when ferrite nucleates at certain coincidence site lattice boundaries of
austenite. This novel result has also been verified by electron back scattered

141
diffraction (EBSD) experiments where ∑ = 3 or ∑ = 11 boundaries are form to
be particularly favorable.
The interfacial energy for the nucleation of ferrite could be decreased by reducing
inclination angle between a facetted interface that has a low energy, and the grain
boundary plane of austenite. Thus, particular orientation relationships that happen to
lead to a low inclination angle would be favoured. However, this criterion leads to
difficulties in describing variant selection of precipitates when the inclination is
large than a critical value, especially when ferrite evolves from deformed
austenite grains.
To deal with this difficulty, a model has been developed by considering the hard
impingement during ferrite grain growth. From several experimental results and
simulations, it has been confirmed that the orientation of ferrite is affected by
mainly three by reasons: the orientation of boundary plane relative to adjacent
austenite grains, the deformation of austenite prior to ferrite formation and the
interface characteristics of boundary. Without deformation of austenite prior to the
ferrite transformation, the orientation of the grain boundary plane has a major
influence on at of the ferrite. It has been observed that ferrite has an orientation
relationship with austenite such that the {111}g plane is aligned as parallel as
possible to the grain boundary plane. This follows the suggestion of previous
studies on variant selection of grain boundary ferrite. It is suggested that the
orientation of ferrite is influenced by that of the grain boundary plane when the
difference in stored energy of adjacent austenite grains is negligible. When this is

142
not the case, the criterion dominates in growth selection.
A pattern recognition approach has been also performed using an artificial
neural network to investigate the effect of complex thermo-mechanical processing
parameters on the ferrite texture in interstitial-free steels, with a focus on the
technologically important g-fibre texture. It approaches that the texture intensity is
sensitive to the cold rolling reduction and concentration of alloying components
such as Mn, P and Ti.

143
Appendix A Texture Development during Reverse Transformation
A.1 Introduction
Transformation induced plasticity (TRIP) steels are known for their combination
of strength and formability and therefore, are used in the automotive industry to
contract safe and efficient. [122-124]. These properties of steels have been
improved by grain refining, especially in low-carbon TRIP steel [125, 126]. One
important step of thermal treatment in this grain refining process is the intercritical
annealing which converts the initial martensitic microstructure of cold rolled
materials into martensite, retained austenite and recrystallized martensite phases.
Since the properties are controlled by the phase fractions, texture and morphologies,
it is necessary to understand the recovery, recrystallization and phase transformation
stages. It is established that these properties are determined by competition between
recovery and recrystallization as well as recrystallization and phase transformation
[127, 128], is determined by parameters such as heating rate, intercritical annealing
temperature, annealing time, cooling rate and annealing temperature etc. [129-131].
Although many microscopic analysis have been performed as a function of these
experimental parameters [127, 128], texture evolutions is not understood. Thus, we
have tried to illuminate the transformation texture development during reverse
transformation in this work.

144
A.2 Experimental procedures
Fe-0.12C-5.8Mn-0.47Si-3.1Al wt. % low carbon manganese TRIP steel has been
used in this experiment. The details of alloy preparation has been presented in report
by Suh et al. [125]. After cold-rolling, specimen was heated to 780 ℃ for 2 min and
a volume fraction of retained austenite of 0.3 was obtained upon cooling to ambient
temperature with 10℃/s. Samples were polished using the standard specimen
preparation to the colloidal silica for 3min. Crystallographic orientations of phases
were measured using electron back scattered diffraction (EBSD) on a ZEISS
SUPRATM scanning electron microscope. Step size for orientation mapping was
0.05mm.
A.3 Results and discussions
Figure A.1 (a) is an image quality map of scanned area and (b) the orientation
map. Since the hot-rolled structure is a mixture of elongated ferrite and martensite,
coarse ferrite stretched in the rolling direction (RD) is assumed to be fully
recrystallized δ -ferrite and other phases to be mixture of un-recrystallized
martensite, recrystallized martensite and austenite. To confirm each phases from the
scanned area, phase map with grain orientation spread map was illustrated in Figure
A.1 (c). In general, it is impossible to separate ferrite from martensite in a phase
map due to their same crystal structure.

(a)
(b)
(c)
Figure A.1 (a) Image quality map of scanned area (b) orientation map (c) phase map
with grain average misorientation map. Red color corresponds to the austenite and
white color to martensite or recrystallized phase from martensite. Grains which
have grain orientation spread (GS) value less than 1.5 were
145
A.1 (a) Image quality map of scanned area (b) orientation map (c) phase map
with grain average misorientation map. Red color corresponds to the austenite and
white color to martensite or recrystallized phase from martensite. Grains which
tion spread (GS) value less than 1.5 were illustrated by gray scale.
‘a’

146
However, several methods such as Kernel average misorientation (KAM) map [132-
135], grain orientation spread (GS) map [127] and image quality (IQ) map [135-139]
etc can be used for this purpose. Grains which have GS value less than 1.5(× randomly distributed intensity) are expressed in gray scale in (c) and it can be seen
clearly that austenite transformation occurred not at the unrecrystallised a’/
unrecrystallised a’ boundaries but mostly at boundaries between unrecrystallised
a’/ recrystallized a’. This means that austenite transformed after the
recrystallization of martensite during intercritical annealing and a magnified image
of section ‘a’ in Figure A.1 (c) demonstrates the location of austenite grains. To
know the orientation relationship between austenite and martensite or recrystallized
martensite in Figure A.2, a total of 20 grains was observed and their deviation from
the exact Kurdjumov-Sachs relationship listed in Table A.1. Most austenite grains
had a low energy orientation relationship with both adjacent martensite and
recrystallized martensite, i.e., a dual orientation relationship. Since simultaneous
lattice matching in this way leads to strong variant selection during diffusional
transformation [17, 18], it is assumed that the austenite variants with this would be
selected from 24 possible variants.
Figure A.3 shows (100), (110) and (111) pole figures of martensite, recrystallized
martensite and austnite grains. Based on variant information, (110)g and (111)g
austenite texture were calculated using all possible KS variants and Figure A.4 (b)
shows the results. This is not consistent with experimental data of austenite in
Figure A.4 (a) indicating favoured variants. Figure A.4 (c) are calculated (110)g and
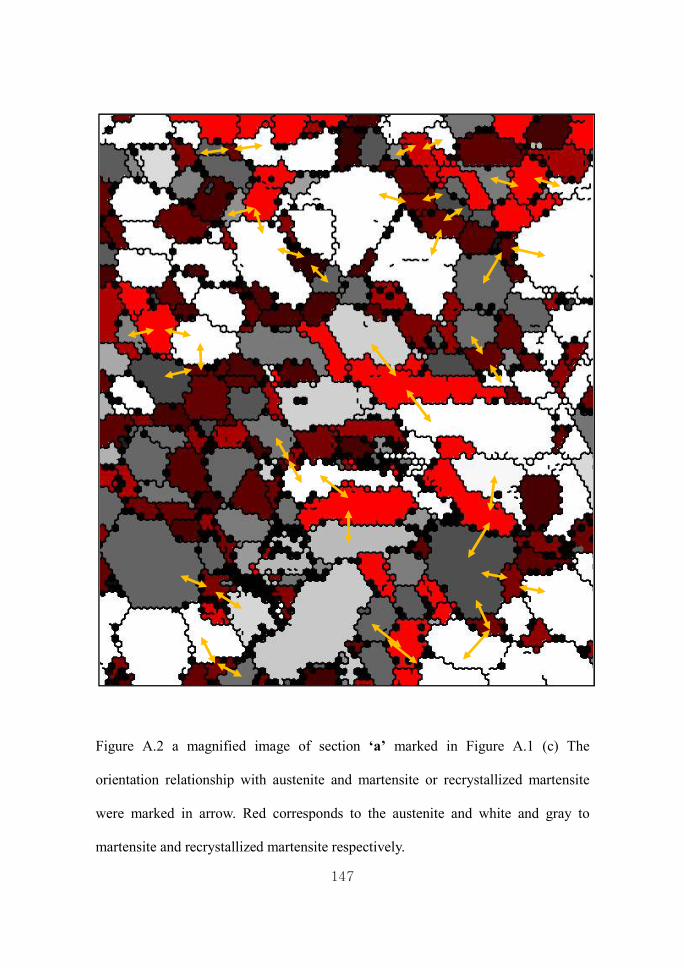
147
Figure A.2 a magnified image of section ‘a’ marked in Figure A.1 (c) The
orientation relationship with austenite and martensite or recrystallized martensite
were marked in arrow. Red corresponds to the austenite and white and gray to
martensite and recrystallized martensite respectively.

148
Table A.1 Deviation from the exact Kurdjumov-Sachs orientation for the austenite
grains in Figure A.2
g grains
Deviation axis - angle pairs from exact KS orientation relationship
With respect to martensite With respect to recrystallized martensite
γ γ γ γ γ γ γ γ γ γ γ γ γ γ γ γ γ γ γ γ
[0.32 0.25 -0.91]
[0.68 -0.27 0.68]
[0.74 0.65 0.19]
[0.54 -0.71 -0.45]
[0.52 -0.34 -0.79]
[0.02 0.96 -0.28]
[0.19 -0.46 -0.87]
[-0.78 -0.14 0.61]
[-0.07 1.00 0.01]
[0.65 -0.05 -0.76]
[-0.03 -0.77 0.63]
[-0.88 -0.13 0.47]
[0.20 -0.80 0.57]
[-0.66 -0.25 0.71]
[-0.03 -0.77 0.63]
[0.08 -0.80 -0.60]
[0.68 -0.72 -0.09]
[-0.91 0.34 -0.23]
[0.18 0.16 -0.97]
[0.77 -0.63 0.05]
7.0o
4.5o
2.5o
1.3o
4.0o
3.4o
3.7o
4.9o
8.0o
2.6o
6.6o
2.6o
5.0o
1.5o
6.6o
3.4o
1.1o
8.2o
3.8o
4.2o
[-0.01 -0.93 -0.38] [-
0.78 0.62 0.11]
[-0.49 -0.05 -0.87] [-
0.29 -0.34 -0.89]
[-0.88 -0.47 -0.07]
[0.58 0.78 -0.23]
[-0.12 0.87 0.48]
[0.99 -0.16 -0.01]
[0.25 0.21 -0.95]
[0.82 -0.16 -0.55]
[-0.75 -0.66 0.01]
[0.14 -0.45 0.88]
[-0.05 0.91 0.42]
[-0.57 0.29 -0.77]
[-0.75 -0.66 0.01]
[-0.98 0.10 -0.15]
[-0.95 0.02 0.32]
[-0.39 0.67 0.63]
[0.87 -0.48 -0.15]
[0.19 0.12 -0.98]
14.3o
4.0o
5.5o
4.0o
10.4o
3.8o
7.8o
11.3o
1.6o
9.4o
6.2o
4.7o
5.1o
4.6o
6.2o
5.5o
15.2 o
4.2o
5.8o
1.1o
149
(111)g pole figures of austenite with variant selection. Although some austenite
transformed at boundaries between martensite or recrystallized martensite grains,
selection by dual orientation shows good agreement with results in (a) in terms of
texture intensity and positions of variants.
A.4 Conclusions
No standing of kinetics competition between recrystallization and transformation
mechanisms during reverse transformation has been studied in Fe-0.12C-5.8Mn-
0.47Si-3.1Al wt. % low carbon manganese TRIP steels using macroscopic texture
analysis. Austenite has been observed to have a low energy orientation relationship
simultaneously with adjacent martensite and recrystallized martensite grain, which
means that most transformation from martensite to austenite occurred after the
recrystallization of martensite in this alloy system. The calculated pole figure with
variants selection are consistent with those observed experimentally observed pole
figure of austenite showed the evidence of variants restriction due to the
simultaneous lattice matching by dual orientation.

150
Figure A.3 {100}, {110} and {111} pole figures of (a) un-recrystallized martensite
(b) recrystallized martensite, (c) austenite grains
(a)
(b)
(c)

151
Fig.5 110 and 111-Pole figures of austenite (a) Experimental data, (b) calculated data with all possible KS variants (c) and with favoured variants.
(c)
(b)
(a)
152
Appendix B FORTRAN program
These programs can be obtained from http://www.msm.cam.ac.uk/map/mapmain.html
Program MAP_STEEL_FERRITE_TEXTURE
1. Provenance of Source Code
Kim Dae Woo
Graduate Institute of Ferrous Technology (GIFT)
Pohang University of Science and Technology
Pohang, Republic of Korea
Added to MAP: September 2008.
2. Purpose of code
The allotriomorphic ferrite nucleates heterogeneously at austenite grain boundaries,
and although a reproducible, low-energy orientation relationship is expected to exist
between the ferrite and one of the austenite grains with which it is in contact, there
are reports that the ferrite can simultaneously adopt this orientation with more than
one austenite grain. We examine this possibility using crystallographic theory in
order to assess the probability of such events as a function of the strength of the

153
texture within the austenite prior to its transformation.
3. Specification
Language: Fortran 77
Product form: Source code and executable files for UNIX/Linux machines.
4. Description
Austenite grains are conveniently represented as a stack of identical, space-filling
Kelvin tetrakaidecahedra each of which consists of eight hexagonal and six square
faces, with 36 equal edges. For ferrite nucleation at austenite grain surfaces, there
are therefore 14 face-sites per grain. The computer algorithm was constructed so
that for each grain orientation relative to the sample frame of reference, it was
possible to access the orientations of the fourteen neighbouring grains. A total of
1700 austenite grains were created in this way, with one of the grains having its
crystallographic axes exactly parallel to those of the sample. The relationship
between the sample and austenite crystal axes can be described using Euler angles.
These are the three angles by which the sample reference frame must be rotated in
order to coincide with that of the crystal. None random austenite textures were
generated relative to the sample axes by setting the first austenite grain to the exact
required texture, and then choosing relative to this grain, random rotation axes but
with the right-handed rotation angle limited to the range of 4 to 45 degree. Any
grain of ferrite will always have an orientation relationship (a J g) with an austenite

154
grain 1. However, some ferrite grains will have a special orientation relationship
which corresponds to a low energy configuration. We adopt as the low energy
orientation, one predicted by the crystallographic theory of martensite in order to
ensure a coherent line between a and g:
0.579356 0.542586 0.102537
0.014470 0.133650 -0.788984
-0.552000 0.0572979 0.086936
and when ferrite was allowed to form on a face between two austenite grains with
relative orientation (g1 J g1), the corresponding orientations with the ferrite are (g1 J
a) and (g2 JLE a) where the latter is the low energy variant. It follows that:
(g1 J a) = (g1 J g1) (g2 JLE a)
Both the matrices on the right-hand side of this equation are known because the
austenite orientations are set initially and (r 2_JLE_a) is given by previous table.
Ferrite was allowed to nucleate on all 14 faces of each austenite grain. The ferrite in
all cases had a low energy orientation with one austenite grain; since there are 24
crystallographically equivalent such orientations for any given austenite grain, the
selection of the particular variant was made at random from the 24 available. The
name of source code is
allotriomorh.f
This is a source code of this program. For the execution, it needs to be compiled.
compile example : g77 allotriomorp.f -o name.out

155
5. References
1. Transformation texture of allotriomorphic ferrite in steel, Materials Science
and Technology, 2009, DOI: 10.1179/174328408X365793, D. W. Kim, R.
S. Qin, H. K. D. H. Bhadeshia
2. Crystallographic Texture of Stress-Affected Bainite, Proceedings of The
Royal Society A, 463 (2007) 2309-2328, S. Kundu, K. Hase and H. K. D. H.
Bhadeshia
3. S. Kundu, Transformation Strain and Crystallographic Texture in Steels,
Ph.D. Thesis, University of Cambridge, U. K., 2007.
4. H. K. D. H. Bhadeshia, Geometry of Crystals. 2nd edition, Institute of
Materials, 2001

156
References
1. Mackenzie, J.K. and J.S. Bowles, The crystallography of martensite
transformations II. Acta Metallurgica, 1954. 2(1): p. 138-147.
2. Bowles, J.S. and J.K. Mackenzie, The crystallography of martensite
transformations I. Acta Metallurgica, 1954. 2(1): p. 129-137.
3. Wechsler, M.S., D.S. Lieberman, and T.A. Read, On the theory of the
formation of martensite. Trans. AIME Journal of Metals, 1953. 197: p.
1503-1515.
4. Kundu, S. and H.K.D.H. Bhadeshia, Transformation texture in deformed
stainless steel. Scripta Materialia, 2006. 55(9): p. 779-781.
5. Kato, M. and T. Mori, Stress-induced martensite in single crystals of an Fe-
23Ni-5Cr alloy. Acta Metallurgica, 1976. 24(9): p. 853-860.
6. Higo, Y., F. Lecroisey, and T. Mori, Relation between applied stress and
orientation relationship of α′ martensite in stainless steel single crystals.
Acta Metallurgica, 1974. 22(3): p. 313-323.
7. Bokros, J.C. and E.R. Parker, The mechanism of the martensite burst
transformation in FeNi single crystals. Acta Metallurgica, 1963. 11(12): p.
1291-1301.
8. Bogers, A.J. and W.G. Burgers, Partial dislocations on the {110} planes in
the B.C.C. lattice and the transition of the F.C.C. into the B.C.C. lattice.
Acta Metallurgica, 1964. 12(2): p. 255-261.
9. Patel, J.R. and M. Cohen, Criterion for the action of applied stress in the

157
martensitic transformation. Acta Metallurgica, 1953. 1(5): p. 531-538.
10. Perdahcioǧlu, E.S., H.J.M. Geijselaers, and M. Groen, Influence of plastic
strain on deformation-induced martensitic transformations. Scripta
Materialia, 2008. 58(11): p. 947-950.
11. Geijselaers, H.J.M. and E.S. Perdahcioǧlu, Mechanically induced
martensitic transformation as a stress-driven process. Scripta Materialia,
2009. 60(1): p. 29-31.
12. Dames, G.J., J.S. Kallend, and P.P. Morris, The quantitative prediction of
transformation textures. Acta Metallurgica, 1976. 24(2): p. 159-172.
13. Kurdjumov, G.V. and G. Sachs, Über den mechanismus der stählhartung.
Zietschrift für Physik A Hadrons and Nuclei, 1930. 64: p. 325-343.
14. Nishiyama, Z., X-ray investigation of the mechanism of the transformation
from face centered cubic lattice to body centered cubic. Science Reports of
Tohoku Imperial University, 1934. 23: p. 637–634.
15. Lee, J.K. and H.I. Aaronson, Influence of faceting upon the equilibrium
shape of nuclei at grain boundaries--II. Three-dimensions. Acta
Metallurgica, 1975. 23(7): p. 809-820.
16. Lee, J.K. and H.I. Aaronson, Influence of faceting upon the equilibrium
shape of nuclei at grain boundaries--I. Two-dimensions. Acta Metallurgica,
1975. 23(7): p. 799-808.
17. Kim, D.W., et al., Dual orientation and variant selection during diffusional
transformation of austenite to allotriomorphic ferrite. Journal of Materials

158
Science, 2010. 45(15): p. 4126-4132.
18. Kim, D.W., R.S. Qin, and H.K.D.H. Bhadeshia, Transformation texture of
allotriomorphic ferrite in steel. Materials Science and Technology, 2009.
25(7): p. 892-895.
19. Bhadeshia, H.K.D.H., Diffusional formation of ferrite in iron and its alloys.
Progress in Materials Science, 1985. 29(4): p. 321-386.
20. Chan, J.W. and G. Kalonji. in International Conference on Solid-Solid
Transformations. 1981. Warrendale, Pennsylvania: TMS-AIME.
21. Cahn, J.W., Theory of crystal growth and interface motion in crystalline
materials. Acta Metallurgica, 1960. 8(8): p. 554-562.
22. Hillert, M., The Mechanism of Phase Transformation in Crystalline Solids.
1969: Institute of Metals, London.
23. Clemm, P.J. and J.C. Fisher, The influence of grain boundaries on the
nucleation of secondary phases. Acta Metallurgica, 1955. 3: p. 70–73.
24. Cahn, J.W., The Kinetics of grain boundary nucleated reactions. Acta
Metallurgica, 1956. 4: p. 449–564.
25. Reed, R.C. and H.K.D.H. Bhadeshia, The Reconstructive Austenite-Ferrite
Transformation in Low-Alloy Steels. Materials Science and Technology,
1992. 8: p. 421-435.
26. Ryder, P.L., W. Pitsch, and R.F. Mehl, Crystallography of the precipitation
of ferrite on austenite grain boundaries in a Co + 20% Fe alloy. Acta
Metallurgica, 1967. 15(9): p. 1431-1440.

159
27. Ryder, P.L. and W. Pitsch, The crystallographic analysis of grain-boundary
precipitation. Acta Metallurgica, 1966. 14(11): p. 1437-1448.
28. King, A.D. and T. Bell, Observations on the morphology and
crystallography of proeutectoid ferrite. Metallography, 1976. 9(5): p. 397-
413.
29. Christian, J.W., The Theory of Phase Transformations in Metals and Alloys,
Part 1, 2nd edition. 1965: Pergamon, Oxford.
30. Babu, S.S. and H.K.D.H. Bhadeshia, A direct study of grain boundary
allotriomorphic ferrite crystallography. Materials Science and Engineering:
A, 1991. 142(2): p. 209-219.
31. Crosky, A., P.G. McDougall, and J.S. Bowles, The crystallography of the
precipitation of a rods from b Cu-Zn alloys. Acta Metallurgica, 1980.
28(11): p. 1495-1504.
32. Purdy, G.R., The dynamics of transformation interfaces in steels--I. The
ferrite-austenite interface in Fe-C-Mo alloys. Acta Metallurgica, 1978.
26(3): p. 477-486.
33. Ghosh, P., et al., Precipitation behavior and texture formation at different
stages of processing in an interstitial free high strength steel. Scripta
Materialia, 2008. 59(3): p. 276-278.
34. Tanaka, T., Controlled Rolling of Steel Plate and Strip. International metals
reviews, 1981. 26(4): p. 185-212.
35. Bowles, J.S. and J.K. Mackenzie, The crystallography of martensite

160
transformations III. Face-centred cubic to body-centred tetragonal
transformations. Acta Metallurgica, 1954. 2(2): p. 224-234.
36. Bunge, H.-J., Texture Analysis in materials Science: Mathematical Methods.
1982: Butterworths-Heinemann, London.
37. Randle, V. and O. Engler, Introduction to texture analysis : macrotexture,
microtexture and orientation mapping. 2000: Amsterdam, The Netherlands
38. Lee, D.N., Texture and Related Phenomena. 2006: The Korean Institute of
Metals and Materials, Seoul.
39. Bhadeshia, H.K.D.H., Problemisn theG alculatioonf T ransformatiToenx
turein Steels. lSlJ lnternat ional, 2010. 50(11): p. 1517-1522.
40. Bhadeshia, H.K.D.H., Geometry of crystals, 2nd edition. 2001: Institute of
Materials, London.
41. Miyamoto, G., et al., Crystallography of intragranular ferrite formed on
(MnS+V(C,N)) complex precipitate in austenite. Scripta Materialia, 2003.
48(4): p. 371-377.
42. Kang, J.H., et al., Effect of external stress on the orientation distribution of
ferrite. Scripta Materialia, 2003. 48(1): p. 91-95.
43. Dahmen, U., P. Ferguson, and K.H. Westmacott, Invariant line strain and
needle-precipitate growth directions in Fe-Cu. Acta Metallurgica, 1984.
32(5): p. 803-810.
44. Gey, N., B. Petit, and M. Humbert, Electron backscattered diffraction study
of ε/α′ martensitic variants induced by plastic deformation in 304 stainless

161
steel. Metallurgical and Materials Transactions A: Physical Metallurgy and
Materials Science, 2005. 36(12): p. 3291-3299.
45. Bokros, J.C. and E.R. Parker, The mechanism of the martensite burst
transformation in Fe---Ni single crystals. Acta Metallurgica, 1963. 11(12):
p. 1291-1301.
46. Durlu, T.N. and J.W. Christian, Effect of prior deformation on the
martensite burst transformation in single crystals of an Fe-Ni-C alloy. Acta
Metallurgica, 1979. 27(4): p. 663-666.
47. Davies, G.J. and R.M. Bateman. in 6th International Conference on
Textures of Materials. 1981. Tokyo: The Iron and Steel Institute of Japan.
48. Higo, Y., F. Lecroisey, and T. Mori, Relation between applied stress and
orientation relationship of α′martensite in stainless steel single crystals.
Acta Metallurgica, 1974. 22(3): p. 313-323.
49. Kato, M. and T. Mori, Orientation of martensite formed in Fe-23Ni-5Cr
crystals under uniaxial stress along [001]. Acta Metallurgica, 1977. 25(8):
p. 951-956.
50. Miyaji, H., et al. in Physical metallurgy of thermomechanical processing of
steels and other metals. 1988.
51. Adachi, Y., K. Hakata, and K. Tsuzaki, Crystallographic analysis of grain
boundary Bcc-precipitates in a Ni-Cr alloy by FESEM/EBSD and
TEM/Kikuchi line methods. Materials Science and Engineering: A, 2005.
412(1-2): p. 252-263.

162
52. Kei, A., et al., Morphology of proeutectoid ferrite at austenite grain
boundaries in low carbon. Tetsu-To-Hagane, Journal of the Iron and Steel
Institute of Japan, 1988. 74: p. 1839-1845.
53. Vaughan, D., The precipitation of q' at high-angle boundaries in an Al-Cu
alloy. Acta Metallurgica, 1970. 18(1): p. 183-187.
54. Furuhara, T., et al., Crystallography of grain boundary alpha precipitates in
beta titanium alloy. Metallurgical and Materials Transactions A, 1996. 27: p.
1635-1646.
55. Dingley, D.J. and M.M. Nowell, The use of electron backscatter diffraction
for the investigation of nano crystalline materials and the move towards
orientation imaging in the TEM. Microchimica Acta, 2004. 147: p. 157–165.
56. Humphreys, F.J., Characterisation of fine-scale microstructures by electron
backscatter diffraction (EBSD). Scripta Materialia, 2004. 51: p. 771–776.
57. Gourgues-Lorenzon, A.F., Application of electron backscatter diffraction to
the study of phase transformations. International Materials Reviews, 2007.
52: p. 65-128.
58. Gourgues, A.F., H.M. Flower, and T.C. Lindley, Electron backscatterring
diffraction study of acicular ferrite, bainite and martensite steel
microstructures. Materials Science and Technology, 2000. 16: p. 26–40.
59. Gourgues, A.-F., Electron backscatter diffraction and cracking. Materials
Science and Technology, 2002. 18: p. 119-133.
60. Nohava, J., et al., Electron backscattering diffraction analysis of secondary

163
cleavage cracks in a reactor pressure vessel steel. Materials
Characterisation, 2003. 49: p. 211–217.
61. Lambert-Perlade, A., et al., Mechanisms and modelling of cleavage
fractures in simulated heat–affected zone microstructures in HSLA steel.
Metallurgical & Materials Transactions A, 2004. 35A: p. 1039–1053.
62. Kim, Y.M., et al., Effects of molybdenum and vanadium addition on tensile
and charpy impact properties of API X70 linepipe steels. Metallurgical &
Materials Transactions A, 2007. 38A: p. 1731–1742.
63. Callone, V., A.F. Gourgues, and A. Pineau, Fatigue crack propagation in
cast duplex stainless steels: thermal ageing and microstructural effects.
Fatigue and Fracture of Engineering Materials and Structures, 2004. 27: p.
31-43.
64. S.Wechsler, M., D.S. Lieberman, and T.A. Read., On the theory of the
formation of martensite. AIME Journal of Metals, 1953. 197: p. 1503-1515.
65. Kundu, S. and H.K.D.H. Bhadeshia, Crystallographic texture and
intervening transformations. Scripta Materialia, 2007. 57: p. 869–872.
66. Kundu, S., K. Hase, and H.K.D.H. Bhadeshia, Crystallographic texture of
stress–affected bainite. Proceedings of the Royal Society A, 2007. 463: p.
2309-2328.
67. Kundu, S., Transformation Strain and Crystallographic Texture in Steels.
2007, University of Cambridge: Cambridge, U. K.
68. Aaronson, H.I., The proeutectoid ferrite and the proeutectoid cementite

164
reactions. Decomposition of austenite by diffusional processes, ed. I.V.
F.Zackay and H.I. Aaronson. 1962, New York, USA.
69. King, A.D. and T. Bell, Crystallography of grain boundary proeutectoid
ferrite. Metallurgical Transactions A, 1975. 6A: p. 1419-1429.
70. Suh, D.-W., et al., Evaluation of the deviation angle of ferrite from the KS
relationship in low carbon steel by EBSD. Scripta Materialia, 2002. 46: p.
375-378.
71. Underwood, E.E., Quantitative Stereology. 1970: Addison–Wesley
Publication Company.
72. Czinege, I. and T. Reti, Determination of local deformation in cold formed
products by a measurement of the geometric characteristics of the
crystallites, in In Eighteenth International Machine Tool Design and
Research Conference, Forming. 1977. p. 159–163.
73. Leeuwen, Y.v., et al., Effect of geometrical assumptions in modelling solid
state kinetics. Metallurgical & Materials Transactions A, 1998. 29: p. 2925-
2931.
74. Singh, S.B. and H.K.D.H. Bhadeshia, Topology of grain deformation.
Materials Science and Technology, 1998. 15: p. 832-834.
75. Q. Zhu, C.M.S. and H.K.D.H. Bhadeshia, Quantitative metallography of
deformed grains. Materials Science and Technology, 2007. 23: p. 757–766.
76. McDougall, J.D.W.a.P.G., The crystallography of Widmanstätten ferrite.
Acta Metallurgica, 1973. 21: p. 961-973.

165
77. Bhadeshia, H.K.D.H., Critical assessment: Diffusion–controlled growth of
ferrite plates in plain carbon steels. Materials Science and Technology,
1985. 1: p. 497-504.
78. Hillert, M., The formation of pearlite. Decomposition of austenite by
diffusional processes, ed. V.F. Zackay and H. I. Aaronson. 1962.
79. Swallow, E. and H.K.D.H. Bhadeshia, High Resolution Observations of the
Displacements Caused by Bainitic Transformation. Materials Science and
Technology, 1996. 12: p. 121-125.
80. Watanabe, T., et al., Grain boundary engineering by magnetic field
application. Scripta Materialia, 2006. 54(6): p. 969-975.
81. Tsurekawa, S., et al., The control of grain boundary segregation and
segregation-induced brittleness in iron by the application of a magnetic
field. Journal of Materials Science, 2005. 40(4): p. 895-901.
82. Bogers, A.J. and W.G. Burgers, A.J Bogers and W.G Burgers. Partial
dislocations on the {110} planes in the b.c.c. lattice and the transition of the
fcc into the bcc lattice. Acta Metallurgica, 1964. 55: p. 779-781.
83. Wilkinson, A.J. and D.J. Dingley, Quantitative deformation studies using
electron back scatter patterns. Acta Metallurgica et Materialia, 1991. 39: p.
3047-3055.
84. Mukherjee, A.K., Plastic Deformation of Metals Treaties on Materials
Science and Technology, ed. Arsennault. Vol. 6. 1975, New York: Academic
Press.

166
85. Wilkinson, A.J. and D.J. Dingley, Quantitative deformation studies using
electron back scatter patterns. Acta Metallurgica et Materialia, 1991.
39(12): p. 3047-3055.
86. Choi, S.H., Simulation of stored energy and orientation gradients in cold-
rolled interstitial free steels. Acta Materialia, 2003. 51(6): p. 1775-1788.
87. Choi, S.-H. and Y.-S. Jin, Evaluation of stored energy in cold-rolled steels
from EBSD data. Materials Science and Engineering A, 2004. 371(1-2): p.
149-159.
88. Tóth, L.S. and J.J. Jonas, Modelling the texture changes produced by
dynamic recrystallization. Scripta Metallurgica et Materialia, 1992. 27(3): p.
359-363.
89. Urabe, T. and J.J. Jonas, Modeling texture change during recrystallization
of an IF steel. ISIJ International, 1994. 34(5): p. 435-442.
90. Juul Jensen, D., Growth rates and misorientation relationships between
growing nuclei/grains and the surrounding deformed matrix during
recrystallization. Acta Metallurgica et Materialia, 1995. 43(11): p. 4117-
4129.
91. Krielaart, G.P. and S. van der Zwaag, Simulations of pro-eutectoid ferrite
formation using a mixed control growth model. Materials Science and
Engineering A, 1998. 246(1-2): p. 104-116.
92. Lee, K.-M., H.-C. Lee, and J.K. Lee, Influence of coherency strain and
applied stress upon diffusional ferrite nucleation in austenite. Philosophical

167
Magazine, 2010. 90: p. 437-459.
93. Lee, J.K., et al., Plastic relaxation of the transformation strain energy of a
misfitting spherical precipitate: Ideal plastic behavior. Metallurgical
Transactions A, 1980. 11(11): p. 1837-1847.
94. Earmme, Y.Y., W.C. Johnson, and J.K. Lee, Plastic Relaxation of the
Transformation Strain Energy of a Misfitting Spherical Precipitation:
Linear and Power-Law Strain Hardening. Metallurgical transactions. A,
Physical metallurgy and materials science, 1981. 12 A(8): p. 1521-1530.
95. Santofimia, M.J., L. Zhao, and J. Sietsma, Model for the interaction
between interface migration and carbon diffusion during annealing of
martensite-austenite microstructures in steels. Scripta Materialia, 2008.
59(2): p. 159-162.
96. Mecozzi, M.G., J. Sietsma, and S. van der Zwaag, Analysis of g to a
transformation in a Nb micro-alloyed C-Mn steel by phase field modelling.
Acta Materialia, 2006. 54(5): p. 1431-1440.
97. Krielaart, G.P. and S. Van Der Zwaag, Kinetics of g→g phase
transformation in Fe-Mn alloys containing low manganese. Materials
Science and Technology, 1998. 14(1): p. 10-18.
98. Santofimia, M.J., et al., Influence of interface mobility on the evolution of
austenite-martensite grain assemblies during annealing. Acta Materialia,
2009. 57(15): p. 4548-4557.
99. Liu, Z.K., Theoretic calculation of ferrite growth in supersaturated

168
austenite in Fe---C alloy. Acta Materialia, 1996. 44(9): p. 3855-3867.
100. Kozeschnik, E., A numerical model for evaluation of unconstrained and
compositionally constrained thermodynamic equilibria. Calphad, 2000.
24(3): p. 245-252.
101. Ghosh, P., et al., Precipitation and texture formation in two cold rolled and
batch annealed interstitial-free high strength steels. Scripta Materialia,
2006. 55(3): p. 271-274.
102. Ghosh, P., B. Bhattacharya, and R.K. Ray, Comparative study of
precipitation behavior and texture formation in cold rolled-batch annealed
and cold rolled-continuous annealed interstitial free high strength steels.
Scripta Materialia, 2007. 56(8): p. 657-660.
103. Saha, R. and R.K. Ray, Texture and grain growth characteristics in a boron
added interstitial free steel after severe cold rolling and annealing.
Materials Science and Engineering: A, 2010. 527(7-8): p. 1882-1890.
104. Saha, R. and R.K. Ray, Effect of severe cold rolling and annealing on the
development of texture, microstructure and grain boundary character
distribution in an interstitial free steel. ISIJ International, 2008. 48: p. 976-
983.
105. Wang, Z.-d., et al., Effect of Processing Condition on Texture and
Drawability of a Ferritic Rolled and Annealed Interstitial-Free Steel.
Journal of Iron and Steel Research, International, 2006. 13(6): p. 60-65.
106. Martínez, V.J., J.I. Verdeja, and J.A. Pero-Sanz, Interstitial free steel:
169
Influence of [alpha]-phase hot-rolling and cold-rolling reduction to obtain
extra-deep drawing quality. Materials Characterization, 2001. 46(1): p. 45-
53.
107. Ghosh, P., et al., Comparative study of precipitation behavior and texture
formation in continuously annealed Ti and Ti + Nb added interstitial-free
high-strength steels. Scripta Materialia, 2008. 58(11): p. 939-942.
108. Ghosh, P., C. Ghosh, and R.K. Ray, Thermodynamics of precipitation and
textural development in batch-annealed interstitial-free high-strength steels.
Acta Materialia, 2010. 58(11): p. 3842-3850.
109. Samet-Meziou, A., et al., TEM Study of Recovery and Recrystallization
Mechanisms after 40% Cold rolling in an IF-Ti steel. ISIJ International,
2008. 48: p. 976-983.
110. Verbeken, K. and L. Kestens, Strain-induced selective growth in an ultra
low carbon steel after a small rolling reduction. Acta Materialia, 2003.
51(6): p. 1679-1690.
111. Bhadeshia, H.K.D.H., Neural networks and information in materials
science. Statistical Analysis and Data Mining, 2009. 1: p. 296-305.
112. Yescas, M.A., H.K.D.H. Bhadeshia, and D.J. MacKay, Estimation of the
amount of retained austenite in austempered ductile irons using neural
networks. Materials Science and Engineering A, 2001. 311(1-2): p. 162-173.
113. Cottrell, G.A., et al., Neural network analysis of Charpy transition
temperature of irradiated low-activation martensitic steels. Journal of
170
Nuclear Materials, 2007. 367-370(Part 1): p. 603-609.
114. Capdevila, C., et al., Proposal of an empirical formula for the austenitising
temperature. Materials Science and Engineering A, 2004. 386(1-2): p. 354-
361.
115. Bhadeshia, H.K.D.H., Mechanisms and Models for Creep Deformation and
Rupture, in Comprehensive Structural Integrity, I. Milne, R.O. Ritchie, and
B. Karihaloo, Editors. 2003, Pergamon: Oxford. p. 1-23.
116. Emren, F., U. von Schlippenbach, and K. Lücke, Investigation of the
development of the recrystallization textures in deep drawing steels by ODF
analysis. Acta Metallurgica, 1986. 34(11): p. 2105-2117.
117. Akben, M.G., et al., Dynamic precipitation and solute hardening in a
titanium microalloyed steel containing three levels of manganese. Acta
Metallurgica, 1984. 32(4): p. 591-601.
118. Hamart, O., T. Lung, and S. lanteri. 40th MWSP Conference Proceedings.
1998. Warrendale(PA):ISS.
119. Lee, K., S.-H. Han, and Y.-S. Jin. in International Forum for the Properties
and Application of IF Steels. 2003. Tokyo.
120. Gladman, T., The physical metallurgy of microalloyed steels. 1997, London:
Institute of Materials.
121. Samajdar, I., et al., g-Fibre recrystallization texture in IF-steel: an
investigation on the recrystallization mechanisms. Materials Science and
Engineering A, 1997. 238(2): p. 343-350.

171
122. De Cooman, B.C., Structure-properties relationship in TRIP steels
containing carbide-free bainite. Current Opinion in Solid State and
Materials Science. 8(3-4): p. 285-303.
123. Zaefferer, S., J. Ohlert, and W. Bleck, A study of microstructure,
transformation mechanisms and correlation between microstructure and
mechanical properties of a low alloyed TRIP steel. Acta Materialia, 2004.
52(9): p. 2765-2778.
124. Choi, K.S., et al., Microstructure-based constitutive modeling of TRIP steel:
Prediction of ductility and failure modes under different loading conditions.
Acta Materialia, 2009. 57(8): p. 2592-2604.
125. Suh, D.W., et al., Influence of Al on the microstructural evolution and
mechanical behavior of low-carbon, manganese transformation-induced-
plasticity steel. Metallurgical and Materials Transactions A: Physical
Metallurgy and Materials Science, 2010. 41(2): p. 397-408.
126. Suh, D.-W., et al., Influence of partial replacement of Si by Al on the change
of phase fraction during heat treatment of TRIP steels. Scripta Materialia,
2007. 57(12): p. 1097-1100.
127. Peranio, N., et al., Microstructure and texture evolution in dual-phase steels:
Competition between recovery, recrystallization, and phase transformation.
Materials Science and Engineering: A, 2010. 527(16-17): p. 4161-4168.
128. Lee, S.-J., Y.-M. Park, and Y.-K. Lee, Reverse transformation mechanism of
martensite to austenite in a metastable austenitic alloy. Materials Science

172
and Engineering: A, 2009. 515(1-2): p. 32-37.
129. Bleck, W., A. Frehn, and J. Ohlert. in Niobium Science and Technology: The
International Symposium Niobium 2001. 2001. Orlando, FL, USA.
130. Humphreys, F.J. and M. hatherly, Recrystallization and Related Annealing
phenomena. 2004: Elsevier, Oxford, GB.
131. Rocha, R.O., et al., Microstructural evolution at the initial stages of
continuous annealing of cold rolled dual-phase steel. Materials Science and
Engineering A, 2005. 391(1-2): p. 296-304.
132. Petrov, R., et al., Microstructure and texture of a lightly deformed TRIP-
assisted steel characterized by means of the EBSD technique. Materials
Science and Engineering: A, 2007. 447(1-2): p. 285-297.
133. Jorge-Badiola, D., A. Iza-Mendia, and I. Gutiérrez, Study by EBSD of the
development of the substructure in a hot deformed 304 stainless steel.
Materials Science and Engineering A, 2005. 394(1-2): p. 445-454.
134. Dziaszyk, S., et al., On the characterization of recrystallized fraction using
electron backscatter diffraction: A direct comparison to local hardness in
an IF steel using nanoindentation. Materials Science and Engineering: A.
In Press, Corrected Proof.
135. Calcagnotto, M., et al., Orientation gradients and geometrically necessary
dislocations in ultrafine grained dual-phase steels studied by 2D and 3D
EBSD. Materials Science and Engineering: A, 2010. 527(10-11): p. 2738-
2746.

173
136. Wilson, A.W., J.D. Madison, and G. Spanos, Determining phase volume
fraction in steels by electron backscattered diffraction. Scripta Materialia,
2001. 45(12): p. 1335-1340.
137. Verbeken, K., N. Van Caenegem, and M. Verhaege, Quantification of the
amount of e-martensite in a Fe-Mn-Si-Cr-Ni shape memory alloy by means
of electron backscatter diffraction. Materials Science and Engineering: A,
2008. 481-482: p. 471-475.
138. Verbeken, K., N. Van Caenegem, and D. Raabe, Identification of e-
martensite in a Fe-based shape memory alloy by means of EBSD. Micron,
2009. 40(1): p. 151-156.
139. Kitahara, H., et al., Crystallographic analysis of plate martensite in Fe-28.5
at.% Ni by FE-SEM/EBSD. Materials Characterization, 2005. 54(4-5): p.
378-386.
174
Acknowledgements
I am grateful to the POSCO, Korea for funding this project. I would also like to
thank POSCO for allowing me to take study leave for 4 years.
I would like to express my sincere gratitude to my supervisor, Prof. H. K. D. H.
Bhadeshia, for his guidance and encouragement. I am also thankful to Professor
Dong-Woo Suh for his guidance and friendship as my co-advisor. I also want to
express my great thanks to Professor Nack-Joon Kim, the Dean of Graduate
Institute of Ferrous Technology, for the provision of laboratory facilities and the
atmosphere at POSTECH and Professor Hae-Geon Lee for their advice and support.
Support from Dr. Carlos Capdevila Montes and Dr. Francisca Caballero in
CENIM-CSIC, Spain is gratefully acknowledged – who helped with many
experiments. I would like to express my sincere gratitude to Dr. S. Kundu and Dr. S.
Babu for their helpful discussions and advices. I am indebted to Dr. Jang-Yong You,
Dr. Kyung-Kun Um for their help and encouragement with the experiments
conducted at POSCO.
I have received technical help suggestions from many other people during the
course of this work. I want to specially mention Prof. De Cooman, Prof. Hu-Chul
Lee for many helpful discussions.
I would like to express sincere thanks to all the people in the Graduate Institute of

175
Ferrous Technology (GIFT) in Pohang University of Science and Technology,
especially those members in Computational Metallurgy Laboratory (CML), for all
their help and for all the memories we have.
Finally, I wish to record my deep sense of appreciation to my parents, wife for
their love and support during the entire period.

176
학부와 석사를 졸업하고 박사과정을 마무리 하는 지금까지 10 년의 시간이
흘렀습니다. 그 동안 힘들었던 일, 슬펐던 일들 보다는 기쁘고 행복한 일들이
훨씬 많기에, 이 마음을 조금이나마 더 표현하고자 글을 씁니다.
우선, 늘 솔선 수범하시며 저를 올바른 학자의 길로 인도해 주신 Bhadeshia
교수님께 먼저 감사의 말씀 올립니다. 끊임 없이 정진하시고 항상 새로운 것을
찾으시는 모습은 학생들에게 늘 귀감이 되었습니다. 딱딱 할 수 있는 사제간의
관계를 늘 부드럽게 유지하시면서도 연구를 하실 때에는 늘 진중하시며
열정적이셨습니다.
강한 리더십으로 늘 연구실에 활력을 불어넣어 주시는 서동우 교수님께도
감사의 말씀 올립니다. 실험이 잘 되지 않아 진척이 없어 풀이 죽어 있을
때에는 다정다감한 친 형처럼, 연구에 있어 소홀함이나 나태함을 보일 때에는
엄한 아버지처럼 저를 대해주셨습니다. 그 덕분에 큰 힘을 얻고 무사히
박사과정을 마칠 수 있었습니다.
4 년 동안 학교에서 수학을 할 수 있도록 도움을 주신 포스코 후판 연구그룹
연구원 분들께도 감사의 말씀 드립니다. 바쁘신 와중에서도 디펜스 때 참석해
주신 엄경근 박사님께 먼저 감사 드리며 연구에 많은 조언을 해주신 유장용
박사님과 최종교 박사님께도 감사의 말씀 올립니다.
늘 함께 동고 동락 했던 연구실 식구들에게도 저의 마음을 전합니다. 준학,
홍석, 주현, 민성, 재용, 재훈, 유영, 승우, 은주, 영주, 지용, 근수, 한번도
제대로 고맙다는 표현을 못한 것 같습니다. 모두 착하고 성실한 동생들이니
졸업하고 어디에 있던지 제 몫은 다 하는 연구원이 되리라 믿어 의심 치
않습니다.

177
늘 바쁘다는 핑계로 연락도 제대로 못 드리고 자주 찾아 뵙지도 못해 불효만
한 것 같습니다. 아버님 어머님 그리고 장인어른 장모님께도 큰절을 올립니다.
앞으로 살면서 못다한 효도를 다하겠습니다. 두문불출하는 오빠를 대신해서
굿은 일 도맡아서 하는 여동생 내외에게도 고맙습니다. 지수, 민준이 건강하게
잘 자라기를 기원합니다. 그리고 공부하느라 잘 챙겨주지도 못한 우리 처남과
처제에게도 미안함과 고마움을 전합니다.
끝으로 저의 처에게 글을 남깁니다.
여보, 11 월 15 일이면 당신과 결혼하고 이제 꼭 1 년 째 되는 날입니다. 매주
장거리 출퇴근 하면서 보러 오겠노라고 약속해놓고 바쁘다는 핑계로 한 달에 몇
번 보지도 못하고 혼자 큰 집 남겨놔서 미안해요. 기쁠 때, 행복할 때에는 늘
당신이 먼저 생각이 나고, 슬프고 힘들 때에도 당신의 위로와 따듯한 손이 먼저
떠오릅니다. 늘 묵묵히 내 곁에 있어줘서 고맙고 사랑합니다.
2010. 10. 28
김 대 우

178
CURRICULUM VITAE
Name: Kim, Dae Woo (金 旲 優)
E-mail: [email protected]
Date of birth: 14nd Augest, 1978
Place of birth: DaeGu, South Korea
Education
B. S. 2005, Kyungpook National University (Daegu, Korea), Department of
Materials and Engineering
M. S. 2007, POSTECH (Pohang, Korea), Department of Materials Science and
Engineering
Ph.D. 2011, POSTECH (Pohang, Korea), Graduate Institute of Ferrous Technology,
Computational Metallurgy Group