Variable Rate Technology in Wheat
24
Variable Rate Technology in Wheat www.dasnr.okstate.edu/precision_ag
description
Variable Rate Technology in Wheat. www.dasnr.okstate.edu/precision_ag. 1993. Dr. Marvin Stone adjusts the fiber optics in a portable spectrometer used in early bermudagrass N rate studies with the Noble Foundation, 1994. - PowerPoint PPT Presentation
Transcript of Variable Rate Technology in Wheat

Variable Rate Technology in WheatVariable Rate Technology in Wheat
www.dasnr.okstate.edu/precision_agwww.dasnr.okstate.edu/precision_ag

19931993
Dr. John Solie, Dr. Marvin Stone, and Dr. Shannon Osborne collect sensor readings at ongoing bermudagrass, N rate * N timing experiments with the Noble Foundation in Ardmore, OK. Initial results were promising enough to continue this work in wheat.
Dr. Marvin Stone adjusts the fiber optics in a portable spectrometer used in early bermudagrass N rate studies with the Noble Foundation, 1994.

N R
ate
(lb
N/a
c)N
Rat
e (l
b N
/ac)
NDVI = NIR - RedNIR + Red
NDVI = NIR - RedNIR + Red
Increased soil background increased red reflectance decreased NDVIIncreased soil background increased red reflectance decreased NDVI
In this region, NDVI is influenced by
(a) soil(b) % coverage(c) color
In this region, NDVI is influenced by
(a) soil(b) % coverage(c) color
0010102020303040405050606070708080
0.20.2 0.30.3 0.40.4 0.50.5 0.60.6 0.70.7 0.80.8NDVINDVI
1010
2020
3030
4040
5050 N U
ptake (lb
N/a
c)N
Up
take (lb N
/ac)
In this region, NDVI is influenced by
(a) color.
In this region, NDVI is influenced by
(a) color.
Red 620-750 nmNIR 750-1x10⁶ nmRed 620-750 nmNIR 750-1x10⁶ nm
Distance, mDistance, m
Rep 2, Miller-2Rep 2, Miller-2
00
1010
2020
3030
4040
5050
6060
00 1010 2020 3030 4040 5050 6060 7070
Gra
in N
up
take
, kg
/ha
Gra
in N
up
take
, kg
/ha
Check 28.9 ± 6.4Check 28.9 ± 6.4
Variable Rate 48.5 ± 4.2Variable Rate 48.5 ± 4.2
Fixed Rate 44.1 ± 8.2 Fixed Rate 44.1 ± 8.2
19941994
Variable N rates using an inverse N-rate, NDVI scale were applied. N rates were cut in half with no differences in grain yield compared to fixed rates. Grain N uptake levels using VRT across a 70 meter transect were less variable when compared to the fixed rates (left).
John Ringer and Shannon Osborne collected sensor readings and later applied variable N fertilizer rates based on an initial bermudagrass algorithm.
Initial algorithms used to spatially treat N deficiencies in wheat and bermudagrass employed an inverse N Rate-NDVI scale.

New ‘reflectance’ sensor developed.
Samples were collected from every 1 square foot. These experiments helped to show that each 4ft2 in agricultural fields need to be treated as separate farms.
19951995
Extensive field experiments looking at changes in sensor readings with changing, growth stage, variety, row spacing, and N rates were conducted.

Collaborative Project with CIMMYT Variety Selection/Yield PotentialSpring Wheat 1995
Collaborative Project with CIMMYT Variety Selection/Yield PotentialSpring Wheat 1995

CIMMYT CIMMYT DateDate LocationLocation PersonnelPersonnel ObjectivesObjectivesFeb, 1997Feb, 1997 Ciudad ObregonCiudad Obregon TEAM-VRTTEAM-VRT Discuss potential Discuss potential
collaborative workcollaborative workJan, 1999Jan, 1999 Obregon & TexcocoObregon & Texcoco Steve Phillips, Joanne LaRuffa, Steve Phillips, Joanne LaRuffa,
Wade Thomason, Sherry Britton, Wade Thomason, Sherry Britton, Joe Vadder, Gordon Johnson, Joe Vadder, Gordon Johnson, John Solie, Dick WhitneyJohn Solie, Dick Whitney
IRSP 98, refine INSEY, 2-IRSP 98, refine INSEY, 2-wheel tractor and wheat wheel tractor and wheat bed planter designbed planter design
Sep, 1999Sep, 1999 TexcocoTexcoco Erna LukinaErna Lukina IRSP 98, use of EY as a IRSP 98, use of EY as a selection toolselection tool
Aug, 2000Aug, 2000 TexcocoTexcoco Marvin Stone, Kyle Freeman, Marvin Stone, Kyle Freeman, Roger Teal, Robert Mullen, Roger Teal, Robert Mullen, Kathie Wynn, Carly Washmon, Kathie Wynn, Carly Washmon, Dwayne NeedhamDwayne Needham
IRSP 99, applications of IRSP 99, applications of INSEY, sensor design INSEY, sensor design for plant breedingfor plant breeding
Jan-Mar 2001Jan-Mar 2001 Ciudad ObregonCiudad Obregon Kyle FreemanKyle Freeman Joint collaboration on Joint collaboration on 200-03530 NRI Grant200-03530 NRI Grant
Apr 2001Apr 2001 Ciudad ObregonCiudad Obregon Kyle FreemanKyle Freeman Wheat harvestWheat harvest
TOTALTOTAL 88 2626
July 2001July 2001 El BatanEl Batan Jagadeesh Mosali, Shambel MogesMicah Humphreys, Paul Hodgen,Carly Washmon
Jagadeesh Mosali, Shambel MogesMicah Humphreys, Paul Hodgen,Carly Washmon
Wheat harvestWheat harvest
Apr 2002Apr 2002 Ciudad ObregonCiudad Obregon Paul HodgenPaul Hodgen NASA GrantNASA Grant
19961996
Evaluation of management resolution at 3 locations
y = -15770x + 41909y = -15770x + 41909
RR22 = 0.73= 0.73
10001000
30003000
50005000
70007000
90009000
22 2.12.1 2.22.2 2.32.3 2.42.4 2.52.5 2.62.6
695/405695/405
We
t B
iom
ass
, kg
/ha
We
t B
iom
ass
, kg
/ha
May 29 1996May 29 1996
y = -15770x + 41909y = -15770x + 41909
RR22 = 0.73= 0.73
10001000
30003000
50005000
70007000
90009000
22 2.12.1 2.22.2 2.32.3 2.42.4 2.52.5 2.62.6
695/405695/405
We
t B
iom
ass
, kg
/ha
We
t B
iom
ass
, kg
/ha
May 29 1996May 29 1996
Indices developed where we could detect differences in N and P, independent of one another. For wheat, numerator wavelengths between 705 and 735, and denominator wavelengths between 505 and 545 proved to be reliable predictors of N and P uptake. In bermudagrass, the index 695/405 proved to be reproducible from one season to the next.
In, March, 1996, first variable rate N applicator demonstrated to the public
Relationship between total forage N uptake and NDVI was used to apply variable N rates in turf.

www.dasnr.okstate.edu/nitrogen_use
In 1997, our precision sensing team put together two web sites to communicate TEAM-VRT results. Since that time, over 20,000 visitors have been to our sites. (www.dasnr.okstate.edu/precision_ag)
19971997
00
10001000
20002000
30003000
40004000
50005000
60006000
0.010.01 0.020.02 0.030.03 0.040.04 0.050.05 0.060.06 0.070.07
NDVI F4+NDVI F5/days from F4 to F5NDVI F4+NDVI F5/days from F4 to F5
Gra
in Y
ield
Gra
in Y
ield
Perkins, N*PPerkins, N*P
Perkins, S*NPerkins, S*N
Tipton, S*NTipton, S*N
y = 1E+06x2 - 12974x + 951.24R2 = 0.89y = 1E+06x2 - 12974x + 951.24R2 = 0.89
The first attempt to combine sensor readings over sites into a single equation for yield prediction A modification of this index would later become known as INSEY (in-season estimated yield), but was first called F45D.

Cooperative research program with CIMMYT. Kyle Freeman and Paul Hodgen have each spent 4 months in Ciudad Obregon, MX, working with CIMMYT on the applications of sensors for plant breeding and nutrient management.
19981998
0
1
2
3
4
5
6
0 0.001 0.002 0.003 0.004 0.005 0.006 0.007 0.008
INSEY (NDVI Feekes 4-6/days from planting to Feekes 4-6)
Gra
in Y
ield
, M
g h
a
-1
N*P Perkins, 1998
S*N Perkins, 1998
S*N Tipton, 1998
N*P Perkins, 1999
Experiment 222, 1999
Experiment 301, 1999
Efaw AA, 1999
Experiment 801, 1999
Experiment 502, 1999
N*P Perkins, 2000
Experiment 222, 2000
Experiment 301, 2000
Efaw AA, 2000
Experiment 801, 2000
Experiment 502, 2000
Hennessey, AA, 2000
VIRGINIA (7 Loc's)
Cooperative Research Program with Virginia Tech

Covington, 1999Wheat Grain Yield
Covington, 1999Wheat Grain Yield
N Rate Method Yield Yieldlb/ac kg/ha bu/ac__________________________________________0 - 1122 16.740 Fixed 1269 18.980 Fixed 1846 27.568 YP-INSEY 2396 35.7SED 230 3.4
__________________________________________CV, % 19
N Rate Method Yield Yieldlb/ac kg/ha bu/ac__________________________________________0 - 1122 16.740 Fixed 1269 18.980 Fixed 1846 27.568 YP-INSEY 2396 35.7SED 230 3.4
__________________________________________CV, % 19
19991999Applications of indirect measures of electrical conductivity were evaluated in several field experiments. This work aims to identify added input variables to refine the in-season prediction of yield.
TEAM-VRT entered into discussions with John Mayfield concerning the potential commercialization of a sensor-based N fertilizer applicator for cereal crops.
Increased yields at lower N rates observed at Covington. Using the in-season response index (RINDVI), we were able to project responsiveness to applied N, which changes from location to location based on climatic conditions specific to each parcel of land, and that changes on the same land from year to year.
0
0.5
1
1.5
2
2.5
3
0 0.5 1 1.5 2 2.5 3
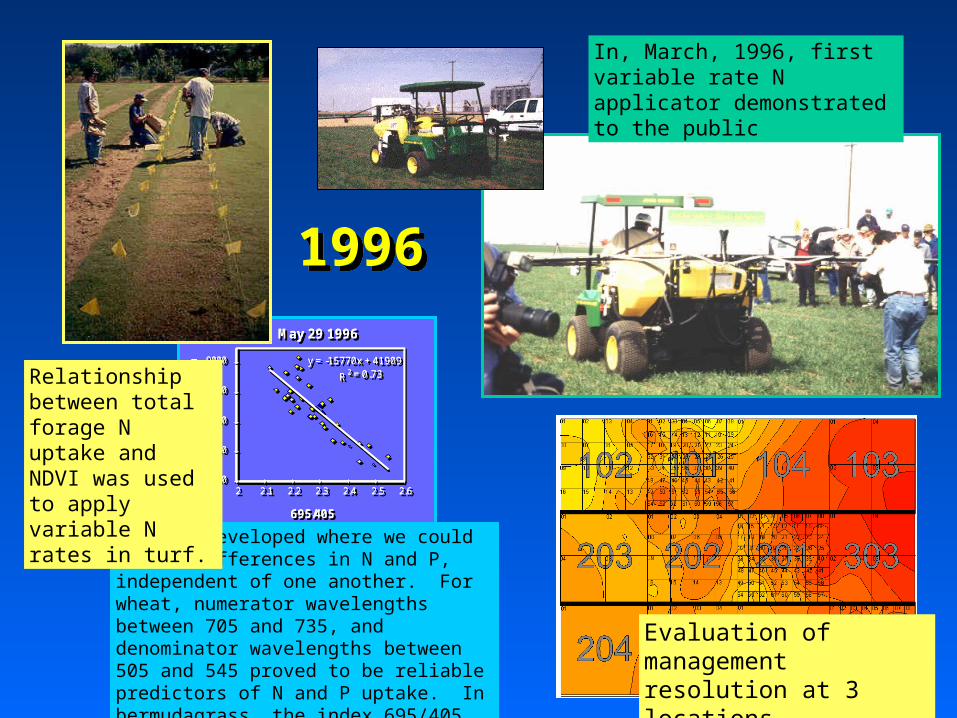
y = 1.06x + 0.18
R2 = 0.56
RI HarvestRI Harvest
RI NDVIRI NDVI
Predicted potential response to applied N using sensor measurements collected in-season. Approach allowed us to predict the magnitude of response to topdress fertilizer, and in time to adjust topdress N based on a projected ‘responsiveness.’
20002000
Fertilized N required to maximize yield (Lahoma, OK).
y = 0.65x + 27 (CV = 62)
0
10
20
30
40
50
60
70
80
90
19
71
19
74
19
76
19
78
19
80
19
82
19
84
19
86
19
88
19
90
19
92
19
94
19
96
19
98
20
00
Year
Fe
rtili
zer-
N (
lb/a
cre
)Discovered that the N fertilizer rate needed to maximize yields varied widely over years and was unpredictable in several long-term experiments. This led to his development of the RESPONSE INDEX.

Feekes 10
y = 0.0438e6.2862x
R2 = 0.75
0
1
2
3
4
5
6
7
8
9
0.3 0.5 0.7 0.9Red NDVI
Bio
ma
ss
(M
g/h
a)
20012001
Feekes 10
0
1
2
3
4
5
6
7
8
9
0 2 4 6 8Visual Score
Bio
mas
s (M
g/h
a)
N Fertilizer Optimization Algorithm (NFOA):
1. Predict potential grain yield or YP0 (grain yield achievable with no additional N fertilization) from the grain yield-INSEY equation, where;
INSEY = NDVI (Feekes 4 to 6)/days from planting to sensing (days with GDD>0)
YP0 = 0.74076 + 0.10210 e 577.66(INSEY)
2. Predict the magnitude of response to N fertilization (In-Season-Response-Index, or RINDVI). RINDVI, computed as; NDVI from Feekes 4 to Feekes 6 in non-N-limiting fertilized plots divided by NDVI Feekes 4 to Feekes 6 in the farmer check plots (common fertilization practice employed by the farmer). The non-N limiting (preplant fertilized) strip will be established in the center of each farmer field.
3. Determine the predicted yield that can be attained with added N (YPN) fertilization based both on the in-season response index (RINDVI) and the potential yield achievable with no added N fertilization, computed as follows:
YPN = (YP0)/ (1/RINDVI) = YP0 * RINDVI
4. Predict %N in the grain (PNG) based on YPN (includes adjusted yield level)
PNG = -0.1918YPN + 2.7836
5. Calculate grain N uptake (predicted %N in the grain multiplied times YPN)
GNUP = PNG*(YPN/1000)
6. Calculate forage N uptake from NDVI FNUP = 14.76 + 0.7758 e 5.468NDVI
7. Determine in-season topdress fertilizer N requirement (FNR)= (Predicted Grain N Uptake - Predicted Forage N Uptake)/0.70
FNR = (GNUP – FNUP)/0.70
Engineering, plant, and, soil scientists at OSU release applicator capable of treating every 4 square feet at 20 mph
Work with wheat and triticale plant breeders at CIMMYT, demonstrated that NDVI readings could be used for plant selection

0
1
2
3
4
5
6
0 0.002 0.004 0.006 0.008 0.01
INSEY=NDVI/Days from planting to sensing GDD>0
Gra
in y
ield
, M
g/ha
P erkins N&P , 1998P erkins S&N, 1998
Tipton S&N, 1998P erkins N&P , 1999
Experiment 222, 1999Experiment 301, 1999Efaw AA , 1999
Experiment 801, 1999Experiment 502, 1999
P erkins N&P , 2000Experiment 222, 2000Experiment 301, 2000
Efaw AA , 2000Experiment 801, 2000Experiment 502, 2000
Hennessey, AA , 2000P erkins N&P , 2001
Experiment 222, 2001Experiment 301, 2001Efaw AA , 2001
Experiment 801, 2001Experiment 502, 2001
Hennessey, AA , 2001
y=0.4593e246.3x
R2=0.55
Winter Wheat24 locations in Oklahoma1998-2001
Winter Wheat24 locations in Oklahoma1998-2001
y = 649.34e175.42x
R2 = 0.75
0
2
4
6
8
10
12
0 0.005 0.01 0.015 0.02
INSEY=NDVI/days from planting to sensing (GDD>0)
Gra
in y
ield
, kg
/ha
Spring Wheat4 locations in Ciudad Obregon, MX2001
Spring Wheat4 locations in Ciudad Obregon, MX2001
y = 0.5643e279.42x
R2 = 0.6476
0.0
1.0
2.0
3.0
4.0
5.0
6.0
0 0.002 0.004 0.006 0.008
INSEY=NDVI/days from planting, GDD>0
Gra
in y
ield
, M
g/h
a Soft White Winter Wheat7 locations in Virginia, 2001
Soft White Winter Wheat7 locations in Virginia, 2001

OklahomaOklahoma

October February June0 120 240 days
October February June0 120 240 days
50 lb N /ac
100 lb N/ac
75 lb N/ac75 lb N/ac
N u
pta
ke, l
b/a
cN
upt
ake
, lb
/ac
INSEY: Rate of N uptake over 120 days, > ½ of the total growing days
and should be a good predictor of grain yield
INSEY: Rate of N uptake over 120 days, > ½ of the total growing days
and should be a good predictor of grain yield
45 bu/ac, 2.5% N in the grain
days with GDD>0?
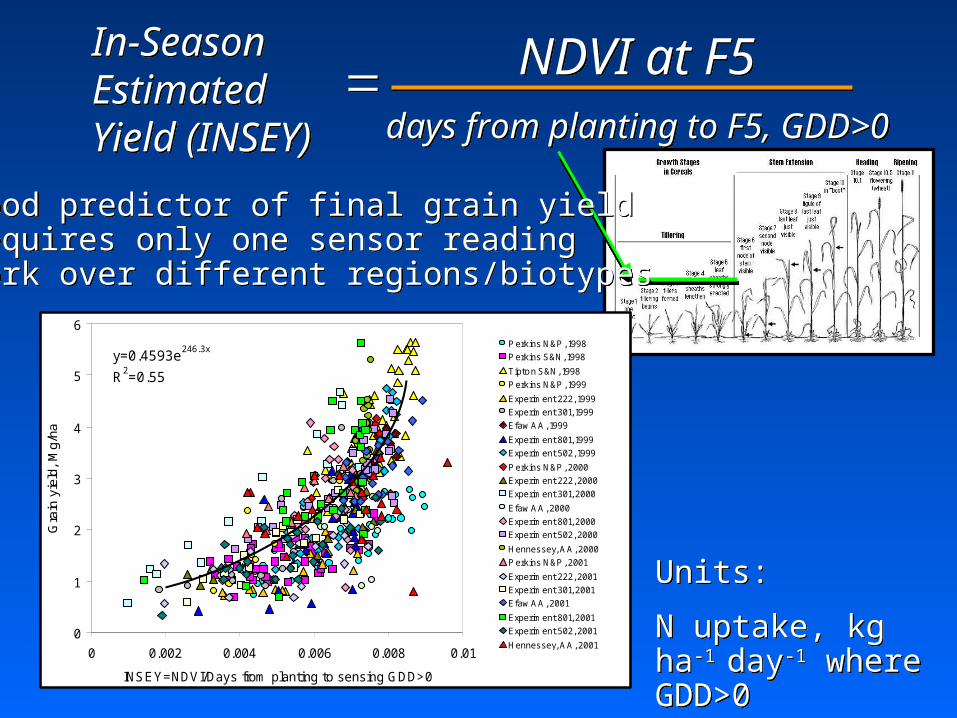
NDVI at F5 NDVI at F5 In-SeasonEstimatedYield (INSEY)
In-SeasonEstimatedYield (INSEY)
days from planting to F5, GDD>0 days from planting to F5, GDD>0
+Good predictor of final grain yield+Requires only one sensor reading+Work over different regions/biotypes
+Good predictor of final grain yield+Requires only one sensor reading+Work over different regions/biotypes
Units:
N uptake, kg ha-1
day-1 where GDD>0
Units:
N uptake, kg ha-1
day-1 where GDD>00
1
2
3
4
5
6
0 0.002 0.004 0.006 0.008 0.01
INSEY=NDVI/Days from planting to sensing GDD>0
Gra
in y
ield
, M
g/ha
P erkins N&P , 1998P erkins S&N, 1998
Tipton S&N, 1998P erkins N&P , 1999
Experiment 222, 1999Experiment 301, 1999Efaw AA , 1999
Experiment 801, 1999Experiment 502, 1999
P erkins N&P , 2000Experiment 222, 2000Experiment 301, 2000
Efaw AA , 2000Experiment 801, 2000Experiment 502, 2000
Hennessey, AA , 2000P erkins N&P , 2001
Experiment 222, 2001Experiment 301, 2001Efaw AA , 2001
Experiment 801, 2001Experiment 502, 2001
Hennessey, AA , 2001
y=0.4593e246.3x
R2=0.55

•Fertilize whole field with 40 lbs N/ac preplant
•Before exiting the field, apply one strip with 80 (non-N-limiting)
•Fertilize whole field with 40 lbs N/ac preplant
•Before exiting the field, apply one strip with 80 (non-N-limiting)

Why is it important to know the RI for a field?Why is it important to know the RI for a field?
Figure 1a. Wheat yield of plots receiving no added fertilizer N 1971-2001 (Lahoma, OK)
y = -0.0869x + 26.708
0
10
20
30
40
50
60
19
71
19
75
19
78
19
81
19
84
19
87
19
90
19
93
19
96
19
99
Year
Yie
ld (
bu
/ac
re)
Figure 1a. Wheat yield of plots receiving no added fertilizer N 1971-2001 (Lahoma, OK)
y = -0.0869x + 26.708
0
10
20
30
40
50
60
19
71
19
75
19
78
19
81
19
84
19
87
19
90
19
93
19
96
19
99
Year
Yie
ld (
bu
/ac
re) C.V. = 31C.V. = 31

So, what’s in it for the farmer?So, what’s in it for the farmer?Loss from fertilizing with 80 lb N/acre for a 40 bu yield
(Lahoma 502)
0
5
10
15
20
25
30
35
40
1971
1974
1976
1978
1980
1982
1984
1986
1988
1990
1992
1994
1996
1998
2000
Time
Lo
ss/a
cre
($)
Yld Loss Excs N LossTotal Loss
Loss from fertilizing with 80 lb N/acre for a 40 bu yield (Lahoma 502)
0
5
10
15
20
25
30
35
40
1971
1974
1976
1978
1980
1982
1984
1986
1988
1990
1992
1994
1996
1998
2000
Time
Lo
ss/a
cre
($)
Yld Loss Excs N LossTotal Loss
Ave Loss/ac/yr = $9.77Ave Loss/ac/yr = $9.77

RIRINDVINDVI and RI and RIHARVESTHARVESTRIRINDVINDVI and RI and RIHARVESTHARVEST
• Strong correlation between RIStrong correlation between RINDVINDVI (vegetative stages) and RI (vegetative stages) and RI HARVESTHARVEST • Accurately predict the crop’s ability to respond to N Accurately predict the crop’s ability to respond to N • RIRINDVINDVI may refine whether or not N should be applied, how much, and may refine whether or not N should be applied, how much, and
expected NUEexpected NUE
RINDVI=NDVI-N-non-limiting/NDVI-farmer checkRINDVI=NDVI-N-non-limiting/NDVI-farmer check
0
0.5
1
1.5
2
2.5
3
0 0.5 1 1.5 2 2.5 3
y = 1.06x + 0.18
R2 = 0.56
RI HarvestRI Harvest
RI NDVIRI NDVI
2000
1999
2001
1998

0
1
2
3
4
5
6
0 0.002 0.004 0.006 0.008 0.01
INSEY=NDVI/Days from planting to sensing GDD>0
Gra
in y
ield
, M
g/ha
P erkins N&P , 1998P erkins S&N, 1998
Tipton S&N, 1998P erkins N&P , 1999
Experiment 222, 1999Experiment 301, 1999Efaw AA , 1999
Experiment 801, 1999Experiment 502, 1999
P erkins N&P , 2000Experiment 222, 2000Experiment 301, 2000
Efaw AA , 2000Experiment 801, 2000Experiment 502, 2000
Hennessey, AA , 2000P erkins N&P , 2001
Experiment 222, 2001Experiment 301, 2001Efaw AA , 2001
Experiment 801, 2001Experiment 502, 2001
Hennessey, AA , 2001
y=0.4593e246.3x
R2=0.55
YP0YP0
YPNYPN
YPMAXYPMAX
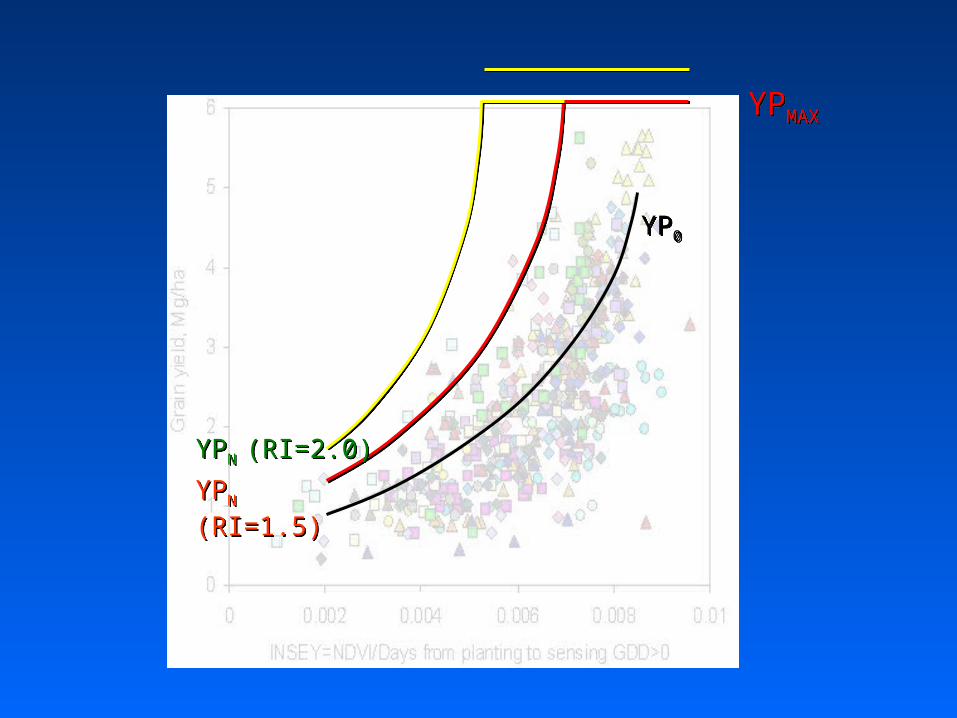
YP0YP0
YPN (RI=1.5)YPN (RI=1.5)
YPMAXYPMAX
YPN (RI=2.0)YPN (RI=2.0)

1
2
Predict RI
Predict YP0
Predict YPN based on RI
Fertilizer N = GNUPYPN –GNUPYP0/0.7
3
4
1
2
3
4