
VARIABILITY WIND POWER OTHER RENEWABLES Variability of Wind Power and other Renewables: Management...
57
VARIABILITY OF WIND POWER AND OTHER RENEWABLES Management options and strategies INTERNATIONAL ENERGY AGENCY
Transcript of VARIABILITY WIND POWER OTHER RENEWABLES Variability of Wind Power and other Renewables: Management...

VARIABILITY OF
WIND POWER AND
OTHER RENEWABLESManagement
options aanndd strategies
I N T E R N A T I O N A L E N E R G Y A G E N C Y

Variability of Wind Power and other Renewables: Management Options and Strategies
1
AcknowledgementsAt the IEA, this paper was written by Timur Gül and Till Stenzel. The project was supervised andguided by Rick Sellers and Antonio Pflüger. Olivier Lavagne d'Ortigue and Lorcan Lyons supportedthe verification of data and statistics. Ulrik Stridbaek commented on earlier drafts and providedmuch valuable time for discussions. Noé van Hulst and Ian Cronshaw provided further valuablecomments. Helpful comments were provided by the Renewable Energy Working Party (REWP) ofthe IEA's Committee on Energy Research and Technology (CERT).
This paper also benefited from many helpful discussions and comments from outside experts.Particular thanks go to Professor Goran Strbac (UMIST, UK), Professor Lennart Söder (KTH Stockholm,Sweden), David Milborrow (Consultant, UK), Professor Wolfgang Pfaffenberger (IU Bremen,Germany), Professor Georg Erdmann (TU Berlin, Germany), Christopher Rogers (National GridCompany, UK), Karsten Neuhoff (Cambridge University, UK), Brian Parsons (NREL, USA), John B.Cadogan (US DoE), Yih-Huei Wan (NREL, USA), Chris Bromley (IGNS, New Zealand), Peter Gardner(Garrad Hassan, UK), Hannele Holttinen (VTT, Finland), Knut Hofstad (NVE, Norway), AnaEstanqueiro (INETI, Portugal), Peter Christiansen (ELSAM, Denmark), Emmanuel Bué (RTE, France),Stefan Nowak (Chairman, IEA PVPS Implementing Agreement, Switzerland), Peter Goldman(Chairman, IEA Wind Energy Implementing Agreement, USA).
Naturally, all remaining errors and omissions are the authors' own responsibility.
International Energy Agency9, rue de la Fédération75739 Paris Cedex 15
www.iea.org


3
Variability of Wind Power and other Renewables: Management Options and Strategies
Executive SummaryThis working paper links the current debate about the 'intermittency' of wind power into the widercontext of natural cycles of resource availability of all renewable energy technologies. It investigateswhether there are technical limits to the market penetration of renewable energy technologies dueto these cycles and it discusses some of the economic implications and outlines key cost variables.Being an inherent aspect of the renewable resource, they are, in the case of mature renewable energytechnologies such as hydropower and biomass, well understood and managed. 'New' renewableenergy technologies such as wind power or solar PV have surfaced prominently in recent discussionsamong policy-makers, researchers and the media for two main reasons: Firstly, the rapid growth,especially of wind power, led to significant market share in some countries within a short timeframethus magnifying grid integration issues. Secondly, these technologies introduce a new quality ofnatural cycles in that they can fluctuate over short timescales intra-day and intra-hourly which requiresdifferent management strategies than previously established. In the case of wind energy, it is analyzedhow this affects the possibility of integrating renewables into electricity grids on a larger scale.
This review comes to the conclusion that a number of measures are necessary to integrate windenergy and other renewables into modern electricity grids, even though the fundamental technicalprinciples are not new. The geographical aggregation of generators such as wind turbines reduces thevolatility of output. Improved forecasting methods will make it more predictable. Both aspects arealready widely used in electricity markets. Furthermore, careful attention needs to be paid to theprovision of backup and reserve capacities and the timely extension of transmission and distributiongrids in order to ensure system stability at all times. In particular, transboundary electricity exchange isgoing to play an increasing role which will have to be assessed. Although these issues are also centralto market liberalisation and security of supply concerns, they will become even more important withincreasing market penetration of wind power. Finally, as each renewable energy technology fluctuatesover a different time-scale, important gains from the complementarity of these cycles can be achieved.
Beyond the above mentioned technical issues, the extent to which the intermittency of naturalresources will become a barrier to renewables is mainly a question of economics and marketorganisation. Grid extensions and the provision of reserves which are attributable to wind powercome at costs which have to be taken into account when considering the overall economics of windpower. The precise costs depend on a number of factors, including the level of market penetration ofwind power, the availability of the renewable resource, the state of the existing grid and currenttechnology mix. Transparent, inter-connected and well-functioning markets help to minimise thesegrid integration costs. This may require structural adaptation in some cases. In this context, marketgate-closure times between final declaration of forecasted generation and actual real-time usage playan important role; weather forecasting and modelling techniques become more precise the closerthey are to real time, thus shorter gate closure times would allow for more precise output estimatesand consequently better management. Currently, some markets are still designed with long gate-closure times which impose additional economic costs which are not necessarily based on technicalneeds. Taking this into account produces the right incentives for the development of a portfolio ofoptions to manage intermittency, including flexible new plants, storage technologies, distributedgeneration and demand-side response techniques.
This study draws mainly on experiences in Denmark and Germany and some theoretical analyses. Inorder to provide a more complete picture, in future analyses more countries will have to be consideredand effects of trans-boundary electricity flows will have to be taken into account in more detail.


Table of ContentsACKNOWLEDGEMENTS . . . . . . . . . . . . . . . . . . . . . . . . . . . . . . . . . . . . . . . . . . . . . . . . . . . . . . . . . . . . . . . . . . . . . . . . . . . . . . . . 1
EXECUTIVE SUMMARY . . . . . . . . . . . . . . . . . . . . . . . . . . . . . . . . . . . . . . . . . . . . . . . . . . . . . . . . . . . . . . . . . . . . . . . . . . . . . . . . . . 3
1. INTRODUCTION . . . . . . . . . . . . . . . . . . . . . . . . . . . . . . . . . . . . . . . . . . . . . . . . . . . . . . . . . . . . . . . . . . . . . . . . . . . . . . . . . . . . . 7
2. NATURAL CYCLES OF RENEWABLES ENERGY TECHNOLOGIES . . . . . . . . . . . . . . . . . . . . . . . . . 9
Overview . . . . . . . . . . . . . . . . . . . . . . . . . . . . . . . . . . . . . . . . . . . . . . . . . . . . . . . . . . . . . . . . . . . . . . . . . . . . . . . . . . . 9
Hydropower. . . . . . . . . . . . . . . . . . . . . . . . . . . . . . . . . . . . . . . . . . . . . . . . . . . . . . . . . . . . . . . . . . . . . . . . . . . . . . . . . . . . . . . . 10
Geothermal . . . . . . . . . . . . . . . . . . . . . . . . . . . . . . . . . . . . . . . . . . . . . . . . . . . . . . . . . . . . . . . . . . . . . . . . . . . . . . . . . . . . . . . . 11
Biomass . . . . . . . . . . . . . . . . . . . . . . . . . . . . . . . . . . . . . . . . . . . . . . . . . . . . . . . . . . . . . . . . . . . . . . . . . . . . . . . . . . . . . . . . . . . . 11
Solar PV. . . . . . . . . . . . . . . . . . . . . . . . . . . . . . . . . . . . . . . . . . . . . . . . . . . . . . . . . . . . . . . . . . . . . . . . . . . . . . . . . . . . . . . . . . . . . 12
Wind . . . . . . . . . . . . . . . . . . . . . . . . . . . . . . . . . . . . . . . . . . . . . . . . . . . . . . . . . . . . . . . . . . . . . . . . . . . . . . . . . . . . . . . . . . . . . . . . 12
Wave/Tidal . . . . . . . . . . . . . . . . . . . . . . . . . . . . . . . . . . . . . . . . . . . . . . . . . . . . . . . . . . . . . . . . . . . . . . . . . . . . . . . . . . . . . . . . . . 13
Summary . . . . . . . . . . . . . . . . . . . . . . . . . . . . . . . . . . . . . . . . . . . . . . . . . . . . . . . . . . . . . . . . . . . . . . . . . . . . . . . . . . . . . . . . . . . . . 13
3. INTEGRATING WIND INTO ELECTRICITY GRIDS . . . . . . . . . . . . . . . . . . . . . . . . . . . . . . . . . . . . . . . . . . . 17
Grid operation and ancillary services . . . . . . . . . . . . . . . . . . . . . . . . . . . . . . . . . . . . . . . . . . . . . . . . . . . . . . . . . . . . 17
Wind power aggregation, grid operations and interconnection . . . . . . . . . . . . . . . . . . . . . . . . . . . 19
Weather forecasts and gate-closure times . . . . . . . . . . . . . . . . . . . . . . . . . . . . . . . . . . . . . . . . . . . . . . . . . . . . . . 22
Options for managing intermittency . . . . . . . . . . . . . . . . . . . . . . . . . . . . . . . . . . . . . . . . . . . . . . . . . . . . . . . . . . . . . 25
Power plants providing operational and capacity reserve . . . . . . . . . . . . . . . . . . . . . . . . . . . . . . . . . . . . . . . 26
Storage . . . . . . . . . . . . . . . . . . . . . . . . . . . . . . . . . . . . . . . . . . . . . . . . . . . . . . . . . . . . . . . . . . . . . . . . . . . . . . . . . . . . . . . . . . . . . 27
Interconnection with other grids. . . . . . . . . . . . . . . . . . . . . . . . . . . . . . . . . . . . . . . . . . . . . . . . . . . . . . . . . . . . . . . . . . 29
Distributed generation. . . . . . . . . . . . . . . . . . . . . . . . . . . . . . . . . . . . . . . . . . . . . . . . . . . . . . . . . . . . . . . . . . . . . . . . . . . . . 30
Demand Side Response (DSR). . . . . . . . . . . . . . . . . . . . . . . . . . . . . . . . . . . . . . . . . . . . . . . . . . . . . . . . . . . . . . . . . . . . . 31
Curtailment of wind farms . . . . . . . . . . . . . . . . . . . . . . . . . . . . . . . . . . . . . . . . . . . . . . . . . . . . . . . . . . . . . . . . . . . . . . . . 32
Summary of options . . . . . . . . . . . . . . . . . . . . . . . . . . . . . . . . . . . . . . . . . . . . . . . . . . . . . . . . . . . . . . . . . . . . . . . . . . . . . . . 32
Costs of wind power integration . . . . . . . . . . . . . . . . . . . . . . . . . . . . . . . . . . . . . . . . . . . . . . . . . . . . . . . . . . . . . . . . . 33
Markets for managing intermittency . . . . . . . . . . . . . . . . . . . . . . . . . . . . . . . . . . . . . . . . . . . . . . . . . . . . . . . . . . . . . 36
DSR in the United Kingdom and Scandinavia . . . . . . . . . . . . . . . . . . . . . . . . . . . . . . . . . . . . . . . . . . . . . . . . . . . . 36
United States balancing market. . . . . . . . . . . . . . . . . . . . . . . . . . . . . . . . . . . . . . . . . . . . . . . . . . . . . . . . . . . . . . . . . . . 37
United Kingdom NETA system . . . . . . . . . . . . . . . . . . . . . . . . . . . . . . . . . . . . . . . . . . . . . . . . . . . . . . . . . . . . . . . . . . . . 37
Connection of offshore wind . . . . . . . . . . . . . . . . . . . . . . . . . . . . . . . . . . . . . . . . . . . . . . . . . . . . . . . . . . . . . . . . . . . . . 39
Summary . . . . . . . . . . . . . . . . . . . . . . . . . . . . . . . . . . . . . . . . . . . . . . . . . . . . . . . . . . . . . . . . . . . . . . . . . . . . . . . . . . . . . . . . . . . 40
4. SUMMARY AND LESSONS LEARNED . . . . . . . . . . . . . . . . . . . . . . . . . . . . . . . . . . . . . . . . . . . . . . . . . . . . . . . . . 41
Technical lessons from integrating wind energy . . . . . . . . . . . . . . . . . . . . . . . . . . . . . . . . . . . . . . . . . . . . . . . 41
Economic and policy lessons . . . . . . . . . . . . . . . . . . . . . . . . . . . . . . . . . . . . . . . . . . . . . . . . . . . . . . . . . . . . . . . . . . . . . . 43
5. CONCLUSIONS: LESSONS LEARNED FOR ALL RENEWABLES . . . . . . . . . . . . . . . . . . . . . . . . . . 47
6. REFERENCES . . . . . . . . . . . . . . . . . . . . . . . . . . . . . . . . . . . . . . . . . . . . . . . . . . . . . . . . . . . . . . . . . . . . . . . . . . . . . . . . . . . . . . . 51
5
Variability of Wind Power and other Renewables: Management Options and Strategies

Variability of Wind Power and other Renewables: Management Options and Strategies
6
List of Figures
Figure 1: Hydropower capacity and electricity production in Norway . . . . . . . . . . . . . . . . . . . . . . . . . . . . . . . . 10
Figure 2: Timescales of natural cycles of renewable energies . . . . . . . . . . . . . . . . . . . . . . . . . . . . . . . . . . . . . . . . . 14
Figure 3: The smoothing effects of geographical dispersion of a single wind farmand distributed wind farms, both rated at 1000MW. . . . . . . . . . . . . . . . . . . . . . . . . . . . . . . . . . . . . . . . 20
Figure 4: The smoothing effects of geographical dispersion on output variations . . . . . . . . . . . . . . . . . 21
Figure 5: Intra-hourly load changes in Western Denmark, with and without 20% wind. . . . . . . . . . . . 22
Figure 6: Reducing added back-up for wind . . . . . . . . . . . . . . . . . . . . . . . . . . . . . . . . . . . . . . . . . . . . . . . . . . . . . . . . . . . 24
Figure 7: Time and power rating of various electricity storage systems. . . . . . . . . . . . . . . . . . . . . . . . . . . . . . . 28
Figure 8: Spread of System Sell Prices (SSP) and System Buy Prices (SBP) on theUK NETA markets since April 2001 . . . . . . . . . . . . . . . . . . . . . . . . . . . . . . . . . . . . . . . . . . . . . . . . . . . . . . . . . . . 38
Figure 9: The benefit of reducing gate-closure times in the UK . . . . . . . . . . . . . . . . . . . . . . . . . . . . . . . . . . . . . . . 39
List of Tables
Table 1: Average annual growth rates of renewable energy sources in TPES. . . . . . . . . . . . . . . . . . . . . . . . . 7
Table 2: Reserve capacities in Germany, Ireland and the United States. . . . . . . . . . . . . . . . . . . . . . . . . . . . . . 18
Table 3: Various storage technologies and typical technical performance. . . . . . . . . . . . . . . . . . . . . . . . . . . 27
Table 4: Costs of extra balancing wind in the UK . . . . . . . . . . . . . . . . . . . . . . . . . . . . . . . . . . . . . . . . . . . . . . . . . . . . . 34
Table 5: Experienced and modeled costs of integrating wind power . . . . . . . . . . . . . . . . . . . . . . . . . . . . . . 35
Table 6: Levels of wind penetration and corresponding issues. . . . . . . . . . . . . . . . . . . . . . . . . . . . . . . . . . . . . . . 42
1. IntroductionIn many IEA countries, renewable energy technologies receive increasing attention and with thelatest International Renewable Energy Conference in Bonn, 2004, several countries have setambitious targets for renewables. As a result, the World Energy Outlook 2004 expects all renewablesto account for a share of 19% in world electricity generation 2030 in the reference scenario, and even24% in the alternative policy scenario (IEA 2004b).
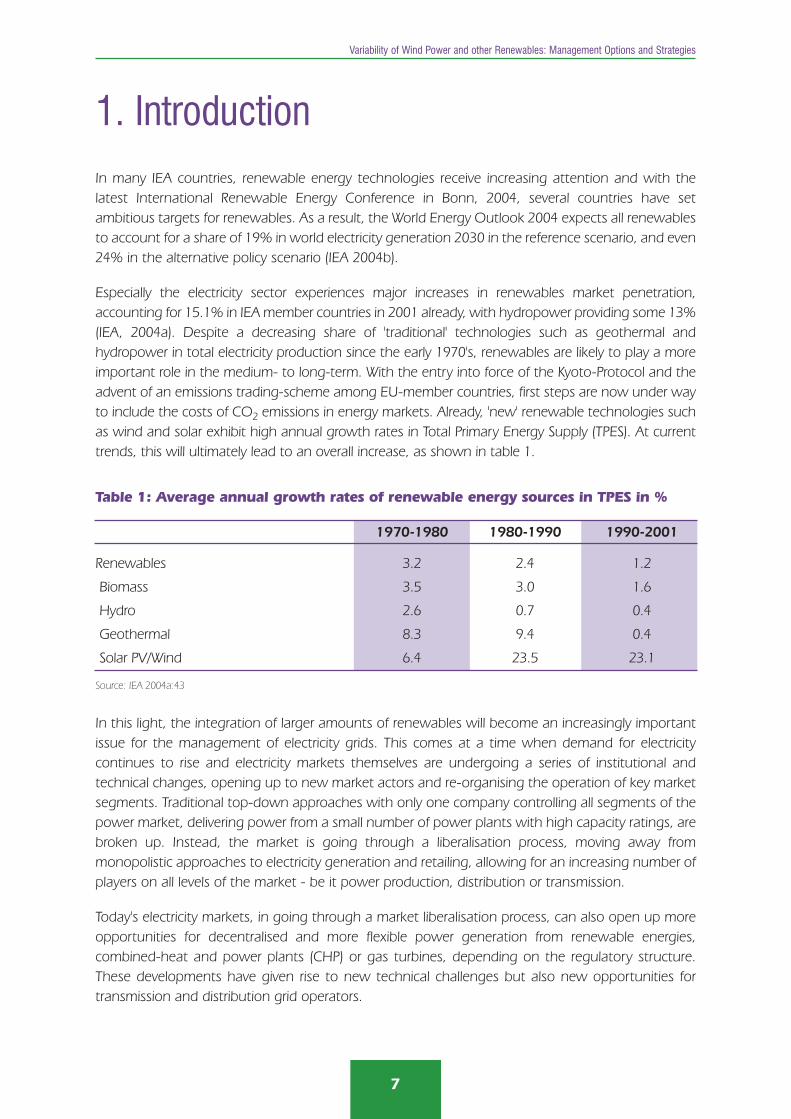
Especially the electricity sector experiences major increases in renewables market penetration,accounting for 15.1% in IEA member countries in 2001 already, with hydropower providing some 13%(IEA, 2004a). Despite a decreasing share of 'traditional' technologies such as geothermal andhydropower in total electricity production since the early 1970's, renewables are likely to play a moreimportant role in the medium- to long-term. With the entry into force of the Kyoto-Protocol and theadvent of an emissions trading-scheme among EU-member countries, first steps are now under wayto include the costs of CO2 emissions in energy markets. Already, 'new' renewable technologies suchas wind and solar exhibit high annual growth rates in Total Primary Energy Supply (TPES). At currenttrends, this will ultimately lead to an overall increase, as shown in table 1.
Table 1: Average annual growth rates of renewable energy sources in TPES in %
1970-1980 1980-1990 1990-2001
Renewables 3.2 2.4 1.2
Biomass 3.5 3.0 1.6
Hydro 2.6 0.7 0.4
Geothermal 8.3 9.4 0.4
Solar PV/Wind 6.4 23.5 23.1
Source: IEA 2004a:43
In this light, the integration of larger amounts of renewables will become an increasingly importantissue for the management of electricity grids. This comes at a time when demand for electricitycontinues to rise and electricity markets themselves are undergoing a series of institutional andtechnical changes, opening up to new market actors and re-organising the operation of key marketsegments. Traditional top-down approaches with only one company controlling all segments of thepower market, delivering power from a small number of power plants with high capacity ratings, arebroken up. Instead, the market is going through a liberalisation process, moving away frommonopolistic approaches to electricity generation and retailing, allowing for an increasing number ofplayers on all levels of the market - be it power production, distribution or transmission.
Today's electricity markets, in going through a market liberalisation process, can also open up moreopportunities for decentralised and more flexible power generation from renewable energies,combined-heat and power plants (CHP) or gas turbines, depending on the regulatory structure.These developments have given rise to new technical challenges but also new opportunities fortransmission and distribution grid operators.
7
Variability of Wind Power and other Renewables: Management Options and Strategies

Variability of Wind Power and other Renewables: Management Options and Strategies
8
With higher market penetrations of renewable energy technologies, however, some electricitysystems in IEA countries will increasingly need to cope with an important variable: natural cycles ofrenewable energies. Natural cycles relate to a phenomenon, which all renewable energies have incommon, as will subsequently be shown. Renewables by their very nature vary their output withnatural conditions, albeit, depending on the technology, on different timescales. These fluctuationsof renewable electricity output can pose challenges in managing electricity grids. On the other hand,hydropower (pumped-storage) has been used for a long time to level out short- and mid-termfluctuations in electricity production and consumption. Hence, the issue of unmatched demand andsupply is not completely new and in many cases understood.
The most prominent example in media and policy discussions is wind power, where the naturalfluctuations have received a great deal of attention in recent years and have led to concerns aboutwind integration. Regions such as Western Denmark and Northern Germany, where windpenetration levels have become significant, have become "case studies" for the integration ofrenewables in general, and wind power in particular. The challenges that the high share of windpower poses both for these countries and its neighbours are highlighted in chapter 3.
On the question of wind intermittency, a lot of research has been carried out on the American andEuropean electricity markets. Initially, it was believed that only a small amount of intermittentcapacity was permissible on the grid without compromising system stability. However, with practicalexperience gathering, for example in the Western Danish region where over 20% of the yearlyelectricity load is covered with wind energy, this view has been refuted. Instead of rejectingintermittent technologies outright for want of dispatchable capacity, a number of papers haverecently focused on management techniques that minimise disruption to the grid and thus allow forhigher penetration of renewable technologies.
Nevertheless, the questions whether natural cycles of renewables have impacts on renewableenergy market potential, and whether there are upper limits to renewable energy share in electricitysupply, have become critical for policy-makers. This study reviews and draws together the existingliterature from a number of countries and puts it into the context of the current debate. It thuspresents the current thinking on the technical and policy implications of variable electricity supplyfrom renewable energy sources and offers insights and methodological guidance for interestedparties who want to assess these issues within their own national circumstances. In chapter 2, it willgive a detailed overview on the natural cycles of different renewable energy technologies to providea context for the subsequent chapters. Chapter 3 will focus on the currently prominent example ofthe integration of wind power into electricity grids as an example for renewable energies in general.Options for grid management, reserves and policy are outlined and a review of current costestimates of system integration is presented. Chapter 4 will summarise the key technical and policychallenges that arise for the system integration of wind while chapter 5 will broaden the picture andanalyse the wider lessons learned for the integration of all renewable energy technologies intoelectricity grids and conclude.

9
Variability of Wind Power and other Renewables: Management Options and Strategies
2. Natural Cycles of RenewablesEnergy Technologies
OverviewAll renewable technologies ultimately derive energy from natural sources that vary in their availabilityover different timescales. Even fossil fuels like oil, gas and coal have natural cycles of regenerationwhich, however, occur on a timescale several orders of magnitude longer than what is discussed in thecontext of this study.
In this chapter, an overview will be given on some key renewable technologies and the natural cycleson which they depend. These can range from seasonal changes, which are important for hydropower but also for wind, to minute-by-minute changes of cloud cover which, for example, affectSolar PV arrays.
As noted in the introduction, the natural cycle of wind has frequently received the greatest amount ofattention by policy makers, industry and the media. Undeniably, the varying output of wind energycould destabilise electricity grids if no precautions are taken. However, the large-scale blackouts thathave been witnessed in Western Europe and North America in recent years were completely unrelatedto the wind energy installed in the respective countries.
Two factors have especially contributed to the prominence of the fluctuation of wind power in publicawareness. Firstly, it has seen rapid growth in a number of countries, raising its share of electricityproduction to a significant proportion within a short amount of time. Secondly, it has introduced a newquality of intermittent supply which has been less important for other technologies, namely, that ofintra-day and intra-hourly output changes.
Two Large scale research projects in Europe, the IRED-Cluster ("Integration of Renewable EnergySources and Distributed Generation into the European Electricity Grid") and EU-DEEP ("The birth of aEuropean Distributed EnErgy Partnership that will help the large-scale implementation of distributedenergy resources in Europe"), have analysed and continue to examine the options and challenges tointegrate renewable energy sources and notably wind energy into existing electricity grids.1 TheNational Renewable Energy Laboratories (NREL) and Sandia National Laboratories in the US have acontinuous research programme on grid-integration challenges of wind power.
In this context, the following paragraphs aim to show how the fluctuation of wind is part of the widerpicture of variations in natural resources that affect a range of technologies, many of which have beenused for long periods of times. Methods have been developed to successfully cope with seasonalfluctuations of a variety of technologies. Following research and development (R&D) efforts that werespurred by the oil price shock in the 1970s, three technologies became especially prominent2:Hydropower, geothermal and biomass. All three technologies have an inherent element of naturalcycles which will be reviewed in the following paragraphs. The 'new' renewable energy technologiesthat are currently developed introduce new qualities of natural cycles. The main technologiesconsidered for this section are solar PV, wind and wave/tidal.
1. More information on these research projects can be found on the websites www.ired-cluster.org and www.eu-deep.com.2. See also IEA (2004a), which gives a timeline of IEA member countries' R&D efforts in renewable energy technologies.

Variability of Wind Power and other Renewables: Management Options and Strategies
10
HHyyddrrooppoowweerr
Hydropower plants had a 16.2% share in global electricity production in 2002. The two most importanttypes of hydropower plants considered here are run-of-river plants and dams. The capacity of a hydroplant to produce electricity ultimately depends on the water cycle providing seasonal rain and runofffrom snow pack. This has slightly different impacts in each of the two methods. Run-of-river plantsproduce electricity according to the flow of water in the river it has been built in. Water is shored at low-head hydroelectric plants and channeled through turbines using the natural force of the river flow.Seasonal variations determine the water level in the river and thus the strength of the water flow andits implicit available energy. Dams are often built in mountainous regions where the natural topographycan be used to create artificial lakes at low costs. The runoff from rain and snow is thus collected andfunnelled through dedicated pipes into a powerhouse downstream where it powers a turbine. Again,seasonal variability determines the availability of water and thus the total potential energy that can bestored in the artificial lakes.
Hydropower today is the main energy carrier to store electricity at a large-scale. Besides the naturalaccumulation of water in reservoirs, pumped-storage facilities offer the opportunity to pump water andthus potential energy upstream and release it again when required. The typical round-trip efficiency ofthis method is around 80%. The benefits of pumped-hydro storage reservoirs are further examined inchapter 3.
Figure 1 shows the experience of Norway, a country whose electricity system is 99% dependent onhydro power. For example, between 1995 and 1996, actual annual electricity production from hydropower dropped by about 17,000 GWh. This can be attributed to low annual rainfalls and thus lowerpotential energy to be utilised by hydro power plants. Conversely, between 1999 and 2000, annualhydroelectricity production rose by about 15,000 GWh.
Figure 1: Hydropower capacity and electricity production in Norway
Source: IEA, 2004a:510

Drought periods can become a problem when they coincide with periods of high electricity demand.For example in southern climates, hot periods are often associated with annual peak demand on thesystem as well as relative droughts.
GGeeootthheerrmmaall
Geothermal is energy available as heat emitted from within the earth, usually in the form of hot wateror steam. Geothermal heat has two sources: the original heat produced from the formation of theearth by gravitational collapse and the heat produced by the radioactive decay of various isotopes. It isvery site dependent and can be used for heating and power generation purposes. Since the earth'scrust is continuously emitting heat towards its surface, geothermal is in principle an inexhaustibleenergy source, with the centre of the earth having cooled down by only about 2% over the earth'slifetime of about 4 billion years.
However, despite this consistency, even geothermal power can be subject to cyclic changes. Excessivecooling can occur within a field not only due to rapid returns of re-injected cooler water, but also fromnatural inflows from the periphery of the resource or from shallow cooler groundwater. In this case, thegeothermal field can be "rested" to allow for natural reheating. Depending on the permeability of thehot recharge fluid channels and the mix of conductive versus advective heat flow, this process can takeanywhere from decades to hundreds of years (Bromley 2004).
Excessive cooling of geothermal fields, though, is a well-known fact. Re-siting of re-injection wells toreduce cooling effects was quite commonly necessary in the 1970s to 1990s. Today, better strategieshave evolved and major adjustments are less common. Flexible field management allows for changesin strategy in the event of rapid localised cooling, i.e. through re-siting of wells. Staged developmentallows for reliably predicting effects of future operation and choosing of the right strategy by feedinginformation gathered from each expansion stage into mathematical reservoir models. Commonpractices include simply shutting down the field for a period and allowing the resource to recovernaturally, or to drilling deeper wells and retiring the old shallow wells to allow for shallow heat recovery.This keeps geothermal power output fluctuations at a minimum (Bromley 2004).
BBiioommaassss
Biomass can be used for a great variety of energy needs, from heating and transport fuel to powergeneration. There are technologies for using biomass as liquid and gaseous fuel, as well as traditionalapplications of direct combustion. The basis for all these applications is organic matter, in most casesplants and trees. There is a trend towards purposefully planted biomass crops although biomass canalso be collected as a by-product and residue from forestry, industry and household waste.
It is projected that growth in biomass applications in IEA countries will mostly come from newtechnologies that depend on dedicated plantations and by-products from sustainable forestry. Thus,the supply of biomass depends to a significant extent on the seasonal cycle of these dedicated plants.To increase the use of biomass for electricity generation and heat production, there is an increasingfocus on dedicated energy crops such as short-rotation coppice which allow frequent harvest cyclesper year. The area that can be thus planted and the number of harvests per year will determine themaximum amount of energy that can be derived in this way. Should the use of biomass increase in allits applications, these limitations might become more pronounced.
11
Variability of Wind Power and other Renewables: Management Options and Strategies

Variability of Wind Power and other Renewables: Management Options and Strategies
12
A second, albeit man-made, variability arises when biomass is used in combined-heat-and-powerplants (CHP). For example, in the Scandinavian countries, combined heat and power production isdominant for biomass. For industry residues this production is quite constant over the year but fordistrict heating this results in electricity production of biomass having seasonal variation (production highat winter with high heat load), as well as some daily variations, according to temperature/heat load.
In principle, a global market for biomass products can be envisaged taking advantage of differentclimates and types of vegetation around the world. There is an increasing interest in ethanol as analternative transport fuel but currently few countries plant significant amounts of plants such assugar cane for this purpose. Brazil, one of the forerunners in this field, is a major exporter of thisproduct with a volume of about 800 million litres and some 25% of the world's ethanol exportmarket. The Netherlands forecast a significant biomass market in Europe in their energy transitionstrategy with major supplies expected to come from Scandinavian forestry. The boundaries thatseasonal cycles put on the maximum amount of energy derived from biomass can thus be extended,but will ultimately run into competition from other land use interests and possibly competing usesof biomass itself. If current growth forecasts of biomass usage become reality seasonal cycles willsurface more prominently on the policy agenda.
SSoollaarr PPVV
Photovoltaic cells convert sun light directly into electrical energy. The amount of energy that can beproduced is directly dependent on the sunshine intensity and the angle at which solar PV cells areradiated. Thus, for example, PV cells are capable of producing electricity even in winter and evenduring cloudy weather albeit at a reduced rate. Natural cycles in the context of PV cells thus havethree dimensions. As with the previously discussed technologies, it has a seasonal variation inpotential electricity production with the peak in summer although in principle PV cells operatingalong the equator have an almost constant exploitable potential throughout the year. Secondly,electricity production varies on a diurnal basis from dawn to dusk peaking during mid-day. Finally,short-term fluctuation of weather conditions, including clouds and rain fall, impact on the inter-hourly amount of electricity that can be harvested. Short-term fluctuations are reduced bygeographically distributed PV production.
WWiinndd
Wind turbines convert wind power into electrical energy. The amount of energy that can be producedis directly dependent on the wind speed, more precisely on the cube of the wind speed. The windspeeds, at which wind turbines commonly operate, are between 2.5 to 25 m/s. Thus, wind power canbecome unavailable at times of low wind speeds, but also at times of very high wind speed, whenwind turbines need to be shut down in order to avoid damage of equipment.
Wind power can fluctuate at various time scales; it is subject to seasonal variations of peak electricityproduction in winter or summer depending on the region, as well as diurnal and hourly changes.Generally, very short-term fluctuations - in the intra-minute and inter-minute timeframe - are smallrelative to installed capacity, compared to hourly or daily variations and levelled out when consideringlarger areas of production. Furthermore, wind forecasting and aggregation of wind turbines mitigateagainst short-term fluctuations, a topic which will be elaborated in chapter 3. Ultimately, the degree ofvariations is also very site dependent, as for example see breezes are much more constant than areland breezes.

13
Variability of Wind Power and other Renewables: Management Options and Strategies
WWaavvee//TTiiddaall
Utilizing the energy of the World's Oceans provides a very promising approach to produce electricity.However, despite a rather big potential, ocean energy systems have not yet passed the stage ofdemonstration projects and are yet limited to a few selected sites due to several drawbacks (technologyrelated, location related, and economics). Although large ocean areas provide for a rather stableenvironment, wave and tidal power generation shows intermittent aspects as well.
Tides are generated by the rotation of the earth, causing periodical movements of the oceans' surfaceaccording to three interacting cycles:
A half-day cycle caused by the rotation of the earth within the rotational field of the moon resultsin tidal movements every 12 hours and 25 minutes.
A 14-day cycle based on the superposition of the gravitational fields of moon and sun.
Interaction of the gravitational fields of sun and moon at new and full moon result in maximumspring tides. Minimum neap tides occur at quarter phases of the moon, when the sun's force ofattraction cancels out that of the moon.
As these movements are generally well understood, the variability of tidal energy is highly predictable.Still, output from tidal plants varies by a factor of four over a spring-neap cycle (Pontes et al. 2001).
Wave energy largely depends on wind: Wind speed, duration of wind blow and fetch define theamount of energy transferred. Despite this wind dependency, fluctuations of wave energy are different,as waves in deep water lose their energy and by this smooth out only slowly and therefore can travellong distances. Wave energy, however, is subject to cyclic fluctuation as well, dominated by waveperiods and wave heights. This lets power levels vary both on a daily and monthly basis, with seasonalvariations being less in more temperate zones.
Summary
As discussed above, cyclic changes refer to the natural variability of renewable energy resources andare therefore a general phenomenon of all renewable energies. One can refer to natural cycles both asa relatively short-term (intra-day or inter-day) variation in output as well as a long-term variation(seasonal changes). Figure 2 summarises the time-scales over which the various technologies operate.
Since natural variations of resource availability do not necessarily correspond with the (also varying)need of the consumers, balancing supply and demand is a critical issue, potentially requiring backupby other means of energy supply. The variations can occur at any time-scale: hourly changes inoutput require balancing of short-term fluctuations by the so-called 'operational reserve', while dayswith low output require balancing of longer-term output fluctuations by so-called 'capacity reserves',as further discussed in chapter 3. Conversely, exceptionally windy days or rainy seasons can producea surplus of supply and their might be an issue of handling excess capacity where grids are notsufficiently interconnected.
On the other hand, hydropower has played an important role as backup power and electricitystorage for years. Together with other renewables such as biomass and geothermal it also has thepotential to serve as backup power as shares of renewables in electricity supply increase.

Variability of Wind Power and other Renewables: Management Options and Strategies
14
Figure 2: Timescales of natural cycles of renewable energies
Currently, natural cycles of renewables have become an issue to grid operations on a regional levelbecause of fluctuations in hydropower and wind. Other technologies have either not yet reached alevel of penetration where their variations are of importance for balancing the electricity system, orhave been integrated relatively successful.
In summary, although natural cycles of renewables have usually been considered in the context ofwind power (“intermittency”3), this does not have to be the case, as has been demonstrated above.In the future, the wider application of other renewable energy technologies such as solar energy andbiomass might necessitate similar analysis. Although natural cycles are inherent in all renewabletechnologies, solutions were found to manage them as in the case of hydropower. Norway'selectricity production, for example, is 99% based on hydro power but it has to be prepared to copewith years of below-average as well as above-average rainfall to maintain its electricity supply. Themain avenue used to cope with these fluctuations is hydro-storage and interconnection with itsneighbouring countries in Scandinavia and a concomitant market liberalisation that allows fortransparent signalling of supply shortages and overcapacities to induce market participants to adjustsupply into and out of Norway when necessary. This issue will be re-examined when discussing thevariability of wind in chapter 3.
As figure 2 showed, natural cycles of renewables operate over different time-scales. Utilising a varietyof technologies that draw on a range of renewable resources will reduce the risk of any one cyclehaving a critical bearing on the system balance and will thus reduce costs. In fact, in a number ofstudies that will be considered in this report, a portfolio of renewable energy technologies have beenconsidered concomitantly. One study by Sinden (2002) considered the optimal portfolio ofrenewables to supply a targeted amount of electricity per year. It found that requirements for backup
3. For simplicity, the terms 'natural variability' and 'intermittency' will be used interchangeably. See for example also the definition of the USEnergy Information Administration (EIA, 2004): "Intermittent electric generator or intermittent resource: An electric generating plant withoutput controlled by the natural variability of the energy resource rather than dispatched based on system requirements."

15
Variability of Wind Power and other Renewables: Management Options and Strategies
capacity for wind power could be reduced by almost two thirds if the same amount of electricity isproduced by a portfolio of renewable energy technologies rather than by wind power alone.
The two regions, where the natural variation of wind (often referred to as "intermittency") is currentlymost discussed in the context of changes to system operations are Western Denmark and NorthernGermany, where wind power penetration has reached a considerable level, albeit a number ofcountries like the USA, UK, Portugal and Spain are investigating the demands on their grids as theyexpect wind to grow further in the near future. It is advisable for countries with ambitious renewableenergy targets to discuss intermittency of wind and fluctuation of other renewables as early in theprocess as possible, and the efforts which are undertaken in a number of countries in this respectare commendable. The following chapter will now present a review of the issues associated withintegrating wind energy into the electricity grid.


3. Integrating Wind into Electricity GridsAs noted in the previous section, the fluctuation of wind energy has recently received a greatamount of attention in policy-making, academia and the media. New policies to integrate windenergy into existing electricity grids are currently formulated, major research initiatives investigate thechallenges associated with this task and reports about the costs and benefits of wind energy are afrequent topic in the media. The recent fast growth in installed wind capacity in many countries andassociated cost reductions mean that wind energy is considered one of the most important 'new'renewable energy source in the near-future. In order to illustrate the demands that the natural cyclesof renewables can place on electricity grids, this chapter will discuss in depth the challenges thatwind power poses to system operations.
Generally, the strategies to address the intermittency of wind vary between different national orregional grids. Important factors are the degree of interconnection, the natural resource and theavailability of flexible generation capacity. In the first part, challenges that can arise with windintermittency on the grid are presented. Here, grid operations are described and the functions ofoperational and capacity reserves are explained. Subsequently, the various options for mitigating theproblems of wind intermittency are reviewed. Finally, cost estimates and market practices in anumber of IEA countries are examined. Chapter 4 will then discuss some of the technical and policylessons from this chapter in summary and conclude.
Grid operation and ancillary servicesThe term operation refers to daily and longer-term grid-management both on a distribution as wellas a transmission level. Commonly, however, the distribution grid is not actively managed and playsonly a passive role; this may change in the future due to different factors such as an increase ofdistributed generation. At present, however, the transmission network mostly manages thebalancing of supply and demand.
As large energy systems operate with little storage capacities mostly for economic reasons, theguiding principle is to balance demand and supply continuously and, where necessary, to replaceother capacity within very short lead times. As each national electricity system operates under tightsecurity and quality standards, these so-called 'ancillary services' have to be relied on to 'secure' and'fine-tune' the electricity provided, independent of whether intermittent renewables are connectedto the grid or not.
Firstly, security standards dictate that the electricity grid must be designed to withstand outages ofcertain magnitude and high loads without losing service, so-called 'N-1' or 'N-2' events. Overallsystem reliability is determined by the 'loss-of-load probability' (LOLP) which can be defined as "theprobability that the load will exceed the available generation" (Jenkins et al. 2000).
Secondly, quality standards define the exact nature of the electricity service delivered, the frequencyand voltage being two important variables of this. This mandates that the operator keeps variationsin frequency and voltage within specified limits so as not to damage electrical appliances.
Keeping these criteria in mind, an operator has to enable enough reserve capacity to be able tomaintain the specified security and quality of electricity supply in the face of major events. Two
17
Variability of Wind Power and other Renewables: Management Options and Strategies

commonly considered events are the outage of the largest individual generating unit on the grid orthe loss of the most significant transmission line. In the first case, these are typically large powerstations like the Sizewell B nuclear power station in the UK (1188 MW), in the latter case this couldsimilar be high-voltage transmission lines in the 1000 MW-class such as the interconnector betweenGermany and Denmark, for example.
These reserves are operating over different time-scales and many countries operate distinct marketsfor each of them. The exact definitions vary between countries, but typically, there is a short-termdimension to reserves with a market for 'spinning reserve' or 'fast-response' capacity, which is ableto come online within seconds. Next, there is a more medium-term dimension to reserves that cancome online within minutes to quarter of an hour. The actual operational act of buying or sellingenergy in the short-run is typically referred to as 'balancing'. Finally, there is a longer-term dimensionto reserves, which operates over hours and days. An important variable which determines whichtype of technology is used for each of these timeframes is the time it takes to start up thermal powerplants. All three dimensions are reflected in table 2, which shows the setups for three differentcountries and how these dimensions are understood.
Table 2: Reserve capacities in Germany, Ireland and the United States
Short-term Medium-term Long-termreserve reserve reserve
Primary reserve: Secondary Minute reserve:available within reserve: available available withinGermany
30 seconds, within 5 minutes, 15 minutes, called n/areleased by TSO released by TSO by TSO from supplier
Ireland Primary operating Secondary Tertiary response:reserve: available operating reserve: from 90 seconds
within 15 seconds operates over onwards (dynamic n/a(inertial response/ timeframe of or static reserve)
fast response) 15-90 seconds
United States Regulation Load-following horizons: 1 hour Unit-commitmenthorizon: 1 minute with increments 5- to 10-minute horizon: 1 day to
to 1 hour with increments (intra-hour) and 1 week with1- to 5-second several hours (inter-hour) 1-hour time
increments
Sources: RWE 2004, SEI 2004, Smith et al. 2004
As the above table shows, reserves are neither defined nor treated equally in different countries.Thus, in order to simplify the ensuing discussion, this paper will in the following refer to the short-and medium-term reserves as operational reserve, whereas the long-term reserve will be labelledcapacity reserve.
In the case of wind power, operational reserve is the additional generating reserve needed to ensurethat differences between forecast and actual volumes of generation and demand can be met. Again,it has to be noted that already significant amounts of this reserve are operating on the grid due to
Variability of Wind Power and other Renewables: Management Options and Strategies
18

the general safety and quality demands of the grid. Wind imposes additional demands onlyinasmuch as it increases variability and unpredictability. However, these factors are nothingcompletely new to system operators. By adding another variable, wind power changes the degreeof uncertainty, but not the kind - a fact that several authors referred to recently (DeMeo et al. (2003)).Wind power can be aggregated thus evening out imbalances of individual turbines, an issue pickedup again in the next section.
Wind power has been referred to as a special case, because differences between forecasts and actualvolumes can arise from other than 'common reasons'. Common reasons include planned andunplanned outages of generating plant or on the transmission or distribution networks on the supplyside; and predicted and unpredicted changes in consumer demand levels due to TV pickups, weatherpatterns or other events on the demand side. Wind power, and ultimately all renewable energies ifapplied to a larger degree, includes another uncertainty on the supply side: unpredicted changes inwind speeds and, thus, altering wind generation levels. The most important tool for addressing thisissue is weather forecasting. Significant research has been put into optimizing forecasting andmodelling techniques and this will be discussed in more detail further in this chapter.
How balancing and the operational reserve is handled, differs according to the individual countrysetups. Plants can be literally in 'spinning reserve' mode as they are running below full power andthus have the ability to adjust output very quickly up- or downwards. Hydropower storage facilitiescan bring on capacity within minutes by opening gates for water. In countries with high penetrationof wind power already today and only few flexible power stations or hydropower storage, thequestion of operational reserves is critical; for economic (as well as environmental) reasons, it is costlyto use less flexible conventional power plants as backup.4 As short-term weather forecasts and thusshort-term output predictability improve the more critical variable for the utilisation of renewableenergies and especially wind power the availability of longer-term capacity reserve. Good weatherand thus wind output predictions allow wind to reduce exposure to the short-term (expensive)balancing market to a minimum, but longer-term capacity investments will still be needed for periodsof generally calm winds. Capacity reserves are called upon between hours and days in advance.Thus, they operate in effect through conventional markets and part-loading is not normally an issue.Various options for this will be examined in more detail later in this chapter.
Wind power aggregation, grid operationsand interconnectionThe previous section has outlined the technical principles of providing certain ancillary services suchas operational or capacity reserve to the grid. It is now aimed to give a managerial perspective onhow this is operated in practice.
Liberalisation of electricity markets has resulted in a fragmentation of transactions. Traditionally, inmany markets in IEA countries, either a publicly-owned organisation or a private monopoly had alicence to generate, transmit and sell electricity in a specified area. Today, a variety of market designshave evolved and financial markets for futures and options have been created alongside the
19
Variability of Wind Power and other Renewables: Management Options and Strategies
4. However, Dale et al. (2003) highlight that reserves still contribute useful energy to the system. With a conservative estimate of 10% for thereduced efficiency and a 20% load factor for wind power, they argue that emission savings from wind will be reduced by a little over 1%. Intheir scenario, 20% of electricity in 2020 is produced from wind power, so some 20% of fossil fuels are saved by applying wind.

Variability of Wind Power and other Renewables: Management Options and Strategies
20
physical electricity markets. In principle, physical balancing is a duty for the grid operator, but theprecise market mechanism through which the associated financial transactions take place variesbetween countries.
When examining the impact of intermittency of wind on the grid, it firstly has to be noted that ananalysis of individual wind turbines or wind farms in isolation does not capture the essence of thechallenge posed. The fragmentation of the market might lead to the idea that each generatorshould provide individually for balancing reserve. However, this will not necessarily lead to a least-cost solution from a systems perspective. Thus, the objective of mitigating intermittency is not toprovide a steady output from each renewable generator itself ( i.e. individual wind turbines or -parks),but to equal demand and supply at minimised operation costs to the electricity system as a whole.
In this perspective, the grid plays an important role in mitigating the impact of intermittency. Asdiscussed in the previous section, intermittent generators are not only likely to be geographically (i.e.north - south, up-hill - near-coast) dispersed but also technologically (wind, PV, ocean), which willsmooth variations in output from the various sources as they are all connected to the same grid. Thisis a simple statistical phenomenon and the bigger the integrated grid (for example beyond nationalborders), the more pronounced this effect becomes. It is a general principle in electrical engineeringthat the larger a system becomes, the less reserve capacity it needs. Demand variations betweenindividual consumers are mitigated by the grid interconnection in exactly the same way. Figuratively,just like consumers average out each other (in electricity demand), individual wind farms average outeach other, too (in electricity supply). By way of an example, the peak load demand of an individualhouse can be over 15 times higher than the average load. In contrast, on the UK grid as a whole,peak demand is about 1.5 times higher than average demand.
In summary, the size of swings in output from wind farms and the volatility of average output aresignificantly reduced through geographical aggregation. Figure 3 below shows a typical situation fora (hypothetical) 1000MW wind farm in one place and having 1000MW of wind geographicallydispersed but interconnected in the same grid. The size and volatility of output fluctuations issignificantly reduced in the latter case.
Figure 3: The smoothing effects of geographical dispersion of a single wind farmand distributed wind farms, both rated at 1000MW (Mott MacDonald 2003:8)

21
Variability of Wind Power and other Renewables: Management Options and Strategies
Finally, figure 5 shows the distribution of intra-hourly load (demand) changes in Western Denmarkwith and without a 20% wind share in electricity production (conceptualising wind output asnegative load). The horizontal axis shows the change in demand (in MW) from one hour to thenext, while the vertical axis shows the frequency of occurrence of each event. Again, the mostfrequent event seen on the system is no or little change in output (the area around '0' on thehorizontal axis) between one hour and the next, irrespective of whether wind was present on thesystem or not.
From a grid management point of view, wind energy is a further variable impacting on overall systemvariability, but, just like demand, it fluctuates statistically random and thus can or cannot correlatewith movements of other variables. This correlated movement might not be by the same amount inall cases, but it underlines once more, that the objective should not be to 'level' out fluctuations fromevery single wind turbine but to balance demand and supply in an appropriate area. Some furtherobservations from Milborrow (2004b:5-6) in this respect, taken from studies on the German andDanish grid, are presented below.
Figure 4 below shows real experience from wind farm operations in Western Denmark, comparingthe variation in output from one hour to the next of one 5MW wind farm with the overall windfluctuation on the Danish grid. This is a key variable for grid operators who often analyse variablesin terms of their forecasted deviation from the present level. The horizontal axis shows the changein output after one hour as a share of the total installed capacity. The vertical axis gives the frequencyof occurrence on a log-scale. In this case, the maximum one-hourly power swing from the windfarms installed in Western Denmark was 18% of installed capacity, and for almost 50% of the timeit was less than 2% of installed capacity (Mott MacDonald 2003:8).
Figure 4: The smoothing effects of geographical dispersion on output variations(Mott MacDonald 2003:9)

Consequently, it can be concluded that the interconnection into a common grid of intermittentrenewables can significantly reduce the size and volatility of aggregate output swings that can occurdue to weather conditions. It also makes use of the fact that both supply and demand exhibit aconstant fluctuation and that it is thus not important to ensure steady supply of every singlegenerator. The grid operator seems best placed to execute the physical balancing as all demand andsupply information come together in real-time at this level. However, the exact market design toorganise these 'balancing markets' is still an ongoing discussion in the electricity market regulationliterature and will not be covered in depth here. The next paragraph will now discuss windforecasting and modelling techniques that can further contribute to managing wind intermittency.
Weather forecasts and gate-closure timesFrom a grid management point of view, changes in electricity production are typically observed overshort time-intervals (minutes, half-hourly or hourly intervals). Thus, for example, if current windenergy production runs at 2000MW, the question a system operator might ask is what will be theoutput in one hour? On the basis of weather forecasts and modelling results, the likely output iscalculated and the operational reserve is planned accordingly.
The interest in wind forecasting has been growing over recent years along with the recognition oftechnical implications of higher penetrations of wind power. For wind penetrations of below around
Variability of Wind Power and other Renewables: Management Options and Strategies
22
"The maximum hourly swing in output power from distributed wind rarely, if ever, exceeds 20%of the installed capacity of the wind plant. The standard deviation of the hourly swings is 3%.This information is important in the context of assessing the needs for additional reserves.
The maximum measured change in output per minute from 2400 MW of wind in westernDenmark is about 6 MW."
Figure 5: Intra-hourly load changes in Western Denmark, with and without20% wind (Milborrow 2004b:7)

23
Variability of Wind Power and other Renewables: Management Options and Strategies
5%, wind forecasting is generally believed as not necessary, since "deviations in wind output fail toshow up in the ebb and flow of daily operation with [such] small grid penetrations" (Milborrow2003:37).5 As wind penetration rises, wind forecasting increasingly adds value to wind power.
For example, the German balancing market is divided into four zones (operated by E.On Grid, RWE,Vattenfall and EnBW respectively), all of which use a forecasting tool called Wind PowerManagement System (WPMS), which has been developed by the German Institut für SolareEnergieversorgungstechnik (ISET). This system reaches a prediction margin of error averaging 9% inday-ahead forecasting, 8% for eight hours ahead, and only 2% for one hour ahead (Knight 2003).However, some forecasting errors are expressed in terms of rated power, while others express this interms of deviation from actual electricity produced. Thus, Holtinnen (2004:40) states that "for theNordpool electricity market […] the mean absolute error of wind production is 8-9% of installedcapacity" which, if expressed in terms of the amount of energy produced converts to "38% of theyearly wind power production". In summary, there does not appear to be a sizable difference inoutcome between the Scandinavian and the German system but methodologies do differ. Forcomparison, prediction errors of consumption are generally in the region of 1-5%.
Electricity generation from wind turbines will always vary with weather conditions but the moreprecise the forecasting and modelling becomes, the smaller will be the error margin in forecastingthis variability and thus the lower the requirements can become for operational reserves andbalancing energy. This is reflected in figure 6 below, which contrasts the gap between simple"persistence forecasting" and "perfect forecasting" and the impact on required operational reserve.Persistence forecasting assumes constant power output for one hour ahead, i.e. no change in poweroutput over the next hour.
Research programmes that focus on improving wind forecasting and modeling techniques areongoing in Europe and the USA. The German Institut für Solare Energieversorgungstechnik (ISET),together with the UK meteorological office and the consultancy IT Power, recently completed part ofan EU research project6 to adapt and improve wind power prediction tools to market-basedelectricity trading systems. Further EU research investigates enhanced methods for forecasting,modeling and integrating wind power in liberalised markets.7
In summary, a sizable margin of error in weather forecasts can still exist and the longer the timeframeover which output has to be predicted, the higher the resultant error. This becomes important whenactual markets for balancing capacity are considered. While the UK has a 'gate-closure time' ofcurrently one hour (between final declaration of capacity and actual use of it), many IEA countrieshave gate-closure times between 12 and 36 hours in advance. These times have often developedout of historic structures and in many cases have no technological and economic background in thecurrent system. Shorter times do not necessarily have to entail extra economic costs and there is atrade-off between reduced gate-closure times and thus better forecasts and the increased need forflexible operational reserve and thus potentially higher costs. Still, more investigation on the exactcosts and benefits of this trade-off could reveal whether gate-closure times can be shortened in
5. 5% as a level of wind penetration is here given as indicative. This may differ depending on the natural conditions of each individual regionor country. As an example, the French TSO RTE (Réseau de Transport d'Électricité) estimates that a level of wind penetration of 3% could bemet without increased wind forecasting.6. For more information see the website www.dispower.org. 7. See for example the projects ANEMOS, HONEYMOON and WILMAR (http://anemos.cma.fr/, http://www.ucc.ie/serg/honeymoon/ andhttp://www.wilmar.risoe.dk/)

respective national or international markets. With the increased use of communication technologyas a result of evolving market structures, the information flow is already improving in many marketsand might facilitate the reduction of gate closure times further. Yet, even with reduced gate-closuretimes, liquidity in most electricity markets is highest in the day-ahead trades, while activity in short-term energy trades on the spot market for one- or two hour-ahead contracts is typically low. Thus,some of the benefits from reduced gate-closure times might be mitigated by reduced tradingopportunities in the short-term markets in many IEA member countries. Further considerations onthe market integration of wind power can be found in appendix 9 to IEA (2005) and Neuhoff (2005).
Figure 6: Reducing added back-up for wind
Variability of Wind Power and other Renewables: Management Options and Strategies
24
Source: Milligan/NREL cited in Milborrow 2003:37.
In summary, Milborrow (2003:37) notes: "The bottom line value of a prediction model is thereduction it is likely to achieve in the extra costs, either of additional reserve or balancing marketcharges. […] If these costs can be halved, as researchers claim, then the specific costs of adding anintermittent source of energy to the system such as wind come down accordingly." However, it hasto be added that much the value of any improved forecasting also depends on the flexibility of theelectricity system in which an intermittent generator is embedded. Better short-term prediction willonly translate into reduced costs if the enough flexible technologies, possibly interconnected fromanother country, are available.
The value of wind forecasting will increase as wind energy reaches a higher penetration in markets,for example moving into the 10%-20% market share region. Hence, improved weather forecasts andoutput models are frequently cited in the literature as a key research priority to improve predictabilityof wind output.
Another aspect that is worth considering in this respect is that individual wind turbines generallyhave a very high technical availability (>97.5%) when compared to traditional power plants. Also,this availability is for one turbine, so any amount of significant wind power in an electricity systemwould never see all (hundreds or thousands of) turbines down at the same time. Availability in the
25
Variability of Wind Power and other Renewables: Management Options and Strategies
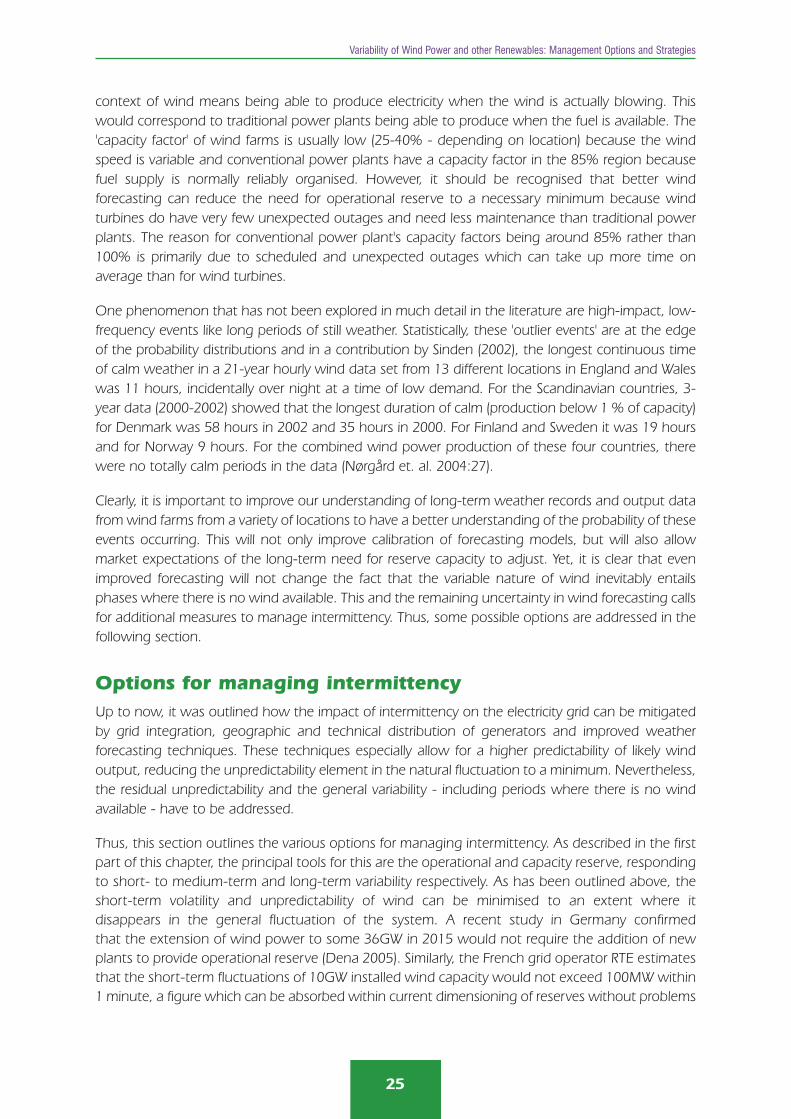
context of wind means being able to produce electricity when the wind is actually blowing. Thiswould correspond to traditional power plants being able to produce when the fuel is available. The'capacity factor' of wind farms is usually low (25-40% - depending on location) because the windspeed is variable and conventional power plants have a capacity factor in the 85% region becausefuel supply is normally reliably organised. However, it should be recognised that better windforecasting can reduce the need for operational reserve to a necessary minimum because windturbines do have very few unexpected outages and need less maintenance than traditional powerplants. The reason for conventional power plant's capacity factors being around 85% rather than100% is primarily due to scheduled and unexpected outages which can take up more time onaverage than for wind turbines.
One phenomenon that has not been explored in much detail in the literature are high-impact, low-frequency events like long periods of still weather. Statistically, these 'outlier events' are at the edgeof the probability distributions and in a contribution by Sinden (2002), the longest continuous timeof calm weather in a 21-year hourly wind data set from 13 different locations in England and Waleswas 11 hours, incidentally over night at a time of low demand. For the Scandinavian countries, 3-year data (2000-2002) showed that the longest duration of calm (production below 1 % of capacity)for Denmark was 58 hours in 2002 and 35 hours in 2000. For Finland and Sweden it was 19 hoursand for Norway 9 hours. For the combined wind power production of these four countries, therewere no totally calm periods in the data (Nørgård et. al. 2004:27).
Clearly, it is important to improve our understanding of long-term weather records and output datafrom wind farms from a variety of locations to have a better understanding of the probability of theseevents occurring. This will not only improve calibration of forecasting models, but will also allowmarket expectations of the long-term need for reserve capacity to adjust. Yet, it is clear that evenimproved forecasting will not change the fact that the variable nature of wind inevitably entailsphases where there is no wind available. This and the remaining uncertainty in wind forecasting callsfor additional measures to manage intermittency. Thus, some possible options are addressed in thefollowing section.
Options for managing intermittencyUp to now, it was outlined how the impact of intermittency on the electricity grid can be mitigatedby grid integration, geographic and technical distribution of generators and improved weatherforecasting techniques. These techniques especially allow for a higher predictability of likely windoutput, reducing the unpredictability element in the natural fluctuation to a minimum. Nevertheless,the residual unpredictability and the general variability - including periods where there is no windavailable - have to be addressed.
Thus, this section outlines the various options for managing intermittency. As described in the firstpart of this chapter, the principal tools for this are the operational and capacity reserve, respondingto short- to medium-term and long-term variability respectively. As has been outlined above, theshort-term volatility and unpredictability of wind can be minimised to an extent where itdisappears in the general fluctuation of the system. A recent study in Germany confirmedthat the extension of wind power to some 36GW in 2015 would not require the addition of newplants to provide operational reserve (Dena 2005). Similarly, the French grid operator RTE estimatesthat the short-term fluctuations of 10GW installed wind capacity would not exceed 100MW within1 minute, a figure which can be absorbed within current dimensioning of reserves without problems

(Bué 2005). Thus, for the future grid integration of wind power, the provision of flexible capacityreserve will become one of the key variables, reflecting the fact that even large wind capacitynumbers will face climatic conditions where there is no or little wind. As will be discussed in thesection on the economies of wind power integreation, this is also one of the most important costitems when considering the long-term integration of wind power into electricity grids.
From a policy point of view, it has to be analysed which are the least-cost options system-wide ineach case and furthermore, whether market participants are facing the right incentive structure toexploit those opportunities. The list of options presented below should not be considered exhaustivenor should it be understood as an attempt to pre-empt any market decisions. It serves as a referenceto the most-discussed resources at current available technology.
The six main options currently discussed are:
power plants providing operational and capacity reserve;
electricity storage;
interconnection with other grid systems;
distributed generation;
demand-side response;
curtailment of intermittent technology.
The principle behind all these options is the same - balancing demand and supply continuously bothover long-term timeframes and, where necessary, backing up other capacity within very short leadtimes. It is likely that in future electricity markets no one option will provide all the balancing servicesand that a combination of the above-named will be operating in parallel. Choosing between theseoptions, the trade-offs need to be spelt out clearly. Ideally, a market can be envisaged where allpotential options can bid into and the least-cost solution for each point in time is thus selected.
PPoowweerr ppllaannttss pprroovviiddiinngg ooppeerraattiioonnaall aanndd ccaappaacciittyy rreesseerrvvee
This is the most frequently cited option in the literature and has often been used as a benchmark tocalculate the extra costs of integrating intermittent generation into the system both over short- andlong-term timeframes. Using power plants for balancing services is a well known and tested ancillaryservice in electricity systems. In today's grids, it is typically met by flexible plants with relatively shortresponse times. Depending on national circumstances, these could be open-cycle gas turbines(OCGT) but also steam-fired power plants like coal and oil running at below full-capacity. Strbac et al.(2002) - which is discussed further in the section on costs of wind power integration - use OCGT asa benchmark in their methodology to determine the costs of operating reserve due to variations inrenewable technologies.
A market for capacity reserves per se is not likely to open in many countries. They will expect to beoperating similarly to peaking plants, but depending on the availability of natural resources for therenewable technologies used, can expect operating hours between about 4000 and 5000 hours ayear. The costs for capacity reserves will be determined alongside the regular market developmentbut are likely to show up in reduced capacity factors of conventional plants and a preference intechnology choice for plants which provide increased flexibility in operation. The IEA (IEA 2004b)currently forecasts a bigger role for combined-cycle gas turbines (CCGT) in electricity supply, althoughcoal-fired power stations will retain their dominant position globally. For the purpose of their study,Strbac et al. (2002) use CCGT as a benchmark to determine the costs of capacity reserves.
Variability of Wind Power and other Renewables: Management Options and Strategies
26

27
Variability of Wind Power and other Renewables: Management Options and Strategies
Overall, in terms of commercial availability, cost competitiveness and ease of system integration,power plants are the state of the art for providing the necessary ancillary services for intermittentwind generation in most countries and are certainly the most tried and time-tested from the pointof view of the system operator.
SSttoorraaggee
Hydro storage facilities, whether in the form of pumped-hydro or hydro reservoirs, have played a keyrole in many countries in providing several grid balancing services. Their advantages are the potentialfor large-scale electricity storage (>1000MW capacity, depending on location), fast response timesand relatively low operating costs. A fully loaded hydro facility can replace a conventional powerstation for several hours if needed. However, beyond hydro storage, there has been very littlecommercially available storage technology that operates on today's electricity grids. The main reasonis that large-scale grid integration replaces to a certain extent the function of storage, as discussedin the previous sections and that other storage technologies are as yet not cost competitive. Storagesystems within the grid have to compete against other technologies for the operational reserveservices they could provide, and there is no a priori advantage to storage systems over generatorsfor example. Only hydro-storage systems have a long history of utilisation and are thus well-established in today's markets.
Certain storage systems such as flywheels and certain battery types could become viable to providespecific support services for renewables in the frame of bridging very short-term output fluctuations(less than one minute) which also has the advantage of minimising the impact of power qualityissues. One fundamental problem with storage is that where energy is converted from one type toanother, conversion losses and thus inefficiencies are inevitably incurred, see table 3 below fordetails. This is true for batteries and hydrogen fuel cells (where electrical energy is converted tochemical energy storage) and flywheels (where electrical energy is converted to kinetic energy).
Table 3: Various storage technologies and typical technical performance
Storage technology Typical round-trip efficiency Typical capacity(in %)
Pumped-hydro station ~80 >100 MW - >1000 MW
Compressed air storage ~75 >50 MW - >100 MW
Flywheel ~90 >1 kW - >50 kW
Conventional batteries ~50 - ~90 >1kW - >10 MW
Flow battery ~70 ~15MW
Hydrogen fuel cell ~40 >50 kW - >1 MW
Depending on available locations another viable form of storage is compressed air, which is storedin geologic structures under the ground and released when necessary. Typical places for suchprojects could include disused coal mines or salt domes. A number of projects have been developedin the USA and Europe for the purpose of 'peak shaving', whereby the potential energy is built up inperiods when demand is low and released during hours of peak demand.

Batteries are typically operated on small-scale systems, and no commercially viable solution for large-scale battery storage has been demonstrated to the market yet. The UK company Innogy announcedin 2001 the development of a 'flow-battery' labelled 'Regenesys', which was hoped to bridge this gapwith a power rating of 15MW and storage capacity of 120MWh, but the project was cancelled byInnogy in 2003 for apparently technical reasons, although the exact circumstances were never fullydisclosed. Still, batteries could play a role for intermittent renewables in smoothing short-termfluctuations, thus providing more stable energy in the intra-minute period. In the long-run, it isspeculated whether hydrogen storage might become a viable option on different scales, however,currently high costs and relatively poor round-trip efficiency is preventing wider market penetration.
Figure 7: Time and power rating of various electricity storage options
Variability of Wind Power and other Renewables: Management Options and Strategies
28
Source: Milborrow 2001a.
Flywheels are a kinetic storage option - "electricity to be stored powers an electric motor whichincreases the speed of the flywheel, while electricity is recovered by running the motor as agenerator which causes the flywheel to slow down." (Dell and Rand 2001:9) Again, this technologyis of interest primarily as a short-term buffer to smooth local output fluctuations from a wind-farmor PV-array. It can remove the need for more expensive power electronics downstream to smoothsuch fluctuations and thus improve overall cost efficiency.
Figure 7 summarises the time- and power ratings of the various technologies. Overall, in theabsence of major technological and cost break-throughs, storage in mature large scale powersystems will only play a minor role in the short term, apart from hydro- and compressed air storage.Besides, technologies for bridging short-term power fluctuations such as flywheels or batteries mayonly gain importance at higher than current wind penetration levels. As mentioned previously, mostIEA countries' existing operating reserves are sufficient to absorb current levels of fluctuation.However, the development of renewables and market liberalisation itself could act as powerful

incentives to intensify R&D efforts in this field. Experience from the Eltra system in Denmarksuggests that spot prices can fall to zero or could even become negative in the future where thereis a high penetration of intermittent renewables and furthermore combined-heat-and-power (CHP)plants. In other words, there are times of the day when the market offers to pay a storage-deviceoperator to take up some electricity from the market. This can consequently be sold back to themarket once prices return to positive again. Another example is differential pricing between baseload and peak load which could be exploited by storage systems that charge during the cheapnight-time period and release energy when demand is peaking and prices are high. As renewablespenetration in the markets increases, the need for operational reserves become more importantand could furthermore act as an incentive. Also, the full pricing of emissions of conventional reserveproviding backup capacity would improve the relative economics of storage as an alternative.
IInntteerrccoonnnneeccttiioonn wwiitthh ootthheerr ggrriiddss
As mentioned earlier, one reason why the western Danish grid can handle a high proportion of windpower very well is that it has good interconnectors with the Swedish, Norwegian and German gridand thus, for example, access to Norwegian hydro-power as reserve capacity. The Scandinavian'Nord Pool' electricity market was established in 1996. One of the drivers for its establishment wasthe difference in generation mix, with Norway depending largely on hydropower, Sweden on a mixof hydropower and nuclear power, Denmark on thermal power plants and wind only emerging.'Nord Pool' market participants trade power contracts for next-day physical delivery on a SpotMarket, and on separate futures markets.
The benefit for a country such as Denmark, generating some 20% of its electricity from wind power,is apparent: Denmark can trade wind power on the spot market in times of excessive supply, and ifthis cannot be used at the time of production elsewhere in the market, it can be stored inhydropower storage facilities i.e. in Norway. In turn, Danish operators can purchase extra electricityon the 'Nord Pool' market at times of low wind generation.
The connection to the 'Nord Pool' market, together with the rather unique situation of stronginterconnections to Germany, allows Denmark to balance the high penetration of wind power.Comparing Danish wind penetration levels to other countries such as Spain, where the systemoperator claims 17% of wind penetration to be the upper limit, is therefore to some extent misleading.However, it reflects (besides other factors) the importance of interconnections to other grids, as Spainis only poorly connected to its neighbours, as McGovern (2003) describes. A new Iberian pool ('MIBEL')will improve management of the strong interconnections between Spain and Portugal but physicaltransmission between Spain and France remains relatively weak for the moment.
However, the high concentration of wind power in the Northern Part of Germany and its proximityto the Danish grid with a similarly high share of wind capacity on the system can pose threats tosystems despite good interconnection to the neighbouring countries. This is due to the fact thattransmission grids have not been originally developed to accommodate increasingly large amountsof wind energy and associated cross-border trade. According to the Dutch system operator, this hasled to a few events where transmission capacity between Germany and its Western neighbours inthe Netherlands, Belgium and France was seriously congested and system stability was threatened.These events occurred either when wind output in both Germany and Denmark was high at timesof low demand, thus exporting excess energy into neighbouring grids. Alternatively, at times of lowoutput and high demand, additional energy was imported from France. This highlights not only the
29
Variability of Wind Power and other Renewables: Management Options and Strategies

need for further transmission grid development, including strengthening and upgrading existinglines, but also the fact that interconnection is only one - though clearly very important - measure inthe portfolio of options to integrate wind power successfully. Failure to develop grids concomitantlyto intermittent resources such as wind power is likely to threaten system stability.
Furthermore and critically, planning new grid capacity is a time-consuming process and building newtransmission lines comes at additional costs. Initial capital outlays can add up to hundreds of millionEuros invested and regular maintenance is required once these assets are installed. Moreimportantly, planning procedures in many IEA countries can take between 3 and 10 years, whichmeans grid extensions cannot be realised without significant lead times.
In general, interconnection of grids is frequently seen as an important step towards improvedcompetition and full market liberalisation, for example in Europe and North America. Resources, bothto power renewable energy sources and conventional power plants, are unevenly distributed andavailable across different power grids, thus limiting the options available on any one grid.Interconnection increases the number of available options and therefore provides significant value aslower cost balancing power stations can be accessed or even be shared. This allows for a moreefficient utilisation of resources and can also contribute to system security.
Major interconnection plans are currently discussed, linking for example Norway and theNetherlands8 through a sub-sea High-Voltage DC (HVDC) cable. The major driver here is betterutilisation of resources, gains from market competition and trade and increased security of supply.Norway holds significant resources of hydro power which it will be able to utilise more efficientlywhen linked in with the Dutch and thus the continental electricity grid. It also serves as a furtherreserve option for the Norwegian grid in case of hydro resource shortages. New technology such asHVDC will improve power flow and reduce losses and costs. Underground cabling is investigated asan alternative to overhead power lines on land as well to circumvent lengthy planning procedures,but this significantly adds to the costs (Dena 2005). The EU has a priority plan for interconnecting itsmember states' electricity grids.9
The IEA (IEA 2004b) forecasts that electricity markets in the OECD countries alone will needinvestments of $1.8 trillion in transmission and distribution networks in the period up to 2030. Thisis merely to keep up with expected demand growth and to upgrade aging assets. A forward-lookingpolicy should aim to integrate these investment needs with renewable energy related investmentsand thus create an integrated strategy to face future challenges in the transmission, distribution andinterconnection field.
DDiissttrriibbuutteedd ggeenneerraattiioonn
IEA (2002:19) defines distributed generation (DG) as "… generating plant serving a customer on-siteor providing support to a distribution network, connected to the grid at distribution-level voltages."DG can provide significant system benefits for local distribution companies by relieving congestion,reducing transmission losses and delivering ancillary services to the system. Thus, DG could provide
Variability of Wind Power and other Renewables: Management Options and Strategies
30
8. See announcement by Statnett http://www.statnett.no/default.aspx?ChannelID=1169&DocumentID=11438.9. The EU priority plan for a Trans-European Energy Networks is outlined on the website of the Directorate General for Energy onhttp://europa.eu.int/comm/energy/ten-e/en/index.html

fast and longer-term reserve requirements to the grid on a regional level as an alternative to large-scale power plants. One of the most frequently cited DG options are combined-heat and power(CHP) plants, which produce heat much like a conventional boiler but also produce electricity at thesame time, thus increasing the efficiency of fuel use. This is utilised in colder climates such asScandinavia, for example, where electricity demand is higher in winter and load increases are typicallygreatest in the morning at the same time when the heat demand picks up.
However, as highlighted in IEA (2002), there currently exist a number of barriers to a widerintegration of DG into electricity grids. One important area is information exchange, a topic that hasalready been highlighted earlier in connection with weather forecasting for wind farms. IEA(2002:98) notes: "If networks are managed in a decentralised way, for example with individualcustomers responding to the needs of the local network, they will require a greatly increased flow ofinformation to ensure smooth operation of the system. The distribution utility of the future will needto be in a position to provide information, and to monitor and control its own system in a moresophisticated manner." Similar requirements could become important to operate a greater numberof renewables such as wind farms in an efficient way. Thus in this area, DG and intermittency mayhave similar requirements for future grid operations and upgrades.
DDeemmaanndd SSiiddee RReessppoonnssee ((DDSSRR))
In some ways, DSR has been the great enigma of electricity policy. The idea behind DSR is thatelectricity produced at different times of the day has different values, as can be witnessed by theprice differential between base and peak load power on the wholesale market. If the marginal peakload price is higher than the value that a customer gets out of the services derived from theelectricity delivered at peak times, he/she would be willing to modify demand if paid the peak priceor slightly less instead. A grid operator is indifferent between paying a power producer to supplymore output and paying the same amount to a customer to switch of his/her electric appliancesinstead, as both provide the identical balancing service. In principle, market mechanisms can bedevised to capture such a market and DSR could be an important aspect of load management bothto cope with peak demand and with intermittency. DSR makes the demand curve for electricitymore elastic and thus sensitive to price changes which will reduce the need for reserves in anelectricity market ceteris paribus.
In practice, however, contributions from DSR in many countries have so far been relatively small, withsome exceptions such as Norway. It is however unclear, whether this is due to electricity users'marginal valuation of electricity being too high to stay on-line even at high prices, or whether thereare transaction costs or informational barriers to access such a market. DeCarolis et al. (forthcoming)review some recent experience of DSR techniques. It is also proposed that participants in DSR useon-site distributed generation technologies to replace the supply from the grid but for such switchingto become automatic electronic communication and an increased flow of information will benecessary. While households would be another attractive target for DSR, their electricity bill is oftenonly a small fraction of total household spending which provides only a small incentive. However,aggregation or 'consolidation' service providers that represent a bundle of households at thewholesale market could explore this market niche. A recent action paper by Eltra (2004b), the Danishgrid operator, has highlighted the potential of DSR in order to cope with large amounts of windenergy and CHP plant penetration and will be discussed in more detail in a further section below.
31
Variability of Wind Power and other Renewables: Management Options and Strategies

CCuurrttaaiillmmeenntt ooff wwiinndd ffaarrmmss
Recently, with the expansion of wind farms offshore, curtailment of intermittent technologies hasbecome a further option to cope with system variability (Gardner 2004). Large wind farms, with asignificant number of megawatt-sized turbines can in principle provide the same ancillary servicesthat conventional generators offer today. Switching off some wind turbines for operational reserveor running them at reduced output becomes a realistic option with modern large-scale wind farms.Furthermore, where transmission and distribution capacity is congested, curtailment of wind farmsis an option to ensure system stability. Thus, as in the case of Northern Germany, at times ofincreased congestion on the grids, wind farm operators have switched off their turbines for shortperiods of time to ensure system stability. Associated requirements are emerging in some Grid Codedocuments for wind generation which Transmission System Operators are developing or publishingat the moment. Wind turbine manufacturers are also investing in associated technology as part oftheir business. Additionally, modern control technology of wind turbines can furthermore smoothsudden bursts and even out short-term fluctuations. Reducing output from a source that producesat almost zero marginal costs might sound unattractive. But the flexibility offered by wind turbinescan be very valuable for an electricity system, as the alternative of shutting down or part-loadingcoal and combined cycle gas turbines implies higher energy and maintenance costs forsubsequently heating them up. Therefore, tariff systems or contractual arrangements are requiredto ensure that wind turbine owners benefit from the system savings they can provide with a flexibleoperation of their turbines.
SSuummmmaarryy ooff ooppttiioonnss
The resultant mix of options is likely to be different between different national grids. For example,where hydro power is available for balancing services, this is likely to be the predominant choice sinceit has been proven as very flexible at low prices for these services. Grids with a high proportion ofgas-fired power plants might be more reliant on this technology again for its desirable characteristics.Greater interconnection between grids would allow for a greater availability of least-cost options ona wider geographic scale while mitigating the impact of intermittency further. On the other hand,this will probably require increased long-distance transportation of electricity with associatedtransmission losses and investment requirements for grid upgrades.
In any case, when choosing between the different options the trade-offs have to be visible in themarket for it to deliver a least-cost solution. However, this is often not the case. For example, manygrids do not 'see' distributed generation as dispatchable and thus cannot extract the potentialbenefits from this option. Without differential pricing at different times of the day, storage systemsand demand side responses will not be economical. To upgrade grids and increase theinterconnection between them, large-scale investments are often required but at current there isoften no clear regulatory incentive for those who benefit from these investments to meet a shareof the costs.
Depending on the strategy chosen and the options available, the costs will vary. In the followingsection, a number of studies are presented that have analysed the cost implications of integratingintermittent renewables - in most cases wind - into the electricity grid. They provide a range ofestimates and actual numbers, and it should be remembered that most of them are country orsystem specific, reflecting technological options and market structure.
Variability of Wind Power and other Renewables: Management Options and Strategies
32

Costs of wind power integrationThis section summarises a number of studies from Europe and the USA that attempted to quantifythe additional system costs that wind power might impose on electricity systems. Assessing theadded costs of integrating renewables into electricity grids involves four main parameters: Balancing,operational reserve, capacity reserve and extension of transmission and distribution lines. As hasbeen summarised in the previous sections, grid operators estimate that the need for additionaloperating reserve is likely to be limited relative to the other two items. As wind power expands, theissues of additional capacity reserve and new transmission and distribution lines will grow inimportance. The studies presented below use slightly different methodologies to assess the variouscost items. Thus, while some aim to quantify all of the above-listed system integration costs, othersfocus specifically on the operating and capacity reserves. Also, it has to be borne in mind that theprecise numbers are country-specific and there is no one cost figure that is universally applicable. Inthis sense, the studies below present an overview of different country experiences and expectationson the costs of system integration of renewables. A further discussion of the costs of grid integrationof wind power can be found in appendix 9 to IEA (2005).
Strbac et al. (2002) were commissioned by the UK Department of Trade and Industry (DTI) to carryout a study 'Quantifying the System Costs of Additional Renewables' to the UK electricity grid in 2020(also known as the SCAR report). A variety of scenarios, using different combinations of technologieswere considered, and OCGT and CCGT power plants were used as benchmarks to quantify theadditional system costs of operational and capacity reserve respectively. A comprehensivemethodology was developed to assess all relevant aspects of system adaptation due to renewables.This included the reinforcement and management of the transmission system, the impact ontransmission losses, the reinforcement and management of the distribution networks and balancingenergy generation and demand. This methodology could well serve as a model for other countriesto quantify their own system costs of integrating renewables.
In a scenario using a mix of biomass and wind, it was found that the total additional system costsper year for a 20% renewables share were €205m (£143m) in 2020, translating into total additionalsystem costs of €4.9 per MWh of renewable electricity compared to current wholesale electricityprices in the UK of about €47 (£32). The highest additional system costs were found for a scenariowhere the renewables share would come predominantly from wind, mostly located in Scotland andoff-shore, far away from load centres. Here the per annum additional system costs would be €570m(£398m) in 2020, translating into total additional system costs of approximately €14 per MWh ofrenewable electricity, in this case almost entirely from wind. An extensive sensitivity analysis of avariety of parameters can be found in the study. As expected, costs for upgrades in the transmissionand distribution system were highest in the scenario with a high share of renewables far away fromload centres, contributing about one quarter of the additional costs. In all scenarios, costs foroperational and capacity reserves dominated, taking a share between 67% and 100% of the totalcosts. In the break down between operational and capacity reserve, costs for the latter dominatedin all scenarios, typically at a ration of 2/3 to 1/3.
A second comprehensive study, which examined reserve as well as transmission and distributionrequirements is presented in Auer (et al. 2004) from the "GreenNet" research project.10 In reviewing
33
Variability of Wind Power and other Renewables: Management Options and Strategies
10. For further information see www.greennet.at.

international studies (incl. Strbac et al. 2002) and modeling their results in a number of Europeanelectricity markets, they establish a cost range for system integration costs specifically for wind powerat different levels of market penetration and for different climatic conditions. For a 20% market shareof wind power, they establish a cost range for operational and capacity reserves between €4.5 and€6, while transmission and distribution upgrades are modeled to lie between €2.5 and €3. Thus,total costs range from €7 to €9 at that level of market penetration.
Table 4 below summarises figures from different studies focusing on the operational and capacityreserve costs of wind in the UK, both in terms of absolute costs per annum and per MWh of windgeneration. Note that this is different from the more comprehensive methodology in Strbac et al.(2002). However, as different studies analysed different aspects of wind integration a common basison the assessment of these costs can be established in this way.
Table 4: Costs of extra balancing wind in the UK
Wind penetration in % of total capacity
5.3 7.6 10 14.2
Total cost in €million per annum
Lower estimate 26 44 66 120
Median estimate 29 54 80 143
Upper estimate 41 79 119 215
Cost in € per MWh of wind electricity
Lower estimate 1.3 1.6 1.8 2.1
Median estimate 1.4 2.0 2.3 2.4
Upper estimate 2.1 2.9 3.4 3.7
Source: Mott MacDonald 2004:34; exchange rate used: 1£=1.43€.
The lower boundary costs were taken from an energy review by the cabinet office of the primeminister of the UK, conducted in 2001/2002 (PIU 2002). The Upper boundary represents figurescalculated by the UK grid operator (National Grid Company) which are based on somewhat moreconservative estimates of market prices for balancing services (NGC 2001). Finally, the middleestimates are again from Strbac et al. (2002). It should be noted that these figures, even in the mostpessimistic case, represent about 8% of current wholesale market prices in the UK (€47/MWh or£32/MWh), noting that these include only balancing costs.
For Western Denmark, the Transmission System Operator (TSO) Eltra (2004a) reports that for the3,368 GWh of wind power that they were mandated to purchase in 2003, the total balancing costswere €8.7m (65m DKK). This corresponds to about €2.6 per MWh of wind energy.
For Germany, E.ON reports 6250 MW of wind power on its grid in 2003 and costs of more than€100m (Winter 2004). It is not clear what these costs include. With wind energy production of 8.5TWh in 2003, €100m corresponds to approximately 11.7€ per MWh of wind energy.
Variability of Wind Power and other Renewables: Management Options and Strategies
34

35
Variability of Wind Power and other Renewables: Management Options and Strategies
The large differences in reported balancing costs between the German and Danish grid appearstriking at first glance. However, they might point to the fact that reported market prices for balancingservices are not always equal to actual economic costs incurred or alternatively that a higherproportion or absolute quantity of wind power is more expensive to balance within a given grid.
Smith et al. (2004) summarise a total of eight studies from US utilities and research laboratories onthe additional operational and capacity reserve costs of wind power. The studies had slightlydifferent scopes depending on the precise system under investigation, and calculations were madefor wind penetration levels ranging from 3.5% to 29%. Total additional system costs ranged between€1.13 per MWh (1.47$/MWh)11 and €4.22 per MWh (5.50$/MWh) amounting to between 2 and15% of current US average electricity prices. The authors note that "It is now clear that, even atmoderate wind penetrations, the need for additional generation to compensate for wind variationsis substantially less than one-for-one and is generally small relative to the size of the wind plant."(Smith et al. 2003:7) However, they also point to important areas of future research, among othersa better understanding of how a market for ancillary services could operate. Also, improving availablewind forecasts and the models operated by grid operators that implement the resultant data areidentified as a priority area for improving the cost performance of wind power.
Table 5 (adapted from IEA 2005:214) presents an overview of the different costs for systemintegration of wind power that have been presented above. It has to be borne in mind that thesenumbers are highly dependent on the specific circumstances in each region, including geographicaland climatic conditions, the state of existing electricity grids and available technologies and theprecise market design. IEA's (2005) best estimate to date covers a range of between €5 and €15 forthe total system integration costs of wind at 20-30% market penetration.
Table 5: Experienced and modeled costs of integrating wind power, euro per MWhof wind power*
E.ON Eltra Smith et al. Strbac et al. Auer Netz** (2004) (2002)*** (2004)***
Balancing 11.7 2.63.3
1.5-2
Operational reserves 1.13 - 4.22
Capacity reserves 6.7 3-4
Transmission & distribution 4 2.5-3
*For comparison with other technologies it must be taken into account that all technologies require integration costs. ** E.ON Netz (2004):8.5 TWh of wind power in 2003 and costs of more than 100 mil. Euro. It is not clear what these costs include. *** At 20% wind powershares of consumption.
In summary, from the findings presented above, a number of general conclusions can be drawn:
Firstly, all the studies published have found that the integration of wind power at the levelsconsidered thus far does not need one-for-one backup capacity. Electricity grids already operatewith high levels of reserve due to the conventional mix of power plants connected, thusabsorbing the incrementally added variability due to wind power thus far.
11. 1$=0.77€

Secondly, the survey on costs also shows that large differences exist between countries. This ison the one hand due to different climatic and geographic conditions, the technology mix, thestate of the grid and levels of wind power market penetration in each country. On the otherhand, markets and incentives to manage intermittency in an efficient manner do not exist in allcases, thus the true economic costs are not always revealed in the reported prices.Thirdly, the cost ranges presented in table 5 are mostly for electricity markets where wind powerhas reached a share of 20% or more. Currently, only the Danish and Northern German regionexhibit such a level of market penetration in practice.The range of these costs suggests that gains can be achieved by pushing costs to the lower endof this range through, for example, careful and efficient market design and optimised location ofnew wind plants.
Markets for managing intermittencyHaving reviewed a number of studies that aimed to provide cost estimates of integrating wind intothe electricity grid, it will now be asked, how markets are actually set up to manage this task. Takingone step back from the studies presented in the last section, two factors still have to be kept in mind.Firstly, costs will always differ between countries and regions due to different levels of market shareof wind power, the availability of renewable resources and options to mitigate the effect ofintermittency. Secondly, market regulation varies among IEA countries so prices might not always bereflective of the actual economic costs imposed. In the following some examples are presented ofhow countries have modified their markets to allow for a better management of renewables. Thisshould in no way be seen as comprehensive, rather it is sought to present a range of contemporaryissues of how market rules are adapted to better integrate intermittent renewables.
DDSSRR iinn tthhee UUnniitteedd KKiinnggddoomm aanndd SSccaannddiinnaavviiaa
Both the Scandinavian ('Nord Pool') and UK (NETA) market operate a short-term balancing market tomake up for differences between actual and scheduled production, thus establishing an importantprerequisite institution for DSR to operate. While most of the short-term balancing is still provided bygenerators regulating up and down their capacity, there have been market actors that have bid intothese markets based on their demand, offering to lower or increase their electricity consumption ata specific time according to the price signals in the market.
Ofgem (2004), the UK electricity market regulator, recently quoted an example from a specific day,28 January 2004, where during a peak winter period DSR provided about 1 GW of capacity (reduceddemand), which represented about 2% of total demand at the time.
Eltra (2004b), the Danish grid operator, notes in a recent 'action plan' that DSR was a key to improvedmarket functioning and better integration of large amounts of wind power onto the system. DSR isalso appreciated for reducing the scope for the abuse of market power in the general electricitymarket, since the demand curve becomes more elastic and thus more responsive to price increases.A strategic generator would therefore need to withhold more output and lose more revenue toachieve the same price increase and would consequently be less inclined to do so. Moreover, froma system security point of view, DSR provides 'capacity' to cope with periods of low supply and/orhigh demand (and principally vice-versa). Eltra has proposed an action plan with a total of 22 projectsto - among others - assess the viability of DSR, improve the information among likely participants,trial new business models and test new electricity meters to improve the share of DSR on the system.Most of these projects will be finished by 2008-2010 and it will be clearer by then what role DSR canplay on the Danish grid.
Variability of Wind Power and other Renewables: Management Options and Strategies
36

Norway established a new power reserve market on 1 November 2000. Both generators andconsumers can bid into this market and Statnett, the Norwegian grid operator, reports significantdemand-side participation, mainly by large customers in the paper and steel industry. Participation isinvited by a bidding system for a fixed balancing product. The minimum size of balancing power is25MW, which must be available for DSR within 15 minutes of notification and last for at least onehour without interruption. Participants must be prepared to offer this service for at least 10 hoursper week (Nilssen and Walther 2001). At the second bidding round in 2001, a total of 2967 MW ofbalancing reserve were offered to the grid operator through 80 offers of which 23 were accepted fora total of 944MW.
UUnniitteedd SSttaatteess bbaallaanncciinngg mmaarrkkeett
Utilities in the northwest of the United States who want to add wind power to their portfolio butdo not want to get involved in the day-to-day balancing of intermittency now have a new offer tochoose from. To make utilities more acquainted with intermittent renewables and generally raise theprofile of wind energy, the Bonneville Power Administration (BPA) recently started offering a newbusiness service. Thanks to its vast 7000MW hydropower network, the BPA offers to 'soak up' anyamount of intermittent renewable output and re-sell it as firm output from its hydropower networkone week later (O'Bryant 2003).
Utilities will first have to secure a power-purchase agreement directly with the wind farm operator,organise for transmission through the BPA network and schedule the wind capacity. At a charge of€3.45 per MWh ($4.50/MWh), the BPA then absorbs this wind energy and delivers an equivalentamount as firm capacity one week later.
While this price is not necessarily cost reflective of the actual costs that BPA incurs, it could act tolower information barriers and increase interest in wind energy, taking out the perceived high riskthat intermittency otherwise might inflict. It might also spur other operators to offer similar servicesat lower prices thus inducing some competition for the lowest cost way of managing intermittency.However, balancing services need to be supplied within a local region defined by potentialtransmission constraints, and are therefore typically only offered by a limited number of generators.Therefore, unless new storage technology offers low-cost small-scale storage options or balancingzones are enlarged, it is possible that competition for the provision of balancing services will staylimited and will require continued market power monitoring to achieve efficient prices andinvestment incentives.
UUnniitteedd KKinnggddoomm NNEETTAA ssyysstteemm
Following the start of the New Electricity Trading Arrangements (NETA) in the UK on 27 March 2001,one commentator observed that "The most profitable way of operating a wind farm so far has beento turn it off". The rules that were implemented in this new market changed the operatingconditions for wind farms from one day to the next in such a way that they ran into serious troublewithout any change in the underlying wind characteristics or physical operating conditions.Moreover, given the modest amounts of wind that were connected to the UK grid at that time, thereal additional costs that were imposed by wind on the system were negligible compared to theamount that was actually charged under NETA. Under NETA, operators had to engage into supplycontracts for half-hourly intervals at least 3.5 hours in advance on the sport market. Should the windconditions change subsequently, each individual wind farm operator had to trade surplus ordeficiency in a system balancing market, where prices differ from the spot market.
37
Variability of Wind Power and other Renewables: Management Options and Strategies

The purpose of these imbalance prices is to provide a commercial incentive to all participants tohonor their positions. If a generator has a shortfall in generation, it must pay for that shortfall at theso-called System Buy Price (SBP). If a generator produces more energy, then it is paid for this excessat the so-called System Sell Price (SSP). In a working paper for the UK cabinet office, Milborrow(2001b) notes that NETA imposed additional costs of between €3.6 per MWh (£2.5/MWh) to €5.7per MWh (£4/MWh) for about 500MW of wind power that were connected to the system at thetime, about 1% of total capacity in the UK. In contrast, on the basis of the Danish experience withwind power, calculating the real technical system costs of balancing even 10% of wind would yieldan imbalance price of only €2.1 per MWh (£1.5/MWh). Naturally, there were differences in theoptions available between the two grids, but this was insufficient to explain the large price differenceactually witnessed.
Figure 8: Spread between System Sell Prices (SSP) and System Buy Prices (SBP) onthe United Kingdom NETA markets since April 2001
Variability of Wind Power and other Renewables: Management Options and Strategies
38
Source: Elexon Ltd, London.
This was partly due to teething problems of NETA as, especially in the first few trading months, thespread between SSP and SBP in the balancing market was relatively large and relatively volatile ingeneral (see figure 8 above). Especially the SBP had very high spikes so the penalty for being shortin the market could climb above €140 per MWh (£100/MWh) for brief periods. This has narrowedsignificantly as market participants gained experience. Nevertheless, structural improvements weresuggested that would recognise the specific technical situation of intermittent renewables withoutdistorting the market or raising costs. After some lobbying by renewable energy groups and alsocombined-heat-and-power (CHP) plant operators, some changes were implemented to themarket rules.
As noted initially, the gate-closure time, i.e. the time between notification and despatch was setat 3.5 hours when NETA was launched. This had a particularly negative impact on intermittentrenewable generators since supply forecasts over this timeframe had a substantial margin of error.

39
Variability of Wind Power and other Renewables: Management Options and Strategies
UK Source: Milborrow 2004a:38.
After a review, Ofgem, the UK electricity market regulator, accepted a proposal to reduce this timeperiod to one hour. This will allow all market participants to limit their exposure to imbalancecharges. Significantly, wind forecasts and modelling that form the basis of the supply schedule foreach half-hourly period of wind farm operators, have a significantly reduced margin of error overthis timeframe. Figure 9 illustrates the effect of reduced gate closure times. Reduced gate-closuretimes contribute significantly in reducing the spread between system buy and sell price and thusthe effective penalty that has to be paid by the operator.
Nevertheless, another criticism is that NETA has resulted in far more spinning reserve beingscheduled by the individual suppliers than is really necessary. This argument goes back to the pointof balancing demand and supply on a systems level rather than requiring each individual supplier tobalance their output individually. Since suppliers have been especially keen to avoid the higher SBP,"suppliers have typically chosen to be over-contracted at Gate Closure and generators have chosento part-load some of their plant so that they can increase their output to cover any unforeseenoutages in their plant which might leave them short of electricity." (Ofgem 2002:4)
On a system-wide level, some of the over- and undersupply at every point in time will be naturallybalanced out leaving only a residual of imbalance in the market. The grid as a whole can only eitherbe short OR long in a half-hourly period. Nevertheless, generators who are short when the systemoverall is short pay the SBP, thus imposing costs on suppliers as if they were directly connected totheir end-customer, ignoring the benefits the grid delivers in this respect.
Figure 9: The benefit of reducing gate-closure times in the United Kingdom
CCoonnnneeccttiioonn ooff ooffffsshhoorree wwiinndd
The development of offshore wind plays an important part in the market introduction strategy ofmany European Countries with access to coast lines. However, one unresolved key issue is theconnection of these new wind farms into the national grids. At a recent workshop in Egmond aan

Zee, held under the auspices of the Dutch EU presidency, some of the important stepping-stones inthis regard were agreed upon by representatives from governments, research institutes and industry.Even representatives from countries without a coast-line were invited since it was considered thatthe benefits from developing offshore wind could only be shared if a truly trans-European solutionto grid integration was found. The declaration from the workshop makes this point strongly (DutchEconomic Ministry 2004): "In order to find European wide solutions to grid system issues like costs,size and dynamics related to system balance and interconnection, the European Commission shouldencourage, and where appropriate, support co-operation between Member States Governments,power plants and Transmission System Operators." The development plans for offshore wind inmany countries could seriously surpass the narrow demand of coastal regions. Interconnectioncould allow a better sharing of both the costs to integrate these wind farms into the national gridsas well as the benefits from high capacity renewable energy. While offshore wind farms are onlymagnifying this point by their sheer size, it has to be pointed out once more, that this principleapplies to the integration of all kinds of intermittent electricity sources in general.
Already, three European interconnection projects that will aid the integration of offshore wind havebeen earmarked for up to 20% EU funding by the European Parliament, including an interconnectorbetween the UK and continental Europe; an interconnector linking Ireland with the UK mainland;and increasing interconnection capacity between Denmark and Germany and other Baltic Ringcountries (Windpower Monthly 2003).
SSuummmmaarryy
The examples given above underline the fact the addressing intermittency of wind has only recentlyemerged as a priority concern of grid operators. Market rules are tested and revised and no clearpreferred model of markets for ancillary services has been emerging yet. Similarly, upgrading oftransmission lines and the interconnection of systems in general and for better wind integration isstill in the planning stage and a model of sharing costs and benefits needs to be worked out. Arecent study on the integration of wind energy into the national grid for example showed that theprojected growth of wind power in Germany to some 36GW by 2015 necessitates an extension ofthe existing grid by about 5% of installed grid-km (Dena 2005).
In summary, policy-makers, regulators and grid operators as well as wind turbine manufacturersneed to learn from the experience gathered and share information in order to arrive at solutions thatwork. The benefits of aggregation of wind power output have to be visible in balancing prices. Thenext chapters will summarise the key issues that should be considered in this context.
Variability of Wind Power and other Renewables: Management Options and Strategies
40
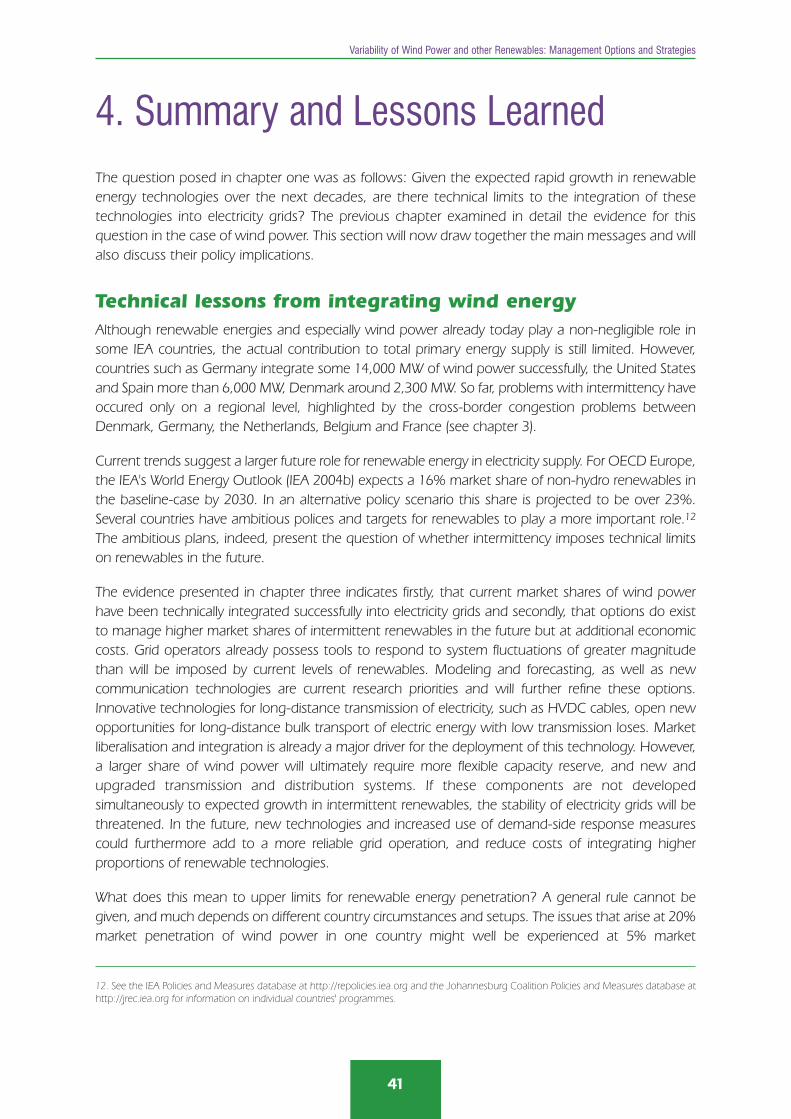
41
Variability of Wind Power and other Renewables: Management Options and Strategies
4. Summary and Lessons LearnedThe question posed in chapter one was as follows: Given the expected rapid growth in renewableenergy technologies over the next decades, are there technical limits to the integration of thesetechnologies into electricity grids? The previous chapter examined in detail the evidence for thisquestion in the case of wind power. This section will now draw together the main messages and willalso discuss their policy implications.
Technical lessons from integrating wind energyAlthough renewable energies and especially wind power already today play a non-negligible role insome IEA countries, the actual contribution to total primary energy supply is still limited. However,countries such as Germany integrate some 14,000 MW of wind power successfully, the United Statesand Spain more than 6,000 MW, Denmark around 2,300 MW. So far, problems with intermittency haveoccured only on a regional level, highlighted by the cross-border congestion problems betweenDenmark, Germany, the Netherlands, Belgium and France (see chapter 3).
Current trends suggest a larger future role for renewable energy in electricity supply. For OECD Europe,the IEA's World Energy Outlook (IEA 2004b) expects a 16% market share of non-hydro renewables inthe baseline-case by 2030. In an alternative policy scenario this share is projected to be over 23%.Several countries have ambitious polices and targets for renewables to play a more important role.12
The ambitious plans, indeed, present the question of whether intermittency imposes technical limitson renewables in the future.
The evidence presented in chapter three indicates firstly, that current market shares of wind powerhave been technically integrated successfully into electricity grids and secondly, that options do existto manage higher market shares of intermittent renewables in the future but at additional economiccosts. Grid operators already possess tools to respond to system fluctuations of greater magnitudethan will be imposed by current levels of renewables. Modeling and forecasting, as well as newcommunication technologies are current research priorities and will further refine these options.Innovative technologies for long-distance transmission of electricity, such as HVDC cables, open newopportunities for long-distance bulk transport of electric energy with low transmission loses. Marketliberalisation and integration is already a major driver for the deployment of this technology. However,a larger share of wind power will ultimately require more flexible capacity reserve, and new andupgraded transmission and distribution systems. If these components are not developedsimultaneously to expected growth in intermittent renewables, the stability of electricity grids will bethreatened. In the future, new technologies and increased use of demand-side response measurescould furthermore add to a more reliable grid operation, and reduce costs of integrating higherproportions of renewable technologies.
What does this mean to upper limits for renewable energy penetration? A general rule cannot begiven, and much depends on different country circumstances and setups. The issues that arise at 20%market penetration of wind power in one country might well be experienced at 5% market
12. See the IEA Policies and Measures database at http://repolicies.iea.org and the Johannesburg Coalition Policies and Measures database athttp://jrec.iea.org for information on individual countries' programmes.

penetration in another country and vice-versa. Based on the practical experience gathered with windpower in a number of countries and the studies presented in this paper, table 6 below is a simplifiedsummary of the issues that are likely to be encountered as wind power progressively increases itsmarket share. The exact numbers will vary from country to country and new technologies might alterthe picture significantly. Therefore, the table below attempts to differentiate three phases of increasingwind power market deployment rather than exact penetration levels, and shows how at eachprogressive stage, issues arise which should be considered in advance for the successfulaccommodation of wind power.
Table 6: Levels of wind penetration and corresponding issues
Wind development Issuesphases
Phase I The added variability due to wind is not significantly noticed on the system, wind is treated as negative load; no major system adaptation is normally necessary and demands on transmission capacity are mostly within existing limits.
Phase II Additional operational and capacity reserve will become necessary.Grid re-enforcements might become necessary, depending on windlocation of wind resources and demand centres.
Phase III Flexible capacity reserves increasingly gain in value; grid upgrades and new interconnections will become more important, depending on the historic structure of the grid.
Bearing the above in mind, a study of the Central Electricity Generating Board CEGB in the UK forexample revealed that the existing system would need to reject a small amount of wind energy atcertain times at a wind penetration of 10%, but could still work without major modifications evenat 15% (BWEA 2004). It is stated, that even a wind capacity of 15,000 MW, i.e. enough to meet13% of the UK's electricity demand at the time of the study in 1990, would still contribute to asmaller risk than one conventional power station being unexpectedly unavailable. This againunderlines that a general rule cannot be given. Ultimately, the question whether there is an upperlimit for renewables penetration into the existing grid, will be an economic and regulatory onerather than a technical issue.
Electricity systems as a whole continue to evolve and grid operators and utilities will ultimately haveto adapt their methods, as they have in the past. The high concentration of wind power in northernGermany, and Western Denmark for example, might call for a joint operation of the balancingmarket, technical adaptation by the concerned utilities, collaborating on production forecasts,sharing data and possible grid extensions both on the German and on the Danish side, but all ofthese measures would add to the costs of reliable electricity provision. Potential future structuralchanges such as Distributed Generation with smaller flexible power generation units might becomeanother driver of these types of system evolutions.
One relevant study in the context of structural changes was published by Kraemer (2003). Thisstudy aimed to optimise the costs for electricity generation in Germany under the assumption ofhigh penetration of wind power (about 44 GW in 2020, so roughly a quarter of total electricitysupply) and priority to wind power under the German Renewable Energy Sources Act. This study
Variability of Wind Power and other Renewables: Management Options and Strategies
42

43
Variability of Wind Power and other Renewables: Management Options and Strategies
shows that high penetration of wind power under cost optimised aspects and with the objectiveto reduce CO2 emissions by 40% in 2020 will lead to displacement of base load power plants suchas brown coal plants through a more flexible system based on wind and gas, with modestadditional costs for wind power.
However, this approach would certainly require substantial changes in the energy systems andrequires a change in paradigm; whether or not this change in paradigm is practical remains to beseen. Still, in many countries a significant number of conventional (fossil and nuclear fueled) powerplants are to be replaced because of their age, thus opening the general opportunity for such aparadigm shift.
Economic and policy lessonsThe discussion about intermittency of wind power has also brought about issues with widerelectricity market implications. On a first level, the question arises whom grid integration costs areattributed to. In the context of intermittency, it has been argued that wind developers should becharged for transmission and distribution system upgrades and the increase in operational andcapacity reserve that would become necessary as a consequence of wind power expansion.However, proponents of wind power argue that historically, these costs have always been recoveredfrom all producers (and ultimately of course the customers) in the market and that new conventionalpower plant projects, such as the new nuclear power plant in Finland, also have wider system costswithout that being necessarily charged to the relevant operator.
The difference between these views is substantial. For example, the additional system costs forrenewables that have been calculated for a 20% wind and biomass scenario in the UK would be€4.9 per MWh (3.3£/MWh) of renewable generation but only €0.44 per MWh (£0.3/MWh) of totalgeneration. From an economic point of view, each generator should be charged the proportion ofcosts that can be attributed to it in order to provide the right incentives to achieve a system-widecost minimisation. However, given the legacy in the existing electricity markets of unspecific chargesof system costs and the general network economics of electricity systems, structural changes inmarket designs and potentially new markets for reserves might become necessary.
In any case, it is clear that there has been as yet no universally adopted system of making theadditional costs that intermittency imposes on the system transparent. The studies discussed abovewere often based on scenarios of coping with intermittency, without necessarily considering amarket model of how these charges might be recovered. In many IEA member countries marketdesigns have grown out of and in response to historic institutional structures and continue to evolve.Many markets have experienced phases of trial and error. Thus, in the following some generalconsiderations for the charge of additional system costs are discussed, for the case of intermittentrenewables as well as system balances in general.
In general, the most important issue which markets should address is cost reflectivity. For systembalancing purposes, this means that market actors have the right incentives to increase theiravailability and provide precise schedules. Costs for maintaining system stability should beapportioned fairly according to how much each generator contributes to the need for keepingreserves, as well as potential transmission and distribution line upgrades. Here it might be importantto highlight once more some first principles of system operation.
Bigger units of power plants bring with them the need for both greater operational and capacityreserve since outages cause greater disturbances to the system, ceteris paribus.

The higher the technical availability, the lower the probability of unexpected outages and thusthe lower the requirements of short-term operational reserve, ceteris paribus. (Strbac andKirschen 2000).
Wind power plants actually score favourable against both criteria, since they normally employ smallindividual units (currently up to 5MW) and have a record of high technical availability. Bad windforecasting can diminish the second point, but as mentioned before, this is an area that currentlyreceives a great deal of attention and promises significant improvements in the short term. Still, ifa TSOs can pass on all balancing costs to customers then it faces little incentive to improve forecastaccuracy, even less so if vertical integration implies that balancing services are contracted fromown generation.
Strbac and Kirschen (2000) present a method to allocate the costs of reserve requirements based onboth the capacity factor and outage rates of each plant. Milligan (2001) adapts this method for amodel using real data from wind power plants in Minnesota, USA. The results show that in the mostpessimistic scenario the highest reserve burden for the wind plants is 20% of its rated capacity,averaging about 3% throughout the year (Milligan 2001:4).
It might be asked whether in the context of cost-reflectivity the demand side would play a role aswell since it also contributes to system uncertainty. Here, it has to be stressed that the currentforecasting error of demand in most grids is in the order of 1%-5%, thus the scheduling ofoperational and reserve capacity is practically driven entirely by the supply side.
System operators will ultimately execute the physical balancing, as they are uniquely placed to havea system's view of imbalances. Thus, the smoothing effect of over- and underproduction of individualgenerating units is taken into account and only the residual imbalance is covered, providing a least-cost solution. Markets to organise the necessary resources should reflect this thinking and rewardthose generators that contribute to system's stability and only charge those that contribute to overallsystem imbalances.
Transparent, cost-reflective and interconnected markets for reserves will ultimately deliver the least-cost solution to grid integration of intermittent renewables. Market power by incumbent operatorscan prevent the development of such markets and is currently an important topic in electricitymarket regulation (Neuhoff 2005).13 Securing a wide variety of options and competition betweenthese products has to be stimulated. Solutions will be needed to let both consumers as well asproducers participate in these markets. Issues include transaction costs for novel participants suchas demand-side response and distributed generation and geographic spread of such markets.Operating these "balancing" or "regulating markets" is an issue which will become more importantfor electricity market reform in general but is further illuminated through the challenge ofintermittency. New products, especially for capacity reserves for occurrences of low output fromintermittent renewables over longer time periods might become necessary.
Another important sub issue that remains is the gate-closure times of spot markets, which is animportant variable especially for intermittent renewables. As has been discussed earlier, reducinggate-closure times to a technically necessary minimum could have real advantages, most
Variability of Wind Power and other Renewables: Management Options and Strategies
44
13. See Platts (2005:1-2) for a report on suspected market collusion in the German balancing market where four separate balancing marketzones are maintained, leading to higher levels of required reserve.

45
Variability of Wind Power and other Renewables: Management Options and Strategies
importantly for wind power but also for conventional generation in general and thus for theelectricity consumers as well. There will be a trade-off, grid operators will not always have flexiblefast-response capacity available and this will be an important driver in considering to what extentgate-closure times can be shortened without imposing additional economic costs. Markets mightnot always be liquid in short-term trades, reducing the potential value gained for wind farmoperators. Nevertheless, improved schedules for wind power, which specifically depend on weatherforecasting and modelling operations, are likely to have significantly reduced margins of error whichwill contribute to system stability and reduced overall costs.
Since the costs of integrating wind in the grid are location dependent, a general concern is that thebest wind resources might not always be where they are cheapest to develop. This might forexample be the case where the resources are far away from major demand centres and grids areonly poorly developed. Thus, there might be a balance in the benefits from the exploitable resourceand the system integration costs for different locations. Countries could share these costs andbenefits through wider grid integration which could also have benefits in relation to the widercompetition concerns in electricity markets. Yet, an approach that is cost reflective would give theright locational signals and would provide an efficient basis on which to decide new renewablesdevelopments.


47
Variability of Wind Power and other Renewables: Management Options and Strategies
5. Conclusions: Lessons Learnedfor all RenewablesThis paper started by outlining how natural cycles affect all renewable technologies over differenttime frames. While wind or solar PV technologies can change their output within minutes or hours,other technologies like hydro or biomass have seasonal variations of available energy. Manyrenewable technologies are in use in IEA member countries for many decades and have coped withthis variation in available energy successfully.
As has been argued in chapter 2, the introduction of 'new' renewable technologies like wind or solarPV has added a new quality to this variability in that it added intra-day variations. Moreover, this hasbeen magnified by the rapid growth in some of these technologies. Nevertheless, the fundamentalprinciples on which these variations operate are known and should not come as a surprise.'Traditional' renewables like hydro, geothermal and biomass were either part of national electricitysupply from the beginning and have comparable operation characteristics as other power stations.
Given the high prominence of wind power among policy-makers, the media and in the researchcommunity, chapter 3 specifically examined the integration of wind energy into electricity markets.The main issues in terms of grid management and technological options to address the variability ofwind have been examined and a review of policy and market issues was presented subsequently. Itwas concluded, that the experience with wind power showed that integration was more aneconomic and political issue than a technical issue. However, the importance of developing technicalsolutions concomitant to the growth of intermittent renewables to ensure electricity system stabilitywas highlighted, especially in the case of grid extensions.
When considering the integration of renewable energy technologies into electricity grids, the broaderevolution of the electricity market has to be taken into account. The pre-dominant fuel in electricitysupply has changed in many countries over the past decades and is forecasted to do so in the future.The IEA's World Energy Outlook (WEO - IEA 2004b) expects a total investment into global electricitymarkets of $10 trillion by 2030, of which almost $5 trillion will go in new and upgraded transmissionand distribution assets.
As renewables gain more significant market shares, some of this investment will benefit theintegration of these technologies. There are six main areas of structural change that will directlybenefit renewables. The first four presented below are likely to occur as a consequence of continuedevolution of electricity markets and electricity grids. Other options might require further policyguidance. Each will briefly be highlighted subsequently.
Increased grid capacity and cross-boarder connections, corresponding to the projections fromthe IEA's WEO.
Balancing/Regulating markets that are cost-reflective, transparent and interconnected with gate-closure times reflecting the technical and economic needs on the system.
Enhanced uptake of efficient demand-side response mechanisms.
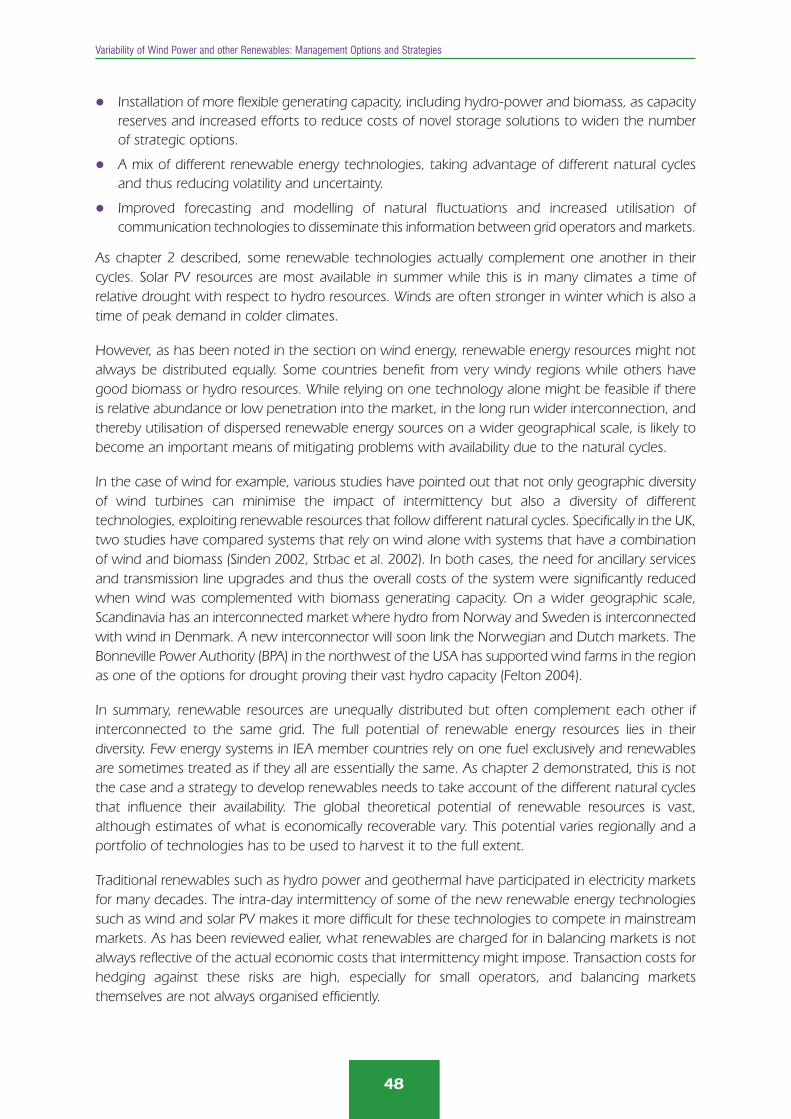
Installation of more flexible generating capacity, including hydro-power and biomass, as capacityreserves and increased efforts to reduce costs of novel storage solutions to widen the numberof strategic options.
A mix of different renewable energy technologies, taking advantage of different natural cyclesand thus reducing volatility and uncertainty.
Improved forecasting and modelling of natural fluctuations and increased utilisation ofcommunication technologies to disseminate this information between grid operators and markets.
As chapter 2 described, some renewable technologies actually complement one another in theircycles. Solar PV resources are most available in summer while this is in many climates a time ofrelative drought with respect to hydro resources. Winds are often stronger in winter which is also atime of peak demand in colder climates.
However, as has been noted in the section on wind energy, renewable energy resources might notalways be distributed equally. Some countries benefit from very windy regions while others havegood biomass or hydro resources. While relying on one technology alone might be feasible if thereis relative abundance or low penetration into the market, in the long run wider interconnection, andthereby utilisation of dispersed renewable energy sources on a wider geographical scale, is likely tobecome an important means of mitigating problems with availability due to the natural cycles.
In the case of wind for example, various studies have pointed out that not only geographic diversityof wind turbines can minimise the impact of intermittency but also a diversity of differenttechnologies, exploiting renewable resources that follow different natural cycles. Specifically in the UK,two studies have compared systems that rely on wind alone with systems that have a combinationof wind and biomass (Sinden 2002, Strbac et al. 2002). In both cases, the need for ancillary servicesand transmission line upgrades and thus the overall costs of the system were significantly reducedwhen wind was complemented with biomass generating capacity. On a wider geographic scale,Scandinavia has an interconnected market where hydro from Norway and Sweden is interconnectedwith wind in Denmark. A new interconnector will soon link the Norwegian and Dutch markets. TheBonneville Power Authority (BPA) in the northwest of the USA has supported wind farms in the regionas one of the options for drought proving their vast hydro capacity (Felton 2004).
In summary, renewable resources are unequally distributed but often complement each other ifinterconnected to the same grid. The full potential of renewable energy resources lies in theirdiversity. Few energy systems in IEA member countries rely on one fuel exclusively and renewablesare sometimes treated as if they all are essentially the same. As chapter 2 demonstrated, this is notthe case and a strategy to develop renewables needs to take account of the different natural cyclesthat influence their availability. The global theoretical potential of renewable resources is vast,although estimates of what is economically recoverable vary. This potential varies regionally and aportfolio of technologies has to be used to harvest it to the full extent.
Traditional renewables such as hydro power and geothermal have participated in electricity marketsfor many decades. The intra-day intermittency of some of the new renewable energy technologiessuch as wind and solar PV makes it more difficult for these technologies to compete in mainstreammarkets. As has been reviewed ealier, what renewables are charged for in balancing markets is notalways reflective of the actual economic costs that intermittency might impose. Transaction costs forhedging against these risks are high, especially for small operators, and balancing marketsthemselves are not always organised efficiently.
Variability of Wind Power and other Renewables: Management Options and Strategies
48

49
Variability of Wind Power and other Renewables: Management Options and Strategies
As markets continue to evolve and participants learn and better understand what the best rules anddesigns are to operate such institutions, this problem should gradually be addressed. Theimplementation of new communication and improved forecasting and modelling technologies willfurthermore aid this task. Renewable energy technologies stand to benefit from markets which arewidely integrated and where a wide variety of options, including demand-side response, storage,distributed generation and flexible power plants compete to offer the various ancillary services. Inthis way, renewables will become 'mainstream' in its characteristics and much akin to what marketparticipants are familiar with today from conventional power plants. Furthermore, some of theintegration efforts fall into the needs for restructuring electricity grids for better performance andmore efficient operation.
Overall, should renewable energy technologies make a more significant contribution to energysupplies in the future, it is likely to be through a variety of technologies which will not be identicalglobally but will vary with the regional availability of natural resources and their cycles. In thisperspective, higher contributions from renewable energy sources seem feasible. The technicalbarriers to such a strategy are well understood and current estimates of associated costs of systemintegration indicate that the economically exploitable potential remains significant.


51
Variability of Wind Power and other Renewables: Management Options and Strategies
6. ReferencesBromley, Chris (2004), Email Correspondence, 17 November and 23 November.
BWEA (2004), What happens when the Wind stops blowing?, online available at:http://www.bwea.com/ref/stop.html, accessed 18/02/2004.
Dale, L., Milborrow, D., Slark, R. and Strbac, G. (2003), A Shift to Wind is not unfeasible; Power UK,109, March, p.17-25.
DeMeo, E., Parsons, B (2003), Some Common Misconceptions about Wind Power; presentation tothe All State Wind Summit, Austin, Texas, May 22.
DeCarolis, J.F., Keith, D.W. (forthcoming), The economics of large-scale wind power in a carbonconstrained world, Energy Policy, Article in Press.
Dena (2005), Dena Netzstudie, available online at: http://www.offshore-wind.de/media/article004593/dena-Netzstudie,%20Haupttext,%20r.pdf, accessed: 25/03/2004.
Dutch Economic Ministry (2004), Declaration - EU Policy Workshop Development of Offshore WindEnergy, Egmond aan Zee, 30 September and 1 October 2004, the Netherlands, online available at:http://www.ez.nl/content.jsp?objectid=26484, accessed 02/12/2004.
EIA (2004), Energy Glossary, available online at: www.eia.doe.gov/glossary/glossary_i.htm, accessed02/12/2004.
Eltra (2004a), Annual Report 2003, available online at: http://www.eltra.dk/show.asp?id=15581,accessed: 20/11/2004.
Eltra (2004b), Danish Action Plan for Demand Response, available online at: http://www.eltra.dk/media(16183,1033)/Nordel_-_Dansk_TSO-plan_GB_ny.pdf, accessed: 25/11/2004.
EWEA (2004), Wind Energy - The Facts, Brussels: The European Wind Energy Association.
Felton, L. (2004), Integration of Wind with Hydro-electric Generation in the NW USA, presentationto the First International Conference on the Integration of Renewable Energy Sources andDistributed Energy Resources, 1-3 December, Brussels.
Gardner, P., Snodin, H., Higgins, A., McGoldrick, S. (2003), The Impacts of Increased Levels of WindPenetration on the Electricity Systems of the Republic of Ireland and Northern Ireland: Final Report;Garrad Hassan and Partners Ltd. to the Commission for Energy Regulation.
Gardner, Peter (2004), Email correspondence, 7 October.
Holttinen, H. (2004), The impact of large scale wind power production on the Nordic electricity system,VTT Processes: Espoo. Available online at: http://www.vtt.fi/inf/pdf/publications/2004/P554.pdf,accessed: 20/01/2005.

IEA (2002), Distributed Generation in Liberalised Electricity Markets, Paris: IEA/OECD.
IEA (2003), Renewables for Power Generation - Status and Prospects, Paris: IEA/OECD.
IEA (2004a), Renewable Energy - Market and Policy Trends in IEA Countries; Paris: IEA/OECD.
IEA (2004b), World Energy Outlook 2004, Paris: IEA/OECD.
Jackson, J. (2003), A Cry for Better Forecasters in Denmark, Windpower Monthly, December, p. 40.
Jenkins, N., Allan, R., Crossley, P., Kirschen, D., Strbac, G. (2000), Embedded Generation, London: TheInstitution of Electrical Engineers.
Johansson T.B., McCormick K., Neij L.,Turkenburg W. (2004), The Potentials of Renewable Energy,Thematic Background Paper to the International Conference for Renewable Energies, Bonn,Germany, 1-4 June, available online at: http://www.renewables2004.de/pdf/tbp/TBP10-potentials.pdf, accessed 08/01/2005.
Knight, S. (2003), Balancing Cost Halved by Forecast Program, Windpower Monthly, December, p. 43.
Kraemer, M. (2003), Modellanalyse zur Optimierung der Stromerzeugung bei hoher Einspeisung vonWindenergie; Fortschritts-Berichte VDI, Reihe 6, Nr. 492, Duesseldorf: VDI-Verlag.
Luther, M., Santjer, F. (2001), Technische und betriebliche Aspekte fuer den Netzanschluss vonWindenergieanlagen; DEWI magazine, Nr. 19, August.
McGovern, M. (2003), Steep Learning Curve for Grid Operators, Windpower Monthly, December, p. 48.
Milborrow, D.J. (2001a), Wind and storage - and a look at Regenesys, Wind Power on IslandsConference, Gotland, Sweden 13-15 September. Published by Gotland University.
Milborrow, D.J. (2001b), PIU Working Paper on Penalties for Intermittent Sources of Energy, availableonline at: http://www.strategy-unit.gov.uk/files/pdf/Milborrow.pdf, accessed: 01/12/2004.
Milborrow, D.J. (2003), Forecasting for scheduled delivery, Windpower Monthly, December 2003, p.37.
Milborrow, D.J. (2004a), The Real Cost of Integrating Wind, Windpower Monthly, February 2004,p.35-38.
Milborrow, D.J. (2004b), Assimilation of wind energy into the Irish electricity network, Dublin:Sustainable Energy Ireland, online available at: www.irish-energy.ie/uploads/documents/upload/publications/David_Millborrow_Paper.pdf, accessed: 01/12/2004.
Milligan, M.R. (2001), A chronological Reliability Model to Assess Operating Reserve Allocation toWind Power Plants, presentation to the European Wind Energy Conference 2001, 2-6 July,Copenhagen, Denmark.
Mott MacDonald (2003), Intermittency Literature Survey, Annex 4 to the Carbon Trust and DTIRenewables Network Impact Study, available online at: www.thecarbontrust.co.uk/carbontrust/about/publications/Annex4.pdf, accessed: 10/12/2004.
Variability of Wind Power and other Renewables: Management Options and Strategies
52
53
Variability of Wind Power and other Renewables: Management Options and Strategies
NGC (2001), Submission of the National Grid Company to the PIU Energy Review, London: NationalGrid Company Plc.
Nilssen, G. and Walther, B. (2001), Market-based power reserves acquirement, presentation to theConference on Methods to Secure Peak Load Capacity in Deregulated Electricity Markets, Stockholm,Sweden, 7-8 June.
Nørgård, P., Giebel, G., Holttinen, H., Söder, L., Petterteig, A. (2004), Fluctuations and predictabilityof wind and hydropower, Report Risø-R-1443(EN), online available at http://www.risoe.dk/rispubl/VEA/veapdf/ris-r-1443.pdf, accessed 20/01/2005.
O'Bryant, M. (2003), Advantage of Tight Hour Ahead Forecasts, Windpower Monthly, December2003, p.44.
Ofgem (2002), The review of the first year of NETA - Volume 1, online available at:http://www.ofgem.gov.uk/temp/ofgem/cache/cmsattach/1984_48neta_year_review.pdf, accessed:10/12/2004.
PIU (2002), The Energy Review, London: HMSO, available online at: http://www.number-10.gov.uk/su/energy/TheEnergyReview.PDF, accessed: 10/12/2004.
Platts (2005), Big Four seek to preserve German balancing zones, Platts Power in Europe, Issue 443,31 January.
Pontes, T., Falcao, A. (2001) Ocean Energies: Resources and Utilisation; 18thWorld EnergyConference, Buenos Aires, Argentina, 21-25 October.
RWE (2004), Ausschreibungen von Regelenergie für RWE Transportnetz Strom, website of RWE plc.,available online at: http://www.rwetransportnetzstrom.de/main_de.aspx? PgId=42&Pg=/regelenergie1.asp, accessed: 10/12/2004.
Sassnick, Y. (2004), The Challenge of large-scale wind power integration into Grid Operation,presentation to the First International Conference on the Integration of Renewable Energy Sourcesand Distributed Energy Resources, 1-3 December, Brussels.
Saunders, B. (2003), From NETA to BETTA, presentation to the APEx 2003 Conference, 14-15October, Cartagena de Indias, Colombia.
SEI (2004), Operating Reserve Requirements as Wind Power Penetration Increases in the IrishElectricity System, Dublin: Sustainable Energy Ireland.
Sinden, G. (2002), Renewable Energy and Intermittency - Diversification and Optimisation,presentation at the Intermittency in Renewable Energy Workshop, 29 November, London, onlineavailable at: http://www.eci.ox.ac.uk/lowercf/intermittency/intro.html, accessed: 02/12/2004.
Smith, J.C., DeMeo, E.A., Parsons, B., Milligan, M.R. (2004), Wind Power Impacts on Electric PowerSystem Operating Costs: Summary and Perspective on Work to Date, presentation to the 2004Global WINDPOWER Conference, Chicago, Illinois, 29-31 March.
Söder, L (2004), Email correspondence, 8 November.

Variability of Wind Power and other Renewables: Management Options and Strategies
54
Strbac, G. and Kirschen, D. (2000), Who Should Pay for Reserve?, The Electricity Journal, 13, 8:32-37.
Strbac, G. and ILEX Consulting (2002), Quantifying the System Costs of Additional Renewables in2020, London: Department of Trade and Industry, available online at: www.dti.gov.uk/energy/developep/080scar_report_v2_0.pdf, accessed: 01/12/2004.
WBGU (2004), World in Transition: Towards Sustainable Energy Systems, Earthscan: London.
Windpower Monthly (2003), Offshore focus for trans-Europe grid, June, p.28.
Winter, W. (2004), Windpower integration into the transmission system, presentation at the IEAWorkshop on Integration of Wind Power into Electricity Grids, Paris, 25 May.

IEA PUBLICATIONS9, rue de la Fédération75739 Paris Cedex 15
Printed in France by the IEAJune 2005