Variability of Quality of Life at Small Scales: Addis ...
16
Variability of Quality of Life at Small Scales: Addis Ababa, Kirkos Sub-City Elsa Sereke Tesfazghi J. A. Martinez J. J. Verplanke Accepted: 6 September 2009 / Published online: 26 September 2009 Ó The Author(s) 2009. This article is published with open access at Springerlink.com Abstract Urban quality of life (QoL) is becoming a subject of urban research mainly for western and Asian countries. Such attention is due to an increasing awareness of the contribution of QoL studies in identifying intervention areas and in monitoring urban planning policies. However, most studies are carried out at city or country level that can average out details at small scales. In this paper we present a case study where the urban QoL at small scale is measured and its variability is evaluated for Kirkos sub-city of Addis Ababa, Ethiopia. The study is based on data from a household survey and some secondary data. Geographic information system (GIS) is applied to extract proximity information (e.g., distance to school facilities) and visualize the spatial distribution of QoL. Statistical methods such as factor analysis are applied to establish an index of objective QoL while coefficient of variation is applied to evaluate spatial variability of subjective QoL. The results of this study reveal that the subjective quality of life (QoL) scores show large variation in the sub-city. The mean QoL score also indicates that the respondents in the sub-city, on average, are dissatisfied with the quality of their life. Respondents with higher education level and income are on average, however, more satisfied with their QoL in the sub-city. The results reveal that the lower the QoL in the Kebele, the larger the variability of QoL within the Kebele. Such indicates how aggregation at large scale can average out the variation of QoL at small scales. The results reveal the presence of QoL variability at small scales. The comparison between the subjective and the objective QoL at Kebele level indicated a state of dissonance, adaptation, deprivation or well-being. Such results suggest that the two measures do not always indicate the same level of QoL. Keywords Quality of life Quality of life variability GIS Kirkos sub-city Addis Ababa E. S. Tesfazghi (&) Helvetas Ethiopia, Addis Ababa, Ethiopia e-mail: [email protected]; [email protected] J. A. Martinez J. J. Verplanke Department Urban and Regional Planning and Geo-Information Management, International Institute for Geo-Information Science and Earth Observation-ITC, Enschede, The Netherlands 123 Soc Indic Res (2010) 98:73–88 DOI 10.1007/s11205-009-9518-6
Transcript of Variability of Quality of Life at Small Scales: Addis ...

Variability of Quality of Life at Small Scales: AddisAbaba, Kirkos Sub-City
Elsa Sereke Tesfazghi Æ J. A. Martinez Æ J. J. Verplanke
Accepted: 6 September 2009 / Published online: 26 September 2009� The Author(s) 2009. This article is published with open access at Springerlink.com
Abstract Urban quality of life (QoL) is becoming a subject of urban research mainly for
western and Asian countries. Such attention is due to an increasing awareness of the
contribution of QoL studies in identifying intervention areas and in monitoring urban
planning policies. However, most studies are carried out at city or country level that can
average out details at small scales. In this paper we present a case study where the urban
QoL at small scale is measured and its variability is evaluated for Kirkos sub-city of Addis
Ababa, Ethiopia. The study is based on data from a household survey and some secondary
data. Geographic information system (GIS) is applied to extract proximity information
(e.g., distance to school facilities) and visualize the spatial distribution of QoL. Statistical
methods such as factor analysis are applied to establish an index of objective QoL while
coefficient of variation is applied to evaluate spatial variability of subjective QoL. The
results of this study reveal that the subjective quality of life (QoL) scores show large
variation in the sub-city. The mean QoL score also indicates that the respondents in the
sub-city, on average, are dissatisfied with the quality of their life. Respondents with higher
education level and income are on average, however, more satisfied with their QoL in the
sub-city. The results reveal that the lower the QoL in the Kebele, the larger the variability
of QoL within the Kebele. Such indicates how aggregation at large scale can average out
the variation of QoL at small scales. The results reveal the presence of QoL variability at
small scales. The comparison between the subjective and the objective QoL at Kebele level
indicated a state of dissonance, adaptation, deprivation or well-being. Such results suggest
that the two measures do not always indicate the same level of QoL.
Keywords Quality of life � Quality of life variability � GIS � Kirkos sub-city �Addis Ababa
E. S. Tesfazghi (&)Helvetas Ethiopia, Addis Ababa, Ethiopiae-mail: [email protected]; [email protected]
J. A. Martinez � J. J. VerplankeDepartment Urban and Regional Planning and Geo-Information Management, International Institutefor Geo-Information Science and Earth Observation-ITC, Enschede, The Netherlands
123
Soc Indic Res (2010) 98:73–88DOI 10.1007/s11205-009-9518-6
1 Introduction
Quality of life (QoL) has been a subject of study in the field of several disciplines (Foo
2000; Bonaiuto et al. 2003; Li and Weng 2007; Møller 2007; Brereton et al. 2008; Lee
2008; Moro et al. 2008). The outcomes of urban quality of life studies may help city
planners to understand and prioritize the problems that the community face. As stated by
Lee (2008), QoL information can be used to diagnose previous policy strategies and to
draft future planning policies. As a result, research in this field can lead to improvements in
the QoL of residents.
Most of the quality of life studies cover cities of the western countries, see Rogerson
et al. (1989) and Wong (2001) for England; Marans (2003) for Detroit metropolitan area in
USA; Møller (2007), Higgs (2007) and Richards et al. (2007) for South Africa; Moro et al.
(2008) for Ireland; Lee (2008) for Taiwan. However, quality of life studies for the cities in
the East Africa region, particularly for Ethiopia, are noticeably absent. As such there is a
need to evaluate and adapt the QoL concepts which were developed for the developed
world and Asian countries to the East Africa region.
Commonly quality of life is studied at regional and country level. The purpose of
studying QoL at those levels is mainly to compare its variations and in some cases
benchmarking different areas. Such comparisons can also be complemented with better
knowledge on local variability in quality of life. Studies that show the small scale vari-
ability of QoL are, however, rare although it is often the case that interventions are targeted
and implemented at smallest administrative levels.
Quality of life is often measured using either subjective or objective indicators. Sub-
jective indicators are derived from surveys of resident’s perception, evaluation and satis-
faction with urban living. Lee (2008) stated that quality must be subjective and the most
appropriate method of exploring QoL is by directly asking people about their perception.
Subjective QoL is often measured on a Likert scale usually ranging from ‘very dissatisfied’
to a ‘very satisfied’.1 Bramston et al. (2002), Ibrahim and Chung (2003), McCrea et al.
(2006) and Lee (2008) used subjective indicators to measure quality of life. Subjective
methods are preferred over objective methods, particularly for planning and policy pur-
pose, as it is able to provide more valuable feedback (Ibrahim and Chung 2003). Subjective
indicators offer valuable information when tackling community based issues through a
bottom up approach. However, as described by Foo (2000), subjective indicators have
lower reliability and higher validity than objective indicators. One reason for the problem
of reliability for subjective reporting, as also stated by Das (2008), is that these indicators
cannot represent the actual environmental conditions in which people live. Also, resident’s
subjective perception of well-being is often affected by expectations.
Objective QoL is measured using objective indicators which are related to observable
facts that are derived from secondary data, see Li and Weng (2007) and Apparicio et al.
(2008). Examples of secondary data include population density, crime rate, educational
level and household characteristics. However, as stated in Foo (2000), objective indicators
themselves may not express the true quality of life since these indicators have high
measurement reliability but low validity in assessing human wellbeing. A very important
fact is that quality can not be determined by objective conditions only and it is important to
take into account subjective well-being of individuals. Also Das (2008) stated that these
1 There is no commonly defined range for the Likert scale. For instance, Foo (2000) applied a 5-point Likertscale ranging from a ‘very dissatisfied’ to a ‘very satisfied’ while Brereton et al. (2008) applied a 7-pointLikert scale.
74 E. S. Tesfazghi et al.
123

indicators are very often imperfect and may suffer from either under reporting or over
reporting.
As stated by Turksever and Atalik (2001), measuring quality of life using both sub-
jective and objective measures is necessary to provide an understanding of QoL. Mea-
suring quality of life using both indicators can benefit from the strengths of each of the
perspectives, i.e., to arrive at more reliable and valid information about QoL. Such
approach is also advocated by Rogerson et al. (1989), Marans (2003), Van Kamp et al.
(2003) and Li and Weng (2007).
The combination of both subjective and objective QoL measures allows the comparison
of the possible variations between the two perspectives. Depending on the level of QoL
that is measured by subjective and objective indicators, there will be well being, depri-vation, adaptation, or dissonance. As stated by Zapf (1984) cited in Craglia et al. (2004), if
an individuals subjective feeling and objective living conditions are good then we say there
is well being. If both conditions are bad then there is deprivation. On the other hand, if the
subjective condition is good and the objective condition is bad there is adaptation.However, if the subjective condition is bad and the objective condition is good then there is
dissonance (Table 1).
In this study, quality of life is measured in the Kirkos sub-city, Addis Ababa, Ethiopia,
using subjective and objective attributes of individuals’ life. The spatial variability of QoL
at Kebele level is also analyzed. Objective QoL index is developed using both household
and spatial variables. The subjective and the objective QoL in the sub-city are also
compared in terms of some states of QoL. The first section of this paper starts with a
description of the study area. In the second section the methodology of the study is
presented. The third section continues presenting the results and discussion, including the
subjective QoL measurement, the QoL variability, the objective QoL measurement and the
comparison of both the subjective and the objective QoL. The conclusion is presented in
the latter sections of the paper.
2 Study Area Description
2.1 Kirkos Sub-City
Kirkos sub-city is one of the ten sub-cities of Addis Ababa, Ethiopia. As shown in Fig. 1,
Kirkos sub-city is located at the centre of Addis Ababa. National sport and cultural
facilities such as Addis Ababa stadium and Meskel square are located in the sub-city. The
sub-city hosts international offices such as the office for Organization for African Union
(OAU) and the United Nations Economic Commission for Africa (ECA).
Table 1 Sates of quality of lifeObjective condition
Good Bad
Subjective condition
Good Well-being Adaptation
Bad Dissonance Deprivation
Variability of Quality of Life at Small Scales 75
123
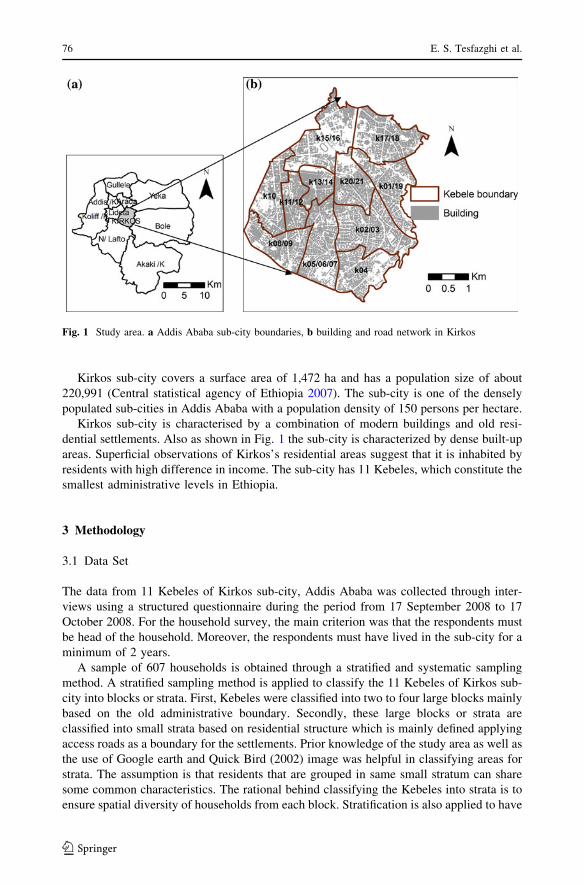
Kirkos sub-city covers a surface area of 1,472 ha and has a population size of about
220,991 (Central statistical agency of Ethiopia 2007). The sub-city is one of the densely
populated sub-cities in Addis Ababa with a population density of 150 persons per hectare.
Kirkos sub-city is characterised by a combination of modern buildings and old resi-
dential settlements. Also as shown in Fig. 1 the sub-city is characterized by dense built-up
areas. Superficial observations of Kirkos’s residential areas suggest that it is inhabited by
residents with high difference in income. The sub-city has 11 Kebeles, which constitute the
smallest administrative levels in Ethiopia.
3 Methodology
3.1 Data Set
The data from 11 Kebeles of Kirkos sub-city, Addis Ababa was collected through inter-
views using a structured questionnaire during the period from 17 September 2008 to 17
October 2008. For the household survey, the main criterion was that the respondents must
be head of the household. Moreover, the respondents must have lived in the sub-city for a
minimum of 2 years.
A sample of 607 households is obtained through a stratified and systematic sampling
method. A stratified sampling method is applied to classify the 11 Kebeles of Kirkos sub-
city into blocks or strata. First, Kebeles were classified into two to four large blocks mainly
based on the old administrative boundary. Secondly, these large blocks or strata are
classified into small strata based on residential structure which is mainly defined applying
access roads as a boundary for the settlements. Prior knowledge of the study area as well as
the use of Google earth and Quick Bird (2002) image was helpful in classifying areas for
strata. The assumption is that residents that are grouped in same small stratum can share
some common characteristics. The rational behind classifying the Kebeles into strata is to
ensure spatial diversity of households from each block. Stratification is also applied to have
Fig. 1 Study area. a Addis Ababa sub-city boundaries, b building and road network in Kirkos
76 E. S. Tesfazghi et al.
123
representative sample of households and represent the heterogeneity in the sub-city as
much as possible.
Systematic sampling method is used to identify the households during fieldwork. The
total number of household in each Kebele is about 2,200–5,000. The interval for systematic
sampling is calculated by dividing the total number of households by 55, which is the
needed sample size from each Kebeles. Thus one household every 40–90 households were
selected for interview.
The subjective quality of life (QoL) in the sub-city is measured in terms of intuitive and
rational response. During the household survey, both the intuitive and the rational quality
of life were measured for two similar questions. The first question is: ‘what do you feelabout your life as a whole?’ The response to this question is intuitive. The other question is
‘Taking all the domains of life above into consideration, how satisfied are you with yourlife as a whole at present?’ The response to this question is considered as rational. The
rational response would be influenced by the answers to preceding questions and is
therefore better thought through than the intuitive one, which is more instinctive. The
domains of life selected in this study based on literature are housing, built-environment,
neighbourhood safety, neighbourhood sanitation, quality of public services, access to
public services, social connectedness and family income.
Data analysis was also performed to evaluate the objective quality of life in the sub-city.
Prior to the analysis, data preparation on the 13 selected objective attributes (variables) was
performed. The variables to measure objective QoL include both individual characteristics
and spatial variables (Table 2). Some of the selected individual characteristics such as
employment status, level of education and household tenure were categorical variables.
These attributes are transformed into a score of 0–10 based on their contribution to quality
of life. This method of data transformation is adopted from Zebardast (2009). For instance,
the variable employment status has two classes that are employed and unemployed. The
categories are transformed into a minimum score of 0 and a maximum score of 10. The
assumption is that employed respondents have relatively high QoL than unemployed
respondents. The variable Income is transformed using natural logarithm. The remaining
household characteristics such as household size, number of dependent children and number
of rooms in a house are continuous and no transformation is computed on these variables.
Geographic information system (GIS) is used to derive proximity variables which are
nearest distance to school and health facilities. Following McCrea et al. (2005), the centroid
of the block maps is used to identify the nearest distance to the facilities e.g., primary school.
Population density is measured as total population (2007) divided by total area of each
Kebeles. Building density is measured as total built-up area divided by total surface area of
each Kebeles. Crime rate is measured based on the description applied in Moro et al.
(2008).2 It is measured as a number of reported crimes in each Kebeles per 100,000 of the
population. Number of traffic accident is measured as number of reported accidents in each
Kebele. The spatial variables are assumed the same for all respondents in the specific
Kebeles.
3.2 Subjective Quality of Life and its variability
Descriptive statistics is applied to measure subjective quality of life at the sub-city level.
The response is measured using a six point Likert scale that ranges from one for completely
2 In Moro et al. 2008, crime rate is defined as the number of headline crimes in the respondent’s localauthority area per 100,000 of the population.
Variability of Quality of Life at Small Scales 77
123

dissatisfied to six for completely satisfied. The cumulative percentage of respondents is
calculated to compare the rational and intuitive QoL. Descriptive statistics is also applied
to measure the QoL at Kebele level. The mean score is used to aggregate the QoL for each
Kebele. GIS is used to visualize the distribution of QoL in the sub-city by creating thematic
maps.
Following Turksever and Atalik (2001), spatial statistics in terms of the coefficient of
variation (CV) is applied to study the variability of the subjective QoL at Kebele level.3
GIS is applied to visualize the variability and to identify clustering of Kebeles with high or
low variability by mapping the calculated CV for each Kebele.
Table 2 Objective variables description
Variable name Description Type Transformedscore
Employment status Respondent is employed Dummy 10
Respondent is unemployed 0
Level of education Respondent is not educated Dummy 0
Respondent has primary education 4
Respondent has secondary education 7
Respondent has vocational qualification 9
Respondent has university degree 10
Household tenure Respondent owns their home Dummy 10
Respondent lives in Kebele house 7
Respondent lives in private rented house 5
Respondent lives in housing agency rentedhouse
4
Others 3
Income Family monthly income (log) Continuous –
Household size Number of individuals in a house Continuous –
Number of dependentchildren
Number of dependent children in a house Continuous –
Number of rooms in a house The total number of rooms in a house Continuous –
Distance to school facilities Measured as the nearest distance to the schoolsfrom the centroid of the block maps
Continuous –
Distance to health facilities Measured as the nearest distance to the healthfacilities from the centroid of the block maps
Continuous –
Population density Measured as total population (of the year 2007)divided by total area of each Kebeles
Continuous –
Building density Measured as total built-up area divided by totalsurface area of each Kebeles
Continuous –
Crime rate It is measured as number of reported crimes ineach Kebele per 100,000 of the population
Continuous –
Number of traffic accident Measured as number of reported accidents ineach Kebele
Continuous –
3 The CV is computed as standard deviation of the QoL scores divided by the mean of the scores and itindicates an absolute variability. To evaluate the relation between QoL scores and its spatial variability, thecorrelation coefficient is computed between mean QoL and the CV.
78 E. S. Tesfazghi et al.
123

3.3 Objective Quality of Life
Factor analysis is applied to identify the underlying dimensions of objective quality of life
in the sub-city.4
An index of objective quality of life is developed based on the method presented by Li
and Weng (2007). The QoL index is established using the score of the dimensions of
objective QoL that was estimated by the factor analysis. The overall score of each
respondent is obtained by weighting each factor score by the respective variance. Fol-
lowing, Li and Weng (2007), in this study, the objective QoL index for Kirkos is developed
by weighing the dimensions with the variance of the respective factors.
A minimum–maximum standardization technique is applied to transform the objective
QoL score to score of 1–6 to have a similar range of values as that used for the subjective
QoL. A score of 1 represents the lowest objective QoL and a score of 6 represents the
highest objective QoL. The standardized score is aggregated using the mean value for each
Kebele.
3.4 States of Overall Quality of Life
Following Das (2008), the correlation coefficient is applied to compare the scores of the
subjective QoL and the index of the objective QoL derived for every individual house-
holds. The comparison between the subjective and the objective QoL at Kebele level is
evaluated based on the theoretical concept that is described in Zapf (1984) cited in Craglia
et al. (2004). First, the QoL score that is perceived by individuals is aggregated in terms of
the mean score per Kebele. Next, the objective QoL score, which is established using
factor analysis, is aggregated in terms of the mean score per Kebele. Finally, a two-way
matrix is developed to assess the condition of both the subjective and the objective QoL for
each Kebeles. GIS is used to visualize the four conditions of QoL in Kirkos sub-city.
4 Results and Discussion
4.1 Subjective Quality of Life
4.1.1 Intuitive and Rational QoL Score at Sub-City Level
Table 3 shows the percentage of respondents’ in Kirkos sub-city that are categorized by
level of subjective QoL based on their response. When respondents were asked about their
intuitive QoL, 26% expressed some level of satisfaction including 3% who expressed
4 Factor analysis is a statistical technique commonly used to extract a sub-set of uncorrelated dimensionsthat explain the variance observed in the original data set. With factor analysis it is possible to derive from alarge set of variables a set of factors or dimensions. Each of them can be thought of as a macro or ‘‘supervariable’’ that represents a cluster of highly correlated variables.
Priori to applying factor analysis, the suitability of the data was checked based on the Kaiser–Meyer–Olkin (KMO) and Bartlett’s tests. The requirement to apply factor analysis is that the KMO value must begreat than 0.5 and the Bartleet’s test value must be less than 0.1 (Li and Weng 2007). To determine thenumber of factors extracted the eigenvalue criterion is applied.
In this study, orthogonal varimax rotation method is applied to ensure that the attributes are maximallycorrelated with only one factor and for ease of interpreting the factors. To ensure that the factor scores areuncorrelated and to avoid the influence of different measurement scale on the resulting score, the Anderson–Rubine method is carried in identifying the factor score coefficients.
Variability of Quality of Life at Small Scales 79
123

complete satisfaction. About 74% of the respondents said they are dissatisfied with their
quality of life in general.
When respondents were asked about their rational QoL, 38% expressed some level of
satisfaction including 4% who expressed complete satisfaction. About 62% of the
respondents said they are dissatisfied with their quality of life in general.
More respondents expressed dissatisfaction with life in terms of the intuitive response
than the rational response (74 and 62%, respectively). This implies that rationally the QoL is
perceived better when respondents consider all the different domains of life. For both
responses the (calculated) mode is three, i.e., most of the responses indicate ‘dissatisfaction’.
The cause of the difference could be due to the reason that the intuitive response is
instinctive and not well thought through. However, the rational response is well-thought
through and influenced by the domain satisfactions. The result agrees with the finding by
Ibrahim and Chung (2003) that reported higher percentages of respondents that are satisfied
and very satisfied in terms of the rational response than the intuitive response for selected
settlements in Singapore. Das (2008) reported a different result that a lower percentage of
respondents were satisfied in terms of the rational response than the intuitive response for
Guwahati, India. The above studies are carried out for Asian region and both studies
applied a five point Likert scale. Although the studies suggest that there could be some
difference between the two responses, the difference in study area makes comparison of the
findings difficult.
For further analysis, wherever the subjective QoL was used in this study, it was pre-
ferred to consider the rational response. This was preferred since it showed high correlation
with the domain satisfactions and since it is better thought through than the intuitive
response.
4.1.2 Rational QoL Score at Kebele Level
Measuring QoL at the sub-city level is expected to hide variations in the QoL at a smaller
scale, i.e., at Kebele level. The map in Fig. 2 shows the spatial distribution of the mean
score of the rational QoL in Kirkos sub-city. Each polygon in the map defines a specific
Kebele. Small values indicate Kebeles with low QoL while high values indicate Kebeles
with high QoL. The map shows that rationally, the respondents’ in the sub-city feel either
satisfied (i.e., a value of 4) or ‘dissatisfied’ or worst (i.e., a value of less than 4) about their
Table 3 Percentage of respondents with specific level of intuitive and rational QoL
Level of subjective QoL Intuitive QoL Rational QoL
Percentage (%) Cumulative (%) Percentage (%) Cumulative (%)
Completely dissatisfied 24 24 15 15
Very dissatisfied 24 48 16 31
Dissatisfied 26 74 31 62
Satisfied 17 91 26 88
Very satisfied 6 97 8 96
Completely satisfied 3 100 4 100
Mean (Likert) 2.67 3.06
Mode (Likert) 3.00 3.00
Standard deviation (-) 1.3 1.3
80 E. S. Tesfazghi et al.
123

life. The map also shows that there is some pattern of clustering of Kebeles with high or
low values. For instance, Kebeles with low QoL are clustered in the south-western part of
the sub-city.
The map in Fig. 3 shows the percentage of respondents’ expressing any level of dis-
satisfaction in each of the Kebeles. The highest percentage is shown in Kebele 13/14 and
the lowest percentage is in Kebele 02/03.
Fig. 2 Spatial distribution of averaged rational QoL in Kirkos sub-city. Note that a Likert scale of 1represents ‘completely dissatisfied’, 2 represents ‘very dissatisfied’, 3 represents ‘dissatisfied’, 4 represents‘satisfied’, 5 represents ‘very satisfied’ and 6 represents ‘completely satisfied’
Fig. 3 Percentage ofrespondents’ expressing any levelof dissatisfaction in each Kebele
Variability of Quality of Life at Small Scales 81
123
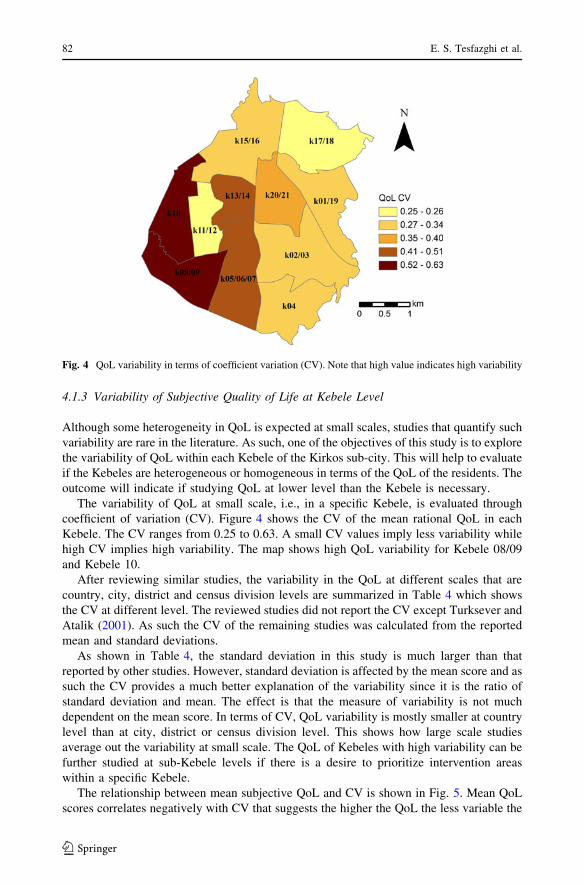
4.1.3 Variability of Subjective Quality of Life at Kebele Level
Although some heterogeneity in QoL is expected at small scales, studies that quantify such
variability are rare in the literature. As such, one of the objectives of this study is to explore
the variability of QoL within each Kebele of the Kirkos sub-city. This will help to evaluate
if the Kebeles are heterogeneous or homogeneous in terms of the QoL of the residents. The
outcome will indicate if studying QoL at lower level than the Kebele is necessary.
The variability of QoL at small scale, i.e., in a specific Kebele, is evaluated through
coefficient of variation (CV). Figure 4 shows the CV of the mean rational QoL in each
Kebele. The CV ranges from 0.25 to 0.63. A small CV values imply less variability while
high CV implies high variability. The map shows high QoL variability for Kebele 08/09
and Kebele 10.
After reviewing similar studies, the variability in the QoL at different scales that are
country, city, district and census division levels are summarized in Table 4 which shows
the CV at different level. The reviewed studies did not report the CV except Turksever and
Atalik (2001). As such the CV of the remaining studies was calculated from the reported
mean and standard deviations.
As shown in Table 4, the standard deviation in this study is much larger than that
reported by other studies. However, standard deviation is affected by the mean score and as
such the CV provides a much better explanation of the variability since it is the ratio of
standard deviation and mean. The effect is that the measure of variability is not much
dependent on the mean score. In terms of CV, QoL variability is mostly smaller at country
level than at city, district or census division level. This shows how large scale studies
average out the variability at small scale. The QoL of Kebeles with high variability can be
further studied at sub-Kebele levels if there is a desire to prioritize intervention areas
within a specific Kebele.
The relationship between mean subjective QoL and CV is shown in Fig. 5. Mean QoL
scores correlates negatively with CV that suggests the higher the QoL the less variable the
Fig. 4 QoL variability in terms of coefficient variation (CV). Note that high value indicates high variability
82 E. S. Tesfazghi et al.
123

QoL is. This implies that those Kebeles with high level of QoL are relatively homogeneous
in terms of QoL while Kebeles with low level of QoL are relatively heterogeneous in terms
of QoL.
The exponential relationship between the mean subjective QoL and the CV value is
defined in the following equation:
CV ¼ 143:96e�0:4349M
where CV is coefficient of variation, M is the mean score of the subjective QoL, and e is
the base of natural logarithm which is 2.718. The equation was fitted with R2 = 0.77 that
indicates satisfactorily performance.
4.2 Objective Quality of Life
4.2.1 Factor Analysis
There are several objective attributes (variables) that may affect quality of life. The main
challenge is how to develop indices from these attributes that can be used to predict QoL.
Factor analysis is applied in this study to develop these indices using several objective
attributes. Thirteen variables which reflect both household and spatial characteristics are
studied.
Table 4 Variability of subjective QoL at different scale
Literature Description Scale Standarddeviation
Mean CV Likert
Foo (2000) Singapore Country 0.63 3.55 0.18 5
Turksever and Atalik (2001) Istanbul City 0.50 1.48 0.34 4
Das (2008) Guwahati, India City 0.92 3.43 0.27 5
Turksever and Atalik (2001) Istanbul District 0.22–0.37 4
Foo (2000) Singapore Census division 0.09–0.21 5
Tesfazghi (2009) Addis Ababa Kirkos sub-city 1.30 3.06 0.43 6
Kebele 0.25–0.63 6
R2 = 0.77
20
30
40
50
60
70
2.0 2.5 3.0 3.5 4.0 4.5
Mean QoL
CV
(%)
Fig. 5 Relation betweencoefficients of variation andmean QoL
Variability of Quality of Life at Small Scales 83
123

The Kaiser–Meyer–Olkin (KMO) value is 0.59 and the Bartlett’s significance test is 0.0.
This implies that the data is suitable for factor analysis. Five factors with an eigenvalue
greater than 1 are extracted in this study.
The result of the factor analysis is shown in Table 5. Attributes with factor loadings of
greater than 0.5 are considered in identifying the dimensions. A label or meaning is
attached to each factor in the next section.
4.2.2 Dimensions of Objective Quality of Life
The factors that are shown in Table 5 can be considered as the underlying dimensions of
objective QoL in the Kirkos sub-city. The five factors explain 73.57% of the total variance
in the data set. The first factor explains 19.57% of the variance while the remaining factors
explain 12.00–14.00% of the variance. This implies that the relative importance of the
factors is almost equal and removing any one of the factors may result in loss of
information.
The five factors are interpreted to define the dimensions of objective QoL in the Kirkos
sub-city as follows:
First factor: This factor can be interpreted as crowdedness (CD) since it shows high
loadings on building density and population density. The two variables are positively
correlated with the factor. This suggests that the higher the score in this factor, the higher
the crowdedness and the smaller the space for people to live
Second factor: This factor can be interpreted as socio-economic status (SE) since it
shows high loadings for instance on employment status and family income. All the
Table 5 Factor loading matrix for objective QoL attributes
Attributes Factors
1 2 3 4 5
Building density 0.918
Population density 0.889
Employment status 0.823
Education level 0.754
Ln family Income 0.709
Distant to health facility -0.715
Number of traffic accident 0.711
Crime rate 0.625
Distance to school facilities 0.609
Number of rooms in a house 0.828
Household tenure 0.810
Number of dependent children 0.888
Household size 0.869
Eigenvalue 2.82 2.28 1.73 1.55 1.18
Percentage of variance explained 19.57 14.35 13.91 13.60 12.15
% Total explained variance 73.57%
Extraction method: principal component analysis
Rotation method: varimax with Kaiser normalization
84 E. S. Tesfazghi et al.
123
attributes are positively correlated with the factor. The higher the score in this factor, the
higher the economic aspects of quality of life
Third factor: This factor is a combination of proximity and neighbourhood safety
attributes. Crime rate, number of traffic accident and distance to school facilities are
positively correlated with the factor, while distance to health facilities is negatively
correlated with the factor. This may be a result of a statistical interaction between the
safety and proximity variables. The factor can be labelled as a combination of safety and
proximity dimension (SP)
Fourth factor: This factor can be interpreted as housing dimension (HD) of QoL since it
shows high loadings on the number of rooms per house and household tenure. The two
attributes are positively correlated with the factor indicating the higher the score of these
attributes the higher the score of the HD of QoL
Fifth factor: This factor can be interpreted as demographic dimension (DM) of QoL.
This factor shows high loading on number of dependent children and household size.
The higher the score in this factor, the lower the number of people living in a house
4.2.3 Objective QoL Index
An index of quality of life is developed using objective attributes. This will help for
designing future studies of urban QoL in the East Africa region. For instance, it can reveal
the dominant dimension of QoL and as such the attributes of such dimension should be
given more attention while designing data collection schemes. The QoL index is developed
by combining the scores of the five selected factors that relate to the objective dimensions
of QoL. The overall objective score of each respondent is obtained by weighting each
factor score by the respective variance as follows.
QoLi ¼ ð�19:58� CDi þ 14:35� SEi � 13:91� SPi þ 13:60� HDi � 12:15
� DMiÞ=100 ð1Þ
where QoLi is quality of life score of respondent i, CDi is crowdedness score, SEi is socio-
economic score, SPi is safety and proximity score, HDi is housing score and DMi is
demographic score of respondent i. The sign in the equation shows the direction of rela-
tionship between QoL and its dimensions. Socio-economic and housing dimensions have
positive contribution to quality of life. This implies that the higher the score in the socio-
economic and housing dimension, the better the QoL. While crowdedness, safety-prox-
imity and demographic dimensions have negative contribution to QoL in the sub-city. This
implies that the higher the score in these dimensions, the lower is the QoL. For instance,
the higher the score of crowdedness, the smaller the space for people to live and a
consequent worse quality of life.
The objective QoL score that is estimated by applying Eq. 1 varies between -1.49 and
1.42. Minimum–maximum standardization method is applied to transform the score to 1–6
which is similar to the scale range of the subjective QoL score in this study. This will help
for ease of comparability of the index with subjective QoL score in the sub-city. A score of
1 represents low quality of life and a score of 6 represents high QoL.
4.3 Combined Subjective and Objective QoL
The condition of QoL in each Kebele is identified as a state of deprivation, well-being,
dissonance or adaptation based on the average score. A score of 3.5 is applied to
Variability of Quality of Life at Small Scales 85
123

differentiate between ‘good’ and ‘bad’ QoL. If both the subjective and objective QoL are
good then there is well-being while if both are bad then there is deprivation. If the objective
is good but the subjective is bad then there is dissonance while if the objective is bad but
the subjective is good then there is adaptation.
The map in Fig. 6 shows the distribution of the QoL depending on whether the sub-
jective and the objective QoL in Kirkos sub-city are good or bad. Although the objective
living condition in Kebele 11/12 is bad, the individual’s perception of the living condition
in that Kebele is good. In terms of QoL, we can say that there is adaptation in Kebele 11/12.
The objective QoL in this Kebele is low mainly due to the fact that the Kebele is over-
crowded and it has low level of housing conditions compared to other Kebeles. The sub-
jective QoL of this Kebele is high compared to the objective QoL probably due to the fact
that the respondents are satisfied with some of the domains of life. For instance, the
respondents in this Kebele, expressed satisfaction with housing, built-environment,
neighbourhood safety, access to public services and social connectedness.
On the other hand, despite good objective living conditions, the individually perceived
subjective QoL in Kebeles 01/19, K10, K08/09 and K05/06/07 is bad or low. Therefore, we
can say that there is dissonance in these Kebeles. The objective living conditions in these
Kebeles are relatively good mainly due to the fact that these Kebeles are less crowded and
have respondents with high economic condition compared to other Kebeles. The subjective
QoL of the four Kebeles is low compared to the objective QoL probably due to the fact that
the respondents are dissatisfied with some of the domains of life. For instance, the
respondents in these four Kebeles, expressed dissatisfaction with housing, income and
sanitation.
Both subjective and objective living conditions are bad in Kebele 13/14, K15/16 and
K20/21. We can say that there is deprivation in these Kebeles. The opposite is the case
where both subjective and objective living conditions are good, like in Kebeles 02/03, K04
and K17/18. We can then say there is well-being in those Kebeles.
Fig. 6 The combined effect of subjective and objective QoL in Kirkos sub-city
86 E. S. Tesfazghi et al.
123
5 Conclusion
In this study, the subjective QoL is measured and its spatial distribution is evaluated in
Kirkos sub-city of Addis Ababa while the objective QoL is estimated from objective
attributes that are collected from field survey. At the sub-city level, the mean score of
response of the respondents indicate that the respondents are dissatisfied with the quality of
their life. However, there is large variation between the QoL of the respondents in the sub-
city. For instance, about 4% of the respondents in the sub-city are ‘completely satisfied’
and 15% are ‘completely dissatisfied’. The remaining 81% of the respondents expressed a
satisfaction level that ranges between the two extremes.
At smaller scale than the sub-city, i.e., at Kebele level, respondents of all Kebeles
expressed dissatisfaction. However, there is a large variation at Kebele level within the
expressed satisfaction of respondents. The results indicate that aggregation at larger scale,
i.e., the sub-city level, can average out the variability of QoL that exists at small scales, i.e.,
at Kebele level in this study.
The variability in the subjective QoL in the sub-city is evaluated using coefficient of
variation (CV). The result indicated that the variability of QoL in each Kebele decreases
somehow exponentially as the QoL in the Kebele increases. Such result suggests that
Kebeles with high QoL are perceived relatively homogeneous in terms of QoL while
Kebeles with low QoL are perceived relatively heterogeneous.
The dimensions of the objective QoL in Kirkos are crowdedness, socio-economic
status, safety and proximity, housing and demography. Using these dimensions of
objective QoL, an index of objective QoL is developed. The combined effect of sub-
jective and objective QoL in the sub-city is studied using the subjective QoL score and
the index that is developed for the objective QoL. The combined effect of the subjective
and the objective QoL indicated a state of dissonance, adaptation, deprivation or well-
being in each Kebele. Well-being and deprivation indicate the subjective and the
objective perspectives measured the same level of QoL. However, dissonance and
adaptation indicate the subjective and the objective perspectives do not necessary mea-
sure the same level of QoL. The result in this study also indicates the need to study the
combined effect of both subjective and objective QoL. Relative to the subjective per-
spective, the objective perspective lacks validity since most of the formulation of the
index is determined by the researchers’ judgment, standards and norms or existing for-
mulations that may not accurately reflect residents’ satisfaction.
In general, the findings of this study indicate that large scale study can hide the vari-
ability of QoL at small scales. The findings also reveal the importance of studying both
subjective and objective QoL instead of any one of these separately.
It is expected that the results and finding of this study will be useful in designing future
urban QoL studies in the region. Studying QoL at the city level, i.e., Addis Ababa, was not
the focus in this study and such can be considered in future studies.
The outcomes of these studies may help local planners in improving and having a
better understanding of the quality of life conditions of the population. Consequently
they can better prioritize the problems that the community face as well as the most
deprived areas.
Open Access This article is distributed under the terms of the Creative Commons Attribution Noncom-mercial License which permits any noncommercial use, distribution, and reproduction in any medium,provided the original author(s) and source are credited.
Variability of Quality of Life at Small Scales 87
123
References
Apparicio, P., Seguin, A.-M., & Daniel, N. (2008). The quality of urban environment around public housingbuildings in Montreal: An objective approach based on GIS and multivariate statistical analysis. SocialIndicators Research, 86, 355–380.
Bonaiuto, M., Fornara, F., & Bonnes, M. (2003). Indexes of perceived residential environment quality andneighbourhood attachment in urban environments: A confirmation study on the city of Rome. Land-scape and Urban Planning, 65(1–2), 41–52.
Bramston, P., Pretty, G., & Chipuer, H. (2002). Unravelling subjective quality of life: An investigation ofindividual and community determinants. Social Indicators Research, 59, 261–274.
Brereton, F., Clinch, J. P., & Ferreira, S. (2008). Happiness, geography and the environment. EcologicalEconomics, 65(2), 386–396.
Central statistical agency of Ethiopia. (2007). Retrieved January 15 2009, from http://www.csa.gov.et.Craglia, M., Leontidou, L., Nuvolati, G., & Schweikart, J. (2004). Towards the development of quality of
life indicators in the ‘digital’ city. Environment and Planning B-Planning and Design, 31(1), 51–64.Das, D. (2008). Urban quality of life: A case study of Guwahati. Social Indicators Research, 88, 297–310.Foo, T. S. (2000). Subjective assessment of urban quality of life in Singapore (1997–1998). Habitat
International, 24(1), 31–49.Higgs, N. (2007). Measuring and understanding the well-being of South-Africans: Everyday quality of life
in South-Africa. Social Indicators Research, 81, 331–356.Ibrahim, M., & Chung, W. (2003). Quality of life of residents living near industrial estates in Singapore.
Social Indicators Research, 61, 203–225.Lee, Y.-J. (2008). Subjective quality of life measurement in Taipei. Building and Environment, 43(7), 1205–
1215.Li, G., & Weng, Q. (2007). Measuring the quality of life in city of Indianapolis by integration of remote
sensing and census data. International Journal of Remote Sensing, 28(2), 249–267.Marans, R. W. (2003). Understanding environmental quality through quality of life studies: The 2001 DAS
and its use of subjective and objective indicators. Landscape and Urban Planning, 65(1–2), 73–83.McCrea, R., Shyy, T.-K., & Stimson, R. (2006). What is the strength of the link between objective and
subjective indicators of urban quality of life? Applied Research in Quality of Life, 1(1), 79–96.Mccrea, R., Stimos, R., & Western, J. (2005). Testing a moderated model of satisfaction with urban living
using data for Brisbane-south east Queensland, Australia. Social Indicator Research, 72, 121–152.Møller, V. (2007). Quality of life in South Africa: The first ten years of democracy. Social Indicators
Research, 81(2), 181–201.Moro, M., Brereton, F., Ferreira, S., & Clinch, J. P. (2008). Ranking quality of life using subjective well-
being data. Ecological Economics, 65(3), 448–460.Richards, R., O’leary, B., & Mutsonziwa, K. (2007). Measuring quality of life in informal settlements in
South Africa. Social Indicator Research, 81, 375–388.Rogerson, R., Findlay, A., & Morris, A. (1989). Indicators of quality of life: Some methodological issues.
Environment and Planning A, 21(12), 1655–1666.Tesfazghi, E. S. (2009). Urban quality of life and its spatial distribution in Addis Ababa: Kirkos sub-city.
Enschede: ITC.Turksever, A. N., & Atalik, G. (2001). Possibilities and limitations for the measurement of the quality of life
in urban areas. Social Indicators Research, 53, 163–187.Van Kamp, I., Leidelmeijer, K., Marsman, G., & de Hollander, A. (2003). Urban environmental quality and
human well-being: Towards a conceptual framework and demarcation of concepts; a literature study.Landscape and Urban Planning, 65(1–2), 5–18.
Wong, C. (2001). The relationship between quality of life and local economic development: An empiricalstudy of local authority areas in England. Cities, 18, 25–32.
Zapf, W. (1984). Individuelle Wohlfahrt: Lebensbedingungen und wahrgenommene Lebensqualitat [Indi-vidual welfare: Living conditions and noticed quality of life]. In W. Glatzer & W. Zapaf (Eds.),Lebensqualitat in der Bundesrepublik. Objektive Lebensbedingungen und subjektives Wohlempfinden(pp. 13–26). Campus: Frankfurt am Main.
Zebardast, E. (2009). The housing domain of quality of life and life satisfaction in the spontaneous settle-ments on the Tehran metropolitan fringe. Social Indicators Research, 90, 307–324.
88 E. S. Tesfazghi et al.
123