
Vardhaman Mahaveer Open University, Kotaassets.vmou.ac.in/MP109.pdfVardhaman Mahaveer Open...
214
Vardhaman Mahaveer Open University, Kota Operations Management MP-109
-
Upload
hoangkhanh -
Category
Documents
-
view
221 -
download
2
Transcript of Vardhaman Mahaveer Open University, Kotaassets.vmou.ac.in/MP109.pdfVardhaman Mahaveer Open...

Vardhaman Mahaveer Open University, Kota
Operations Management
MP-109

INTRODUCTION
Operations Management is the management of organization’s productiveresources. It is a production system which converts inputs into tangible products andintangible services. Block I : Operations Management deals with introductorybackground of the subject which highlights the evolution of the this discipline. Itaddresses the issues related to facility location and Product/process Design inrelevant units. Block II : Job Design describes factors affecting job design,procedure for work measurement and operations standards in the relevant units. Theseaspects help the managers to standardise the job through time study, work study andmethod study. Block III: Inventory Management deals with the units namelyInventory Management: Models and System, MRP and Supply Chain Management.These aspects deals with cost effectiveness and efficiency for managing inventoriesin a firm. Block IV: Operations Systems focuses upon forcasting, operationsscheduling TQM and ISO : 9000 in respective units. Block V : Emerging Issueshighlights the significance and operative aspects of CRM, Six Sigma andMaintenance Management for bringing efficiency in Operations Management.

Course Development CommitteeChairmanProf. (Dr.) Naresh DadhichVice-ChancellorVardhaman Mahaveer Open University, Kota
Convener and MembersSubject Convener and Co-ordinatorProf. P.K. SharmaProfessor of ManagementVardhaman Mahaveer Open University, Kota
1. Prof. P.N. MishraProfessor,Institute of Management Studies,Devi Ahilya University, Indore
2. Prof. Kalpana MathurProfessor,Deptt. of Management Studies,J.N.V. University, Jodhpur
3. Prof. Nimit ChaudharyProfessor,Indian Institute of Tourism & Travel Management,Gwalior
4. Prof. Kamal YadavProfessor,School of Management Studies,IGNOU, New Delhi
5. Prof. Gitika KapoorProfessor,R.A. Poddar Institute of Management,
6. Prof. R.K. JainProfessor & Dean (Retd.),JLN Institute of Business Management,Vikram University, Ujjain
7. Prof. Isphita BansalProfessor, WISDOM,Banasthali Vidhyapeeth, Banasthali
8. Prof. Karunesh SaxsenaProfessor,Faculty of Management Studies,MohanLal Sukhadia Univeristy, Udaipur
9. Dr. Mahesh Chand GargAssociate Professor,Haryana Business School,Guru Jambeshwar University of Science &Technology, Hisar
10. Dr. R.K. JainAssistant Professor,Vardhaman Mahaveer Open University,Kota
Editing and Course WritingEditorProf. R.K. JainEx. Dean, Faculty of Management Studies,Vikram University, Ujjain.
Dr. Abhishek Bardia (Unit No.1,2)Jodhpur Institute of Engineering& Technology, JodhpurDr. Vivek Sharma (Unit No.4,5,6)Institute of Management Studies,Devi Ahilya University, IndoreDr. Rupam Kothari (Unit No. 7)The IIS University, JaipurDr. Anita Sukhwal (Unit No. 8,9,10)Department of Management,Pacific Institute of Technology, UdaipurMs. Aditi Gupta (Unit No. 3,11)Department of Management,The IIS University, Jaipur
Dr. Anurodh Godha (Unit No. 12,13)Department of Commerce,Vardhaman Mahaveer Open University, Kota.Dr. Priyanka Vyas (Unit No. 14)Department of Management,The IIS University, JaipurDr. Charu Shri (Unit No.- 15)Institute of Technology & Management ,Navi Mumbai.Dr. Abha Purohit (Unit No.- 16)Jodhpur Institute & Technology,Jodhpur.
Unit Writers

Academic and Administrative Management
Course Material Production
Mr. Yogendra GoyalAssistant Production Officer,
Vardhaman Mahaveer Open University,Kota
PRODUCTION: , 2011 ISBS:All rights reserved. No part of this book may be reproduced in any from by mimeograph or any other means,without permission in writing form the V.M. Open University, Kota.Printed and published on behalf of V.M. Open University, Kota by Registrar.
Prof. (Dr.) Naresh DadhichVice-Chancellor
Vardhaman Mahaveer Open University,Kota
Prof. M.K. GhadoliyaDirector (Academic)
Vardhaman Mahaveer Open University,Kota
Mr. Yogendra GoyalIncharge
Material Production andDistribution Departmant

MP-109
Vardhaman Mahaveer Open University, Kota
Operations Management
Unit No. Name of Unit Page No.BLOCK - I : OPERATIONS MANAGEMENT
1 Operations Management : An Introduction 1-8
2 Facility Location 9-16
3 Product/ Process Design 17-29
BLOCK - II : JOB DESIGN
4 Job Design Concept 30-38
5 Operations Standards 39-48
6 Work Measurement 49-58
BLOCK - III : INVENTORY MANAGEMENT
7 Inventory Management: Models and Systems 59-77
8 Materials Requirement Planning 78-89
9 Supply Chain Management 90-102
10 Forecasting 103-112
BLOCK - IV : OPERATIONS SYSTEMS
11 Operations Scheduling 113-125
12 Total Quality Management 126-142
13 ISO : 9000 143-158
BLOCK - V : EMERGING ISSUES
14 Customer Relationship Management 159-177
15 Six Sigma 178-194
16 Maintenance Management 195-209

Unit -1 Operations Management : An IntroductionUnit Structure
1.0 Objectives
1.1 Introducation
1.2 Concept of Product and Services
1.3 Evolution of Operations Management
1.4 Important Milestones
1.5 Role and Responsibilities of Operations Manager
1.6 Summary
1.7 Self Assessment Test
1.0 Objectives
After studying this unit you should be able to understand :
The concept of conversion system.
Basic elements of operations system.
Basic difference between product and service.
Evolution of current phase of operations management.
Recent developments in operations management.
Role of an operations manager.
1.1 IntroductionAmongst all the functional areas of management, operations is today considered as one of
the most critical and strategic weapon, in the hands of management, to gain competitive advantage.Operations management is the management of an organisation’s productive resources. It is aproduction system which converts inputs into organization’s tangible products and intangibleservices. In short, the operations system of any organization is the part that produces its products. Insome cases the product may be physical goods (automobile, buscuit, soap), while in others, it isservices (insurance, health care, banking).
The question which arises is that, what does such diverse organizations as manufacturingcompanies, financial institutes and educational institute have in common with in their operationssystem ? The main concept which they share is shown in Fig. 1.1. It indicates the presence of aconversion system or a process, some resources acting as input to the process, output from thesystem, a feed back mechanism and environmental factors which acts as random fluctuations.
Inputs are in the form of raw materials, labour, machines and equipment, Capital, Land andBuilding etc. which when processed through this conversion system generates output in the form ofproduct and service. In order to monitor the system, control points are estabilished at input andoutput. This helps in comparing the planned output and actual output. Random fluctuations whichmay be internal or external to the system cause the variatons. Once the output is received, it is soldand again inputs are purchased which keeps the system alive.

Fig. 1.1 Basic Elements of Operation System
This system can be applied to a variety of organizations. We take two examples, one relatingto a departmental store (service) and another to a automobile manufacturer (product).
* Inventroy Levels
* Labour Efficiency
* Sales Volume
* Rising Popularity of Store
Fig. 1.2 Operation System for a Departmental Store
• Change in Trends• Recession• Non availability of goods• Labour Turnover

Random Fluctuations
Recession
High turnover of Labour
Strikes
Taxation Policy of Government
INPUTS OUTPUTMachines & Cars withEquipment good performanceComponent, parts high mileageAssemblies CS Good ambienceLabour, Vendors AdvanceOffice FeatureCapital Good afterLand and Building Sales ServiceManagement Feed Back
• Rising Sales• Lesser Complaints• Ratings in Surveys• by media and Users
Fig. 1.3 Operations System for an Automobile Manufacturer
1.2 Concept of Product and Services
Before moving further, it is important to understand the conceptual difference between prod-uct and service. Table1.1 provides a broad basis of differentiating the two :
Table 1.1
S.No. Parameter Product Service 1. Tangibility Tangible Intangible 2. Consumption Pattern Consumed over a period of
time Instantaneous consumption
3. Storege Can be stored Can not be stored 4. Nature of Job Less of labour more of
equipment Little customer More of labour, less equipment High customer
5. Customer contact Little customer contact High Customer contact 6. Customer Participation
during the Process of Conversion
No participation of customer High level of participation of customer
7. Measurement Easy to measure using instruments
Difficult to measure

To simplify, a product has tangible characterstics which can be inventoried and consumedover a period of time, jobs that involves less of labour and more of machines, very less customercontact and no participation of customer in conversion (production) process. The features of a prod-uct (say pick up of a car, weight of a watch) can be measured with perfection using sophisticatedequipments.
In case of service, it is intangible and cannot be inventoried and has to be consumed instan-taneously (for example a Haircut), involves job with more of labour and less of machines (say adoctor), high customer contact and frequent participation of customer in the conversion process (inhospital a patient becomes a through put when it goes through tests etc.) The quality of service isdifficult to measure, for example it is difficult to quantify the satisfaction derived out of service in arestuarant.
The above parameters give only a broad difference between product and service. It is verydifficult to classify organisations as pure manufacturing type or pure service type. Even purest ser-vice organizations have some part of product in it. For example an airline industry has a seat as aproduct to the customer, a consultancy firm has project report, a doctor has a prescription in form ofa product. A restaurant is a case of hybrid organization where food served acts a product and ambi-ence, interior, music, service of waiter etc. are part of service.
Thus, various organizations can be placed on a product-service continuum. The two extremerepresents pure product and pure service industries. This is shown in Fig 1.4
Manufacturers Retailers Restaurants Banks Airlines Consultancy
Product Service
Orientation Orientation
Fig. 1.4 Organizations on a Product-Process Continuum
1.3 Evolution of Operations Management :
The modern concept of operations management has evolved in the following three phases-
Phase -I Manufacturing Phase - This traditional view was evolved in the eighteenth century whenAdam Smith came out with economic benefits of specialisation of labour. He called for breakingdown the jobs in small tasks and reassigning these tasks to workers so that they would becomespecialized on them. In the beginning of nineteenth century F.W. Taylor, the father of scientificmanagement came out with time study and work study. This phase prevailed till 1930’s.
Phase II - Production Phase- This became a widely accepted term from 1930’s and continued till1950’s. With Taylor’s contribution being applied by the managers, more and more efforts were madeto eliminate wasteful efforts and to achieve higher efficiency. Besides this, management also felt theneed to understand workers beyond economic needs. Psychologists and social scientists began tostudy people and human behaviour. More analytical approaches were suggested by various econo-mists, mathematicians and computer scientists.
Phase III - Operations Phase - This phase emerged in 1970’s with the increasing dominance of
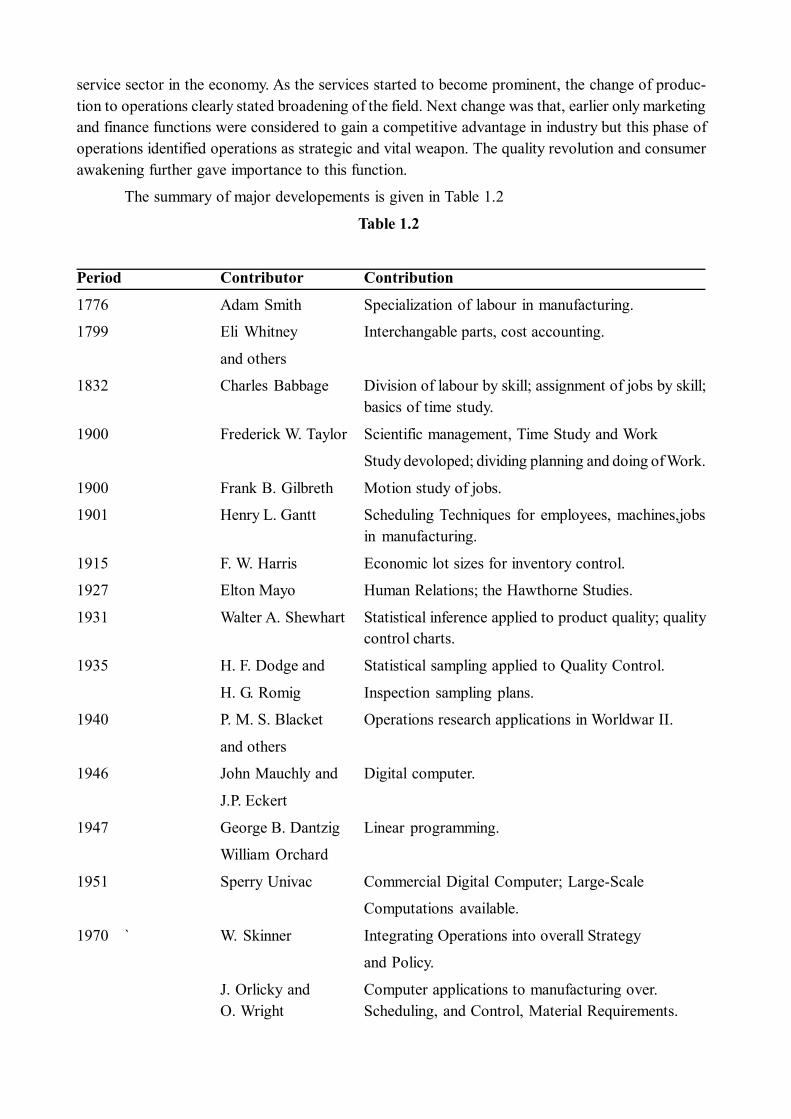
service sector in the economy. As the services started to become prominent, the change of produc-tion to operations clearly stated broadening of the field. Next change was that, earlier only marketingand finance functions were considered to gain a competitive advantage in industry but this phase ofoperations identified operations as strategic and vital weapon. The quality revolution and consumerawakening further gave importance to this function.
The summary of major developements is given in Table 1.2
Table 1.2
Period Contributor Contribution
1776 Adam Smith Specialization of labour in manufacturing.
1799 Eli Whitney Interchangable parts, cost accounting.
and others
1832 Charles Babbage Division of labour by skill; assignment of jobs by skill;basics of time study.
1900 Frederick W. Taylor Scientific management, Time Study and Work
Study devoloped; dividing planning and doing of Work.
1900 Frank B. Gilbreth Motion study of jobs.
1901 Henry L. Gantt Scheduling Techniques for employees, machines,jobsin manufacturing.
1915 F. W. Harris Economic lot sizes for inventory control.
1927 Elton Mayo Human Relations; the Hawthorne Studies.
1931 Walter A. Shewhart Statistical inference applied to product quality; qualitycontrol charts.
1935 H. F. Dodge and Statistical sampling applied to Quality Control.
H. G. Romig Inspection sampling plans.
1940 P. M. S. Blacket Operations research applications in Worldwar II.
and others
1946 John Mauchly and Digital computer.
J.P. Eckert
1947 George B. Dantzig Linear programming.
William Orchard
1951 Sperry Univac Commercial Digital Computer; Large-Scale
Computations available.
1970 ` W. Skinner Integrating Operations into overall Strategy
and Policy.
J. Orlicky and Computer applications to manufacturing over.O. Wright Scheduling, and Control, Material Requirements.

Planming (MRP)
1980 W.E. Deming and Quality and productivity application From Japan;
J. Juran robotics, Computer-Aided Design and Manufacturing(CAD/CAM)
1990’s National Institute of Total Quality Management
Standards and Quality,
American Society of
Quality Control (US)
and International
Organization for Stan
dardisation (Europe)
Michael Hammer Business Process Re-engineering
SAP (Germany) Supply Chain Management
ORACLE (US)
2000’s Amazon, e-bay E-commerce
America online
google, yahoo.
1.4 Important Milestones
(1) JIT and TQC - The 1980’s saw a revolution in the management philosophies and the tech-nology by which production was carried out. Just in time (JIT) production is the major breakthrough in manufacturing philosophy. Given by the Japanese, JIT is an integral set of activi-ties designed to achieve high volume production by minimising inventory that arrive atworkstation exactly when they are needed. This was further coupled with Total Quality Con-trol (TQC) which seeks to eliminate causes of production defects.
(2) Total Quality Management and Quality Certification - One of the major development of1980’s and 1990’s was the focus on Total Quality Management (TQM) . This phenomenontook quality out of the production shop to encompass each and every activity in an organiza-tion with customer being focus of all thoughts and processes. The massage was forwarded byquality gurus W. Edward Deming, Joseph M. Juran and Philip Crosby. The ISO 9000 certi-fication standards created by the International Organization for Standardization, plays a ma-jor role in setting quality standards for global manufacturers.
(3) Business Process Reengineering -The global economic recession in 1990’s pushed compa-nies to seek innovations in the processes by which they run their operations. The message ofbusiness process reengineering (BPR) was conveyed by Michael Hammer’s article in HarwardBusiness Review. The approach suggests to make revolutionary changes as opposed to evo-lutionary changes. It asks for taking a fresh look at what the organization is trying to do in allits business processes and thus eliminating non-value-adding steps and streamlining to achievethe desired outcome.

(4) Supply Chain Management (SCM)- The basic idea of a supply chain management is toapply a total system approach to manage flow of information, materials and services fromraw material suppliers through factories warehouses to end customers. Recent trends asoutsourcing is forcing companies to find flexible ways to meet customers demand. SCMhelps in maximising the speed of response to changes in customer expectations .
(5) Electronic Commerce - The quick adoption of the internet and world wide web during late1990’s has changed a lot in business practices. The term electronic commerce refers to theuse of the internet as an essential element of business activity. The use of web pages , searchengines is changing the way people collect information, communicate and shop. It is alsochanging the way operations managers coordinate and execute production and distributionfunction.
1.5 Role and Responsibilities of Operations Manager
A production/operations manager has to shoulder a number of responsibilities in anymanufacturing organization. Some importamt ones are:
1. To plan location of the Plant.2. Layout of machinery and equipment in the Plant.3. Purchasing of production equipments.4. Design of Product.5. Process Design.6. Designing methods of production and establishing standards.7. Aggregate Capacity planning.8. Production planning.9. Production control.10. Supply chain management.11. Repairs and maintenance.12. Health and Safety of personnel.13. Setting production Standards and getting quality certifications.14. Measurement of productivity.15. Industrial relation (Trade union).16. Budgeting.17. Research and Development.
1.6 Summary
Operation function of any organization is one which produces its products. The basic ele-ments of this function includes input in the form of raw material, machines and labour, output inform of product and services. The system is subjected to random fluctuations which becomes acause of deviation between planned and actual output. The growing volume of service sectoremphasised the need of broadning of the term production to operations. With this vital function, thecompanies tried to gain a competitive advantage. Thus an operations manager has a significant roleto play in any organisation.

1.7 Self Assesment Test 1. Define the term operations management.
2. What is the difference between product & service ?
3. How does operations management differ from production management.
4. Apply the basic model of operations system to -
(a) An MBA institute
(b) A Restuarent
(c) A Courier Company
5. Explain in detail the historical evolution of operations management.

Unit -2 Facility LocationUnit Structure
2.0 Objectives
2.1 Introduction
2.2 Effects of Location on Costs and Revenues
2.3 Need for Location Change.
2.4 Location Options
2.5 Factors for Location.
2.6 Decision Process in Location of Facility.
2.7 Choice of Foreign Facility Location.
2.8 Strategies for Multiple Facilities
2.9 Summary
2.10 Self Assessment test.
2.0 Objectives
After studying this unit you should be able to understand :
Importance and need of facility location
Impact of location on profitability of an organisation
Various factors influencing choice of a location.
Decision process in location selection.
2.1 Introduction
A factory or a plant is a manufacturing facility of a company. A ware house is the storagefacility of a manufacturing or a distribution company. The offices of a service sector company suchas a bank, or an investment consultant are its facilities. The facility location decision is very impor-tant for business houses who are well established as well as for new entrepreneurs. This is a vitaldecision in the sense that it involves a long term commitment. Once the buildings are built manufac-turer or facility provider must live with these locations decision for a long time. The enormous firstcost of most facilities and their subsequent low market value for resale make organizations to con-tinue at the same locations even if they are not optimum.
2.2 Effects of Location on Costs and Revenues
(i) Fixed costs - New or additional facilities entail fixed costs initially, which must be recoveredout of revenues to make the investment profitable. Acquiring a new or additional facilityinvolves cost for new construction, purchase of new plant and after acquiring money has tobe spent on equipment and fixtures. The size of investment depends upon the site selected. Asite with in the main city would be costlier than that in sub urban area.
(ii) Variable Costs : Once built, the new facility must be staffed and operated, and these costsalso depend on location. For labour intensive projects cheap and plentiful labour must be

available. Management must also look for proximities to raw material and markets.
(iii) Revenues - In some industries, revenues depend on having the facility near to the potentialcustomer. In number of cases where service is to be directly consumed, location is verycritical Movie theaters, Restaurants, Banks etc. must be located conveniently within easyreach of the public.
The above analysis of cost and revenues helps us in defining the problem of facility location.So, an ideal location of a facility is one, where all the factors which minimise the cost of operationswill give that enterprise the greatest advantage by virtue of its location. For an optimum location theunit cost of production and supply should be minimum.
2.3 Need for Location Change
The Location Problem is not only for an entirely new business but also equally important forexisting business. Some of the factors are-
1. Operations and expansion restricted due to poor site
2. Growing volume of business
3. Variance in labor cost / productivity
4. Shifting of Markets
5. Companies may merge and facility become redundant
6. New Products may be introduced, changing the avaibility of resource and Market.
7. Changes in political and economic situation
8. Availability of new technology, old Plant become obsolete.
2.4 Location Options
There are four options available to managers which can be considered in location planning:
1. Extension of existing Facility This option can be exercised if adequate for expansion isthere.This is important when desirable features are not readily availabe elsewhere and cost ofexpansion is less than other options.
2. To add a new location while retaining the existing one.
3. To relocate facitity to a new location In this case only machines and equipment can be relo-cated and not the human resource Investment is also required for new location.
4. To maintain the same status If detailed analysis fails to unearth benefits of first three alterna-tives, a firm may decide to maintain the status.
2.5 Factors for Location
The important factors which influence the selection of location of a facility are1. Raw material2. Market3. Transportation4. Fuel

5. Power6. Water7. Labour8. Climate9. Laws and Taxation10. Finance Facilities11. Government aid and Policies12. Existence of similar industries13. Social and recreational facilities14. Ancillary Industry(1) Raw Material : The source of raw material is very important factor in ultimate location of
facility. The total requirment of raw material its availablity within economic distance and itsuninturpted supply are very critical factors to be considerd for location of any manufacturingunit. If a plant is in proximity of raw material it would result into timely delivery, low trans-portation cost and at the same time safeguard from loss arising out of situtation like breakdown of transportation system etc.
Raw materials which have high transport cost attract the industry to the place of theiravailability, such on Iron ore, Sugarcane, Tea etc. Industries like butter, cheese, meat etc.which are perishable in nature have to strike a balance beetwen market and raw materiallocation. Industry which produce costly but light things and use specialsed or skilled labour,have no attraction for nearness of raw material.
Along with raw material, availability of building material must not be over looked,other wise cost of building might go high. Similarly supplies required for maintenance andoperation of factory must be considered.
(2) Market : If the facility is near to the market, specially in case of consumable service, itdefinetly helps in gaining a competitive advantage. The cost of distribution is considerlyreduced by locating a facility near the market. If products demand aftersales service it isimperative for the enterprises to be located near the market. When the products are perish-able (bakeries, dairy products) or service (educational institute, hospital) or weight is addedduring the process (bottled drink), plant should be near the concentration of the market. Ifthat is not possible a company can adopt for differential pricing policy to serve differentmarkets.
(3) Transportation : All manufacturing units require inwords movement of raw material, andoutwords movement of finished goods to the market. While locating a plant full advantageshould be taken care of various transportation facilities available at the disposal. Major trans-portation medium like Rail, Road, Marine, Aircraft, Highway vehicles, Pipelines, Electriccables, Telecommunication(Information Technolgy) should be effectively used to handle thetransportation.
Each transportation meduim has its merits and demerits, so in order to select propermeduim following considerations should be given
1. Type and extent of material handling.

2. Relative cost of various media.
3. Urgency.
4. Special facility requirement like refrigration.
Logistcs today has became an important field in this regard and all possible actionshould be taken to reduce cost.
(4) Fuel : Fuel as a locational factor vary from industry to industry. For those industry andprocesses which utilize fuel as basic raw material, like coal in thermal power plant and ce-ment manufacturing plant, it becomes very critical in terms of cost, quality and availability.Cost figure should be seen in Rs. per thermal unit rather than Rs. per ton so as to use thisefficiently.
(5) Power : Power intensive project will definitely gain advantage if cheap, uninterrupted poweris available to them. Industry like Aluminium refinery is an example of it. In industries likepharmaceuticals units uninturrpted supply is must. It would be cheaper to get supply frompublic electric power company than to generate own electric power.
(6) Water : In number of industries water may be considered an important factor for location.Mineral water plant, nuclear power plant are some of the examples. Water is also required forcooling and waste disposal.While considering the availability of water following points mustalso be taken care of -
(a) Quantity of water required
(b )Source of supply
(c) Hardness level of water
(d) Danger of water becoming polluted by surrounding plants.
(7) Climate : This factor is very important where the process needs a particular environment andthe efficiency of process is affected by it. For example wind mills need open areas with upsand down in topography. A flour mill needs dry climate.
Although atmospheric environment can be created by artificial means, it will haveeffect on both operation and cost. Climate also influences human efficiency and behaviour.Healthy and clear atmosphere free from smoke, dust and noise is additional advantage to anenterprise.
(8) Labour : Availability of trained and cheap labour is another factor influencing plant loca-tion. The labour should not only be adequate in number but it also should have necessaryskill in the process. Other important considerations are-
(a)Wages
(b)Labour productivity
(c) Stability
(d) Cost of living
(e) Labour -Management relations
Labour intensive industries are located near thickly populated areas so that regularand cheap labour is easily available.

(9) Laws and Taxation : Although much of labour laws and taxes are uniform throughout thecountry but some laws and taxes are local and vary from state to state. All labour laws,pollution control laws should be carefully considered before finalising on the location. Manystates offer incentives in terms of tax, electricity rate, land rate which helps a new plant tobreak even faster.
(10) Availability of Finance Facilities : With number of banking companies and financial insti-tutions, this factor is now no more a problem. But cheap financial and insurance charges fora particular zone might lead to a substantial saving. Such locations do attract a number ofindustries.
(11) Government Aid : Central and state policy regarding taxation (Excise, VAT, Corporate Tax),transportation rates, special assistance in form of subsidies, development of Special Eco-nomic Zone (SEZ) or Industrial parks, liberal views in issue of industrial licence are certainfactors which can create industrial concentration for a certain area. Many new entrpreneursand existing industrial giants may tend to move on these location which gives a big monetarybenefit in terms of government aid.
(12) Social and Recreational Facilities : Usually big units are located away from public in ruralareas which are far from social and recreational centers. During off hours, the employees andtheir family members require some recreational amenities which are also necessary. It isthere fore necessary to have parks, cinema halls, schools, hospitals, clubs libraries, sportsfacilities etc. near the factory site.
(13) Existence of similar industries : New entreprenurs start the plant at places where there arelarge number of similar industries so that all the basic things required are easily available.
(14) Ancillary Industries : Sometimes location are selected nearby ancillary industries, meaningindustries which produce materials and supplies in connection to the proposed manufactur-ing, are present. This brings out centralization of industries.
2.6 Decision Process in Location of Facility
Generally while deciding on location for a facility, a three tier approach is followed in quali-tative analysis-
(a) Deciding up on region or geographical area
(b) Identifying the community site
(c) Identifying the actual site
(1) Selection of Region : In the first step, the management identifies the region or geographicalarea where the facility is to be located. Regional location decisions are influenced by factorsdiscussed in the previous section. The importance of these factors can vary from industry toindustry and proper weights can be give to various factors in order to make a choice betweentwo or more locations.
(2) Selection of a Community : Once the geographical region has been decided next step is toidentify the community where the facility has to be located. Again community selecting ischoice between three types :-
(a) City location

(b) Suburban location(c) Country side location
Most of the factors taken into consideration in regional decision are present in communityselection. Other factors include community service, attitude and incentive towards new locations,availability and cost of land, environment impact and management preferences are important factorswhich are seen in community decision.
(a) City Location : A city loaction has the disadvantage of high cost of land which makesinitial investment bigger, at the same time rates of taxes and insurance are also high. But acity site has all other advantages like availability of skilled labour, nearness to market, bettertransport facitities, better financial facilites good supply of power and water and easyapproach to all govemment departments.(B) Surburban Location : It is a location between city and country side, so it can takeadvantages of both types of locations. They are chosen so that if large area of land is requiredit can be obtained and at the same time they are close to large population area. They also getfreedom from common city builiding zone and other restrictions found in the city. Femaleemployees can also be found in suburban area as these areas lack employment opportunities.Govemment laws and taxes are also relaxed in these areas social and recreational facility arenot too far from the site.(C) Country-side Location : If a plant is set on country side, land is availabe on cheap ratewhich can be hlepful in future expansion, Cost of construction, labour taxes. etc are alsolow and pollution norms are also relaxed but these sites are far from market, customers andskilled labour. Adequate transportation facilities are also not available and social andrecreational facilities have to be developed for the employees.
(3) Selection of Actual site : Once the choice of site has been narrowed from region tocommunity the next step in facility location is to select the actual site. While selecting theactual site technical, commercial and financial aspectes must be considered to get themaximum advantage. The main points for selecting a site are-(A) Topography : This is very important in the sense that the sub soil condition of the siteshould be such that it can take load of foundation and building. If the site is not levelled, costof levelling will also be incurred. Also cost of laying water supply line, drainage, sewagedisposal, installation of electricity poles etc. must be checked, as if these are excessive, lowprice land would become expensive.(B) Site Size : Size of the land should be such that it takes care of current needs of plant plusfuture expansion. Sufficient space to accomodate parking, transport facility for receipt andshipment of goods and movement should be availble.(C) Waste Disposal : The facilities required for disposal of process waste needs to beconsidered. The plant should be positioned such that prevailing winds carry away fumes andsolid and liquid waste can be disposed off properly and at reasonable cost.(D) Transportation Facility : The site should be accessible both by road and rail preferablyso that the transportation cost are minimum and movement is easy and quick.(E) Ecology and Pollution : Before final selection of the site, one should check if there isany restrictions imposed by local self government on issues relating to pollution andecological balance.

(F) Legal Aspects of Property : It should be made sure that area which is to be acquired isfree from any dispute and person selling the land has the clear title of the same. It should befree from any encroachments. The land should be taken into possession easily.
2.7 Choice of Foreign Facility Location
With globalization and removal of trade barriers consumers expect the best products at low-est price. In order to meet competition companies have to engage in global production and serviceoperations. Following factors should be taken care while evaluating international location option fora facility.
(i) Trade Barriers.
(ii) International Customers.
(iii) International Competition.
(iv) Lower cost.
(v) Incentives.
(vi) Economics of scale.
(vii) Additional Resources
2.8 Strategies for Multiple Facilities
An organization may go in for setting multiple facilities i.e setting up plant at more than onelocation. There are three basic strategies for multiple locations.
(i) Separate facility to serve different areas : Products where cost of distribution has to becontrolled and demand pattern are volalite this strategy of having separate facility to servedifferent geographical areas is very helpful. A number of areated drink manufacturing com-panies like Pepsi and Coke follow the same strategy. Banks, hospitals, schools, courier com-panies are some examples in service industries.
(ii) Separate facility for different Products : A company like Godrej has diversified productrange from cosmetics to furniture and computers. Similarly white goods manufacturing com-panies have television, washing machine, refrigerators, micro wave etc. in their product range.For such organizations separate facility for each product is optimum.
(iii) Separate facility for different processes : Many computer manufacturers have separatemanufacturing facilities for different sub parts. These parts are then assembled together tomake the final product. This strategy helps in avoiding confusion at the main manufacturingsetup. At the same time a lot of coordination is required between such plants as these serve asfeeder units to the other plants.
2.9 Summary
Location decision for a facility is very important in the sense that it involves a substantialcommitment in terms of cost and time. It is not easy to reverse a wrong decision taken in for alocation. There are a variety of factors which need to be considered before coming to the final choiceof location of a facility. First step is, selecting a region then selecting a community and then selectionof the final site. The over all selection procedure is taken by giving due weightage to various factors.

2.10 Self Assesment Test1. Define facility location : When does the need for a location change arise ?
2. How does location decision affect overall profitablity of any organization. ?
3. Discuss the decision making process in finalizing the facility location.
4. What are the various factors influencing the location decision ?
5. Discuss locations options available to an operations manager.
6. How does location decisions differ in manufacturing and service ?
7. With breaking of trade barriers discuss the option of going for foreign location?
8. When can an organization go for locating multiple facilities ? Discuss with examples.
9. Taking an industry of your choice select the optimum location justifying various factors.

Unit – 3 Product/ Process DesignUnit Structure
3.0 Objectives3.1 Introduction3.2 Types of Processes3.3 Factors for Process Design Decision3.4 Types of Product/ Process Design3.5 Aids of Process Planning3.6 Factors Affecting Process Design3.7 Designing for the Customer3.8 Summary3.9 Key Terms3.10 Self Assessment Test3.11 Reference Books
3.0 Objectives
After studying this unit, you should be able to understand:
Process of new product development Meaning of process and its types Meaning and types of product/ process design Aids of process planning Factors affecting choice of process design
3.1 Introduction
A product is any thing that a manufacturer or service provider has put in the market for sale.It can be a physical good, idea, service, event, news etc. In this chapter we are going to explain howa product takes birth, survives and becomes a hit in the market. What are the different ways in whicha product can be produced, whether all the things are to be done by a single company or they canoutsource some of the processes and parts. In today’s highly competitive world designing a productand getting it to the market has taken a front seat as products are copied very quickly and to recoverthe total research costs one has to take to capitalize first mover’s advantage without which the wholelaunch can be a loss. So let’s see the steps in product development process.
Step 1. Idea Generation – New ideas for products can come from studying consumer de-mands and requirements, interacting with various groups and using creativity generating techniques.Scientists go on testing new technologies to give birth to new products; any such idea can developinto a profitable product. Other then scientists’ ideas can come from employees, competitors, chan-nel members and top management. Employees throughout the company can be a source of ideas forimproving production, products, services and processes. Toyota claims that its employees submit 2million ideas annually, over 85% of which are implemented.

By researching competitors products and services customers likes and dislikes about com-petitors’ product can be found out. Channel members and company representatives have first handexposure to customers and are first to learn about competitive developments.
Creativity enhancing techniques like attribute listening, forced relationship, morphologicanalysis, mind mapping etc can also be helpful in discovering new product ideas. In a lot of compa-nies like Apple (Steve Jobs), Polaroid (Edwin H. Land), CEO’s themselves have taken the responsi-bility of technological innovation and it has proved to be of billions of dollars.
Step 2. Idea Screening – Not all ideas are feasible or can be converted into a successfulproduct. All the ideas received by the Idea manager are reviewed by an Idea committee at regularintervals and are grouped under three heads: promising ideas, marginal ideas and rejects. Each prom-ising idea is researched to find out its marketability. Here two kinds of errors can be committed goerror (moving ahead with a poor idea) and drop error (dismissing a good commercially viable idea).
Step 3. Concept development and testing – A product idea is a possible product the com-pany might offer to the market. A product concept is an elaborated version of the idea expressed inmeaningful consumer terms. For developing a product concept certain questions are to be answered– who is the target customer and what primary benefit will the product give. Concept testing in-volves presenting the product concept to appropriate target consumers and getting their reactions.The more the tested concept resembles the final product or experience, the more dependable concepttesting is.
Step 4. Marketing Strategy – If the product proves to be a success during testing, a prelimi-nary marketing strategy plan is prepared for introducing new product in the market. The plan con-sists of three parts. First part describes size of the target market, its structure, positioning, expectedsales and profit goals etc. Second part outlines the planned price, distribution strategy and marketingbudget for first year. Third and the final part describes’ the long term sales and profit goals andmarketing mix strategy for the product.
Step 5 Commercialization – This stage represents the actual full length launch of the prod-uct into the market. It is the most expensive stage as production plant has to be set up, raw materialpurchased, marketing and supply of the product has to be done at this stage only.
3.2 Types of Processes
Process Converts all the input material into finished goods and services. It is any part of anorganization that takes inputs and transforms them into outputs or finished goods. This whole pro-cess can be done in a lot of different ways like job process, batches, project, line process and con-tinuous process.
Idea Generation
Idea Screening
Concept Development and Testing
Marketing Strategy
Commerci-alization
New Product Development Process

1. Project Process – A project can be defined as any single, exclusive assignment characterizedby long time duration, its own project manager and unique problems etc. Project can beanything from constructing an over bridge, a helicopter or arrangement of an event. Some ofthe characteristics of a project are as follows:
a. Unique in nature i.e. no resemblance to any old project.
b. Has a project manager assigned to it.
c. Dedicated resources.
d. Deadline for its completion is decided beforehand.
e. Has a specific purpose.
f. These require close coordination between various functions.
g. These are usually complex in nature.
2. Job Process - Product or services are produced in small quantity and resources are organizedaround the process. Here the quantity produced is small but the type of products produced ishuge. Some of the characteristics of job process are as follows:
a. Company follows make to order strategy.
b. Products and services are designed as per customer requirements.
c. Volume of products or services are low.
d. Requirement of next customer are unknown.
e. Timings of repeat order is unpredictable.
3. Batch Process – This process type is opposite of job process as here the quantity produced ishigh and the range of products produced is narrow. Some of the characteristics of batchprocess are as follows:
a. Company follows assembly to order strategy.
b. Some of the critical components of the final products are assembled in advance.
4. Assembly Line Process – In line process products and services are standardized i.e. they aresimilar and the production is done in high volumes. Resources to be used during productionare organized around the process. Some of the characteristics of line process are as follows:
a. Material moves from one workstation to other in a fixed sequence.
b. Each operation is performed repeatedly.
c. Company follows make-to-stock strategy.
d. Finished product is kept in inventory.
e. Product variety is created by addition of standard options to basic products.
5. Continuous Process – Continuous process more or less just like line process but the differ-ence lies in the quantities that are produced. Continuous process produces standard productin a very high quantity and the production is carried all round the clock and it follows a rigidline flow. Some of the products which are produced by this process are ceramic tiles, colddrinks etc. Its features are as follows:
a. Volume of production is very high.
b. Primary material keeps flowing round the clock.
c. Company follows make-to-stock strategy.
d. Process is capital intensive.
e. Process are continuously operated to maximize the utilization.
f. Shutdowns and start-ups are minimized by preventive maintenance.
6. Make-to-order Process – In this process, production takes only when company receives anorder for production i.e. process is activated only in response to an actual order. This leads toalmost no work-in-progress and finished goods inventory. Raw material generally followsjust in time approach where at the time of production raw material is received by thecompany. This helps in reducing losses due to obsolesnce. Services generally follow thisapproach as products are processed once an order is received by the company. Restaurants,beauty parlors etc. use this approach.
7. Make-to-stock Process – It is just the opposite of make-to-order process. Here productiongoes on continuously and finished goods are stored. The goods produced are standardizedproducts that have high demand in the market. This attracts those who need products veryquickly and cannot wait till the product is manufactured. This process is controlled based onactual or anticipated amount of finished goods inventory. It is also used when demand isseasonal, so production is carried during off season and stocked for the peak season on thebasis of past year sales.
8. Hybrid Process – Hybrid process is a combination of make-to-stock and make-to-orderprocesses. Here a standard or generic product is produced by make-to-stock process andstored at some point then when customer places an order the final product is completedaccording to individual customer’s requirements. For example Maruti offers Wagon R in twostandard variants petrol and Deo (LPG). It also offers an accessory package in which buyercan get the vehicle customized by choosing from a list of options such as alloy wheels, rearspoiler, fog lamps, different types of leather colored seat covers, steering cover, foot matsetc. While the production of standard vehicle goes on continuously, it is accessorized onlywhen customer asks for it.
9. Pacing – It refers to the fixed timing of the movement of items through the process. In everyassemble line the movement of products is timed according to some standard mechanizedway in order to coordinate the line. Here a clock starts a backward counting as soon as theproduct reaches a stage and when the clock tics zero the product moves to the next stage. Sotime controls the movement of products from one stage to the next stage.
3.3 Factors for Process Design Decisions
As we have seen that there are many types of processes, but how does one decides whichprocess would be appropriate for a product. For deciding this there are some important factors whichshould be considered before laying the process design which are as follows:
1. Nature of Demand – A business exists to serve the needs and requirements of the customerswho make the market. Demand is the want of a product by the customers accompanied by thecapability to pay for it. So a business should be such which understands needs of customers.There are various forecasting methods which are used to estimate the future demand and

accordingly the process is designed and production capacities are established. Inventory levelis also maintained accordingly. During estimating the demand for future certain factors likeseasonality, growth trend and other such factors should be taken care of.
Influence of Demand Pattern : Fluctuation in demand is due to reasons like seasonal effect, growthtrend, customer taste, expectation in future price of products, prices of related goods etc. Example –demand for hot blowers, holiday packages etc. Businesses also have to adjust their production scheduleand pattern according to such changes. During sluggish demand the production has to be reducedand on the other hand if the demand is very high production also needs to be increased. So theprocesses should be flexible enough to incorporate such fluctuations in the demand of the products.
Influence of Price Levels : We all know that there is inverse relation between the price of a productand its demand i.e. if the price increases demand decreases and a fall in price brings about increasein the demand of a product. Price elasticity is another factor which plays a prominent role in thedemand of a product. Elasticity is the degree of responsiveness of a quantity demanded to the changein its price. Normal goods have unitary elastic demand while luxury goods have a highly elasticdemand, so a small change in the price brings about more than proportionate change in the demandof the product.
2. Quality Level – Quality is a very important factor for being successful in today’s market asthere are a lot of closely related products available in the market and per head income hasalso increased over the years. So people are ready to pay even a higher price if the quality ofproduct is good. Companies also use a lot of techniques to improve the quality of the prod-ucts like TQM, CAD/ CAM.
3. Degree of Automation – Degree of automation represent the use of machines in the wholeprocess of production. If more of machines are used then it is capital intensive and if more oflabor is used then it is labor intensive process. If process is capital intensive then the qualityof products would be better and the products will be standardized, which can not be done inlabor intensive process. If the process is capital intensive then it is difficult to make anychanges in the production process. On the other hand it may be difficult to find labor withright kind of skills.
4. Flexibility - An organization is considered as flexible when it adjusts quickly to the chang-ing customers’ needs and market conditions. The more flexible a firm is more are its chancesto maintain and increase its market share.
Volume flexibility : Volume flexibility is the ability of a firm to increase or decrease productionvolumes of a firm in response to external changes. This is useful when the demand of a product isfluctuating and keeps on increasing and decreasing. Volume can be adjusted by adjusting labor andequipment. Fluctuating labor is simple by overtime or sub-contracting. But in short run it is difficultto make changes in industrial capacities. It can only be made flexible by running the equipment onfull load or less then full capacity.
Product/Service Flexibility : Product or service flexibility is the ability of production system forshifting from producing one product to other. It helps in business strategy focused on custom-de-signed product and services and low volume products. It represents the process focused design wheresmall quantities are produced of different products. The more flexible a firm is more are its chancesto survive in changing market.

5. Degree of Vertical Integration – Vertical integration refers to the extent to whichproduction and distribution channel are brought under the ownership of the organization.Integration is of two types – backward integration and forward integration. If a productionhouse acquires the firm that supplies raw material to it, then it is called a backwardintegration. On the other hand if the firm gets into one step forward in the whole channel thatis called forward integration. For example a shirt manufacturing company if gets intobusiness of fabrics then it is backward integration and if it starts its own distribution channelthen it is forward integration.
Integration may not be fruitful for all the industries. So operations managers have to decidewhether it will be profitable or not, if yes then to what extent. Integration has advantages of low costinputs, flexibility etc but disadvantages are obsolesce, lack of effective management etc. So opera-tions manager should evaluate all the pros and cons of vertical integration before deciding on itsimplementation.
3.4 Types of Process/Product Designs
The word design holds different meanings for different people for some its just the aestheticsof a product like its shape, color, texture etc., some other regard it as basic parameters of a system.For example design of a motor garage might mean establishing the characteristics and placement ofvarious units like paint booth, washing bay, lift, engine repair area, etc. Another interpretation ofword design is the detailing of the materials, shapes, and tolerance of the individual parts of a prod-uct. So here we are concerned with this last meaning of designing which explains the completedelineation and description of the specific stages of in the production process and the linkages be-tween the different stages of production. The design should be able to meet the quality standards,time deadline and should be produced at the least cost possible.
The quality and homogeneity of a product decide the level of automation required for theproduction of a product. If the product is highly standardized and mass production is to be done thenhigh level of automation would be there and all the work would be done by machines, hence thecritical production resource would be machine. On the other hand if an exclusive product is to bemade where expertise of a person is required it would be a labor intensive product where very lesspieces would be made. So it becomes very important to decide what kind of process design shouldbe adopted to produce each product and service. The various types of process designs used in theindustries are as follows:
1. Product - Focused2. Process – Focused3. Group Technology
1. Product FocusedThis type of production process is generally used in those production departments which are
organized according to the type of product or service being produced. It is also referred to as LineFlow production system. This is used for the products like radio, candies etc where products orservices tend to flow along linear paths without backtracking or side tracking. These items follow asimilar sequence for whole production i.e. same kind of machinery is used like in an assembly line toproduce a television. Advantages of a product focused process are low unit cost, high volume ofproduction, ease of planning. A disadvantage of this process is that it requires very high initial

investment as it uses specialized and expensive fixed position processing equipment. As it is amachine intensive production process it requires low labor skills, worker training and supervision,so in total it is easy to control. This is like the admission process in schools and colleges. At the timeof admission everything is united at a single place. In a single room you can take admission card,uniform, books and also deposit the fee.
A product focused production system is generally designed for three forms of production:discrete unit manufacturing, process manufacturing and delivery of services.
(a) Discrete Unit Manufacturing
It is a process where production of distinct products like cold drink or branded medicinestakes place. The production of these can be done batch wise and then the system can be shifted toproduce other products in similar batches. The whole production process moves in a single line andsimilar process.
(b) Process Manufacturing
In process manufacturing movement of materials among different operations takes place.Operations can involve crushing, screening, mixing, blending etc. So it is generally used by cement,paper, chemical, steel, packaged water and brewing industries.
(c) Delivery of Services
Delivery of services is also done through product focused process design, for example wait-ers of a restaurant follow a particular linear route while serving the guests.
2. Process Focused
In this method of process design, processes are given more importance then product. Sooperations are grouped according to the type of process. This system is also referred to as job shop asproducts move from department to department in batches that are usually determined by customers’orders. Unlike product focused designs which are used for mass production, process-focused designis used to produce small quantities of different items. We can also call it a functional system whereequipment and personnel are located according to the functions. Products flow in irregular patternthrough the different facilities. For example take the case of the system followed in schools and
A
B
C
B
C
C D1
Raw Material
Components (procured)
Procured Sub Assemblies
Components (made)
Sub Assemblies
Sub Assemblies
Assemblies Finished Product
Assemblies
A – Component Manufacturing Section B – Sub Assembling Section C – Assembling Section
Layout of a Product Focused production system

colleges. At the end of semester students have to take no dues, they have to go from one departmentto another i.e. from accounts to library, laboratory, computer lab etc then back to accounts. So a lot oftime is wasted.
Basic advantage of this design is flexibility of operations. Here more than one product can bemanufactured at a single time. Products move from department to department. If a department re-ceives two products at the same time then one can be put on hold till the first one is worked on.Another flexibility offered by this system is the wide spectrum of products which can be produced ata single time. A major setback of this design is the wastage of time during waiting in departments.Moreover this system also requires a lot of skills in employees, training is also required, more super-vision and control.
3. Group Technology
It was first used in 1940’s in Soviet Union as a production process design. Now it is usedeverywhere whether it’s India, Japan or USA. In this layout dissimilar machines are grouped into asingle work center to work on products similar in shape and processing requirements. Group tech-nology is similar to both product and process layout as each cell is dedicated to a limited range ofproducts and each cell is designed to perform specific set of processes. In this technology, each partwhich is produced is represented by a code which has several digits, each representing a physicalcharacteristic of the part. The benefits of implementing coding system are as follows:
Crusher Hopper A Feeder A
Hopper B Feeder B
Hopper C Feeder C
Hopper D
Dispatch Silo
Raw Mill
Blending Silo
Firing Kiln
Hopper E
Feeder
Feeder
Cement Mill
Limestone
Clay
Iron Ore
Gypsum
Layout of a Process Focused Cement Plant

1. Codes very clearly tell the steps taken in producing a part. Hence it is easy to route the partsin production.
2. Parts with similar characteristics can be grouped into families as similar products are gener-ally produced in similar ways.
3. It results in standardization of parts. These codes Collectively Consitute a database havingall the specifications of all old parts used in manufacturing that product. So when a newproduct is to be designed, codes of existing products can be accessed to identify similar partspresent.
Cellular Manufacturing :
It is a type of group technology in which the total production area is divided into cells; eachcell consists of group of similar machines. Advantages of cellular group technology are:
i. Less changeover time between batches of parts hence high productivity.
ii. Less cost of training as worker works on similar machines.
iii. Better quality.
iv. Reduction in material handling cost.
v. Simplified production planning and control.
3.5 Aids of Process Planning
Planning of production process is very important to fight with any unseen contingency thatmay come across during production. Production is a continuous process but it has to adapt to thechanging demands of the public. Operations manger generally uses assembly charts and processcharts to redesign, update and evaluate their production processes. Now let’s discuss all these atlength.
Assembly Charts :-
Assembly charts give a general understanding of the entire process involved in producingproducts which involve assembly of a number of parts. They provide an overall view of the move-ment of components and sub-assemblies. They also show a list of major components, sub-assemblyoperations, quality checks and assembly operations that are involved in making a mechanical assem-bly. In these charts operations are indicated by circles and inspections by squares.
Process Charts :-
These are also like assembly charts but they show extra information like description of vari-ous steps involved, their frequency of occurrence etc. Other activities like storage, delay and trans-port are also shown with the help of different signs like “ for storage, D for delay and for transport.The major use of process charts is to compare alternate ways of performing operations. Each activityis reviewed by examining whether the whole process can be improved if a particular task is elimi-nated, combined with some other task, changing the sequence of tasks or modifying the tasks.
Process charts are also useful in new product planning and improving existing operations.Thus process charts help managers analyze the efficiency of processes.

3.6 Factors Affecting Process Design
Investment :-
We have seen that a huge investment is required in product focused process design ascomplicated machinery is used in this kind of production. On the other hand a process focuseddesign involves less investment. So if a person who wants to set up a production plant but haslimited resources then he cannot opt for a product focused design. So the level of investment isdefiantly a very important input in selecting a process design.
Variety and Volume
The process design to be applied to a facility layout depends on the range of the product i.e.variety and volume of that particular product. If mass production of standard product is to beundertaken then defiantly we will have to go for a product focused design as it allowsstandardization and mass production. But if special product in small quantity is to be produced thenprocess focused design is better applicable.
The above diagram shows how to choose the kind of product design depending in diversityof product design and the batch size. It says that if product diversity is high and the number of eachkind of product is low then a process focused job shop would be a better option for design. On theother extreme if the product to be manufactured is standard and mass production is to be done thenproduct focused system would yield maximum results. Cellular and product focused batch systemlie in between both the designs.
Economic Analysis
There are two kinds of costs involved in any production process, which are – fixed cost &variable cost. Fixed cost does not depend upon the level of production but variable cost is directlydependent upon the level of production. If production is high variable cost is also high and visa-
DIVERSITY IN PRODUCT DESIGN
BA T C H
S I Z E
Product Focused dedicated system Product
Focused batch System
Cellular manufacturing system
Process focused job shop system

versa. Fixed expenses are rent of land, cost of machinery etc. While variable costs include cost ofraw material, electricity and fuel used to run the machinery, etc. So we can deduct that fixed costsare higher in product focused designs and low in process focused in designs. Same is the case withinitial investment, it is high in case of product centered process design and low in process centereddesign. Moreover if money is not a limiting factor then operations manager can suggest any designbased on the targeted production volume of the product.
3.7 Designing for the Customer
In some fields basically the technology intensive fields like electronics it was realized that inthe race to producing more technologically advanced products the companies had left consumersbehind. When designs are made keeping in mind the user and the aesthetics, it is called as industrialdesign.
According to Industrial design product should be defined and developed based on customerneeds. Less features or advanced features may not suit to the customer and result in failure of theproduct. Quality function deployment (QFD) is used to identified the customer needs by involvingcustomer in product design function. It helps in reduction of design time. QFD is also known ashouse of quality. It helps in identifying customer need and the way in which they can be met. Stepstaken for QFD are as follows:
Steps in Quality function deployment (QFD) :-
1. As QFD keeps customer at its center so it starts with market research to identify customerrequirement.
2. Customer priorities are put in sequence in terms of importance with respect to differentparameters/ characteristics of the product or service.
3. Next step rates companies’ product vis-à-vis competitors’ product.4. A matrix is drawn between Whats and Hows. Where “Whats” (Customer requirements) re-
fers to list of characteristics that a customer wants and rated by customer on a scale of 10.5. Hows are design characteristics to meet the customers requirements.6. Competitors scores are also shown in matrix at right side on a scale of 5.7. Central matrix shows the relationship between customer requirement and design dimensions8. Technical Assessment is carried out by finding out absolute importance of design character-
istics by multiplying the value of relationship between design characteristics and customerrequirements as defined by the customer.
9. Symbols are used in matrix for defining the relation ship. Example:
Whats vs HOWs Hows Vs WhatsStrong relationship 9 Strong positiveMedium relationship 3 PositiveWeak relationship 1 Negative *
Strong negative10. Triangular corner at the top shows the correlation among various design characteristics.
House of Quality – House of quality is a matrix made on the basis of customer requirement infor-mation. QFD brings about a whole picture of customer likings, dis-likings, etc in front of the man-agement team. But to understand all of it in writing is very difficult, to overcome this problem house

of quality matrix shows all this information in a pictorial form which is very easy to understand. Itmakes easy to come to a decision in engineering, marketing and design decisions. So the mostimportant quality of this matrix is that it lays full importance on customers’ requirements and thus ithelps the management team to focus on building a product that satisfies customers.
The matrix helps the team to translate customer requirements into concrete operating orengineering goals. The whole process encourages all the departments involved in product develop-ment to work closely and lays down the entire important characteristic which should be included inthe product. Matrix also shows the areas that need improvement.
First step in building the house of quality is to develop a list of requirements needed bythe customer in the product. In the next step these requirements are ranked in descending order ofimportance. Customers are then asked to compare company’s product with that of its competitors.Then a set of technical characteristics of the product is developed. These technical characteristicsshould relate directly to customer requirements. An evaluation of these characteristics should sup-port or refuse customer perception of the product. These data are then used to evaluate the strengthsand weaknesses of the product in terms of technical characteristics. The diagram on the next pageshows a blank diagram of the house of quality.
3.8 Summary
Process Designs are prepared at the time when a new product is launched in the market. Itsmain purpose is to make proper use of all the production resources like land, labor, material etc anddeliver the right product of right quality, at the right time, in the decided budget and in the rightquantity. There are different types of processes used for manufacturing which are – project, job,batch, line or assembly, continuous, make-to-stock, make-to-order and hybrid.
Process design helps in developing a detailed blueprint of a manufacturing plant and thusprovides foundation and structure of whole facility. Process Designs are of three basic types –product focused, process focused and group technology. Product Focused design is organized
What are 1-10 Ratings
Technical Assessment
Hows
Competitive Score
1-5 Ratings
Whats 1-10 Ratings
House of Quality

according to the product with linear flow of material, without any backtracking and side tracking. Itfacilitates high volume production of a standard product.
Process Focused design almost opposite of product focused design and facilitates productionin small quantities of customized products. Under group technology process design dissimilarmachines are grouped into work centers to work on products with similar shape and processingrequirements.
3.9 Key Terms
• Process – Set of activities performed by an organization that takes inputs and transformsthem into outputs ideally of greater value to the organization than the original inputs.
• Project – A group of interrelated tasks with unique characteristics, separate resources whichhelp in achieving predetermined objectives.
• Make-to-order – Process that is activated only in response to an actual order.• Make-to-stock –Process that produces standard products that are stored in finished goods
inventory. The product is delivered quickly to the customer from the goods inventory.• Hybrid – This Process combines the features of both make-to-order and make-to-stock.
Typically, a generic product is made and stocked at some point in the process. The genericproduct thus produced is customized according to customer’ wants and needs beforedelivery.
• Pacing – Movement of items through a process which is coordinated by a timingmechanism. Assembly lines are generally paced.
3.10 Self Assessment Test
1. What are the steps in new product development explain with the help by taking a fictitiousproduct.
2. What is a process? Explain the different types of processes by which products can bemanufactured.
3. What are the aids of process design?
4. What is a product/process design? Write down the different types of process designs withdiagrams.
5. What are the factors affecting the choice of process design for a manufacturer?
3.11 Reference Books
1. Adler, P.S; A. Mandelbaum; V. Nguyen; and ElizabethSchwerer. “Getting the most out ofyour product development process” Harward Business Review, March- April 1996,pp. 134-52
2. Ulrich, Karl T., and Steven D. Eppinger. Product Design and Development . New york: McGraw Hill/Irwin, 2004
3. Richard B Chase, F Robert Jacobs, Nicholas J Aquilano, Nitin K Agarwal, McGraw hillsCompanies( 11th edition) New Delhi 2006.
4. Operations Management, ICMR September 2003.

Unit 4 Job Design ConceptStructure
4.0 Objectives
4.1 Introduction
4.2 Factors affecting Job Design
4.3 Behavioral Elements in Job Design
4.4 Approaches to Job Design
4.5 Socio Technical Approach to Job Design
4.6 Contemporary Issues in Job Design
4.7 Summary
4.8 Key Words
4.9 Self Assessment Test
4.10 Reference Books
4.0 Objectives
After reading this unit you should be able to :
Understand the concept of job design and its relationship with other functions of operationsmanagement.
Study the significance of ergonomics and human engineering in job design.
Consider design specifications for improving productivity.
Realize the need for providing high quality of work life to employees.
Consider the behavioral dimensions of job design
Understand the need for socio technical approach to job design.
4.1 IntroductionJobs are the foundation of organizational productivity and employee satisfaction or dis-satis-
faction. During the next millennium the success of any organization will depend on how well thejobs are designed. Well designed jobs will help the organizations to enhance the motivation level ofemployees resulting in retaining the employees. On the other side, it may be noted that poorly de-signed jobs will result in lower productivity, employee turnover, absenteeism, complaints, sabotage,resignations and other problems. Job-related questions such as what work is to be performed, who isto perform the work, where the work is to be done, why the job is necessary and how should the workbe accomplished should be answered by a good job design. For organizational purposes, we dividejob design into two basic elements a human element and a work element. Physiological, social andpsychological considerations are important human factors relating to job design. The work elementwill comprise the work study which is covered in next two units. Chase and Aquilano define jobdesign as the function of specifying the work activities of an individual or group in an organizationalsetting. According to them following decisions are to be involved in job design:-
1. Quality control as a part of worker’s job

2. Cross training of workers to perform multi skilled jobs.
3. Employee involvement and team approaches to design and organize work.
4. “Informating” of ordinary workers.
5. Extensive use of temporary workers.
6. Creation of alternative “workplaces”.
7. Automation of heavy manual work.
8. Organizational commitment to provide meaningful and rewarding jobs for all employees.
4.2 Factors affecting Job Design
Job design is affected by design, organizational and environmental factors. Now, we willdiscuss each of them as under : Design Factors
Layout of Equipment and Seating: - When a person and equipment operate together to perform aproductive process, interest focuses on the efficient use of the person’s time and equipment time.When the operator’s working time is less then the equipment’s run time, a worker machine chart is auseful device for analysis. Generally equipment is first designed and then the operator is assignedthat equipment to perform his activities. The attitude is that no change is required in the equipmentand the person himself will adapt according to the requirements of the equipment.
For good design, the designer should know the details regarding areas for vision, for con-trols, for sitting, for leg room etc. by taking note of standard anthropometric data of men and women,as the case may be. Job design should consider weather the job is to be done standing or sitting or inboth the ways. In many of the cases it is noted that the workers have to change their postures fromtime to time and make them comfortable enough to relax by leaving the work station though for avery short duration of time.
It is the requirement of good seating that the person while sitting should be able to maintaina good posture. The use of a well designed and positioned back rest may relieve the back muscles ofa good deal of postural strain. A well design seat should therefore bear the weight of the body in agood posture. The element of good seating will depend on the length, width and shape of seat;material of which the seat is made; the shape and the height of the seat above the floor.
In many cases workers of categories such as cobblers, tailors, etc. prefer to work at floorlevel. This is popular among these workers as they have greater freedom to move their legs andbodies. Sometimes stool or bench are provided to them by the management, but usually it is seenthat such aids are not used subsequently for sitting purposes; rather the operators would place theirtiffin boxes, small bags, shawls etc. on these stools.
In case of controls, information should preferably given to the operators in a binary form of“yes-no” type. If the workers are illiterate then colors can be used. For quantitative information,digital presentation should be used. Important control penal instruments should have a combinationof auditory and visual signal scheme. While deciding on the layout of equipments, control panelsetc. space should always be kept for their subsequent maintenance and repair. There should be acces-sibility for regular maintenance. Diagnostic studies on regular basis should be conducted to preventfailures.

Instrument Display Design:- Displays which should be primarily of auditory or visual type help usto give information about a situation which is occurring or has occurred and which cannot beobtained by seeing or hearing directly, and so we might have to resort to the use of instruments, likepressure gauge for instance, which reveal the condition of piece of equipment or instrument. Dialsand counters are generally used for quantitative and qualitative reading, and to check reading forcomparison in visual displays without controls. Dials and counters may be used for checkcontrolling, setting and tracking when the displays are used for controls.
Studies have shown that counters which give the value directly in numerals are far moresuperiors than others for quantitative reading. It has further been observed that vertical straight dialsare better than circular dials because an upward movement of the pointer will always indicate anincrease in value. Horizontal straight dials can be used for setting machines more quickly ascompared to other varieties. There seem to be no definite conclusions about the variety of dials bestsuited for indication and warning purposes. When qualitative information about a situation is to beshown then pictorial displays are the best. These displays could include not only instruments buttables, graphic presentations and even pictorial panels. Today computer graphics is assuming greatsignificance. Auditory signals are also in use for providing warnings of the ‘yes-no’ type.
Compatibility: - While designing the control knobs, natural movements need to be kept in mind.Learning times for the operation of the equipment on which controls are compatible are much shorterthen if the controls are incompatible. The chances of accidents also increase if the control knobs arenot compatible with the natural movements. Based on the layout the various instruments are to bearranged so that they are compatible with each other as per the requirements of the jobs and the jobholders. Where controls are associated with dials in a panel, the dial and control should be laid outwith the same spatial relationship.
Control Design Characteristics:- With the computerization of major industries the control work isdone by the computers but still in traditional organizations manual control mechanisms are stillprevalent. Controls are the way in which an operator gives his instructions to his machine. Controlused for continuous adjustment could be rotary or reciprocating in form. Cranks, hand wheels andknobs are of the rotary type while ‘joysticks’ and levers are of the reciprocating form. Levers usuallygive controls in one dimension and joysticks in two dimensions but both types of controls do givespeed and accuracy. Controls required for discrete movement will usually be of some ‘off-on’ type ofmechanism.
Organizational Factors
Characteristics of Task: - Job design requires the assembly of a number of tasks into a job or agroup of jobs. The complexity in a job depends on the number and variety of tasks, or the scope ofdecisions to be made or the difficulty of predicting the decisions. The internal structure of each taskconsists of three elements: (i) planning (ii) executing (iii) controlling. The ideal job design is tointegrate all the three elements.
Work Flow: - The product manufactured or the service provided helps the firm to decide the deci-sion of work flow. The sequence and balance between jobs should be done correctly if the work is tobe done efficiently. After the sequence of jobs is determined, the balance between jobs is established.
Ergonomics: - Every industrial system consists of some or all of the following components: hard-ware, software, the physical environment and the organization. An objective of the designer is toarrange these components to give a harmonious and efficient operation. An objective of ergonomics

is to match, or provide the information to match, the various parts of the system to the characteristicsand abilities of the people involved in it. By utilizing ergonomics, the designer’s opportunities tocreate a system which reliably achieves its function are improved. Ergonomics can be defined as aterm used to describe the study of the physical arrangement of the work space together with the toolsused to perform a task. Ergonomics does not alter the nature of job tasks but the location of tools,switches and other facilities, keeping in view that the handling of job is the primary consideration.Work Practices: - Work practices are set ways of performing work determined by time and motionstudy which determine the standard time needed to complete a given job. This has been covered indetail in next two chapters. A new technique has now emerged, which introduced, could drasticallyalter the work practices in industrial settings. This technique known as, Maynard OperatingSequence Technique (MOST), uses a standard formula to list the motion sequences ascribed inindex values. Environmental FactorsTemperature and Humidity: - From the time of classical approach to management major stress hasbeen given on the effect of working conditions on the performance and efficiency of employees.Some studies conducted show an increase in accidents both with decrease and increase oftemperature from an optimum of 65°F to 69°F, the increase with cold being somewhat greater. Somestudies were conducted on people with different age groups and it was concluded that older men areadversely affected by higher temperatures. The scientists have very clearly proved with the help ofvarious experiments that human tolerance to heat increases gradually with the passage of time.Vibration: - The effect of movement and vibration upon the person may result in motion sicknessthrough slight discomfort or physical damage. Vibration near the tolerable comfort limit ifexperienced for long periods may harm and also affects person’s efficiency as a worker.Noise: - Any unwanted sound can be considered as noise. It has been proved quite a number of timesthat individuals who have been exposed to high noise levels over a long period of time suffer ahearing loss. It is thought that people get used to noise without realizing the long term impact.Earplugs and cotton wool can be used as cheap and effective preventive remedy against unavoidablenoise. However, noise could be made helpful in increasing productivity in some cases. Somecompanies introduce music-will-you-work so as to increase output and to improve workers feelingof satisfaction at job.Visual Environment: - The efficiency with which tasks are carried out are very much determined bylighting arrangements, the standard of lighting and recommended level of illumination at work place.It is proved that at that normal levels of illumination, the ability to see increase in proportion to thelogarithm of illumination,(given in lumens per foot, lm/ft) . This implies that after a defined level ofillumination the increase in illumination will not affect the productivity of workers. The contrastbetween the surroundings and the task being performed, the color schemes and the presence orabsence of glare drastically influence the overall efficiency and effectiveness of the worker.Social and Cultural Expectations:- Literacy, knowledge and awareness among workers have changedthe workers expectations regarding the jobs .Hence jobs should be such designed that they meet theexpectations of workers. Hours of work, holidays, vacations, rest breaks, religious beliefs,management styles and worker sophistication and attitudes are just some of the predictabledifferences that can affect the job designs across international borders. Failure to consider theseexpectations can create dissatisfaction, low motivation, hard to fill job opening and a low quality ofwork life, especially when foreign nationals are involved in the home country or overseas.

4.3 Behavioral Elements in Job Design
Degree of Labor SpecializationFrom the time of Taylor the debate always exists whether specialization of labor is advanta-
geous or disadvantageous for the organization as well as for the workers. Specialization of labor istwo-edged sword of job design. On the one hand it has made possible high speed and low costproduction, on the other hand, extreme specialization has lead to adverse effects on the worker, likeboredom etc. Recent research suggests that the disadvantages dominate the advantages. Thoughavoiding specialization is risky. The reason, of course, is that people differ in what they want fromtheir work and what they are willing to put into it. Some workers prefer not to make decisions abouttheir work and are simply not capable of performing more complex work. Two popular contempo-rary approaches are job enrichment and socio technical systems. These two have been discussed inthe chapter at different places.Advantages of specialization to management are following:
i. Training of the workforce is easy.ii. Recruitment of workers is simple..iii. High output due to simple and repetitive work.iv. Substitutability of labor results in lower wages.v. Close control over workflow and work load.
Advantages of specialization to labor are:i. Multiple skills are not required.ii. Uneducated workers can also perform.iii. Learning the jobs is easy.
Disadvantages of specialization to management arei. Controlling quality is difficult.ii. Worker dissatisfaction arising from turnover, absenteeism, tardiness, grievances, intentional
disruption of production process.iii. No one is concerned for the improvement of the process.iv. Limited flexibility and so creativity of workers is not seen.
Disadvantages of specialization to labor could bei. Repetitive nature of work results in boredom.ii. Small contribution to each item results in little gratification.iii. No control over the work leading to frustration.iv. As significant learning is not there in the process opportunity to progress is very little.
AutonomyIt is the freedom to control one’s responses to the environment. Jobs that give workers au-
thority to make decisions will provide added responsibilities, which tend to increase the employee’ssense of recognition and self esteem. Feedback
Proper feedback given to the employees will inspire the individuals to work on the completeproduct or on a significant part of it.

4.4 Approaches to Job Design
Job Rotation
Job rotation refers to moving employees from job to job to add variety and reduce boredomby allowing them to perform a variety of tasks. When an activity is no longer challenging, the em-ployee would be moved to another job at the same level that has similar skill requirements. Employ-ees with a wider range of skills give the management more flexibility in scheduling work, adaptingto changes and filling vacancies. According to Herzberg, job rotation is merely “substituting onezero for another zero”.
Job Enlargement
Job enlargement refers to the expansion of the number of different tasks performed by anemployee in a single job. An enlarged job can motivate an individual for five reasons:
(a) Task Variety
(b) Meaningful Work Modules
(c) Ability Utilization
(d) Work-Paced control
(e) Performance Feedback
Although the benefits of job enlargement are several certain disadvantages cannot be ig-nored. First, training costs tend to rise. Workers may require additional training for their new en-larged tasks. Besides, if the job enlargement program involves breaking up of the existing produc-tion line of work systems, redesigning a new system, and training employees to adjust to it, the costscan be substantial. Moreover the productivity may fall during the introduction of new system. An-other drawback is that union often argues for increased pay because of the increased workload.Finally even after enlargement many jobs may still be routine and boring. Fredrick Herzberg wasright when he said that job enlargement is simply “adding zero to zero”, meaning that one set ofboring tasks (zero) is simply added to another tasks of boring tasks (zero).
Job Enrichment
Job Enrichment involves adding more motivators to a job to make it more rewarding. Jobbecomes enriched when it gives job-holder more decision making, planning and controlling powers.First coined by Herzberg in his famous research with motivators and maintenance factors, job en-richment has become a popular concept. According to Herzberg, an enriched job had eight character-istics:
(a) Direct Feedback
(b) Client Relationship
(c) New Learning
(d) Scheduling Own Work
(e) Unique Experience
(f) Control Over Resources
(g) Direct Communication Authority
(h) Personal Accountability
Increased motivation, performance, satisfaction, job involvement and reducing absenteeism.Meet certain psychological needs of job holders help stimulate improvements in other areas of orga-nization. The concept of empowerment is a by-product of job enrichment. Empowering means pass-ing on authority and responsibility. Empowerment occurs when power goes to employees who, thenexperience a sense of ownership and control over their jobs.
Some Cautions about Job Enrichment
(a) Job Enrichment is Not a Substitute for Good Management.
(b) ‘Enriched’ is a Relative Term.
(c) Enriching Jobs may create a ‘Snowball’ Effect.
(d) Job Enrichment Assumes that Workers Want More Responsibility.
(e) Job Enrichment may have Negative Short-run Effect.
(f) Job Enrichment may become Static.
(g) Participation can affect the Enrichment Process.
(h) Change is Difficult to Implement.
4.5 Socio Technical Approach to Job Design
The socio-economic approach emphasizes the need for integrating the social consequencesof work with the traditional cost versus quantity consideration of production. The concept of socio-technical system was first elucidated by Eric Trist and his colleagues at the Tavistock Institute ofSocial Research in London. The approach attempts to develop jobs that adjust the need of the pro-duction process technology to the needs of the worker and work group. The social technical ap-proach has been applied in many countries- often under the heading of “autonomous work groups”,“Japanese style work groups”, or employee involvement teams. The American manufacturing com-panies use work teams as the building block of employee involvement teams.
The individual or work group requires a logically integrated pattern of work activities thatcomprise the following job design principles:
1. Task variety: An optimal variety of tasks within each job should be provided. The optimallevel is one that allows the employee to rest from a high level of attention or effort whileworking on another task or, conversely, to stretch after periods of routine activity.
2. Skill Variety: Research suggests that employee derive satisfaction from using a number ofskill levels.
3. Feedback: fast feedback aids the learning process.
4. Task Identity: Whenever possible, a group or individual employee should have responsibilityfor a set of task that is clearly defined, visible and meaningful.
5. Task Autonomy: Employees should be able to exercise some control over their work.
4.6 Contemporary Issues in Job Design
Telecommuting
Two of every three fortune 500 companies now use telecommuting. It is the use of micro-computers, networks and other communication technology such as fax machine to do work from

home, which was traditionally done in the workplace. The employees have no contact with otheremployees, but are able to communicate with them using electronic means. A variant of telecommutingis the virtual office, where employees are in the field selling or serving customers. However, thereare problems associated with telecommuting. These include the loss of creativity, as employees arenot interacting with other employees on a regular basis.
Alternative Work Pattern
Job sharing is an example of alternative work pattern. It involves two people sharing in a fulltime job. It can be implemented in several ways:
- Each working a half-day, five days a week.
- Each working two or three full days a week.
- Each working every other week.
- Each working alternate months or season.
Companies that use job sharing are primarily in the legal, advertising and financial servicessectors.
Techno stress
Techno Stress is caused by new and advancing technologies, particularly by informationtechnology. For example, the widespread use of electronic bulleting board as a forum for rumors oflayoffs may cause feelings of uncertainty and anxiety. It is the stress caused by new and advancingtechnologies in the workplace.
Task Revision
A new concept in the design of work is task revision. Task revision is an innovative way tomodify incorrectly specified role or job. Task revision assumes that organizational roles and jobexpectation may have been correctly or incorrectly defined. Performance suffers because of deviantbehaviors which result from incorrectly defined jobs. Task revision helps correct such incorrectlydefined jobs.
Knowledge Work
The emergence of knowledge work has transformed the way of designing works. Work isconcerned with firm’s intangible assets- human brains. The nature of knowledge work is fundamen-tally different from the traditional mass production.
4.7 Summary
With the advent of 21st century the conditions at the work and at the organizational level arechanging at a very rapid pace. The operations manager’s task is more complex and challenging withthese changes. Job design is one of those functions which have a great significance. The presentchapter talks about all the factors which help in designing the job. Along with organizational, designand environmental factors it also discusses the behavioral considerations. In various approaches tojob design, job rotation, job enlargement and job enrichment are discussed. In considering the role ofwork, operations manger must take a Sociotechnical approach. The chapter ends with a discussionon the recent trends in job design viz. techno stress, knowledge work, etc.

4.8 Key Words
• Job: Group of related tasks or activities that need to be performed to meet organizationalobjectives.
• Job design: The determination of specific job tasks and responsibilities, the work environ-ment and work methods.
• Job Enlargement: Procedure of redesigning jobs or modifying work content to providegreater stimulus variety, autonomy, task identity and feedback for the worker.
• Job Rotation: Movement of the employees into a job for a short period of time and then outagain.
• Job enrichment: Specialized work is made more interesting by giving the worker a greatervariety of tasks or by getting worker involved in planning, organization, and inspection.
• Specialization of Labor: Simple, Repetitive jobs are assigned to each worker.• Sociotechnical systems: A philosophy that focuses more on the interaction between tech-
nology and the work group. The approach attempts to develop jobs that adjust the productionprocess technology to the needs of the worker of a work group.
• Ergonomics: Study of the physical arrangement of the work space together with the toolsused to perform a task.
• Anthropometric data: Data regarding physical characteristics of human being.
4.9 Self Assessment Test
1. Why might practicing managers and industrial engineers be skeptical about job enrichmentand Sociotechnical approaches to job design?
2. What are the differences among job rotation, job enlargement and job enrichment?3. Explain the factors affecting job design?4. Which approaches of job design is being followed by organizations in the recent time. Ex-
plain taking example of any one company.5. Define job design. Which decisions are involved in job design.6. write a note on contemporary issues in job design.7. Taking examples justify the impact of environmental factors on job design.
4.10 Reference Books
Adams, Jr. E.E. and R.J. Ebert, 1978. Production and Operation Management, Prentice Hall Inc:Englewood-Cliffs.Barnes, R.M., 1980 Motion and Time Study, Design and Measurement of Work, Seventh Edition,John Wiley & Sons: New York.Cummings, T.C. and S. Shrivastava, 1977. Management of Work: A Socio-Technical Systems Ap-proach, Comparative Administrative Research Institute, Kent State University: Kent.Chase, R.B. and N. J. Aquilano, 1977. Production and Operations Management: A Life Cycle Ap-proach, Revised Edition, Richard D. Irwin Inc: Homewood.Maynard, H.B. (ed.) 1971. Industrial Engineering Handbook, 3rd Edition, McGraw- Hill Book Co:New York.

Unit -5 Operations StandardsStructure
5.0 Objectives
5.1 Introduction
5.2 Productivity
5.3 Introduction to Work Study
5.4 Introduction to Method Study
5.5 Method Study: Select, Record and Examine
5.6 Method Study: Define, Install and Maintain
5.7 Summary
5.8 Key Words
5.9 Self Assessment Test
5.10 Reference Books
5.0 Objectives
After reading this unit you should be able :
To realize the significance of productivity in operation standards,
To understand the concepts of work study,
To understand the concepts of method study and its relation with work study,
To realize that the approach is scientific method of decision making,
To understand that method study as one of the technique of productivity improvement,
To conduct method study with confidence,
To realize that the concepts are not restricted to manufacturing industries only.
5.1 Introduction
In contemporary industry, responsibility for developing operations standards in large firms istypically assigned either to a staff department designated methods analysis or to the industrial engi-neering department. In small firms, this activity is often performed by consulting firms that special-ize in work methods. But in both the cases the operations manager of the concerned firm plays thevital role in standardizing the operations as he is having the first hand experience of the differentoperations taking place in the organization.
5.2 Productivity
The ratio of output produced to the input resources utilized in the production.
The input resources in any productive system are one or more among these four: land, mate-rial, machines and men. Over and above the overall measure of productivity, where all the inputs aretaken together, there is a need to have partial measures relating output to individual input, in order topin point the areas of deficiency.

Two basic variations around the above definition have thus evolved. Total productivity is the ratio of the aggregate output to aggregate input. Partial productivity is the ratio of the aggregate output to any single input. The definition applies for an enterprise, an industry or an economy as a whole.
The basic objectives behind productivity measurement are:
(a) to study performance of a system over time;
(b) to attain a relative comparison of different systems for a given level; and
(c) to compare the actual productivity of a system with it’s planned productivity.
From the definition of productivity, it is apparent that a higher total productivity may result, if:
(a) more output is produced with the same or lesser input,
(b) the same output is produced with lesser input, and
(c) more output is produced with more input; the proportional increase in output being morethan the increase in input.
In the long term it is only through advance in productivity that employees can hope to obtainan increase in real wages, shareholders an increase in the purchasing power of their dividends, andcustomers lower real prices. It is equally true that the future economic strength of the nation in acompetitive world depends on the management’s success in achieving this aim, wherever the provi-sion of goods or services is involved. With the increase in scientific knowledge and development ofbetter management techniques this advance should not only be continuous, but should take place ata ever increasing pace.
Factors affecting productivity :-
Nature and quality of raw materials Basic nature of processes employed Amount of plant and equipment employed Efficiency of the plant and equipment employed Volume, continuity and uniformity of production Utilization of manpower
The Six lines of attack :-
To improve productive efficiency, some positive lines of action are :-
(1) Improve basic processes by research and development(2) Provide more, and improved, physical means of producing(3) Simplify and improve the product and reduce the variety.(4) Improve methods of operation(5) Improve organization, planning and control.(6) Increase manpower effectiveness at all levels.
5.3 Introduction to Work Study
The objective of the work study is to assist management to obtain the optimum use of thehuman and material resources available to an organization for the accomplishment of the work upon

which it is engaged. Fundamentally, this objective has three aspects-
(1) The most effective use of plant and equipment
(2) The most effective use of human effort
(3) The evaluation of human work
Work study is one of the major techniques in the group coming to be known as Productivityscience. A number of techniques have evalved which help management to create a prescribed outputwith a reducing input of the three real resources- manpower, materials and capital equipment. Workstudy, as the name implies, is the study of work: of human work in the deepest sense and dignity ofthe word, and not merely in the restricted meaning used in physical sciences.
The term ‘Work Study’ is defined in British Standard 3138:1969 as: ‘A managementservice based on those techniques, particularly, method study and work measurement, which areused in the examination of human work in all its contexts and which lead systematically to theinvestigation of all the factors which affect the efficiency and economy of the situation beingreviewed, in order to effect improvement.’
While the linkage between work study and productivity is apparent from the above, it is notexactly clear as to what makes it different from other productivity raising techniques. So now weexamine the two definitions: Method study is the systematic recording and critical examination of existing and proposed
ways of doing work, as a means of developing and applying easier and more effectivemethods and reducing costs.
Work measurement is the application of techniques designed to establish the time for aqualified worker to carry out a specified job at a defined level of performance.
Basic Procedure :There are eight steps in performing a complete work study .They are: Select the job or process to be studied. Record from direct observation everything that happens, using the most suitable of the
recording techniques, so that the data will be in the most convenient form to be analyzed. Examine the recorded facts critically and challenge everything that is done, considering in
turn: the purpose of the activity; the place where it is performed; the sequence in which it isdone; the person who is doing it; the means by which it is done.
Develop the most economic method, taking into account all the circumstances. Measure the quantity of work involved in the method selected and calculate a standard time
for doing it. Define a new method and the related time so that it can always be identified. Install the new method as agreed standard practice with the time allowed. Maintain the new standard practice by proper control procedures.
Steps 1, 2 and 3 occur in every study, whether the technique being used is Method Study or WorkMeasurement. Step 4 is part of Method Study practice, while step 5 calls for the use of WorkMeasurement.
Work study is not a substitute for good management and never can be. It is one of the tools inthe manager’s tool kit. If work study is to contribute seriously to the improvement of productivity,

relations between the management and the workers must be reasonably good, and the workers musthave confidence in the sincerity of the management towards them.
5.4 Introduction to Method Study
Method Study is the systematic recording and critical examination of existing and proposedways of doing work, as a means of developing and applying easier and more effective methods andreducing costs.The objectives of Method Study are:
i. Improvement of processes and procedures.ii. Improvement in the design of plant and equipment.iii. Improvement of plant layout.iv. Improvement in the use of men, materials and machines.v. Efficient materials handling.vi. Improvement in the flow of production and processes.vii. Economy in human effort and the reduction of unnecessary fatigue.viii. Method standardization.ix. Improvement in safety standards.x. Development of a better physical environment.
ProcedureThe solution of any problem follows the following sequence of phases in that order:
1. DEFINE the problem.2. RECORD all the facts relevant to the problem.3. EXAMINE the facts critically but impartially.4. CONSIDER the courses of actions (possible solutions) and decide which to follow.5. IMPLEMENT the solution.6. FOLLOW UP the development.
We have already discussed the basic procedure for the whole of work study, and workmeasurement. Let us now examine the basic procedure of method study.They are as follows:-
(a) SELECT the work to be studied.(b) RECORD all the relevant fact about the present method by direct observation.(c) EXAMINE those facts critically and in an ordered sequence, using the techniques best suited
to the purpose.(d) DEVELOP the most practical, economic and effective method, having due regard to all con-
tingent circumstances.(e) DEFINE the new method so that it can always identify.(f) INSTAL that methods and standard practice.(g) MAINTAIN that standard practice by regular routine checks.

5.5 Method Study: Select, Record and Examine
Selection of JobWhen a method study investigation of a particular job is carried out, certain factors are kept
in mind. These are:-(1) Economic consideration: The cost of the study, the loss of time due to the investigation, the
cost both short-term associated with the prospective changes in the recommended workingmethod of the job should be carefully estimated and examined. If the accumulated estimatedbenefits from the recommended method outweigh the estimated total cost we should take upthe job under study. Discounted Cash Flow Technique (DCF) or Pay-back period methodmay be used for this purpose. Under preliminary considerations the early job choices are:Bottlenecks which are holding up other production operations. Movements of material overlong distances between shops or operations involving a great deal of man power or wherethere is repeat handling of material. Operations involving repetitive work using a great dealof labor liable to run for a long time.
(2) Technical considerations: The most important point is to make sure that adequate technicalknowledge is available with which to carry out the study. For eg. a) A speed machine toolconstituting a bottleneck in production is known to be running at a speed bellow that whichthe high speed or ceramic cutting tools will operate effectively. Can it be speeded up or is themachine itself not robust enough to take faster cut? This calls for the advice of machine toolexpert.
(3) Human reactions: These are among the most important factors to be taken into consider-ations since mental and emotional reactions to investigations and change of method have toanticipate. Trade union official workers” representatives and the operators themselves shouldbe educated in the general principles and objectives of method study .Participative manage-ment may facilitate overcoming the negative human reactions to investigations the changesof method. If, however, the study of a particular job appears to be leading to unrest or illfeeling, leave it alone, however promising it may be from the economic point of view. Ifother jobs are talked successfully and can be seen by all to benefit of people working onthem, opinions will change and it will possible in time, to go back the original choice
The need for recordIn order that the activities selected for investigation mat be visualized in their entirety, with a
view to improve them by subsequent critical analysis, it is essential to have some means of placingon record all the necessary facts for the existing method. A record is also essential if a “before andafter’ comparison is to be made to assess the effectiveness of the investigation and the subsequentinstallation of the new method.Recording Techniques-
According to the nature of the job studied, and the purpose for which the record is required,the technique chosen will fall into one of the following categories- (1) Charts (for process and timerecords) (2) Diagrams and models ( for path of movement records)
Sometimes more than one technique may have to be used to provide all the necessary infor-mation. This information may be obtained by visual observation, by calculation, or by means of aphotographic technique. In the case of micro motion studies, elaborate equipment and specializedknowledge may be necessary. The different types of charts and diagrams are-

ChartsOutline process chart - principle operations and inspectionFlow process chart - activities of men, material, equipmentTwo handed process chart - activities of worker’s two handsMultiple activity chart - activities of men and/or machines on a common time scale
Simultaneous motioncycle (sumo) chart - activities of worker’s hands, legs and other body movements
on a common time scaleTravel chart - movement of materials between departments.Diagrams and ModelsFlow and string diagram - paths of movement of men, materials or equipment
Two and threeDimensional models - layout of workplace or plantCyclegraphs and chronocyclegraphs - high speed, short cycle operationsExamine critically :The questioning technique
The questioning technique is the means by which the critical examination is conducted, eachactivity being subjected in turn to a systematic and progressive series of questions. The five sets ofactivities recorded on the flow process chart fall naturally into two main categories, namely-
- Those in which something is actually happening to the material or workpiece under consid-eration , i.e. it is being worked upon, moved or examined; and
- Those in which it is not being touched, being either in storage or at a standstill owing to thedelay.
Activities in the first category may be subdivided into three groups:(i) MAKE READY activities required to prepare material or workpiece and set it in position
ready to be worked on.(ii) DO operations in which a change is made in the shape, chemical composition and physical
condition of the product.(iii) PUT AWAY activities during which the work is moved aside from the machine or workplace.
The put away activities of one operation may be the make ready activities of the next- as, forexample, transport between operations from the degreaser to the cleaning benches. Puttingparts into storage, putting letters into an Out tray and inspecting finished parts are otherexamples.It will be seen that, while make ready and put away activities may be represented by transport
and inspection symbols, do operations can only be represented by operation symbols.The Primary Questions :-In the first stage of the questioning technique, the purpose, place, sequence, person, means of everyactivity recorded is systematically queried and the reason for each reply is sought.

The primary questions are-
PURPOSE - What is actually done?
Why is the activity necessary at all?
PLACE- Where is it being done?
Why is it done at a particular place?
SEQUENCE- When is it done?
Why is it done at a particular time?
PERSONAL - Who is doing it?
Why is it done by that particular person?
MEANS- How is it being done?
Why is it done in that particular way?
Secondary Questions :-
The secondary questions cover the second stage of questioning technique, during which. Theanswer to the primary questions are subjected to further query to determine whether possible alterna-tives to Place, Sequence, Person and / or means are practicable and preferable as a means of im-provement upon the existing method. Thus, during this second stage of questioning (having askedalready, about every activity recorded, what is done and why is it done), the method study man goeson to enquire: what else might be done? And hence: what should be done? In the same way, theanswers already obtained on Place, Sequence, Persons, and Means are subjected to further inquiry.
Combining the two primary questions with the two secondary questions under each of theheading purpose, place, etc, yields the following list, which sets out the questioning technique infull:
PURPOSE: What is done?
Why is it done?
What else might be done?
What should be done?
PLACE: Where is it done?
Why is it done there?
Where else might be done?
Where should it be done?
SEQUENCE: When is it done?
Why is it done then?
When might be done?
When should it be done?
PERSON: Who does it?
Why does that person do it?
Who else might do it?

Who should do it?
MEANS: How is it done?
Why is it done that way?
How else might it be done?
How should it be done?
These questions, in the above sequence, must be asked systematically every time a methodstudy is undertaken. They are the basis of successful method study.
Develop the Improved Method
Once the questions have been answered, it is the job of the method study man to put hisfindings into practice. The record on the flow process chart is made so that it can be compared withthe original method and can be checked to make sure that no point has been overlooked. This willalso enable a record to be made in the summary of the total number of activities taking place underboth methods, the savings in distance and time which may be expected to accrue from the changeand the possible savings in money which will result.
5.6 Method Study: Define, Install and Maintain
Defining the Improved Method :The Written Standard Practice
It is desirable to prepare a written standard practice, also known as an operative instructionsheet. This serves several purposes:
(a) It records the improved method for future reference, in as much detail as may be necessary.(b) It can be used to explain the new method to the management, foreman and operatives. It also
advises all concerned, including the work engineers, of any new equipment require or ofchanges needed in the layout of machines or workplaces.
(c) It is an aid to training or retraining operatives and can be used by them for reference untilthey are fully conversant with the new method.
Three sorts of information will normally be required:
(a) The tools and equipment to be used and the general operating conditions.
(b) A description of the method. The amount of detail required will depend on the nature of thejob and the probable volume of production, For a job which will occupy several operativesfor several months, the written standard practice may have to be very detailed, going intofinger movements.
(c) A diagram of the workplace layout and, possibly, sketches of special tools, jigs or fixtures.
Installing the Improved Method :
The final stages in the basic procedure are perhaps the most difficult of all. It is at this pointthat active support is required from the management and the trade unions alike. It is here that thepersonnel qualities of the work study man, his ability to explain clearly and simply what he is tryingto do and his gift for getting along with the other people and winning their trust become of thegreatest importance.

Installation can be divided into five stages: Gaining acceptance of the change by the departmental supervision. Gaining approval of the change by the management. Gaining acceptance of the change by workers involved and their representatives. Restrain the workers to operate the new methods. Maintaining close contact with the progress of the job until satisfied that it is running as
intended.Maintaining the New Method
To be maintained, a method must first be clearly defined and specified. This is especiallyimportant where it is to be used for setting time standards for incentive or other purpose. Tools,layout and elements of movement must be specified beyond any risk of misinterpretation. The extentto which it is necessary to go into minute details will be determined by the job itself.
5.7 Summary
Productivity is defined as the ratio of output produced to the input resources utilized in theproduction. It is important to have proper productivity measurement systems in place in order tohave an idea about the current productivity levels. The organization can set reasonable goals withrespect to increase in productivity and take appropriate steps to achieve them. Methods analysis is atechnique which can be applied to a new job design as well as to the improvisations of jobs estab-lished earlier by using tools such as flow process chart, employee machine activity chart and variousother diagrams and models. The chapter covers the complete process of method study.
5.8 Key Words
• Productivity: The ratio of output produced to the input resources utilized in the production.
• Work Study: A management service based on those techniques, particularly, method studyand wok measurement, which are used in the examination oh human work in all its contextsand which lead systematically to the investigation of all the factors which affect the effi-ciency and economy of the situation being reviewed, in order to effect improvement.
• Method Study: Method study is the systematic recording and critical examination of exist-ing and proposed ways of doing work, as a means of developing and applying easier andmore effective methods and reducing costs.
• Flow process chart: Analyses infestations activities to capture the flows of products throughthe overall production process.
• Process chart: A graphic representation of a sequence of events that occur in the workmethod, classifying them by symbols according to the nature of the events.
• SIMO chart: A chart used to record against a time scale performed by operator.
5.9 Self Assessment Test
1. What is method study? How are flow process charts and diagrams helpful in method study?
2. Define productivity. How can it be measured?
3. Explain the various ways by which productivity of an organization can be improved?

4. Explain the various techniques for recording in method study?
5. Explain the relation between work study and productivity?
6. “Selecting the right job is the most important step in method study.” Comment.
7. Give specific applications of various charts covered in the present chapter?
5.10 Reference Books
• Barnes, R.M., 1980 Motion and Time Study, Design and Measurement of Work, SeventhEdition, John Wiley & Sons: New York.
• Cummings, T.C. and S. Shrivastava, 1977. Management of Work: A Socio-Technical SystemsApproach, Comparative Administrative Research Institute, Kent State University: Kent.
• Chase, R.B. and N. J. Aquilano, 1977. Production and Operations Management: A Life CycleApproach, Revised Edition, Richard D. Irwin Inc: Homewood.
• Currie, R.M., 1977. Work Study, Fourth Edition, English Language Book Society, London
• International Labor Organization, 2001, Introduction to Work Study, IIIrd Edition,ILO, Geneva.
• Maynard, H.B. (ed.) 1971. Industrial Engineering Handbook, 3rd Edition, McGraw- HillBook Co: New York.
• Mundel, M.E.,1978, Motion and Time Study, 5th Edition, Prentice Hall: Englewood-Cliffs.

Unit - 6 Work MeasurementStructure
6.0 Objectives
6.1 Introduction
6.2 Procedure for Work Measurement
6.3 Work Measurement Techniques
6.4 Work Sampling
6.5 Time Study
6.6 Predetermined Time Standards
6.7 Work Study Applications
6.8 Summary
6.9 Key Words
6.10 Self Assessment Test
6.11 Reference Books
6.0 Objectives
After reading this unit you shold be able to :
Understand the concepts of work measurement and its relation with work study.
Realize that the approach is scientific method of decision making.
Understand that work measurement is one of the technique of productivity improvement.
Conduct time studies and work sampling with confidence.
Realize that the concepts are not restricted to manufacturing industries only.
6.1 Introduction
The measurement of human work has always been a problem for management, as plans forthe provision of goods or services to a reliable program and at a predetermined cost are often depen-dent on the accuracy at which the amount and time of human work involved can be forecast andorganized. Work measurement by enabling target times to be set , into which are incorporated restallowances appropriate to the type of work involved, provides a far more satisfactory basis on whichto plan. It has been defined by the British Standards Institution as-
“The application of techniques designed to establish the time for a qualified worker to carry out aspecified job at a defined level of performance.”
International Labor organization defines it as “Work measurement is the application of techniquesdesign to establish the time for a qualified worker to carry out a specific job at a defined level ofperformance.”
The fundamental purpose of work measurement is to set time standards for a job. It can alsobe used for the following purposes:
a) To evaluate a workers performance

b) To plan the work-force needs
c) To determine available capacity
d) To determine price or cost of a product
e) To compare work methods
f) To facilitate operations scheduling
g) To establish wage incentives schemes.
6.2 Procedure for Work Measurement
SELECT- The work under study should be selected.
RECORD - The data related with the methods and the elements of activity is being recorded.
EXAMINE – The step of examination is to be done with the help of recorded data to ensure that themost effective method and motions are being used and the unproductive and foreign elements areseparated from the productive elements.
MEASURE - The quantity of work involved in each element is to be measured in terms of time,using the appropriate work measurement technique.
COMPILE - The standard time for operation will include time allowances to cover relaxation,personal needs, etc.
DEFINE - the series of activities and method of operation for which the time has been compiled is tobe defined precisely. After this time is considered as standard for the activities and methodsspecified.
6.3 Work Measurement Techniques
For the purpose of work measurement, work may be regarded as repetitive or non repetitive.When the main operation or the group of operations repeats continuously during the work time, thework is considered to be repetitive for example, light press work jobs. Types of maintenance andconstruction work in which hardly the job is repeated may be considered as non repetitive work.British Standard 3138:1969; define the following techniques of work measurement-Time Study : A work measurement technique for recording the times and rates of working for theelements of a specified job carried out under specified conditions, and for analyzing the data so as todetermine the time necessary for carrying out the job at a defined level of performance.Synthesis : A work measurement technique for building up the time for a job or parts of job at adefined level of performance by totaling element times obtained previously from time studies onother jobs containing the elements concerned , or from synthetic data.Predetermined Motion Time System PMTS : A work measurement technique whereby times es-tablished for basic human motions (classified according to the nature of the motion and under theconditions in which it is made) are used to build up the time for the job at a defined level of perfor-mance.Analytical Estimating : A work measurement technique, being a development of estimating, wherebythe time required to carry out elements of a job at a defined level of performance is estimated partlyfrom knowledge and practical experience of the elementsconcerend and partly from synthetic data.
Comparative Estimating : A work measurement technique in which the time for a job is evaluatedby comparing the work in it with the work in a series of similar jobs – benchmarks- the work contentof which has been measured. The arranging of jobs into broad bands of time is referred to as slotting.Estimating : A means of assessing the time required to carry out work, based on knowledge andexperience of similar types of work, without a detailed breakdown of the work into elements andtheir corresponding times at a defined level of performance.Activity Sampling : A work measurement technique in which a large number of observations aremade at random intervals over a specified period of time of a group of machines, processes andworkers. Each observation records what is happening at that instant and the percentage of observa-tions recorded for a particular activity or delay of the measure of the percentage of time during whichthat delay occurs.
Rated Activity Sampling : An extension of activity sampling in which rating is applied so that ,where the frequency is known, work content may be established in addition to the proportion of timeoccupied by other activities or delays.
6.4 Work Sampling
The origin of this technique is LHC Tippet. He used the method of ‘snap reading’ for deter-mining the causes of loom stoppages in Textile factories in 1935 while working for the BritishCotton Industry research Institute. Since then, the technique has been successfully applied in manydifferent situations under such names as Ratio Delay Study, Random Observation Method, Observa-tion ratio Study, Activity Sampling and work sampling.
Work sampling is defined as a method of finding the percentage occurrence of a certainactivity by statistical sampling and random observations.Work Sampling Procedure :-
1. Define the problem - It is essential to state the main objective, purpose or goal of the projector problem. This would provide a frame of reference and help place a limit on the costs forthe study to secure the desired results. It is better to identify what group of people and/ormachines is to be studied, what sub groups are to be included and what accuracy is desiredfrom the study and which other agencies must benefit from the results of the work sampling.
2. Preliminary survey of work activities- A good deal of public relations effort might be calledfor at this stage. The person making the study must be familiar with the activities of thesubjects being considered.
3. Activity Classification- The procedure of breaking of activities is indicated by the problemdefinition. There is no rule to specify the levels of breakdown.
4. Design of necessary forms for recording study data- the different forms of observation sheetsare to be considered. For every study a unique observation form is designed.
5. Develop properly randomized times of observation- A single observation consists of an in-stantaneous operation in order to determine the state in which it is defined. The times ofobservation for any given sampling must be selected without bias. The selection is doneusing random numbers which are taken from random tables.
6. Select and Train Observers – The proper selection of observers is must for a good worksampling. The observers should be trained to get an understanding of study rules and specific

limitations. The observers should be trained such that he objectively records explicitly in-stant snapshot observation. All clarifications should be sort out and solved before actuallyconducting the final study.
7. Estimate Number of Observations- The tradeoff is required between the sample size to betaken and the accuracy level required of the study. The confidence level chosen is usually95% and the desired accuracy level will range from 1% to 10%.
Determination of sample size :-The work sampling technique is similar to the technique applicable in inferential statistics
where conclusion about the proportion ‘P’ in a large population is to be drawn after observing theproportion ‘p´’ in a suitably selected sample of size ‘n’ from a large population. How far the actualproportion ‘P’ may ‘p´’ is found in a sample size ‘n’ can be answered by finding a suitable indicatorfor measuring the sampling variations. These variations are given by the sampling error which is
ó = ? p (1-p)/ nErrors in Work Sampling :-
(a) Observational Error- This is due to the presence and behavior of the observer, the observedand/or the environment in which the observations are made. Further, the study is made on thefinite period of time, and the period may not be representative.
(b) Experimental Error- Due to finite number of random observations on a specified activity, anexperimental error is introduced which is a measure of the sampling variations in terms ofthe standard error of proportion.
Applications of work sampling are :-1. Ratio delay to determine the activity time percentage for personnel or equipment.2. Performance measurement to develop a performance index for workers. This is useful for
periodic performance evaluation.3. Time standards to obtain the standard time for a task.4. For manpower planning5. For safety performance.6. For assisting in engineering economy studies.
6.5 Time Study
Time study is the original technique of work measurement and it is concerned with the directobservation of work while it is being performed. An important feature of time study is the way inwhich the accuracy of the results obtained improves as the number of occasions upon which theoperation is observed increases. ILO defines time study as -
“Time study is defined as a work measurement technique for recording the times and ratesfor working for the element of a specified job carried out under specified conditions, and for analyz-ing the data so as to obtain the time necessary for carrying out the job at the defined level of perfor-mance.”The following are the essentials for the time study of any job-
1. An accurate specification of where the job begins and where it ends, and of the method bywhich it is to be carried out, including details of material, equipment, conditions, etc.

2. A system of recording the actual times taken by workers to do the job while under observa-tion.
3. A clear concept of what is meant by standard rate of working.4. A means of assessing the amount of rest which should be associated with the job.
Standard rate of working- Standard performance results when the work in a job is done atideal degree of effectiveness and the appropriate relaxation allowance is taken in full. While neitherthe worker nor the amount of work which will make him no more than reasonably tired are definablein a strictly scientific sense, it has been found that , in the long run , standard performance can bemaintained throughout the year without over exertion and consequent detriment to health. A scalehas therefore been fixed giving this ideal of effectiveness a value of 100. The 100 is designated as thestandard rate of working./ observers are trained to be able to recognize the conditions of standardrate of working, and to assess to the nearest five points the degree to which a worker’s observedspeed and effectiveness vary from the ‘100’ concept. The procedure in which this assessment isnoted simultaneously with the observed time is known as rating.
Breaking Task into Elements
It is found in practice that a worker’s rates of working may vary not only from cycle to cycleof a job, but frequently also within each cycle itself. As this would make it difficult to make anoverall rating for the period of the study, or even a separate rating for each cycle, it is customarybefore starting a time study to break down into what are called elements all jobs but those having avery short cycle time. Breaking the job down into elements it is essential that they should each beclearly distinguishable. Observation of the following principles will be of assistance-
1. Separate elements which are identical from those which are variable in the work they com-prise.
2. Separate heavy work from light work.
3. When convenient use audible points in the work.
The elements are classified into eight broad groups; a repetitive element; an occasional ele-ment; a constant element; a variable element; a manual element; a machine element; a governingelement; a foreign element.
Factors Effecting Ratings –
Variations in actual times for a particular element may be due to factors outside or within thecontrol of the worker. Those outside his control may be-
(1) Variations in the quality or other characteristics of the material used, although they may bewithin the prescribed tolerance limits.
(2) Changes in the operating efficiency of tools or equipment within their useful life.
(3) Minor and unavoidable changes in methods or conditions of operation.
(4) Variations in the mental attention necessary for the performance of certain elements.
(5) Changes in climatic and other surrounding conditions.
Factors within his control may be-
• Acceptable variations in the quality of the product.
• Variations due to his ability.

• Variations due to his attitude of mind, especially towards the organization.
Basic Steps in Time Study :-
The following eight steps constitute the time study process excluding the selections of thejob for the worker which have to be done before the steps:
(a) Obtaining and recording all the available information about the job, operator and the sur-rounding conditions likely to affect the execution of the work.
(b) Recording the complete description of the method, breaking down the operation into ‘ele-ments’.
(c) Examining the detailed breakdown to ensure the most effective method and motions arebeing used and determining sample size.
(d) Measuring with a time device (most commonly a stop-watch) and recording the time takenby the operator for each ‘element’ of the operation.
(e) At the same time, assessing the effective speed of working the operator relative to the observer’sconcept of the rate corresponding to standard rating.
(f) Extending observed time to “basic times”.(g) Determining the allowances to be made over and above the basic time for the operation.(h) Determining the “standard time” for the operation.
Time Study EquipmentThe equipment logistic support required to carry out time study activity basically belongs to
two groups. The first group represent those which are to be used at site, i.e., during the data collec-tion. Such a set of equipment which is essential, are:
i. A stop-watchii. A study board, andiii. Documentation.
While the second group of equipment, representing those which are used as supplementaryones, usually not carried to the site always, includes:
i. A small calculatorii. A reliable clock with seconds handiii. Set of measuring instruments such tape, steel rule, micrometer, spring balance and tachom-
eter (to measure rational speed) and such other items relevant to and useful for the particulartype of work being measured.
(a) The Stop-WatchUsually three types of stop-watches are used for performing time study:
i. The flyback timeii. The non-flyback timeiii. The split hand stop-watch type.
However the first two types are used for a large majority of cases.(b) The Study Board
A study board is used to hold the time study observation record sheets during the study. It
should be made so as to give a good surface for writing without being large enough to interfere withobservation of the worker being studied.(c) Documentation
The documentation reflects the responsibility the work study officer brings to his job. Longexperience and practice suggest that five documents are necessary- (1) Element Breakdown andWork Content, sometimes termed as Set Up Sheet; (2) Study Summary, sometimes called as StudySummary Record; (3) Time Study Observation Record which has been entitled as Observation record;(4) Time Study Analysis and (5) Standard Time.
The first, Element Breakdown and Work Content, uses both sides of the sheet; the others useonly one side. Work Sampling compared to time study-
Work sampling offers some advantages-
1. Several work sampling studies may be conducted simultaneously by one observer.
2. The observer need not be a trained analyst unless the purpose of the study is to determine atime standard.
3. No timing devices are required.
4. Work of a long cycle time may be studied with fewer observer hours.
5. The duration of the study is longer, which minimizes effect of short period variations.
6. The study may be temporarily delayed at any time with little effect.
7. Because work sampling needs only instantaneous observations, the operator has less chanceto influence the findings by changing his or her work method.
6.6 Predetermined Time Standards
One more approach to work measurement was created with the publication of the idea ofbasic human motions termed as ‘therbligs’ given by Gilbreth. In 1927 A B Segur put forward the ideathat within practical limits the time required by all experts to perform true fundamental motionswould be a constant. If these constants could be determined the measurements would at least beconsistent. So, predetermined time standard is a work measurement technique whereby times estab-lished for basic human motions (classified according to the nature of the motion and the conditionsunder which it is made) are used to build up the time for a job at a definite level of performance. PTSsystems are techniques for synthesizing operation times from the standard time data for basic el-ementary motions comprising the operation. The five elementary operations reach, grasp, moveposition and release in different forms of feasible combinations represent a large number of opera-tions. In a PTS system one time is indicated for the basic elementary motions irrespective of whereit is performed. Further the PTS systems which avoid both rating and direct observations invariablylead to more consistent standard times arrived at relative to their counterpart. PTS systems are usu-ally simple, easy to apply and are very fast particularly for operation shaving very short repetitivetimes. Due to the various advantages this system has been accepted by different industries all overthe world.
The existence of a very large number and a variety of systems often results in confusionwhich is further increased by the fact that many of such systems are of a proprietary nature. Anotherpoint of criticism is that PTS systems fail to recognize the effect of the influence of the immediate

predecessor and follow a basic elementary motion, on the time indicated as standard time for theintervening basic elementary motion. Direction of motion like downwards, upwards, clockwise,anti- clockwise, away from body and near to body also influence the duration of basic motions butare not considered in PTS. The last point of criticism is that even with most of advanced PTS systemit would not be possible to obtain 100% coverage of all operations carried out in any organization.
PTS systems can be applied either through direct observation of the motions used by theworker or through mental visualization of the motions required to accomplish a new or alternativework method. This method is particularly suited to situations where direct observations may not bepossible or it may be some entirely new method of working which, however, is composed of work ofbasic elements which are standard with a new combination or mix. It is suited to both repetitive aswell as non repetitive work.
6.7 Work Study Applications
The fields of application of the work study that are most highly developed at the present timeare-
(a) Incentive Schemes : Because standard times enable jobs of differing type and duration to beexpressed in terms of the same denomination, they provide an exceptionally useful basis forthe operation of a system of payment by results. The availability of the work specification foruse as the contract between management and worker in this connecion is particularly conve-nient, since it establishes precisely the conditions under which a job is to be performed aswell as the method to be employed. In the event of a change in either or both of these it canbe a routine matter to determine the extent and efeect on the work content or standard timesand make the necessary adjustments. From the worker’s point of view the ability to calculatebonus earnings is important. Incentives scheme of these type have the added advantage thatthere is every encouragement for workers to pay attention to delays and record waiting time,thus making it apparent to management when and where action may be necessary to preventtheir recurrence.
(b) Labor Control : Measurement of work is essential in order to deploy, and record the effec-tiveness of labor. By proper analysis of deviation from standards, the true causes and extentsof losses are disclosed and supervision can see what action, if any, should be taken to im-prove labor utilization and performance. Further more, the greater confidence thereby isgenerated by the removal of frustration for the men and the doubt regarding performance. Itresults in improving labor relations.
(c) Materials Handling : Material handling concerns the movement of both material and peoplethroughout complex concern- raw materials, components between the various activities, fin-ished products, materials for maintenance and scrap. Activities can be broadly classified into two headings- process operations and handling operations. Work study is, in effect, thetool which has been developed to analyze and measure these operations and thereby deviseways and means of increasing productivity. In this form of analysis, process operations, re-ferred to in work study as “do” operations, are the first to be considered because if these arechanged in nature and sequence, combined or eliminated at any point, the associated han-dling and movement operations are at once affected.

(d) Planning : The techniques which have developed in to modern work study were evolved tomeet the need for a more accurate knowledge of two fundamental planning requirements- themethods to be adopted to achieve specified objectives, and the time required to carry outsuch methods
(e) Plant and Product Design : The following targets are aimed at in the application of workstudy to design a new plant or project or modify and extend the existing one- (i) shortenproject time; (ii) reduce capital and operating cost; (iii) ensure efficient maintenance;(iv)reduce alterations;(v) improve quality of design;(vi) reconomize technical man power. Thework study techniques used to help achieve these aims are all based on work measurementand method study, but adapted to the particular needs of designer.
6.8 SummaryThe prime objective of any organization is to reduce cost and increase profit. These twin
objectives can only be achieved if the work system is such designed that it increases productivity.The chapter covers work measurement part of work study in detail. The three basic techniques ofwork measurement viz. work sampling, time study and predetermined time standard are explainedand their processes are discussed with applications. Work study applications show that the techniquecan be effectively applied to a large variety of situations; it is just not limited to the manufacturingsystem.
6.9 Key Words
• Allowed Time : The leveled time as well as the allowances for fatigue and delays.
• Standard Time : Calculated by taking the normal time and adding allowances for personalneeds, unavoidable work delays and worker fatigue.
• Work Measurement : The application of techniques designed to establish the time for aqualified worker to carry out a specified job at a defined level of performance.
• Time Study : It is a work measurement technique for recording the times and rates forworking for the element of a specified job carried out under specified conditions, and foranalyzing the data so as to obtain the time necessary for carrying out the job at the definedlevel of performance.
• Work Sampling : a method of finding the percentage occurrence of a certain activity bystatistical sampling and random observations.
• Predetermined Time Standards: a work measurement technique in which, times estab-lished for basic human motions are used to build up the time for a job at a definite level ofperformance.
• Work Cycle: the complete sequence of the elements necessary to perform a specified activ-ity to yield a unit of production.
6.10 Self Assessment Test
1. Compare work sampling and time study?
2. Write the various applications of work measurement in management?
3. Comment-:

(a) “It’s best that our workers don’t know that they are being time studied. That way, theycan’t complain about us getting in the way when we set time standards.”
(b) “Rhythm is fine for dancing, but it has no place on the shop floor.”
4. Write the merits and demerits of PTS?
5. Explain the procedure for work sampling?
6. How will you determine sample size in work sampling?
7. Write a note on equipments used in time study?
6.11 Reference BooksBarnes, R.M., 1980 Motion and Time Study, Design and Measurement of Work, Seventh Edition,John Wiley & Sons: New York.
Cummings, T.C. and S. Shrivastava, 1977. Management of Work: A Socio-Technical SystemsApproach, Comparative Administrative Research Institute, Kent State University: Kent.
Chase, R.B. and N. J. Aquilano, 1977. Production and Operations Management: A Life CycleApproach, Revised Edition, Richard D. Irwin Inc: Homewood.
Currie, R.M., 1977. Work Study, Fourth Edition, English Language Book Society, London
International Labor Organization, 2001, Introduction to Work Study, IIIrd Edition,ILO, Geneva.
Maynard, H.B. (ed.) 1971. Industrial Engineering Handbook, 3rd Edition, McGraw- Hill Book Co:New York.
Mundel, M.E.,1978, Motion and Time Study, 5th Edition, Prentice Hall: Englewood-Cliffs.
Unit - 07 Inventory Management: Models And SystemsStructure:
7.0 Objectives7.1 Introduction7.2 Motives for Holding Inventory7.3 Objectives of Inventory Management7.4 Principles of Inventory Management7.5 Inventory Related Problems and Solutions7.6 Setting Inventory Levels7.7 Economic Order Quantity (EOQ)7.8 Economic Batch Quantity (EBQ)7.9 Safety Stock7.10 Inventory Systems7.11 Inventory Control Systems7.12 Summary7.13 Key Words7.14 Student Activity7.15 Self-Assessment Test
7.16 Reference Books
7.0 Objectives
After completion of this unit, you should be able to : Achieve a trade -off between the conflicting consideration of holding higher inventory and
lower inventory.
Optimize the firm’s investment in inventory striking a balance between cost of holdinginventory and stock-out costs.
Ensure adequate maintenance of supplies of raw material, stores and spares and finishedgoods so as to maintain production levels and meet the varying requirements of the customer.
Understand the effective control over the inventory, their purchase, use, store, etc. with clearaccountability.
Learn about various types of inventory models.
Minimize/prevent loss due to deterioration, obsolescence, pilferage, theft,etc.
7.1 Introduction
The term ‘inventory’ refers to the stock pile of the product which a firm is offering for saleand the components that are essential for the product.
There are three types of inventories (1) Raw materials, (2) Work in Process (Semi-finishedgoods) and (3) Finished goods.

Raw materials are inputs, which are purchased by the firm from the others and are converted in tothe final product through production (manufacturing) department.The Work –in-process is also called stock-in-process, refers to partially or semi-finished goods at
the various stage of production in the multi stage production process.
Finished goods represent final or completed product, which are available for sale. The inventory ofsuch goods consists of items that have been produced but are yet to be sold.
While manufacturing firms generally hold all three types of inventories, distribution firmshold mostly finished goods. Inventories generally represent the second largest asset category formanufacturing companies, next only to plant and equipment. Given substantial investment ininventories, the importance of inventory management cannot be overemphasized.
Inventory as a current asset, differs from other current assets because it is not finance manageralone who are involved here. Rather, all the functional areas in finance, marketing, production, andpurchasing are involved. Yet, as investment management has important financial implications, thefinancial manager has the responsibility to ensure that inventories are properly monitored andcontrolled. He has to emphasize the financial point of view and initiate programmes with theparticipation and involvement of others for effective management of inventories
Inventory Management involves an interface between all the departments along the productivedistributive channel of the firm. It involves reconciling the interest of the different departmentsinvolved in the production distribution function. For example the Purchase department in order tobenefit from the economies of scale indulges in bulk buying which may cause overstocking of rawmaterial. whereas the production department would always want sufficient inventory of Work –In –progress for unhindered production output maximization.Similarly, the marketing department withits objective of maximization of sales and would focus on maximization investment in the finishedgoods, investment as it enables the firm to exploit to opportunity any sudden increase in demand.The role of finance department is significant, it not only reconciles the varied goal of the purchase,production, and marketing department in inventory investment, it also looks at inventory managementfrom the broader perspective of share holder’s wealth maximization.
The objective of inventory management is primarily to achieve a trade off between theconflicting consideration of holding higher inventory and lower inventory. The issue of optimalinvestment in inventory is decided in the light of incremental gains from inventory investments andthe incremental costs of holding inventory management.
7.2 Motives for Holding Inventory
Specifically there are three motives for holding inventory:
Transaction Motive: A firm is required to maintain inventory on regular basis in order tofacilitatethe smooth and uninterrupted production and sales operations. Due to the time lag present betweenthe placement of order and its receipt, an optimum amount of inventory is always required to bemaintained by the organization.
Precautionary Motive: Apart from holding stock for regular transactions, an organization is requiredto hold the inventory to meet the sudden changes in demand and supply forces like delay in supply ofmaterial due to strike, transport, short supply etc. Similarly, demand for finished goods of seasonalnature may increase suddenly. Therefore, company is required to maintain a sufficient supply in the

form of inventory.
Speculative Motive: The Company may like to purchase and stock the inventory in the quantitywhich is more than needed for production and sales purpose. This may be with the intention to getadvantage in term of quantity discounts connected with bulk purchasing or anticipating price rise.
7.3 Objectives of Inventory Management
The main objective of inventory management is to achieve maximum efficient in productionand sales with the minimum investment in inventory. The other objectives are as follows- To ensure the availability of supply of raw material, stores and spares, Work-in process, and
finished goods to maintain production levels and meet various requirements of the customers. To minimize loss due to deterioration, obsolescence, pilferage, theft etc. To maintain investment in inventory at optimum level striking a balance between cost of
holding inventory and stock out costs. To ensure effective and full utilization of storage capacity and other facilities related to
inventory holding. To have effective control over in inventory purchase, uses, storage etc. To provide basis for short term and long term plan. To improve the customer service needs adequately.
7.4 Principles of Inventory Management:
The underlying principles that govern inventory management are-
Principle of efficient business operations- Firm should always maintain that level of inventories,which is adequate for ensuring uninterrupted business operations. Inventory holding takes place atthe different stage of operations, therefore higher the investment in the inventory, shows the strongerpossibility of the firm to absorb supply and demand shock due to uncertain market conditions. Howeverthe increased inventory slow down inventory turnover, moreover increasing the risk ofobsolesecence,change in technology should also take into account.Principle of cost minimization-The inventory levels must be adequate and not excessive as thefunds blocked in the inventory ties with the cost. These funds can be put to other alternative uses.Firms tries to minimize the cost of holding inventory (carrying cost) without affecting smoothoperating. Various innovative techniques purchaser-vendor –based inventory management,improvements in the supply chain, outsourcing etc. are used to minimize inventory holding. Althoughreduced investment in inventory saves funds but there is always a risk of delay in production andsupply, due to inadequate level of inventory, which may result in loss of sales for the firm. Therefore,as the firm increases its level of inventory, the risk of running out of inventory is lessened but cost ofholding inventory (carrying cost) increases. Thus, deciding the optimum level of inventory investmentassumes significant. That is why Reorder point and inventory control are two points given attentionin inventory management.
Activity :-1. What are the motives to hold inventory?2. What are the main components in inventory?3. What are the objectives of effective management of inventory?

7.5 Inventory Related Problems and Solutions
Following table focuses on some key problem areas and their probable solutions related toinventory management. Right from the stage of procurement of raw material and its usage in productionto stocking of finished goods in ware house the store keeper encounters numerous situations. Ordersize of the material poses a major problem area as it may lead to the overstocking and under stockingof inventory resulting in resulting in unnecessary blockage of funds in inventory or loss of salesrespectively.
7.6 Setting Inventory Levels
Setting inventory levels or proper inventory management requires achievement of balancesbetween inventory carrying cost and ability to adequately meet demand. Extreme levels of inventory–too high or too low are not desirable. High levels of inventory enhance the firm’s capacity to meetdemand, but also result in high carrying cost. Too little inventories, resulting in lower carrying cost,increase the opportunity cost of being out of stock and increase customer dissatisfaction. The decisionto keep the level of inventory of raw material at particular level is taken after considering a numberof factors. They can briefly be stated as under-
Nature of the product/raw material, If perishable ,or subject to deterioration in quality orobsolescence; less will be stored.
Availability –if seasonal, bulk purchase may be made.
Rate of consumption in production.
Cost-higher the cash move will be controlled and lesser quantity will be stored.
Lead time-time taken for purchase order to materialize.
Storage Cost, Insurance Cost, Economic Order Quantity, Govt. Restrictions if any, fluctuationsin price.
Availability of credit from suppliers.
Work-in –Progress is based on the production cycle. More inventories in stock may be stuck up inwork –in –progress due to production bottlenecks .Investment in WIP can be reduced by removing,bottlenecks and adopting a production process of shorter duration.
Finished Goods storage determined by-Nature of demand-seasonal and production plan, credit policyof the firm, competition and demand for the product. For effective control, different levels ofinventories are determined.
7.6.1 Reorder Level :
This level is between minimum and maximum levels, such that before the material ordered is
S.No. Inventory Related Problems Solution 1. Overstocking and under stocking Max. and Min. Level, Re-order
Quantity 2. Order quantity problem EOQ, EOQ (Qty. Discount 3. Stock out Problem Safety Stocks 4. Classification problem to determine
the type of control required ABC, VED etc.

received into stores, there is sufficient quantity in hand to cover with normal and abnormal consumptionsituation. It is the level at which order for replenishment of stock should be placed.
Under the assumption that the replenishment is made instantaneously ( Lead Time =0), therelationship between the quantity of inventory used along a time with the time period takes the formas shown in Fig.1
Figure:1
7.6.2 Maximum Level :
It indicates maximum level of inventory quantity held in stock at any time. This is the limitbeyond which the stock of an item should not exceed. Fixation of maximum level is governed byfollowing considerations:
1. Its reorder levels. The reorder itself depends on the maximum rate of consumption andmaximum delivery period.
2. Minimum consumption and minimum delivery period for each inventory item.
3. The economic order quantity
4. The availability of funds, storage, space, government regulations, nature of items and theirprice per unit are also important.
5. For imported material since of their irregular supply. The maximum level should be high.
The main purpose in fixing maximum level is to control investments in inventories.
Maximum level of inventory = Reorder level + Reorder quantiy - (Minimum Consumptionx Minimum reorder period)
7.6.3 Minimum Level:
It indicates the lowest level of inventory which must be maintained in hand at all times, sothat there is no stoppage of production due to non-availability of inventory. This is the limit belowwhich the stock should not be allowed to fall.
Main consideration for fixation of minimum level of inventory-
1. Information about maximum consumption and maximum delivery period in respect of eachitem to determine its reorder level.
2. Average rate of consumption for each inventory item.
Re-order Level = Maximum reorder period x Maximum usage Or = Minimum level + (Average Rate of consumption x Average time to Obtain fresh supplies.
Inve
ntor
y (u
nits
)
Time
Q
Q 2

3. Average delivery period for each item.
Average delivery period= ½ (Maximum Period+ Minimum Period)
Minimum level of inventory = Reorder level - (Average rate of consumption x Average time of inventory delivery)
Sufficient margin will be built into the minimum level to take care of increase in consumptionor delay in delivery. Longer the lead time (delivery period) and higher the fluctuation in the deliveryschedule of the supplies, higher will be the minimum level. The level will be kept as low as possiblein case of it being subject to obsolescence and high value items.
7.6.4 Average Level:
This level indicates the average stock which is required to be maintained in the store house.This is generally, taken as the average of the maximum and the minimum stock level.
Now, Average inventory level = Minimum level+1/2 Re-order quantity
Or
2level minimum level Maximum
7.6.5 Danger Level
Generally the stock level is not allowed to fall below the minimum level, but in specialcircumstances it may fall below this level. Danger level is the level at which normal issues of rawmaterial inventory are stopped and emergency issues are only made. The storekeeper should takeimmediate action to replenish the stock in case the inventory reaches to danger level.
Danger Level = Average consumption x lead time for emergency purchases
Example 1 : Two components X and Y are used as follows-
Normal Usage-200 units/week
Maximum Usage-250 units/week
Minimum Usage-150 units/week
Re order quantity- X=600 Y=1000
Re order Period- X= 4 to 6 weeks
Y= 2 to 4 weeks
Calculate -1. Reorder level
2. Minimum level
3. Maximum level
4. Average stock level
Solution: 1. Reorder level = Maximum usage/week X Maximum Delivery period
Re order level for X = 250X 6 =1500 units
Re order level for Y= 250X 4 =1000 units
2. Minimum level = Reorder level-(Normal Usage X Average Period)
units 7502
6 4 X 150– 1500Xfor level Minimum

units 5502
4 2 X 150– 1000Yfor level Minimum
3. Maximum level= Reorder level + Reorder quantity –( Minimum consumption x
Minimum reorder period)
Maximum level for X = (1500+600) – (150X 4)
2100 - 600 = 1500 units
Maximum level for Y = (1000+1000) – (150X 2)
2000 - 300 = 1700 units
4. Average Stock level = 1/2 (Minimum stock level + Maximum stock level)
X = 1/2 (750 + 1500)
= 1125 units
Y = 1/2 (550+1700)
= 1125 units
7.7 Economic Order Quantity (EOQ)
The quantity of inventory to be ordered and the timing of order are the underlying issues thatneed to be resolved to arrive at the optimal level of inventory. Therefore, it involves a tradeoffbetween profitability and liquidity. The two questions that the inventory theory related are-
(a) How much should be ordered? (b) When should be ordered?
First question, how much, arises due to the presence of ordering costs and other issues whichdepend on the frequency of order. The smaller the order size, more orders will be placed andconsequently the more the ordering costs.
The second question confronts with the when to order, arises due to supply side uncertainties.
7.7.1 What is EOQ?
Economic order Quantity (EOQ) is the order size for some particular inventory item thatresults in lowest total inventory cost for the period. It refers to the lot size of inventory that is mosteconomical to procure and hold.
Total inventory cost consists of inventory ordering cost and inventory carrying cost. An EOQmay be computed for each inventory item. EOQ assumes that the relevant costs of inventory can bedivided into order cost and carrying costs.(The model excludes the actual cost of the inventory) Eachof them has certain key components and characteristics.

Inventory Carrying cost – The carrying cost is the cost of maintenance of inventory in the company’swarehouse. It is also known as holding cost and has two parts-
(a) The cost related with physically carrying and handling inventories. Such as –Warehouse rent
Cost of insurance of inventory
Cost of handling, inspection and supervision of inventory
Cost of spoilage, obsolescence and deterioration
Cost of theft, shrinkage and damages
(b) Financial cost of funds tied up in the inventory which is the cost of alternative investment.
Relationship between the carrying Cost and EOQ :
Total carrying cost increases as inventory increase. It has a positive correlation with the levelof inventory.
Inventory Ordering cost:
Cost which is incurred at the time of placing an order is called Ordering cost. These costs are also
known as ordering cost or setup cost. These costs are as follows-
Cost of writing and placing an order
Cost of processing of order
Cost of follow up with the vendor
Cost of receiving new shipment
Cost of acquiring recent price quotations
7.7.2 Assumptions of EOQ
The model rests on the following assumptions:
a. There is a known constant demand
Larger the order size Higher is the carrying cost due to high average inventory.
Smaller the order size Lower is the carrying cost due to low average inventory.
Eg : The annual requirement is 20000 units. If order size is 10000 units; carrying cost = ? If order size is 5000 units; carrying cost = ? If the carrying cost per unit per annum is Rs. 5, Price per unit is Rs. 50, Calculate the carrying cost in both cases. Carrying Cost = Average order size x Carrying cost per unit per annum.
Larger the order size Lower is the ordering cost due to less no. of orders.
Smaller the order size Higher the ordering cost because of more orders
Eg : The annual requirement is 20000 units. If order size is 10000 units; n = ? If order size is 5000 units; n = ? If the cost per order is Rs. 50 calculate the ordering cost in both cases. Ordering Cost = No. of orders × cost per order

b. Ordering costs are known and remain constant.
c. Carrying costs are known and remain constant
d. Production and inventory capacity is unlimited.
7.7.3 Methods to Compute EOQ
Trial & Error
This method requires computing the total inventory cost at various order size. Eventually theEOQ can be found or closely approximated by repeating the computation. The limitation of thismethod is time consuming.
Formula Method :
Optimum order size can be calculated mathematically using the Economic Order Quantity (EOQ)formula method. Each method yields the optimum order quantity with a single set of calculations.The models is-
COA 2EOQ
Where, A = Annual demand in Units
O = Ordering cost per order
C = Carrying cost per unit per period
Graphical Method : Both costs are depicted on graph. The EOQ is a point at which both orderingcosts and carrying costs are equal. At this point the Total cost of inventory shall be lowest. Hence,
A Annual usage (in units) B Order size (Rs.) C No. of orders (A/B) D Cost per order E Total ordering cost (C × D) F Average inventory (B/2) G CC per unit per annum H Total carrying cost (F × G) I Total of ordering cost & CC (E + H) J Total purchase price (A × purchase price per unit) K Total cost (I + J)
EOQ Order Size
Ordering cost
Total cost
Carrying Cost
Cost/Revenue

this is the most economical quantity that combining the carrying and ordering costs shows that totalinventory cost decrease up to a point with the increase in inventory. Beyond the EOQ point, totalinventory cost increase with increasing inventory. This method also lacks precision.
7.7.4 Modified EOQ (for varying unit prices-discount on bulk purchases)
Many Suppliers encourage their buyers to place large orders by offering them quantitydiscounts. With quantity discounts the firm saves on its purchase price per unit but has to order morethan its EOQ size. This will reduce the number of orders but will increase the average inventoryholding. Thus the firm saves an amount equal to the discount available and reduction in orderingcost, but incurs additional carrying costs. The net incremental benefits are equal to the differencebetween the additional savings and additional costs. If the net difference is positive, the order sizeshould be equal to the quantity necessary to avail the discount and if negative its order size should beequal to EOQ.
Steps for incremental cost benefit Analysis:
Calculate Q* (EOQ) without considering the discount and compare it with the minimumorder size Q’ for utilizing discounta.
a. if Q* > Q’, then EOQ remains valid.
b. If Q*< Q’, then incremental analysis is to be done whether to avail discount or not.
Incremental analysisa.
a. incremental benefits:
- Discount available = AD
- Savings in ordering cost due to decrease in no.of order = [(A/Q*) - (A/Q’)]x O
- Total incremental benefits = AD + [(A/Q*) - (A/Q’)]x O
b. Incremental carrying costs:
- Carrying cost at Q* = Q*PC/ 2
- Carrying cost at Q’ = Q’(P-D)C/ 2
- Incremental carrying cost = CC at Q’ – CC at Q*
c. Net incremental benefits = incremental benefits – incremental costs
d. Decision: If net benefits are positive, EOQ= Q’ and one should avail the bulk discount.
Inflation and EOQ :
Buying in anticipation of price increase :
Cost : added carrying cost of inventory
Benefits : buying inventores at low price
Increased carrying cost :
Interest rates move up due to incrrease in inflation, as a result carrying cost of inventoryincreases. Therefore under the conditions of inflation here is a decline in EOQ
Example -2 A unit manufacturing plastic container consumes 50 units of molded plastic daily. Thefirm operates the total of 240 business days a year.The current cost of acquisition is 60 Rs. percontainer and carrying cost for the firm 20% of unit cost. The firm has to bear Rs.500 per order when

it places an order. The selling price is Rs. 95 per unit. Compute the optimal inventory level for theyear ahead using EOQ model.
Solution:
Annual Demand A = 50 x 240 = 12,000 units
Cost of Order O = Rs. 500 per order
Carrying Cost C= 20% × Rs. 60 = Rs. 12 Per order
Hence, EOQ(Q) = units10002.60
50012002
Thus, the firm will be able to minimize its total cost if it places oder for 1000 units (EOQ).
Number of Order = order12runits/orde1,000
units000,12EOQ
A
Order Cost = 000,6.Rs000,1
50012EOQ
ON
Carrying cost is function of average amount of inventory on hand multiplied by the carrying costrate.
Average Inventory = 5002
EOQ
Carrying cost = 000,6.Rs2.0602
1000C2
EOQ
At the EOQ, the cost of ordering for the period (RS. 6,000) equals the carrying cost for the period(Rs. 6,000).
The result given by the EOQ model can be cross checked using Trial and Error \Iterative Process fordetermining optimum inventory level.
Schedule of Inventory costs at various order sizes
It is evident from the table in example that total cost is higher at any order quantity .otherthan 1000 units. Thus the result from the iterative process matches with that achieved using the EOQmodel. The above statement also shows that total inventory cost is least at order size of 1,000. Anyorder size other than EOQ level yields a higher total Inventory cost..
A Annual usage (in units) 12000 12000 12000 12000 12000 12000 12000 B Order size (Rs.) 400 600 800 1000 1200 1400 1600 C No. of orders (A/B) 30 20 15 12 10 8.6 7.5 D Cost per order 500 500 500 500 500 500 500 E Total ordering cost (C ×D) 15000 10000 7500 6000 5000 4300 3750 F Average inventory (B/2) 200 300 400 500 600 700 800 G CC per unit per annum 12 12 12 12 12 12 12 H Total carrying cost (F × G) 2400 3600 4800 6000 7200 8400 9600 I Total of ordering cost &
CC (E + H) 17400 13600 12300 12000 12200 12700 13350
J Total purchase price (A × purchase price per unit)
1140000 1140000 1140000 1140000 1140000 1140000 1140000
K Total cost (I + J) 1157400 1153600 1152300 1152000 1152200 1156500 1153350

7.8 Economic Batch Quantity (EBQ)
Economic Batch Quantity:
The two costs involved are:
a. Set up cost: it is fixed in nature and is incurred at the beginning of each production run
b. Inventory carrying cost
Cost Behavior:
Larger the size of production run-
Lower will be the set up cost
Higher will be the inventory carrying cost.
Optimum production size:
It is that level at which total cost is minimum or we can say that at this level, the two cost willbe equal.
EPQ = (2UP/S)1/2
Where,
U= annual (monthly) output
P= Set up cost per production run
S= Carrying cost per unit per annum (month)
Activity
Given the answers in true of false
1 Inventory management is the subject matter of finance department only
2 Inventory carrying cost is directly proportional to the level inventory.
3 If the carrying cost of inventory is more than stock out cost, the companyshould produce and keep an inventory.
4 In danger level of inventory only emergency issue of raw material made.
5 At the point of EOQ. invnetory carrying cost and inventory ordering costare equal.
7.9 Safety Stock
The reorder point has been determined under the situation of certainty. However, it may notbe so in reality. In practice, uncertainty is likely to exist with respect to delivery times, productioncost rates, sales rates. Due to strikes, delayed supply of raw materials or usage increases unexpectedly,a stock out is likely to occur. To reduce the likelihood of stock out, firms hold, safety stock, additionalinventory over and above prescribed by the EOQ.
Safety stock is an additional level of inventory intended to enhance the firm to continue tomeet demand in case sales level turn out to be higher then predictive and in case there are unexpecteddelays in either receiving raw material or in producing goods.

If we incorporate uncertainty in the reorder point formula become as follows-
Reorder point = Lead time × Average usage + safety stock
Determining the optimal level of funds to be blocked in safety stock assumes importance,since the holding of safety stock is imminent. It is important to note that having safety stock does noteliminate the possibility of stock out. The safety stock is intended to give a known probability of astock out.
Inventory Stock out Cost:
This type of cost is the cost of being out of stock. Such cost occurs when the firms has theshortage of finished goods inventory. It is also known as back order cost. Following costs are includedin these costs, such as-
Cost of lost sales
Cost of inefficient production
Penalty cost for late completion of the contract
Cost of substituting more expensive raw material
Loss of goodwill due to poor customer service.
This cost varies inversely with the inventory level .Firms control these cost by procuringsafety stock and maintain it. The relationship of carrying cost and stock out cost is helpful to determinethe inventory level, whether the firm has over production or under production. If the carrying cost ofinventory is less than stock out cost ,the company should over produce and keep an inventory.
Activity
Fill in the blanks
1 _________ is the point, at which the firm should place an order to replenish theinvoentory.
2 If annual demand is 12,000 units, order cost is Rs. 90 per order and inventory carrycost is Rs. 15 per annum. The EOQ will be ________.
3 In the situation of uncertainty, a firm keeps ____ to meet unexpected demand.
4 The formula of maximum level of inventory is ____________
5 Inventory ordering cost increases with the _______ in the per order invenoty level.
7.10 Inventory Systems
There are two inventory systems, namely
- Periodic inventory system
- Perpetual inventory system
Periodic Inventory System:
Under this system the quantity and value of inventory is ascertained on the basis of actualphysical count or measure or weight of all the inventory items in hand at the end of specific period.This system does not facilitate continuous stock taking. The cost of material issued is calculated as:
Cost of Material issued = Opening Inventory + Purchases – Closing Inventory

Perpetual Inventory System:
Under this system the value of inventory is ascertained after every receipt and issue. This systemfacilitates regular checking and obviates closing down for stock taking. The objective of perpetualinventory system is to provide a continuous quantitative – cum- value record of receipts, issues andbalances of each item of stores followed by continuous stock taking.
Activity
1. What is periodic and perpetual system of holding inventory?
2. Differentiate between periodic and perpetual system of inventory.
7.11 Inventory Control Systems
Application of inventory control system is imperative for effective inventory management.There are several inventory systems adopted by the organization based on their need. The two majorfactors determining the choice of inventory control system are size of the business and its nature.The common inventory control systems in vogue are discussed below:
Double Bin System:
Bin refers to a rack, an almirah or space wherein inventory is kept. A separate bin is maintainedfor each item of inventory and is assigned an identification number. Bin system is generally maintainedby small organizations.
Under double Bin System each bin is divided into two parts namely the smaller part and thelarger part.
Smaller part is used to store the inventory equal to the minimum level or sometimes equal tothe re ordering level and the larger part is used to store the remaining quantity.
Once the inventory in the larger part is used an order is made and meanwhile inventory in thesmaller part is used.
On receipt of fresh supply of inventory, the inventory used from the smaller part is replacedfrom the fresh receipts.
Double Bin System
ABC Inventory Control System:
In case of large firms inventories maintained are not uniform in terms of value and number.Therefore, it is not desirable to keep the same level of control on all the items of inventory. For thepurpose of effective control mechanism, firm needs to classify inventory based upon the investment
Smaller Part
Minimum Stock Level or
Reorder Level
Larger Part
Remaining Inventory

required and efforts to be made in controlling them. ABC Analysis measures the proportion of eachitem of inventory in the total inventory in terms of its value. ABC Analysis is also known as Controlby Importance and Exception (CIE) and Proportional Value Analysis (PVA) This technique is based on the assumption that the firm should not exercise the same degree
of control on all the items of inventory. More rigorous control is required on the items that are (i) the most costly and (ii) the slowest
turning. On the basis of cost involved , inventory items are categorized into
- A: involves large investment, are less in number hence requires rigorous control. To avoidoverstocking and shortage, the stock of material is controlled by fixing maximum, minimumand reorders levels.- B: involves small investment, are large in number hence requires minimum control.- C: stands midway, deserves less attention than A but more than C
Practical Steps involved in ABC Analysis:Step 1: Classify the items of inventory on the basis of their expected use. Determine their units andprice per unit.Step 2: Calculate the total value of each item (units x price per unit)Step 3: Rank and arrange the items in descending order of their value.Step 4: Compute the proportion of each item of inventory in the total inventory in terms of numberand value.Step 5: Categorize the items on the basis of their relative value into A, B and C.
Following table indicates that ‘item A’ forms the minimum proportion (10%) of the totalunits of inventory, but represents the highest in term of value ie 70%. On the other hand ‘Item C’represents more than half the total number of inventory and is merely 10% in terms of investmentrequired. No strict control is therefore required in case of ‘Item C’
Group Number of items (%) Inventory Value (%)A 10-20 70-50B 20-30 20-30C 70 – 50 10-20
5 10 26 40 72 90 10030
40
50
60
70
80
90
100
Item A
Item B Item C

Just In Time (JIT) Inventory Control System:
Just In time (JIT) system of inventory management gained popularity from Japan. It is one ofthe important components of Total Quality Management (TQM). In a JIT system, inventory is notmaintained. Material, manufacturing parts and other components are ordered as and when the needarise and arrives at the site just before few hours they are put into use. Successful implementation ofJIT ensures savings in warehousing cost, the cost of deterioration and the cost of funds blocked ininventory. Implementing JIT is not a very easy task. It requires perfect synchronization between thedelivery of material and manufacturing cycle. The relationship between the supplier and themanufacturer also has a crucial role to play in terms of timing of delivery and quality of the material.Delay in delivery of material or substandard quality supply may result in stoppage of production.This system creates lot of pressure on the manufacturer as well as the supplier and demand for astrong supply chain management.
VED Inventory Control System:
VED analysis is based on the criticality of an item. “V” is for vital items without which anOrganization cannot function, “E” for essential items without which an organization can functionbut may affect the quality of the services and “D” stands for desirable items, unavailability of whichwill not interfere with functioning.
The vital items are stocked in abundance; essential items are stocked in medium amounts,and desirable items we stocked in small amounts. By stocking the items in order of priority, vital andessential items are always in stock which means a minimum disruption in the services offered to thepeople.
VED Analysis is generally used in Service industry like Hospitals.
Computer based Inventory Control Systems:
With the increasing business size and the nature of work , more and more companies havenow started using computerized systems to control their inventory. A computerized system of inventoryis an automatic system of taking an account for the flow of inventory. The computer system isprogramed to identify the various levels of inventory like the maximum level, minimum level andthe reorder level. As soon as the inventory reaches any of the above threshold limits the computerprogram notifies the same and the store keeper/ operator may take necessary action to replenish thesame. In case of large departmental stores / retail stores computerized systems for inventory aremust. In some advanced cases, computer system of buyer and suppliers are linked. As soon as thesupplier’s computer receives order from the buyer’s computer, the supply process is activated.
Outsourcing Inventory:
Outsourcing inventory means procuring parts and components from outside rather thanmanufacturing them internally. Outsourcing decision involves cost benefit analysis to be undertaken.
Stock Turnover Ratio:
It is control technique Gives the relationship between cost of material consumed and average stock held. Formula: Cost of Material Consumed during the year Cost of average stock held during the year

Where, Cost of material consumed = Opening stock+ Purchases – Closing stock Average Stock = ½ (opening stock + closing stock) Inventory holding period = 365/ Inventory turnover It indicates the speed with which the inventory is consumed. A too high and a too low ratio is a matter of concern. A satisfactory level of inventory should be maintained.( Intra firm comparison and inter firm
comparison)
7.12 Summary
Inventory forms a major component in the total current assets of the company,especially in the manufacturing companies. There are three motives of holding inventorynamely, transaction, speculation and precautionary motives. The main objective of inventorymanagement is to achieve maximum efficiency in production and sales with the minimuminvestment in inventory. Three types of costs are involved in management of inventory:(i) Ordering cost,(ii) Carrying cost, and(iii) Stock out cost. The firm should try to minimize its total cost of holding inventory byordering at EOQ. EOQ occurs at the point where the total cost is minimum (ordering+carryingcost) is minimum. Setting inventory levels enable the store keeper to know the maximumand minimum level of stock required to be maintained at all times. The stock level at whichthe firm places an order to replenish the inventory is known as reorder level or reorder point.Under perfect certainty reorder point is equal to Lead time x Usage rate. Under uncertainconditions, a firm has to maintain a safety stock which serves as a cushion to meetcontingencies. Reorder point under such conditions is calculated as safety stock + lead timex usage rate. There are two systems of keeping the record of inventory; period system and theperpetual system. A firm which carries a number of items of inventory that differs in valuemay follow a selective approach such as ABC analysis in managing its inventory. There aremany other techniques like JIT, VED and computerized system of managing inventories.
7.13 Key Words:
ABC Analysis Carrying Cost Economic Production Quantity
Economic Order Quantity
Lead Time
Nature of stock Meaning Stock turnover ratio Fast Moving Stock Stock in great demand Very High Slow Moving Stock Stock in low demand Low
Dormant Stock Stock having no demand at present Too low Obsolete Stock Stock no longer in demand Too low

Maximum Level
Ordering Costs
Re order point
Safety Stock
Set up Cost
7.14 Student Activity:
Select any two manufacturing organizations from any sector and compare their inventorymanagement process.
7.15 Self-Assessment Test
1. Describe the objectives of inventory management and discuss its relevance in in differenttypes of organizations.
2. Enumerate and discuss different types of cost associated with inventory management.3. “There are two extreme dangerous situations that management should avoid in controlling
inventories.” Explain.4. Explain and illustrate the EOQ model with the help of graph. Also examine the relationship
between risk and cost with respect to inventories.Practical Problems:5. The average annual consumption of a material is 18,250 units at a price of Rs. 36.50 per unit.
the storage cost is 20% on an average inventory. Ordering cost is Rs. 50. How much quantityis to be purchased at a time?Ans. 500 Units
6. A company buys its requirement of 36000 units in 6 installments. Each unit costs Re. 1 andthe ordering cost is Rs. 25. The inventory carrying cost is estimated at 20% of unit value.Find the total cost of existing inventory policy. How much money can be saved throughEOQ?Ans. (a) Rs.750 (b) Savings due to EOQ Rs. 150
7. PQR ltd. Produces a product which has a monthly demand of 52000 units. The productrequires a component X which is purchased at Rs. 15 per unit. For every unit of finishedoutput 2 units of component X are required. Order cost is Rs. 350 per order.carrying cost is12% paCalculate:(i) EOQ for component X(ii) If the minimum lot size to be supplied is 52000 units, the company has to incurr?(iii) What is the minimum carrying cost the company has to incur?Ans. (1) 22030 units, (ii) Rs. 55200 (iii) Rs.15545
8. X Ltd. is committed to supply 24000 bearings per annum to Y Ltd. On steady basis. It isestimated that it costs 10 paise as inventory holding cost per bearing per month and set upcost per run of bearing manufacture is Rs., 324.- What would be the optimum run size for bearing manufacture?

- Assuming that the company has a policy of manufacturing 6000 bearings per run, howmuch extra cost would the company be incurring as compared to the optimum run suggestedin (a) above?- What is the minimum inventory holding cost?Ans. 3600 bearings, Rs. 576 , Rs. 2160
9. Monthly demand of product X – 1500 units- Input required to produce 1 unit of X: 5 units- Ordering, receiving and handling cost: Rs. 10 per order- Trucking cost: Rs. 5 per order- Deterioration and obsolescence cost: Rs. 10 per unit per annum- Interest rate: 15% pa- Storage cost: Rs. 450000 for 90000 units- Purchase price of component: Rs.100- Calculate EOQ.Ans. 300 units
7.16 References
1. Sinha Pradeep Kumar, Financial Management- Tools and Techniques, Excel Book, NewDelhi, 2009.
2. Shrivastav Rajeev, Misra Anil, Financial Management, Oxford University Press, Delhi, 2009.3. Jeevanandam C. , Financial Management, Sultan Chand & Sons, New Delhi, 2005.4. Chandra Prasanna, Financial Management Theory and Practice, Tata Mc Graw – Hill, New
Delhi, 2009.5. Pandey IM, Financial Management, Vikas Publishing House Pvt Ltd., Ne Delhi, 2010.

Unit – 8 Materials Requirement PlanningStructure8.0 Objectives8.1 Introduction8.2 Materials Requirement Planning8.3 History of Materials Requirement Planning8.4 Scope of MRP8.5 Is MRP a Planning System?8.6 MRP System Information Processing8.7 Steps in MRP8.8 Where to use MRP ?8.9 MRP System Inputs and Outputs8.10 Disadvantages and Advantages of MRP8.11 Problems with MRP System8.12 Critique of MRP8.13 Summary8.14 Key Words8.15 Self Assessment Test
8.0 Objectives
After studying this unit you should be able to understand : The Concept of Material Requirement Planning The History and Scope of MRP MRP planning systems MRP Systems Inputs and outputs Disadvantages and Advantages Problems of MRP
8.1 Introduction
Material management is the detailed study of complete material flow process of firm. TheAmerican Production and Inventory Control Society defines materials management as “the groupingof management functions supporting the complete cycle of material flow from the purchase andinternal control of production materials to the planning and control of work-in-process to thewarehousing, shipping and distribution of finished products.” Materials management helps operationsmanagers assess the requirements of materials at various stages of production process and maintaincontrol over the firm’s production and distribution functions.
The scope of materials management is broad, as it considers the entire flow of materials inand out of an organization. Its scope can be viewed in two contexts – trouble avoidance andopportunistic. Managers in any organization are worried if the materials function does not perform

well. The proper management of materials enables smooth operation of the firm’s functions. Moreoverthe proper management and control of materials leads to reduction in production costs and inventorylevels, coupled with an increase in the efficiency of production. Therefore, materials managementcan be viewed as an opportunistic tool to improve a firm’s profits.
The responsibilities of materials managers include activities like determining the materialsrequirements at various stages of the production process, procuring materials in the most effectiveand economic manner, and receiving and storing them safely.
8.2 Materials Requirement Planning
Materials Requirement Planning (MRP) is both an inventory control and a schedulingtechnique. It consists of a series of steps which start by determining what finished products areneeded to meet the demand by time periods and are completed with a schedule of the finishedproduct components needed at each assembly level for each timePeriod.
Material requirements planning (MRP) is a production planning and inventory control systemused to manage manufacturing processes. Most MRP systems are software-based, while it is possibleto conduct MRP by hand as well.
Material Requirements Planning (MRP) uses the MPS as a starting point and computes deriveddemands for all components required for the production of the end products. The planning data usedare the bill-of-materials structure (BOM structure, Gozinto structure), the current inventory status(including planned receipts) and planned lead times. Within this planning step lot sizes are computedunder the assumption that infinite capacity is available. Result of these computations is plannedproduction quantities.
Conventional Inventory Systems are based on –
1. ABC Classification
2. Reorder Models
3. Safety Stock
4. EOQ
An MRP system is intended to simultaneously meet three objectives:
Ensure materials and products are available for production and delivery to customers.
Maintain the lowest possible level of inventory.
Plan manufacturing activities, delivery schedules and purchasing activities.
In project situation and Batch production the demand is not uniform but discrete. As thedemand is clearly known and so also the time frame, it is also known as ‘Time-phased requirementsplanning.” MRP is based on concepts like,
1. Independent versus Dependent demand
2. Lumpy demand
3. Lead times
4. Common use items
The use of computer has helped MRP to gain the popularity because the numerous calculationsfor the product explosion are readily handled with the direct access capability of the disc systems.

The on-line capabilities of computers is another reason for the increased interest, in MRP.
MRP systems are appropriate for dependent demand items. Dependent demand means thedemand for an item is directly related to or the result of demand for “higher level” items. Thus, whilethe demand for the final product may be continuous and independent, the demand for lower-level,subordinate items composing the product tend to be discrete, derived and dependent. Dependentdemand items need not be forecasted, but are calculated by the MRP system from the Master Schedule.
The key features of an MRP system are the time phasing requirements, generation of lower-level requirements, planned order releases and rescheduling capability. Planned Order releases indicatewhen orders should be placed by purchasing and manufacturing
Activity.
Based on the demand for the end product, MRP system disassembles the end product intocomponent parts and subassemblies. MRP is a backward scheduling process that estimates requirementof materials starting with the date of requirement and working backward to estimate date of receiptkeeping in view production and waiting time, and estimating date of order based on delivery leadtime.
An MRP system helps in coordinating orders from external and internal sources. Externalorders are referred to as purchase orders and internal orders are referred to as jobs. The systemstudies the future production requirements and disassembles the end product into required amountof raw materials parts, subassemblies and assemblies required in each time bucket (time period) ofthe planning horizon. It then determines the existing level of inventories for each item and the requiredorder quantities. Finally a schedule is generated that specifies the time when the items are required.This schedule takes into consideration the time when each item is needed in production, the leadtimes available for procuring the items etc... This ensures the availability of parts and materialsexactly when they are required in the production process. Ideally, an MRP system aims at replenishingthe material stocks when they are required. But in real world situations, this may not be feasible. Asa result, the MRP system regularly examines the production schedule to identify schedule disruptionsand adjusts the material flow to reduce the levels of in-process inventories. Decisions regarding theinstallation of the MRP system and the features required in the system depend on the type of productionand the time considerations in delivering the products to meet the market demand.
8.3 History of Materials Requirement Planning
Prior to MRP and before computers dominated the industry, reorder-point/reorder-quantity(ROP/ROQ) type methods like EOQ had been used in manufacturing and inventory management. Inthe 1960s, Joseph Orlicky studied the TOYOTA Manufacturing Program and developed MaterialRequirements Planning (MRP), and Oliver Wight and George Plossl then developed MRP intomanufacturing resource planning (MRP II).[1]. Orlicky’s book is entitled The New Way of Life inProduction and Inventory Management (1975). By 1975, MRP was implemented in 150 companies.This number had grown to about 8,000 by 1981. In the 1980s, Joe Orlicky’s MRP evolved intoOliver Wight’s manufacturing resource planning (MRP II) which brings master scheduling, rough-cut capacity planning, capacity requirements planning and other concepts to classical MRP. By 1989,MRP II software sold to about one third of the software industry was American industry ($1.2 billionworth of software).

8.4 Scope of MRP in manufacturing
The basic function of MRP system includes inventory control, bill of material processing andelementary scheduling. MRP helps organizations to maintain low inventory levels. It is used to planmanufacturing, purchasing and delivering activities. “Manufacturing organizations, whatever theirproducts, face the same daily practical problem - that customers want products to be available in ashorter time than it takes to make them. This means that some level of planning is required.”
Companies need to control the types and quantities of materials they purchase, plan whichproducts are to be produced and in what quantities and ensure that they are able to meet current andfuture customer demand, all at the lowest possible cost. Making a bad decision in any of these areaswill make the company lose money. A few examples are given below:
If a company purchases insufficient quantities of an item used in manufacturing, or the wrongitem, they may be unable to meet contracts to supply products by the agreed date.
If a company purchases excessive quantities of an item, money is being wasted - the excessquantity ties up cash while it remains as stock and may never even be used at all. However,some purchased items will have a minimum quantity that must be met, therefore, purchasingexcess is necessary.
Beginning production of an order at the wrong time can cause customer deadlines to bemissed.
MRP is a tool to deal with these problems. It provides answers for several questions:
What items are required?
How many are required?
When are they required?
MRP can be applied both to items that are purchased from outside suppliers and to sub-assemblies, produced internally, that are components of more complex items.
The data that must be considered include:
The end item (or items) being created. This is sometimes called Independent Demand orLevel “0 on BOM (Bill of materials).
How much is required at a time.
When the quantities are required to meet demand.
Shelf life of stored materials.
Inventory status records. Records of net materials available for use already in stock (onhand) and materials on order from suppliers.
Bills of materials. Details of the materials, components and sub-assemblies required to makeeach product.
Planning Data. This includes all the restraints and directions to produce the end items. Thisincludes such items as: Routings, Labor and Machine Standards, Quality and Testing Standards,Pull/Work Cell and Push commands, Lot sizing techniques (i.e. Fixed Lot Size, Lot-For-Lot,and Economic Order Quantity), Scrap Percentages, and other inputs.

8.5 Is MRP a Planning System?
The MRP (Material Requirements Planning) concept exists since the 60s of the last century.It is the basis for most software systems supporting production planning and control in industrialpractice. Most of these so-called MRP systems provide good assistance for order processing, datahandling and inventory book-keeping, but they do not support planning.
A typical MRP system follows a successive planning concept, as depicted in the following figure.
Master Production Scheduling :- Based on existing customer orders and a medium-term aggregateproduction plan Master Production Scheduling (MPS) prepares a short-term production plan for endor rather main products. The planning result is the Master Production Schedule, which is commonlyreferred to as the MPS.Capacity Requirements Planning :- Next, for each operation required to make the products theplanned starting time and ending time are computed with the help of standard project planningalgorithms, such as the Critical Path Method (CPM). Again, capacities of the resources are neglected(infinite loading). Following this planning step, the capacity requirements resulting from infiniteloading are tabulated and graphed. Usually the comparison with the available capacities shows thatthe production plan developed so far is infeasible.
This is the point in time when adjustment of the production plan by the human planner comesinto play. Usually based on experience, the planner tries to shift operations on the time axis in orderto generate a feasible production schedule. If this is not possible due to conflicts between the resourcerequirements of different operations, the capacity is extended by overtime, if possible. In general, ahuman does not have the capability to solve this complicated combinatorial optimization problem,which is a variant of the so-called Resource-Constrained Project Planning Problem (RCPSP).Production Control :- For the upcoming short-term planning horizon production schedules arereleased and assigned to the resources. For each resource orders are scheduled with the help ofsimple priority rules.
8.6 MRP System Information Processing
After the collection of requisite data from the bills of material, the inventory records file andthe master production schedule, the data is entered into a computer program where it is processed,and the production and inventory requirements are generated. MRP system uses information fromproduct structure file and lead-time information to develop purchase and production schedule for the

component, so that the materials are available exactly when they are required in the productionprocess. The Steps are:
Step 1- Explosion
Step 2- Netting
Step 3- Offsetting
(1) Explosion : The first step in the MRP information processing is that of explosion, in whichend product is disassembled into components required for its production. It starts with thetime when the product is required and then proceeds backward to determine each productionor purchasing activity that is necessary to make each higher level item in the product structurechart. Explosions use the information from MPS and BOM to generate the sequence followedto produce the end product.
(2) Netting : The next step in MRP information processing is to develop a materials requirementsplan for each item in the BOM file for each time bucket. The system first identifies the grossproduct requirement from the master production schedule. It then calculates the net productrequirements by subtracting the available units of the item and the quantity on order fromgross product requirement.
Net Requirement = Gross Requirement – On hand space inventory – Quantity on order. Incase both on hand inventory and quantity on order are zero, then the net requirement is equalto the gross requirement.
(3) Offsetting : The system then uses the information obtained from explosion and nettingprocess to determine planned order releases, ie, the quantities to be ordered so that the materialsarrive just when they are needed. The planned order releases for the finished product orcomponent becomes the gross product requirement for items at the next lower level in theproduct structure chart.
8.7 Steps in MRP
STEP 1: Determine the Gross Requirement.STEP 2: Determine the Nett Requirements.
Net Requirements = Gross requirements – Available Inventory.STEP 3: Develop the Master Schedule.STEP 4: Explode the Bill of Materials.STEP 5: Screen for ABC items.STEP 6: Determine net requirements for an item.STEP 7: Adjust requirements by Scrap or Shrinkage factor.STEP 8: Schedule planned orders.STEP 9: Explode the next level.STEP 10: Aggregate Demands and Determine Order Quantity.STEP 11: Write and place the planned orders.
8.8 Where to Use MRP ?
MRP is the most useful scheduling technique for many industries engaged in fabricating andassembling products like automobiles, tractor-trailer equipments, Rail coaches, etc. It is especiallysuitable for situations where one or all of the following conditions exist:

(a) The final product is complex and made up of several levels of assemblies.
(b) The final product is expensive.
(c) The lead times for components and raw materials are relatively long.
(d) The manufacturing cycle is long for the finished product.
(e) Consolidation of requirements for several products is desirable so that economic lot Sizesare applicable.
The MRP seeks to achieve the following objectives in a simultaneous manner:-
(i) Ensure the availability of materials, components and products for planned production and forcustomer delivery.
(ii) Maintain the lowest possible levels of Inventory.
(iii) Plan manufacturing activities, delivery schedules and purchasing activities.
MRP systems are appropriate for dependent demand items. Dependent demand means thedemand for an item is directly related to or the result of demand for “higher level “items. Thus, whilethe demand for the final product may be continuous and independent, the demand for lower-level,subordinate items composing the product tend to be discrete, derived and dependent. Dependentdemand items need not be forecasted, but are calculated by the MRP system from the Master Schedule.
The key features of an MRP system are the time phasing requirements, generation of lower-level requirements, planned order releases and rescheduling capability. Planned Order releases indicatewhen orders should be placed by purchasing and manufacturing
8.9 MRP System Inputs & Outputs
Inputs :-
Inputs of an MRP system include master production schedule, bills of material and inventoryrecords file.
Master Production Schedule – The Master production schedule file contains informationabout when and how many units of finished products are required. It also contains informationabout the available cumulative lead-time for purchasing, receiving, fabricating and assembling.This information is derived from an aggregate production plan and is based on demandforecasts. Based on this information form MPS, MRP system generates a replenishment planfor items needed in the production of the final product. The time horizon in the MPS isdivided into time buckets. Managers can use shorter time buckets such as a day or two to planshort term requirements and longer time buckets such as a fortnight or a month to plan long-term requirements. However the most frequently set period for practical purpose is about aweek. MRP system based planning is based on the assumption that production capacity issufficient to produce everything on or before the pre-designated dates given in the MPS. Tomake the schedule feasible, operations managers run the MRP program repeatedly, each timemaking some changes in the master production schedule, lead times, or material requirement,until the schedule attains feasibility.
Bills of Material: The Bills of Material (BOM) contain the list of materials along with thequantity required to produce one unit of a product. The BOM file shows the hierarchicallevels or phases a product goes through during production. It consists of the complete list of

all end products, the structure of the products and the quantity of each item required forproducing each higher-level item in the product hierarchy. It also contains information aboutwhether a particular item was produced internally or purchased from external sources. ThePurchase or production lead time to acquire the item is also mentioned. The file is alsoreferred to as the product structure file or indented parts list.
Inventory Record Files: In a typical production organization that uses MRP, many items(often ranging in thousands) are purchased, withdrawn from stock, moved to other departmentsof distribution outlets, processed and assembled. Sometimes system for all inventorytransactions. these items do not reach their intended locations in time or items received aredefective or rejected. All these issues complicate the task of inventory management andnecessitate an effective filing system for all inventory transactions. The inventory recordsfile is a computerized file with a complete record of each material held in the inventory. Itcontains information about inventory levels- levels at the beginning of the planning horizonand the details of the expected arrivals of inventory during that period. It also containsinformation about vendors like their names and addresses and the time required for supplyingmaterials, parts, etc... Organizations hold some components and parts as end products thatare supplied to customers as replacement parts or spare parts. These parts are not included inthe MPS, as they have no role in the production process. They are recorded directly into theinventory records file, and become a part of the MRP system. Though accuracy is importantfor all the elements of the MRP system it is most crucial for the inventory records file. Forinstance, if an organization by mistake, does not record the removal of an item from stock, itmay alter schedule considering the out-of-stock components. This would lead toinconsistencies in the future schedule.
Outputs :-
There are two outputs and a variety of messages/reports:
Output 1 is the “Recommended Production Schedule” which lays out a detailed schedule ofthe required minimum start and completion dates, with quantities, for each step of the Routingand Bill of Material required to satisfy the demand from the Master Production Schedule(MPS).
Output 2 is the “Recommended Purchasing Schedule”. This lays out both the dates that thepurchased items should be received into the facility and the dates that the Purchase orders, orBlanket Order Release should occur to match the production schedules.
Messages and Reports:
Purchase orders. An order to a supplier to provide materials.
Reschedule notices. These recommend cancelling, increasing, delaying or speeding up existingorders.
Primary Reports : Primary reports are the main reports that are used in inventory and productioncontrol.
Planned Orders: It is a simple report that defines the quantity of inventory required in aspecific time bucket. It includes information about all inventory requirements during theplanning period. Examples : Inventory forecasts, purchase commitment report and longrange materials requirement planning information.

Order Releases: These documents empower the purchase department to procure a specificquantity of inventory items required within a specific period.
Changes in due date : These reports are generated to revise purchase orders if the orders arenot completed on time. These reports include revision in delivery periods and order quantities.They also contain information based on which orders can be advanced, delayed, suspended,or canceled if needed.
Cancellation or Suspension : These reports are generated when the order is to be canceled orsuspended because of changes in the MPS.
Secondary Reports : These are optional reports that assist operations managers in assessingthe performance of the inventory management system.
Exceptions Reports : Exception reports contain information about errors, late or overdueorders, or any other deviations from the normal planned objectives. Exception reports areautomatically generated whenever actual delivery of parts, sub-assemblies, etc. differs fromthe planned schedule.
Note that the outputs are recommended. Due to a variety of changing conditions in companies,since the last MRP / ERP system Re-Generation, the recommended outputs need to be reviewed bytrained people to group orders for benefits in set-up or freight savings. These actions are beyond thelinear calculations of the MRP computer software.
8.10 Advantages and Disadvantages of MRP system
MRP is a comprehensive system used for planning and scheduling and materials requirement.It assists in improving the materials handling capability of the organization. But it has certaindisadvantages. Some of the advantages and disadvantages of MRP have been discussed below :
Advantages – Some of the key benefits that can be derived from using an MRP system are :
Reduced per unit cost of production thus enabling an organization to price its productscompetitively.
Low inventory levels, especially for in-process materials
Better response to market demand
Better customer service
Reduced set-up and tear-down costs
Comprehensive material tracking and optimized production scheduling
Improvement in capacity allocation and planning
Disadvantages : Following are the disadvantages of an MRP system
High costs and technical complexities in implementation. In addition, organizations whichuse an MRP system need to spend considerable effort on installing necessary equipment(computers), training personnel, modifying the software to serve their specific needs,validating, testing, and eliminating possible errors, and maintaining the software.
The time required for planning and implementing an MRP system is generally very long.
Data entry and file maintenance requires considerable inputs in the form of training andeducation of the personnel.

Dependence on forecast values and estimated lead-time can sometimes be misleading.
The implementation of an MRP system can be effective only when there is a high degree ofaccuracy in the organization’s operations. It requires high commitment from the top management ofan organization. The management should educate its executives on the importance of MRP as astrategic planning tool. The success of an MRP system, like that of any other system depends onproper implementation and right application. MRP needs enormous human efforts and care incontinuously collecting the required information for the system. However, many organizations preferto adopt MRP systems, as the advantages of the system outweigh its disadvantages
8.11 Problems with MRP systems
Integrity of the data : If there are any errors in the inventory data, the bill of materials (commonlyreferred to as ‘BOM’) data, or the master production schedule, then the outputted data willalso be incorrect. Most vendors of this type of system recommend at least 99% data integrityfor the system to give useful results.
Requirement that the user specify how long it will take to make a product from its componentparts (assuming they are all available). Additionally, the system design also assumes that this“lead time” in manufacturing will be the same each time the item is made, without regard toquantity being made, or other items being made simultaneously in the factory.
Organizing Inventory : A manufacturer may have factories in different cities or even countries.It is no good for an MRP system to say that we do not need to order some material because wehave plenty thousands of miles away. The overall ERP system needs to be able to organizeinventory and needs by individual factory, and intercommunicate needs in order to enableeach factory to redistribute components in order to serve the overall enterprise. This meansthat other systems in the enterprise need to work properly both before implementing an MRPsystem, and into the future. For example systems like variety reduction and engineering whichmakes sure that product comes out right first time (without defects) must be in place.
ERP system needs to have a system of coding parts : Production may be in progress for somepart, whose design gets changed, with customer orders in the system for both the old design,and the new one, concurrently. The overall ERP system needs to have a system of codingparts such that the MRP will correctly calculate needs and tracking for both versions. Partsmust be booked into and out of stores more regularly than the MRP calculations take place.Note, these other systems can well be manual systems, but must interface to the MRP. Forexample, a ‘walk around’ stock intake done just prior to the MRP calculations can be apractical solution for a small inventory (especially if it is an “open store”).
Takes no account of capacity in its calculations : This means it will give results that areimpossible to implement due to manpower or machine or supplier capacity constraints.However this is largely dealt with by MRP II.
Inadequate employee training and involvement : Inadequate employee training andinvolvement is one of the major obstacles in implementing MRP systems. If the employeesare not trained properly, they will not be able to understand the system and hence cannot useit properly. In order to derive maximum benefits from an MRP system, employees should bemade aware of a the functionalities provided by the system. While instaling an MRP system,employees suggestions should be taken into consideration. Workers’ involvement helps createbetter systems and injects a sense of ownership among them.

Use of Inaccurate and Obsolete Data – An MRP system cannot yield good results if the datais either inaccurate or obsolete. In other words, the system will not yield the desired results ifthe BOM records are not updated regularly. To improve the accuracy of the system eachinventory item should be assigned with a unique item code so that it can be identified easilyand the complexities in data maintenance is reduced. Common items required in the productionof different products are identified and pooled together into a single category to avoiddiscrepancies in inventory management. The inventory database should be updated on aregular basis to ensure timely and accurate recording of all transations.
Inappropriate Product Environment: The success of an MRP system usually depends on theproduct environment. The system is useful only when an organization needs to purchasemany items, a majority of which are components and parts. The demand pattern of theseitems should be dependent in nature and irregular in timing. Moreover, the lead times forpurchase of these items should be consistent. If any of these criteria are not satisfied, thefunctioning of the system may not be economical and satisfactory.
8.12 Critique of the MRP concept
Basically, the MRP concept is nothing else than the automation of order processing proceduresthat in earlier days have been done manually. The MRP concept has been criticized by many scientistsas well as practitioners in a large number of publications. Its flaws are system-immanent and cannotbe deleted.
8.13 Summary
The American Production and Inventory Control Society defines materials management as“the grouping of management functions supporting the complete cycle of material flow from thepurchase and internal control of production materials to the planning and control of work-in-processto the warehousing, shipping and distribution of finished products.”Material requirements planning (MRP) is a production planning and inventory control system usedto manage manufacturing processes. Most MRP systems are software-based, while it is possible toconduct MRP manually as well. An MRP system is intended to simultaneously meet three objectives: Ensure materials and products are available for production and delivery to customers. Maintain the lowest possible level of inventory. Plan manufacturing activities, delivery schedules and purchasing activities.
8.14 Key Words
Action Bucket – In the MRP record for the current week, a cell calling for immediate actinto meet the MPS goal.
Back Scheduling – Subtracting lead time from the due date to find the time to start processingor to place an order with a supplier, a basic MRP calculation.
Critical Path Method – (CPM) A network based project management technique initiallyused on construction projects; about the same as PERT.
Demand Management – Recognizing and managing all demands for products and servicesin accordance with the master plans
Gantt Chart – a graphic display of the duration of a set of activities. Charts are simple barcharts that can be used to schedule in any of operation.

8.15 Self Assessment Test
1. What do you understand by Material Requirement Planning?
2. Explain the objectives of MRP.
3. Discuss the MRP system.
4. Elaborate the MRP input and Output systems.
5. Describe the Problems of MRP systems.
6. Write an Essay on MRP.

Unit – 9 Supply Chain ManagementUnit Structure
9.1 Objectives
9.2 Introduction
9.3 Supply Chain Management
9.4 Elements of SCM
9.5 Evolution of SCM
9.6 Business Process and SCM
9.7 Manufacturing Process Choices
9.8 Demand Management Concept
9.9 Financial Fundamentals
9.10 Financial Analysis
9.11 Electronic Supply Chain Management
9.12 Just in Time Management
9.13 Total Quality Management
9.14 Summary
9.15 Key Words
9.16 Self Assessment Test
9.0 Objectives
After studying this unit you should be able to understand:
The Concept of Supply Chain management.
Elements of SCM
Evolution of SCM
Business Process which connects various elements of SCM
Manufacturing Process choices
Demand Management Concept
Financial Fundamentals
Financial Analysis
Electronic Supply Chain Management
Just in Time
Total Quality Management
9.1 Introduction
In any manufacturing company, material flow can be basically classified into three phases.
Flow of raw material, from suppliers into the manufacturing facility.

Flow of material within the manufacturing facility as they are processed.
Flow of finished goods from the manufacturing facility to the end customers.
To be responsive to the global competition, organizations must be able to manage the completeflow of material from the suppliers, through manufacturing, till the end product reaches, the customers.Hence organizations must be involved in the management of management of suppliers who providedirect and indirect material inputs, must increase the manufacturing competitiveness and musteffectively manage the network of distribution systems responsible for delivery of the product to endcustomers. From this realization emerged the concept of supply Chain.
9.2 Supply Chain Management
Supply Chain: The supply chain encompasses all activities associated with the flow andtransformation of goods from the raw materials stage (extraction), through to end users, as well asthe associated information flows.Material and information flows both up and down the supply chain.The supply chain includes new product development, systems management, operations and assembly,purchasing, production scheduling, order processing, inventory management, transportation,warehousing, and customer service. Supply chains are essentially a series of linked suppliers andcustomers; every customer is in turn a supplier to the next downstream organization until a finishedproduct reaches the ultimate end user.
Supply Chain Management (SCM): SCM is the integration of all the activities in the supply chainto achieve a sustainable competitive advantage. Supply Chain can be broadly classified into threenetworks – Supplier, Firm and Distribution. The supplier network consists of all organizations thatprovide inputs, either directly or indirectly, to the focal firm (i.e., the purchaser). Focal firm’s networkis involved in the conversion of input material to the output material. The distributive network consistsof all downstream organizations from the focal firm that ensure that the right quantity of goods isdelivered to the appropriate customer location in a timely manner.
9.3 Supply Chain Management vs. Logistics
Logistics: Logistics, also called as physical distribution, focuses on the physical movement andstorage of goods and materials. Logistics is that part of the supply chain process that plans, implements,and controls the efficient, effective forward and reverse flow and storage of goods, services, andrelated information between the point of origin and the point of consumption. Typical issues inlogistics are evaluation of various transportation options, packaging options, inventory managementfor different channels, develop and manage networks of warehouses when needed, and manage thephysical flow of materials into and out of the organization. Therefore, logistics is a subset in thebroader scope of SCM.
9.4 Elements of SCM
Following are the key elements in Supply Chain Management: Customers Producers (includes Retailer, Distributor, and Manufacturer) Suppliers
Customers, Producers and Suppliers are interconnected in the supply chain interrelationshipof the elements

A number of companies can be linked in the supply chain network. A supplier to one manufacturing facility can be a customer to another manufacturing facility
and so on... hence a number of supplier / customer relationships exist in the supply chainnetwork.
A number of intermediaries (distributors, wholesalers, retailers etc.,) form part of the supplychain network.
In defining the supply chain network and the integrations between the elements, the followingdecisions must be made.
Identifying the key supply chain elements in the network to link the processes. Identifying the processes that are to be linked with the key elements. Identifying the level of integration and management control to be applied for each of the
processes.
9.5 Evolution of Supply Chain Management
Organizational structure from the fifties to the late eighties was marked by the functionalsilos where the decisions were made keeping in mind the narrow view of the business functions andthe repercussions of the decisions on the other functions were ignored. These often created conflictingobjectives within the various functions of a company. The late eighties saw the advent of BusinessProcess Reengineering and ERP concepts. The corporate houses started analyzing the importance ofaligning their business with the developments in the information technology capabilities to collaborateeffectively with its stakeholders, integrate its functions and decision making and to remain competitivein the market. There are three distinct phases in evolution of SCM:
Pre-1970 era:
Supply Chain was not considered as a competitive unit. Companies seek more profit bymaneuvering their suppliers and customers.
Scientific methods like EOQ and SPC were applied.
Companies attempted at Vertical integration – themselves.
1970 – 1980 era:
Holding inventory becomes key due to oil shock
TQM and JIT practice becomes popular in Japan
Distribution is not yet the focus area
MRP systems gain popularity in US and Europe
Post 1980 era:
Inventory profits dry up as inflation reigns in
US manufacturers embrace JIT philosophy. JIT pushes inventory upstream.
Lower setup times, lower batch quantities result in reduction in lead times and drasticimprovement in customer responsiveness.
Suppliers and customers considered as part of the organization network. ‘We against them’philosophy fades away.
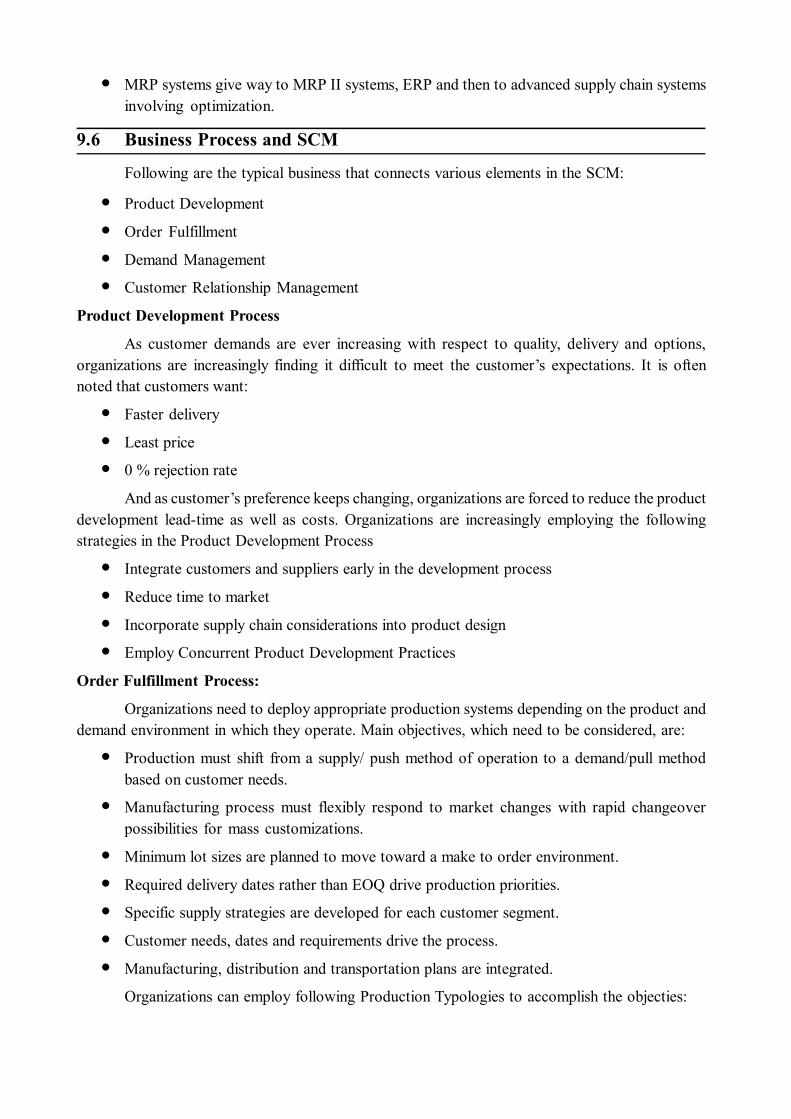
MRP systems give way to MRP II systems, ERP and then to advanced supply chain systemsinvolving optimization.
9.6 Business Process and SCM
Following are the typical business that connects various elements in the SCM:
Product Development
Order Fulfillment
Demand Management
Customer Relationship Management
Product Development Process
As customer demands are ever increasing with respect to quality, delivery and options,organizations are increasingly finding it difficult to meet the customer’s expectations. It is oftennoted that customers want:
Faster delivery
Least price
0 % rejection rate
And as customer’s preference keeps changing, organizations are forced to reduce the productdevelopment lead-time as well as costs. Organizations are increasingly employing the followingstrategies in the Product Development Process
Integrate customers and suppliers early in the development process
Reduce time to market
Incorporate supply chain considerations into product design
Employ Concurrent Product Development Practices
Order Fulfillment Process:
Organizations need to deploy appropriate production systems depending on the product anddemand environment in which they operate. Main objectives, which need to be considered, are:
Production must shift from a supply/ push method of operation to a demand/pull methodbased on customer needs.
Manufacturing process must flexibly respond to market changes with rapid changeoverpossibilities for mass customizations.
Minimum lot sizes are planned to move toward a make to order environment.
Required delivery dates rather than EOQ drive production priorities.
Specific supply strategies are developed for each customer segment.
Customer needs, dates and requirements drive the process.
Manufacturing, distribution and transportation plans are integrated.
Organizations can employ following Production Typologies to accomplish the objecties:

Product /market relations and production typology
Make and assemble to stock Flow productio (large batches)
Make to stock, assemble to order Batch Production
Make to order Job shop (small batches)
Engineer to order Project-based (unique)
9.7 Manufacturing Process Choices
Considering the demand for the items, range of products, product design, equipment, materialmovement, etc., manufacturing process choices can be categorized as follows:
Lot/Batch/Intermittent
Flow Line / Repetitive / Continuous
Project
Lot/Batch/Intermittent: In the batch/intermittent process, goods are produced in batches / lots.Work centres are generally organized into groups/departments having the similar equipment andskills. Ex., all milling machines in one group, all Lathe machines in one group etc., these workcenters can perform a variety of operations due to the different machine’s and skills present andhence are capable of producing different products. The products move along the various machines inthe work centers based on the required operations to be performed on them. These work centershence comprise of general purpose machinery with the flexibility of making a variety of products.Control of work is managed through the individual work centers for each lot.
Flow Line / Repetitive / Continuous: In a flow line / repetitive / continuous manufacturing process,workstations are organized in the sequence needed to make the product. The product moves fromone work station to the next along the defined sequence at an almost constant rate. If the products arediscrete ex., automobiles, Refrigerators etc., the process is called repetitive manufacturing process.If the products are not discrete ex., gasoline, oils etc., the process is called continuous manufacturingprocess. The repetitive or continuous manufacturing process has the following characteristics:
Setting up of a flow line is justified only if the demand of the product is large enough.
Only a limited range of products can be produced in each flow line
The work stations comprise of specialized machinery and tooling required for the product
Since the flow of products between the work stations is balanced and is nearly constant; thereis a minimal build up of work in process inventory.
Project: The Project manufacturing process choice is applicable to huge complex projects. In mostcases, the product is developed at a particular location with all the necessary resources and equipmentmoving to the product development location. Large aircrafts, ship building and construction areexamples.
9.8 Demand Management Concept
Organizations have to forecast demand accurately. This will result in:
Synchronized flow of products and materials to customer demand
Reduction of variability

Organizations should combine accurate demand forecasting with marketing plans, inventorymanagement and sales projections to gain an advantage over the competitors. Better demandmanagement process utilizes information resources to reduce costs, improve customer service andtap into hidden value throughout the supply chain. In this process customer demand is continuouslygathered, complied and renewed in order to match the organization’s supply capability with therequirements of the market.
The process has the following main objectives:
Demand requirements and Supply capabilities are continuously modeled using point of saleand “key” customer demand data.
Market requirements and production plans are coordinated on an enterprise-wide basis.
Multiple sourcing and routing options are considered at the time of receipt of the order.
Demand and production rates are synchronized and inventories need to be managed.
Customer Relationship Management Process:
Organizations should maximize customer service as a means of providing focused point ofcontact for all customer enquiries in order to insulate them from the complexity of a large,multi-divisional corporation. Main objectives of a CRM process are:
Customer service provides a single source of customer information, a point of contact foradministration of the product / service agreement.
Instant promising / availability information is available for the customer
On-line/real-time access to product and pricing information assists customers with quickorder placement.
On-line/real-time access to order status information is available to support customer orderenquiries.
Procurement Process
Organizations maintain relationships with major suppliers, which are corporately managed;in strategic alliances while purchase order transactions become simplified and integrated with supplyprocess.
Main objectives of an efficient Purchase Process are:
Strategic plans of suppliers and organization are aligned to focus on resources on holdingdown costs and developing new products.
Supplier categorization and management is implemented on a corporate global basis, withpurchasing in a strategic contracting role.
Purchase Order transactions are integrated with supply process to improve productivity andall areas of supplier performance.
9.9 Financial Fundamentals
Practitioners of Supply chain management need to understand the cost structure of eachorganization in the supply chain. Following figure depicts how the cost structure of one entity in thesupply chain impacts other entities:

An important activity in the management of a supply chain is to reduce the costs in the entiresupply chain network. Therefore, one needs to be acquainted with the fundamental aspects ofaccounting.
Accounting Cycle:
Major steps of Accounting cycle are:
Analyze Business Transactions
Record entries in Journal
Post entries to Ledger
Prepare a Trial Balance
Prepare Adjusting entries and Post to the Ledger Accounts
Prepare Adjusted Trial Balance
Prepare Financial Statements
-Profit and Loss Statement
-Balance Sheet Statement
Closing entries are madeBalance Sheet :
It is a financial statement that summarizes organization’s financial position at a specificpoint of time. It’s a numeric illustration of the balance between a firm’s assets on one hand and itsliabilities and owner’s equity on the other hand in a given point of time.Assets:The resources the business owns.
Assets are listed in the order of their liquidity – the speed which they can be converted intocash. Types of Assets are:

Current Assets – Assets that can be quickly converted into Cash. Ex: Inventory
Fixed Assets – Assets that are held or used for a period longer than a year. Ex:
Plant and Machinery :
Intangible Assets – Assets that do not exist physically but have a value based on rights orprivileges they confer on the firm. Ex: Brand Value.
Liabilities:
What a firm owes, its obligations liabilities are listed in the order that they are scheduled tobe paid. Types of liabilities are:
Current liability
-Debts to be re-paid within a year or less.
-Ex: Accounts payable, Income Tax payable, current portion of long term debt
Long term liability
-Debts that need not to be paid within a year
-Ex: Mortgages, bonds and long-term loans.
Owner’s Equity :
The owners investment after all obligations have been met.
Accounting Equation:
Assets = Liabilities + Owner’s Equity
The Income Statement :
This summarizes the firm’s revenues and expenses and shows total loss or profit during aspecified accounting period. This is also called as Profit and Loss Statement or Earnings Statement.
Revenues:
The entire amount earned by a firm from all sources (e.g., selling goods, providing services,investing on stocks etc.).
Gross sales – Total value of all goods and services sold during accounting period.
Net Sales – The adjusted value after subtracting sales returns, sales allowances and salesdiscounts.
Expenses:
Cost of Goods Sold
-Beginning inventory plus net purchases less ending inventory
Operating Expenses
-All other business Costs
-Selling Costs – Marketing related activities cost
-General Expenses – Costs for managing the business
Net Profit or Loss:
The profit earned (cash surplus) or the loss (cash deficit) suffered by the organization duringan accounting period, after all expenses have been deducted from revenues.

9.10 Financial Analysis
Financial Analysis enables SCM practitioner to analyze the cost structure of the supplynetwork. Some of the financial ratios widely used are:
Liquidity ratios
Profitability ratios
Activity ratios
Leverage ratios
Valuation ratios
Liquidity Ratios:
Liquidity Ratios are used to examine the firm’s ability to meet short-term cash outflow needs.
Current Ratio: indicator of company’s ability to pay its short term liabilities
Current Ratio = current assets/current liabilities
Quick (acid test) Ratio: Measures ability to pay off short term obligations excluding Inventory
Quick (acid test) Ratio = (current assets-inventory)/current liabilities
Inventory to net working capital: Measure of inventory balance, shows if balance can bethreatened by unfavorable changes in inventory.
Inventory to net working capital = Inventory/ (current assets-current liabilities)
Cash Ratio: Shows how much of the current obligations can be paid from cash or near-cashassets.
Cash Ratio = (cash + cash equivalents)/current liabilities
Profitability Ratios :
Profitability Ratios are ratios used to measure the profitability of the firm.
Net Profit Margin: shows how much after tax profits are generated by each rupee of Sales.
Net Profit Margin = Net profit after taxes/net sales
Gross Profit Margin: Indicates the total margin available to cover other expenses beyondcost of goods sold, and still yield a profit.
Gross Profit Margin = (sales-cost of goods sold)/net sales
Return on Investment (ROI): a measure of a company’s efficiency, it shows the return onall assets under its control.
Return on Investment (ROI) = Net profit after taxes/total assets
Return on Equity (ROE): measures rate of return on the book value of shareholder’s totalinvestment in the company.
Return on Equity (ROE) = Net profit after taxes/shareholder’s equity
Earnings per Share (EPS): Shows the after-tax earnings generated for each share of commonstock. EPS = (Net profit after taxes-preferred stock dividends) / (Average Number of commonshares)

Activity Ratios:
Activity Ratios are ratios used to measure the efficiency with which the firm conducts itsbusiness.
Inventory Turnover: measures number of times that average inventory turned over during aperiod of time.
Inventory Turnover Ratio = Cost of Goods Sold (COGS) / Average Inventory
(inventory of finished goods)
Accounts Receivable Turnover: the average length of time it takes to collect the sales madeon credit.
Accounts Receivable Turnover =Sales/Average Accounts Receivable (Sales/AccountsReceivable)
Days (Inventory/Receivable) Outstanding: measures number of days each is outstanding.
Days (Inventory/Receivable) Outstanding =365/Inventory Turnover; 365/Accounts receivableTurnover
Total Asset Turnover: a measure of the utilization of all the firm’s assets.
Total Asset Turnover = Sales/total assets during period
Leverage Ratios :
Leverage Ratios are ratios used to measure firm’s ability to meet its long-run debt serviceObligation.
Debt-to-assets ratio: measures extent to which borrowed funds have been used to financethe firm’s operations. Includes long term, short-term debt.
Debt-to-assets ratio = Total debt/total assets
Debt-to-equity ratio: Provides another measure of the funds provided by creditors Vs. fundsprovided by owners.
Debt-to-equity ratio = Total debt/total stockholder’s equity
Valuation Ratios:
Valuation Rules are used to describe the way the market values the firm and the way thatcertain characteristics are related to the value of the firm.
Price per Earnings Ratio = Current market price per share/after tax earnings per share.
9.11 Electronic Supply Chain Management
In an organization the SCM’s core focus is to integrate its suppliers, the manufacturing processand its customers. As with most other aspects of business, Information technology has become a partof SCM. The internet has provided organizations the capability to integrate the entire supply chain,from raw material sourcing to delivery of the product to the customers. ESCM or electronic supplychain management is business to business integration through the internet.ESCM – Implementation
In order to improve ESCM implementation the following activities should be undertaken: Understand and evaluate the level of integration within the organization.

Determine the number of suppliers who have direct influence over the products or servicesthat are delivered to the customers, across the entire supply chain.
Divide suppliers into different categories: First tier, second tier, and so on. Define the customer base in terms of sales, profitability, size, etc... Improve the information infrastructure within the organization to accommodate ESCM
requirements. Constitute a team with representative from various functions within the organization and
representatives from suppliers and customers to plan and carry out the implementation. Identify leaders who are capable of guiding the implementations process competently.
Issues relating to ESCM :-The purpose of ESCM is to allow effective sharing of information like forecasts and orders
among the supply chain partners.Utilization of data relating to customers and suppliers through internet technologies results
in a virtual corporation that facilitates real time information flow between various supply chainpartners. ESCM has many benefits, but together with the benefits, there are issues that must beaddressed to improve the efficiency of ESCM. These issues include: Security Issues – Security is the most sensitive issue when information is shared or exchanged
over the Internet. An organization has to ensure that the rightful recipient views the information.One way of doing this is to encrypt the data as this ensures that the data is secure and membersof supply chain can view only that information which is relevant to them.
Changes to existing Business Processes An Electronic Supply chain transforms a businessprocess significantly. The changes arise in the way companies deal with each other. Al channelpartners should be willing to exchange information such as inventory levels; productionschedules forecasts, promotion plans, etc. Sometimes partners may be apprehensive of sharingtoo much information. In order to tide over such apprehensions, a culture of openness andtrust should be developed between all the channel partners.
9.12 Just in Time Management
As a philosophy initially it is difficult to understand what is JIT. JIT is linked with the idea ofhigh velocity manufacturing. Basically if factory is a pipe and raw material is water, which you wantto flow from one end to the other, then our aim is to reduce the time gap of out flow on one end andinflow at the other. Hence we need to move materials and assemblies through the pipeline more andmore quickly. Which basically means reducing the diameter of the pipe? With a narrower pipe wecan have the same rate of shipments if we accelerate the velocity of “water” through the pipe. Afaster throughput time also allows us to be more responsive to any change in customer demands.
Ideally we would like to have the “diameter of the pipe” as low as possible, in the ultimatesituation a single piece flow made instantaneously. As we go on reducing we invariably come acrossconstraints. First that constraint must be resolved before we proceed to do any further reduction. Wemust therefore employ methods that determine the location and cause of constraints. Once we removethat constraint we can safely move ahead on our journey. This “continuous improvement” is animportant arm of JIT. Embedded in this endeavor is “elimination of waste”. So basically JIT philosophyis nothing but making as much as possible with as little resources. To achieve that, various methodslike pull systems, work cells, flexible manufacturing, etc are used in JIT.

Concepts of Waste : Waste can be defined as any activity that does not add value for the customer.It is the use of resources in excess of theoretical minimum, be it manpower, material, equipment,time, space etc. Waste can be excess inventory, setup times, inspection, and material
9.13 TQM
In today’s world customer is king. You can ignore the king at your own peril. Gone are themonopolistic days where customer would take whatever the manufacturer dishes out. Today he wantsgoods on his own terms and that too if he sees value in it. Ultimately that means doing things that addvalue to the product, from customer’s viewpoint. Which means “meeting or exceeding customer’sexpectation” (Juan’s definition), or “conformance to requirement” (Crosby’s definition). These areonly some of the words that define quality. And why “Total”? Total means bringing quality intoevery aspect and not just in product or manufacturing, be it in sales or even a lowly operator punchingchallans. Every activity has to be viewed from customer’s perspective and hence devoid of waste,and ‘filled ‘with quality. Quality does not mean “best” in any sense, but “best” for certain customerconditions. As a matter of fact JIT and TQM go hand in hand together. They are two sides of thesame coin, one uncovers problem and the other solves it. It would be foolish to implement JITwithout TQM. There is no sense to arouse a lion if you cannot make it disappear. TQM is the processthat makes the lion of constraints disappears. You can implement TQM without JIT but experts agreethat it is not as effective. Implementing JIT alone will give you paises whereas implemented ittogether with TQM will give you rupees. The sum of the parts of both these processes is greater thantheir individual parts.
9.14 Summary
In any manufacturing company, material flow can be basically classified into three phases :-Flow of raw material from suppliers into the manufacturing facility. Flow of material within themanufacturing facility as they are processed, and Flow of finished goods from the manufacturingfacility to the end customers.
SCM is the integration of all the activities in the supply chain to achieve a sustainablecompetitive advantage. Supply Chain can be broadly classified of comprising of three networks –Supplier, Firm and Distribution. The supplier network consists of all organizations that provideinputs, either directly or indirectly, to the focal firm (i.e., the purchaser). Focal firm’s network isinvolved in the conversion of input material to the output material. The distributive network consistsof all downstream organizations from the focal firm that ensure that the right quantity of goods isdelivered to the appropriate customer location in a timely manner.Following are the key elements in Supply Chain Management: Customers Producers (includes Retailer,Distributor, and Manufacturer), and Suppliers.
Customers, Producers and Suppliers are interconnected in the Supply chain interrelationshipof the elements there are three distinct phases in evolution of SCM:
9.15 Key Words
Activity: An activity is a task, which must be completed in order to finish the project. Activitiesconsume resources and time and have a definite end and starting point.
Customer: The next process (where the work goes next) also, the end user or consumer.

Design Specifications: The important, desired characteristics of a product or service specifiedin detail during the design phase.
Lot size: Quantity of an item produced, serviced, or transported at one time.
Lot sizing: Planning order quantities.
Just in time: A manufacturing system whose goal it is to optimize processes and proceduresby continuously pursuing waste reduction.
9.16 Self Assessment Test
1. What do you understand by Supply Change Management?
2. What are the Elements of SCM?
3. Explain the Evolution of SCM?
4. Discuss the Manufacturing process choices?
5. Elaborate the Demand Management Concept.
6. Describe the Financial Fundamentals?
7. Write an essay on Financial Analysis?
8. Expain the Electron Supply chain Management. State the issues in ESCM.

Unit – 10 ForecastingUnit Structure
10.1 Objectives
10.2 Introduction
10.3 Demand Management
10.4 Key Demand Drivers
10.5 Characteristics of Demand
10.6 Forecasting
10.7 Forecasting Objectives
10.8 Principles of Forecasting
10.9 Collection of Data
10.10 Forecasting Methods
10.11 Forecast Error, Measurment and Response
10.12 Distribution Requirement Planning
10.13 Distribution Requirement Planning – Inputs & Outputs
10.14 Summary
10.15 Key Words
10.16 Self Assessment Test
10.1 ObjectivesAfter studying this unit you should be able to understand:
Demand Management
Key Demand Drivers
Characteristics of Demand
Forecasting
Forecasting Objectives
Principles of Forecasting
Collection of Data
Forecasting Methods
Forecast Error, Measurment & Response
Distribution Requirement Planning
Distribution Requirement Planning – Inputs & Output
10.2 Introduction
Demand Management is a function of recognizing and managing the demands for all productsto ensure that the master scheduler is aware of them. The two main components of DemandManagement are: Forecast (Uncertainty) and Order Service (Certainty). Demand Management

encompasses the activities of forecasting, handle order receipt and entry, order promising, branchwarehouse requirements, interplant orders and service parts requirement and would cover demandfrom the following:
Customers – domestic and foreign.
Other plants in the same corporate family.
Branch warehouse in other locations.
Consigned stocks in customers’ locations.
Demand planning is vital to every business & every significant management decision.. Italso helps in long-term and short-term process selection, capacity planning and facility planning.Market place, customer expectations, and customer relationship drives planning.
10.3 Demand Management
Demand management is the function of coordinating and controlling of all the sources ofdemand in order to enhance efficiency and effectiveness of total business. Demand managementcould be short, medium or long term.Sources of Demand - Following are the sources of demand : Consumers – the end user of a product. Refer – people who recommend the products. Dealers and Distributors – channels of distribution. Inter company – demand from sister or group company. Service needs – requirement from after sales service department.
Kinds of Demand :(1) Dependent Demand : It is a demand for the product or service caused by demand for another
product or services. Dependent demand is directly related to or derived from the bill ofmaterial structure for other items or end products. Such demands are therefore calculated andneed not or should not be forecasted. This typically includes raw materials, purchased ormanufactured parts or ingredients and manufactured subassemblies, attachments andaccessories. For example, if an organization is making table tops with wooden top and 4 legs,then if firms sells100 table tops, then it requires 100 wooden tops and 400 legs. This demandof wooden tops and legs is dependent on demand of tabletop and hence termed as dependentdemand.
(2) Independent Demand : If the demand does not depend upon or is unrelated to the demandof other items then it is called independent demand. Tabletop in above example is anindependent demand. This typically includes demand for finished goods, parts required fordestructive testing and service parts. Independent demand is forecasted. Sometime an inventoryitem can be subjected to both dependent demand and independent demand. For example,parts like automobile glass may represent both demands –dependent (as it depends on themanufacturing schedule of new automobiles) and independent (as it may be used as areplacement parts).
(3) Aggregate Vs Disaggregate Demand Aggregate demand : Demand estimates for a productgroup or family is called aggregate demand Disaggregate demand : Demand estimates for an

individual product is called disaggregate demand. For an example in a Home Appliancemanufacturing company that makes air conditioner, refrigerator of different capacities, thedemand estimates for total of air conditioners and refrigerators is aggregate demand. e.g.20,000 air conditioners or 1,00,000 refrigerators. Similarly demand estimates of each productlike 10,000 nos. of 165 ltr, refrigerators, 30,000 nos. of 200 ltr, refrigerators is disaggregatedemand. Higher the level of aggregation is, the more accurate the demand estimate; thelower or more detailed or disaggregated the level, the less accurate the demand estimate.Though the increased demand forecast accuracy results from aggregation, the aggregateddata may not be as useful. The most commonly used dimensions of aggregation anddesegregations are time, geographic location and product group. The example cited above isat product group level.
10.4 Key Demand Drivers
Market place basically consists of customers, competitors and economic and regulatory policiesas.
• Customers Discussed Below : Customers are considered as a king in today’s fiercecompetition. The preferences of customer changes due to various factors beyond the controlof the organization viz change in customer’s need based in his experience with the product ,general perception of a product, word of mouth etc., All these factors play an important rolein future demand of the product.
• Competitors : Entry of new competition, competitor’s differentiation in product andtechnological innovation/revolution by competitor causes major threats on firm’s existingproduct line.
• Economy and Regulatory Policy : Economic policies declared by states and centralgovernment has major effect on demand. Increase in individual taxes and on product itselfmay discourages customer from spending. On the other hand, removal of taxes may boostsdemand for the product.
• Regulatory Policies : These are the legal guidelines set by regulatory authority. Theintroduction and amendments in statutory requirement increases or lowers the demand,sometimes it may kill the demand completely.
10.5 Characteristics of Demand
Demand pattern for products and services could be as follows :
Trend : It is an increasing or decreasing steady pattern of demand from year to year. A trendcould be a) Linear trend b) S Curve c) Asymptotic Trend d) Exponential trend
Seasonality : The demand in a particular period every year rises above or goes below theaverage yearly demand. This happens as a result of seasonal changes like festival, holiday’setc. .
Random Variations : Random variations are caused by chance events. Statistically when allthe known causes for demand (trend, seasonal, cyclical) are subtracted from the total demand,what remains is unexplained portion of demand. This unexplained portion is due torandomness.

Cyclical : The world economy as well as country’s economy influences overall demandpattern. Cyclical factors are more difficult to determine because the time span may be unknown.Cyclical influence on demand may also come from political election, war, and sociologicalpressure.
10.6 Forecasting
The forecast is an estimate of future demand. A forecast can be determined by mathematicalmeans using historical data; it can be created subjectively by using estimate from informal sources;or it can represent a combination of both techniques. It looks into occurrences, timings or magnitudesof future events. Accurate forecast can reduce uncertainty and minor forecasting improvements havea remarkable and direct impact on inventory cost and responsiveness to customer requirements.Forecast management is a process of collection of data, selection of appropriate techniques, forecasting& then taking corrective action if actual demand varies significantly.
10.7 Forecasting Objectives
Planning of long lead time resources like; Plant expansion, Capital equipment, Planning ofmedium & short term resources like labor, Procurement of materials, and To shorten customer’sdelivery time Product Development Process needs forecasting of demand.
As customer demands are ever increasing with respect to quality, delivery and options,organizations are increasingly finding it difficult to meet the customer’s expectations. It is oftennoted that customers want:
Faster delivery Least price 0 % rejection rate
And as customer’s preference keeps changing, organizations are forced to reduce the productdevelopment lead-time as well as costs. Organizations are increasingly employing the followingstrategies in the Product Development Process:
Integrate customers and suppliers early in the development process
Reduce time to market
Incorporate supply chain considerations into product design
Employ Concurrent Product Development Practices
10.8 Principles of Forecasting
Forecasts will be wrong- as forecasting is based on various considerations viz.,the source ofdata, the forecasting method, the time dimension of data, the level of aggregation of data, the unit ofmeasure used, the frequency of reassessment, and the quality and accuracy of the data itself, it isbound to go wrong.
Forecast shall include an estimate of error. This estimates of error can be mentioned either aspercentage or plus / minus tolerances.
Forecast is more accurate for shorter time periods. This is simply because nearest future ismore predictable
Forecasts are more accurate for a family or group of products. On the other hand, forecast ofindividual items is more erratic.

10.9 Collection of Data
The quality of forecast is as good as data used. Data collection shall be done in an accurateway leaving no way for errors and ambiguity. Following guidelines shall be considered. Data shall be recorded in proper units and location as needed for forecast. For example, if
forecast of sales is to be made, data shall be of actual sales made in the past and shall not beof production or shipment.
Capture the event or circumstances related to data. Certain events and circumstances influencethe demand in that particular period like festivals, holidays etc., Capturing the data withrelevance to such incidents would enable forecaster to account or discount such events inforecasting.
Demand data of different customer group shall be recorded separately.
10.10 Forecasting Methods
Forecasting methods are broadly divided as : Qualitative Techniques Quantitative TechniquesQuantitative Techniques are further divided into : Intrinsic Techniques Extrinsic Techniques
10.10.1 Qualitative TechniquesIt is a subjective, judgmental and is based on estimates and opinions. It is generally used by
senior managers. Following are few examples of qualitative techniques :- Grass Roots : Derives forecast by compiling input from those at the end of the hierarchy
who deal with what is being forecasted Market Research : This is used to forecast long range and new product sales and includes
surveys, interviews. Generally market research connotes a more rigorous, often hypothesis-testing approach.
Panel Consensus : Sales executives, middle managers, supplier, customer is invited in freemeeting and future trends are discussed and summarized.
Historical Analogy : Forecast is derived from actual sale of similar item in the past.Knowledge of past and mostly completed event may be closely related to a future event. Eg.Market development of colour TV may follow pattern Black and White TV. Historicalanalogies tend to be best for replacement products and where direct market substitutabilityrelationship exist.
Delphi Method : Group of experts respond to questionnaire. A group co-ordinator collectsthe feedback, compiles and prepares new questionnaire, which is re-submitted, to group.
10.10.2 Quantitative TechniquesThis incorporates more extensive computational evaluation of data pattern or external
relationships. There are two subsets of Quantitative methods : Extrinsic Techniques Intrinsic Techniques

Extrinsic Technique : A certain set of external factors/ indicators outside the organizationare used to forecast product demand. Examples are : rise in sales of automobiles & refrigeratorswill increase demand on steel industry. Some frequently used indicators are GDP growth,agricultural production, automobile production, steel production, hosing sector growth, censusetc. Extrinsic demand is mostly used to forecast group or family of products.
Intrinsic Techniques : These techniques use historical recorded data for future estimates.Pastperformance of product in the marketplace is studied/ analyzed with mathematical or statisticaltools to arrive at future demand. Individual products are forecasted by these methods. Followingare major techniques of intrinsic methods.
Average Demand : This is a simple average of last year’s actual demand. It has limitation of not ableto capture trend and seasonal variation.Simple Moving Average : Simple moving average is used when demand for a product is neithergrowing nor declining rapidly and if there is no seasonality in it. It is very important to select the bestperiod for the moving average. There are several conflicting effects of different period lengths. Thelonger the moving average period, the greater the random elements are smoothed out. But if there isa trend in the data either increasing or decreasing, the moving average has the adverse characteristicsof lagging trend.Weighted Moving Average : This allows any weights to be placed on each element, but ensuringthat the sum of all weights equals to 1. Weights are chosen by experience & trial & error . As a logicalrule, most recent data is given higher weight. But if data are seasonal, then weights shall be establishedaccordingly. If different weights for each period are selected, the following three rules should befollowed: Rule 1: The sum of the weights should be 1.0 (or factored to be 1.0) Rule 2: Weights should not be zero or negative Rule 3: More recent periods should receive heavier weights.
Exponential Smoothing : In both the above methods, an organization has to carry a large amount ofhistorical data. It is well established that forecast based on recent data is more indicative of futurethan more distant past. Exponential smoothing is a technique that uses this kind of recent data inestablishing future demand. In the exponential smoothing method, only 3 pieces of data are needed,the most recent forecast : The actual demand that occurred for that forecast period Smoothing constant alpha (á).
This smoothing constant alpha (á) determines the level of smoothing and the speed of reactionto difference between forecasts and actual occurrences. The value of alpha is determined by natureof product, forecasters’ intuition. The another way is to use computer simulations and by trial anderror arrive at the alpha value.Seasonal Index : Demand of the product increases or decreases in a particular period every time,such demand is termed Seasonal. This could happen as a result of festival, recurring occurrences ofcertain event, holidays and so on. This seasonal variation in demand is captured through seasonalindex. Seasonal index estimates by how much the demand in season will be below or above theaverage demand.Seasonal Index = Period Average demand / Average Demand for all periods

The average demand for all periods is a value that averages out seasonality. This is called thedesesonalized demand. Equation given above can be re-written like this; Seasonal Index = Periodaverage demand / Deseasonalised demandRegression Analysis : Quantitative models for finding the mathematical expression that best describethe relationship between two or more variables. Regression models often are used in forecasting.Box-Jenkins Models : A quantitative forecasting approach based on regression and moving averagemodels, where the model is based not on regression of independent variables but on past observationsof the item to be forecast at varying time lags and on previous error values from forecasting
10.11 Forecast Error, Measurment and Response
The accuracy of a particular forecast method is measured in terms of the forecast error. Thedifference between the actual demand and the forecast demand is called forecast error.
The error can come in two ways : Bias Random
When actual demand is consistently above or below the forecast demand, the error is calledbias. To improve upon bias, an organization needs to change forecast. Random errors in forecast arenatural variation about the average demand. Bias & random variations are similar to assignable andinherent causes in SQC. Forecast error can be measured in any of following ways,
Mean Absolute error
Standard Error
Tracking Signal
Mean Absolute Deviation (MAD) : MAD is simple method and very useful in obtaining trackingsignal. MAD is the average error in the forecast, using absolute value. MAD is calculated using thedifference between the actual demand and the forecast demand without regard to sign. It equals thesum of absolute deviations divided by the number of data points.
MAD = Sum of Absolute error / No of Observations
= 8400 / 12
= 700
MAD is the average amount by which the forecast errs. MAD does not consider the directionof the error, only the average amount of the error.
Standard Error : As shown in the example, MAD is a measurement of the differences betweenactual demand & forecast. If we plot histogram of frequency of actual demand of a particular value,it gives bell shaped curve also known as normal distribution. Normal distribution is based on; mean(average), and dispersion. This dispersion is measured by standard deviation. MAD though differentcan be interpreted the way standard deviation is interpreted in following manner,
The forecast error will be within,
+/-1 MAD of the average about 60 % of time
+/-2 MAD of the average about 90 % of time
+/-3 MAD of the average about 98 % of time
Tracking Signal : It is measurement that indicates whether the forecast average is keeping pacewith any genuine upward or downward changes in demand. A tracking signal is the number of mean

absolute deviation that the forecast value is above or below the actual occurrences. Tracking signalis useful because it measures error over a specified range of data, for example 4 weeks in a month or52 weeks in a year, Thus it can identify periodic areas where forecast has greater error. In addition tothis, tracking signal can be used to indicate that the inherent pattern of the data is changing and theforecasting method needs to be adjusted.
Tracking Signal = Algebraic sum of forecast error / MAD
Referring to our example (MAD is already calculated as 700)
Tracking Signal = 1800 /700 = 2.57
Organizationa set limits for tracking signal called trigger, say +/- 4. If tracking signal calculatedis beyond this limit, then forecasting model needs review otherwise not. Acceptance limits for trackingsignal depend on the size of the demand being forecast and the amount of time available.
10.12 Distribution Requirement Planning
DRP provides a framework for implementation of centralized push systems of distributioninventory management. Distribution resource includes more than just the planning and control systemfor replenishment. It includes many of the physical aspects of distribution – warehousing andtransportation facilities. It also implies the connection of replenishment system to financial systemsand use of simulation as a means to improve system performance.
DRP is similar to MRP applied to MPS .The process of determining the need to replenishfinished good inventory at branch warehouses. A Time-Phased Order Point (TPOP) approach is usedwhere the planned orders at the branch warehouse level are “exploded” with the help of MRP logicto become gross requirements on the supplying source. This gross requirement then becomes inputto MPS. The extension of distribution requirements planning into the planning of the key resourcescontained in a distribution system: warehouse space, workforce, money, truck, freight is known asdistribution requirement planning 2 (DRPII)
10.13 DRP Inputs and Output
DRP Inputs : Requirement of each distribution system is calculated by Forecast. Hence, forecastingmethod shall be selected with utmost care so that trends & seasonality are captured properly. As incase of MRP actual customer order also becomes input to DRP system.
DRP Outputs : Planned order release are outputs of DRP which can be automatically generatedfrom the system. This planned order release is input for Master Production Schedule. The point ofconnection between the production system and the distribution system is the master productionschedule (MPS). DRP provides a framework for managing orders, shipments and inventories evenin the face of dynamic market place. Unplanned events and changing conditions may often beaccommodated through pegging of requirements, fair share allocations, and firm planned orders,while still maintaining overall lower safety stock levels.
10.14 Summary
Demand Management is a function of recognizing and managing the demands for all productsto ensure that the master scheduler is aware of them. The two main components of DemandManagement are: Forecast (Uncertainty) and Order Service (Certainty). Demand Managementencompasses the activities of Forecasting, handle order receipt & entry, order promising, branch

warehouse requirements, interplant orders and service parts requirement and would cover demandfrom the following: Customers – domestic & foreign Other plants in the same corporate family Branch warehouse in other locations Consigned stocks in customers’ locations
Sources of Demand - Following are the sources of demand : Consumers – the end user of a product Referrers – people who recommend the products Dealers & Distributors – channel of distribution Inter company – demand from sister or group company Service needs – requirement from after sales service department
Forecasting methods are broadly divided as : (i) Qualitative Techniques, (ii) Quantitative techniques.Quantitative Techniques are further divided into : (i)Intrinsic Techniques, (ii) Extrinsic TechniquesQualitative Techniques are : Grass Roots, Market Research, Panel Consensus, Historical Analogy,Delphi MethodQuantitative Techniques : This incorporates more extensive computational evaluation of data patternor external relationships. There are two subsets of Quantitative methods : (i) Extrinsic Technique,(ii) Intrinsic Technique.
Following are major techniques of intrinsic methods :-
Average Demand
Simple Moving Average
Weighted Moving average
Exponential Smoothing
Seasonal Index
Regression Analysis
Box Jenkins Technique
Regression Analysis
Box-Jenkins Models
10.15 Key Words
Bias – A forecast eror measure that is the average of forecast error with regard to directionand shows any tendency consistently to over or undr forecast; calculated as the sum of theactual forecast error for all periods divided by the total number of periods evaluated
Cyclical – Cyclic refers to changes in the demand patterns which exist for more than oneyear.
Demand Management – Recognizing and managing all demands for products and servicesin accordance with the master plan.

Dependent Demand – Demand for an item that can be linked to the demand for anotheritem.
Independent demand- Demand for an item that occurs separately of demand for any otheritem.
10.16 Self Assessment Test
1. What do you understand by Demand Management?2. What is Forecasting Management?3. Explain the objectives of Forecasting4. Discuss the Forecasting Techniques and methods?5. Elaborate the Distribution Requirement Planning.6. Describe the Principles of Forecasting?

Unit – 11 Operations SchedulingUnit Structure
11.0 Objectives11.1 Introduction11.2 Objectives of Operations Scheduling11.3 Work Centers11.4 Scheduling Activities11.5 Techniques for Scheduling Activities11.6 Scheduling in Services11.7 Methods to Meet Customer Service Facility11.8 Summary11.9 Key Words11.10 Self Assessment Test11.11 References
11.0 Objectives
After studying this unit, you should be able to understand: Concept of operations scheduling Objectives, reasons for operations scheduling Activities involved in scheduling Methods to schedule Scheduling in Services
11.1 Introduction
At the start of every semester a days plan is given to all students specifying when the classeswill start, the time and sequence of classes, deadlines to submit internal assignments and the date forstarting of semester end exam. While booking the tickets for railway we look at the timings of thetrains. Big corporate players, heads of states register all their meetings well in advance. When BarakObama came to India his plan was prepared well in advance so that all the things go as planned andspace could be provided for contingencies.
In all these above instances a schedule was prepared so that all the things finish in specifieddeadline and everything happens on or before time. Scheduling not only covers timing rather it alsopertains to the use of resources within an organization. In both manufacturing and servicesorganizations scheduling covers use of equipment and facilities, the scheduling of human activities,and receipt of materials. It can be for short term or long term. In short term it may relate to finishinga project which can turn into expansion plans in long term. Scheduling indicates: what is to be done,when it is to be done, and with what equipment.
In operations management also scheduling plays a very important role. In today’s highlycompetitive world it is very important to make your client happy, so orders have to be manufacturedon or before time so as to beat competition. Operations scheduling makes sure that neither the

machinery waits for the raw material nor finished goods lie in the warehouse. All this has given riseto important operations concepts like Just in Time (JIT) and lean manufacturing.
Operations scheduling is a very important part of MES or Manufacturing Execution System.MES is an information system which schedules, dispatches, tracks, monitors and controlsproduction in a manufacturing or a service concern. In service concern like a courier service thisMES plays a very important role. By the use of MES a person sitting in Delhi can trace the mailwhich was sent form Bhopal to Kanyakumari and can find out whether it is in transit, or it hasreached Kanyakumari head office, branch office etc. These days courier companies give their clientsa unique number through which the client can himself find out whether the courier he had sent, hasreached the destination or not, he can also get some other information like date of dispatch, delivery,current status etc.
11.2 Objectives of Operations Scheduling
1. To maximize customer satisfaction – Customers want that their order should be preparedaccording to the specifications given by them and this should happen on time. Operationsscheduling helps to procure the raw material as soon as the order is received without anydelay. With the help of techniques like backward scheduling managers schedule the start dateso that it completes on the due date of delivery.
2. Minimize Service delays – On time delivery is very important for business like couriercompanies as they have very less time in hand from the time a mail is received and the timewhen it is to be delivered, so they have to schedule every movement from receiving the mailto its pickup and transportation through different mediums like truck, airplanes etc.
3. To enable the firm to allocate the capacity to meet customers’ demands on time - Inmanufac turing a product, lot of machines are used. Firms should use their machines in sucha way that idle time for every machine becomes zero or reduced to minimum. This becomespossible through effective scheduling of the orders that a firm has received.
4. To reduce cost and maximize profit – If all the facilities are used most efficiently so thatrum time of machines is maximized and idle time minimized to zero, the cost will reducebecause of less wastage. As a result profit of the firm is maximized.
5. To create flexibility to accommodate variation in customer demand – When operationsmanager plans and schedules the manufacturing process of the different orders received by afirm he comes to know about the changes that can be made if any new information is to beaccommodated.
11.3 Work Centers
Work center – It is an area on the shop floor where resources of production are organized and workis completed. It can be a single machine, a group of machines or an area where a particular type ofwork is done. For example in a factory which makes hand-made paper work station can be the areawhere workers sit and work same is the case with BOP employees, their work station is the cubicalwhere they sit and make calls.
Objectives of Work-Center Scheduling are to meet due dates, minimize lead time, minimizesetup time or cost, minimize work-in-process inventory, maximize machine utilization.

1. Forward Scheduling – It is a scheduling method in which actual production starts when ajob order is received. It is generally applicable to specific items which need to bemanufactured on the basis of some other specification like big machines or limited editioncars like Limousine. These are prepared according to the needs of a customer, so until andunless a customer tells what he needs the product cannot be prepared.
“In this method, operations manager schedules each operation forward in time starting fromthe date of production. Using forward scheduling, the operations manager determines startand finish times for jobs to be done by assigning them to the earliest available time slots atthe work centers. As the jobs start at the earliest possible time, they are finished before theyare required at next work centers. As a result work –in-progress inventory level tends to behigher in forward scheduling method.
2. Backward Scheduling - This method schedules orders according to their due dates. Theoperations manager obtains due dates for the job orders and develops the schedulebackwards and thus calculates the latest starting date of the project to complete the order ontime. Firms generally follow either backward or forward scheduling, depending upon thenature of the job. The forward scheduling method is used to estimate the earliest date bywhich a job can be completed. Operations manager uses backward scheduling if theestimated date is well before the actual date of its completion for example the due date forcompleting a consignment is on 31st day starting today, time required to complete the job is20 days so operations manager will calculate the latest starting date so that the consignmentgets finishes on the 31st day. So the latest day to start the manufacturing would be 11th dayfrom today.
On the contantary if the manager needs to give his clients an expected date of comple-tion of a particular product then he would use forward scheduling method to forecast the dateto completion of a product or project. “Retailers and wholesalers use forward scheduling forreplenishing their stock.”
3. Infinite Loading - jobs are assigned to work centers without considering work center’scapacity, as if its capacity is infinite. Gantt load charts and visual load profiles andassignment algorithm are used to evaluate loading and assigning the jobs. So capacity is notregarded as a limitation.
4. Finite Loading - It is a scheduling procedure that assigns jobs into work centers anddetermines their starting and completion dates by considering the work center’s capacity.Work center’s capacity is allocated unit by unit by simulating job starting and completiontime. This means that capacity of a work center is a limiting factor in the method.
5. Machine Limited Process – Basic production resources are men, material, machine andmoney. While actual manufacturing the products, two factors limit the volume which aremachine and men (labor). In a machine limited process, equipment is the critical resourcethat is scheduled. It can become critical because of limited use it, or most important andexpensive input.
6. Labor Limited Process – As discussed above if labor is in shortage or very exclusive kindof labor with high expertise is required which only a few people have then in that case laborbecomes critical resource and all other things become dependent on this one input. Examplecan be of scientists, workers in jeweler industry, hand wearers etc.,

Scheduling Problem :
[Problem 1]Two jobs are to be processed on two machines. Both jobs should be ready in 10 hours. The
route sheet is given below. Develop schedule using forward scheduling.
[Solution]
Cumulative Hours
Explanation :This qurstion means that there are 3 processes to be done to complete job A for which first it
will be processed on machine 1(M1) for 2 hours, then it will go on mchine 2(M2) there it will beprocessed for 5 hours and only after this it can go on to M1 again on which it will be processed for 2hours. Likewise job B has to go on M1 for 3 hours first then on M2 for 3 hours.
In the solution we have put job A on machine first because more processes are to be done forit and the process time is also long. The aim of this question is that both jobs should be completedwithin a span of 10 hours with minimum idle time.
On M1 first job A will be processed it will take a span of 2 hours there so 1 to 2 hours areoccupied by it. During that time we cannot do anything for job B as it also has to be processed on M1first and this span of 0 to 2 hours will be idle time on M2 as processing on M1 is not complete for anyof the jobs. Once job A finishes at M1it will be transferred to M2 for 5 hours and job B will be doneon M1. There is an idle time of 2 hours on M1 for 5 to 7 hours as job B has to go on M2 which isoccupied by M1 and job A is already running on M2. At hour 7 job A will be again shifted to M1 for2 hours then only job B can be processed on M2.[Problem 2] Solve Problem by Backward Scheduling
[Solution]
Cumulative Hours
Job A Route Sheet Job B Route Sheet Routing sequence
Machine Processing Time Hrs.
Routing sequence
Machine Processing Time Hrs.
1 1 2 1 1 3 2 2 5 2 2 3 3 1 2
Total 9 6
M1 A1 A1 B1 B1 B1 Idle Idle A3 A3 Idle M2 Idle Idle A2 A2 A2 A2 A2 B2 B2 B2 0 1 2 3 4 5 6 7 8 9 10
Job A Route Sheet Job B Route Sheet Routing sequence
Machine Processing Time Hrs.
Routing sequence
Machine Processing Time Hrs.
1 1 2 1 1 3 2 2 5 2 2 3 3 1 2
Total 9 6
M1 ldle A1 A1 ldle ldle B2 B2 B2 A3 A3 M2 B2 B2 A2 A2 A2 A2 A2 A2 ldle ldle 0 1 2 3 4 5 6 7 8 9 10

Explanation :
In Backward Scheduling we estimate the time backward i.e. if we want to complete both thejobs on 10th hour exact then when should we start doing the Job. Because of this reason only now wehave Idle 1 hour at the starting of 0 to 1 hour. So in backward scheduling, we will start Job A form10th hour backward and calculate the time backward. Rest is same as above.
11.4 Scheduling Activities
1. Routing – Routing outlines the sequence of operations and processes to be followed formanufacturing a product. In short, routing lays down the flow of work through differentworkstations, machines and departments. It determines what is to be done, how and where itis to be done. Operations manager gives all the details like list of operation is to be per-formed, time of operation and the sequence in which it will take place. Routing Sheets can bein physical hard copy as well as computerized electronic copy. Routing can also be useful inservice sector.
2. Loading – “Loading can be defined as “assigning specific jobs to each work centers for theplanning period.” There is one limitation to be considered while loading i.e. each work cen-ter has a limited capacity and work in excess of that capacity cannot be loaded at a time. Incase there is no capacity restriction then operations manager tries to minimize the cost byreducing machine idle time, amount of inventory etc.
3. Dispatching – Next step in the process of scheduling is dispatching. It is the final act wherejob orders are released to worker to go ahead with the production process. Here job ordersare released in the sequence as planned by the operations manager.Job Sequencing –
It is the process of determining the job order on some machine or in some workcenter. These are also called as dispatching rules or priority rules which are used by the firmsin light of the limitations that they have. These dispatching rule are simple which requirejobs be sequenced according to one piece of data such as processing time, due date or orderof arrival.
(i) Earliest Due Date (DDate) : Due date is the date promised for completion of product. Sofirms that follow this priority rule, first dispatch the one with earliest due date, next earliestjob second and so on. For example if there are 5 assignments due on 23rd Dec, 5th Jan, 12thDec, 30th Dec and 10th Jan. In this case first the one due on 12th Dec will be dispatched, nextwould be 23rd Dec, 30th Dec, 5thJan and last would be the one due on 10th Jan.
(ii) Longest Processing Time : According to this priority rule those jobs which take longesttime to process are loaded first, then the next longest time and so on. These jobs are givenpriority as these are considered more valuable. So if there are 4 jobs A, B, C, & D are to bedone for completing a product and they take 4, 10, 3 &12 hours respectively to finish. Thenthe order to be followed would be D, B, and A & C respectively in this order.
(iii) Shortest Processing Time (SPT) or Shortest Operating Time (SPT) : Some firms priori-tize there jobs on the basis of shortest processing time. So jobs that take shortest time toprocess are loaded first. Here all jobs are treated equal and not prioritized according to thererelative importance unlike in longest processing time priority rule. So in the above examplethe sequence to be followed would be C, A, B, D.

(iv) First Come, First Serve (FCFS) : Here jobs are processed as they come or in order of theirarrival. In this method also all jobs are regarded equal so no importance is given to any job.This rule is followed to give fair treatment to customers. For example in all restaurants peoplewho place their order first are served first.
(v) Slack Time Remaining (STR) : According to this priority rule operations manger calculatesthe slack time remaining of each job. Slack time is the difference between time remaining indue date and the processing time required. Jobs with the shortest slack time are dispatchedfirst. If the due date for 2 jobs are on 20th and 30th day form today and these jobs take 10 and8 days to process then job 1 would be done first as slack time for both these are 10(20-10)and 22(30-8) respectively.
(vi) Slack Time Remaining Per Operation (STR/OP) : In this method orders with shortestSTR/OP are run first. STR is calculated as follows:
Operations Remaining ofNumber Time Processing Remaining - date due before remaining Time OP/STR
(vii) Critical Ratio (CR) : This is calculated as the difference between the due date and thecurrent date by the work remaining. Order run in ascending order i.e. order with the smallestCR run first. The formula for calculating CR is as follows :
remaining days ofNumber Date)(Current - Date) (Due RC
(viii)Last Come, First Served (LCFS) : Suppose you have is jar, which is filled half withchocolates, now you got some more chocolates, your natural response will be to just put it inthe jar. As a result now when you will take out the chocolates from it, first ones to come inyour hand will be the once you have put last. This is exactly what happens frequently at theshop floor also. As orders arrive, they are placed on the top of the stock and operator picks upfrom top and uses it.
(ix) Random Order or Whim : This rule is no rule actually; supervisor or operator selects which-ever he feels like running. So every order received by the firm has equal probability to be runby the operator. Now let’s see a solved example of all these priority rules.
[Problem 3]
Scheduling n Jobs on one Machine : Rachit Iron Works ltd. manufactures bearings used in all themachines. It has received 4 orders from its customers P, Q, R, and S in the same order at the begin-ning of the month. The processing time and due dates of these orders are given on the next page:
Solve this by the following methods and calculate average delay of a job in each case :-
1. Earliest Due Date
2. Longest Processing Time
Jobs (in order of arrival) Processing Time (in days) Due Date (days hence) P 5 6 Q 8 11 R 4 7 S 2 5

3. Shortest Processing Time4. First Come First Serve (FCFS)5. Slack Time Remaining6. Last Come, First Served (LCFS)7. Critical Ratio
[Solution]Earliest Due Date
Average delay is as follows -(-3 + 1 + 4 + 8) / 4 = 2.5 days
So we can see that order S gets completed before time while all other orders get delayed by2.5 days on an average.Longest Processing Time
Average delay is as follows -(-3 + 7 + 10 + 12) / 4 = 6.5 days
By this process job get delayed even more. Again order Q get finished before time and all theother jobs get delayed.Shortest Processing Time
Average delay is as follows –(-3 -1 + 3 + 8) / 4 = 1.75 days
By this method order S and R get complete before time while P and Q get late by 3 and 8 daysrespectively.First in First Serve
Job Sequence Processing Time Due Date Flow Time Delay (flow time – due date) Q 8 11 0 + 8 = 8 -3 ( 8 - 11 ) P 5 6 8 + 5 = 13 7 ( 13 - 6 ) R 4 7 13 + 4 = 17 10 ( 17 – 7 ) S 2 5 17 + 2 = 19 12 ( 19 – 5 )
Job Sequence Processing Time Due Date Flow Time Delay (flow time – due date) P 5 6 0 + 5 = 5 -1 ( 5 - 6 ) Q 8 11 5 + 8 = 13 -2 ( 13 - 11 ) R 4 7 13 + 4 = 17 10 ( 17 – 7 ) S 2 5 17 + 2 = 19 12 ( 19 –5 )
Job Sequence Processing Time Due Date Flow Time Delay (flow time – due date) S 2 5 0 + 2 = 2 -3 ( 2 - 5 ) P 4 6 2 + 5 = 7 1 ( 7 - 6 ) R 5 7 6 + 5 = 11 3 ( 9 – 6 ) Q 8 11 11 + 8 = 19 8 ( 19 –11 )
Job Sequence Processing Time Due Date Flow Time Delay (flow time – due date) S 2 5 0 + 2 = 2 -3 ( 2-5 ) R 4 7 2 + 4 = 6 -1 (6-7) P 5 6 7 + 4 = 11 3 ( 9 – 6 ) Q 8 11 11 + 8 = 19 8 ( 19 – 11 )

Average delay is as follows –
(-1 -2 + 10 + 14) / 4 = 5.25 days
Here though P and Q still get done before but average delay time gets increased to 5.25 days.
Last Come First Serve (LCFS)
Average delay is as follows –
(-3 + 5 + 9 + 13) / 4 = 6 days
According to this method one of the jobs get completed on time and the average delay is of 6days.
Slack Time Remaining
Here first we have to calculate slack time for all the jobs which is the difference between duedate and processing time. Then we will arrange the jobs in ascending order of there slack time. Soaccording to that following is the slack time –
P (6 - 5) = 1 Q (11 - 8) = 3
R (7 - 4) = 3 S (5 – 2) = 3
Here as we can see that slack time for Job A is lowest, so it will come first. But for all otherjobs slack time is same i.e. 3 so we will see their processing time and then arrange them in ascendingorder.
By this method job P and S get completed before time while the other jobs R and Q getdelayed by 4 and 8 days.
Critical Ratio (CR)
remaining days of Numberdate) Current-date (DueCR
To solve this question by CR method first we need to calculate critical ratio for all jobs.So lettoday be Day 1 and allow a total of 15 days to do the work. The resulting CR’s and order scheduleare:
CR (P) = (6-5)/15 = .067
CR (Q) = (11-2)/15 = .6
CR (R) = (7-4)/15 = .2
CR (S) = (11-8)/15 = .2
Job Sequence Processing Time Due Date Flow Time Delay (flow time – due date) Q 8 11 0 + 8 = 8 -3 ( 8 – 11 ) R 4 7 8 + 4 = 12 5 ( 12 - 7)
S 2 5 12 + 2 = 14 9 ( 14 – 5 ) P 5 6 14 + 5 = 19 13 ( 19 – 6 )
Job Sequence Processing Time
Due Date Flow Time Delay (flow time – due date)
P 5 6 0 + 5 = 5 -1 ( 5 - 6 ) S 2 5 5 + 2 = 7 -4 ( 7 - 11 ) R 4 7 7 + 4 = 11 4 ( 11 – 7 ) Q 8 11 11 + 8 = 19 8 ( 19 –11 )

So the order schedule would be P, S, R and Q respectively. As CR for R and S is same so wecan have any sequence in them.
11.5 Techniques for Scheduling Activities
Scheduling becomes a very complicated task when it is to be done in big industries and itbecomes impossible to do it manually so operations managers use different techniques some of thencomputer based techniques to make the schedule. Some of these techniques are Gantt chart, JobSequencing Rule, Queuing Theory, and Critical Ratio.
1. Gantt Chart :
Gantt Chart was developed by Henry L. Gantt on whose name it is named. He won a presi-dential citation for his application of this type of chart for ship building during World War I. It issometimes also referred to as bar chart showing both amount of time involved and the sequence ofactivities to be performed. Hence it is a graphical display of the duration of a set of activities. It isused by individual departments or job shops of large departments to plan and track jobs. It is a toolto monitor the progress of work and to view the load on workstations. The chart takes two basicforms:
(1) The job or activity progress chart, and
(2) The workstation chart.
(i) The Gantt progress chart graphically displays the current status of each job or activity rela-tive to its scheduled completion date.
Gantt Progress Chart for an Auto Parts Company
(ii) The Gantt workstation chart shows the load on the workstations and the nonproductive time.
Gantt Workstation Chart for Hospital Operating Rooms
Start activity Finish activity
Nonproductive time
Scheduled activity time
Actual progress
Maruti
Ford
Honda
Job
4/11
6/11
7/11 8/11
9/11 12/11
5/111/11
2/11
3/11

2. Johnson’s Job Sequencing Rules
Johnson’s rule was developed by Johnson and Bellman, and it is utilized to minimize thetotal time span required for completing the given jobs. It is use to schedule n jobs on two machines.Sequencing of jobs is important for scheduling of jobs. It helps in minimizing the processing timeand maximizing the operations efficiency. It also reduces the operations cost over a period of time.When products like ice-cream, tiles etc., are to be made, jobs are processed in multistage, it isnecessary to sequence in such a way that idle time is reduced.
(i) Johnson’s Rule for Two Stage Production : If a firm has to perform “n” jobs on two ma-chines A and B in the order AB. Expected time for these jobs are A1, A2, A3….. An onmachine A and B1, B2, B3….. Bn in machine B. Following steps are followed:
1. Identify least processing time in A1, A2,….An and B1, B2….Bn. If there is tie, select eitherof the processing time.
2. If the smallest processing time is Ar (rth job in machine A then place it at the beginning of thesequence. And if it is Bs (sth job on machine B), then place it at the end of the sequence.
3. If there is tie for the least processing time on machine A, any of the jobs can be placed at thebeginning of the sequence. In case of tie at machine B, any of the jobs can be placed at theend of the sequence.
4. Identify the next least processing time and repeat the above step. The process is continued tillall the jobs are assigned in a sequence. The sequence obtained is called as optimum se-quence.
5. Once the time sequence is found, the total elapse time and idle time on machine A and B canbe calculated by the following formula.
Total Elapse time = time between start of the first job – end time of last job.
Idle time on machine A = time of completion of last job on machine B in optimum sequence-time of completion of last job on machine A in optimum sequence
Idle time on machine B = Time taken by Machine A in completing first job in sequence - “[(time when kth job starts on machine B) – (time when k-1 th Job finishes on B)
(ii) Johnson’s Rule for Three Stage Production : If the expected processing time for n-jobs on3 machines A, B and C are A1,A2,A3…..An; B1, B2, B3….Bn and C1,C2,C3…..Cn
Stage -1: check that Johnson rule can be used:
Any one of the following conditions should be satisfied
(i) The smallest processing time on machine A should be greater than or equal to the largestprocessing time on machine B.
(ii) The smallest processing time on machine C should be greater than or equal to the larg-est processing time of machine B.
Stage -2: Assume two fictitious machines G and H
Stage -3: Find out corresponding time for these machines by they following formula
Gi = Ai +Bi
Hi = Bi + Ci

Stage -4: solve the problem like 2 machines and n jobs with order of GH.
The resulting optimum sequence will also become the optimum sequence for the problem of3 machines and n jobs.
11.6 Scheduling in Services
Till now we have discussed scheduling in manufacturing industries where machines are usedfor production of goods. Now lets see what kind of scheduling has to be performed in service indus-try like restaurants, courier services etc.,
In service industry the only critical resource which needs to be scheduled is human resourcewhich is temperamental and comes with a lot of limitations. In BPO’s and restaurants where workhappens in a number of shifts and the staff is generally part time it becomes difficult to give timeslots to the staff as you never know when the work inflow would be high. Another problem could begiving two consecutive days off to all the employees, when employer wants all seven days as work-ing days. The problem gets even more complicated while going deep to set weekly, daily and hourlyschedules. So all the issues in short can be summarized as follows:
1. Customer’s direct interaction 2. High variability in demand
Two operations:
1. Front of the house 2. Back of the house
11.7 Methods to Meet Customer Service Facilities
Appointment System – customer arrival time can be controlled. Like prestigious saloons,dress designers entertain clients only if they have to an appointment then only they are givenentry into the establishment.
Reservation System – At some places customers have to make a reservation first beforethey could enjoy the place like hotel rooms etc.
Strategic Product Pricing – Strategic pricing is a method in which prices are adjustedaccording to demand of a product. When demand is high prices are higher and in off seasonprices are lower, same happens during different hours of the day like higher price at peakhours, electricity at high price in summer, advertisements also become expensive at primetime.
11.8 Summary
Organizations schedule their activities in order to meet customers’ requirements on time andimprove their operational efficiency. Scheduling activities are not only important for manufacturingfirms but they are equally important for service organizations also. But the focus of both aredifferent, while manufacturing concerns schedule production on machines, service organizationsfocus on employee scheduling using mathematical tools that can be used to set work schedule inlight of expected customer demand.
11.9 Key Words
Backward Scheduling – Starts from some date in future (generally the due date) andschedules the required operations in reverse order. It tells the latest date when an order can bestarted so that it is completed by a specific date.

Dispatching – The activity of initiating scheduled work. Finite Loading – Each resource is scheduled in detail using the set up and run time required
for each order. The system determines exactly what will be done by each resource at everymoment during the working day.
Forward Scheduling – Schedules from now into the future to tell the earliest date by whichan order can be completed.
Johnson’s Rule – A sequencing rule used for scheduling any number of jobs on twomachines. The rule is designed to minimize the time required to complete all the jobs.
Labor Limited Processes – People are the key resource that is scheduled. Machine Limited Processes – Equipment is the critical resource that is scheduled. Priority Rules – The logic used to determine the sequence of jobs in a queue. Work Center – An area in a manufacturing plant where productive resources are organized
and work is completed.
11.10 Self Assessment Test
(1) What is scheduling? Explain the different scheduling activities with an example.(2) Is scheduling important only in manufacturing firms? If not, elaborate in which other indus-
try it is used and write down the way to do it.(3) Ayush Ceramics Ltd. manufactures tiles. It has received 4 orders from its customers P, Q, R,
and S in the same order at the beginning of the month.The processing time and due dates of these orders are given on the next page:
Solve this by the following methods and calculate average delay of a job in each case.(i) Earliest Due Date(ii) Longest Processing Time(iii) Shortest Processing Time
4 Sanjeeva Jewels Emporium has received 5 orders from its customers for makingnecklaces. The processing time and due dates of these orders are given on the nextpage:
Solve this by the following methods and calculate average delay of a job in each case.
(i) First Come First Serve (FCFS)
(ii) Slack Time Remaining
(iii) Last come, first served (LCFS)
Jobs (in order of arrival) Processing Time (in days) Due Date (days hence) P 2 5 Q 5 7 R 7 10 S 4 8
Jobs (in order of arrival) Processing Time (in days) Due Date (days hence) P 3 8 Q 6 9 R 9 12 S 5 7

(iv) Critical Ratio
(v) What is a work center? Write down its importance.
(vi) Solve the following question by forward scheduling.
Can these jobs be completed in a span of 12 hours?
(7) Following is a chart showing 3 jobs which are to be done on 3 machines. Make a schedule forit by Forward and Backward scheduling.
11.11 References1. http://www.enotes.com/management-encyclopedia/operations-scheduling
2. Brucker. P. Scheduling Algorithms. Berlin : Spring Verlag, 2001
3. Richard B Chase, F Robert Jacobs, Nicholas J Aquilano, Nitin K Agarwal, McGraw HillsCompanies( 11th edition) New Delhi 2006.
4. Operations Management, ICMR September 2003.
Job M Route Sheet Job N Route Sheet Routing sequence
Machine Processing Time Hrs.
Routing sequence
Machine Processing Time Hrs.
1 1 1 1 1 3 2 2 2 2 2 4 3 1 3 3 1 1 4 2 2
Total 6 10
Job A Route Sheet Job B Route Sheet Job C Route Sheet Routing sequence
Machine Processing Time Hrs.
Routing sequence
Machine Processing Time Hrs.
Routing sequence
Machine Processing Time Hrs.
1 1 2 1 3 1 1 1 1 2 2 3 2 2 2 2 2 4 3 1 1 3 1 3 3 3 1 4 3 2 4 3 1 4 2 2
Total 10 6 10

Unit - 12 Total Quality ManagementStructure of Unit:
12.0 Objectives
12.1 Introduction
12.2 Quality Control and Quality Assurance
12.3 Total Quality Management (TQM)
12.4 The Evolution of Total Quality Management (TQM)
12.5 What is TQM?
12.6 Key Concepts of TQM
12.7 Planning and Implementation of TQM
12.8 Quality Initiatives and Benefits
12.9 Summary
12.10 Self Assessment Test
12.11 References
12.0 Objectives
After completing this unit you would be able to:
Understand the concept of quality and learn how to use quality as a competitive tool;
Examine quality assurance, quality control, and quality planning;
Understand the concept of TQM and its impact on the organisation;
Know about the evolution of TQM;
Enhance the understanding regarding various TQM concepts;
Explain the systems approach to TQM and its implementation requirement;
Point out various quality initiatives in Indian companies.
12.1 Introduction
In response to the question “What is quality?” Some people say that it is “getting what youpay for”. Some says quality is “getting more than you paid for!” Quality is a term that is very common.In day-to-day conversation, if something needs to be classified as being ‘superior’, it is often said tobe of ‘good quality’. The Oxford American Dictionary defines quality as “a degree or level ofexcellence”. It is obvious that quality can be defined in many ways, depending on who is defining itand to what product or service it is related. In this section of the unit we attempt to gain a perspectiveon just what quality means to consumers and different people within a business organisation.
Consumer’s Perspective on Quality
Quality is rapidly becoming a major factor in customer’s choice of products and services.Customers now perceive that certain companies produce better-quality products than others, andthey make decisions about which products to purchase accordingly. An important consideration,then, in producing quality products is how consumers make judgments as to what constitutes good

quality; that is, how does the consumer define quality? The consumer can be a manufacturer purchasingraw materials or parts, a store owner or retailer purchasing products to sell, or someone who purchasesretail products. W. Edwards Deming, the internationally famous author and consultant on quality,has made the frequent observation that “The consumer is the most important part of the productionline. Quality should be aimed at the needs of the consumer, present and future.” From this perspective,product quality is determined by what the consumer wants and is willing to pay for. Since individualconsumers have different product needs and requirements, they will have different quality expectations.This results in a commonly used definition of quality as a product’s fitness for its intended use, orfitness for use. In other words, how well does the product do what the consumer or user thinks it issupposed to do and wants it to do?
David Garvin has identified eight dimensions of quality or product quality characteristics,for which the consumer looks in a product.
1. Performance: The basic operating characteristics of a product, for example, how well a carhandles or its mileage.
2. Features: The “extra” items added to the basic features, such as a stereo CD or a leatherinterior in a car.
3. Reliability: The probability that a product will operate properly within an expected timeframe.
4. Conformance: The degree to which a product meets pre established standards.
5. Durability: how long the product lasts; its life span before replacement.
6. Serviceability: The ease of getting repairs, the speed of repairs, and the courtesy andcompetence of the repair person.
7. Aesthetics: how a product looks, feels, sounds, smells, or tastes.
8. Other Perceptions: Subjective perceptions based on brand name, advertising, etc.
These quality characteristics are weighed by the customer relative to the cost of the product.In general, consumers will pay for the level of quality that they can afford. If consumers feel like theyare getting what they paid for, then they tend to be satisfied with the quality of the product.
Figure 12.1 Meaning of Quality
The Meaning of Quality
Consumer’s PerspectiveProducer’s Perspective
Quality of Design* Quality Characteristics* Price
Quality of Conformance* Conformance to specifications* Cost
Production Marketing
Fitness forConsumer

Producer’s Perspective on Quality
A second point of view of quality derives from the producer’s (or manufacturer’s) point. Wehave already mentioned how product development is a function of the level of quality characteristics(i.e., the product’s fitness for use) that the consumer wants, needs, and can afford. Product designresults in design specifications that, it is to be hoped, will achieve the desired quality characteristics.How ever, once the product design has been determined, the producer perceives quality to be howeffectively the production process is able to conform to the specifications required by the design.This concept is referred to as the quality of conformance.
The ability to achieve quality of conformance is a function of a number of factors in theproduction process like design of the production process itself, the performance level of machineryand equipment, the materials used, the training and supervision of operators, and the degree to whichstatistical quality control techniques are used.
In our previous discussion we noted that an important consideration from the consumer’sperspective of product quality is the product price. Alternatively, from the producer’s perspectivean important consideration is achieving quality of conformance at an acceptable cost. Product cost isalso an important design specification. Thus quality characteristics included in the product designmust be balanced against production costs.
Competitive environments demand a better quality product or service at lower costs. Onlythose organizations which manage productivity and quality on a continuous basis are in a position tocompete in increasingly global market place. The impact of poor quality on any organisation ispresented in Figure. 12.2
Figure 12.2 Impact of Poor Quality on an Organisation
Figure 12.1 summarizes our discussion of the meaning of quality from the consumer’s andproducer’s perspectives. At the end of the figure, note that the final determination of quality is“fitness for use”, which you will recall is the consumer’s view of quality. This is a natural conclusion,since ultimately it is the consumer who makes the final judgement regarding quality, and so it is theconsumer’s view that must be dominant.
Low Moraleof
Employees
ProcessBottlenecks
Increase inAnalysis &Repair Cost
Decreasein
Productivity
Increasein
Inventory
LowCustomer
Satisfaction
Rise inCustomer
Complaints
LowMarketShare
Impact ofPoor Quality

The modern view of quality is that products should totally satisfy the customer’s needs and expectationsin every respect on a continuous basis. This new concept of quality calls for:
Well designed product with functional perfection at right time.
Providing satisfaction beyond customer’s expectation
Excellence in service
Absolute empathy with customer.
Definitions of Quality
1. According to Juran, Quality is “Fitness for purpose or use”
2. As per the ISO 8402 Quality Vocabulary Quality is “The totality of features and characteristicsof a product or service that bear on its ability to satisfy stated or implied needs”
3. In the words of Feigenbaum “Total composite of product and service characteristics ofmarketing, engineering, manufacturing and maintenance through which the product and servicein use will meet the expectation by the customer”
4. According to Deming “Quality should be aimed at the needs of the consumer, present andfuture”
5. According to Crosby “Quality is conformance to requirements”
6. In the words of Broh “Quality is the degree of excellence at an acceptable price and controlof variability at an acceptable cost”
7. The “official” definition of quality by the American National Standards Institute (ANSI) andthe American Society for Quality Control (ASQC) is “the totality of features and characteristicsof a product or service that bears on its ability to satisfy given needs.”
12.2 Quality Control and Quality Assurance
Quality Control refers to the measures that ensure that all the equipment, processes, andpersonnel within an organisation adhere to rules that maintain the required level of quality from thefirst to the final stage of production. Quality planning constitutes all those processes connected withdetermining the needs of customers and optimizing the product features so as to meet the customer’sneeds.
Quality Assurance refers to all the planned and systematic activities implemented withinquality system that evoke confidence that a product or service will fulfill requirements for quality, interms of fitness for use, and conformance to legal and environmental standards. It involves theactivities of verification, audits and evaluation of quality factors. Quality assurance system is toprovide guarantee which a customer requires that a supplier will deliver goods of desired quality.Responsibility of implementing Quality Assurance System lies with Quality Management which hasalso to carryout the following functions:
To get support of top-management and ensure quality to customers and care to customersatisfaction.
To make the programme of quality as programme of masses, i.e. to obtain participation andcontribution of each employee.
To develop awareness amongst all employees (quality attitude)

To formulate quality policy, objectives, goals as per corporate policy.
To develop quality plans.
To ensure that quality control works:
- Develop quality improvement group.
- Training, education to all concerned people and continuous evaluation.
To introduce rewards and incentives.
Quality assurance and quality control are often used interchangeably to refer to the actionsperformed for ensuring the quality of a product or service. However, both terms have multipleinterpretations.
12.3 Total Quality Management (TQM)
Quality is regarded today as the most accurate arrow in a company’s quiver, to hit the bull’seye of strategic competitive advantage in both domestic and international markets. The variousattributes of quality such as performance, features, reliability, conformance, disability, aestheticsand perceived quality are being constantly evaluated and upgraded so to be in sync with current andfuture market demands.
In the previous section we approached quality from two perspectives, the consumer’s and theproducer’s. In this section we explore how quality is managed in a business organization. Thus, ourfocus will be from the producer’s perspective on the production process and achieving quality ofconformance. The production process is used here in a broad context to mean the conversion ofresources (of any type) into goods and services. In order to assure that the quality level designed intoproducts are achieved, a commitment to quality through out the production system is required; thatis, a systems approach to quality must be used. This approach to the management of quality throughoutthe entire production system and business organization has evolved into what is currently referred toas Total Quality Management, or TQM.
The TQM philosophy is then the guiding light that leads to superior product and processdesign, world class manufacturing, statistical process control, design of experiments and improvedvendor as well as customer relations.
12.4 The Evolution of Total Quality Management (TQM)
The term quality assurance was first used at Bell Telephone Laboratories during the 1920s bya group of early pioneers in the field, including George Edwards, Hardold Dodge, and Walter Shewhart.Many of the technical methods for statistical quality control, such as control charts and samplingtechniques, were developed by these individuals and in 1940 the emphasis was on processimprovement.
It was as early as 1954 that Armand Feigenbaum came up with term total quality control. Hedefined TQC as an effective system for integrating the quality development, quality maintenanceand quality improvement efforts of various function of business to enable production and service atthe most economical levels to meet full customer satisfaction. Around the same time W. EdwardDeming and Joseph M. Juran, Ishikawa were helping war-torn industries of Japan to recover andrecoup with somewhat similar philosophy and techniques. Japanese termed this initiative as CompanyWide Quality Control (CWQC).

Although the word total was replaced by company wide, the concept is the same - that allemployees at all levels of the organization, led by top management, are responsible for quality. In1960-70 there was zero defect movement in US to improve the quality of products & services andthe initiator of this philosophy was Crosby.
In recent years the expression TQM has become popular. It embodies the same basic principlesas quality assurance, total quality control, and companywide quality control. TQM emphasizes topmanagement’s predominant role in leading a total quality effort on which all employees at all levelsmust focus. All employees are responsible for continuous quality improvement, and that quality isthe focal point of all organizational functions. TQM also emphasizes that quality is a strategic issue.The organization must determine what the customer wants in terms of quality and then use strategicplanning encompassing all functional areas to achieve strategic goals related to quality.
Figure 13.3 Evolution of Total Quality Management
In fact, to summarize, the three Americans Feigenbaum, Deming and Juran conceived andnurtured the idea, the Japanese Ishikawa and Taguchi refined the concepts in the test bed of Japaneseindustry and now TQM revolution is a rage in America (to regain America’s ManufacturingCompetitiveness) and it is fast spreading in the world.
12.5 What is TQM?
In our previous section, we came to know about the evolution of TQM, and now we willknow that “what exactly TQM is”? Total quality management is a process with a strong philosophicalbase which incorporates many of the concepts upon which total quality control systems are based,but goes even further in emphasizing that quality should be managed into the system, and quality
StatisticalMethods
Applied toManufacturing
Increased Emphasis on ProcessImprovement
Japan Emerges asWorld Quality
Leader
Zero DefectsMovement in
US
TQCEmerges in
US
Shewhart,Edwards,
Dodge[1920s]
Deming,Juran [1940s]
TQM Emerges inUS and World
Feigenbaum[1950-60s]
Deming, IshikawaTaguchi [1960-70s]
Crosby[1960-70s]
Feigenbaum Deming, Juran,Taguchi Crosby [1980-90s]

management should always be oriented towards the achievement of complete customer satisfaction.Let’s understand the different elements of TQM: Total: It refers to everything, including human resources and equipment, associated with thecompany that is involved in continuous improvement. Quality: It refers to the ‘expressed and implied requirements’ of the customers that are metfully, i.e., based on the customers’ perceptions of a product’s design and how well the design matchesthe original specifications as well as the stated or implied needs of the consumers. According to ISO1994 quality is ‘the totality of features and characteristics of a product or service that bears on itsability to meet a stated or implied need’; ‘fitness for use’ (Juran); and ‘conformance to requirement’(Crosby). Management: It means that top management and executives are fully committed to thephilosophy of TQM. Satisfying the consumer’s needs and expectations implies that a company needsto define accurately, early in its product / service development cycle, various attributes related todesign, performance, price, safety, and delivery specifications from the consumer’s perspective. Themodern trend in total quality management is to exceed expectations of the consumers and delightthem.
Total Quality Management (TQM) as defined by Richard J. Schonberger as, “the Total QualityManagement is a set of concepts and tools for getting all employees focused on continuousimprovement, in the eyes of the customer.”
The quality concepts involved in TQM have worked so well in the manufacturing sector thatthese can well be applied to services such as banking, transportation, retailing, etc. Total qualitymanagement provides the overall concept that fosters continuous improvement in an organization. Itemphasizes upon a systematic, integrated, consistent, and organization - wide perspective that involveseverything and everyone. In other words, TQM is an important element of corporate culture thatrepresents a vision as well as some behavioural patterns shared by all the members of the organization.TQM has three dimensions - excellence, universality and perpetuity. In TQM, it is not just products,process, customers and employees but it is entire gamut of organizational activities.
12.6 Key Concepts of Total Quality Management
Figure 12.4 Key Concepts of Total Quality Management
TQM
ManagementCommitment
Quality Delivery Process
Universal Responsibility
Customerfocus
Prevention
ContinuousImprovement
EmployeeInvolvement
EmployeeEmpowerment
QualityMeasurement
Benchmarking
Feedback
Recognition& Rewards
Team work
ValueEnhancement
CustomerRequirements
StatisticallyProcess

1. Management Commitment to Quality: An organization’s personality and culture willultimately reflect its senior management’s values. If an organization is serious aboutimplementing TQM, the commitment to do so have to start at the top and the organization’ssenior management has to be unwavering in its commitment to quality. If management iswilling to increase the sales only if quality levels are up to requirements, the rest of theorganization will understand that the commitment to quality is real.
2. Customer Focused: TQM is focused on the requirements of the customer. On the personalfront people only go back to restaurants that fully satisfy them and shop regularly at storesthat meet their needs. An industrial customer has the same range of emotions as a person.Customer (personal or industrial) after being disappointed & cheated withdraw the businessand start buying elsewhere.
3. Customer Requirements: In TQM the first question to answer is what does the customerrequire? The customer will have five questions, consciously or unconsciously. These are thefive dimensions of quality. The traditional view of quality is simple ‘conformance tospecification’. However, this is only part of total quality. Quality involves all of the fivedimensions for the customer to be satisfied. The measurement of quality will reflect each ofthe elements mentioned below:The specification for the product or service.The conformance to the specifications.The reliability (or conformance through time)The value for money aspectThe delivery (Quality and on time)
4. Preventing rather than Detecting Defects: TQM is a management philosophy that seeks toprevent poor quality in products and services, rather than simply to detect and sort out defects.If a single characteristic is most strongly attached to the TQM philosophy, it is preventionrather than detection. Like many of the philosophies tied to TQM, this is not a new concept.A popular saying from Halliburtion’s Wise Saws, “An ounce of prevention is worth a poundof cure.” That wisdom says it all, from a TQM perspective.
5. Universal Quality Responsibility: Another basic TQM precept is that the responsibility forquality is not restricted to an organization’s quality assurance department, but is instead aguiding philosophy shared by everyone in an organization. In TQM everyone takesresponsibility for quality. Does this type of thinking work? Absolutely. Most of us wouldintuitively suspect that in order to improve quality, the quality assurance department wouldhave to grow. In companies that successfully implement TQM, just the opposite occurs. Asquality improves, the quality assurance department gets smaller. If everyone is responsiblefor the quality of the output (and everyone accepts this responsibility), the need for a separatequality assurance function disappears.
6. Quality Measurement: Along with “An ounce of prevention is worth a pound of cure” isanother saying particularly relevant to TQM, and it is: “If you don’t know where you’regoing, you’ll probably end up somewhere.” The quality measurement aspect of TQM asksthe question: Where are we and where are we going? A basic TQM concept is that quality isa measurable commodity, and in order to improve, we need to know where we are (or stateddifferently, what the current quality levels are), and we need to have some idea where we aregoing (or what quality levels we aspire to). This is an extremely important concept.

7. Continuous Improvement: TQM espouses a philosophy of continuous improvement in allareas of an organization. This philosophy ties in closely with the quality measurement anduniversal quality responsibility concepts mentioned above. Quality measurement is neededin order to focus improvement efforts appropriately, and continuous improvement should bepursued in all areas. This TQM concept focuses on finding shortfalls in administrative,manufacturing, and service processes that can detract from a quality output, and improvingthe process to eliminate undesirable outputs.
8. Employee Involvement and Empowerment: Another fundamental TQM concept is thatemployees must be involved and empowered. Employee involvement means every employeeis involved in running the business and plays an active role in helping the organization tomeet its goals. Employee empowerment means employees and management recognize thatmany obstacles to achieving organizational goals can be overcome by employees who areprovided with the necessary tools and authority to do so.
9. Team Work: In addition to the TQM concepts of empowerment and involvement ofemployees, taking advantage of the synergy of teams is an effective way to address the problemsand challenges of continuous improvement. Dr Kaoru Ishikawa first formalized the team’sconcept as part of the TQM philosophy by developing quality circles in Japan.
10. Statistically Thinking: Thinking Statistical is another basic TQM philosophy. Quality effortsoften require reducing process or product - design variation, and statistical methods are ideallysuited to support these objective.
11. Benchmarking: Comparing one company’s performance with that of another is a reflex ofTQM. Competitive benchmarking is a continuous management process that helps firms toassess their competitiveness and to use that knowledge in designing a practical plan to achievesuperiority in the market place. The measurement takes place along the three components ofa total quality programme :-Products: Products and services delivered to external and internal customers.Process: Business processes in all departments / functions.People: Organisation, business culture and calibre of people.Competitive benchmarking, then, is a vital component of any total quality programme. Five
solid reasons for actively using the techniques are to: Define customer requirements. Establish effective goals and objectives. Develop time measures of productivity. Become more competitive. Determine industry best practices.
12. Value Enhancement: The linkage between continuous improvement and value enhancementis simultaneously obvious and subtle. This linkage becomes apparent when one considersthe definition of quality, which is the ability to meet or exceed customer requirements andexpectations. The essence of value enhancement is the ability to meet or exceed customerexpectations while removing unnecessary cost. Removing unnecessary costs andsimultaneously satisfying customer expectations and requirements can only serve to increasecustomer satisfaction.

13. Feed Back: Performance feedback is vital to enable managers at all levels to improve theircontribution to the business. Feedback provides information on where a manager is todayand gives an indication of level of improvement compared with previous feed back.
14. Recognition and Rewards: An appropriate system of recognition and reward is critical toany company’s TQM programme, particularly as the quality improvement process offersinvolvement to ordinary working people. Positive reinforcement through recognition andreward is essential to maintain achievement and continuous improvement through participativeproblem solving projects. People work for many reasons, for achievement, advancement,increased responsibility, recognition, job interest as well as finance.
15. The Quality Delivery Process: TQM is not just about awareness of Quality. TQM demandsthe implementation of new systems. ‘The Quality Delivery Process’ is a generic name forsuch a system. The purposes of the quality process are to: Ensure that everyone works on those activities which are most important for the
success of the business by fulfilling work group missions. Improve the quality of work delivered (outputs) to the customers-internal customers,
the next person down-the-line, who receives the work. Eliminate work that is wasted because people do not do it right the first time. Harness the combined skills, ideas and experience of the work group members to
improve the business continuously through team work. Satisfy the external customers.
12.7 Planning and Implementation of TQM
The strategic implementation of TQM involves continuous improvement of the quality,reduction of the costs, and delivery of goods in time as well as pushing for innovation thusstrengthening the competitive edge in the process. It encompasses leadership, pre-operational, postoperational organizational aspects and production processes. From choosing the right productionequipment, to the right personnel and the right strategy of marketing and customer service.
To ensure effective implementation of TQM system the following paradigm shifts are neededshown in Table – 12.1
Table -12.1 Paradigms Shift Needed for Implementation of TQMFrom To
Control Management Commitment Management Tracing problems to workers Tracing problem to systems & positive
management Focus on specific tasks and company standards Focus on process & customer needs Task assignment to individuals Team work and synergy Tall pyramidal Organization structure Flat, flexible structure Command oriented management Consensus oriented management. Unstated values Standard and stated values Drive people towards goal Enable people to achieve goals through
leadership Resources consuming management Resource creating management Record keeping - close supervision to find faults
Score keeping - caching people doing the right and allowing them to score (trust)
Top-Down approach Top-down, bottom-up approach

The following aspects are important in planning and implementing TQM:1. Quality Vision: A statement regarding what your organization will become and how good
your organisation intends to be in the business. Quality vision creates a common focus forthe business organization, thus encourages strategic planning. The major areas covered underthe head of quality vision: The basis for strategic planning. The basis for implementing quality initiatives. The direction for heading with quality.
2. Quality Policy: To enunciate the basic principles which are to guide the action of theorganization, to fulfill the quality vision, it is essential to document these and make it knownto all employees. It is important that all further activities in the organization are not in conflictwith the policy, aim and objectives conveyed.
3. Quality Strategy Development: The quality strategy should be based on the informationthat is important to customer i.e. how customer view quality. Quality strategy should be apart of overall strategic plan for the business. The major areas that it should cover include: Customer needs A documented strategy. Data from wide spectrum of potential customer.
4. Quality Goals: A statement on specific goals related to the quality of goods/services to beoffered by the organisation. The quality goals should be measurable. Quality goals can be seton the basis of following: The needs and satisfaction of your customers. Your performance compared to your competitor. Specific performance defects. Training needs.
5. Deployed Objectives: Quality goals (long term quality goals) must be divided into smallerobjectives which can be easily implemented. Specific individuals must be assigned theresponsibility to meet the objectives. The objectives can be set on the basis of resources andnegotiation between the groups/individuals.
6. Functional Responsibilities and Delegation: All divisions, departments and sections haveto spell out in clear terms their responsibilities. It is necessary to develop and well define asto what is required of each department and section. It should be stated in a way that serves asbasis for action. It provides a yard stick for measuring progress and promoting targetachievement. It is important to define the required quality in each section and to achieve thetarget without failure will eventually lead to improvement of the Total Quality Level.
7. Information Sharing: It is very important to create an overall awareness about theorganization at all levels. The success of quality teams depends on resources used to performthe work. The most important resources include training, time for meeting, data collectionand analysis, facilitator support, data analysis support, etc. Lack of this knowledge createsindifference in the employees of the organization. Information pertaining to organizationalhistory, growth and development, routes and areas covered, public acceptability, future plansboth short term and long term, achievements etc.; all policies, procedures, and rules affecting

employees must be made known to them and updated. The most important task is to organizethe flow of information. From the top to the bottom. From the bottom to the top. Within various levels of the organization.
Total quality is directly dependent upon precise and timely communication.8. Customer Data: Planning TQM requires adequate data of relevant areas:
Identification of customers, their needs expressed in terms of benefits. The relative importance of each need. Customer evaluation of your quality. Customer evaluation of the competitor’s quality. Measure of performance of the self against the competitor’s goods / services.Data on these areas should be adequate so that some statistical methods and scientific samples
that include both current customers and potential customers can be applied.9. Quality Culture: For effective implementation of TQM system, Quality Culture is very
Crucial. It includes following:(a) Personal Involvement: It includes:
Meeting with people of all levels frequently Meeting and focusing attention on quality. Meet customers. Delivering talks in training. Lead quality based efforts.
(b) Consistency: Consistency in quality means not allowing the ordinary rush of business or evenextraordinary events to slow or to suspend the process. Never allow other activities to interfere with scheduled quality responsibilities. Try to be consistent in quality / assigned activities. Consistent in quality initiatives.
(c) Changing Culture by Providing Time: People often require time to adjust to proposed changes.Time provided should be based on time needed for change psychologically, but if it is toolong, it may paralyze the system. This time should be adequate to accommodate matters ofdispute. Resistance to change may sometime create problem. So we should develop activeplans dealing with resistance, but prove enough time to adaptation.
(d) Leadership is desired at the top level of management to lead the organization with impact. Itmay be based on focusing on the degree to which the top management or managers demonstratefaith in their subordinates through delegation. It can be assessed on the basis of: Sound decisions taken by subordinates. How much to concentrate on resources, methods, goals. Subordinates need careful review of their work/performance frequently and corrective actions are suggested to have better results.
(e) Changing Culture through Actions: Attitudes change as a result of activities in which

individuals participate. Efforts to change attitudes directly are rarely successful. The type oftraining that you provide is one indicator of the orientation of your efforts to create a qualityculture. Training or other activities that focus directly on changing people’s attitudes willcreate short term changes.
(f) Elimination of Blame: Blaming individuals does not solve the problems, it simply createshostility. If we continue to blame people, we will create a situation in which we will beunable to solve problems because individuals will be fearful of identifying, describing orworking on problems. Uncover the root causes of problems. Be consistent in assigning the faults. Less blame oriented approach.
10. Quality Efforts: Quality council or steering committee should be appointed to lead thequality efforts. Top management to review periodically the status of quality and action taken. Steering committee should also review the results of performance on periodic basis. Steering committee should set the quality improvement groups. Committee should set the priorities, top priority should be to satisfy customer. Review the product deficiencies, cost of poor quality and quality culture.
11. Purchase Quality Control: An operating system and procedure for assuring quality ofmaterials, equipment and spares, source selection, evaluation and development to meet allquality requirement consistently and includes proper packaging, handling, storage and issue.The same is applicable while sub contracting for any materials / work. Control of purchasedinventory forms is an integral part to achieve the above. The relation between vendor andvendee has to make use of principles enunciated for assurance of quality.
12. Process Quality Control: It is necessary to introduce process quality control philosophy inorganization. It means to check the process or product during production not after theproduction. The key points are: To determine true quality characteristic for own process/outputs. To determine the measurement methods, To have proper, common understanding of errors, defects and deviations, To expose latent deficiencies and observe quality statistically, and To arrive at and maintain standards as well as review / revise and improve them.
13. Monitoring Progress towards Goals and Quality Audit: The results with respect to eachgoal must be measured regularly. Top-management must assign this responsibility for actionso that goals/objectives can be met economically. It includes: Progress measured against documented goals/objectives. Results review and prompt corrective action to be taken. Performance results highlighted.
Quality Audit means to study the quality of a given product by taking samples fromtime to time either from within the company or from the market place. It checks the quality ofthe product to see if the requirements of the consumer are satisfied. If any defects, are

discovered, they are corrected which increase the product’s attractive quality. The latest trendin quality auditing is to engage in a total quality audit which studies the entire managementsystem. There are three ways for conducting quality audit in any organization: To be conducted by the corporate as well as by persons from other units. To be done internally by division/departments, and To be done by a consultant.
14. Motivation through Non Monetary and Monetary Reward: Recognition is a strong non-monetary incentive to adapt changes. Recognition must be in a form that is valued by theindividuals being recognized. One of the most powerful forms of recognition is the activeand personal participation of top-managers in the review, discussion, and implementation ofresults on which other individuals have worked. There shall be separate system for financialreward/incentives for contribution to quality.
15. Quality Circle Activities: Quality circle activities are to be carried out only as a part ofTQM activities, to sustain the movement at work place. The outstanding features of thequality circles are: Humanizes the work ie. Quality of work life is stressed and improved. Brings out extraordinary qualities from ordinary people. To display the human capabilities fully and eventually draw out infinite possibilities.
12.7.1 Operational Model of TQM:Operational Model of TQM provides a very different view - point of management style. The
corner stone of TQM are total participation and teamwork. Earlier such participation and team workwas initiated through quality circles suggestion schemes and quality improvement teams. Currentlythe focus is more on self-motivated and self-empowered teams comprising multi-skilled workers.
Another dimension of the Operational Model of TQM as depicted in Figure 12.5 is thecontinuous quality improvement (through various quantitative tools), innovations as per customerwants and needs.
Figure 12.5 Operational Model of TQM
At the apex of the model is the support and commitment of top management towards theultimate aim of customer satisfaction. Without the sustained support of management the TQM effortcannot be made operational.
Total QualityManagement
Syestem
Management Support andCommitment towardsCustomer Satisfaction
EmployeesParticipation &
Self-Empowered TeamsContinuous Quality
Improvement and Innovations

At the centre of model is the total quality management system (QMS) which incorporate to issuessuch as quality assurance, quality planning, quality control, Quality policy, manual documentationand information on quality related matters.
12.8 Quality Initiatives and Benefits
The benefits of TQM include:
The minimization of waste.
Increased customer satisfaction and, therefore, additional sales.
The ability to redeploy resources to add real value.
The achievement of competitive advantage. Companies are increasingly competingon the basis of quality products and services, and
Focusing attention on continuous improvement.
Overall, the process of developing a TQM culture can increase involvement, identificationand commitment. The experiences of successful TQM oriented companies show that the integrationof key business requirements is achieved by following a set of core values and concepts.
Focus on results;
Employee participation and development;
Build-in prevention and reliability;
Customer - driven quality in products and services;
Supply chain quality;
Continuous individual and organizational learning;
Management leadership in quality initiatives;
Long - term vision, planning, and commitment; and
Fast response to market and customers.
The boom in the Indian economy has seen a proliferation of goods. Whether it is automobilecomponents, machines, or textiles, the costs are lower and quality is comparable to best worldwide.The examples are Infosys, Wipro, TCS, and Satyam in software; Sundaram Fasteners and BharatForge in Manufacturing; and a plethora of companies in textiles. According to Natrajan (1999) thequality evolution in post independent India followed the following stages:
Inspection of products in factories and receiving departments.
Statistical Quality Control and sampling plans.
Process quality control in manufacturing industries.
The ISI mark was recognized as a quality standard for products.
ISO 9000 certification for manufacturing.
ISI 9000 certification for service industries
Kaizen for continuous quality improvement.
Quality circles for management of quality.
Juran and Crosby methods for TQM.

12.9 Summary
Quality offers organizations significant opportunities for improvement, including reducedcosts, increased sales, better performance schedule, and more satisfied customers. A successful qualitysystem does more than ensure the quality of products and services; it drives vigorous operations andleads to a healthy bottom line.
Total quality management provides the overall concept that fosters continuous improvementin an organization. It emphasizes upon a systematic, integrated, consistent, and organization - wideperspective that involves everything and everyone. In other words, TQM is an important element ofcorporate culture that represents a vision as well as some behavioural patterns shared by all themembers of the organization. The total quality management process is not simply a new set ofbuzzwords on this week’s quality slogan. TQM emerged is the result of pioneering work by Deming,Juran, Shewhart, Feigenbaum, and other. The TQM process gained acceptance in the United Statesduring the 1980s, and the TQM quality revolution is continuing to develop in world. The termsquality assurance and quality control are used interchangeably. Quality assurance refers to all theplanned and systematic activities implemented within the quality system. It evokes confidence that aproduct or service will fulfil requirements for quality. Quality control refers to all measures thatensure that all the equipment, processes, and personnel within an organization adhere to rules thatmaintain the required level of quality from the first to the final stage of production. Quality planningconstitutes determining the needs of those customers and optimizing the product features so as tomeet the customer’s needs.
In TQM, it is not just products, process, customers and employees but it is entire gamut oforganizational activities. Key concepts of total quality management are management commitment toquality, focus on customer requirements, preventing rather than detecting defects, universal qualityresponsibility, quality measurement, continuous improvement, employee involvement &empowerment, team work, statistically thinking, benchmarking, value enhancement, recognitionand rewards, and the quality delivery process.
Quality vision, quality policy, quality strategy development, quality goals setting, functionalresponsibilities and delegation, information sharing, building Quality culture, purchase quality control,process quality control, monitoring progress towards goals, quality audit, quality circle activities,customer satisfaction, and employee motivation, are some elements to be considered whileimplementing TQM. Organizations such as the International Organization for Standardization (ISO)and Bureau of Indian Standards (BIS) set standards of quality for products and organizations.
12.10 Self Assessment Test
1. What do you understand by quality? Which definition of quality you like best and why?
2. How do you define TQM? Explain operational model of TQM.
3. “Quality should be aimed at the needs of the consumer, present and future” explain and alsoput light on the evolution of TQM.
4. What do you mean by the terms “Quality Assurance”, “Quality Control” and “QualityPlanning”? Is there any relationship between these? Explain
5. Describe the various key elements of TQM with suitable examples.

6. If you are required to implement the TQM in your organisation, write down the various pointrelated to this.
7. What in your opinion should be done to change the mindset of Indian Industry regardingTotal Quality Management?
8. What factors should be kept in mind while implementing TQM in an organisation?
12.11 References
Roberta S. Russell, Bernard W. Taylor III (1995); ‘Production and Operations Management’; PrenticeHall, New Delhi.
Suresh Dalele, Saurabh (1999); ‘ISO 9000: A Manual for Total Quality Management’; Sultan Chand& Sons, New Delhi.
N. Logothetis (1997); ‘Managing for Total Quality: From Deming to Taguchi and SPC’; PrenticeHall of India, New Delhi.
Rajesh Kumar Shukla (2006); ‘Total Quality Management’; New Royal Book Company, RevisedEdition, Lucknow.
Joseph & Susan Berk (1995); ‘Total Quality Management: Implementing Continuous Improvement’;Excel Books, New Delhi.
Parag Diwan (1997); ‘Quality in Totality: A Manager’s Guide to TQM and ISO 9000’; Deep & DeepPublications, New Delhi.
N. S. Sreenivasan, V. Narayana (1996); ‘Managing Quality Concepts and Tasks’; New AgeInternational Publishers, New Delhi.

Unit - 13 ISO : 9000Structure of Unit:
13.0 Objectives
13.1 Introduction
13.2 Genesis of ISO : 9000
13.3 Terminology
13.4 ISO : 9000
13.5 ISO : 9000 Series Standards
13.6 Elements Applicable to ISO : 9001, 9002, & 9003
13.7 National Efforts in India
13.8 Summary
13.9 Self Assessment Test
13.10 References
13.0 Objectives
After completing this unit you would be able to:
Understand the concept of quality standards;
Know in detail about ISO : 9000 standards;
Explain the genesis of ISO : 9000 standard series;
Differentiate between the usage of ISO : 9001, 9002, 9003 and ISO : 9004 codes;
Enhance the understanding regarding elements applicable to ISO : 9001, 9002, 9003;
Draw road map about national efforts done in India regarding IS standards;
Examine the need of IS : 14000 in Indian business environment;
Point out various quality standards like ISO : 9000, IS 14000, EN 29000 and BS 5750.
13.1 Introduction
Liberalization of economy, opening up the trade barriers, the gradual integration of localmarket into a global environment, the internationalization of engineering and IT activities and globalaccess to knowledge and information have all contributed to a growing appreciation of QualityRequirements and Assurance in all Business Activities. To survive and remain competitive in globalmarket, goods/services offered should not only be of high quality, but also be reliable, safe, energy-efficient, environment friendly and cost-effective. Ability to produce quality goods and services andto sustain them over a long period of time requires implementation of quality standards or systemsapproach (ISO 9000 Series of Quality Systems). Regional and International Standards in QualityMeasures and Assurances like ISO 9000 series of Quality Systems monitor and ensure quality at allstages of manufacturing/production cycle (e.g. material selection-design-process selection-fabrication& assembly-testing-packaging–marketing)
Now Europe Corporations (EC) from world over (be it from the US, Japan or anywhere else)

will be expected to adhere to ISO 9000 registration. The U.K. has already taken an initiative in thisdirection and more than fifteen thousand British Companies have already been assessed and foundconforming to ISO 9000 standards. It is clear that purchasing power of EC is huge and Indian exporterscan ill afford to be silent spectators to the changing scenario in the EC market.
In the Indian market context, India has no product/service liability law that binds vendors toproduce reliable and safe products/services therefore, perhaps ISO 9000 can prove to be a precursorto advent of product liability laws in India. Further, ISO 9000 also brings in economy is its wake.This is due to the fact that systems in the company adopting ISO 9000 will be controlled from startto finish resulting in economies in resources and time spent on preplanning or modifying processesand designs.
The idea of ISO 9000 certification is slowly gathering momentum in India also. Bureau ofIndian Standards (BIS) has done considerable spade work and has got a number of personnel trainedin ISO 9000 assessment and certification. The challenge to a developing nation like India is tomotivate its manufacturers and service providers to adopt and implement these standards, and toestablish a credible national quality registration system which will be recognized and be acceptableto its trading partners.
13.2 Genesis of ISO : 9000
Q = Quality G = Guidance I = Inspection System
Figure: 13.1 Genesis of ISO : 9000
The roots of ISO : 9000 can be traced to the defence procurement philosophy prevalent in theNorth Atlantic Treaty Organization (NATO) in the 1950s and 1960s and which by 1970s spread tocommercial establishments also. Beginning in the 1950s the defence procurement establishment ofthe North Atlantic Treaty Organization (NATO) stressed on the concept to make suppliers and
US Military Specification
Allied QualityAssurance Publication
Defence Standards
BS5750 1979Pt1 (Q) Pt2 (I) Pt3 (I)
Pt 4 (G) Pt 5 (G) Pt 6 (G)
ISO 9000 Series 1987National Standards
ISO 9004
EN 29004
IS 14000
ISO9001 9002 9003
EN29001 29002 29003
IS14001 14002 14003
G G G
05/21(Q) 05/24 (I) 05/29 (I)
:
:
::
:
:

contractors more aware of their responsibilities in meeting the required quality and to achieve a cost-effective approach to large defence projects and requirements.
The supplies of NATO in the 1950s and 1960s were as per the U.S. Military specifications.These were then in consonance with Allied Quality Assurance Publications (AQAP) and werecomplying with Defence Standards of Ministry of Defence of the UK such as 05/21, 05/24 and 05/29. From these defence standards, BS5750 (1979) Part1, 2 and 3 were developed. These were muchbroader than the military specifications and hence were generally applicable. Later to BS5750 (1979)were added Parts 4, 5 and 6 which gave explanatory and non-mandatory notes.
The ISO 9000 series was developed by a technical committee working under ISO in Geneva.The series took several years in the making and was an outcome of previous work of military standardsin World War II and the British Standards Institution’s BS5750 series Part 1 to 6. In 1987, ISOpublished the ISO 9000 series. This series is a family of quality management and quality assurancestandards. This family consists of 17 different standards out of which only ISO 9001, ISO 9002, andISO 9003 are quotable standards (i.e., can be audited against) while the rest only guidelines.
13.3 Terminology
1. Quality Policy: ‘The overall intentions and direction of an organisation as regards quality, asformally expressed by top management’ (clause 3.1, ISO : 9000). It ultimately forms the keyelement of corporate policy.
2. Quality Management: ‘That aspect of overall management function that determines andimplements the Quality Policy’ (clause 3.2 ISO : 9000). It is also experienced by QualityConsultants that ‘Quality Management is not separate from general management. When usedeffectively, Quality Management should be an integral part of an organization’s overallmanagement approach’. That approach is designed to produce quality results for the customer.
3. Quality System: ‘The organisational structure, responsibilities and authorities, procedures,processes and resources for implementing quality management’ (clause 3.3 ISO : 9000). Thequality should only be comprehensive as needed to meet quality objectives.
4. Quality Control: ‘The operational techniques and activities that are used to fulfillrequirements for quality’ (clause 3.4 ISO : 9000). Quality Control is a very broad concept.When referring to a sub-set of Company-Wide Quality Control, company should use modifyingterms such as ‘Manufacturing Quality Control’.
5. Quality Assurance: ‘Includes all those planned and systematic actions necessary to provideadequate confidence that a product or service will satisfy given requirements for quality’(clause 3.5 ISO : 9000).
The purpose of quality assurance is to provide approximate confidence that a productor service will satisfy specific quality requirements. The purpose of quality-assurance systemis to prevent problems form occurring, detect them when they do, identify the cause, remedyfor the cause, and thus prevent re-occurrence. The basics (principles) of a quality system areto say what you do, do what you say, record what you did, check the results and act on thedifference. But according to ISO : 8402 Quality Management and Quality Assurancevocabulary Quality is defined as ‘the totality of characteristics of an activity that bear on itsability to satisfy stated or implied need’.

6. Quality Objectives: ISO : 9000 describes an organization’s three basic quality objectives.Each organisation should:
Achieve and sustain the quality of the product or service produced so as to meetcontinually the purchaser’s stated or implied needs.
Provide confidence to its own management that the intended quality is being achievedand sustained.
Provide confidence of the purchaser that the intended quality is being or will beachieved in the delivered product or service provided.
7. Basic Definitions of Three Commonly Used Key Terms:
The Supplier in the organisation is providing a product to the customer. In a contractualsituation, the supplier is the producer, i.e. everybody can be a supplier.
The Purchaser is the recipient of product or services delivered by the supplier.According to revised version of the ISO : 9000 series standard plans to use the term
Customer rather than Purchaser.
The Sub-contractor in the organisation provides products/services to the supplier. Itis interesting to note that an organisation by itself can be a supplier, a purchaser anda sub-contractor at the same time.
13.4 ISO : 9000
The International Organisation for Standardization (ISO), headquartered in Geneva,Switzerland is a federation of national standards organizations for more than 91 countries. The ISOmember for the India is the Bureau of Indian Standards known as BIS.
The objective of ISO is to promote the development of standardization and related activitiesin the world with a view to facilitating international exchange of goods and services and to developcooperation in the spheres of intellectual, scientific, technological and economic activities.
The ISO : 9000 series of quality management and assurance standards, developed by theISO/TC 176 Committee over a period of seven years and first published in 1987, consists of foursubsections, ISO : 9001, 9002, 9003 and 9004.
Table 13.1 Quality System Standards
ISO : 9000 series sets out implementable methods in an organization that assure that thecustomer’s requirements are fully met. It comprises of documented system, invokes total company
ISO IS (Indian Standards)
EN (European Norms)
TITLE
9000 14000 29000 Quality Management & Quality Assurance Standards - Selection & Use
9001 14001 29001 Model for Quality Assurance in Design/Development, Production, Installation, Servicing - all elements.
9002 14002 29002 Model for Quality Assurance in Production & Installation
9003 14003 29003 Model for Quality Assurance in Final Inspection & Tests
9004 14004 29004 Guidelines and Development of Quality Management Systems to Minimize Cost & Maximize Benefits.

involvement, and also acts as a basis for effective management control. ISO 9000 is significantlydifferent from normal engineering standards, such as units of measure, product specification, testmethods, etc. set by agencies such as the Bureau of Indian Standards (BIS). ISO 9000 standardsrequirements are complementary and not an alternative to these engineering standards. Companiesshould, however, consider implementing ISO 9000 as the first milestone along the path of TQM andquality excellence. The five basic objectives of ISO 9000 are:
To achieve, maintain and seek continuous improvement in product quality.
To improve the quality of operation on continuous basis in order to meet customers needs.
To provide confidence to internal management and employees that quality requirements arebeing fulfilled and that improvement is taking place.
To provide confidence to customers and other stake holders that quality requirements arebeing achieved in the delivered product.
To provide confidence that quality systems requirements are fulfilled.
13.5 ISO : 9000 Series Standards
ISO : 9000, the first standard in the series, titled Quality Management and Quality AssuranceStandards for Selection and Use, is actually a guide for using the other four standards in the series,9001, 9002, 9003 and 9004. One thing that has to be kept in mind about the ISO: 9000 series ofstandards that they don’t prescribe any readymade answers to quality problems in organizations.What the standards do instead, is to prescribe the basic requirements that must be present if a systemis to be considered superior, and capable in the first place, of consistently delivering to the customerwhat the organization has promised.
ISO : 9001, Quality Systems - Model for Quality Assurance in Design/Development,Production, Installation, and Servicing, is the standard with the widest scope of application.It applies to those instances where a supplier has responsibility for the design and development,production, installation, and servicing of a product. This standard includes a set of genericrequirements for the quality management system of the supplier, beginning with topmanagement responsibility and providing objective criteria to verify that key elements in thetotal quality management approach of the supplier are present. For example, ISO 9001 specifiesminimum requirements for contract review procedures, design and process control, inspection,testing, etc. This standard also requires a documented system for the identification of testedproducts, the control of nonconforming products, and procedures for taking corrective actionto avoid repeating nonconformance in processes. It further defines requirements for producthandling, storage, packaging, delivery and includes requirements for conducting internalquality audits to verify the effectiveness of the quality management system.
ISO : 9002, Quality Systems - Model for Quality Assurance in Production and Installation, isvery similar to ISO 9001 except that it is limited to cases where the supplier is not responsiblefor design, development, or servicing of the product. For a supplier that only produces andinstalls a product, ISO 9002 assures the customer that the supplier’s quality system forproduction and installation meets basic requirements.
ISO : 9003, Quality Systems - Model for Quality Assurance in Final Inspection and Test, islimited to cases where product design and installation is less relevant because of the relative

simplicity of the product. As such, this standard is limited to providing guidelines for finalinspection and testing. ISO 9003 gives a customer assurance that a supplier’s final inspectionand test area has quality system elements that guarantee the integrity of data about the qualityof the product and actually reflect the quality of the product the customer is receiving. Thisstandard shifts responsibility for quality to the supplier in that if the supplier’s inspection andtest process complies with ISO 9003, the customer is assured of that quality standard or levelof quality when the product is received. Thus, it is not necessary for the customer to repeatthe inspection and test process that the supplier has already done. The supplier simply providesthe customer with the inspection and test data for the product.
13.6 Elements Applicable to ISO : 9001, 9002, and 9003The scope of the requirements is presented in Table no. 13.2 and describtion below:
1. Management Responsibility: The standard suggests that management responsibility willonly then be evident if the organization has enunciated a quality policy, which is documented,and is understood by all in the facility. Furthermore, the responsibility and authority of allthose who manage, perform or verify work affecting quality, apart from being defined mustalso ensure that all such people have the requisite freedom to function in a manner thatupholds quality.
Table 13.2 Elements Applicable to ISO : 9001, ISO : 9002 and ISO : 9003
* = ApplicableNA = Not ApplicableThe first requirement also encompasses the appointment of a management representative
S. No. Elements ISO 9001 ISO 9002 ISO 9003 1 Management Responsibility * * * 2 Quality System * * * 3 Control Review * * NA 4 Design Control * NA NA 5 Documents Control * * * 6 Purchasing * * NA 7 Purchase, Supplied Product * * NA 8 Product Identification & Tracetability * * * 9 Process Control * * NA
10 Inspection & Testing * * * 11 Inspection, Measuring & Test Equipment * * * 12 Inspection & Test Status * * * 13 Control of Non Conforming Product * * * 14 Corrective Action * * NA 15 Handling, Storage, Packing & Delivery * * * 16 Quality Records * * * 17 Internal Quality Audit * * NA 18 Training * * * 19 Servicing * NA NA 20 Statistical Techniques * * *

who will ensure that the international standard is implemented and maintained. On the wholethe organization’s systems are to be regularly reviewed by senior management to ensure thatit is being implemented as it should.
The involvement of senior management in the creation and the subsequentimplementation and maintenance of the system is absolutely essential. The standard by making‘management responsibility’ a mandatory requirement insists upon ensuring that the modicumof management involvement and support is discernible in the organization. It is obvious thatwhat the standard insists upon is merely the ‘bare minimum’, and an enterprise wishing totouch a level of quality that is truly world class, has to go much beyond the minimumrequirements of the standard. In total quality organizations, the support of management hasto come in word and deed, and consistently.
2. Quality System: The standard requires that a documented quality system will be maintainedin order to ensure that the output (product or service) of the firm conforms to specifiedrequirements. The emphasis is on a documented system consisting of the following tiers ofdocuments:
A quality manual, at the division/corporate level which provides a ‘bird’s eye view’ of thequality system.
Procedures that are so written down that the questions: what for, When, by whom, whereand what? about the system are unambiguously answered. The objective of having proceduresis essentially to detail the appropriate methods of going about something, ensuring that theright personnel, who are trained and qualified for the tasks, do them. And in a manner thatcontributes to the production and delivery of consistent output.
Work instructions which are, as the name suggests instructions to people and whichexplain the ‘how’ of the system, and its functioning.
Together the documentation is supposed to serve as a useful way of summarizing theorganization’s qualtiy programme, while at the same time indicates the linkages that people,processes, and procedures need to maintain for consistently delivering to the chosen customersthe promised output.
3. Contract Review: This requirement of the standard mandates that any agreement on part ofthe customer and the supplying firm, based on the latter’s promise to provide a certain outputto the former, must be established carefully. The standard insists that the requirements of thecustomers be carefully scrutinized, assessed from the standpoint of being sufficiently detailed,unambiguous, and finally, within the ambit of the firm’s process capability. Only when thesystem ensures that such a systematic review of the customer’s requirements has taken place,is the supplier firm likely to be able to deliver what the customer wants right the first time.And that is what any total quality organization definitely must ensure.
4. Design Control: This clause pertains to the need for having a proper system whereby thevoice of the customer is adequately translated into practical designs, capable of being producedby the operating units, and thereby guaranteeing the satisfaction of the user. This standardinsists upon having documented systems in place that go through a sequential step by stepapproach covering the following:
Planning of design and development.

Assigning the ‘translation’ to qualified staff, and ensuring that organizational and technicalinterfaces are clear to all for the free flow of pertinent information.
Preparing a design brief relating to the requirements of the product or service (designinput)
Preparing comprehensive technical data that confirms that the product will function as it ismeant to, while simultaneously also conforming to the safety and other regulatory requirements(design output).
Verifying that the design outputs ‘meet’ the design inputs.
Making sure that any changes in design are suitably made with the prior approval ofcompetent agencies, so that the customers’ interests in receiving an effectively designedproduct are not jeopardized.
5. Document Control: This standard emphasizes that the documentation pertaining to themaintenance of the quality system must be adequately controlled, so that at any given pointin time, only the most up-to-date issues are in use and utilized by all those who are meant torely on them in the course of their work. This necessitates having a suitable track of who getswhich documents, and how amendments are made to them. Initially, the importance of thisdoes not dawn upon many of us. However, it is fundamental to the process of effective shop-floor based communication. The success of any quality system can be adversely affected bythe lack of proper document control.
Computerization, and the advent of Information Technology has made it possible tohave ‘real-time’ control on documents which are not hard copies, but ‘screens’ on PersonalComputers (PCs). However irrespective of whether the documents are hard copies or oncomputer, the control that is required must exist.
6. Purchasing: From the point of view of the standard, what needs to be ascertained withrespect to purchasing is that all purchased material that has a direct bearing on the quality ofthe product or service that is being rendered to the end-user, conforms to the requirements ofthe customer. The requirements of the customer, of course, are expected to have been dulyand faithfully incorporated into the organization’s very own criteria for evaluating purchasedproducts.
It is also expected that rather than merely relying on the inspection and testing ofincoming material, the organization also assesses its suppliers in terms of their quality systems,and other relevant parameters, so that there is confidence in the suppliers’ ability to producewhat is expected of them, and that relevant records of material purchases are kept so that it ispossible to actually determine whether the incoming material is as desired by the customer.Under many circumstances it is to be allowed to have the customer or his representativeverify if the purchased material is as desired.
7. Purchaser - Supplied Product: In the language of the standard, the organization that suppliesthe product or service to the user, is the supplier, while the customer or the recipient of theoutput of the supplier is the purchaser. This usage is consistent in all the standards under ISO9000.
The standard makes a provision for the control of material that may be supplied bythe customer for use in the final product that is ultimately to be used by the very same customer.

There are countless examples of this kind in industry. For instance, the manufacturer ofboilers is asked to make a boiler for use by a steel tube making firm. The customers in thiscase also insist that they themselves will supply the boiler tubes of the appropriate sizes forfitment in their boiler. Under these circumstances it is mandatory from the standpoint of thestandard to ensure that there is a system in place to ensure that the material supplied issuitably stored, verified and maintained in the right manner for incorporation in the product.
8. Product Identification and Traceability: This is not a mandatory requirement in the standard,but it is emphasized that wherever appropriate, the producing firm must have in place asuitable system whereby materials, right from the raw materials to final delivery stages (ifpossible) must be uniquely identifiable and traceable. This ensures that there are means withinthe organization where quality issues can be worked upon ‘backwards’ and the relevant causesidentified and permanently rectified. Traceability and identification also come in very handyfor Original Equipment Manufacturers (OEMs) who may use sub-assemblies made by anotherproducer, and who can only get to the root causes of a customer complaint if they can go rightback to the various streams of production - at their premises as well as in those of theirsuppliers. It is with this in focus that the standard expects that individual products or batcheswill be uniquely identified.
9. Process Control: The standard also emphasizes, by making it mandatory for the producingfirm to ensure that only those processes be relied upon for producing the product, that havebeen brought under control, and which are also operated under controlled conditions. Ensuringcontrolled conditions would also need that documented work instructions exist, which aremeticulously followed by the available staff because the absence of such discipline willadversely affect the quality of the output. Furthermore, it would be expected that there is alsoa reliable means of monitoring and controlling process and product characteristics, andworkmanship standards for those levels of quality that rely on the skill of the operators.
For certain special processes, which the standard defines as those where the resultscannot be fully verified by subsequent inspection and testing, or where processing deficienciesmay become apparent only when the product is in use, certain precautions need to be taken.The precautions include compliance with the conditions required for ‘normal’ processes, aswell as continuous monitoring and assessment of adherence to the documented procedures.This would ensure control in the case of special processes. Typical examples of specialprocesses include welding, heat-treatment, cooking food, plastic molding.
10. Inspection and Testing: Systems need to exist in order to effectively inspect and test materialsused within the organization, at various stages in the process. The standard especially prescribesthat Receiving Inspection and Testing (I & T), In-process I & T, and Final I & T, be conductedto verify that the material at each stage is conforming to specified requirements. As with allother requirements in the standards, it is expected that the inspection and testing routineswill be conducted in accordance with written-down procedures, and a quality plan specifyingthe frequency and manner of inspection. It is emphasized that no material shall be shippedout until the activities specified in the quality plan and the documented procedures have beencompleted satisfactorily. Suitable records have got to be maintained to demonstrate that theproduct, prior to dispatch, passed the laid-down inspection and test criteria for acceptance.
11. Inspection, Measuring and Test Equipment: All equipment that is used for inspection,

measuring or testing any attributes of the product, need to be suitably controlled andmaintained. This is irrespective of whether the devices used are owned by the organizationitself, or whether they have been taken on loan or used at the premises of another agency(such as a subcontractor). This is to ensure that the measurement uncertainty is known and isconsistent with the required measurement capability.
To achieve this organization will have to identify and monitor those measurementsthat have an impact on the quality of the final product, and accordingly choose the equipmentthat will be used for the purpose. The equipment chosen would then need to be calibrated atprescribed intervals, against certified equipment capable of measuring the same variablesand having a known valid relationship to nationally recognized standards. The control ofsuch equipment in the manner of handling, use and storage, would need to be assured tosafeguard the accuracy and the fitness for use of the equipment. Records would also need tobe maintained to ensure that regular verification of the status of equipment is possible.
12. Inspection and Test Status: There are only three conditions in which material that are subjectto inspection and testing is likely to be classified, and these are:
Awaiting inspection or test
Passed requirements of inspection or test
Failed requirements of inspection or test
The standard advocates that either condition or the status of the material be suitablyidentified using tags, labels, stamps or any other reliable means, so that there is completeclarity about the condition of the material. If the inspected and tested material is foundacceptable for shipping out to the next process, or the subsequent user, the ‘status indicators’must clearly show this.
13. Control of Non-Conforming Product: Care has to be taken to ensure that the system has abuilt-in check to prevent the inadvertent use of material that has been found to be non-conforming. This requires that the system ensures adequate control in the identification,documentation, segregation and disposal of the non-conforming product. The system alsorequires that all concerned be informed of the manner in which the disposal has been effected.The disposal of the non-conforming material may, however, is effected in either of thefollowing ways:
Reworking it to meet the specified requirements.
Accepting with or without repair by concessions.
Re-grading for alternative applications.
Rejecting or scrapping
Information to the customer is sometimes required to be given in the event of thenon-conforming material being used after suitable changes, such as re-work and the like.This is especially so if it is also specified in the contract between the supplier and the purchaser.
14. Corrective Action: This clause in the system enables the organization responsible for thesystem to take the needed corrective action in the event it is found that somewhere the systemis not functioning in a manner that contributes to customer satisfaction. The standard thereforerecommends, as a mandatory requirement, to having in place of procedures whereby general

guidelines exist for improvement actions to be undertaken in all areas covered by the system.The objectives, of course, would be to eliminate the causes of non-conformance by initiatingsystematic investigations, analyses, diagnoses and the ultimate remedy of root causes. Theprocedures are essentially to ensure that once the corrective actions have been implementedthe new work ‘regimen’ is documented to prevent a recurrence of the old problem.
15. Handling, Storage, Packaging and Delivery: It is often ignored, but a great deal of damageto products occurs outside the production premises, while the product is either in transit, or iswaiting in a warehouse to be shipped further. This clause of the ISO: 9001 standard focuseson the need for having systems that assure the customer of receiving quality, extending tothose locations where the material might otherwise be prone to deterioration or damage. Forthis it is mandatory for the supplier to develop a documented system that prevents the damageor deterioration of the material. The material is also expected to be stored in secure storageareas, prior to shipment to the customer, again to prevent damage. The packaging of theproduct is also done in such a way that, apart from protecting the product, it also conforms tonational/international codes of practice.
16. Quality Records: It is important to have well-organized and easily retrievable records inorder to provide objective evidence that the work in the organization is being done inaccordance with documented procedures. The standard relies entirely on the presence ofrecords to demonstrate that the system, as designed, is actually functioning in that manner.The records need to be compatible with the product to which they pertain, besides being keptneatly and well organized, either in manual or other storage systems, so that they are quick toretrieve. The records need to be retained for predetermined lengths of time, which againneeds to be specified and then documented, in order to have uniform adherence to the system.
17. Internal Quality Audits: To ensure that the documented system is in place and being followed,it is mandated that comprehensive audits shall be periodically carried out by trained personnel,internal to the organization. This would be over and above the regular reviews that thesupplier’s management is expected to institute, in order to determine the effectiveness of thesystem. The reliance on frequent and systematic audit is the only way to ensure compliancewith the written-down procedures. Non-compliance with the system is to be brought to theattention of the ‘head’ of the audited system, so that suitable corrective action may be taken,to restore the effectiveness of the system.
18. Training: For all those whose work affects the quality of the output, it is mandatory to spellout the qualifications clearly, in addition to ensuring that the following actions take place ona regular basis:
Identification of training need
Regular training, in the areas identified
Maintaining the relevant records of training
The training also assures that the people involved in the system are capable of followingthe written-down work instructions, and have the requisite expertise to do what is expectedof them right the very first time.
19. Servicing: Wherever servicing is a part of customer requirements, it is mandatory to haveprocedures that ensure that these are met. The servicing system is quite likely to include

some or all parts of the total quality system such as design, process control, training andalthough the focus will be on providing the appropriate resources to get the servicing done asdesired by the customers.
20. Statistical Techniques: This is the last clause of the standard. It is relevant where the processesof production have to be in a state of statistical control, and where detailed knowledge of theprocess is needed to deliver the desired output. Where these conditions exist, written proceduresneed to be in place that will help in the analysis and the verification of process variables.Essentially, what is required is the use of the right tools that help in analyzing data andquantitative information, so that processes are always in a state of control.
A closer scrutiny of the clauses of the ISO: 9001 standard indicates that the focus is onensuring that there is a documented system that exists for all those important aspects of the organizationwhereby consistency in the output is assured. The clauses together form the backbone of a set-up thatassures consistency in operations and an overall control of the pertinent processes. If an organizationconforms to the standards, it implies that it has a suitable documented system in place, which is alsobeing meticulously followed.
ISO : 9004, Quality Management and Quality System Elements - Guidelines, provides generalguidelines for developing and implementing the kinds of quality management systems required inISO 9001, 9002, and 9003. It considers management responsibility, principles of quality systemdevelopment, system structure, auditing, and system review. In general, these guidelines andsuggestions are aimed at helping management develop an affective quality management system sothat their companies can be qualified to meet ISO : 9001, 9002 and 9003 requirements. In 1991 theTechnical Committee added a second part to ISO : 9004, providing special attention to qualitymanagement in the service sector, since, as already mentioned, the original ISO : 9000 series focusedalmost exclusively on the manufacturing sector. However, the ISO : 9000 standards can generally beapplied to the service sector by making such simple modifications as substituting terms, such asprocess for production and service for product.
The ISO series standards do not tell management how to meet requirements; rather theysimply indicate what is required. For this reason the ISO : 9000 documents are not very large. Thestandards are designed to be user friendly. They are generic in nature and follow a logical, easilyunderstood format. For example, ISO : 9001 and 9002 contain only seven pages of text and 9003 hasonly two pages. As each company is unique and there may be different level of preparedness toimplement the standards. In general, larger companies tend to use ISO : 9001, and smaller companiestend to use 9002, since smaller companies are not as frequently involved in the product designprocess. Also in some cases, smaller companies do not feel they can attain the type of pervasive totalquality system required by ISO : 9001.
ISO : 9000 is both an opportunity and a challenge to developing nations. They now knowwith a good degree of certainty the level of quality that purchaser expect and can learn the prerequisitesand characteristics of a good quality assurance and management system.
13.7 National Efforts in India
In July 1991, the Government of India made an important strategic and political commitmentto move towards a market oriented economy with particular emphasis on the achievement ofinternationally accepted standards of quality in manufactured and exported products. The Central

Government announced the export policy in April 1992 introducing a scheme to recognize andsuitably reward manufacturer who acquire the ISO 9000 series which are equivalent Indian IS 14000standards. Presently, such manufacturer will be eligible to receive benefits related to the grant ofimport licenses.
In May 1992 Prime Minister launched a nation wide programme on quality awareness and aschedule compassing to reach out to 54 cities in all the states and union territories to spread themessage. State Governments were to be encouraged to launch the movement in their respectivestates particularly in small scale and handicrafts sectors. To match the requirement of the industrywhich is expected to gain an impetus by such moves, a national scheme of certification is required tobe a place. The objective of this scheme would be following:
To provide criteria for certification bodies to certify quality management systems (ISO 9000/IS 14000) and products.
To provide criteria for training organizational personnel on quality management perspective To provide criteria for certification of test and calibration laboratories. To oversee the national quality campaign and the national information enquiry service. In
most countries where such a scheme does operate, there is usually formed an apex umbrellaorganization of a national structure with the objective of promoting the establishment of atransparent, efficient and internationally recognized accreditation system for the regulatedand voluntary area of certification. i.e. in the UK it is the National Accreditation Council forcertification bodies and in Germany this the German Accreditation Council. A similar councilwith a support structure acceptable internationally has been setup in India.Basic Requirements for ISO : 9000 Certification: The following are the basic requirements
for ISO 9000 certifications:(a) Documentation: Write down everything that has to be done and develop required
documentation of procedures for carrying out any activity in the operation.(b) Performance: Use the documentation as a working tool by doing everything that is written.(c) Verification: Verify that in all cases, the accepted written procedures are respected by all
parties concerned.(d) Filling: A written trace of all procedures should be retained, kept updated and be available to
all persons concerned to certification by an independent third party. It can take up to twoyears to obtain certification and the cost could be quite high. Re-certification is requiredevery three years. Individual departments or divisions not entire organization must achieveregirstration individually and all costs are borne by the applicant. Bureau of Indian Standards(BIS) is also issuing the similar certificate as presented in (Table – 14.3).ISO : 14000: In 1996, series of standards of ISO 14000 was established in order to achieve
the environmental objectives of the organisation. This provides an ‘environmental managementsystem’ to industries. ISO 14000 includes 20 separate standards covering from environmental labelingand assessing the life cycle of products. This is based on six principles:
Organisation should define an environmental policy. Organisation must prepare a plan to achieve its policy. Organisation must provide all necessary support in order to achieve the environment policy. Organisation should monitor and evaluate its performance.

Organisation must ensure commitment towards environmental management systems. Organisation must adopt new strategies for its improvement on continuous basis.
ISO 14000 does not require third party registration but the organisation will have to be certifiedISO 14000 as a prerequisite for doing business. Its standards based on:
(a) Management Systems: Standards for system development and integration.
(b) Operations: Standards for consumption of natural resources and energy.
(c) Environmental Related Systems: Standards for measuring, assessing and managingemission, affluent and other waste streams.
Table 13.3 ISO : 9000 Standards and Indian Standards
13.8 Summary
Opening up the trade barriers, the gradual integration of local market into a global environment,global access to knowledge and information have all contributed to a growing appreciation of QualityRequirements and Assurance in all businesses. To survive and remain competitive in global market,
S. No. ISO : 9000 Bureau of Indian Standards 1 ISO 10011-1: 1990 IS 14011 Part I: 1991 Quality Systems Guidelines for Auditing
Quality Systems: Part I, Auditing 2 ISO 10011-2: 1991 IS 14011 Part 2: 1991 Quality Systems - Guidelines for
Auditing Quality Systems: Part 2, Qualification for Auditors 3 ISO 10011-3: 1991 IS 14011 Part 3 : 1991 Quality System -Guidelines for Auditing
Quality Systems: Part 3, Managing Audit Programs 4 ISO 9004-2: 1991 IS 14004 Part 2: 1992 Quality Systems - Quality Management
and Quality Septum Elements - Part 2, Service 5 ISO 9000-3: 1991 IS 14000 Part 3: 1991- Guidelines for Application to Software 6 ISO 10012-1: 1992 IS 14011 Part 1: 1993 - Quality System – QA Requirement for
Measuring Equipment, Part I, Metrological confirmation 7 ISO 9000 - 2: 1993 IS 14000 Part 2: 1994 Generic Guidelines for Application 8 ISO 9004 - 3: 1993 IS 14004 Part 3: 1994 Quality Systems - Quality Management
and Quality System Elements: Part 3, Processed Material 9 ISO 9000-4: 1993 IS 14000 Part 4: 1994 Quality Septum - Quality Management 10 ISO 9004-4: 1993 IS 14004 Part 4: 1994 Quality Systems - Quality Management
and Quality Septum, Part 4, Quality Improvement 11 ISO 8402: 1994 IS 13999 Quality Management Vocabulary 12 ISO 9000-1: 1994 IS 14000 Part 1: 1999 Guidelines for Selection and use 13 ISO 9001: 1994 IS14001: 1994 Quality Systems - Model for QA in Design,
Development, Production, Installation and Servicing 14 ISO 9002: 1994 IS 14001: 1994 Quality Systems - Model for QA in Production,
Installation and Servicing 15 ISO 9003: 1994 IS 14003: 1994 Quality Systems - Model for QA in Final
Inspection and Test 16 ISO 9004-1: 1994 IS 14004 Part 1: Quality Systems - Quality Management and
Quality Systems Elements: Part 1, Guidelines 17 ISO 10013 IS 10013 Guidelines for Developing Quality Manual

goods/services offered should not only be of high quality, but also be reliable, safe, energy-efficient,environment friendly and cost-effective. Ability to produce quality goods and services and to sustainthem over a long period of time requires implementation of quality standards or systems approach(ISO 9000 Series of Quality Systems). The ISO 9000 series was developed by a technical committeeworking under ISO in Geneva. The series took several years in the making and was an outcome ofprevious work of military standards in World War II and the British Standards Institution’s BS5750series Part 1 to 6. In 1987, ISO published the ISO 9000 series. This series is a family of qualitymanagement and quality assurance standards which consists of 17 different standards out of whichonly ISO 9001, ISO 9002, and ISO 9003 are quotable standards while the rest only guidelines. TheISO member for the India is the Bureau of Indian Standards known as BIS.
The objective of ISO is to promote the development of standardization and related activitiesin the world with a view to facilitating international exchange of goods and services and to developcooperation in the spheres of intellectual, scientific, technological and economic activities. ElementsApplicable to ISO 9001 are management responsibility, quality system, control review, design control,documents control, purchasing, purchase & supplied product, product identification & traceability,process control, inspection & testing, inspection, measuring & test equipment, inspection & teststatus, control of non conforming product, corrective action, handling, storage, packing & delivery,quality records, internal quality audit, training, servicing, statistical techniques.
The challenge to a developing nation like India is to motivate its manufacturers and serviceproviders to adopt and implement these standards, and to establish a credible national qualityregistration system which will be recognized and be acceptable to its trading partners.
13.9 Self Assessment Test
1. What is the basic difference between the following codes of ISO 9001, 9002, 9003 and 9004?
2. Briefly list the benefits of ISO 9000 certification to Indian companies.
3. What is ISO? Put a light on the genesis of ISO 9000.
4. Write the definition of following terminology as per ISO and interpret the same:
(a) Quality Policy
(b) Quality System
(c) Quality Control
(d) Quality Assurance
(e) Quality Objectives
5. Explain the ISO 9000 series and also describe the objectives of ISO 9000.
6. Briefly explain the equivalent quality system standard in India and European Nations.
7. What are the key elements applicable and not applicable to ISO 9001, 9002, 9003? Brieflyexplain
each.
8. What is the basic requirement for ISO 9000 certification? Also explain the national effortsdone in India related to this.
9. Write an essay on “ISO 9000 Standards and Indian Standards”

13.10 ReferencesRoberta S. Russell, Bernard W. Taylor III (1995); ‘Production and Operations Management’; PrenticeHall, New Delhi.
Suresh Dalele, Saurabh (1999); ‘ISO 9000: A Manual for Total Quality Management’; Sultan Chand& Sons, New Delhi.
N. Logothetis (1997); ‘Managing for Total Quality: From Deming to Taguchi and SPC’; PrenticeHall of India, New Delhi.
Rajesh Kumar Shukla (2006); ‘Total Quality Management’; New Royal Book Company, RevisedEdition, Lucknow.
Joseph & Susan Berk (1995); ‘Total Quality Management: Implementing Continuous Improvement’;Excel Books, New Delhi.
Parag Diwan (1997); ‘Quality in Totality: A Manager’s Guide to TQM and ISO 9000’; Deep & DeepPublications, New Delhi.
N. S. Sreenivasan, V. Narayana (1996); ‘Managing Quality Concepts and Tasks’; New AgeInternational Publishers, New Delhi.

Unit – 14 Customer Relationship ManagementUnit structure
14.0 Objectives
14.1 Introduction
14.2 Benefits of CRM
14.3 Traditional Management vs. Relationship Management
14.4 Types of Relationship Management
14.5 CRM to e-CRM
14.6 Successful Continuous Relationship
14.7 Customer Retention and Relationship Management
14.8 Internal and External Relationship
14.9 Strategies for Relationship Marketing
14.10 Summary
14.11 Key Words
14.12 Self Assessment Test
14.0 Objectives
After studying this unit you should be able to understand
The Concept of Customer Relationship Management
The objectives , significance and types of CRM
CRM to e-CRM
Strategies of CRM
Need for Customer Retention
14.1 Introduction
CRM stands for customer relationship management. It is a strategy used to learn more aboutcustomers need and behaviours in order to develop strategic relationship with them. Good customerrelationship is the heart of business success. Customer relationship management is a strategic pro-cess that will help you better understand your customers need and how you can meet those needs andenhance your bottom line at the same time. This Strategy depends on bringing together lots of piecesof information about customers and market trends so you can sell and market your products andservices more effectively.
The concept of managing relationships with customers is not new. Companies had beendoing it since the beginning of trade, however, the focus was more on selling rather than customerorientation. Competition, driven by globalization has changed the whole gamut. Customers nowhave varied choices, are more knowledgeable and demanding too. Now they need to be handled withutmost care by the companies because the question is not only to acquire them but to satisfy andretain them for long. The companies now realize that they could boost up their profits by almost
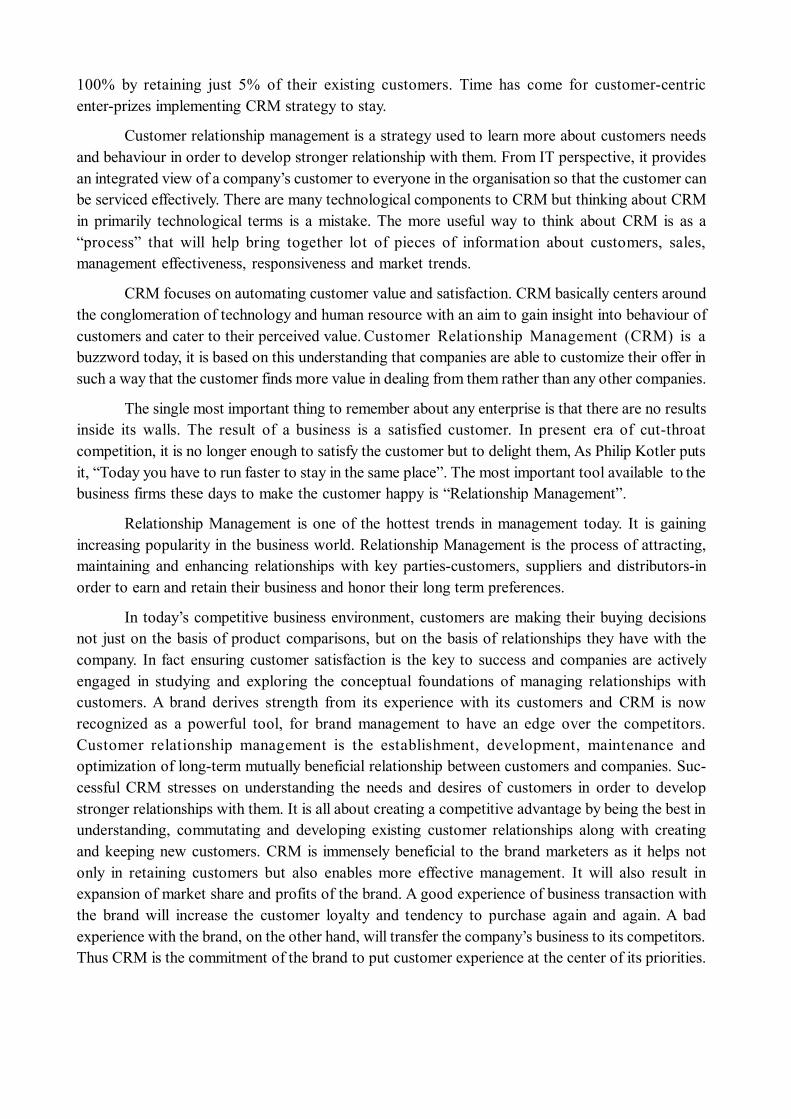
100% by retaining just 5% of their existing customers. Time has come for customer-centricenter-prizes implementing CRM strategy to stay.
Customer relationship management is a strategy used to learn more about customers needsand behaviour in order to develop stronger relationship with them. From IT perspective, it providesan integrated view of a company’s customer to everyone in the organisation so that the customer canbe serviced effectively. There are many technological components to CRM but thinking about CRMin primarily technological terms is a mistake. The more useful way to think about CRM is as a“process” that will help bring together lot of pieces of information about customers, sales,management effectiveness, responsiveness and market trends.
CRM focuses on automating customer value and satisfaction. CRM basically centers aroundthe conglomeration of technology and human resource with an aim to gain insight into behaviour ofcustomers and cater to their perceived value. Customer Relationship Management (CRM) is abuzzword today, it is based on this understanding that companies are able to customize their offer insuch a way that the customer finds more value in dealing from them rather than any other companies.
The single most important thing to remember about any enterprise is that there are no resultsinside its walls. The result of a business is a satisfied customer. In present era of cut-throatcompetition, it is no longer enough to satisfy the customer but to delight them, As Philip Kotler putsit, “Today you have to run faster to stay in the same place”. The most important tool available to thebusiness firms these days to make the customer happy is “Relationship Management”.
Relationship Management is one of the hottest trends in management today. It is gainingincreasing popularity in the business world. Relationship Management is the process of attracting,maintaining and enhancing relationships with key parties-customers, suppliers and distributors-inorder to earn and retain their business and honor their long term preferences.
In today’s competitive business environment, customers are making their buying decisionsnot just on the basis of product comparisons, but on the basis of relationships they have with thecompany. In fact ensuring customer satisfaction is the key to success and companies are activelyengaged in studying and exploring the conceptual foundations of managing relationships withcustomers. A brand derives strength from its experience with its customers and CRM is nowrecognized as a powerful tool, for brand management to have an edge over the competitors.Customer relationship management is the establishment, development, maintenance andoptimization of long-term mutually beneficial relationship between customers and companies. Suc-cessful CRM stresses on understanding the needs and desires of customers in order to developstronger relationships with them. It is all about creating a competitive advantage by being the best inunderstanding, commutating and developing existing customer relationships along with creatingand keeping new customers. CRM is immensely beneficial to the brand marketers as it helps notonly in retaining customers but also enables more effective management. It will also result inexpansion of market share and profits of the brand. A good experience of business transaction withthe brand will increase the customer loyalty and tendency to purchase again and again. A badexperience with the brand, on the other hand, will transfer the company’s business to its competitors.Thus CRM is the commitment of the brand to put customer experience at the center of its priorities.

Figure 1 : Relationship Management Transition Model
The above model shows the Transaction Management to relationship which includes:-
A move from functionally based management to cross-functionally based management.
A shift from management activities which have emphasis on customer acquisition to man-agement activities which emphasize customer retention.
14.1.1 Definition of Relationship Management
Philip Kotler – “Relationship management is the process of building long-term, trusting,win-win relationship with customers, distributors, dealers and suppliers.”
Stanton – “ By means of management function, marketer can direct the firm’s response to anever changing management environment and orient all activities of the business toward thecreation of a satisfied customer”.
Couldwell – “CRM is a combination of business process and technology that understands acompany’s customers from the perspective of who they are, what they do and what they like’.
Anton - “CRM is an integrated approach to managing relationship with continuousimprovement or re-engineering”.
Berry – “CRM as a attracting, maintaining and enhancing customer relationship in multiservice organization”.
14.1.2 The Evolution of Relationship Management
The formal study of management has focused on an evolving range of management sectorsover the past few decades as shown in figure-2.
Relationship
Management
Transaction
Management
Emphasis on customer
retention and six market domains
Emphasis on customer
acquisition
Functionally Based
Management
Cross-functionally Based
Management

Figure-2 : The Changing Focus of Management
In the 1950s, management interest was primarily focused on consumer goods. In the 1960s,increased attention also started to be directed towards industrial markets. In the 1970s, considerableacademic efforts placed on the area of social management. In the 1980s, attention started to bedirected at the services sector, an area of management that had received remarkable little attention inview of its importance in the overall economy. In the 1990s, we believe that relationship manage-ment is the area that will receive increasing attention. This involves two major considerations. Firstat the macro level the recognition that management impacts on a wide range of areas includingcustomer markets, employee, markets, supply markets, internal markets, referral markets and influ-encer markets such as the governmental and financial markets; and second at the micro level therecognition focus to a relationship focus.
14.2 Benefits of CRM
In today’s dynamic business world, if CRM is implemented effectively, it will result in im-mense benefits to the brand marketers as well as to the customers. Now days, it has become a vitalelement for success. Benefits of CRM can be divided into two categories i.e. (A) Benefits of CRMwith reference to brand marketers (B) Benefits of CRM with reference to customers
(A) Benefits of CRM with reference to brand marketers :-
(1) Improvement in Sales Revenue - The sales revenue of the brand is improved through CRM.Keeping the customers satisfied and happy will ensure that they stay with the brand, thusmaximizing their contribution to the business. By being customer centered the brand canincrease its sales revenue.
(2) Increase in Profits -When CRM is applied; the profits of the brand will increase due tolower defection rates of the customers. When customers enter into a relationship with abrand, they are willingly foregoing other options and limiting their choice. By staying withthe brand, the customers enhance profitability of the brand.
(3) Reduction in cost of management -If CRM strategy is adopted for management theproducts, the marketers will have a good relationship with the customers. The customers willbe satisfied and readily accept the product. Thus less cost will be incurred in advertising andpromotions.
Consumer management
Industrial management
Social management
Services management
Relationship management
Major area of Concentration
‘50s ‘60s ‘70s ‘80s ‘90s

(4) Better Understanding of Customers - CRM enables the brand marketers to have betterunderstanding of the customers. They can easily anticipate what customers want in terms ofthe product and services provided by the brand.
(5) Targeted Customer Contact-Improved customer knowledge will enable the brandmarketers to target their customers precisely. Management efforts can be optimized and fullyexploited by targeting on right prospects and potential segments. CRM will help marketersto identify their target customers and not waste their time.
(6) Improvement in Customer Satisfaction-With the help of CRM, firstly the customers willchoose the right product offered and also if they face any problems, they will be easily solved.Thus with CRM the level of customer satisfaction will be raised. Strong customer loyaltywith the help of CRM good relationship is developed with the customers. This will result inincrease in customer loyalty for a brand. Thus, CRM develops a strong customer loyalty andgood brand image.
(7) Increase in Customer Retention-CRM helps in increasing retention of existing customersby improved after sales service and support. As the existing customer will be fully satisfied,they will buy the same brand, thus CRM helps to retain old customers.
(8) Identifying, Attracting and Acquiring New Customers -A fine tuned CRM would be ableto add a large number of customers to the existing customer base. The brand marketerswould be able to add more and more customers to the captive customers. CRM allows thebrand marketers to focus their limited management resources on the most promising targetmarkets with the highest potential value.
(9) Proximity to customers-The growing expectations of the customers have lead to the brandmarketers to innovate, serve and satisfy the customers in a better way. The ability to success-fully manage customer relationship is a decisive advantage in today’s competitive world toincrease proximity to customers.
(10) Helps in identifying cross-selling and up-selling opportunities-CRM helps in identifyingopportunities for cross-selling and up-selling of higher value added services to existingcustomers based on their past purchasing behaviour.
(B) Benefits of CRM with reference to Customers :-
(1) Decreased Cost for Customers- CRM as management expenses of a brand will decrease inthe long run; brand marketers can offer the same product at a little lower cost, which will beto the benefit of the customers.
(2) Improvement in Customer Satisfaction-CRM ensures that the customers experiencepositive interaction with the brand. Customers form long lasting impressions of how they aredealt with. Thus, a good experience with the brand will result in satisfied and happycustomers.
(3) Timely Delivery of Products-The awareness level of customers has increased manifold.Now the customers are well informed about different types of products and brands availablein the market. Therefore, companies are increasingly practicing CRM. This is resulting ineffective and timely delivery of products to consumers.
(4) Personalization and Closeness-Customers in this competitive age expect constant accessto a company. They demand immediate response. They want personalization and closeness

for meeting their needs, placing new demands on the company, which CRM alone cansatisfy.
(5) Availability of Wide Variety of Products-CRM helps the brand to understand the customer’sdemands and manufacture new products according to their expectations. With heightenedcompetition and easy to access information, customers have a wide variety of choice ofproducts and services that are specifically tailored to meet customer’s needs.
14.3 Traditional Management vs. Relationship Management
The traditional management, known as transactional management focused on mass produc-tion, mass management and standardized products and services. But with relationship management,the focus has now shifted to highly customized and personalized products and services.
Table-1 : Traditional/ Transaction Versus Relationship Management
14.4 Types of Relationship Management
(A) Classic Market Relationship -(1) The Classic Dyad: The relationship between the supplier and customer. This is the parent
relationship of management, the ultimate exchange of value which constitutes the basis ofbusiness.
(2) The Classic Trial: The drama of the customer – supplier- competitor triangle Competition isa central ingredient of the market economy. In competition there are relationships betweenthree parties: between the customer and the current supplier, between the customer and thesupplier’s competitors, and between competitors.
(3) The Classic Network Distribution Channels: The traditional physical distribution and themodern channel management including goods, services, people and information consists ofa network of relationships.
(B) Special Market Relationship -Relationships via full- time marketers (FTMs) and part-time marketers (PTMs) : Those who
work in the management and sales departments- the FTMs- are professional relationship markers.All others, who perform other main functions but yet influence customer relationships directlyordirectly, are PTMs. There are also contributing FTMs and PTMs outside the organization.
(1) The service encounter- interaction between the customer and the service provider :Production and delivery of services involve the customer in an interactive relationship withthe service provider, often referred to as the moment of truth.
(2) The many-headed customer and the many headed supplier: Marketing to other
Traditional/Transaction management Relationship Management 1. Focus on single sale Focus on customers retention 2. Orientation on product features Orientation on product benefits 3. Short time-scale Long time-scale 4. Little emphasis on customer service High customer service emphasis 5. Limited customer commitment High customer commitment 6. Moderate customer contact High customer contact 7. Quality is primarily a concern of
production Quality is the concern of all

organizations- industrial management or business management – often means contactsbetween many individuals from supplier’s and the customer’s organization.
(3) The relationship of the customer’s customer : A condition for success is often theunderstanding of the customer’s customer; and what suppliers can do to help their customersbecome successful.
(4) The close versus the distant relationship : In mass management, the closeness of thecustomer is lost and the relationship become distant, based on surveys, statistics and writtenreports.
(5) The relationships to the dissatisfied customer : The dissatisfied customer perceives aspecial type of relationship, more intense than the normal situation, and often badly managedby the provider. The way of handling a complaint, can determine the quality of the futurerelationship.
(C) Mega Relationship -
(1) Personal and Social Networks : Personal and social networks often determine businessnetworks. In some cultures even, business is solely conducted between friends andfriends-of-friends.
(2) Mega management - the real ‘Customer’ is not always found in the marketplace . In certaininstances, relationships must be sought with governments, legislators, influential individualsand other in order to make management feasible on an operational level.
(3) Alliances change the market mechanisms : Alliances mean closer relationships andcollaborations between companies. Thus competition is partly curbed, but collaboration isnecessary to make the market economy work.
(4) The knowledge relationships : Knowledge can be the most strategic and critical resourceand ‘knowledge acquisition’ is often the rationale for alliances.
(5) The mass media relationship : The media can be supportive or damaging to managementand they are particularly influential in forming public opinion. The relationship to media iscrucial for the way media will handle an issue.
(D) Nano Relationships -
(1) Market mechanisms are brought inside the company : By introducing profit centers in anorganization, a market inside the company is created and internal as well as externalrelationships of a new kind emerge.
(2) Internal customer relationship :The dependency between the different tiers anddepartments in a company is seen as a process consisting of the relationships betweeninternal customers and internal suppliers.
(3) Quality providing a relationship between operations management : The modern qualityconcept has built a bridge between design, manufacturing and other technology-basedactivites and management. It considers the company’s internal relationships as well as itsrelationships to the customers.
(4) Internal management : Relationship with the ‘Employee market’ : Internal managementcan be seen as a part of relationship management as it gives indirect and necessary support tothe relationship with external customers.

(5) The relationship to external providers of management services : External providersreinforce the management function by supplying a series of, such as those offered by adver-tising agencies and market research institutes, but also in the area of sales and distribution.
The Relationship Management Model
Relationship Management can be described with the help of the following Figure-3
Figure-3
This model reveals the facts that certain inputs of relationship management will achieve therequired output to build fair and long lasting relationship with the customer like individual care andattention is paid to the customer obviously it will create a positive word of mouth for the companyand it will increase customer satisfaction. Thus we can say that relationship management is a twoway process in which the inputs are required to generate the desired level of output in the present eraof competitive world.
14.5 CRM to e-CRM
The 20th and 21st Century has seen an increase in the use of electronic transmission, mediumseither as alternatives or as the sole means for the exchange of information, products, and services.Technology and the Internet in particular, has become as important a feature to business as theadvent of the calculator photocopy machine and the telephone. As with other advances in technologyand business system, inadequate or poorly planned inputs can only result in poor outcomesE-commerce has added benefit of allowing personalized services to occur over a far greater numberof people and organization.
Now, customers have not only become more demanding about the level and quality of servicebut their tolerance for internal communications deficiencies are decreasing and the need for instantgratification is on the rises. If the company is unable to satisfy customers, they will lose their busi-ness to the competition. Using electronic means to buy and sell products and services over theinternet will not in itself enhance customer service and support, it will increase sales opportunities,e-CRM had many advantages over traditional methods of CRM including mass communication,personalization around the clock availability, increased knowledge and awareness of customer needsand expectation, and the potential for increased customer satisfaction whilst increasing revenues.However, e-CRM has the potential to alienate customers, create problems within company cultureand threaten the livelihood of the company if not implemented correctly.
In simple words, e-CRM is a means to conduct interactive personalized and relevantcommunication with customers across both electronic and traditional channels. It focuses onunderstanding how the economics of customers relationship affect the business. The e-CRM, i.e.CRM online implies an additional means of communication and level of interaction with thecustomer, e-CRM can be defined as “A comprehensive understanding of customer activities,
Input Process Output Value-added products and services
RELATIONSHIP MANAGEMENT
High customer satisfaction One-on-one relationship Increased customer share Individual care and attention Lower management costs Special facilities and services Positive word-of mouth Structural ties High brand equity Information sharing High customer loyalty

personalization, relevance, permission, timeliness and metrics as a means to an end optimizing thevalue of your most important customers.
It can be referred as “electronic” customer relationship management, or more simply CRMthat is Web-based. The goal of e-CRM is to leverage technology, more specifically the power of theInternet to improve customer service, and enable a greater degree of customer interactions throughpersonalized communication. The Internet has changed businesses around the world by offeringsimpler ways to send and receive information search, buy and sell products at the mere click of amouse. This has made a lot of things easier for the customer. Features like products and services On-Demand, 24-house Access, up-to-the minute information on stock levels, prices and features, onlinecustomer support, self-service and personalized content are all easily available. This can save thecustomer time and energy scouting around for products for days. It can save the company executivesfrom going back and forth to get the exact requirements from the customer and, it has also reducederrors.
Developing continuous relationships with customers and to make them feel delighted has be-come a necessity in the wake of globalization, where customer delight is the only key to success andto the very existence of the company. Company’s perception is usually based on the customer’sbroad experiences with staff of the company. The status of relationship management in India elicitsthe various techniques employed by marketers to build and maintain relationship with the custom-ers. It provides a rich insight into the role of IT in CRM. To become market driven CRM have to optIT as e-CRM. This is the most potent weapon on the battleground of 21st century market place withdigital markets, faster, smarter, adaptive management, and customized product/services for custom-ers with the most potential long-term value.
e-CRM is not only simply electronic CRM, it is customer management for e-business thatmust confront the complexity of managing sophisticated customer and business partners in a varietyof online and offline medias, personal contacts and other automated and electronic forms of commu-nication. In simple words, e-CRM is technology driven CRM, where relationship is maintained withthe help of technology. It is the skeleton of modern business and management is the core of allbusiness activities, therefore the changes in information technology inevitably changes the manage-ment processes, systems, strategies and setups. Blossoming of the information age has made man-agement efforts more information-oriented, service oriented and relationship-oriented.
The development of information superhighway and opening up of the digital market haveenable the marketers to provide customized product or services offering and develop value ladenlong lasting relationships with the customers. Highly empowered and informed customers havemade CRM a most important area to concentrate upon the marketers.
Success in the 21st century market place will depend on a company’s ability to develop, retain,and expand profitable business relationships with its customer base. Getting the right technologyand infrastructure is a major part of one’s continuous relationship management strategy. Its no longerenough to understand who are your customers- you have to develop enduring and proactive relation-ships while buying a sustaining infrastructure that delivers to your company’s customers’ needs’expectations and wants at the time and place dictated by him/her. It’s hard to enough fostering thesepersonal relationships in the offline world.
Internet gives companies a greater opportunity to learn more about an individual customer’sneeds, preferences and buying pattern. Traditionally, customer services were reactionary, with acustomer contacting the company and the company responding to the contact.

14.5.1 Basic Requirements for e-CRM :
Necessary technical and functional requirements for e-CRM solutions are listed out asfollows:
(1) Analytical capabilities :In organisation, e-CRM applications contain a vast amount ofinformation pertaining to its customers. Such information needs to be leveraged and analysedby decision makers to take more informed and timely business decisions. This is a majorrequirement, for management applications and possible only if e-CRM solutions have robustbusiness intelligence and analytical capabilities.
(2) Web based e-CRM: Web is a critical channel for e-business, and is also important from aninfrastructure perspective. Users of e-CRM applications require access to their applications,which is supported through standard web-browsers. Moreover, business logical and data aremaintained centrally thus facilitating the deployment, maintenance and upgrading ofapplications.
(3) Continuous Channels of Customer Interaction: Continuous interaction with customers isa prime requirement for e-CRM. Integration of these components across multiple channels isrequired so that the customer interaction can be seen seamless, consistent and efficient.
(4) Integrated Workflow with ERP applications: Integration must include low-level datasynchronization as well as business process integration so that the integrity of business rulescan be maintained across systems and workflow tasks can pass between the systems.
(5) Optimization of Interactive Continuous Relationships with Customers Problems:e-CRM offerings might patch together sales force automation and customer support,producing only a fraction of an e-CRM solution. Still another CRM packages might providecustomer analytical needed to observe customer relationship but lack the means to turnfindings into initiatives in order to have a positive impact on continuous relationships withcustomers.
14.5.2 Six ‘E’s of E-crm Implementation
Implementation of e-CRM is the basic need for continuous relationship with customers, thatrequires following six ‘E’ outlined in brief as follows.
(1) Electronic Messaging Channels-For fast interact ive and economic customercommunications, companies have to adopt new electronic channels such as the Web andpersonalized e- Messaging. The purpose of the Web experience in the CRM is to identify acustomer/derive the value of the customer and interact with him/her.
(2) Enterprise-Every enterprise gains the means to touch and shape a customer’s experiencethrough e-CRM. An e-CRM strategy relies heavily on the construction and maintenance of adata warehouse that provides a consolidated, detailed view of individual customer behaviourand communication history.
(3) Empowerment-At present consumer, have a power to decide when and how tocommunicate with the company and through which channel. Consumers also decide whichfirms earn the privilege to communicate with them. New e-CRM strategies must bestructured to accommodate such type of consumers, and e-CRM solution must be structuredto deliver valuable information timely and patiently information to its customers that he/shecan accept it in exchange for his/her attention.

(4) Economics-Understanding customer economics relies on a company’s ability to attributecustomer behaviour to management programs. today, customer economics drives smart assetallocation decisions, directing resources and efforts at individuals likely to provide thegreatest return on consumer communication initiatives. Many companies execute bestcommunication strategies to understand the economics of continuous customer relationship.
(5) Evaluation-For meaningful evaluation, a company should evaluate customer interactionsalong with various customer touch point channels, and compare anticipated ROI againstactual returns, through customer’s analytical reporting. Results of evaluation allowcompanies to continuously refine and improve efforts to optimize continuous relationshipsbetween companies and its customers.
(6) External Information-External valuable information can be used to understand customerneeds in a better way. External information can be gained from sources such a third-partyinformation net works, and web page profiler applications, under the condition thatcompanies adhere to strict consumer opt-in-rules and privacy concerns.
Company builds an e-CRM solution in order to optimize continuous relationships betweencompanies; and its customers. Each company has different and multiple objectives such asincreasing the number of customers, increasing customer profitability, growing revenue, drivingcustomers through cost effective channels and cross-selling for continuous relationship with thecustomers.14.5.3 e-CRM as a Component of CRM :-
CRM is essentially a right business strategy for acquiring and maintaining the loyal customersfor continuous relationship for long-term period. A number of channels exist for interacting withcurrent customers. One of it is called and known as e-commerce or e-business. In the simplest terms,e-CRM is electronic CRM on the web.
14.5.4 e-CRM as a Sales Tool :-
The application of e-CRM includes activities of sales executives internal as well as field.General application of e-CRM viz., time scheduling of sales persons; contact with accounting de-partment; compensation of sales persons; sales forecasting; evaluation of demand; deciding pricingpolicy; allotment of sales territory; and reporting. Special rules should be programmed into configu-ration applications and need to be abstracted from customers. Sales configurations should suit theWeb user customers they need not be expected to have a technical background to assemble products.14.5.5 e–CRM as a Management Tools :-
e-CRM is a new business tool that all age companies are rushing to get. It is the agreement thatwas signed in the New Delhi between Microsoft and Infosys honchos Bill Gates and N R NarayanaMurthy. It is a business strategy designed to optimize profitability, revenue and customers’ satisfac-tion.
It is an integration of varying Communication Channels viz., Wireless application Protocol(WAP), electronic mail (e-mail), Telephony and Mobile Devices. Web, Wireless and Voice Tech-nologies may make it possible to combine personalized touch and customized service with mass-market efficiencies. It expands on this technology by using next generation technologies that areintegrated, comprehensive and interactive. It bring about a web-centric approach where the web ande-mail are a critical means of customer interaction that makes customer to access and make use of e-

CRM system from anywhere and anytime. General application of e-CRM consists of viz., manage-ment inventory management; forecasting and budgeting; management information system; pricingpolicies; channel and logistic management; and evaluation of management campaign.
It is primarily important to Indian customers because of increasingly available domestic andglobal brands in the market place. eCRM should cover majority of the customer touch bases such asface to face; Internet and phone. It should support employee and should customer-facing roles andallow all individuals viz., employees, and business partners, to innovate the entire value chain tocome together and successfully create customer delight.
14.5.6 e-CRM a Management Strategy :-
e-CRM help companies to increase their dialogue bandwidth and engage in continuousdialogue with the customer, establish a learning relationship in order to deliver customizedsolutions. For Indian companies especially, global ambition and competition lie at the heart ofe-CRM strategy, e-CRM especially makes it possible for varying departments to provide one uni-form face to the customer whenever they interact with them. Therefore, their attitude, communica-tion ability, knowledge base coupled with technical skill becomes important.
14.6 Successful Continuous Relationship
The dimensions of Successful continuous relationship are -
(1) Trust :It is an important factor in the development of management relationships and prevailswhere a customer has confidence in a seller’s reliability and integrity. Trust in a person isacquired by assessing the previous interactions, such as conflicts; the partner has had withothers in similar situations. Trust is strengthened if partners are responsive in ways thatacknowledge an individual’s particular needs and affirm their sense of worth.
(2) Customer Satisfaction: It plays an important role in developing long-term continuousrelationships. Highly loyal customers remain loyal for longer period, which ultimately givestrength to the relationship between the concerned parties. Customers’ preference for aparticular company or a company’s product reflects his/her loyalty towards that brand, whichin turn signifies positive attitude for building and retaining continuous long-term relation-ships.
(3) Complaint Handling :It results in efficient management of continuous relationships inservice business. Complaint handling helps in developing and maintaining continuousrelationship because of challenges in managing quality, profitability.
(4) Commitment :It focuses on long lasting desire of parties to maintain a relationship. Theconcept of commitment becomes relevant to services due to the need for customerparticipation in the delivery process. Like trust, satisfactory complaint handling is alsorelated positively to customer commitment.
(5) Customer orientation :It suggests to be more customers focused instead of product-centric.Staffs have to understand the needs of customers as individuals, so that such information canbe used to improve quality of service they offer. There has to be greater emphasis on trainingprogram to ensure staffs’ use of the technology in ways appropriate to particular types ofrelationships.
(6) Continuous Communication: Continuous communication with the customers has been

determined as a key factor of relationship maintenance in service sector, such as insurance,wholesale banking. Parties cannot be expected to trust each other, if particular momentsconstitute their only opportunity to interact.
(7) Continuous Periodic Assessment: Continuous periodic assessment of customer’s needsand assurance that they have made correct decision is necessary for strong relationship.
(8) Continuous Personal Touch: Continuous personal touch such as gifts on special occasion;cards; calendars; and diary etc. can maintain long way continuous relationships among par-ties. It is an interactive, face-to-face relationship between company and an individual on one-to-one base.
14.6.1 Satisfaction in Relationship :
Customers’ satisfaction is a state of mind that occurs when the customer feels that his expectedrequirement is fulfilled by what is offered by the organization. Customer’s satisfaction is relatedwith various parts given as below :-
(1) Product satisfaction: Product satisfaction comes with the core benefit provided by the prod-uct. It is related to the minimum expectation of customer from the product. It is related withsatisfying basic needs of customers.
(2) Ambience Satisfaction :It is a blend of tangible factors, which the customer experience, inthe purchase and consumption process. The tangible aspect of ambience satisfaction includeappearance of sales point, continuous services available and competitive pricing. Where in-tangible aspects include the courtesy extended by sales persons.
(3) Peripheral Satisfaction :When specific value added to the product in addition to the corebenefit it resulted into peripheral satisfaction. It helps the customer to enhance their desirefor personal attention.
(4) Clarity satisfaction :Clarity satisfaction is related with the satisfaction extended in tunewith the individual of the customer concerned. It provides the customer an arena to reducehis anxieties and fear with respect to the purchase of product. A talkative customer would bemuch satisfied if the sales personnel engaged in lengthy dialogue. A suspicious customerwould be fully satisfied if all his/her latent and expressed doubts are clarified.
14.6.2 Continuous Relationship Through Customer Loyalty:
In today’s highly competitive and challenging business environment, it is really a blessing fororganization if they are fortunate enough to have loyal customer in their directory. Building cus-tomer loyalty is the basic platform for continuous relationship. Loyalty in the management term hasbeen defined as a willful, voluntary and repeated choice of a specific brand of a product or type ofservice. For the one-time purchase, Loyalty could be explained in terms of the extent of commitmentto the brand selected; the positive attitude developed towards using the brand selected and positiveimage the customer projects about the brand he/she selected.
Loyalty for specific brand is the committed willful option for a particular brand. Loyalty to-ward brand is what customer normally develops with specific reference to a brand, irrespective ofany one of the above categories such as organization, store, and sales person, etc.
Brand loyalty process starts with awareness of the fact that the brand is available. Creatingsuch sense of awareness of brand is of the major responsibilities of the marketer. A customer whodevelops loyalty towards an organization might willfully offer to whatever product or service is

offered by the organization. He/she would be a strong supporter for the organization’s products andservices. Such a loyalty is a result of the organization’s image, continuous relationship with organi-zation, better performance of the organization and so on.
14.7 Customer Retention and Relationship Management
The major objective of ‘relationship management’ is to turn new customers into regularlypurchasing clients, and then to progressively more them through being strong supporters of thecompany and its product, to finally being active and vocal advocates for the company.
The development of a closer, long-term relationship with customers is particularly importantin certain types of service operation; namely when the service cannot be provided completely on oneoccasion, of instance, certain treatments at the dentist which require several visits, or a problem witha care which requires more than one visit to the mechanic. Similarly, if the service itself is highlyintangible, the existence of a stronger relationship can be an important influence on a customer’sdecision to pay for the services of one provider in preference to another. If there is little tangibleevidence available to assess the quality of the service on offer, customer frequently turn to the pro-vider they have used before, whom they feel they can trust.
14.7.1 The Importance of Customer Retention
A relationship management approach draws attention to the importance of retaining as well asattracting customers with the emphasis being placed on the development of long-term relationshipswith existing customers. It involves changing the focus of management from a transactional to arelationship focus, with the emphasis on customer retention, high customer service and commit-ment, and quality being a concern for all. The focus of transaction management, with an emphasis onsingle transactions, limited customer service and commitment and with quality considered to beprimarily a concern for production, is no longer appropriate.
One of the major reasons why relationship management has emerged as the new paradigm formanagement is because of advances in information technology and specifically the generation ofcustomer databases. These clearly make it easier for service organizations to identify loyal custom-ers. Both small and large service operators use databases in this way. A video retailer, for example,holds membership details of all customers on a database and sends regular users a birthday card witha complementary voucher for a free video despite a flurry of activities aimed at serving customersbetter, only a few companies have achieved meaningful, measurable improvements in customerloyalty. It would appear that although companies seem to agree that customer loyalty is a good thing,not so many are prepared to make loyalty retention measures an integral part of their strategy.
14.7.2 Need for Customer Retention
In order to maximize CLV, attention has to be paid to customer retention. Customers of todayare becoming smarter, more price conscious, more demanding and are approached by various com-petitors with better offers. This had led the customers to churn. John Hutchinson – “Principal CRMconsultant at Xansa has made an attempt to segment customers into three categories based on cus-tomer churn frequency”. The first are the “Habitual Churners” who like to change suppliers fre-quently, view product as a commodity and are engaged in finding the best deal. The second segmentis “Possible Churners” which might move if you given them the right offer at the right time. Thethird segment is “Sluggish Churners” which comprise of old and affluent customers who are clini-

cal about benefits of change. Until and unless substantial cost benefit is offered they won’t changetheir suppliers, therefore this is one of the most challenging group.
CRM strategy for habitual churners should be the lowest cost method of service and in-creased number of sales calls. For possible churners the strategy should comprise of high quality ofinformation and product offering at the right time; and for sluggish churners hassle of switchingsupplier could be removed by subtle communication, encouragement and by developing shop win-dow image.
All these CRM strategies center-around the basic idea of retention so as to get the most out oftheir existing or potential customers. According to Gartner Research firm, it cost five times as muchto find a new customer as it does to keep an old one. “If you are losing high value customers, the costgo up substantially to acquire a customer and grow that relationship to the same level”, says Kim-berly Collins, a research director at Gartner. “Besides, once they leave it’s too hard to win themback”. Customer Life cycle for an enterprise begins with acquisition, is perpetuated with retentionand is improved with cross-selling. Cross-selling is usually more profitable for customers.
Ultimately the heart of any retention strategy is a genuine commitment to customer service.The best thing a company can do is to make it easy for the customers to complain. Suggestion forms,toll free numbers and e-mail addresses serve the purpose. the 3M company claims that over twothirds of it’s product improvement ideas came from listening customer complaints. At the same timechanges in consumer behaviour be monitored, such as reduced buying frequency or purchase amountetc. which are the signs of dissatisfaction. This requires immediate action by building proper CRMsystem. Some companies maintain customer file for every customer and see if they have any unre-solved issues. The key to retaining customers is relationship marketing According to Berry andParasuraman, to keep customers happy, marketers can add financial or social benefits to products, orcreate structural ties between company and customers. For companies to reap profits, focus on reten-tion will be the right direction.
Fig. The Relationship Marketing Ladder of Customers Loyalty
Partner
Advocate
Supporter
Client
Customer
Prospect
Emphasis on developing and enhancing relationship (customer keeping)
Emphasis on new customers (customer catching)

14.7.3 Retaining and Growing Customers :
Customers are becoming harder to please. They are smaller, more price conscious, moredemanding, less forgiving, and they are approached by many more competitors with equal or betteroffers. The challenge, according to Leffrey Gitomer, is not necessarily to produce satisfied custom-ers: several competitors can do this. The challenge is to produce delighted and loyal customers.
Companies seeking to expand their profits and sales have to spend considerable time andresources searching for new customers. To generate leads, the company develops ads and placesthem in media that will reach new prospects; it sends direct mail and makes phone calls to possiblenew prospects; its salespeople participate in trade shows where they might find new leads; it pur-chases names from list brokers; and so on. All this activity produces a list of suspects. Suspects arepeople or organizations who might conceivably have an interest in buying the company’s product orservice, but may not have the means or real intention to buy. The next task is to identify whichsuspects are really good prospects-customers with the motivation, ability, and opportunity to make apurchase by interviewing them, checking on their financial standing, and so on then it is time to sendout the salespeople.
It is not enough, however, to attract new customers; the company must keep them and in-crease their business. Too many companies suffer from high customer churn-high customer defec-tion. It is like adding water to a leaking bucket.
There are two main ways to strengthen customer retention. One is to erect high switchingbarriers. Customers are less inclined to switch to another supplier when this would involve highcapital costs, high search costs, or the loss of loyal-customer satisfaction. This makes it harder farcompetitors to offer lower prices or inducements to switch.
14.8 Internal and External Relationship
Relationship management implies consideration of not just better relationships with customermarkets, but also the development and enhancement of relationships with supplier, recruitment,internal, referral and influence markets.
(1) Relationship with Suppliers: In the relationship, the buyer recognizes that fact that suppli-ers are very much a part of his final products, and that working together with suppliers canincrease the benefits to both parties. Benefits in this context have been found to includeshorter delivery lead times, lower stock levels, fewer quality problems and faster implemen-tation of design changes. Strategies aimed at improving relationships with suppliers alsoform part of what has been referred to in the service management literature as ‘reverse man-agement’.
(2) Relationships with Recruitment Markets: Relationship management also involves hav-ing a closer relationship with those who supply human resources to the organization, that is,recruitment markets. Service organizations need to cultivate long-term relationships with thesuppliers of such employees to ensure that they receive both the right quantity and quality ofemployees.
(3) Relationships with Internal Markets: Employees need to feel that they have formed along-term relationship with the service provider and have a shared understanding of themission of the organization. Human resource strategies need to focus on internal markets andspecifically an employee retention. The longer employees stay with the company, the more

familiar they become with the business, the more they learn, and the more valuable they canbe.
(4) Relationships with Referral Markets: Specific strategies need to be devised to reward thereferral sources that generate the most business. Although, traditionally, satisfied customersare the key referral source for service organizations, other sources might include suppliers,other agencies dealing with the company, for instance, banks, and in some cases even com-petitors.
(5) Relationships with Influence Markets: Influence markets can also affect the strength ofthe relationship the organization has with its customers like legislative bodies, political groups,and trade and consumer associations.
14.8.1 Building Relationship Through Blogs and Forums :-
The important job of ORM is to investigate about what is being said about the industry,competitors and about its own brand ORM system collects the conversation contents of customersand general public by visiting and analyzing various consumer blogs, pod casts and opinion forums.However, the size and complexity of blogosphere, coupled with speed news travelling in internetmake difficult to monitor all that is being said about brand, industry and competition in internetmedia.
Building the relationship is nothing but building the reputation of the organization so that theduration and number of customer rotation must increase.
If a site includes complaints for the company it should immediately clarify its position. Incases of in accurate brand information on any site, the banking organization should send informationto the site and should ask to remove the false information from the site.
Banking industry has witnessed a lot of changes since the era of liberalization. Retention andenlarging of the customer base bas gained utmost importance for all the banks since the last five toten years due to the severe threat posed by competitors. This has forced banks to think the way theyfunction and make use of the latest technologies available for the industry. The challenges faced bythe banking industry have never been so complex. To operate in this tough environment banks needto be ready to change and redefine themselves in the way they conduct business. The transformedbusiness should rapidly respond to meet any customer demands market opportunity or external threat.This business strategy requires the use of technology as an enabler for broader transformation withinthe organization.
With the changing environment, banks implemented tele banking, internet banking, mobilebanking call centre services ATMs etc., for enhanced customer services. Internet banking is the latestin this series of technological wonders in the recent past involving use of internet for delivery ofbanking products and services. It uses today’s computer technology to give a person the option ofbypassing consuming paper used aspects of traditional banking in order to manage their financesquickly and efficiently. Banks view internet banking as a powerful value added’ tool to attract andretain new customers. Internet banking also helps eliminate costly paper handling and teller interac-tions in an increasingly competitive banking environment.
14.9 Strategies for Relationship Marketing
Service organizations use a number of strategies to move their customers through the stagesof relationship development.

(1) The possibility of relationships developing can occur only where the parties are aware ofeach other and of their mutual desire to enter into exchange transactions. At this stage, theparties may have diverging views about the possibility of forming a long-term relationship.The supplier must be able to offer potential customers reasons why they should show disloy-alty to their existing supplier. In some case, low introductory prices are offered by serviceorganizations which provide a sufficient incentive for disloyal customers of other companiesto switch supplier.
(2) On entering into a relationship, buyers and sellers make a series of promises to each other. Inthe early stages of a relationship, suppliers’ promises result in expectations being held bybuyers as to the standard of service that will actually be delivered . Many studies on servicequality have highlighted the way in which the gap between expected and actual service per-formance determine customers’ perception of quality. Quality in perceived service deliveryis a prerequisite for a quality relationship being developed.
(3) At a relatively simple level, incentives for frequent users can help to develop short to me-dium-term loyalty-many airlines, for example, reward frequent business passengers with freeor reduced-price leisure tickets.
(4) The better approach is to deliver high a strategy used by some companies is to create rela-tionships by turning discrete service delivery into continuous delivery. In this way, compa-nies offer season tickets valid at all times which avoids customers having to make a choice-where it is available between competing but operators.
(5) Financial incentives are often given to customers as a reward for maintaining their relation-ship. These can range from a simple money off voucher valid for a reduction in the price ofa future service to a club type scheme which allows a standard level of discount for clubmembers. Incentives that are purely financially based have a problem in that they can defeatthe service supplier’s central objective of getting greater value out of a relationship.
(6) Rather than offer price discounts, companies can add to the value of relationship by givingother non-financial incentives. For example, many retailers offer special preview eveningsfor customers who have joined its membership club.
(7) Information about the preferences of individual customers can be retained so that futurerequests for service can be closely tailored to their needs.
(8) A more intensive relationship can develop where customers assign considerable responsibil-ity to a service provider for identifying their needs.
14.10 Summary
With the advent of relationship marketing, companies are prepared to do anything and every-thing to keep their customers happy and satisfied. A satisfied customer is not going to shift hisloyalty to the competition’s grab for additional sales. Business firms are now willingly engaged inconstant improvisation, personalization and customization marking a visible shift from “marketingmyopia” to “marketing hypermetropia”. The reason for all this is pretty simple. “If you would nottake care of your customers, your competitors definitely would.” So the firms should keep pleasingcustomers and they will keep coming back. Delivery what you promise-on time and in a visiblefashion. A satisfied customer is the best advertising a firm can do. So, in present times, to be success-ful a company needs to be not just. High tech but high tough as well. Future of a business can be very

bright if it nurtures the key relationship well.
Today’s economy is demanding. As margins get squeezed quality can deteriorate. Customer’sdon’t want to spend hours on hold. Failure to quick access to information can turn “hot prospect”into ice cold. Speed of practical flow and speed of delivery has become the vital factors for survival.Not only this, the future web based integration is going to witness ERM i.e. Enterprise RelationshipManagement, a stage above CRM where entire enterprise operations align from CRM to ERP anddata warehousing, to provide a single view to the customers.
14.11 Key Words
Customer: Any person or firm who is making use of services or products and also the oneswhom you can attract to build future relationship with your organization .
Management: It is the ability of getting things done through others.
Customer Statisfaction: Customers’ satisfaction is a state of mind that occurs when thecustomer feels that his expected requirement is fulfilled by what is offered by theorganization.
Relationship: Mutual understanding and goodwill between the organization and customers.
Loyalty: signifies commitment of the customer to a brand.
14.12 Self Assessnment Test
(1) What do you understand by customer relationship management?
(2) Explain the difference between traditional and relationship management.
(3) Explain the types of relationship management.
(4) How can you build continuous relationship through customer loyalty?
(5) What is customer retention and relationship management?

Unit – 15 Six SigmaUnit Structure
15.0 Objectives
15.1 Introduction
15.2 What Is a Standard Deviation?
15.3 Growing Interest in Six Sigma
15.4 Origin of Six Sigma
15.5 Implementing Six Sigma
15.6 How Does Six Sigma Works ?
15.7 The Six Sigma Methodology
15.8 Downsides of the Six Sigma Methodology
15.9 Key Words
15.10 Summary
15.11 Self Assessment test
15.0 Objectives
After studying this unit you should be able to understand:
The concept of six sigma.
What is the statistics behind it and its origin ?
Reasons of growing interest in six sigma.
Implementing six sigma.
The six sigma methodology.
Implementation roles of six sigma methodology.
Downsides of the six sigma.
15.1 Introduction
Six sigma is a philosophy of doing business with a focus on eliminating defects through fundamentalprocess knowledge. Six sigma methods integrate principles of business, statistics and engineering to achievetangible results. A business discipline that combines a structured process-improvement methodology withan array of tools that help manage the achievement of objectives. The objectives of most Six Sigma projectsare specific and measurable, such as “improving the preferred customer order cycle time to 99.99% on-time performance level.” Other objectives might be expressed in “mean time between failures (MTBF)” orother process-centric terms.
In statistical terms, the purpose of Six Sigma is to reduce process variation so that virtually all the productsor services provided meet or exceed customer expectations. This is defined as being only 3.4 defects permillion occurrences. Six Sigma was developed by Motorola in the 1980s but has its roots in StatisticalProcess Control (SPC), which first appeared in 1920s.
Why “Sigma”? The word is a statistical term that measures how far a given process deviates from

perfection. The central idea behind Six Sigma is that if you can measure how many “defects” you have in aprocess, you can systematically figure out how to eliminate them and get as close to “zero defects” aspossible. To achieve Six Sigma Quality, a process must produce no more than 3.4 defects per millionopportunities. An “opportunity” is defined as a chance for non-conformance, or not meeting the requiredspecifications. This means we need to be nearly flawless in executing our key processes. The goal of SixSigma is to increase profits by eliminating variability, defects and waste that undermine customer loyalty.
Six sigma tools are used to improve the processes and products of a company. They are applicableacross every discipline including: Production, Sales, Marketing, Design, Administration and Service. SixSigma is :
1. A statistical measure of the performance of a process or a product.
2. A goal that reaches near perfection for performance improvement.
3. A System of management to achieve lasting business leadership and world-class results.
The Greek symbol ó (sigma) is a statistical term denoting “standard deviation”. Standarddeviation denotes how far away the data points are from the mean, typically, and it may be computedwith a formula. The phrase six sigma refers to several things: One, six sigma is a performance levelfor a six sigma process, 6 standard deviations each may be fitted between the mean and the upperand lower specification limits. Allowing for machine wear & tear and operator fatigue, this performancelevel equates to 3.45 dpmo (defects per million opportunities) for a process with a single-sidedspecification (or 6.9 dpmo for a process with a double-sided specification). Six sigma also is adisciplined and data-driven approach to insuring that repetitive work processes function in the bestpossible manner. The primary goal of six sigma is to minimize defect levels in the outcomes of workprocesses, a defect being anything that causes customer dissatisfaction. Maximizing customersatisfaction leads to improved bottom-line performance and globally competitive positions.
Six sigma offers a wealth of tangible benefits. When skilfully applied by your people:
Six sigma reduces costs by 50% or more through a self-funded approach to improvement.
Six sigma reduces the waste chain.
Six sigma affords a better understanding of customer requirements.
Six sigma improves delivery and quality performance.
Six sigma provides critical process inputs needed to respond to. changing customerrequirements.
Six sigma develops robust products and processes.
Six sigma drives improvements rapidly with internal resources.
Six Sigma as a fairly rigorous methodology for solving business process problems. Six Sigmatools are oriented to repetitive business processes, those that regularly produce outputs. It is data-based problem solving; it requires very specific measures of performance and that to quantify currentperformance with measurements—enough measurements to matter. Once quantitatively assessedcurrent performance, rigorously determine what the root causes are for unacceptable behaviour,these are also confirmed with data, and then systematically attack those roots until system performsas desired as demonstrated by more data. There is nothing magic in this. It is the straightforwardapplication of measurements, statistics, and scientific problem solving. A scientist might look at SixSigma and say “What is all the fuss about? We’ve been doing this for a hundred years.” And she would be

right!
However, businesses have not always been run with scientific methods. Businesses are createdby entrepreneurs, people who have visions and leadership skills, people who have passion andendurance and sometimes great luck. As these businesses expand, the leader has less and less directimpact on the business and the processes that make it up so the company begins to rely more andmore on the experience of their employees. Passion and vision are important but are not particularlyuseful at letting others know what to do in large groups. Also, passion and vision don’t normally helpcreate repeatable processes. Repeatable processes are necessary to have a reliable business operation.Six Sigma problem solving is oriented around the creation and improvement of repeatable processes.It is a methodology that allows businesses to solve problems in a scientific way rather than relyingon hunches, “experience,” or the way we’ve always done it. What is “experience” anyway? Youknow exactly what experience is: Experience is what is left after mistakes. Sometimes experiencekills people but those who survive are considered valuable to many businesses. Why should that be?Does experience make a good problem solver? Does it make a good leader? A good trainer? Maybe,but maybe not. Relying on employees with experience is dangerous when one need reliability andpredictability and high performance unless one is happy with their systems running just the way theyhave in the past, because experience tends to make people want to repeat what worked for them inthe past.
Six Sigma gives us a way to use employees with normal experience and knowledge butharness what they know to solve problems and improve their business in ways that are predictableand better than normal. The Six Sigma system will make process improvement efforts successful,not whether they happened to pick the right person for the job. One never have enough right peopleanyway, right?
15.2 What Is a Standard Deviation?
We have been talking about things being predictable and repeatable. Why is that importantand how do we measure it? These terms are closely connected. If something is repeatable, it meansthat it will tend to do the same thing over and over. If one is shooting a rifle at a target, and one wasvery repeatable, one could perhaps fire every round into the same hole. Even if the hole is nowherenear where one is aiming, if they all go to the same place, one has a repeatable process. If what onereally wants is to hit the bull’s-eye and his process is repeatable, it’s easy to adjust what one is doingto hit it. Simply adjust the sights on the rifle so that the position of the round lands closer to whereone wants. As long as one continue to fire the rifle the same as one did before, a successful adjustmentwill now has one hit the target every time. If one is familiar with guns, he will recognize this as a verysimple adjustment to make. But what if when one look at their initial pattern, the rounds landed allover the place? What if there was no pattern to them at all? If sometimes they were high, sometimeswere low, sometimes missed it completely, and sometimes hit the target next to him? Besides thefact that nobody would want to be anywhere near him, this would be a much more difficult processto fix. His process is not repeatable. Because of that, it isn’t predictable. Repeatable processes arepredictable. one can estimate reliably what they will do in the future. Unrepeatable or erratic processesare not predictable. One has no idea what will happen next. That’s why the smart shooter will get farout of the way when the unrepeatable shooter comes to the range! Let’s describe one other situationhere. Let’s say that after firing a group of rounds, one see that not all the bullets go into the samehole, but there is a grouping of them that has a discernable shape. It will probably be round.

Figure 1: Random shot pattern
If every time one fire a group of shots, one get a random but discernable shape, one also hasa predictable process! His process is just as predictable as the person who puts them all into the samehole, but the two of them have different amounts of variation. If three shooters are all predictable(i.e., they all have circular patterns of holes in their targets), but each has a different size pattern, theone with the smallest pattern has the least amount of variation and the one with the largest patternhas the most variation.
How do one measure how much variation a process has? The most ubiquitous metric for thisis the standard deviation. The standard deviation is a statistical measure of how much variation thereis. In the case of the shooter, this would be how much the shots vary around the centre of the circleof shots. It does not measure how close to the centre of the target we are, just how big that circle ofholes is. Figure 2 shows two shot patterns. The one with the smallest diameter (least variation) hasthe smallest standard deviation.
Figure 2: Two different random shot patterns
Part of the Six Sigma technique is simply for everyone to know the proper way to describethings and knowing what a standard deviation is and how to calculate it is the first step for a team tohave a common language to describe variability. If one want to make data-based decisions, onecannot rely on statements like one might hear on the firing range such as “That’s really good,” or“One have really improved.” We have to be able to quantify variability and express it in the rightterms and the standard deviation is what one use. Much better statements are “Last week the standarddeviation of his shots was 2.3 and this week it’s 1.5. Good job!” The bigger the standard deviation,the more variation there is, so normally one is trying to make it smaller. A smaller stn dev wouldmean a tighter grouping of shots. Now one has a precise language that one can use to describevariability to each other. This is important because people do not have a natural way of distinguishingbetween two groups of things, one of which is slightly more or less variable than the other. Ourminds and brains just don’t think that way. One needs to calculate the stn dev to really know. Table1 is an example. The data represent how long a standard query from two different databases takes inmilliseconds.
Table 1 Query Time Example

Both databases have the same mean (average) query times but B has a much larger standarddeviation than A, meaning it is a lot more variable and users of that database will see more variationin query time performance. One of the first things that Six Sigma practitioners learn is that althoughit is common business practice to compare two things by comparing their averages, it is a really badidea to do that. Averages do not tell much about a process. When one add the standard deviationinformation, one know a lot more. In this case, the averages are the same but the two databases havewidely different performance and users will notice it. If there is a specification on response time,Database B will fail it much more frequently than Database A.
15.3 Growing Interest in Six Sigma
Organizations like GE, Toyota, Hewlett Packard, FedEx, Motorola and American Expressare just a few of the world’s leading companies that in recent years have shared incredibleimprovements in increased earnings, reduced waste, improved leadership and more, as a result ofSix Sigma implementations. Because Six Sigma principles focus on business and processimprovement, their successful implementation leads to a significant savings in corporate resources,which can translate directly and rapidly into an increase in corporate profitability and business growth.Additionally, these process improvements result in increased company performance, quality andcustomer satisfaction. Today’s competitive environment leaves no room for error. We must delight
Query Times (milliseconds) Database A Database B
17.7 26.8
20.2 22.8
20.3 25.1
18.9 16.4
20.4 12.9
17.4 29.1
20.4 14.3
20.9 17.2
19.8 11.1
22.0 16.4
20.4 18.7
18.6 26.4
21.3 15.6
18.7 13.6
20.4 26.0
20.1 18.2
20.6 20.4
21.4 19.9
19.9 25.0
17.9 22.5
Mean 19.9 19.9 Stn dev -1.3 -5.3

our customers and relentlessly look for new ways to exceed their expectations. This is why Six SigmaQuality has become a part of our culture.
It should be obvious by now that I don’t view Six Sigma either as a panacea or as a mere tool.The companies that have successfully implemented Six Sigma are well-known, including GE, AlliedSignal, Intuit, Boeing Satellite Systems, American Express and many others. But the picture isn’tentirely rosy, failures also exist, most notably Motorola, the company that invented Six Sigma. Runninga successful business is an extremely complicated undertaking and it involves much more than SixSigma. Any organization that obsesses on Six Sigma to the exclusion of such things as radicalinnovation, solid financial management, a keen eye for changing external factors, integrity inaccounting, etc. can expect to find itself in trouble some day. Markets are akin to jungles, and muchdanger lurks. Six Sigma can help an organization do some things better, but there are places whereSix Sigma doesn’t apply. I seriously doubt that Six Sigma would’ve helped Albert Einstein discoverrelativity or Mozart compose a better opera. Recognizing the limits of Six Sigma while exploiting itsstrengths is the job of senior leadership.
If you are working in a traditional organization, deploying Six Sigma will rock your world. Ifyou are a traditional manager, you will be knocked so far out of your comfort zone that you willliterally lose sleep trying to figure out what’s happening. Your most cherished assumptions will bechallenged by your boss, the accepted way of doing things will no longer do. A new full-time, temporaryposition will be created which has a single mission: change the organization. People with the word‘‘belt’’ in their job title will suddenly appear, speaking an odd new language of statistics and projectmanagement. What used to be your exclusive turf will be identified as parts of turf spanning processes;your budget authority may be usurped by new ‘‘Process Owners.’’ The new change agents will prowlthe hallowed halls of your department, continuously stirring things up as they poke here and peekthere, uncovering inefficiency and waste in places where you never dreamed improvement waspossible. Your data will be scrutinized and once indispensable reports will be discontinued, leavingyou feeling as if you’ve lost the star you use to navigate. New reports, mostly graphical, will appearwith peculiar lines on them labelled “control limits” and “process mean.” You will need to learn themeaning of such terms to survive in the new organization; in some organizations you won’t beeligible for advancement until you are a trained “belt.” In others, you won’t even be allowed to stay.
When done properly, the result of deploying Six Sigma is an organization that does a betterjob of serving owners and customers. Employees who adapt to the new culture are better paid andhappier. The work environment is exciting and dynamic and change becomes a way of life. Decisionsare based on reason and rationality, rather than on mysterious back-room politics. However, whendone half-heartedly, Six Sigma (or any other improvement initiative) is a colossal waste of moneyand time. The message is clear: do it right, or don’t do it at all.
It has been nearly two decades since Six Sigma began and the popularity of the approachcontinues to grow. As more and more firms adopt Six Sigma as their organizational philosophy, theyalso adapt it to their own unique circumstances. Thus, Six Sigma has evolved. This is especially truein the way Six Sigma is used to operationalize the organization’s strategy. Inspired leaders, such asJack Welch and Larry Bossidy, have incorporated Six Sigma into the fabric of their businesses andachieved results beyond the predictions of the most enthusiastic Six Sigma advocate. Six Sigma hasalso been expanded from merely improving existing processes to the design of new products andprocesses that start life at quality and performance levels near or above Six Sigma.

15.4 Origin of Six Sigma
The late Bill Smith, a reliability engineer at Motorola, is widely credited with originating SixSigma and selling it to Motorola’s legendary CEO, Robert Galvin. Smith noted that system failurerates were substantially higher than predicted by final product test. He suggested a number of possiblecauses for this phenomenon, including a dramatic increase in system complexity and the resultingopportunities for failure and a fundamental flaw in traditional quality thinking. He concluded that amuch higher level of internal quality was required and convinced Galvin of the importance of settingSix Sigma as a quality goal. Smith’s holistic view of reliability (as measured by mean time to failure)and quality (as measured by process variability and defect rates) was indeed new, as was the SixSigma quality objective.
Prior to Smith’s analysis, a number of gurus, including Joseph M. Juran, Dorian Shainin,Genichi Taguchi and Eliyahu Goldratt, had presented their programs for quality and productivityimprovement at Motorola. Mikel Harry, president of the Six Sigma Academy and co-author of SixSigma: The Breakthrough Management Strategy Revolutionizing the World’s Top Corporations,attended some of these programs and developed a program for the Government Electronics Divisionof Motorola that included Juran’s quality journey, statistical process control (SPC) and Shainin’sadvanced diagnostic tools (ADT) and planned experimentation (PE).
Harry later teamed with Smith on the Six Sigma initiative and created Motorola’s Six SigmaInstitute prior to forming his own firm. Smith and Harry’s initial Six Sigma umbrella included SPC,ADT and PE. Later, they added design for manufacture (product capability and product complexity)and, as quality was linked to business performance, accomplishing quality through projects.
Motorola’s design margin had been 25 percent (or 4s or Cp = 1.33). When Smith noted thatescaping and latent defects under this strategy were far too high, he reasoned that the disparitybetween actual reliability and the reliability expected at final test could be accounted for by increasedproduct complexity and deviations of the process mean from the target value, arriving at a value of1.5 sigma. The complexity phenomena had been noted previously by Wernher von Braun in the U.S.space program: If a large number of components must function for a system to accomplish its objective,the probability of system success diminishes rapidly as the number of components increases unlessthe reliability of each is essentially perfect. The 1.5-sigma deviation remains controversial, but it’snot a fundamental issue. What is important is that Smith recognized that a process mean could not bemaintained exactly on target, and when it deviated from target, the traditional three-sigma processproduced large numbers of parts that exceeded specifications. Thus, this breaking with the three-sigma quality tradition was a major contribution, as was the recognition of the role of complexity,which dramatically increases the number of opportunities for (and thus, probability of) defects andthe likelihood of subsequent system failure.
But what about the existing theory of optimal quality levels? Motorola observed that Japaneseproducts were of much higher quality than was predicted by the traditional optimal quality levelcurves. Independently, Robert Cole investigated this issue and noted several reasons for this changein the quality viewpoint. Japanese quality professionals, he asserted, realized that the costs of poorquality were far larger than had been supposed; recognized that focusing on quality improvement asa companywide effort improved a wide range of performance measures; established a system thatmoved toward quality improvement and low-cost solutions simultaneously; shifted the focus ofquality improvement from product attributes to operational procedures; developed a dynamic model

in which customer demands for quality rise along with their willingness to pay for these improvements; andfocused on preventing error at the source, thereby dramatically reducing appraisal costs.
As Motorola set out on its quality journey, Harry noted that the company ran into a five sigmawall. Motorola found that it could attain a three-sigma level by installing process improvement andcontrol in its own installations, and improve this to the four- or five-sigma level through the educationof its suppliers. However, Six Sigma only became possible once the company had attained a betterunderstanding of the role of robust design—systems design, parameter design and tolerance design.
Not coincidentally, Motorola won the Malcolm Baldrige National Quality Award shortlyafter the rollout of Six Sigma. Receiving the Baldrige Award requires the winning company to presentits concepts to the world. Thus, as Six Sigma was approaching adolescence, quality professionals atMotorola were describing their methods to their colleagues and learning how far Motorola hadadvanced in comparison to other companies. At this point Harry wrote a strategic vision for acceleratingSix Sigma. This included a change in focus, anchoring quality by dollars and seeking a businesstransformation. It included a description of different competence levels in the Six Sigma methods,which, in the karate tradition, were designated by belts—Green Belt, Black Belt and Master BlackBelt.
Elsewhere, GE’s Jack Welch and AlliedSignal’s Larry Bossidy (first at GE Financial) ledtheir organizations’ cultural change through Six Sigma initiatives. In 1998, Business Week reportedthat GE saved $330 million through Six Sigma, doubling its CEO’s previous prediction. Welch haspredicted a savings of $10 billion over five years. It’s no wonder Six Sigma has gained industry’sattention.
15.5 Implementing Six Sigma
After nearly two decades of experience with Six Sigma and TQM, there is now a solid bodyof scientific research regarding the experience of thousands of companies implementing majorprograms such as Six Sigma. Researchers have found that successful deployment of Six Sigmainvolves focusing on a small number of high-leverage items. The steps required to successfullyimplement Six Sigma are well documented.
(1) Successful performance improvement must begin with senior leadership. Start by providingsenior leadership with training in the philosophy, principles, and tools they need to preparetheir organization for success. Using their newly acquired knowledge, senior leaders directthe development of a management infrastructure to support Six Sigma. Simultaneously, stepsare taken to “soft-wire” the organization and to cultivate an environment where innovationand creativity can flourish. This involves reducing levels of organizational hierarchy, removingprocedural barriers to experimentation and change, and a variety of other changes designedto make it easier to try new things without fear of reprisal.
(2) Systems are developed for establishing close communication with customers, employees,and suppliers. This includes developing rigorous methods of obtaining and evaluatingcustomer, owner, employee, and supplier input. Base line studies are conducted to determinethe starting point and to identify cultural, policy, and procedural obstacles to success.
(3) Training needs are rigorously assessed. Remedial basic skills education is provided to assurethat adequate levels of literacy and numeracy are possessed by all employees. Top-to-bottomtraining is conducted in systems improvement tools, techniques, and philosophies.
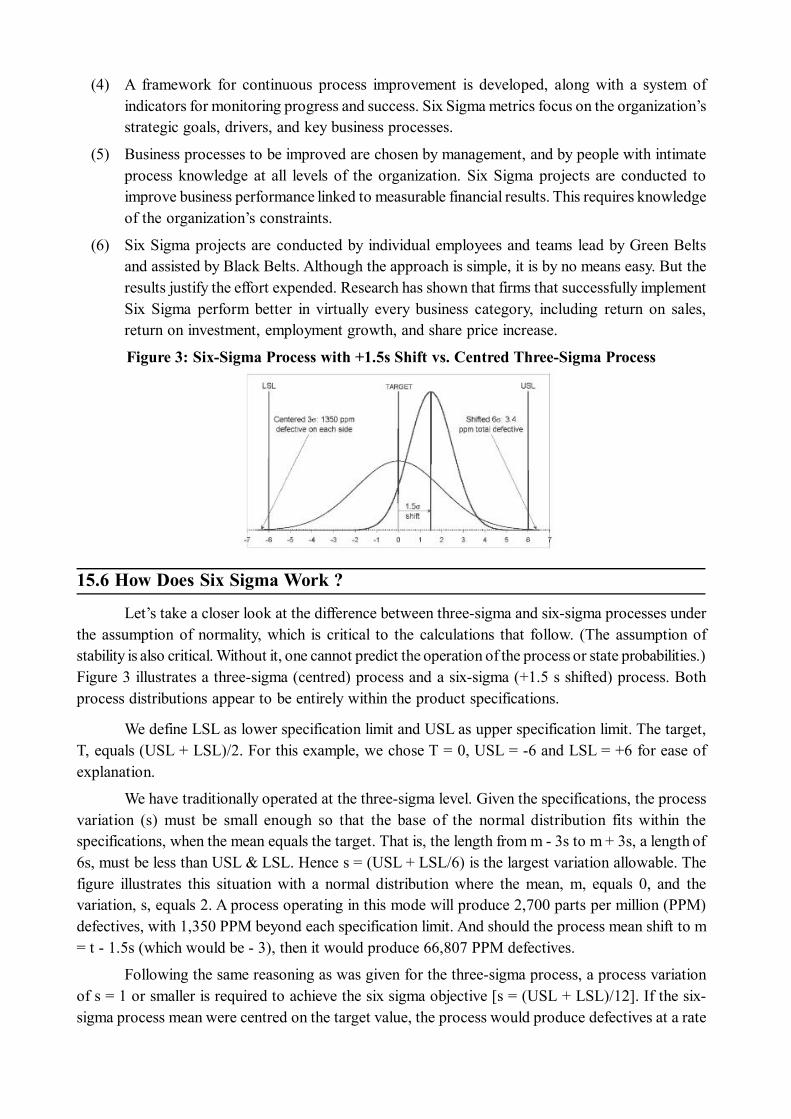
(4) A framework for continuous process improvement is developed, along with a system ofindicators for monitoring progress and success. Six Sigma metrics focus on the organization’sstrategic goals, drivers, and key business processes.
(5) Business processes to be improved are chosen by management, and by people with intimateprocess knowledge at all levels of the organization. Six Sigma projects are conducted toimprove business performance linked to measurable financial results. This requires knowledgeof the organization’s constraints.
(6) Six Sigma projects are conducted by individual employees and teams lead by Green Beltsand assisted by Black Belts. Although the approach is simple, it is by no means easy. But theresults justify the effort expended. Research has shown that firms that successfully implementSix Sigma perform better in virtually every business category, including return on sales,return on investment, employment growth, and share price increase.
Figure 3: Six-Sigma Process with +1.5s Shift vs. Centred Three-Sigma Process
15.6 How Does Six Sigma Work ?
Let’s take a closer look at the difference between three-sigma and six-sigma processes underthe assumption of normality, which is critical to the calculations that follow. (The assumption ofstability is also critical. Without it, one cannot predict the operation of the process or state probabilities.)Figure 3 illustrates a three-sigma (centred) process and a six-sigma (+1.5 s shifted) process. Bothprocess distributions appear to be entirely within the product specifications.
We define LSL as lower specification limit and USL as upper specification limit. The target,T, equals (USL + LSL)/2. For this example, we chose T = 0, USL = -6 and LSL = +6 for ease ofexplanation.
We have traditionally operated at the three-sigma level. Given the specifications, the processvariation (s) must be small enough so that the base of the normal distribution fits within thespecifications, when the mean equals the target. That is, the length from m - 3s to m + 3s, a length of6s, must be less than USL & LSL. Hence s = (USL + LSL/6) is the largest variation allowable. Thefigure illustrates this situation with a normal distribution where the mean, m, equals 0, and thevariation, s, equals 2. A process operating in this mode will produce 2,700 parts per million (PPM)defectives, with 1,350 PPM beyond each specification limit. And should the process mean shift to m= t - 1.5s (which would be - 3), then it would produce 66,807 PPM defectives.
Following the same reasoning as was given for the three-sigma process, a process variationof s = 1 or smaller is required to achieve the six sigma objective [s = (USL + LSL)/12]. If the six-sigma process mean were centred on the target value, the process would produce defectives at a rate

of two parts per billion (PPB), one PPB beyond each specification limit. Should the process mean shift by1.5 sigma, the defective rate would increase to 3.4 PPM defectives. The figure illustrates the latter situation,with a normal distribution where the mean, m, equals 1.5, and the variation, s, equals1.
Note that every process has a variation that can be estimated through a process capabilitystudy. It isn’t determined by the specifications of the product being produced. Here we are determininghow precise a process must be to accomplish a three-or six-sigma objective for the product. P.R.Tadikamalla showed that the 3.4 PPM rate could be obtained in other ways depending upon theprocess spread and the process shift.
15.7 The Six Sigma Methodology
The Six Sigma includes two key methodologies; DMAIC and DMADV.
DMAIC is used for an existing process.
DMADV is used when creating a new product or process. Using DMADV for new projects canusually result in a more predictable process and ultimately higher quality product.
DMAIC :
DMAIC is an acronym for the most commonly used Six Sigma methodology. About 95percent of all Six Sigma projects follow the DMAIC methodology. The acronym is the first letters ofthe stages of a Six Sigma performance improvement project: Define, Measure, Analyse, Improve,and Control. This methodology was developed to provide an organized way to solve problems.Using a standard structure for problem solving, all the process improvement teams go through thesame steps and nothing is forgotten. The methodology also provides standard places for managementreview. In addition, the methodology provides a standard terminology for everybody to use. Thishelps both management and employees know where everybody is on each project. If I say that I’m inthe Analyse phase, then you will know what I mean.
D - Define goals to improve the overall process between company strategy and customer’sdemands (can also refer to group and the groups or individuals that one support) The Definestage is where one start each project. It’s helpful to think of the outputs of each stage to knowwhat the stage does. In this stage one establish the goal of the project. One should know whocustomer is, which process one will be working on, which part of the process one will workon, which of the process variables are important, what the goal is for those process variables,how much money one expect to save or other benefits one will get, when the project will befinished, who the project team is, and who the stakeholders are. It is in the defined stagewhere one first see evidence of Six Sigma thinking. The goal of a project always has to bestated as a measurement, the value of which will be improved. It might be stated as severalmeasurements and goals for each of them. Each of these measurements is an important processoutput that matters to the customer. All six similar projects must identify who the customer isfor each process. The customer sets the acceptable parameters for each of the key processoutputs. These are usually expressed as specifications, but might take other forms. The key isthat no project can proceed unless a quantifiable goal is stated. At the end of the define stageone will have a well-defined project with well-defined and quantifiable goals.
M - Measure current processes. Collect relevant data on current processes and then use thisdata as a baseline for future comparisons. At the output of this stage one should has a thoroughunderstanding of how the process is behaving right now. By understanding means a quantitative

description. This description will include current process variable averages, standarddeviations, behaviour over time, and histograms. In addition, one will know whether theprocess is stable or not. Another thing one will know at the end of this stage is whether or notthe process has a capability and what the value is. Capability is basically the measured abilityof the process to meet customer demands. The sigma level, for which Six Sigma is named, isan example of a capability measure.
To do this entire one has to collect data, and to know what data to collect, one need toknow which characteristics are critical. Sometimes this is determined in the Define stage, butsometimes what are given in the Define stage is not sufficient to collect data. The first thingone would then do is determine the precise measurements necessary to determine processcapability. For example, let’s assume that project is to improve the turnaround time for softwaresupport requests. How is one going to measure this turnaround time? Does it start when theinitiators first think about it? When they create their request form? When they submit theform? When one receives the form? What if there are approvals necessary for the request tobe submitted? Do all of those approvals those have to be finished before the request isconsidered start? In a similar vein, when is this request complete? Does it end when theprogrammer thinks he or she is finished? Does it end when the end user says that it is finished?Is it complete after the end user has tested it? Although this is a simple example, it illustratesthe precise nature of the measurement definition that is necessary to collect data. This mightseem a little picky, but it’s not. Defining precisely when the start and finish points of theproject are helps everybody to agree on a common definition of the critical variable, and itallows to actually collecting data unambiguously.
Let’s talk about data for a moment. One runs the IT organization. One is swimming indata. Any database project should be a snap, right? Some bad news is that the chances thatthe data that one will need are the data that one has might be quite small. Of course, in somecases one will find he has just what he need in his databases. In other cases the agreed-ondefinition will result in the discovery that one doesn’t quite have what is necessary. In addition,for certain aspects of data-based decision making, one need very specific kinds of data,frequently the kinds of data that are not collected by businesses. Businesses collect data fordifferent reasons and problem solving. They collect data to assess financial results. Theymight collect data to determine which of their functions are performing best. The most commondata collected are averages; everybody collects averages. However, as one has already seen,data averages do not tell the whole story. In fact, they tell only about a quarter of the story. Wemerely point this out to make one aware in advance that many Six Sigma process improvementprojects will require that one collect new data. One might consider this bad news, but it is notnecessarily bad at all. If one is not collecting data that will help him to determine processperformance right now, he will be after each project. In addition, it frequently does not takevery many data to make meaningful decisions about process performance. Very often onlyabout one hundred data points are needed to make intelligent decisions. This is so few datathat they can often be collected manually if necessary. In fact, one of the problems with ITorganizations and process improvement is that more time is spent trying to find ways tocollect data automatically when it would be cheaper and faster to do it manually.
A - Analyse relationship within the process. It is important to understand the relationship todetermine factors that can ensure to keep companies strategy in line with their customers

demands. The overall approach in Six Sigma problem solving is to carefully define a problem, findthe root causes for the problem, and then attack the root causes. The purpose of the Analyse phaseis to correctly identify what those root causes are and prove it with data. In this disciplined problem-solving method, opinions are not worth much. In fact, nobody’s opinions are worth much. It is notthat they are valueless, in fact use the opinions of the team to come up with ideas for what the rootcauses are and that is normally the very first thing one does via a brainstorming session. Thenproceed to gather evidence to prove what matters and what doesn’t. This could be a simple exerciseor it could be most of the project, depending on how difficult the problem is and how complex theprocess is. This is where the similarity to the traditional scientific method comes in. Opinions as towhat the root causes are constitute hypotheses. No scientist would act on a hypothesis because it’sjust a guess. They conduct experiments to prove whether the hypothesis is likely to be true or false.Do the same thing. One might be lucky and have historical data that can analyse using some basicstatistics that will help to convince which of “guesses” are true and which are not, or one might hasto conduct some experiments and collect some new data. Again, this could be a simple exercise ora very long and expensive one. How much one is willing to do depend on the value that one wouldgain to solve the problem. Nobody would spend two effort-months to prove or disprove a rootcause hypothesis that would save the company $10,000. They sure would, however, if it had thepotential to save $1 million. Sometimes the cost of implementing solutions is cheap and fast, so onecould abandon scientific method and simply try various solutions. Although this approach might berepulsive to many rigorous Six Sigma people, one is realists, and sometimes trial and error is justplain effective. The difference between random trial and error, however, and a managed decision todo it for a few carefully selected potential root causes that were arrived at in an organized fashion,is huge. As long as one knows what one is doing and why and can defend decision, one see nothingwrong with avoiding experiments. More often than not, though, the analysis of historical data or thecollection of new data because one had not been collecting the right data before to answer thesequestions, or constructing controlled experiments to determine cause and effects are necessary.Figure 3 shows a generalized process with inputs, process variables, environment variables, andoutputs.
Environment Variable
INPUTS OUTPUTS
Figure 4: A simple process diagram.
Every output has multiple characteristics. Project is always defined as improving oneor more characteristics of one or more outputs of a process. For example, reduce the numberof times that incoming support calls take more than three minutes to complete. The output is the call.
PROCESS
(Process Variable)

The characteristic one care about is the call length. The process itself has many variables, of course.Some of them might be how many people one has, what their training level is, characteristics ofphone system, and so on. The inputs in this case are also calls. Some characteristics are the topic ofthe call, the education or experience of the caller, and so on. The environment might include thingslike the time of day, the temperature of the call centre, whether it is a nice day outside, the level ofnoise in the room, the number of disruptions that are present, and so on.
One thing one’s like to point out here is the folly of experience. People are good at a lot ofthings, but people are not very good at determining patterns within complexity. In other words, theyare not very good at determining root causes in complex processes. In fact one will make thestatements that the more experienced someone is, the less likely he or she is to come to the rightanswer of that true root causes are in complex situations. The only exceptions to this are physicalprocesses that are very standardized, such as an oil refinery. The reason one say this is becausepeople feel compelled to give their opinions. In fact, one as a business manager put them into thisposition every day. One demand that they make decisions, even when it’s scientifically impossiblefor them to know they have made the right one, because one has no formal decision-making processin place, yet one still demand decisions so employees make them. They make hundreds of themevery week, and many of them are, in the eyes of the formal problem solver, simply random decisions,half of which are right and half of which are wrong.
The objective of a formal process such as the DMAIC process is to ensure that importantdecisions are usually right and to not allow experience to make those 50-50 calls for us. Experiencecan kill a business. In summary, when one finish the analyse phase of a DMAIC problem-solvingprocess, one knows what is causing problem and one has evidence to back that knowledgeup.
I - Improve the process. It is important to constantly improve and optimize the process,using analysis and other techniques. One technique that is often used is Design of Experiments.(This is a technique that can help to test a hypothesis, using acceptable experimental design)Perhaps it seems like a long time coming if one is the impatient sort, but in the Improvestage, come up with solutions. Finally! This stage also often starts with a brainstormingsession. But now one knows what the root causes are. Let’s reflect a minute on just whatmean by a root cause. A root cause is something that is controllable and has a direct effect onthe characteristic one is trying to improve. If one could has controlled the characteristicitself, if it had a big knob on it one could turn that made it bigger or smaller, one would haveturned it, but it doesn’t. So find root causes that do have knobs on them, things one canchange that will improve the process characteristic one care about. This problem-solvingsession again can be short and simple or long and complex, depending on process. Frankly,at this point most teams have pretty good ideas of what to do, so solutions often flow easily.The hard part, after all, was finding out what the real root causes are. Now that one knowsthem for sure, one can attack them with gusto. In fact, one often has multiple solutionsoffered so one of the things one do in this phase is choose the best one. That might be atechnology exercise, a financial one, an environmental one, or a combination of factors.Sometimes the solution is not obvious and one might have to conduct some other experiments andcollect some new data to figure out what to change. Sometimes solution ideas are easy to come by,but analysing which are the best ones can be very expensive or complex. If problem is where tolocate a new data centre to increase response time, some of the solutions might involve relocation of

data centres, combining them, or adding new ones in various places. How would one choosebetween them? This kind of problem doesn’t lend itself to a calculation answer, but it can be easilysimulated. In fact, dynamic computer simulation is often used to help choose from competing solutionoptions when the effects cannot be calculated and trial and error is too expensive. Simulation conceptsare taught in most Six Sigma Black Belt programs, but actually doing the simulation is a specialtyand normally requires that one use a consultant who knows how because people would normallynever do this or would do it so infrequently that it isn’t cost effective to train them. One of theservices that our firm provides is simulation for project teams.
Not only do figure out what the best solution is in the improve stage, but also implement it!At the end of this stage, the process improvement is installed and the process is now running per ourgoals. Some Six Sigma programs split this stage into two, where the improve stage involves figuringout what the solution is and the implement stage actually implements the solution. This is becausethere are different skills needed to problem solve (improve) and to build (implement) so it seemslike a logical break. Although that is true, most programs only have one I in DMAIC and it’s theteam’s job to get the solution done, even if they subcontract it to another group.
C - Control. It is important ensure that you can control and correct any variances avoidingpossibly costly defects and loss of quality. Many times pilot runs are set up to study process capabilityand production transition. These pilot runs can help fine tune or add additional control mechanisms.The final DMAIC stage is Control. This is unique to the Six Sigma approach. Most managers haveheard of the Hawthorne effect. The Hawthorne effect is a temporary change of behaviour orperformance in response to a change in the environmental conditions, with the response beingtypically an improvement. The term was coined in 1955 by Henry A. Landsberger when analysingolder experiments from 1924 to 1932 at the Hawthorne Works (outside Chicago).
Landsberger defined the Hawthorne effect as a short term improvement caused by observingworker performance. In other words, it’s not what you did that improved performance, it’s the factthat you paid attention to it that caused everyone around you to behave better than normal. As soonas you leave, things will go back to where they were. Even if the Hawthorne effect isn’t operating onyour project, because your problems are more technical and equipment oriented and less reliant onpeople’s behaviour, there is still a tendency for systems that have undergone an improvement todegrade back to where they were. This happens for a lot of reasons, including the habits of people,but regardless of the reasons, if you want your improvement to stay there forever without youwatching it, you need to build something into the process that will ensure it. That’s what the Controlstage is in Six Sigma. In this stage the team makes sure that appropriate things are done so that theprocess will continue to perform at its new level. This can include administrative things like makingsure that training materials or written procedures are modified, making sure that new specificationsare transmitted and understood by everyone who needs them, including suppliers, and making surethat critical control points are monitored and that procedures exist to react quickly when somethinggoes out of balance. The Control phase isn’t as exciting as the other phases because it tends toinvolve administrative and wrap-up activities, but the wise business owner will not let Six Sigmateams call their project finished until the Control phase is done. In Value-Train’s Black Belt program,student project reports are not accepted unless they include a Control phase plan. So there youhave it, Six Sigma in five letters—DMAIC.
Six Sigma is called a tools-based methodology because the DMAIC framework itself is
fairly simple, and most of the work is done using a variety of tools such as flowcharts, variousstatistics, control charts, brainstorming exercises, and so on. Most of the specific tools and techniquesused in all of these phases might already be familiar to you. In fact, very little was actually inventedby the creators of Six Sigma. Their two most obvious inventions were the DMAIC process itselfand the notion of a capability index called the Sigma Level, for which the methodology was named.It is for this reason that people with a background in quality, process improvement, or scientificapproaches might already know many of the specific tools that they need to participate on a SixSigma project team. Unfortunately, many business decisions, even very important ones, are madeby the seat of our pants, so a formal methodology like this is very useful to make sure that somerigor is used in your process improvement decision making. As with anything, efforts like this dependheavily on management. If you train your people on how to do the Six Sigma approach and don’tuse it yourself or don’t allow them the time to make good decisions, or demand fast answers thatcan’t be justified, you will be your own worst enemy. From our experience, about half of all thecorporations trained in Six Sigma approaches fail to use it effectively because senior managementreally doesn’t believe in it. They don’t enforce decision-making rigor and don’t use it themselves.Your people will emulate your behaviours, regardless of what you send them to training for.
DMADV :
There are 5 important steps included in DMADV. They are:
D - Define goals that are consistent between your business strategy and customer demands.
M - Measure CTOs (critical to qualities) CTOs consist of production process, capabilitiesproducing a product, the capability of a product and any risk assessments.
A - Analyse and evaluate many different designs, choosing the best design for its overallqualities.
D - Design details. It is important not only to design a product, but optimize the designfeatures. In order to fully optimize a design feature, you may be required to create multiple designsor simulations.
V - Verify the design. Important steps to verifying a design include setting up pilot runs andrunning a short production. This step also requires you to handover the design to process owners.
15.7.1 Implementation Roles in Six Sigma Methodology
There are many roles that are used in the Six Sigma Methodology. While most of the roles beloware used in many organizations Six Sigma implementation, it should be noted that they are not universal. Theroles include:
Executive Leadership - Top level executives are responsible for vision and ultimatelyimplementation of the Six Sigma Methodology. They also empower others to take initiativeand ownership of the Six Sigma principles.
Champions - Champions are usually upper management that is responsible for theimplementation of Six Sigma throughout their organization.
Master Black Belts - are usually hand picked by Champions to coach others within theorganization on the Six Sigma methodologies. They allocate either all or most of their timeto the Six Sigma methodologies. It should also be noted, that they usually have mentoringresponsibilities to coach and train lower roles including Black Belts and Green Belts (see

below)
Experts - while this role is not in every organization, it can play a huge role in major engineering ormanufacturing sectors. They improve overall services, products, and processes for their endcustomers.
Black Belts - Black Belts focus on six sigma execution. They are usually middle managers.
Green Belts - These roles are usually taken on by employees who help Black belts executespecific projects, as well as other job responsibilities.
15.8 Downsides of the Six Sigma Methodology
For the vast majority of organizations, the Six Sigma methodology has helped them becompetitive and reduce costs; however it should be noted that there are some downsides that doexist. In order to implement the Six Sigma methodology in an organization, it is extremely importantto have buy- in from employees on all levels. If associates, middle managers or high level executivesare not enthusiastic about using the Six Sigma Methodology, it can ultimately lead to failure.
Another downside of using Six Sigma is that in some instances, Six Sigma’s effectivenesshas never been measured or is unable to be measured. Due to the inability of measurements, it isunclear if Six Sigma is actually helpful.
Finally, many organizations use the Six Sigma methodology as a way of protecting themselvesfrom liability. For instance, if a company produces a product that is low in quality or can harm itsuser, the organization can use the defence that quality is at the forefront in order to be viewed positively.In this respect, it is unclear if an organization has implemented Six Sigma for its methodology or tocover its liability.
15.9 Key Words
• Critical to Quality: Attributes most important to the customer.
• Defect: Failing to deliver what the customer wants.
• Process Capability: What your process can deliver.
• Variation: What the customer sees and feels.
• Stable Operations: Ensuring consistent, predictable processes to improve what the customersees and feels.
• Design for Six Sigma: Designing to meet customer needs and process capability.
15.10 Summary
Ultimately, Six Sigma is a superb strategy that addresses leadership, tools and infrastructureissues, some of which were neglected by previous programs. CEOs of leading U.S. firms praise theaccomplishments of their Six Sigma initiatives. Outstanding quality professionals and industrialstatisticians concur and describe potential roles for their colleagues. Engineering programs havebegun to incorporate elements of Six Sigma into their curricula. When have quality professionalsever had such a splendid opportunity to contribute? Constructive criticism of Six Sigma or any otherquality program can be useful—but it should be informed and fair.

15.11 Self Assessment Test
1. What is six sigma?
2. Explain roles that are used in the Six Sigma Methodology?
3. Explain the six sigma methodology?
4. Discuss DMAIC & DMADV?
5. Explain how six sigma works?

Unit 16 Maintenance ManagementStructure16.0 Objectives16.1 Introduction16.2 Failure Analysis of Equipments16.3 Types of Maintenance System16.4 Maintenance Policy16.5 Maintenance Planning System16.6 Maintenance Performance Indices16.7 Total Productive Maintenance16.8 Computerised Maintenance Management System16.9 Summary16.10 Key Words16.11 Self Assessment Test
16.0 Objectives
Upon completion of this unit you should be able to: Relate the objective and importance of maintenance management. Understand the failure analysis related to equipment and machines. Distinguish between various types of maintenance. Comprehend that the efforts involved in maintenance planning are worth it. Identify some of the key indicators for improving maintenance service. To have insight about recent trends in maintenance including computerized maintenance
management and Total Productive Maintenance.
16.1 Introduction
Maintenance in general, has been practiced, since the days when man started activity such ashunting and making pots. Maintenance is very important to extend the useful life of an asset. It hasbeen a challenging task since the beginning of industrial revolution. Maintenance directly affectsquality, productivity, profits, safety and environment. Maintenance is basically a combination ofactions carried out to retain an item in, or restore it to, an acceptance conditions. Main objective ofmaintenance is to have increased availability of production system with increased safety and optimizedcost. In case of equipment we can say maintenance means keeping the equipment in operationalcondition or repair it to operational mode.
A formal definition of Maintenance can be stated as "That function of manufacturingmanagement that is concerned with day to day problem of keeping the physical assets in satisfactoryconditions". Maintenance ensures condition of the facility such that it permits uninterruptedimplementation of plans requiring their use. It can also be termed as asset management systemwhich keeps them in optimum operating condition. Maintenance is one function with has not been

rendered obsolete by advanced technology, has not faded away with passage of time & has not lostits stature in industry.
16.1.1 Objectives of Maintenance Management -
Maintenance management is concerned with planning and controlling routine, planned andpreventive maintenance activity of an organization .
The management of maintenance activity has to concern itself with provision of un-interruptedproduction process at minimum cost and maximum reliability. The following are the objectivesof a maintenance system.
i. To maximize the amount of time the assets will be available for the purpose for which thesewere procured.
ii. To preserve the value of assets by reducing the rate at which they deteriorate e.g. periodicremoval of rust from the hull of a ship and repainting the areas involved preserves its value.
iii. To perform the maintenance activities in a most economical manner.
iv. To plan and schedule maintenance work so as to anticipate and prevent interruptions inoperations.
v. To perform the activities of inspection, adjustment, repairs, replacements and operation ofthe shop performing the various jobs.
16.1.2 Importance of Maintenance Management
1. Good maintenance management is important for company's cost control. As companies try tobecome more competitive by adopting advanced technology they have to rely more onequipment and so these equipment should operate reliably with in specification and theirmaintenance become essential for the companies.
2. Quality assurance is another basis for a successful competitive edge. If the equipments areinconsistent & not maintained properly then they may produce defective parts that may failto meetthe established specification.
3. Manufacturing organization specifically those who rely on JIT have very low inventory leveland offer no protection in a situation of lengthy equipment failure which can lead to cost ofidle equipment, cost of idle labour, loss of sale and even companies can permanently loosetheir market shares.
4. Proper maintenance management can help a company to remain productive and comptetive.If maintenance is overlooked, it can have its impact on idle labour costs, low quality productsand overall loss to the company.
16.1.3 Functions of Maintenance Management
The basic function of maintenance activity is to keep the equipments and assets in a satisfactorycondition or to restore them to these conditions. Maintenance function can be:-
1. Repair - When any item or a component breaks down then repairing or replacing it to keepit in working order.
2. Overhaul - In this function of maintenance the equipment or machine is stripped and thevarious parts are cleaned and oiled and critical components are replaced.

3. Lubrication - This function of maintenance reduce the gradual damage to the moving part byconverting solid friction to liquid friction and thus prolonging the life of the equipment.
4. Inspection - Maintenance inspection involves detection of faults before they break down andensure safe and efficient operation.
Besides, the basic functions, broadly, the major functions of a maintenance department aremaintenance of installed equipment and facilities, installation of new equipments and facilities,inspection and lubrication of existing equipment and applying corrective maintenance technologieswherever required, to do modification of already installed equipments and facilities, management ofinventory, supervision of man power & keeping records.
16.2 Failure Analysis of Equipments
The objective of maintenance is to facilitate the optimal use of capital equipment throughaction such as replacement, repair, service and modification of the components of the machinery.Failure analysis plays a vital role in taking decision pertaining to maintenance planning and controlfor effective management subject to budgetary constraints. It is important to identify the nature andoccurrence of failures with respect to time so as to ensure adequate and reliable performance. Mostsituations in area of maintenance involve probabilities and on understanding of the statistics offailure, may provide useful information for making maintenance decision on a prior to the failure ofan equipment. Answer related to question like how long was the machine component working beforeit failed i.e. the time to failure "t" and what percentage of instances did it fail at time "t" obviously thedata collected will be in ranges like range of days it functioned before failure etc. These data can beapproximated to a continuous probability distribution.
In maintenance we come across three types of probability distribution for the time of failurenamely: Hyper Exponential distribution- It shows a steep fall in the probability density functions asthe time to failure increases i.e. chances of a failure are high in initial period very much less in later,as in case of any built in design defect which is evident by the graph below;
Normal distribution- A majority of failures occur around mean time to failures and failures showrelated frequencies around the mean. Such a behavior is observed in the wear out of components ormachine. Some will wear out faster and some will do slower. The curve for such will be as shownbelow.
Prob
abili
tyde
nsity
func
tion
Time to failure

Negative exponential distribution - The phenomenon of failure where the probability of failure isconstant and independent of running time i.e. cause of failure is external to the system, for examplean electrical fuse blows up because of a sudden extra load elsewhere or a short circuit else where.The curve will be.
Combining the three figure of age specific failure rate to give a whole life figure & the resultwill be as shown in figure below which resembles a house hold bath tub in its contour.
The three distributions mentioned above can be combined into one distribution namely, Weibulldistribution. The bath tub curve depending on the failure rate can be represented by a Weibull distri-bution and Weibull graphs can be used for determining mean time between failures which wouldprovide good data for system reliabilities.
16.3 Types of Maintenance System
Different types of Maintenance System are as under :
1. Preventive Maintenance -
Also termed as Diagnostic or Predictive Maintenance consists of routine actions taken in aplanned manner to prevent breakdown and to ensure operational accuracy. It is undertakenbefore the need arises and aims to minimize the possibility of un- anticipated productioninterruptions or major breakdown. Preventive maintenance is a stitch in time procedure fol-lowing the principle that "Prevention is better than Cure". Any preventive maintenanceprogramme should contain features like proper identification of all items, adequate record
f(t)
Mean line of failure t
f(t)
t
Age
Spe
cific
Fa
ilure
rate
II Cause of Failure accidental
III Wear out Phase
I Warranty Phase
Time to failure
covering, volume of work inspection in definite schedule, an inspection frequency schedule,well qualified inspectors etc. Lubrication and inspection are also two major constituents ofpreventive maintenance. Lubrication ensure long and safe working of equipments withoutany risk and inspection tries to detect faults in equipments so that decisions related to timelyrepair or replacement can be done.
Benefits from preventive maintenance are :
-Reduction of total down time and consequent reduction in production losses.
-Reduction in number of accidents in the plant.
-Reduction in the unplanned or crisis management in maintenance.
-Reduction in the inventory of spare parts.
-Reduction in major repairs & consequently reduced maintenance expenses.
-Reduction in production of number of defective parts.
2. Break Down Maintenance
It occurs when there is a work stoppage because of machine breakdown. It is maintenancecarried out to restore an item which has ceased to meet an acceptable condition. It is moreeconomical for those equipments whose down time and repair costs are less.
3. Emergency Maintenance
An unplanned maintenance which is necessary to put in hand immediately to avoid seriousconsequences.
4. Planned Maintenance
In this type of system the maintenance work is planned in advance, is executed as per sched-ule and action taken are recorded on compeletion and historical data so produced and main-tained are reviewed and analyzed for accomplishing better performance. It is a maintenancewhich is organized and carried out with forethought, control and record to a predeterminedplan.
5. Running Maintenance
Maintenance which can be carried out when the item is in service.
6. Shutdown Maintenance
Maintenance which can be only carried out when the item is out of service,
7. Design out Maintenance
It aims at minimizing the effect of failure and aims at eliminating the cause of maintenance.Itis a design oriented curative means aimed at rectifying a design defect originated from im-proper method of installation or poor choice of materials etc. It calls for strong design andmaintenance interface. Design out maintenance aims to eliminate the cause of maintenance.Itis suitable for items of high maintenance cost.
8. Corrective Maintenance
It is carried out to restore an item which has ceased to meet an acceptable condition andinvolves minor repairs.The emphasis is on obtaining full information of all breakdowns andtheir causes.

9. Condition Based Maintenance:It is carried out in response to a significant deterioration in unit as indicated by a change in amonitored parameter of the unit condition or performance. Condition-based maintenancethus reduces injuries and fatal accidents caused by machinery as the conditions of machineryare indicated well before hand. It enables the plant to be stopped safely when instant shut-down is not permissible. Moreover, it permits advanced planning to reduce the effect ofimpending breakdowns and be in time to have necessary spare parts available. However,condition monitoring is not always used because it involves high manpower and monitoringcosts and, furthermore, it is difficult to monitor some parameters.
10. Time Based Maintenance:
This Maintenance is carried out for equipments for which the failure of any item is timedependent and expected to wear out with in the life of equipment.
Various maintenance systems can be summarized as shown in Figure below:
Where,
PM: Preventive Maintenance
TBM: Time Based Maintenance
CBM: Condition Based Maintenance
BM: Break down Maintenance
CM: Corrective Maintenance
16.4 Maintenance PolicyMaintenance polices of a company should primarily focus on issues concerned with work
allocation ,work force , interplant relations and extent of activities etc. Maintenance policy dependson type of work involved, amount of work and expediency with which work must be accomplished.Different companies follow different policies and practices. For examples small plant may use main-tenance department for simple repair & replacement and large non-production engineering job is
Maintenance
Planned
Unplanned
BM
PM
CM
TBM
CBM Visual
Instrument
Periodic Checks
Periodic Inspects
Periodic Service
Daily checks

handled through outsides specialists. Large companies on the other hand, with more specialist staffmay assign all major non-productions engineering jobs to their maintenances department where as,in some companies responsibility for planning and change is placed with maintenance departmentwhile the actual construction is led to outside contractors depending on which ever is cheaper whichmay depend on type of work involved. In case of policies related to equipment maintenance nor-mally two practices are adopted. One is to have a well planned and organized maintenance programmedesigned to secure maximum life and utilization of machinery while the other one is to adopt apolicy of minimum maintenance and maximum wear. Policies related to work force and size ofmaintenance department depends on factors like the cost of having a large maintenance crew, andprompt service, skeleton staff with lower cost and delayed maintenance services. Issues discussedabove and related matter pertaining to maintenance department should be decided by top manage-ment and once the policy is formulated it should be circulated to every department so that limits ofresponsibility and authenticity may be defined properly for a proper and smooth working.
The diagram below provides a broad guideline for formulating an appropriate maintenancepolicy.
Normal mode of failure and high or substantial MTTF (mean time to failure)
Preventive replacement Run till it fails (Preference depends upon relative costs)
Simple Replaceable item
Normal mode; Low MTTF Design or Operating condition
(i.e., speed, r.p.m., frequency, etc.) Run till it fails Preventive replacement
If the above cannot be effected, then the choice depends upon relative costs.
Run till it fails Negative exponential mode of failure; high or substantial MTTF
Normal mode of failure Detection of failure expensive
Prev. replacement Run till it fails Conditions monitoring Design changes
(if MTTF low)
Condition monitoring Prev. replacement Run till it fails Design changes
(if MTTF low)
Detection of failure not very expensive compared to down-time cost
Complex Replaceable item
Negative exponential failure mode
Design changes Condition monitoring Run till it fails
Run till it fails Condition monitoring
Low MTTF Preference depends upon relative costs
High MTTF Preference depends upon relative costs

16.5 Maintenance Planning System:-
Planning and Scheduling is a disciplined approach for utilizing the existing maintenanceresources to reduce down time and minimize overall production cost. This is accomplished throughactivities like prioritizing work, developing the physical steps to complete the job, procuring neces-sary tools and materials, scheduling the work of be done, completing the work, identify any addi-tional work to be completed on the equipment, filing written documentation for equipment historyetc. This can be achieved through having a proper maintenance organization. Maintenance planningsystem involves a systematic approach. The procedure commonly used is.:-
Maintenance Request:- It is document which serves as a prerequisite for planning maintenancefunction which includes the information regarding what exactly the labour force in doing and howlong each task takes. The maintenance request by production staff details the defect or work believedto be requiredAssets/Facility Register:- This register contains the name, code, description, reference numberspertaining to manufacture, suppliers, user location with provision for changes if item is interchange-able or mobile & suppliers details of each & every asset & facility whose maintenance is to lookedfor.Maintenance Scheduling:- After knowing what is to be decided i.e. about our assets next step is todetermine how they are to be maintained. For this a maintenance schedule is prepared which in-cludes grade of labour required, frequency and details of work to be done, and estimated time forexecution of the work.Work Specification:-After preparing maintenance schedules next is to prepare work specificationwhich establishes a communication between the expert and the person who would be doing thatparticular job.Programming time bound planned maintenance programmes:- After preparing maintenanceschedules regarding what to maintain and how to maintain next step is to decide when to maintain.For this we prepare annual maintenance programme over a period of time, planned maintenancesignificantly reduces the demands of maintenance department. From annual planned programmeswe can derive short interval programmes as wellInspection Report:-This document contains all the data regarding maintenance and is used only forreporting the results of planned productive maintenance inspections.History records:-The last step of a planned maintenance procedure is to build up a detailed histori-cal record of results of maintenance of every asset. This record should be properly updated so thatthey can be referred to and made use of more meaningfully.
Maintenance record system should provide information like the percentage of planned workachieved ratio of planned to unplanned work, downtime for the period, equipment failure patterns,performance details for personnel, trends in spare part consumption & many more related informa-tion.
Beside the above discussed maintenance procedure related to the needs of engineering func-tion decision making aspect is also essential. If management has to be truly effective & objective itmust be provided with timely and appropriate information by maintenance organisation.
A maintenance organisation can be considered as being made up of three necessary andinterdependent components mainly resources like men, spares and tools, administration which

includes a hierarchy of authority and responsibility for deciding what, when and how work should becarried our and work planning and control system which is a sort of mechanism for planning andscheduling the work and feeding back the information that is needed for correctly directing themaintenance effort towards defined objective. From above discussion we can have the followingmaintenance planning flow chart:
Maintenance Planning/Work order flow diagram
16.6 Maintenance Performance Indices
Although there is no such yardstick to rate maintance. Unlike direct production which can berated in terms of output of any particular machine, no such analytical yardstick is available for ratingmaintenance but for maintenance one should essentially strive to maximize availability andreliability of the machines/ assets and minimize downtime. Maintenance though a support function,is certainly linked to increase in the productivity of the system in the long run. Chandra (Chandra D.1976, Design out maintenance and Instrument Aids, University Book Corp., Bombay) has proposedsome indices as below, which might help management achieve their objectives more effectively andefficiently.
Enter Work request
Plan Work request
Approve work plan Work order on hold
Work order ready for scheduling
Work order in process
Work order Completed
Work order sent to history
1) Maintenance productivity index = effortenanceintmaoftcosThe
productofoutputThe
2) Maintenance cost index = CostCapital
100xCostMaitenance
3) Downtime index = hoursoductionPr
100xhoursDowntime
4) Waste index = outputtotalofQuantity
100xoducedPrWasteofQuantity

Also,
availablehoursmanTotal100breakdownonspenthoursTheindexenanceintMaBreakdown)1(
availablehoursmanTotal100enanceintmascheduledonspenthoursTheenanceintMaofLevel)2(
outcarriedinspectionofutesmindardtansTotalinspectionimprovedonsavedworkoftesmindardtanSesseffectivenofInspection)3(
hoursmanenaceintmaTotalyeartheduringmadeificationsmodoradditionsfromresultingtscosmaterialandlabourinsavingAnnual
RatioCompetenceTechnial)4(
16.7 Total Productive Maintenance
The basic concept of maintenance management relates to the fact the breakdown are inevi-table. There is always a comprising attitude between preventive maintenance and the breakdownmaintenance. On this score the Japanese have shown a new path to the world of management byceaselessly working towards the ideal goals of zero breakdown and zero defect or zero defectivesbut for the west it is a new way of looking at maintenance. Less the breakdown of machinery, the lesswould be the proportion of defective quality. Breakdown of equipment can occur in the followingdifferent ways.
1. Equipment stops performing its function
2. Equipment deteriorates
3. Equipment has hidden defects
All these type of breakdowns have to be eliminated. There is no room for trade-offs. This isthe rationale behind the Total Productive Maintenance (TPM). The objective of TPM is much widerthan just minimizing equipment downtime; the objective is to minimize the life cycle costs i.e. thecosts for the entire life span of the equipment.
It is basically a maintenance progrmame which involves a newly, defined concept for main-taining plant & equipment. The goal of TPM is to markedly increase production while at the sametime, increasing employer motivation & job satisfaction TPM bring maintenance into focus. Downtime for maintenance is scheduled as a part of the manufacturing day. The goal is to hold emergencyand unscheduled maintenance to a minimum.
Earlier, equipment maintenance was not practiced to be preventive and predominantly in-volved just the act of repairing a piece of equipment after it breaks down (break down maintenance)Factory managers eventually realized the importance of preventing equipment breakdown in orderto boost productivity. Thus, system for subjecting equipment to scheduled maintenance activities inorder to prevent unforeseen breakdowns (preventive maintenance) became popular. Under the scheme,equipment maintenance is the sole responsibility of technical personnel.
TPM includes
1. Optimizing equipment effectiveness by elimination of all types of breakdown or failures,speed losses defects and other wastes in operations.

2. Autonomous Maintenance by operators, which means the people who operate the machineswill look after their machines by themselves. This would mean training and involvement ofthe operators. The idea is that the operating people would get to know their equipment evenbetter so that they will be able to contribute not only in maintenance of the preventive andbreakdown kind but also in the prevention of maintenance itself through their suggestionsfor improved design of machines, processes, systems, materials and products.
3. Company-wide involvement of all employees through small group activities which wouldsupport the above. Such participative management would enhance creative thinking and cross-flow of information. Continuous improvement comes through such participative processes.
We say that, TPM refers to a management system for optimizing the productivity ofmanufacturing equipment through systematic equipment maintenance involving employeesat all levels. Under TPM, everyone is involved in keeping the equipment in good workingorder to minimize production losses from equipment repairs assists, set-ups, and the like.
Under TPM, operators no longer limits themselves to simply using the machine andcalling the technician when a breakdown occurs. Operators can inspect, clean, lubricate,adjust, and even perform simple calibrations on their respective equipment. This frees thetechnical workforce for higher-level preventive maintenance activities that require more oftheir technical expertise. Management should also show interest in data concerning equip-ment uptime, utilization, and efficiency. In short, everyone understand that zero breakdowns,maximum productivity, and zero defect are goals to be shared by everyone under TPM.
In a nutshell we can say, aside from eliminating equipment downtimes, improvingequipment productivity, and zeroing out defects TPM has the following goals; improvementof personnel effectiveness and sense of ownership, reduction of operational costs, reductionof throughout times, and customer satisfaction down the road.
TPM has eight Key Strategies :(1) Focused improvement (Kaizen);(2) Autonomous Maintenance(3) Planned Maintenance(4) Technical Training(5) Early Equipment Maintenance(6) Quality Maintenance(7) Administrative and Support Functions Management(8) Safety and Environment Management
At the same time, TPM eliminates six big losses:(1) Breakdown, which can result in long, expensive repairs;(2) Set-ups, conversions, and changeovers;(3) Idling and minor stoppages(4) Reduced equipment speed(5) Defect and Rework(6) Start-up Losses
Also, TPM requires the mastery of four equipment maintenance techniques:(1) Preventive Maintenance to prevent breakdowns;(2) Corrective Maintenance to modify or improve an equipment for increased reliability and
easier maintenance;(3) Maintenance Prevention to design and install equipment that are maintenance-free; and(4) Breakdown Maintenance to repair equipment quickly after they break down.
16.7.1 Steps in Introduction of TPM ProgrammeSTEP A - Preparatory Stage-
STEP 1-Announcement by Management to all about TPM introduction in the organization:Proper understanding, commitment and active involvement of the top management in neededfor this step. Senior management should have awareness programmes, after which announce-ment is made to all. Publish it in the house magazine and put it in the notice board. Send aletter to all concerned individuals if required.STEP 2- Initial education and propaganda for TPM:Training is to be down based on the need. Some need intensive training and some just anawareness. Take people who matters to places where TPM is already successfully imple-mented.STEP 3- Setting up TPM and departmental committees :TPM includes improvement, autonomous maintenance, quality maintenance etc., as part ofit. When committees are set up it should take care of all these needs.STEP 4- Establishing the TPM working and target:Now each area is benchmarked and fix up a target for achievement.STEP 5- A master plan for institutionalizing wherein TPM becomes an organizational cul-ture.
STEP B- Introduction Stage -All concerned are invited suppliers as they should know the quality supply is essantial re-
quirement from them and related companies and affiliated companies who can be the customers,sister concerns etc. Some may learn and some can help and thus creating awareness that the organi-zation cares for quality output.STEP C- Implementation -
In this stage all the 8 activities or strategies which are essantial for development of TPM arecarried out.
The first four activities are for establishing the system production efficiency, others for initialcontrol system of new products and equipment, for improving the efficiency of administration andfor control for safety, sanitation and working environment.STEP D- Institutionalizing Stage
This is the maturnty stage where TPM now becomes an oranizational curlture.
16.8 Computerized Maintenance Management System "CMMS"
Historically, most system for managing activities were manual. Every thing from index cardto memo files, to wall mounted log charts. These outdated method were cumbersome, incompleteand inefficient and were generally used inconsistently

Also, The potential costs of doing nothing are high. Industry statistic show that billions ofour currency are spent annually to maintain physical plants, commercial buildings, educational &healthcare facilities. A large amount of currency spent on maintenance are wasted due to poor orinadequate maintenance management. When scheduled maintenance is not followed, premature break-down is a certain come out. The associated cost of breakdown do not stop with equipment repair andreplacement, there are also the realties of unproductive down time, loss of business, displacement ofbuilding, uneven workload overtime and emergency inventory purchasing and so maintenance func-tion is a very important aspect.
With the dawn of computer age it was recognized that computer software could be used torecord works requirment, track the status of work and analysis recording data. Computer aided main-tenance management is a much more reliable & better overall maintenance tracking system.
Computer Maintenance Management Systems is a computerized system to assist with theeffective and efficient management of maintenance activities through the application of computertechnology.
The Maintenance Process
It has been developed to organize, expatiate and monitor all maintenance activities. CMMSare usually fragmented into inventory, preventive maintenance and work order tracking.
CMMS maintains a complete database of information about an organization maintenanceoperation which is intended to help maintenance worker or crafts man do their jobs more effectivelylike which machine requires maintenance and which store rooms contain the spare part. They needand help management make informed decision like calculating the cost of machine breakdown re-pair versus preventive maintenance. CMMS data may also be used to verify regulatory compliance.
As CMMS program have to be integrated, allowing control of all the major areas of mainte-nance in one system, the system vary in size allowing organization with 5 to 5000 workers to be costeffective in using them. The need for and use of CMMS is not specific to any one industry or type ofapplication. Any facility or corporation that has a maintenance workforce is potential user of a CMMsystem. However, each organization will have some differences in their requirements to be costeffective in using them.
The impact of CMMS :-
Reduce equipment downtime through the benefits of regular scheduled preventivemaintenance.
Equipment (Assets)
Work orders
History Inventory/ labour
Schedule & Execute

Increased equipment lifeIncreased craft productivityReduction in stores inventoryReduction in emergency and critical maintenance.
The Need of a CMMS Today1. The Safety Factor - Many facilities have to review their maintenance system if they are to
bring creditability to their maintenance departments.For Example :- Fires in the airport havebeen attributed to bad maintenance,
2. The Cost Factor - An effective maintenance management program results in savings inmaintenance time and costs, improve productivity.
3. The ISO Factor - Many manufacturing companies are implementing ISO. A maintenancesystem is now a requirement under ISO 9002.
4. The Productivity Factor - In an effort to have an edge over their competitors, many compa-nies are turning toward TQM (Total Quality Management) of which TPM (Total ProductiveMaintenance) is a major program. One of the key element in TPM is a Maintenance System.
16.9 Summary
Maintenance means keeping any equipment or asset in operational condition so that it cangive desired output and this has always been a challenging task. Now a days maintenance does notmean reducing stoppage time of an equipment but also to avoid unscheduled stoppage and break-downs by frequent performance checking, testing and providing inspection and skillful repair when-ever required. This can be achieved by adopting various maintenance strategies. The strategy adoptedshould be such that emergency maintenance remains an exception. Maintenance is expected to playeven much bigger role in years to follow, as industries world wide are going through an increasing &stiff competition and increased automation of plants. The down time cost for such system is ex-pected to be very high. To meet these challenges maintenance have to use latest technology andmanagement skills in all spheres of activities to perform its effective role.
16.10 Key Words
• Maintenance: A combination of actions carried out to retain an item in, or restore it to, anacceptable condition.
• Maintenance Management: it is concerned with planning and controlling routine, plannedand preventive maintenance activity of an organization.
• Maintenance Planning: Deciding in advance the job, methods, materials tools, machines,labour, timing and time required.
• Planned Maintenance: maintenance organized and carried out with forethought, controland records to a predetermined plan.
• Running Maintenance: maintenance which can only be carried out while the item is inservice.
• Computerized Maintenance System: It maintenance a complet database of informationabout an organization maintenance operation which is intended to help maintenance workersto do their jobs more effectively.

• Total Productive Maintenance: TPM refers to a management system for optimizing theproductivity of manufacturing equipment through systematic equipment maintenance involv-ing employees at all levels. Under TPM, everyone is involved in keeping the equipment ingood working order to minimize production losses from equipment repairs, set-ups, and thelike.
16.11 Self Assessment Test
Q1. Explain the failure analysis of equipment?
Q2. What are the objective of maintenance management?
Q3. Discuss the various type of maintenance system? Giving Example in each case.
Q4. Discuss the various maintenance performance indices discuss a few of them?
Q5. What are the different function of maintenance management?
Q6. What do you understand by computerized maintenance management system?
Q7. Discuss the need and importance of TPM.
Q8. Write a short note on maintenance policy.