Vanja Azabagic - Diplomarbeit - Druckversion...
84
DIPLOMARBEIT Titel der Diplomarbeit „Determinants of Foreign Direct Investment in the Emerging South-East European Countries“ Verfasserin Vanja Azabagic Angestrebter akademischer Grad Magistra der Sozial- und Wirtschaftswissenschaften (Mag. rer. soc. oec.) Wien, 2012 Studienkennzahl lt. Studienblatt: A 157 Studienrichtung lt. Studienblatt: Diplomstudium Internationale Betriebswirtschaft Betreuer: Univ.-Prof. Dr. B. Burcin Yurtoglu
Transcript of Vanja Azabagic - Diplomarbeit - Druckversion...

DIPLOMARBEIT
Titel der Diplomarbeit
„Determinants of Foreign Direct Investment in the Emerging South-East European Countries“
Verfasserin
Vanja Azabagic
Angestrebter akademischer Grad
Magistra der Sozial- und Wirtschaftswissenschaften
(Mag. rer. soc. oec.)
Wien, 2012
Studienkennzahl lt. Studienblatt: A 157
Studienrichtung lt. Studienblatt: Diplomstudium Internationale Betriebswirtschaft
Betreuer: Univ.-Prof. Dr. B. Burcin Yurtoglu

Determinants of Foreign Direct Investment in the Emerging South-East European Countries
2
Eidesstattliche Erklärung
Ich erkläre hiermit an Eides statt, dass ich die vorliegende Arbeit selbstständig und ohne Benutzung
anderer als der angegebenen Hilfsmittel angefertigt habe. Die aus fremden Quellen direkt oder
indirekt übernommenen Gedanken sind als solche kenntlich gemacht.
Die Arbeit wurde bisher in gleicher oder ähnlicher Form keiner anderen Prüfungsbehörde vorgelegt
und auch noch nicht veröffentlicht.

Determinants of Foreign Direct Investment in the Emerging South-East European Countries
3
I dedicate this work to my dear parents and my
sister. Thank you for your support during my
university days and for always being there for
me. My dearest sister, thank you for being my
best friend.

Determinants of Foreign Direct Investment in the Emerging South-East European Countries
4
I. Table of contents
I. Table of contents ........................................................................................................................... 4
II. List of figures ................................................................................................................................. 6
III. List of tables .................................................................................................................................. 7
1 Introduction ................................................................................................................................... 8
2 Foreign Direct Investment .......................................................................................................... 10
2.1 Definition of Foreign Direct Investment ............................................................................ 10
2.2 Choosing the right strategy ............................................................................................... 11
2.3 FDI incentives ...................................................................................................................... 16
2.4 FDI inflows ........................................................................................................................... 18
2.5 Other factors influencing FDI inflows ............................................................................... 25
2.5.1 Distance ......................................................................................................................... 25
2.5.2 Transition process ......................................................................................................... 25
2.5.3 Privatization ................................................................................................................... 25
2.5.4 Corruption ...................................................................................................................... 26
2.6 Financial crisis and its influence ....................................................................................... 28
3 Historical backgrounds of the countries .................................................................................. 32
3.1 Bulgaria ................................................................................................................................ 33
3.1.1 Geographical location of Bulgaria .................................................................................. 33
3.1.2 Governmental system of Bulgaria ................................................................................. 34
3.1.3 Why to invest in Bulgaria ............................................................................................... 35
3.1.4 Macroeconomic outlook of Bulgaria .............................................................................. 36
3.1.5 Tax regulations in Bulgaria ............................................................................................ 39
3.1.6 FDI in Bulgaria ............................................................................................................... 41
3.2 Romania ............................................................................................................................... 42
3.2.1 Geographical location of Romania ................................................................................ 42
3.2.2 Governmental system of Romania ................................................................................ 43
3.2.3 Why to invest in Romania .............................................................................................. 44
3.2.4 Macroeconomic outlook of Romania ............................................................................. 45
3.2.5 Tax regulations in Romania ........................................................................................... 47

Determinants of Foreign Direct Investment in the Emerging South-East European Countries
5
3.2.6 FDI in Romania .............................................................................................................. 49
3.3 Croatia .................................................................................................................................. 52
3.3.1 Geographical location of Croatia ................................................................................... 52
3.3.2 Governmental system of Croatia ................................................................................... 53
3.3.3 Why to invest in Croatia ................................................................................................. 54
3.3.4 Macroeconomic outlook of Croatia ................................................................................ 55
3.3.5 Tax regulations in Croatia .............................................................................................. 58
3.3.6 FDI in Croatia ................................................................................................................ 59
3.4 Bosnia and Herzegovina ..................................................................................................... 62
3.4.1 Geographical location of Bosnia and Herzegovina ........................................................ 62
3.4.2 Governmental system of Bosnia and Herzegovina ....................................................... 63
3.4.3 Why to invest in Bosnia and Herzegovina ..................................................................... 64
3.4.4 Macroeconomic outlook of Bosnia and Herzegovina .................................................... 65
3.4.5 Tax regulations in Bosnia and Herzegovina .................................................................. 67
3.4.6 FDI in Bosnia and Herzegovina ..................................................................................... 68
4 Successful investments ............................................................................................................. 71
4.1 Business Park Sofia, Lindner AG ...................................................................................... 71
4.2 Nestle - Nestle Sofia ............................................................................................................ 71
4.3 Romania Telecommunications Reform and Privatization Support Project ................... 71
4.4 OMV Refining & Marketing AG, Croatia ............................................................................ 72
4.5 Pepsi Co Investments (Europe) I.B. – “Marbo” for production and trade Laktasi, BIH 72
5 Conclusion ................................................................................................................................... 73
IV. References ................................................................................................................................... 74
V. Abstract in German ..................................................................................................................... 81
VI. Curriculum vitae .......................................................................................................................... 82

Determinants of Foreign Direct Investment in the Emerging South-East European Countries
6
II. List of figures Figure 1: FDI Inflows in South-East Europe, 2004-2010 (Q1-Q3 2010)
Figure 2: Factor that influence FDI
Figure 3: FDI inflows, billions of USD
Figure 4: FDI inflows in developed countries
Figure 5: Corruption perception index 2011
Figure 6: FDI inflows in CEE
Figure 7: Map of Bulgaria
Figure 8: Innovative firms in Bulgaria are more productive
Figure 9: Annual change of the inflation rate in Bulgaria
Figure 10: Inflation rate in Bulgaria
Figure 11: Unemployment rate (%), period 2003-2009 in Bulgaria
Figure 12: Unemployment rate, period January 2000-September 2011
Figure 13: Map of Romania
Figure 14: Inward FDI flows and per capita FDI stocks in period 1999-2006 in Romania
Figure 15: Distribution of FDI by the sectors in Romania
Figure 16: Map of Croatia
Figure 17: Inflation rate in Croatia
Figure 18: Employment rate in Croatia
Figure 19: Corporate income tax rates in European countries and Croatia
Figure 20: FDI inflows to Croatia, period 1997-2011
Figure 21: Distribution of FDI in Croatia
Figure 22: Distribution of FDI in Croatia (Q1-Q3/2011)
Figure 23: Map of Bosnia and Herzegovina
Figure 24: FDI stock by industry, 1994-2010 in Bosnia and Herzegovina

Determinants of Foreign Direct Investment in the Emerging South-East European Countries
7
III. List of tables
Table 1: Main host country FDI determinants
Table 2: FDI inflow in Balkan 2001-2009 (million USD)
Table 3: Inward FDI in the CEE economies
Table 4: FDI inflows 2005-2010 (millions of dollars)
Table 5: FDI inflows in 2001
Table 6: Source countries of FDI to transition economies, per cent of total inward stock 2000
Table 7: Corruption Perception Index
Table 8: Inward FDI flows, period 2000-2010
Table 9: FDI trends in twenty largest sectors
Table 10: Macroeconomic indicators in Bulgaria, data from 2009
Table 11: Macroeconomic indicators in Bulgaria, data from 2012
Table 12: Sectoral distribution of Inward FDI stock in Bulgaria 2000 and 2009
Table 13: Macroeconomic indicators in Romania, data from 2009
Table 14: Macroeconomic indicators in Romania, data from 2012
Table 15: Unemployment rate (%), period January 2006-2012
Table 16: FDI in Romania during 2004-2010
Table 17: FDI in Romania in 2011
Table 18: Macroeconomic indicators in Croatia, data from 2009
Table 19: Macroeconomic indicators in Croatia, data from 2012
Table 20: Macroeconomic indicators in Bosnia and Herzegovina, data from 2009
Table 21: Macroeconomic indicators in Bosnia and Herzegovina, data from 2012
Table 22: Inflation rate in Bosnia and Herzegovina
Table 23: FDI stocks by country in million €

Determinants of Foreign Direct Investment in the Emerging South-East European Countries
8
1 Introduction
Many would say that investment has different meanings. According to Myles (2003) we can
direffentiate between two forms of investment: real and financial investment. “Real investment is the
purchase of physical capital such as land and machinery to employ in a production process and earn
increased profit. In contrast, financial investment is the purchase of “paper” securities such as stocks
and bonds“ (Myles, 2003).
“An investment is a choice by an individual or an organization to place or lend money in a vehicle (e.g.
property, stock securities, and bonds) that has sufficiently low risk and provides the possibility of
generating returns over a period of time” (Graham & Dodd, 1951).
Eastern countries have been attractive for the foreign investors, mainly because they are dynamic
(Western Balkans especially), which results in changing costs and conditions for the investors.
Western Balkans, including Albania, Bosnia and Herzegovina, Croatia, Macedonia, Serbia and
Montenegro are considered to offer opportunities in growing businesses (World Bank 1, 2006).
For example, Bosnia and Herzegovina (BiH), with its convenient location (i.e. at the crossroads of
Europe, Middle East and Northern Africa) in the center of the South-Eastern countries, has various
investment opportunities in different sectors. The economy of BiH is growing fast and has achieved
amazing progress in improving the business climate. Other advantages, such as the free trade
agreement with Turkey, free access to consumer market of 50 million people (result of CEFTA-
Central European Free Trade Agreement), no custom duties, are only some of the many advantages
this country has to offer to foreign investors (FIPA 1, 2008).
Also, Bulgaria, Romania and Croatia have been very attractive for the foreign investors. These
countries made a crucial decision and improved their political and business climate, which opened the
doors for the foreign direct investments (FDI) (UNCTAD 1, 2004).
However, the FDI inflows in these countries were not equal. This was mainly because of the different
political situations in these countries, privatization, as well as macroeconomic instability (Barolli et al.,
2009).
In this work, I will concentrate on the inflows of foreign direct investment into the ex-Yugoslavian and
emerging markets, and why their presence is important for the future of these countries, as well as the
advantages they bring to foreign investors.
This thesis is divided into five major parts. In the first part of the paper the topic in general is
introduced. The second part is about the theory of foreign direct investment. I will explain what foreign
direct investments are and what different types we have. I will also address the incentives for the
foreign direct investment in the market.
In the third part different countries are addressed in detail, the ex-Yugoslavian countries as well as the
emerging markets. I will give an overview of their background, their history, governmental background

Determinants of Foreign Direct Investment in the Emerging South-East European Countries
9
as well as their foreign direct investments flow. The fourth part focuses on concrete examples of the
companies that invested in these countries.
The fifth chapter, as a final chapter, contains my conclusion about the work.

Determinants of Foreign Direct Investment in the Emerging South-East European Countries
10
2 Foreign Direct Investment
2.1 Definition of Foreign Direct Investment
Foreign direct investments have been the most important engine of globalization. Since the 1990, they
are the most important source of foreign capital for emerging market economies. Even though a
decrease in investments was noticed as a consequence of the Asian crisis, positive net inflows to
emerging countries were continued after the crisis. FDI was always presented as a positive
development for the emerging markets, based on the long-term stability assumption, which also
differentiate it from the other types of cross-border capital flows (commercial transactions, financial
transaction of credit type, portfolio investment) (Deutsche Bundesbank, 2003).
Figure 1 FDI inflows in South-East Europe, 2004-2010 (Q1-Q3 2010)
18
Economic Annals, Volume LV, No. 187 / October - December 2010
Figure 4: FDI inflows in South-East Europe, 2004 - (I-IIIq) 2010
Source: Central banks of respective countries.
* Data for Bosnia and Herzegovina covers only !rst quarter. ** Data for Croatia, FYR Macedonia and Montenegro covers only 2 quarters of 2010.
OECD (2010) reports on decreasing FDI to South-East Europe, with the downfall starting in third quarter of 2008. Examples reveal that investors were not eager to participate in yet another round of privatizations (e.g. Serbia’s public airline company, Croatian shipyards). "e prospect of green!eld investment was even lower, which adversely in#uenced domestic construction activity and contributed to a signi!cant decrease in overall economic activity. "e lack of foreign direct investment certainly pointed once again to the inadequate domestic sources of capital for achieving sustainable economic growth.
"e question remains of whether the analyzed countries are experiencing a larger decrease in FDI than other transition and developed countries. UNCTAD (2010) reports 39% global FDI decrease in 2009 and has approximately the same number for the region of South-East Europe and the CIS. "e data for FDI in#ows into the countries of the European Union showed a shrinkage of ‘only’ 29% for the same period, with Romania reporting a decline of 54%. For the analyzed countries as a group the decline amounted to 47%. "e largest drop was recorded in the country that received most FDI in the previous period, Croatia, where the decline reached 55%. "e next largest decline was in Bosnia and Herzegovina, reaching 50%,
Source: Valerija Botric. Foreign direct investment in the Western Balkans: privatization, institutional
change, and banking sector dominance, economic annals. October-December 2010, Volume LV, No.
187.
The Organisation for Economic Co-operation and Development (OECD) and the International
Monetary Fond (IMF) say that “foreign direct investments reflect the objective of obtaining a lasting
interest by a resident entity in one economy (“direct investor”) in an entity resident in an economy
other than that of the investor (“direct investment enterprise”). The lasting interest implies the
existence of a long-term relationship between the direct investor and the enterprise and a significant
degree of influence on the management of the enterprise” (Deutsche Bundesbank, 2003).

Determinants of Foreign Direct Investment in the Emerging South-East European Countries
11
OECD also recommends that “direct investment enterprise (to) be defined as an incorporated or
unincorporated enterprise in which a foreigner owns 10 per cent or more of the ordinary shares or
voting power of an incorporated enterprise… An effective voice in the management, as evidenced by
an ownership of at least 10 per cent, implies that the direct investor is able to influence, or participate
in the management of an enterprise; it does not require absolute control by a foreign investor”
(Deutsche Bundesbank, 2003).
Accordingly, in the long run, local companies prefer this type of investment, rather than the stock-
related ones. The reason for that is that the stock-invested capital tends to disappear from the country
when there are signs of a crisis rising on the horizon. Entrepreneurial-invested capital, on the other
side, tends to further the development, even though the present situation does not look promising at
the moment (Botric and Skuflic, 1993-2008).
Especially for the transition countries, FDI have been of a crucial importance. FDI provide financial
capital to the countries that have high debts, skill transfer and create more jobs for the host country.
They offer support for the political transformation, increase tax revenue, and, at the same time, they
help source countries to compete and earn profits abroad (Marchick and Slaughter, 2008).
FDI bring the needed capital in developing countries, managerial know-how and the new technology. It
is believed that FDI are the most stable form of financial flows. FDI were the largest part of the capital
inflows in these countries. Bulgaria and Romania received the largest inflows of FDI relative to their
gross domestic product (GDP). The Baltic countries enjoyed large inflows upon their entrance into the
European Union (EU). The Balkan countries also had an increasing trend of inflows since 2005, mainly
due to privatization processes (Kinoshita, 2011).
There is still a difference whether FDI inflows go to the tradable or non-tradable sector. FDI in the
tradable sector will increase exports over time, while in the non-tradable sector they will rather cover
the domestic demand, which leads to increased imports in the domestic land. This is what happened
from 2003: more inflows went into non-tradable sectors and domestic countries had to increase
imports causing account deficits. During the late 2000s crisis these countries were hit the most
(Kinoshita, 2011).
2.2 Choosing the right strategy
The economic environment of new markets is changing very fast. Central and Eastern European
markets are becoming more and more interesting for economists and foreign investors. As the
preferences of the investors differ from country to country, it is important to mention several
determinants for the foreign direct investments.

Determinants of Foreign Direct Investment in the Emerging South-East European Countries
12
There are two factors that are affecting FDI inflows (Barolli et al., 2009):
1. Transition itself
2. Political instability, armed conflicts, inter-ethnic and civil conflicts.
OECD studies (OECD 1, 2003,) have shown that the following factors are important in deciding where
to invest:
● Predictable and non-discriminatory regulatory environment
● Stable macroeconomic environment
● Sufficient and accessible resources
Hungary enjoyed the highest percentage of the FDI, mostly due to its relationship with Western
countries. Foreign investors saw Hungary as a country with good infrastructure and economic stability.
Poland had delays in their privatization process, which was the reason why FDI in this country started
to grow later than in Hungary. The inflows in Balkans were lower than in other Central European
Countries, caused by political instability in the first place. Romania, Bulgaria and Croatia enjoyed the
high-ranking position due to their political reforms, especially Croatia with its economic development,
influences of foreign trade with Western countries and managers’ experiences in this country (all these
factors had positive impact on the foreign investors).
Poland started to receive FDI inflows after Hungary. This was mostly influenced by delays in the
privatization process (Barolli et al., 2009).
According to Brewer (1993) and Chudnovsky (1997), we can divide investors in four groups, based on
their strategic objective (Barolli et al., 2009):
1. Market-seeking foreign investors
2. Efficiency-seeking foreign investors
3. Natural resources-seeking foreign investors
4. Strategic asset-seeking foreign investors
Market-seeking investors are mainly concentrated on servicing the host country they invest in with the
purpose to serve the host country’s demand for goods. Usually the production is split between several
locations. The size of the market and quality of the market demand are two factors that influence the
demand for FDI inflows. The size of the market can be measured by the absolute GDP, and by GDP
per capita. A higher GDP per capita is a result of a higher demand for goods of a higher quality
(Johnson, 2006).
Efficiency-seeking investors are focused on the low costs of the host country and exporting the
production to the home country of FDI. This happens only in case of a relatively free trade between
the host and home countries.

Determinants of Foreign Direct Investment in the Emerging South-East European Countries
13
Natural resources-seeking investors concentrate on the raw materials available in the host country.
According to Dunning and his paradigm, resource seeking was the most important form in the
nineteenth century, especially for the Commonwealth of Independent States (CIS) countries
(Kazakhstan, Armenia, Azerbaijan), because they have large resources of oil and gas. We couldn’t
say the same for Central and Eastern European (CEE) countries, unfortunately, as the natural
resources are rather low (Johnson, 2006).
Strategic asset-seeking investors are focused on collecting resources and capabilities that investors
think they will sustain.
Table 1 Main host country FDI determinants
Source: Blend Barolli, Koji Takahashi, Toshikatsu Tomizawa. The impact of political volatility on
foreign direct investment: Evidences from the Western Balkan countries. Bulletin of Yamagata
University. 2009; Volume 40, No 1, p. 65-78.

Determinants of Foreign Direct Investment in the Emerging South-East European Countries
14
There are many different determinants of FDI that can be roughly divided into two groups (Botric and
Skuflic, 1993-2008):
1. The determinants dependent on the company itself (internal)
2. The determinants that are not under company´s control (external).
So-called “OLI paradigm” is a combination of these factors that investing companies are using when
they are about to invest abroad. Dunning was the first to introduce OLI paradigm in 1977. According to
the OLI paradigm, the company´s decision to invest was based on the following advantages:
ownership, location and internalization advantages (Johnson, 2006):
1. The ownership (O) advantage – as an internal factor, enables foreign investor to have an
advantage over the local competition
2. The location (L) advantage – lower production and transportation costs; access to specialized
knowledge and skills available in the country of investment; institutional factors
3. The internalization (I) advantage – achieving certain advantages and the ability to keep them;
usually within company.
Brada, Kutan and Yigit (2004, p.8) argue, “FDI is a forward-looking activity based on investors’
expectations.”
These expectations are pretty much the same in every country: they want to conduct their business in
the environment they are investing in without incurring any unnecessary risks. As risk is playing a big
role in determining whether the investors will invest in the host country or not, some of the host
countries were working on improving their environments. They would offer low tax rates to attract
foreign investors, and at the same time to make domestic enterprises stay. Some other strategies
included preferential tariff regimes, investment in infrastructure and some educational measurements. Even though these could be seen as success strategies or incentives, they are actually not real FDI
incentives, as the investors were only given preferential treatment (OECD 2, 2003).
So the question arises: “What are real FDI incentives? And if they actually exist, can we call them real
incentives?
FDI incentives could be defined as: “Measures designed to influence the size, location or industry of
an FDI investment project by affecting its relative cost or by altering the risks attached to it through
inducements that are not available to comparable domestic investors” (OECD 3, 2003).
Measures that meet this definition could be categorized into two groups (OECD 3, 2003):
1. “Rules-based approach” that relies on discrimination of investors to be stipulated by law
(relatively straightforward selective application of investment subsidies)
2. “Specific approach” that tailors incentives to individual foreign investors (multitude of different
incentives e.g. fiscal derogations, grants, soft loans, job training, derogations from regulations)

Determinants of Foreign Direct Investment in the Emerging South-East European Countries
15
They try to achieve the aim to maximize the long-term benefits and to ensure that they are making
profit, in other words, that the benefits exceed the costs and the costs have to be held at the lowest
level (OECD 4, 2003).
How does that influence the host country? And are FDI good or bad for the host country?
Some papers are listing positive and others negative facts about FDI investments. Some of them
argue that political and economic progress in recent years means that the overall outlook for the
region is more positive than that of any time (Kekic, 2004).
But this does not mean that the country has achieved total “turn-over” and is close to the level of a
developed country. Despite the influx of investments it has received, for example, the Balkan is not
even close to being integrated into the international economy like some of the Central European
economies. Unemployment and poverty are still high, and the political situation is unstable. These are
all the risks that FDI faces and that need to be considered before investing in a host country. Another
reason is that the Balkan countries are small by standards, which limits the inflows of the FDI in these
countries. Even though Bulgaria and Romania are large economies, however they still have shortage
of the FDI. Some of the shortages are caused by lack of stabilization (Bulgaria and Romania). Croatia,
Macedonia and Slovenia, on the other hand, had low inflation level, which also did not help much in
attracting the foreign investors. All of these countries have in common political instability. The divide of
the Republic of Yugoslavia had a huge impact on foreign investors. Macedonia suffered the ethnic war
and an embargo from Greece, as well as an embargo from Serbia. Albania had problems with both,
Greece and Macedonia, and Croatia continued its economic and cultural conflict with Serbia. Bosnia
suffered from a war with Serbia (Barolli et al., 2009).
The following Table is showing inflows of the FDI in the Balkan countries in the period of 2001-2009.
Table 2 FDI inflow in Balkan 2001-2009 (million EURO)
100
Jelena Tešić
EU membership and after accession. The political and economic integration of CEE into the EU released a signal to foreign investors that these countries are better regulated and politically more stable. This factor, along with much lower operating costs than in developed countries, contributed to a higher foreign investment into CEE while at the stage of joining EU. We can expect that in Western Balkan countries similar effects could be achieved as the European Union continues to enlarge in our direction. But creating a good investment environment which could attract fresh new investments requires a much deeper and more decisive reforms in the fields of public administration, public finances, the rule of law and, perhaps most important of all, a strong and determined fight against crime and corruption. Joint actions among all Western Balkan countries in this regard are the only way to reach the desired economic and social results as well as stronger regional integration. An integrated and politically stable region means advantages for each country individually. The process of joining the EU can be used as a good approximation for the general institutional progress in Western Balkan countries. Development of institutional environment, i.e. faster progress of the Western Balkans toward the EU, could mean grater inflows of FDI, which in turn has a range of positive effects.
STEADY GROWTH AND STEEP DECLINE DURING THE CRISISBefore we analyze the decline that occurred in 2009 as a result of the world economic crisis, it is important to note that all countries of the region recorded a stable growth in FDI in years prior to the crisis. Mainly due to the global crisis, this growth in the last period was not only slow but it was also negative, as can be seen in the following table and figure.
Table !: FDI inflows by countries and total amount for the region (in millions of euro)Country/Year 2001 2002 2003 2004 2005 2006 2007 2008 2009
Bosnia Herzegovina - - - 565 492 610 1517 726 !"#Serbia 41,6 343 948 652 1180 3375 1431 1687 $%&&
Croatia 1467 1137 1762 949 1467 2764 3678 4195 #'()Monte Negro -0,5 76,3 39 50,5 381 466 672 625,5 (!!Macedonia - - - 260 77,21 344 505 400 $*$
Albania - - - 278 213 259 481 675 &')Total - - 104,4 2756 3810 7818 8284 8308 "&")
Source: countries’ national (central) banksSource: Jelena Tesic. Institutional environment and foreign direct investment in the Western Balkans,
2010.

Determinants of Foreign Direct Investment in the Emerging South-East European Countries
16
Political volatility bears two main risks for investors (Barolli et al., 2009):
1. Domestic instability, civil war and international conflicts – they can reduce the profitability of
investing in the host country. Production is in danger of falling and the invested facility suffers
the risk of being destroyed.
2. Host country currency is affected by political volatility – the assets invested lose their value as
well as the future potential profits.
Figure 2 Factors that influence FDI
Source: Blend Barolli, Koji Takahashi, Toshikatsu Tomizawa. The impact of political volatility on
foreign direct investment: Evidences from the Western Balkan countries, 2009.
2.3 FDI incentives
The positive side of foreign direct investments looks promising. Investments offer benefits to host
countries: they create new jobs and increase tax revenue. They also help the source countries to
compete and earn profits abroad (Marchick and Slaughter, 2008).
Peace record in the past years is more stable and less interrupted by incidents, elections are free and
fair and results are respected. Possibility of a recurrence of a major conflict is low (Kekic, 2004).
The question becomes then: “Which strategy to use when entering the host country? What investors
and policy makers have to keep in mind in order to achieve their goal?”
Policy makers’ and investors’ positions need to be considered when choosing the right strategy. Costs
are extremely important for the policy makers. Complexity and trade-off issue between competing
objectives call for a caution; therefore it is recommendable to find the strategy that would consider not
only the process of attracting the foreign investments, but also the budgetary and regulatory
Determinants of Foreign Direct Investment in the Emerging South-East European Countries
17
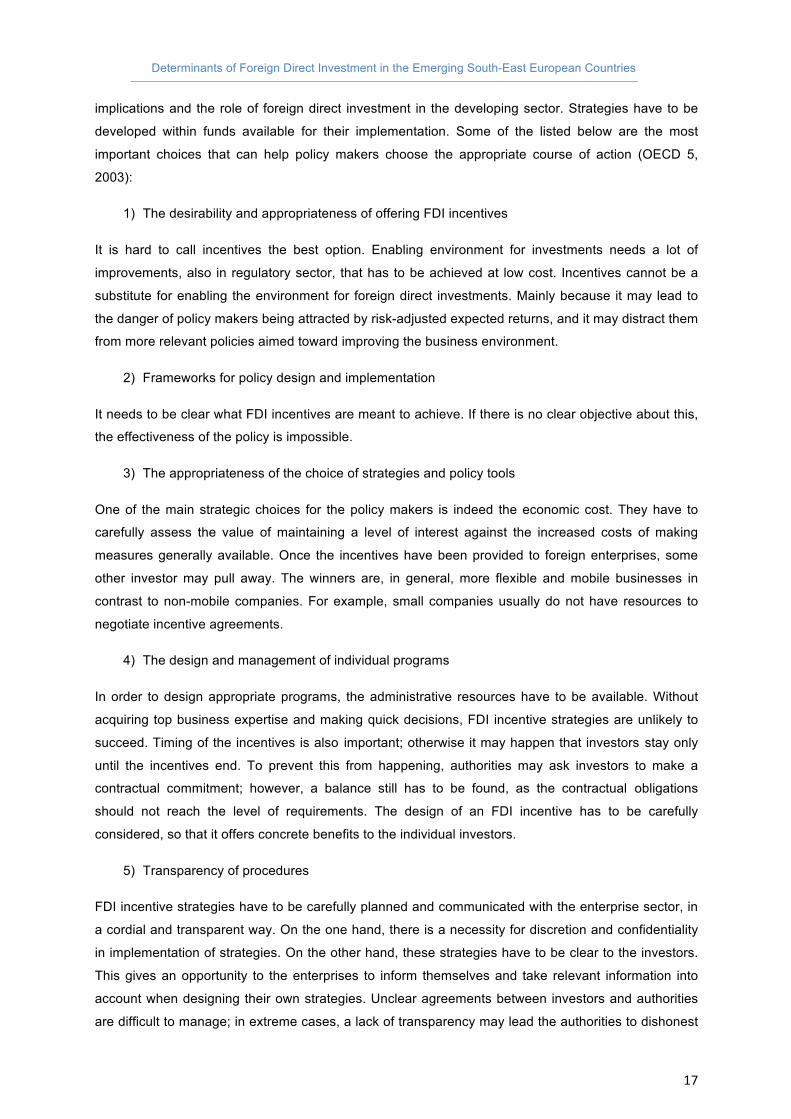
implications and the role of foreign direct investment in the developing sector. Strategies have to be
developed within funds available for their implementation. Some of the listed below are the most
important choices that can help policy makers choose the appropriate course of action (OECD 5,
2003):
1) The desirability and appropriateness of offering FDI incentives
It is hard to call incentives the best option. Enabling environment for investments needs a lot of
improvements, also in regulatory sector, that has to be achieved at low cost. Incentives cannot be a
substitute for enabling the environment for foreign direct investments. Mainly because it may lead to
the danger of policy makers being attracted by risk-adjusted expected returns, and it may distract them
from more relevant policies aimed toward improving the business environment.
2) Frameworks for policy design and implementation
It needs to be clear what FDI incentives are meant to achieve. If there is no clear objective about this,
the effectiveness of the policy is impossible.
3) The appropriateness of the choice of strategies and policy tools
One of the main strategic choices for the policy makers is indeed the economic cost. They have to
carefully assess the value of maintaining a level of interest against the increased costs of making
measures generally available. Once the incentives have been provided to foreign enterprises, some
other investor may pull away. The winners are, in general, more flexible and mobile businesses in
contrast to non-mobile companies. For example, small companies usually do not have resources to
negotiate incentive agreements.
4) The design and management of individual programs
In order to design appropriate programs, the administrative resources have to be available. Without
acquiring top business expertise and making quick decisions, FDI incentive strategies are unlikely to
succeed. Timing of the incentives is also important; otherwise it may happen that investors stay only
until the incentives end. To prevent this from happening, authorities may ask investors to make a
contractual commitment; however, a balance still has to be found, as the contractual obligations
should not reach the level of requirements. The design of an FDI incentive has to be carefully
considered, so that it offers concrete benefits to the individual investors.
5) Transparency of procedures
FDI incentive strategies have to be carefully planned and communicated with the enterprise sector, in
a cordial and transparent way. On the one hand, there is a necessity for discretion and confidentiality
in implementation of strategies. On the other hand, these strategies have to be clear to the investors.
This gives an opportunity to the enterprises to inform themselves and take relevant information into
account when designing their own strategies. Unclear agreements between investors and authorities
are difficult to manage; in extreme cases, a lack of transparency may lead the authorities to dishonest

Determinants of Foreign Direct Investment in the Emerging South-East European Countries
18
practices. As an example, transfer prices, aggressive taxation strategies may be influenced and
abused. Other discrete incentives can be seen as a corruption.
Once these challenges were considered, the appropriate strategy should be chosen. Listed below are
some of the strategies that usually cannot be applied as they are. An effective strategy would usually
require a combination of two or more strategies, considering several goals (OECD 6, 2003):
1. Broadly-based FDI incentives
2. Targeted strategies
3. Improvisation.
Another very important incentive is tax incentive. A country´s tax incentives and strategy to attract FDI
will be discussed in more detail in the third chapter of this thesis.
2.4 FDI inflows
The flow of foreign direct investments in Central and Eastern Europe was not stable during the last few
decades. Strong increase was seen in the last two decades. After the Second World War, the majority
of the FDI flows were going to the now developed economies, but in the last years we could notice a
shift of the FDI flows toward the developing economies in Eastern Europe (Johnson, 2006).
The period until the 1980s was still known as a “suspicious” period for investing in the Eastern
European countries. But this was changed in the 1980s and especially in the 1990s, when the inflows
reached hundreds of millions of dollars. More than 90 per cent of the conditions for attracting FDI were
met, such as transfer of management skills, job creation, etc. This was very positive for the developing
countries, but the transition countries were damaged by this change. To be able to compete, they changed their philosophy of legal frameworks where FDI was completely restricted to the point where
the host country was fighting for FDI inflows. Inflow of the foreign capital has been very important for
the transition process in Eastern Europe. Developing countries needed the inflow to start building an industry; the transition countries, on the other side, had too many. They already had heavy industry, military, rather than the consumer goods and services. At the beginning it was hard to make a shift
and concentrate on producing the goods demanded by the domestic market and the goods that could
be possibly exported abroad. Usually the domestic savings were too small to cover the demand for
investments; therefore the flow of the foreign capital had a crucial role as an additional capital source
(Johnson, 2006).
Furthermore, the regulatory framework of the host country played a very important role in achieving
inflows of FDI. Most Eastern European countries were missing such frameworks, which resulted in
minimal inflows of FDI into these economies. The Soviet Union was the most centralized economy, but
was still under the market economy influence. Hungary started with economic reforms in the 1960s,
and in 1970s implemented the joint-venture laws that welcomed FDI. Before the transition, the Soviet
Union had 96 per cent of production, 65 per cent was in Hungary and 82 per cent in Poland. Transition

Determinants of Foreign Direct Investment in the Emerging South-East European Countries
19
process brought a lot of changes regarding FDI policies and regulations. It resulted in a situation in
which the transition countries were now competing for the foreign capital inflows, using many
incentives, as the reduction of corporate taxes, tax holidays, etc. (Johnson, 2006).
The following figures are showing FDI flows in transition economies and developed countries of the
world. It is obvious that the developed countries received the majority of the FDI stocks during the last
decade.
Figure 3 FDI inflows, billions of USD
Source: UNCTAD 2. Non-equity modes of international production and development. World
investment report 2011.

Determinants of Foreign Direct Investment in the Emerging South-East European Countries
20
Figure 4 FDI inflows in developed countries
Source: UNCTAD 2. Non-equity modes of international production and development. World
investment report 2011.
At the beginning of 2000, percentage of the FDI stock in Central and Eastern Europe was very low,
less than 1 per cent (Figure 3). This was primarily because of the economic environment these countries had at that time. In the following years the growth was more visible, especially in the time
period between 2003 and 2008. In 2009 we can see that the crisis affected negatively the growth of
FDI.

Determinants of Foreign Direct Investment in the Emerging South-East European Countries
21
Table 3 Inward FDI in the CEE economies
Source: Andreas Johnson. FDI inflows to the transition economies in Eastern Europe: Magnitude and
determinants, 2006.
We see that Poland received the largest volume of FDI inflows (Table 3). The Czech Republic took the
second place, followed by Hungary. At the same time, FDI per capita is showing a little bit different
results, where the Czech Republic ranked number 1 and Poland ranked number 8.
Regarding the Balkans, it was not able to attract much FDI comparing to the other countries in Eastern
Europe. One reasonable explanation would be social instability, which impacted the Balkan countries
significantly in the past (today´s picture is a little bit different). It is interesting that from realized FDI in
2000-2002, South-Eastern Europe attracted less FDI, about $12 billion. Croatia ranked number one
with $3.8 billion followed by Romania ($3.3 billion), Bulgaria ($2.3 billion), Macedonia ($1.1 billion),
Serbia-Montenegro ($0.7 billion), Albania and Bosnia-Herzegovina ($0.5 billion each) (Sergi, 2003).

Determinants of Foreign Direct Investment in the Emerging South-East European Countries
22
These trends continued after 2003 (Table 4). Not much changed; Poland remained attractive for
foreign investors, followed by the Czech Republic and Hungary. The Balkan countries remained at the
bottom of the list.
Table 4 FDI flows 2005-2010 (millions of dollars)
Source: UNCTAD 2. Non-equity modes of international production and development. World
investment report, 2011.

Determinants of Foreign Direct Investment in the Emerging South-East European Countries
23
Table 5 FDI inflows in 2001
Source: Bruno S. Sergi. FDI and the Balkans, 2003.
Hungary ranked number 1 in collection of FDI stock (43.4% in 2000). Table 3 above shows rankings in
FDI stock as percentage of GDP in 2003. We can see that Hungary achieved 51.8%, which placed
Hungary in the second place, right after Estonia. Albania’s stock collection increased from 15.4% in
2000 to 18.1% in 2003. Although Albania’s situation improved, the country still did not rank that well.
Bulgaria stock collection increased from 26.4% in 2000 to 29.1% in 2003. Croatia ranked very well, its
stock collection went from 27.1% in 2000 to 49.6% in 2003, taking the third place. Macedonia moved
from 10.9% in 2000 to 22.1% in 2003, Romania from 17.7% in 2000 to 23.4% in 2003. Surprisingly
Slovenia did not have a significant progress; it went from 15.5% in 2000, to 15.6% in 2003, and ranked
the last on the list.
The period after 2003 brought a change in the FDI investment distribution. Hungary was receiving
more inflows than Estonia. Albania as well kept growing and receiving FDI through the years. Croatia
dropped significantly in 2010, from 2911 in 2009 to 583 in 2010 (Table 4).
The Eastern European countries enjoyed advantageous geographic location, even though they are
placed “somewhere at the periphery”. These regions have become very attractive to foreign
investment. Despite many differences between the Balkan countries, (e.g. unemployment rate 5.6% in
Slovenia vs. 41% in BiH, inflation rate 2.5% in Slovenia and Albania vs. 12.5% in Serbia), there are
still location key advantages (Ranieri, 2008):
1. Highly competitive cost structure (land, labor and utilities are cheaper than in the new EU
member countries)
2. Labor availability, cost and quality (well educated and experienced labor with technical
expertise)

Determinants of Foreign Direct Investment in the Emerging South-East European Countries
24
3. Strategic location and proximity (Adriatic access and physical proximity to both Western and
Central Europe)
4. Local availability of raw materials (wood, metals, agricultural products)
5. Improving fiscal and incentive regimes (in form of reforms)
The next table is showing that the EU-15 is dominating the inflow of FDI. Germany and the
Netherlands are important source countries. Finland restricted all flows except to Estonia though;
Sweden was still active in the Baltic area. Austria was focused on helping the Czech Republic and
Hungary, and France was focused only on Poland. The United States showed activity in all transition
economies. For the region of Armenia, Azerbaijan and Kazakhstan, the EU-15 countries were not the
primary source of FDI, but the United States (Johnson, 2006).
Table 6 Source countries of FDI to transition economies, per cent of total inward
stock 2000
Source: Andreas Johnson. FDI inflows to the transition economies in Eastern Europe: Magnitude and
determinants, 2006.
Eastern Europe had very small inward stock of FDI at the beginning of the transition process.
However, we can say that the transition process was a positive “turn over”, especially for CEE
countries, as they were much more successful in attracting FDI then CIS economies (Kazakhstan,
Azerbaijan, Armenia).

Determinants of Foreign Direct Investment in the Emerging South-East European Countries
25
On the other side, the United States, United Kingdom and Russia were important source for the CIS
countries, as they had been primarily investing in the petroleum sector (Johnson, 2006).
2.5 Other factors influencing FDI inflows
2.5.1 Distance
When we talk about distance, we can point out that the distance has rather negative effects on the FDI
inflows. For the market-seeking FDI, larger distance results in higher costs of investment and costly
goods adaptation. For the efficiency-seeking FDI, it might result also in higher costs, specifically
transportation costs, because the goods are produced in the host country and should be shipped back
to the source country. For the resource-seeking FDI, distance does not play such a big role, as the
companies are focused on areas where the resources are, and these areas are mostly limited, so not
much attention is given to the distance factor (Johnson, 2006).
2.5.2 Transition process
Transition process is a very important factor in attracting FDI inflows. It implies that a country may
have to undergo democratic reforms, allow for civil and political freedom as well as consider instituting
economic reforms. As mentioned previously, many East European countries were missing these basic
principals, which resulted in low percentage of the FDI inflows. Unless and until a country reaches an
acceptable level that encompasses a successful implementation of these reforms, a new economic
system cannot be created. It will be easier to operate and achieve profit if host countries move from
administrative economy to market economy. Also, the incentives to invest will grow together with these
changes (Johnson, 2006).
2.5.3 Privatization
Privatization plays an important role in the transition process. Through restructuring process,
privatization is showing the efficiency of the previously state-owned company. It creates new
opportunities for attracting FDI, which significantly determines the size of FDI inflows.
The decision on how to distribute new shares to the new owner has been the most challenging
decision that influences the impact of privatization of FDI inflows. Public offerings are the most
common procedure in distributing the shares to the owners in developed countries. In transition
economies, limited savings call for more alternative methods. At the same time, however, as
discussed in various other publications, all these economies utilized more than one method. The most
important method of all is the direct sales to the outside owners.
Poland and Hungary used direct sales as privatization methods, which had positive effect on their size
of FDI inflow (Johnson, 2006).

Determinants of Foreign Direct Investment in the Emerging South-East European Countries
26
2.5.4 Corruption
“Corruption is a way of life in South-Eastern Europe – a necessary method of survival”
(Fatic, 2000).
Corruption can have very negative effect of the FDI inflows. Corruption increases the operational costs
in the host country, and it reduces profitability. Unfortunately, this type of crisis affected South-Eastern
Europe 20 years ago. Most countries and most sectors in this region are corrupted, where social
interaction is almost impossible without corruption (Fatic, 2000).
The following table shows data for Transparency International´s Corruption Perception Index (TI). A
score of 10 equals perfect countries without corruption, whereas 0 equals countries where business
transactions are managed by corruption (Johnson, 2006).
Table 7 Corruption perception index
RANK REGIONAL RANK COUNTRY / TERRITORY CPI 2010 SCORE
90% CONFIDENCE INTERVALSURVEYS USED
LOWER BOUND UPPER BOUND
56 1 Turkey 4.4 4.0 4.8 7
62 2 Croatia 4.1 3.7 4.5 8
62 2 FYR Macedonia 4.1 3.7 4.5 5
68 4 Georgia 3.8 3.0 4.7 7
69 5 Montenegro 3.7 3.1 4.3 5
78 6 Serbia 3.5 3.1 3.9 6
87 7 Albania 3.3 3.0 3.6 6
91 8 Bosnia and Herzegovina 3.2 2.8 3.5 7
105 9 Kazakhstan 2.9 2.2 3.7 8
105 9 Moldova 2.9 2.7 3.2 6
110 11 Kosovo 2.8 2.7 3.1 3
123 12 Armenia 2.6 2.5 2.8 7
127 13 Belarus 2.5 2.1 3.1 3
134 14 Azerbaijan 2.4 2.1 2.7 7
134 14 Ukraine 2.4 2.1 2.6 8
154 16 Russia 2.1 1.9 2.3 8
154 16 Tajikistan 2.1 1.7 2.5 7
164 18 Kyrgyzstan 2.0 1.8 2.3 7
172 19 Turkmenistan 1.6 1.4 1.8 3
172 19 Uzbekistan 1.6 1.5 1.7 6
RANK REGIONAL RANK COUNTRY / TERRITORY CPI 2010 SCORE
90% CONFIDENCE INTERVALSURVEYS USED
LOWER BOUND UPPER BOUND
1 1 Denmark 9.3 9.1 9.4 6
4 2 Finland 9.2 9.1 9.3 6
4 2 Sweden 9.2 9.1 9.4 6
7 4 Netherlands 8.8 8.7 9.0 6
8 5 Switzerland 8.7 8.3 9.1 6
10 6 Norway 8.6 8.1 9.0 6
11 7 Iceland 8.5 7.7 9.2 5
11 7 Luxembourg 8.5 8.0 8.9 5
14 9 Ireland 8.0 7.7 8.3 6
15 10 Austria 7.9 7.4 8.4 6
15 10 Germany 7.9 7.5 8.3 6
20 12 United Kingdom 7.6 7.3 7.9 6
22 13 Belgium 7.1 6.9 7.2 6
25 14 France 6.8 6.4 7.2 6
26 15 Estonia 6.5 6.1 6.8 8
27 16 Slovenia 6.4 5.9 6.8 8
28 17 Cyprus 6.3 6.0 6.6 4
30 18 Spain 6.1 5.7 6.5 6
32 19 Portugal 6.0 5.4 6.7 6
37 20 Malta 5.6 5.3 5.8 3
41 21 Poland 5.3 5.0 5.5 8
46 22 Lithuania 5.0 4.4 5.5 8
50 23 Hungary 4.7 3.9 5.5 8
53 24 Czech Republic 4.6 4.1 5.1 8
59 25 Latvia 4.3 3.7 4.8 6
59 25 Slovakia 4.3 3.8 4.9 8
67 27 Italy 3.9 3.5 4.4 6
69 28 Romania 3.7 3.3 4.2 8
73 29 Bulgaria 3.6 3.2 4.0 8
78 30 Greece 3.5 3.1 3.9 6
EASTERN EUROPE AND CENTRAL ASIA EUROPEAN UNION AND WESTERN EUROPE
10 11Transparency International Corruption Perceptions Index 2010
1RWH��DOO�PDWHULDOV�XQGHU�VWULFWHPEDUJR�XQWLO������������DW�������&(7
Source: Transparency International. Corruption Perception Index Report 2010.

Determinants of Foreign Direct Investment in the Emerging South-East European Countries
27
RANK REGIONAL RANK COUNTRY / TERRITORY CPI 2010 SCORE
90% CONFIDENCE INTERVALSURVEYS USED
LOWER BOUND UPPER BOUND
56 1 Turkey 4.4 4.0 4.8 7
62 2 Croatia 4.1 3.7 4.5 8
62 2 FYR Macedonia 4.1 3.7 4.5 5
68 4 Georgia 3.8 3.0 4.7 7
69 5 Montenegro 3.7 3.1 4.3 5
78 6 Serbia 3.5 3.1 3.9 6
87 7 Albania 3.3 3.0 3.6 6
91 8 Bosnia and Herzegovina 3.2 2.8 3.5 7
105 9 Kazakhstan 2.9 2.2 3.7 8
105 9 Moldova 2.9 2.7 3.2 6
110 11 Kosovo 2.8 2.7 3.1 3
123 12 Armenia 2.6 2.5 2.8 7
127 13 Belarus 2.5 2.1 3.1 3
134 14 Azerbaijan 2.4 2.1 2.7 7
134 14 Ukraine 2.4 2.1 2.6 8
154 16 Russia 2.1 1.9 2.3 8
154 16 Tajikistan 2.1 1.7 2.5 7
164 18 Kyrgyzstan 2.0 1.8 2.3 7
172 19 Turkmenistan 1.6 1.4 1.8 3
172 19 Uzbekistan 1.6 1.5 1.7 6
RANK REGIONAL RANK COUNTRY / TERRITORY CPI 2010 SCORE
90% CONFIDENCE INTERVALSURVEYS USED
LOWER BOUND UPPER BOUND
1 1 Denmark 9.3 9.1 9.4 6
4 2 Finland 9.2 9.1 9.3 6
4 2 Sweden 9.2 9.1 9.4 6
7 4 Netherlands 8.8 8.7 9.0 6
8 5 Switzerland 8.7 8.3 9.1 6
10 6 Norway 8.6 8.1 9.0 6
11 7 Iceland 8.5 7.7 9.2 5
11 7 Luxembourg 8.5 8.0 8.9 5
14 9 Ireland 8.0 7.7 8.3 6
15 10 Austria 7.9 7.4 8.4 6
15 10 Germany 7.9 7.5 8.3 6
20 12 United Kingdom 7.6 7.3 7.9 6
22 13 Belgium 7.1 6.9 7.2 6
25 14 France 6.8 6.4 7.2 6
26 15 Estonia 6.5 6.1 6.8 8
27 16 Slovenia 6.4 5.9 6.8 8
28 17 Cyprus 6.3 6.0 6.6 4
30 18 Spain 6.1 5.7 6.5 6
32 19 Portugal 6.0 5.4 6.7 6
37 20 Malta 5.6 5.3 5.8 3
41 21 Poland 5.3 5.0 5.5 8
46 22 Lithuania 5.0 4.4 5.5 8
50 23 Hungary 4.7 3.9 5.5 8
53 24 Czech Republic 4.6 4.1 5.1 8
59 25 Latvia 4.3 3.7 4.8 6
59 25 Slovakia 4.3 3.8 4.9 8
67 27 Italy 3.9 3.5 4.4 6
69 28 Romania 3.7 3.3 4.2 8
73 29 Bulgaria 3.6 3.2 4.0 8
78 30 Greece 3.5 3.1 3.9 6
EASTERN EUROPE AND CENTRAL ASIA EUROPEAN UNION AND WESTERN EUROPE
10 11Transparency International Corruption Perceptions Index 2010
1RWH��DOO�PDWHULDOV�XQGHU�VWULFWHPEDUJR�XQWLO������������DW�������&(7
Source: Transparency International. Corruption Perception Index Report 2010.

Determinants of Foreign Direct Investment in the Emerging South-East European Countries
28
Figure 5 Corruption perception index 2011
CORRUPTION PERCEPTIONS INDEX 2011NUMBER OF COUNTRIES ACCORDING TO PERCEIVED LEVELS OF PUBLIC-SECTOR CORRUPTION
BESTNEW ZEALANDDENMARKFINLAND
WORSTAFGHANISTANMYANMARNORTH KOREASOMALIA
VERY CLEAN
HIGHLY CORRUPT
CANADA HAITI
AMERICAS
NEW ZEALAND NORTH KOREA
ASIA PACIFIC
EASTERN EUROPE & CENTRAL ASIA
TURKEY TURKMENISTAN, UZBEKISTAN
EU & WESTERN EUROPE
DENMARK, FINLAND BULGARIA
MIDDLE EAST & NORTH AFRICA
QATAR IRAQ
SUB-SAHARAN AFRICA
BOTSWANA SOMALIA
6
912
7 15
12
6043
19
Source: Transparency International. Corruption Perception Index Report 2011.
In Table 7 we can see that most corrupt country groups are the CIS countries, followed by the CEE
countries. EU-15 also has half as much corruption as CEE countries, and Scandinavia achieved the
almost-free-of-corruption status. In 2011 there were no major changes as we can see from the graph
above.
2.6 Financial crisis and its influence
During 2009, Central and Eastern Europe underwent a big deficit in FDI inflows. Between 2003 and
2008, FDI flows increased five-fold. Estonia, Latvia and Lithuania experienced double-digit increase
rates in output in 2009. Bulgaria and the Czech Republic experienced a decline (but less than 5%).
Poland was predicted to experience growth in 2009. Between 2003 and 2008 were the years of growth
in CEE. At the beginning, between 1997 and 2003, the growth was slower. It went from $20 billion in
1997 to $30 billion in 2003. After 2003, the inflows were 5 times higher, reaching $155 billion in 2008
(PriceWaterHouseCoopers 1, 2010).

Determinants of Foreign Direct Investment in the Emerging South-East European Countries
29
Figure 6 FDI inflows in CEE
Source: PriceWaterHouseCoopers 1. Foreign direct investment in Central and Eastern Europe, 2010.
Table 8 Inward FDI inflows, period 2000-2010
Source: Artidis P. Bitzenis. Inward FDI in Bulgaria and its policy context, Columbia FDI profiles, 2012.

Determinants of Foreign Direct Investment in the Emerging South-East European Countries
30
As we can see from Figure 6 Russia attracted the majority of the FDI inflows in 2007 and 2008 with
increase from less than $5 billion in 1997 to more than $70 billion in 2008.
Croatia, Bulgaria, Estonia, Latvia, Slovenia (marked as “other” in the chart), attracted very small
amounts of FDI until 2003. After 2003 these regions were one of the top FDI inflow destinations. The
Czech Republic, Poland and Hungary were the most interesting regions since the 1990s, and after
2003 we can also see progress in FDI inflows in these regions (PriceWaterHouseCoopers 1, 2010).
In 2009 FDI inflows to emerging markets declined a lot. The inflows into the CEE region were 50%
less than in 2008. Decline happened in all countries, except for Slovakia surprisingly. As previously
mentioned, Russia attracted most percentage of the FDI flows until the crisis in late 2000s. In 2009,
the growth in Russia declined by 48%, primarily because the investment in the real estate collapsed,
which was not the case in previous years. Also, in 2008, Russia received an additional investment of
$4.5 billion by Quality Energy Petro Holding International. However, this sector experienced major
decline in 2009.
Poland ranked number 2 after Russia (Table 8). In 2009, Poland also had a decline by more than the
regional average, 67% in real estate, 74% in extractive industries and 86% in financial services.
The Czech Republic had a smaller decline in 2009 than the other CEE countries. Automotive sector,
real estate and energy were key sectors for investments into Czech Republic. They experienced
decline by 19% of total FDI.
In Slovakia, FDI inflow rose by 55% in 2009. The real estate sector got $2.3 billion, which caused this
rise of 40% of FDI inflows in Slovakia in 2009.
Latvia and Slovenia had the largest declines in FDI inflows in 2009 (71% in Latvia and 70% in
Slovenia). Before 2009, they had only small portion of FDI in the region (PriceWaterHouseCoopers 1,
2010).

Determinants of Foreign Direct Investment in the Emerging South-East European Countries
31
Table 9 FDI trends in twenty largest sectors
Source: PriceWaterHouseCoopers 1. Foreign direct investment in Central and Eastern Europe, 2010.
The after crisis recovery started in 2010 with modest growth in a still fragile economy. FDI inflows into
developed countries and emerging markets were expected to be similar, so in 2010 there was not
much change from 2009. In the next five years, predictions were saying that emerging markets would
attract much more FDI than the developed countries. Almost 60% of the companies are counting with
more than 20% of their revenue from emerging markets (Kekic, 2009).

Determinants of Foreign Direct Investment in the Emerging South-East European Countries
32
3 Historical backgrounds of the countries
The Fraser Institute, a research-based organisation, performs country rankings based on the
Economic Freedom of the World (EFW) Index. This index is calculated taking into consideration the
following areas and its components:
Area 1: Size of government: expenditures, taxes and enterprises
Area 2: Legal structure and security of property rights
Area 3: Access to sound money
Area 4: Freedom to trade internationally
Area 5: Regulation of credit, labor and business
(http://www.fraserinstitute.org/research-news/research/display.aspx?id=16613, May 2012).
The highest ranking that can be achieved is a score of 10, which corresponds the highest level of a
country’s economic freedom.
Using data that the Fraser´s Institute calculated, starting from 1970 onwards, I will show how the
countries’ rankings changed through different indices they received throughout the years.
In 1995 the first EFW index was calculated for Bulgaria. Bulgaria achieved an EFW index of 4.67.
Likewise, the first available data for the EFW index calculation was available in 1995 for Croatia.
Croatia’s EFW index was a little bit higher than Bulgaria’s with 4.97. In 1995 Romania had an even
lower EFW index than Croatia and Bulgaria: 3.81, whereas no data was available for Bosnia and
Herzegovina by then.
Ten years later, in 2005, Bosnia and Herzegovina (BiH) was included in the rankings. BiH’s EFW
index was calculated to be 6.11. In comparison, Bulgaria, Croatia and Romania achieved an index of
6.99, 6.31 and 6.81, respectively, in 2005. The last rankings were performed in 2009. Bulgaria, BiH,
Croatia and Romania achieved the following indices: 7.34, 6.23, 6.46 and 7.08, respectively.
The International Finance Corporation of the World Bank called „Doing Business“ performs similar
rankings. They used their ease-of-doing business index whereby countries are ranked on a scale from
1 to 183. The index is calculated taking into consideration ten specific areas: starting a business,
dealing with construction permits, registering property, getting credit, protecting investors, paying
taxes, trading across borders, enforcing contracts, resolving insolvency and getting electricity. High
ranking means that doing business in this particular country is led by a solid regulatory environment
(www.doingbusiness.org/rankings, May 2012).
As of June 2012, Bulgaria ranked 59 out of 183 in the world’s economies as calculated by „Doing
Business“. BiH ranked 125, Croatia 80 and Romania 72. If we take a look at the rankings from the

Determinants of Foreign Direct Investment in the Emerging South-East European Countries
33
previous year (first available rankings), only BiH improved its ranking position from 127 to 125.
Bulgaria, Croatia and Romania ranked 57, 79 and 65, respectively.
3.1 Bulgaria
3.1.1 Geographical location of Bulgaria
Figure 7 Map of Bulgaria
Source: http://www.geographicguide.com/europe-maps/bulgaria.htm, accessed on April 10th, 2012.
Bulgaria, also known as “the Land of Roses”, is a small country with 110,879 km2 land area and a
population of 7.7 million. Sofia is the capital and at the same time the largest city, with 1.2 million
people, located in the Western part of Bulgaria. It is situated on the West coast of the Black Sea,
Greece and Turkey are neighbors in the South, Romania in the North, and Serbia and Macedonia in
the West. Bulgaria, with its plains, plateaus, hills, mountains and deep river valleys has a large variety
of topographical features for a relatively small country (Wikipedia 1, 2011).
According to the Bulgarian Investment Agency, Bulgaria has a good infrastructure of the motorways
throughout the country, connecting Bulgaria with Western Europe, Russia, Adriatic, Black and Aegean
Sea and Minor Asia.

Determinants of Foreign Direct Investment in the Emerging South-East European Countries
34
But Shteryanova (2009) has a differing opinion on the infrastructure, which she discussed in her
master thesis on Bulgarian investments. She is of the opinion that the quality of the roads, railways
and infrastructure in general are quite damaged and that improvements on these were rather slow.
With the help of European money, transportation improved a little bit. With respect to
telecommunications, the mobile and internet networks improved very fast in comparison to the landline
telephones which remained in poor condition (Shteryanova, 2009).
Bulgaria has 28 regions and 278 municipalities. Municipalities are legal entities with a right to an
independent budget. Every four years Bulgarian government holds elections, where mayors and
council of the municipalities are elected. Since municipalities are independent territories, the council of
each municipality can determine the further development strategy for that municipality. Regions are
the administrative territorial units that execute regional policy of the central government. They also
have regional governors and administration that form the regional government. Regional governors
are appointed by the Council of Ministers (Invest Bulgaria Agency 1, 2011).
3.1.2 Governmental system of Bulgaria
Bulgaria is a parliamentary republic, instituted by the Constitution of the Republic of the Grand
National Assembly in 1991. The constitution of the Republic Bulgaria is the highest law. The National
assembly is a one-chamber parliament. It has 240 members who are elected every four years. The
National Assembly is directed by a board of chairmen, in association with the Chairman of the National
Assembly. Domestic and foreign policies are directed by the Council of Ministers, that is, at the same
time, the executive state body. The government manages the implementation of the budget, state
property and international treaties. Bulgaria is a democratic country where human rights are respected
(Invest Bulgaria Agency 2, 2011).
Before it became a democratic country in 1990, Bulgaria was under a communist regime. The change
of the political system meant that the power of the state moved from the communist party to the
people. The citizens’ rights today are represented by the officials being elected to act on behalf of
citizens. This means that citizens got to influence the politics in their country, the right that resulted
with many transformations in economic, political and social life in Bulgaria (Asenova, 2009).
In the first years of the transition Bulgaria was very unstable, mainly because of the crisis in 1997,
when the Bulgarian economy collapsed. The period until 1997 was very turbulent, with constant
government changes and people´s dissatisfaction with the country management. Within seven years,
Bulgaria has changed its government nine times, which is extreme if we consider the fact that most
governments in the world get re-elected once every four years. The last elections in 1997 brought
positive economic changes, and this government stayed in charge for four years. Thanks to this,
Bulgaria finally has become a stable country in a political sense (Asenova, 2009).

Determinants of Foreign Direct Investment in the Emerging South-East European Countries
35
3.1.3 Why to invest in Bulgaria
According to the World Bank, the attractive areas for investment are always those where the
investment environment requires improvement. Bulgaria is one of those areas. The country has many
advantages for attracting FDI, but at the same time, there are many areas for improvements. The
macroeconomic outlook is good, tax regulations are one of the most preferable in the EU, corporate
taxes are very low and the labor regulations are acceptable. Some of the areas that need most
improvements are in product innovations. Bulgaria is lacking innovations and welcomes all
investments improving this sector. A lack of skilled labor is a disadvantage for the innovative and very
productive firms. This means that investments will have to flow into the innovation sector, wages will
have to be increased in order to invest more in the productive firms (World Bank 2, 2008).
Figure 8 Innovative firms in Bulgaria are more productive
x
BULGARIA: Investment Climate Assessment
Figure 1: Innovative firms are more productive in Bulgaria
0%
25%
50%
75%
Firm licences foreigntechnology
Firm has ISO certification Firm has introduced newproduct
incr
ease
in T
echn
ical
Effi
cien
cy (T
E)
over
non-
inno
vativ
efir
ms
Source: World Bank Enterprise Surveys.Note: See main report for discussion of estimation.
An important issue related to innovation is quality standards and infrastructure. Improving quality standards can accelerate technological progress, improve productivity and increase trade. Yet firms can only fully exploit the benefits of standards when a supportive national quality infrastructure is in place. Bulgaria has all of the necessary institutions for a complete national quality system and over the past five years the system has undergone significant restructuring. Additional improvements are, however, possible.
Bulgaria’s infrastructure for innovation and absorption are discussed in detail in Chapter 3 of the main report and its quality infrastructure is discussed in detail in Chapter 4. !e overview and the main report also include a detailed discussion of steps that the Government could consider to increase access to new technology and to further strengthen quality infrastructure.
Reducing the burden of regulation
Despite the Government’s ambitious reform program, red-tape and burdensome regulation remain a serious obstacle to firm productivity and growth. Over 45 percent of firm managers said that corruption and close to 40 percent said that competition with informal firms were serious problems. Both of these should be seen as symptoms of other problems in the investment climate and many studies have found that they are linked to burdensome regulation, red-tape and taxation.
Objective information from the survey also suggests that the burden of regulation is high. On average, senior managers in Bulgaria report spending 17 percent of their time dealing with requirements imposed by government regulations. !is is higher than in most other middle-income countries. Moreover, as discussed in Chapter 2 of the main report, there is a strong association between the burden of red-tape and low firm productivity in Bulgaria.
Firm managers were also concerned about unpredictable and erratic enforcement of regulation. Over 70 percent of businesses either strongly disagreed or tended to disagree with the statement that public authorities’ interpretations of laws and regulations are consistent and predictable, higher than in most of the other recent entrants to the European Union (EU). Unpredictable and erratic enforcement undermines the goals of regulation and can lead to corruption.
Although there is room for further improvement, Bulgaria has made significant progress in the area of regulatory reform in recent years. In 2003, the Limiting Administrative Regulation and Administrative Control on Economic Activities (LARACEA) law was enacted. One year earlier the Council for Economic Growth, an important public-private consultative forum, was established.
Source: World Bank 2. Bulgaria Investment Climate Assessment, October 2008.
As we can see from Figure 8, the firms that licensed foreign technology are most efficient in Bulgaria,
followed by the companies that have ISO certification and keep introducing new products.
A presence of established, development agencies is certainly an advantage when considering whether
to invest into Bulgaria or not. With the help of the EU, the Bulgarian Foreign Investment Agency has
been established. The main task of this agency was to offer assistance for the investment process,
provide them with latest information, legal advices, provide information on local partners, and prepare
annual reports on investments in the country (Glinavos, 2003).
Increasing economic culture, affordable labour with many different skills and perfect geographic
position between Europe and Asia are just some of many other reasons for investing into this country
(Totev, 2005).

Determinants of Foreign Direct Investment in the Emerging South-East European Countries
36
3.1.4 Macroeconomic outlook of Bulgaria
Table 10 Macroeconomic indicators in Bulgaria 2009
CEE Quarterly 01/2009 page 8 See last pages for disclaimer.
Economics & FI/FX Research
CEE Quarterly
Bulgaria
Outlook
Recent dataflow points to a sharp slowdown in economic activity which has led to a
pronounced deterioration in the short-to-medium term outlook for the Bulgarian economy. We
now forecast just 0.2% growth in 2009 and a moderate recovery to 2.0% growth in 2010. The
flipside of the sharp slowdown in domestic demand and significantly lower energy prices is a
significant improvement in the current account outlook, however.
Author: Kristofor Pavlov, Chief Economist (UniCredit Bulbank) + 359 2 9269 390, [email protected]
MoodyLs S&P Fitch
Long-term foreign currency credit rating Baa3 stable BBB negative BBB- stable
MACROECONOMIC DATA AND FORECASTS
2006 2007 2008e 2009f 2010f
GDP (EUR bn) 25.2 28.9 34.2 36.6 39.2
Population (mn) 7.7 7.6 7.6 7.6 7.5
GDP per capita (EUR) 3286 3782 4497 4845 5210
GDP (constant prices y-o-y %) 6.3 6.2 5.9 0.2 2.0
Private Consumption, real, y-o-y (%) 8.5 5.1 5.2 2.1 2.5
Fixed Investment, real, y-o-y (%) 14.7 21.7 16.4 -3.8 -1.8
Public Consumption, real, y-o-y (%) -2.5 3.4 3.7 3.3 4.0
Exports, real, y-o-y (%) 8.7 5.2 2.5 -8.9 -2.0
Imports, real, y-o-y (%) 14.0 9.9 5.0 -6.0 -1.8
CPI (year end, y-o-y %) 6.5 12.5 7.8 6.0 4.5
Central bank reference rate 3.3 4.6 5.8 3.5 3.4
Unemployment rate (%) 9.1 6.9 6.3 10.0 9.5
Budget balance / GDP (%) 3.6 3.5 3.0 -2.5 -2.0
Current account balance (EUR bn) -4.5 -6.3 -8.5 -5.1 -4.5
Current account balance / GDP (%) -17.8 -21.8 -25.0 -14.0 -11.5
Net FDI (EUR bn) 6.0 6.5 5.0 3.3 2.9
FDI % GDP 23.8 22.6 14.6 9.0 7.5
Gross foreign debt (EUR bn) 20.6 28.9 36.3 36.8 39.2
Gross foreign debt (% of GDP) 81.7 99.8 106.3 100.5 99.9
FX reserves (EUR bn) 8.9 11.9 12.7 9.5 10.3
(Cur.Acc-FDI) / GDP (%) 6.0 0.7 -10.4 -5.0 -4.0
FX reserves / Gross foreign debt (%) 43.3 41.4 35.0 25.8 26.2
Exchange rate to USD eop 1.5 1.3 1.4 1.4 1.5
Exchange rate to EUR eop 2.0 2.0 2.0 2.0 2.0
Exchange rate to USD AVG 1.6 1.4 1.3 1.4 1.4
Exchange rate to EUR AVG 2.0 2.0 2.0 2.0 2.0
Source: UniCredit Research
Source: Bank Austria. CEE Quarterly, 01/2009.

Determinants of Foreign Direct Investment in the Emerging South-East European Countries
37
Table 11 Macroeconomic indicators in Bulgaria 2012
Source: Bank Austria. CEE Quarterly, 01/2012.
GDP growth rate in Bulgaria was increasing until 2008 and then had a major decline in 2009. Similar
to the exports, due to the lack of the demand, the export rate fell down to -8.9% in 2009 (Table 10).
Table 11 shows that the forecast for 2009 was not as accurate as predicted, and that the exports had,
in fact, decreased to less than what they had been in 2009, to -11.2%. It was evident that the crisis hit
Bulgaria hard. The forecasts showed that the recovery would start in 2010. CEE Quarterly expected
economic growth to reach 3.1% in 2011; however, it reached 2% in 2011.

Determinants of Foreign Direct Investment in the Emerging South-East European Countries
38
More reasons for the investment were the local currency (i.e. Bulgarian Lev pegged to the Euro), and
the inflation rate change was only 0.6% in 2009 which is very low in comparison to 2007 when the
inflation rate change with 12.5% was the highest since 2003. In 2009 the inflation rate change was at
its lowest since 2003 (Figure 9). In 2010 the inflation rate went up to almost 6%, but the forecast
shows more stabilization in 2012 and 2013 (Figure 10).
Figure 9 Annual change of the inflation rate in Bulgaria
6.26.56.56.45.04.5
-4.9
2003 2004 2005 2006 2007 2008
2009
5.64.0
6.5 6.5
12.5
7.8
0.6
2003 2004 2005 2006 2007 2008 2009
13.512.2
10.79.1
6.9 6.3
9.1
2003 2004 2005 2006 2007 2008 2009
Source: Invest Bulgaria Agency. Brief Investor´s Handbook 2010.
Figure 10 Inflation rate in Bulgaria
Source: Bank Austria. CEE Quarterly, 01/2012.
The unemployment rate graph in Figure 11 (period 2003-2009) shows that the unemployment was
even lower in 2007 and 2008, at 6.9% and 6.3% respectively. With 9.1% in 2009, Bulgaria
experienced growth in the last years, but still could expect promising forecast based on the fact that
even during the financial crisis, the unemployment rate was still lower that it was at the beginning of

Determinants of Foreign Direct Investment in the Emerging South-East European Countries
39
2003, at high 13.5%. The unemployment rate kept growing in 2010 and 2011 (11.3% and 12.3%
respectively), as evident in Figure 12; it is expected to fall down to 11.7% in 2013 (Table 11).
Figure 11 Unemployment rate in Bulgaria 2003-2009
6.26.56.56.45.04.5
-4.9
2003 2004 2005 2006 2007 2008
2009
5.64.0
6.5 6.5
12.5
7.8
0.6
2003 2004 2005 2006 2007 2008 2009
13.512.2
10.79.1
6.9 6.3
9.1
2003 2004 2005 2006 2007 2008 2009
Source: Invest Bulgaria Agency. Brief Investor´s Handbook 2010.
Figure 12 Unemployment rate January 2000-September 2011
Source: Bank Austria. CEE Quarterly, 01/2012.
3.1.5 Tax regulations in Bulgaria
One of the very important incentives for FDI is a functional tax system of the country that is receiving
the investment. Foreign investors very much like to avoid administrative burden, time to prepare
documents and then to actually pay the taxes. The tax system is managed carefully by the
government with the goal of encouraging FDI inflows. Usually investing companies get some credit for

Determinants of Foreign Direct Investment in the Emerging South-East European Countries
40
the tax paid that they can reinvest in the company and in new projects in the country they invested
into, especially in the regions with high unemployment (Asenova, 2009).
The most important target of the tax incentives is the region located far away from big cities. They
require higher operating costs for transport and communications while delivering goods to the markets.
It is also challenging to find skilled workers who are willing to relocate to these regions; they have to
consider higher transportation costs, which translates into higher salary requirements needed to
compensate for these costs. Therefore tax incentives target these firms, so that the company can use
the tax credit and reinvest into the operational costs. Another solution would be that the government
compensates the company for investing in the country´s infrastructure (i.e. for improving accessibility)
(UN New York and Geneva, 2000).
Considering all these facts for offering tax incentives, Bulgaria has developed a very good tax system,
fully complying with the EU regulations. The Corporate Income Tax Act (CITA) says that all companies
that conduct business in the country have a right to corporate income tax at a 10% rate (Invest
Bulgaria Agency 3, 2010).
This corporate income tax is one of the lowest not only in the region, but in the entire European Union.
In the 2003 the tax was at 23.5%, then it fell to 19.5% in 2004, to 15% in 2005 (Asenova, 2009).
Foreign entities are taxed on the Bulgarian source income. If a company is registered in Bulgaria, it is
considered to be tax resident with the registered office in the country and is entered into the Bulgarian
tax register. If a company operates in Bulgaria only through the branch or agency and is non-resident,
it is liable for a tax only on the profits generated through their Bulgarian branch (Invest Bulgaria
Agency 3, 2010).
“Value Added Tax (VAT) is a form of consumption tax. From the perspective of the buyer, it is a tax on
the purchase price. From that of the seller, it is a tax only on the ‘value added’ to a product, material or
service, from an accounting view, by his stage of its manufacture or distribution. The manufacturer
remits to the government the difference between these two amounts, and retains the rest for
themselves to offset the taxes he had previously paid on the inputs” (Wikipedia 2, 2011).
According to the Bulgarian law, transactions that are liable for VAT are any taxable supply of goods
and services, any intra-community (EU) acquisition with the transaction place within the country, any
intra-community acquisition of new means with the transaction placed within the country, importation
of goods (Invest Bulgaria Agency 3, 2010).
The VAT tax rate in Bulgaria currently is at 20% and therefore competitive to other countries (e.g. 22%
in Croatia). The VAT is applicable to (Invest Bulgaria Agency 3, 2010):
• Any taxable supplies (except for those specified to zero tax rate)
• Any imported good into the country
• Any taxable intra-community acquisitions.

Determinants of Foreign Direct Investment in the Emerging South-East European Countries
41
3.1.6 FDI in Bulgaria
During 1997-1999 the investments in Bulgaria were over $2 billion, which is a lot higher than in
previous years. Before 1997, Bulgaria collected only $1,089 million. Germany was the largest investor
in 1997, with 21.2% of FDI. The Netherlands, Belgium, Austria and Great Britain are some of many
other countries that invested in Bulgaria. More than 75% of the investments came from EU countries
(Jordanova, 2001).
Table 12 Sectoral distribution of inward FDI stock in Bulgaria 2000 and 2009
Source: Aristidis P. Bitzenis. Inward FDI in Bulgaria and its policy context. Columbia FDI Profiles,
2012.
Table 12 shows that the real estate sector received the largest amount of FDI in 2009, followed by the
manufacturing and finances. Telecommunications got a small number of investments in 2000, which
significantly improved in 2009, whereas the agriculture did not rank very well.
Totev finds that the FDI distribution by the sectors is divided into five major areas:
• food products, beverages and tobacco
• basic metals and fabricated metal products, except machinery
• chemicals, products and man-made fibres
• textiles and textile products
• other non-metallic mineral products.

Determinants of Foreign Direct Investment in the Emerging South-East European Countries
42
He also emphasizes that these five sectors collect 70% of total FDI in manufacturing. According to
Totev, the comparative advantage shows two major conclusions (Totev, 2005):
1. The Bulgarian products are less competitive in the EU markets if the value added in goods is
higher
2. Bulgaria has advantage in raw material in EU markets, especially beverages and tobacco
Furthermore, Totev itemizes the distribution of FDI by regions. He emphasizes that there have been
slight changes in regions and their level of economic development in comparison to the time period
before the transition. Regions that have been developed before they have recovered. Also, regions
close to the border with Greece underwent positive changes in the development. Since Greece
borders Bulgaria, a significant part of the Greek FDI has flown into Sofia, and also a large share of FDI
went into the regions of Bulgaria that are close to the border. One major reason and advantage for
investing into these regions was low transportation costs between these two countries. The Sofia
region was the most developed region and received the biggest share of FDI with 56% of the
country´s total FDI. Other regions attracted much less shares of FDI, mostly because of critical
population density outside of Sofia (Totev, 2005).
3.2 Romania
3.2.1 Geographical location of Romania
Figure 13 Map of Romania
Source: http://wwp.greenwichmeantime.com/images/europe/romania.jpg. Accessed on April 10th,
2012.

Determinants of Foreign Direct Investment in the Emerging South-East European Countries
43
Romania has a population of 19 million people. Bucharest is the capital of Romania and its largest city
with a population of almost 2 million people. Approximately 90% of the people are ethnic Romanians,
speaking Eastern Romance language, with primarily Latin roots and some mixture of Slavic, German,
Greek, Hungarian and Turkish languages. Romania has a surface area of 238,400 km2 which makes it
the twelfth largest country in Europe. Its borders only take around 3,100 kilometers. Romania borders
the Republic of Moldova in the East, Serbia in the South-West, Bulgaria in the South, Ukraine in the
North and East and Hungary in the West. Romania is situated in the North-Eastern part of the Balkan
peninsula, the halfway between equator and the north pole (Wikipedia 3, 2012).
Romania is divided into several historic regions (Bachman, 1989):
1. Dobruja is the most Eastern region, between Northern bank of the Danube and the coast of the
Black Sea
2. Moldavia extends from the Eastern Carpathians to the Prut river
3. Walachia is in the South and goes from the Transylvanian Alps to the Bulgarian border. Olt
River divides Walachia into Oltenia on the West and Muntenia on the East.
4. Transylvania is the central West region of Romania and is differentiated by the Carpathians
separating the region from the Maramures region in the North-West. The Crisana area borders
Hungary in the west. The Banat region borders both, Hungary and Serbia. Banat has the highest
concentration of ethnic minorities consisting of Hungarians, Serbs and Germans.
The country’s infrastructure has a very good mixture of roads (103,671 km), railways (11,385 km) and
3.8 million main telephone lines. Even though these numbers look impressive, the country’s economic
infrastructure is very poor und undeveloped. Even if improving of the infrastructure was the number
one project that the government wanted to invest into, finding finances would be the biggest obstacle
to realizing this goal. Government is relying on the EU funds and foreign investors willing to invest their
money in the infrastructure development. The money that came from the EU went into improving main
roads connecting Romania with Europe, rather than investing in improving smaller roads. Railways are
still state-owned with no improvements or further development. In 2001, Japan borrowed $220 million
to Romania to improve the Bucharest-Constanta railway (Encyclopedia of the Nations, 2012).
3.2.2 Governmental system of Romania
In 1965, Romania declared a socialist republic status, which was probably closest to bringing it to
communism. In 1945, the Soviet Union aggressively pushed King Michael to assign the important
government positions to communists. This was already a red flag showing that Romania was on the
path to becoming a communist country. Only 2 years after the communist party took over the country
completely. In 1974, the presidential office of the Romanian communist republic was established with
Nicolae Ceausescu as its first president. Until the end of 1980s he was the head of the Romanian
Communist Party. A political system such as this one was one of the most centralized in the world.
The Council of Minister was larger than that of any other European communist government (with the

Determinants of Foreign Direct Investment in the Emerging South-East European Countries
44
exception of Soviet Union’s council which was the largest). Even though the communist power was
very strong, this regime faced resistance in the 1980s. A letter written by the known retired communist
officials was published in which Ceausescu was accused of violating human rights, misleading the
economy, ignoring the constitutional rights of citizens, etc. The relationships with other countries were
shaken (Hungary especially), as many Hungarians run out of the country (Mongabay, 2011).
After the fall of the communist regime, the restructuring of the public administration followed
immediately. The transition happened gradually under the guidance of the National Salvation Front. In
1991 constitution was adopted and provisions included delivering more power to the local
governments. Political parties were formed, free elections were adopted and public authorities were
created on both levels, central and public. In 1992 the first elections were held. Democracy continued:
Romania joined the Council of Europe in 1993, and it declared its goal to enter the EU. After 1996 the
number of political parties in counties and local councils as well as the number of members
representing each party changed. For the first time these members were elected freely as directed by
the voters. Further changes resulted in distribution of various ministries being more present and
responsive for the needs of the community. They encouraged new management techniques whereby
citizens were able to attend special city meetings and county councils (Coman et al., 2001). Today the
Romanian government consist of a president, parliament and a constitutional court.
3.2.3 Why to invest in Romania
Location is certainly one of the main reasons for investing into Romania. Romania enjoys privileges of
being on the crossroads between EU, Balkans and the CIS Countries. It connects Western and
Eastern Europe, Southern and Northern Europe. Most importantly, the Danube river connects the
large portion of the Black Sea to Northern Europe. Romania had strong economic growth with more-
less steady inflation rate until the world financial and economic crisis hit the country in 2008. Its flat
corporate tax rate of 16% was an additional stabilizing factor for the Romanian business. Romania is
an important and very large market. With its population of 21 million people, Romania represents the
seventh largest EU market. A majority of its population is fluent in several foreign languages due to the
fact that many Romanians studied and worked abroad (since Romanian is rooted in Latin, it makes
Italian, French, Spanish and Portuguese languages easier to acquire) (Weastra, 2011).
State aid schemes and taxation policy have been important factors for investing in Romania. In 1999
regulations about state aids were formed; however, they have been implemented only recently as part
of the preparations for the EU accession. In January of 2007, all state aid clearance powers have
been transferred to the European Commission. A new national state aid policy was approved for the
period 2006-2013, with focus on state aid schemes. A new regional aid-map for Romania for the
period 2007-2013 was approved in 2007. Aids offer incentives for investors such as contribution from
the state for jobs created, subsidy on interest on contracted loans, etc. For the investments of over
€50 million, a special scheme has been designed, with the requirement that the initial investment had
to be at least €30 million and that 300 jobs needed to be created (Mitroi, 2009).

Determinants of Foreign Direct Investment in the Emerging South-East European Countries
45
It is important to mention that there have been much more important factors for the investment in
Romania, such as: Romania is a member of the North Atlantic Treaty Organization (NATO), EU,
United Nations (UN) and World Trade Organization (WTO). Romania has signed the free trade
agreements with EU, European Free Trade Association (EFTA) and Central European Free Trade
Agreement (CEFTA) countries. It has a well developed mobile network, skilled labor speaking different
foreign languages, flat corporate tax, a system in place for improving highway infrastructure,
developed industrial infrastructure, a fiscal policy regulated by the Fiscal Code, etc. (Romania Trade &
Invest 1, 2012).
3.2.4 Macroeconomic outlook of Romania
Table 13 Macroeconomic indicators in Romania 2009
CEE Quarterly 01/2009 page 29 See last pages for disclaimer.
Economics & FI/FX Research
CEE Quarterly
Romania Outlook
Economic growth is forecast to slow rapidly in 2009, against a tight global capital flow backdrop. The positive flipside of this, however, is a significant reduction in the current account deficit and a sharp improvement in the inflation outlook. Fiscal policy and furthersovereign credit ratings downgrades remain risk factors, however, something which continues to warn of upside pressure on EUR/RON in 2009.
Author: Rozália Pál, Ph.D., Chief Economist (UniCredit Tiriac Bank) +40 21 203 2376, [email protected]
MoodyOs S&P Fitch Long-term foreign currency credit rating Baa3 stable BB+ negative BB+ negative
MACROECONOMIC DATA AND FORECASTS
2006 2007 2008e 2009f 2010f
GDP (EUR bn) 97.8 121.4 136.9 125.6 143.1Population (mn) 21.6 21.5 21.4 21.3 21.2GDP per capita (EUR) 4529 5639 6391 5893 6747GDP (constant prices y-o-y %) 7.9 6.0 8.0 0.6 2.0Private Consumption, real, y-o-y (%) 11.4 10.2 11.1 0.2 3.3Fixed Investment, real, y-o-y (%) 19.3 28.9 23.1 0.4 3.9Public Consumption, real, y-o-y (%) -9.9 7.4 5.0 1.0 4.8Exports, real, y-o-y (%) 10.6 8.7 18.2 -8.0 3.8Imports, real, y-o-y (%) 22.4 26.1 21.2 -6.7 6.5CPI (year end, y-o-y %) 4.9 6.6 6.3 4.7 4.0Central bank reference rate 8.8 7.5 10.3 8.5 7.0Unemployment rate (%) 5.4 4.3 4.0 6.0 5.0Budget balance / GDP (%) -1.5 -2.3 -4.8 -5.0 -4.5Current account balance (EUR bn) -10.2 -16.7 -17.4 -12.3 -11.5Current account balance / GDP (%) -10.4 -13.7 -12.7 -9.8 -8.1Net FDI (EUR bn) 8.7 7.2 9.6 4.5 4.7FDI % GDP 8.9 5.9 7.0 3.6 3.3Gross foreign debt (EUR bn) 31.4 38.5 50.6 56.9 65.4Gross foreign debt (% of GDP) 32.2 31.7 36.9 45.3 45.7FX reserves (EUR bn) 22.9 27.2 28.3 25.4 26.7(Cur.Acc-FDI) / GDP (%) -1.5 -7.8 -5.7 -6.2 -4.8FX reserves / Gross foreign debt (%) 73.0 70.7 55.9 44.7 40.8Exchange rate to USD eop 2.6 2.5 2.9 3.2 3.3Exchange rate to EUR eop 3.4 3.6 4.0 4.5 4.3Exchange rate to USD AVG 2.8 2.4 2.5 3.3 3.2Exchange rate to EUR AVG 3.5 3.3 3.7 4.5 4.4
Source: UniCredit Research
Source: Bank Austria. CEE Quarterly, 01/2009.

Determinants of Foreign Direct Investment in the Emerging South-East European Countries
46
Table 14 Macroeconomic indicators in Romania 2012
Source: Bank Austria. CEE Quarterly, 01/2012.
Table 13 indicates that the GDP slowed down to 6% in 2007, from 7.9% in 2006. Domestic demand
and the country´s performance were the reasons for the economy’s continued growth, with gross fix
capital formation reaching close to 29% in real terms. Stock price fall affected negatively the
agricultural supply (European Commission 1, 2008).
In 2008 the economy started to expand again and reached 8% in the first quarter followed by the
incredible 9.3% in the second quarter. For the first time in four years the exports were higher than the

Determinants of Foreign Direct Investment in the Emerging South-East European Countries
47
imports (17.6% vs. 15%), private consumption reached 13.3% (in comparison to 2007 when it was
10.3%) (Hansa Bank Markets, 2008).
Unfortunately, 2008 did not end as expected. As the year was coming to an end, the growth was
declining considerably. The financial crisis hit Romania significantly and caused the growth to fall to
only 0.6%. The crisis continued in 2009 and caused imbalances and economic vulnerabilities leading
to government reforms. The recent data showed an even bigger decline in growth in 2009 with -7.1%
(Table 14). Romania faced difficult task of restoring the sources of the growth; it started revaluating its
policies as well as the wages in the public sector. The government got the support from the IMF, World
Bank of totally €19.95 billion in only 2 years, 2009 and 2010. This amount equals to 14-15% of the
GDP and it played the important role in the normalization of financial conditions and balancing of the
economy. In 2011, the economy slowly started to recover (Table 14) (World Bank 3, 2010).
Table 15 Unemployment rate January 2006-2012
Source: Trading Economics. http://www.tradingeconomics.com/romania/unemployment-rate.
Accessed on April 6th, 2012.
The unemployment in Romania had a huge impact on the economic growth; in this case, a positive
impact, at least until 2009. Table 15 shows that unemployment rate decreased significantly in the
period of 2006-2008. The financial crisis resulted in a higher number of unemployed people in 2009
and 2010. The last months of 2011 had a somewhat constant rate of 7.2%.
3.2.5 Tax regulations in Romania
In order to attract foreign investments, a country needs to reach a certain place where the investing
companies will achieve their goals. Some of the measures that implemented towards this goal were

Determinants of Foreign Direct Investment in the Emerging South-East European Countries
48
adjusting laws and regulations for the entry and establishment of foreign investment projects, with the
guarantee of the return on profit. Market size, access to raw materials and availability of skilled labor
are primary reasons for attracting foreign investments. Once these requirements are met, the next
step of evaluating the country’s incentives can be considered. Tax incentives can very much reduce
tax overload of the investors if applied properly. Tax incentives include reduced tax rates on profits,
not high corporate tax, VAT, etc. They often come with conditions that foreign investors should meet,
like that the company is established in specific regions of the country. Usually these regions are not
very developed and would need growth.
China, for example, offered 40% tax refund on the profit, if this profit was reinvested to increase the
capital of the firm. The same profit had to be reinvested for the next five years. If not, the company had
to pay taxes (UN New York and Geneva, 2000).
The fiscal Procedure Code regulates the tax rights and obligations of the parties, as well as fiscal
registration, declaration, inspection, establishment of the taxes, collecting the fiscal debts (PKF, 2010).
In accordance with the Fiscal Code, the following are treated as taxable subjects (Romania Company,
2011):
• Romanian companies
• Foreign companies doing business in Romania through a registered company in Romania
• Foreign companies and non-resident individuals that perform activity in Romania through a joint-
venture
• Foreign companies making revenue doing real estate in Romania or from transactions with shares
of a Romanian legal business
• Romanian companies and resident individuals, for the income obtained both in Romania and
overseas from joint ventures with Romanian companies.
According to the Foreign Investors Council (FIC), Romania does not have a published tax strategy,
which is not the case with the other EU countries that have set goals and objectives. There is no clear
statement when Romania shall adopt tax standards of the OECD. This is certainly a disadvantage for
Romania as it gives away a reputation of an unstable country. Corporate income tax is 16% in
Romania, which is not as attractive as Bulgaria’s income tax. Value Added Tax is 19%, which is even
more attractive than in Bulgaria (20%). However, the Value Added Tax is another concern for
Romania, as there have been long delays (up to over a year) for receiving tax refunds. Introduced
procedure which would allow faster fund refunds, has unfortunately not been implemented. This
causes big problems for the cash flow in the country, especially for the export companies. FIC is of the
opinion that Romania should announce when it will fully adopt OECD tax standards, in order to
increase FDI and country development. FIC further suggests that Romania should implement already
existing procedures to speed up VAT refunds in the country (Foreign Investors Council, 2003).

Determinants of Foreign Direct Investment in the Emerging South-East European Countries
49
3.2.6 FDI in Romania
Similarly to the other CEECs countries, Romania became an attractive country for foreign investors
during the last few years. Even though the FDI stock per capita is still low in Romania, it has increased
since 1999. Starting with 2004, the FDI inflows were higher than expected (Figure 14). Romania
received larger portion of inflows then the Czech Republic, which was considered the third largest
destination of FDI inflows after Hungary and Poland. The biggest investors in this period were Austria,
Germany and the Netherlands, with 50% of FDI stock of a total of 80% that came from other EU
countries. Western European countries are the main investors in Eastern Europe (Pauwels and Ionita,
2008).
Figure 14 Inward FDI flows and per capita FDI stocks 1999-2006 in Romania
ECFIN Country Focus Volume 5, Issue 3 Page 2
Graph 1: Inward FDI flows and per capita FDI stocks
02468
101214161820
1999 2000 2001 2002 2003 2004 2005 2006
EU-15 Romania Bulgaria EU-8
Net inward FDI flows (% of GDP)
0100020003000400050006000700080009000
10000
HU EE CZ SK SI LV PL LT BG RO
199920032006
per capita net inward FDI stocks (EUR)
Source: Eurostat, UNCTAD However, preliminary data for 2007 show that the steep increase in FDI inflows may not continue. In the first three quarters of 2007, total FDI flows declined to 6.5% of GDP, from 8.4% in the same period in 2006. This is mainly the result of the declining importance of privatisation-related FDI, which used to be significant in sectors like public utilities (gas, electricity, telecommunications), banking and the construction sector and is estimated1 to represent roughly half of total FDI stocks. Although several privatisations are still pending, the bulk of the programme is now over. Yet, the volume of non-privatisation-related FDI seemed to have remained broadly stable between 2006 and 2007, according to currently available data. Changing sectoral composition Major shifts are taking place in the sectoral composition of FDI flows to Romania. Investors' interests are diversifying from exploiting low-cost advantages towards higher value-added production with a stronger emphasis on Romania's growing domestic market. This is reflected in the rising share of the services sector as a destination of total FDI flows. At the same time, the manufacturing sector is undergoing significant transformations.
Graph 2: Sectoral breakdown of inward FDI stocks
0% 2% 4% 6% 8% 10% 12% 14%
mining
transport
electricity, heating, natural gas, water
hotels and restaurants
other
construction
real estate and business activities
financial intermediation and insurance
trade
post and telecommunications
manufacturing
% of GDP
20032006
Source: Eurostat, National Bank of Romania In the services sector, the large population and rising living standards have attracted significant FDI flows in financial intermediation and insurance, quadrupling the FDI stocks in this sector as a share of GDP between 2003 and 2006. The increase in insurance can also be attributed to the anticipation of the introduction of a voluntary pension pillar in 2007 and of a compulsory second pension pillar in 2008. Furthermore, both wholesale and retail trade, and real estate and business activities doubled their FDI share as a percentage of GDP over the same period. However, the largest single beneficiary in terms of FDI stocks remains the manufacturing sector, which held more than 1/3 of the inward investment positions in 2006. While FDI stocks in this sector as a share of GDP increased overall between 2003 and 2006, they have also undergone some major reallocations within the sector. FDI in the (lower-end) clothing and wearing apparel sector has
While the services sector has
recorded the largest increase in
FDI stocks …
With the privatisation programme now
largely over, total FDI flows are slowing
down
… the manufacturing
sector remains the largest single FDI beneficiary, but is
undergoing significant structural
transformations.
Source: Stefaan Pauwels and Lorena Ionita. FDI in Romania: from low-wage competition to higher
value-added sectors, 2008.

Determinants of Foreign Direct Investment in the Emerging South-East European Countries
50
Table 16 FDI in Romania 2004-2010
Source: Romania Trade & Invest 2. http://www.romtradeinvest.ro/index.php/De-ce-Romania/fdi-
statistics.html. Accessed on April 6th, 2012.
Table 17 FDI in Romania in 2011
Source: Romania Trade & Invest 2. http://www.romtradeinvest.ro/index.php/De-ce-Romania/fdi-
statistics.html. Accessed on April 6th, 2012.
Unfortunately, the predictions about future FDI inflows do not look as promising as they did so far.
According to Pauwels and Ionita (2008), in the first three quarters of 2007 FDI flows declined to 6.5%
in comparison to 8.4% in the previous year. This was mainly because the privatisation related FDI
were losing their importance in Romania in sectors like electricity, telecommunications, banking and
construction. The non-privatisation related FDI seemed to stay stable in 2007 (Pauwels and Ionita,
2008).
FDI inflows were somewhat higher in 2008, but then again, 2009 showed a significant decline (Table
16). The decline continued in 2010, as well as in 2011 (Table17).

Determinants of Foreign Direct Investment in the Emerging South-East European Countries
51
Another reason why FDI inflows declined was the financial crisis that hit not only Romania but also the
other countries in the world. In 2009 the number of FDI projects was reduced by 50%, reducing, thus,
volume of the new created jobs by 44%. In this period, Romania attracted 75 foreign investment
projects, only 2% of the total projects in Europe, and created a small number of new jobs, which was
only 5% of the jobs in all Europe. On the list of new jobs created, Romania placed seventh in Europe,
and it placed eleventh on the list of total FDI. Despite the difficulties that Romania faced during the
crisis, it was still considered an attractive country for foreign investors (Rusu, 2010).
Figure 15 Distribution of FDI by sectors in Romania
CCEESS$$WWoorrkkiinngg$$PPaappeerrss,,$$IIII,,$$((44)),,$$22001100! 121!
F igure 2 Distr ibution of FDI by main economic activity
Source: processed data accessed on 13.12.2010, http://www.bnro.ro/page.aspx?prid=4617#peloc
G E O G R APH I C A L DIST RIBU T I O N O F IN V EST M E N TS
An important aspect to be considered is the geographical distribution of FDI on development
regions.
From the territorial point of view is observed mainly targeting foreign direct investment to the
region of Bucharest-Ilfov (63%), other important developing regions receiving FDI are central
region (9%), South East (7%), region South (7%) and West (5%), at the opposite end stood the
North-East with only 2% of total investments attracted. The graphical representation can easily
point an unbalanced distribution of geographically foreign investment placement. Over half of these
were concentrated of the Bucharest Region.
This phenomenon can be explained by the quality of infrastructure, labor supply and quality,
the existence of some important opportunities and more stable markets, for better satisfying the
requirements of an investor. The low FDI in the period analyzed were located in North-East, this is
a poor area in terms of material resources, infrastructure, and the aging workforce (due to massive
migration of labor young labor in other regions of the country or abroad). Another explanation is
that in these regions, many investment projects were made from scratch, due to the lack or failure of
specific economic infrastructure.
Table 1 - Foreign direct investment in Romania on 31 December 2009
Value(Euro)
T O T A L din care 49984$!
Bucharest 31699!
41%
21%
13%
12%
7% 6% Industry
Financial!intermediation!and!insurance
Construction!and!real!estate
Source: Nicoleta Rusu. The dynamics of foreign direct investment in Romania after EU accession,
CES working Paper II 2010.
Figure 15 above demonstrates that the largest portion of FDI went to the industrial sector, 41% of the
total FDI. The next most attractive sector for the foreign investors is the financial sector, taking 21% of
the total FDI inflows. Construction and real estate took third place with 13% of total FDI.
From a geographical point of view, the main target of the FDI is the Bucharest region, with 63% of the
total FDI inflow. This can be explained by the fact that this region is best equipped with quality labor,
infrastructure, large population and material resources, which are all important requirements for
foreign investors. The North-East region is considered to be a poor area lacking all relevant
requirements mentioned above. Therefore this region was able to attract only 2% of the total FDI
inflows (Rusu, 2010).

Determinants of Foreign Direct Investment in the Emerging South-East European Countries
52
3.3 Croatia
3.3.1 Geographical location of Croatia
Figure 16 Map of Croatia
Source: http://www.maps-of-croatia.co.uk/images/croatia-politcal-map. Accessed on July 20th 2011.
The Republic of Croatia is a located in Central and South-Eastern Europe, between the Adriatic Sea,
the Balkans, Dinaric and Pannonia region. The capital of Croatia is Zagreb. Croatia borders Bosnia
and Herzegovina in the South-East, Slovenia in the North, Hungary in the North.East, Serbia in the
East, and Montenegro in the South-East.
After World War II, Yugoslavia became an independent communist country, under the lead of Marshal
Tito. Croatia declared its independence from Yugoslavia in 1991. Croatia has a very good
infrastructure. The motorway network has been growing. At the moment we can find over 1,100 km of
finished motorways in Croatia, connecting Zagreb with Split, Slavonia and Istria. The railway network
still needs improvements since some regions are not accessible by train (Istria, Dubrovnik). Croatia
has three big airports, in Zagreb, Split and Dubrovnik that are fully operational every day. There are

Determinants of Foreign Direct Investment in the Emerging South-East European Countries
53
also a few smaller airports, in Zadar, Rijeka, Osijek, Pula, Bol (island of Brac). Jadrolinija provides
regular ferry transport to many Croatian islands as well as to Italy (Wikipedia 4, 2011).
Croatia has four major regions. These are areas that surround the largest cities, Zagreb, Split, Rijeka
and Osijek. Each region can, furthermore, be divided, into smaller regions, which is why Croatia has
20 counties. The borders between these are not physically fixed and they can be moved which means
that the area of the region can easily be increased or decreased in the future. One thing these regions
have in common is the approximate population size and employment rate. They all have
approximately over 100,000 residents and 50,000 employees. Zagreb has a leading position in terms
of the population shares and employed personnel. It accounts for almost one third of Croatia’s
population and one half of its employed population. The Rijeka region accounts for one fourth of the
population and one third of the employed number of people who are living and working in this region.
Split and Osijek regions are in somewhat of a different situation, in which the population and labor are
differentiated between the other sub regions. Varazdin, Karlovac, Sisak, Bjelovar, Slavonski Brod,
Vukovar (until 1991, after that Vinkovci), Pula, Zadar, Šibenik and Dubrovnik have approximately
40,000 residents and 20,000 employees (Njegac and Nejasmic, 2002).
Croatia is a candidate for the European Union membership (likely to become a member in 2013 rather
than 2012 due to the financial and political difficulties). Croatia is also a member of NATO, WTO,
CEFTA and Council of Europe.
3.3.2 Governmental system of Croatia
After the elections in 1990, Croatia adopted the Constitution of the Republic of Croatia and announced
its independence from former Yugoslavia in 1991. This was the first time that the public administration
was elected by the Croatian parliament regulations. Beside standard problems in every governmental
system, Croatia faced many other difficulties. Some of the internal challenges were brought by the
transition to a multi-party political system. The civil war in the early 1990s significantly damaged the
country’s infrastructure and the private-ownership structure of the market economy. All of these factors
indicated a need for a well functioning governmental system. Due to these problems, in 1992, a local
self-governmental system was declared. First local elections followed in 1993. The local self-
government system was structured in a way to allow for central administration of all public affairs,
focusing on unity and centralization. This brought great expansion and concentration of the central
government. Local self-government systems lasted until the war started when the need for
differentiation of the operational independence of the administration and decentralization of the
system became evident. In 1997, 2000 and 2001 the system went through important changes (Antic,
2004).
Today Croatia is a parliamentary democracy with a multi-party system that is based on a legislative,
executive and judicial branch of government, so called the system of tripartite authority. The
Constitutional Court can be seen as the country’s fourth authority. The parliament of the Republic of
Croatia is the highest organ of the judicial branch. The elections are held once in four years during
which people over 18 years are eligible to vote and elect representatives. The parliament has 120

Determinants of Foreign Direct Investment in the Emerging South-East European Countries
54
representatives. The executive power is divided between the president and the government of the
Republic of Croatia. The president is elected in presidential elections once in five years, and can serve
for a maximum of two terms. The president holds the authority to dissolve the parliament and
nominate a candidate for a prime minister. The government has the highest executive power and
consists of a prime minister and 13 ministries that have executive powers conformed to the
constitution and law (Kuecking et al., 2009).
3.3.3 Why to invest in Croatia
In former Yugoslavia, Croatia was one of the most developed countries. Its excellent geographical
location, multilingual labour and strong infrastructure are just some of the many reasons why Croatia is
a lucrative country to invest into. In 2002, the government of the Republic of Croatia established the
Croatian Trade and Investment Promotion Agency (APIU). The task of the APIU was to be the point of
contact for foreign investors, to promote Croatia as a country for foreign direct investments and to
provide its assistance to the foreign investors on behalf of the Croatian government. APIU puts its
focus on the foreign investment projects in Croatia that will help with producing goods and services for
exports and will create new jobs at the same time (Trade and Investment Promotion Agency of
Croatia, 2009). Croatia presented attractive tax regulations for foreign investments. A company can
reduce the standard corporate income tax of 20% down to 10%, 7%, 3% or even 0%. The tax rate
depends on the amount of the investment, as well as on the number of new jobs created. Non-
refundable funds are offered for the investments of substantial economic interest. These refer to the
investments of a minimum of €15 million with at least 100 new jobs created. Non-refundable funds of
up to 5% of the costs are available for these types of projects, with a limit of €500,000. If the
investments go to the undeveloped areas, where unemployment rate exceeds 20%, non-refundable
funds with a limit of 5% can be received for a construction of a new plant or for equipment purchasing,
with a limit of €1 million. The city of Vukovar was very damaged during the civil war with Serbia. Therefore, the companies which perform business in this area and which hire more than 50%
employees registered in the City of Vukovar are exempt from the corporate income tax for 10 years.
Also, companies that are doing business in the free trade zone located in Vukovarsko-Srijemska
County are exempt from the tax for 10 years starting in 2005. Businesses performed in the mountain
area that are employing at least 5 employees registered in this area, have a right to a reduced
corporate income tax of 15% (Ernst&Young, 2007).
There is a need for construction of hotels, renovation of hotels and golf courses in Croatia. The
Croatian government is about to sell 200 hotels. These are all projects worth investing in, as Croatia
has been an attractive holiday destination for entire Europe. It is very easy accessible by plane, and
even by car (Croatia Invest, 2011). The information and communication technology sector is
developing; Siemens and Ericson are already present in the market. Pharmaceutics (Pliva-Barr,
Belupo), biotechnology (e.g. project for a tech-park in Varazdin) have also big potential for investment
(Ranieri, 2008).

Determinants of Foreign Direct Investment in the Emerging South-East European Countries
55
3.3.4 Macroeconomic outlook of Croatia
Table 18 Macroeconomic indicators in Croatia 2009
CEE Quarterly 01/2009 page 41 See last pages for disclaimer.
Economics & FI/FX Research
CEE Quarterly
Croatia Outlook
The growth outlook remains poor on the back of a weak international environment. While,monetary policy settings remain tight with strong currency policy still in place and double-digit interest rates in the interbank market F constraining credit growth. Fiscal policy has no room for countercyclical management and as tax revenues slow the private sector is exposed to therisk of crowding out by increased government borrowing.
Author: Goran Baravanja, Chief Economist (Zagreba�ka banka) + 385 1 6006 678, [email protected]
MoodyMs S&P Fitch Long-term foreign currency credit rating Baa3 stable BBB negative BBB- stable
MACROECONOMIC DATA AND FORECASTS
2006 2007 2008e 2009f 2010fGDP (EUR bn) 34.2 37.5 41.2 40.7 42.9Population (mn) 4.4 4.4 4.4 4.4 4.4GDP per capita (EUR) 7707 8453 9295 9181 9680GDP (constant prices y-o-y %) 4.8 5.6 2.1 -1.6 1.6Private Consumption, real, y-o-y (%) 3.5 6.2 1.7 -1.0 1.5Fixed Investment, real, y-o-y (%) 10.9 6.5 7.5 -1.3 3.5Public Consumption, real, y-o-y (%) 2.2 3.4 1.9 2.5 2.5Exports, real, y-o-y (%) 6.9 5.7 2.8 -1.0 1.0Imports, real, y-o-y (%) 7.3 5.8 6.1 -0.5 2.5CPI (year end, y-o-y %) 2.0 5.8 3.6 3.8 2.7Central bank reference rate 0 0 0 0 0Unemployment rate (%) 11.2 9.6 8.9 9.8 9.6Budget balance / GDP (%) -3.0 -2.3 -1.6 -2.8 -3.2Current account balance (EUR bn) -2.7 -3.2 -4.5 -3.6 -3.4Current account balance / GDP (%) -7.9 -8.6 -11.0 -8.8 -7.8Net FDI (EUR bn) 2.7 3.5 3.3 1.5 2.5FDI % GDP 8.0 9.3 8.0 3.7 5.8Gross foreign debt (EUR bn) 29.3 33.2 39.0 40.0 42.0Gross foreign debt (% of GDP) 85.5 88.6 94.6 98.2 97.8FX reserves (EUR bn) 8.7 9.3 9.7 8.7 9.2(Cur.Acc-FDI) / GDP (%) 0.1 0.6 -3.0 -5.2 -2.0FX reserves / Gross foreign debt (%) 29.8 28.0 24.9 21.8 21.9Exchange rate to USD eop 5.6 5.0 5.3 5.2 5.7Exchange rate to EUR eop 7.4 7.3 7.4 7.5 7.4Exchange rate to USD AVG 5.8 5.4 4.9 5.3 5.4Exchange rate to EUR AVG 7.3 7.3 7.2 7.4 7.4
Source: UniCredit Research
Source: Bank Austria. CEE Quarterly, 01/2009.

Determinants of Foreign Direct Investment in the Emerging South-East European Countries
56
Table 19 Macroeconomic indicators in Croatia 2012
Source: Bank Austria. CEE Quarterly, 01/2012.
If we consider the fact that Croatia’s independence happened not so long ago, and that it came out of
the war within the last 15 years, it is not surprising that the country experiences only a limited growth.
It is inevitable that the financial crisis left traces in Croatia. Until the crisis, Croatia had a growth of 45%
per year. In the first quarter of 2009, GDP dropped by 6.7% compared to 2008. The first quarter of
2009 was the hardest quarter. Not only was this the third quarter in a row with a GDP decrease, but it
was also the quarter with a significant decrease in all economic sectors. The domestic demand
dropped as well as the external demand, which negatively influenced the exports of the country. This

Determinants of Foreign Direct Investment in the Emerging South-East European Countries
57
was caused mainly by the fall in the oil industry and the chemical products production. Tourists’
overnight visits decreased as well. Only in the first 5 months of 2009, the decline was 9%. In June the
number of overnight stays rose, but in comparison to the previous year, it had a decline of 3%. 2011
forecasted a higher number of overnight stays leading to an account deficit of 0.4% (Table 19).
Consumer prices rose in 2009 by 2.9% in comparison to the previous year, and the producer prices
dropped by 0.6%. Higher transportation prices caused for higher consumer prices. From Figure 17 we
can see that prices were not stabilized yet but were much more consistent (EIZ, 2009).
Figure 17 Inflation rate in Croatia
Source: Bank Austria. CEE Quarterly 01/2012.
The Employment rate declined as well. In 2009 the rate was 2.4% lower than in the previous year. It
kept declining even throughout 2010 when it reached 12.4%, which was 3.3% higher than in 2009.
Increasing employment was expected in 2011, but the labor force was projected to decline faster than
the employment, so there was no big change in the unemployment rate (Figure 18) (European
Commission 2, 2010).

Determinants of Foreign Direct Investment in the Emerging South-East European Countries
58
Figure 18 Unemployment rate in Croatia
0
5
10
15
20
2519
97
1998
1999
2000
2001
2002
2003
2004
2005
2006
2007
2008
2009
2010
2011
*
%
Registered unemployment rateILO unemployment rate
Source: Croatian National Bank. www.hnb.hr/publikac/prezent/spf.ppt. Accessed on April 6th, 2012.
3.3.5 Tax regulations in Croatia
In order to achieve a transparent and effective tax system, it is important to think of a successful
strategy and the best way to implement it. In cooperation with the Croatian government, the Deutsche
Gesellschaft für Technische Zusammenarbeit (GTZ) has acted on behalf of the German Federal
Ministry for the Economic Cooperation and Development (BMZ) and developed a simple taxation
system that can be easily implemented. Until a new system was introduced by GTZ, Croatia had
multiple commodity taxes and many exemptions and tax reductions for personal income and profits. It
was inevitable that the reform had to happen. The reform introduced by GTZ contained reorganisation
of the entire tax administration. It included avoidance of the double taxation of income, bringing
together all tax agencies in the country under one umbrella (by implementing a data processing
system) and replacement of a multiple commodity tax rates by introducing a Value Added Tax
(Schuppert and Birger, 2008).
Croatia introduced a Value Added Tax system in 1998. The standard VAT rate is 22%, and reduced
rates lie at 10% and 0%. Supply of goods into the free zones, exports into diplomatic missions, air and
river transportation, and export to humanitarian organizations are exempted from the VAT (European
Commission 3, 2006).
Croatia introduced the Corporate Income Tax system in 2005. Since the announcement of the
country’s independence, Croatia changed its corporate income tax rates three times. Until 1996 the
tax rate was 25%, then it rose to 35% until 2000. In 2001 Croatia significantly reduced the corporate
income tax to 20%, and it has not been change since. From Figure 19 we can see that Croatia has a
lower corporate income tax rate than an average European country (EU-27). Even though low CIT is

Determinants of Foreign Direct Investment in the Emerging South-East European Countries
59
attractive for the foreign investors, the new EU countries (e.g. Bulgaria, Romania) followed the trend of
lowering CIT much more in order to attract investments. Croatia, on the other hand, has not lowered
the tax since 2001(Simic, 2009).
Figure 19 Corporate income tax rates in European countries and Croatia F E B % W O R K I N G P A P E R S E R I E S 0 9 - 0 2
Page 5 of 14
Figure 1. Adjusted statutory CIT rates in EU-27 and Croatia in 2007 (%)
Source: European Communities (2008) & Corporate Income Tax Act.
Figure 1. shows CIT rates applied in EU-27 and Croatia in 2007. According to the figures presented, Croatia has a relatively low tax rate with respect to the EU-27 average. The difference is, expectedly, even greater when only old EU-15 countries are taken into account. New EU-12 countries, on the other hand, in average apply a lower CIT rate than Croatia. Unlike most EU-12 countries, Croatia has not decreased its CIT rate since 2001, and we can therefore talk about a relatively long period of application of a significantly low CIT rate of 20%. When together with the CIT also the tax structure is observed, and in general the share of CIT in the GDP or in the total revenues, we are talking about a backward-looking approach of observing the effective tax burden. Figure 2. shows the tax structure in Croatia. In the structure of general government tax revenues CIT represents merely 12% of tax revenues, which is the lowest share among the related tax forms such as PIT, VAT and excise duties. The mentioned share would be even smaller if other public revenues, such as social contributions and grants, were taken into account. Apart from demonstrating a rather low CIT burden, the figure also points to a consumption-based tax system in Croatia which is dominated by indirect taxes (VAT, excise duties).
Figure 2. General government tax revenue structure in 2007.
Source: Ministry of Finance (2008).
Source: Hrvoje Simic. Effective Corporate Income Tax Burden in Croatia, February 2009.
Similarly to Bulgaria and Romania, Croatia developed tax incentives to attract foreign investors. In
addition to standard CIT rates, reductions to 10%, 7%, 3% and even 0% are possible, if the conditions
are met. For example, a company needs to be established in the certain region, usually in an
undeveloped region of the country, and has to employ a certain number of people from that region in
order to apply for a reduction of the corporate income tax.
3.3.6 FDI in Croatia
FDI inflows have a big influence on the economic growth of the country receiving the FDI, but all
countries are not that successful in attracting big shares of FDI. Hungary, Poland and the Czech
Republic are leading countries that have attracted the most shares of FDI in the past years. However,
in order to determine the absolute value of FDI inflows in each country, the size of the economy needs
to be considered in addition to the FDI shares (Faculty of Economics and Business Zagreb,
2009/2010).

Determinants of Foreign Direct Investment in the Emerging South-East European Countries
60
Figure 20 FDI inflows to Croatia 1997-2011
480850
1,3631,141
1,4671,138
1,762
950
1,468
2,765
3,651
4,219
2,380
281
1,048
0
500
1,000
1,500
2,000
2,500
3,000
3,500
4,000
4,50019
97
1998
1999
2000
2001
2002
2003
2004
2005
2006
2007
2008
2009
2010
Q1–
Q3/
11*
mill
ion
EUR
Source: Croatian National Bank. www.hnb.hr/publikac/prezent/spf.ppt. Accessed on April 6th, 2012.
The World Bank research from 2006 showed that FDI in Croatia exceeded $1 billion each year. 2003
was the peak year with $ 1.8 billion (Figure 20), which was mainly caused by the sale of INA (oil
company) to Hungarian MOL. These results indicate that Croatia placed itself as one of the top
countries that attracted most FDI. Only Hungary, Estonia, the Czech Republic and Slovenia were
ahead of Croatia in the South-East and Central Europe. The equity investments constituted between
30% and 40% of the inflows, with an amount of $888 million in 2003 and $319 million in 2004.
Telecommunications received 16% of the inflows, pharmaceutical industry 11%, petrol 8% and cement
manufacture only 3% (World Bank 4, 2006).
The privatization process has been very attractive for foreign investors, as most FDI in Croatia went to
already existing companies. They targeted non-manufacturing sectors like banking, insurance, and
real estates (Figure 22). 70% of the FDI shares went to privatization, whereas less than 30% of FDI
were new investments projects (Figure 21). Even though FDI has had tremendous effect on the
transition countries economy, FDI in Croatia did not achieve such great results. It is true that certain
sectors mentioned above improved but the manufacturing sectors (e.g. manufacturing of other non-
metallic mineral products, refined petroleum products) were left behind (Figure 22). A lower inflow of
FDI in Croatia can be explained by the fact that Croatia became attractive for foreign investors later
then other countries (e.g. Hungary and Poland). Also, the fact is that most shares of FDI went to
privatization rather than to export investments impacted the attractiveness of this country. Croatia has
a potential for real economic growth, and there are certainly some changes in the economic system
that need to be worked on. First of all, Croatia needs more export-oriented greenfield investments
(Sohinger et al., 2005).

Determinants of Foreign Direct Investment in the Emerging South-East European Countries
61
Figure 21 Distribution of FDI in Croatia
6
4.1. Modes of entry Only small proportion of FDI in Croatia has been directed towards setting up new production facilities. Most of it went into the existing companies as a part of privatization process. Greenfield investment3, especially in the manufacturing sector or in export-oriented sectors has been negligible. Moreover, most of FDI ended up in non-manufacturing sectors - banking, insurance, retail and wholesale trade or telecommunications. Share of privatization related FDI inflows in period 1993 – 2004 Q2 has been around 54%, but together with other acquisitions (mostly related to acquisitions of previously privatised firms) its share grows to more than 70%. Therefore, less than 30% of total FDI inflows has been related to new investments – around 20% came as greenfield investments, 5% as part of joint venture investments4 and rest of it as subsequent investments into previously acquired firms. These are rather small proportions of greenfield or joint venture investment and especially new investment in acquired companies relative to amounts of acquisitions (Figure 3).
Figure 3 Croatian FDI equity inflows 1993 – 2004 Q2 by the type of investment, (mil USD)
0
500
1.000
1.500
2.000
2.500
3.000
3.500
4.000
4.500
Greenfield Joint Ventures Privatization Other acquisitions
New investments
Other acquisitions
Privatization related acquisitions
Initial investments
Source: Croatian National Bank It is true that privatization related FDI could produce equally positive effects in a long run as greenfield investments. Acquisitions followed by company’s restructuring, technology, management and organizational improvements, labor skills and education upgrade eventually result in productivity rise and greater competitiveness leading to expansions to new markets (exports) and production and employment growth. Such FDI is welcome just as much as export-oriented greenfield investments. However, most of the privatization related FDI in Croatia refers only to acquisitions of companies that were relatively successful even prior to acquisition. They have continued to be very 3 Greenfield investments are defined as investments into enterprises established by foreign capital only 4 Joint venture projects refer to newly established FDI enterprises with mixed domestic and foreign ownership (at least 10%)
Source: Sohinger, Galinec and Skudar. The structure of FDI in Croatia and its impact on the domestic
economy, 2005.
Figure 22 Distribution of FDI in Croatia (Q1 – Q3/2011)
Financial intermediation, exceptinsurance and pension fundsManufacture of chemicals andachemical productsReal estate activities
Real estate investments
Manufacture of other non-metallicmineral productsManufacture of coke, refined petroleumproducts and nuclear fuelPost and telecommunications
Supporting and auxiliary transportactivitiesManufacture ofbasic metals
Other business activities
Other activities
Source: Croatian National Bank. www.hnb.hr/publikac/prezent/spf.ppt. Accessed on April 6th, 2012.

Determinants of Foreign Direct Investment in the Emerging South-East European Countries
62
3.4 Bosnia and Herzegovina
3.4.1 Geographical location of Bosnia and Herzegovina
Figure 23 Map of Bosnia and Herzegovina
Source: http://www.infoplease.com/atlas/country/bosniaandherzegovina.html. Accessed on July 20th,
2011.
Bosnia and Herzegovina (BiH) is a country in Southern Europe. BiH is a part of Ex-Yugoslavia. The
country got its name from two regions, Bosnia (the Northern and Central part) and Herzegovina (the
Southern part). The country borders Croatia in the South, West and North; it borders Serbia in the
East and Montenegro in the South-East. A small part of the Adriatic Sea coast in the South (26 km)
belongs to Bosnia and Herzegovina. Bosnia has a lot of mountains placed mainly in the Central and
Southern part of the country. In the North-West we can find hills and flatlands; in the East we see
mostly forests. Bosnia has a continental climate with high temperatures in the summer and very cold
and snowy wetter in the winter. Herzegovina is influenced by the Mediterranean climate due to its
proximity to the Adriatic Sea.
The capital of Bosnia and Herzegovina is Sarajevo, which is also the largest city in Bosnia. The other
larger cities are Banja Luka, Zenica, Tuzla, Mostar and Prijedor. Bosnia has seven major rivers. Its

Determinants of Foreign Direct Investment in the Emerging South-East European Countries
63
longest, Sava, represents a natural border with Croatia in the North part of the country and flows into
the Danube and Black Sea. Bosnia is therefore a member of the International Commission for the
Protection of the Danube River (ICPDR). The other larger rivers in the North are Una, Vrbas and Sana
and they all flow into Sava. Bosna River is the longest in the country, and also flows into Sava in the
North. Drina River is another natural border with Serbia in the East. Neretva is the only bigger river
that flows South, into the Adriatic Sea (Wikipedia 5, 2011).
Bosnia has approximately 4 million people. They are divided into 3 major ethnic groups, Bosniaks,
Croats and Serbs. Bosniaks constitute a majority, followed by the Serbs and then Croats. The country
is divided into 2 entities, Federation of Bosnia and Herzegovina and Republic of Serbia (Republika
Srpska). Brcko District is another region that, although not a political entity by itself, is represented by
a local government. This division came as a result of the civil war that Bosnia went through in the
period between 1992 and 1995. Another impact of the war is demonstrated by the current
governmental structure of the country. Bosnia is a parliamentary democracy with bicameral parliament
and a three-member rotating presidency. Each of these three members represents a specific ethnic
group.
Bosnia and Herzegovina does not have a very strong infrastructure. The roads are mainly rural, and
they got damaged, especially during the war. Bosnia has only a small part of a highway system
between Zenica and Sarajevo. Before the war, a railway system was connecting Ploce, Mostar and
Sarajevo with Zenica and Doboj. The connection to Zagreb and Split in Croatia was there as well. The
main lines are in use after reparations. The connection to Serbia is still not fully functional. Since the
railway stock was really poor after the war, Germany and Hungary donated used locomotives to
Bosnia (Jane online magazine, 2012).
Bosnia also has a couple of airports that are not operating with full capacity. Sarajevo is fully operating
offering pretty expensive services. During the war, the Tuzla airport was the base for American military
and not available for public services. A couple of years ago the US military left the Tuzla airport. A
flight connecting Frankfurt am Main in Germany and Tuzla was operating for a while in 2010 but was
terminated due to high operating costs and low number of passengers. The bus lines are fully
operational connecting all major cities in Bosnia with the European Union and with the Ex-Yugoslavian
countries.
3.4.2 Governmental system of Bosnia and Herzegovina
“Bosnia and Herzegovina shall be a democratic state, which shall operate under the rule of law and
with free and democratic elections” (Bojkov, 2003).
Bosnia and Herzegovina was an independent Republic, a part of former Yugoslavia. It had a
constitutional and functional status as all of Yugoslavia’s five other federal units. Bosnia declared
autonomy and independency on March 1st, 1992. In the same year it was internationally recognized
as a sovereign, independent state, and a member of the United Nations. This caused resistance in the
other countries, especially Serbia, which resisted recognizing Bosnia as an independent state. This

Determinants of Foreign Direct Investment in the Emerging South-East European Countries
64
resistance was followed by a war that started in May of 1992 when the Yugoslavian military was forced
to leave Bosnia. In the following three years until 1995 Bosnia was fighting a civil war with Serbia. The
Dayton Agreement that was signed in 1995 restructured the constitutional and political order in Bosnia
and Herzegovina. The agreement was designed in such a way that Bosnia and Herzegovina was
officially split into two entities, the Federation of Bosnia and Herzegovina and Republika Srpska, with a
separate territory of Brcko District. The goal of the Dayton Agreement was to bring peace; therefore
this agreement was also known as the Peace Agreement. The Peace Agreement regulated many
problems after the war (mainly, it relieved Bosnia from occupation and stopped the ethnic cleansing). It
also established the Office of High Representative (OHR) for Bosnia and Herzegovina. The OHR had
a neutral role, following the regulations of the agreement; it is the highest political body in the country
(Foco, 2002).
The presidency of Bosnia and Herzegovina does not have a division between the judicial, legislative
and executive branches as the other countries do. It has rather a government which consists of three
members, each representing one ethnic group in BiH: Bosniaks, Croats and Serbs. These
representatives are elected directly by the people. Furthermore, BiH has a Council of Ministers, with a
chairman who is nominated by the presidency.
3.4.3 Why to invest in Bosnia and Herzegovina
Similarly to the other countries in South and East Europe, Bosnia and Herzegovina offers a big
potential for foreign investors. There are certainly many sectors where Bosnia needs to apply some
improvements since they are seen as weak points in terms of foreign investment. Unfortunately, the
war with Serbia between 1992 and 1995 was the main reason why the country has been seen as a
risky country for an FDI (mainly because of the vulnerabilities and insecurities of the political and
business sectors among multiple other sectors). Despite all these so-called risks, Bosnia has positive
reasons for attracting FDI. Before the war, BiH was a country with a strong industry sector. Bosnia has
many natural resources, such as silver, iron, barite, magnesite, arsenic, and it is also the largest
producer and exporter of zeolite in Europe. Large deposits of coal and limestone are very important for
the metal production industry. The energy production is a very important sector in Bosnia given the
high potential for exploitation of renewable resources of energy (wind energy, solar energy, thermal
energy, etc.). Research showed that, on average, the wind potential has 30% higher utility coefficient
than in the EU. BiH’s forest industry offers a big potential. Timber is the best-known natural resource
of Bosnia and Herzegovina, and forests cover 50% of the country. These forests have a potential of
producing about 7 million cm3 of wood per year. Currently Germany and Italy are the largest markets
for the wood export (FIPA 2, 2011).
The agricultural sector is certainly one worth of mentioning as it offers export opportunities to the
neighbor countries (Croatia, Serbia, Slovenia, Montenegro and Albania). There is no language barrier
between these countries; transportation costs are rather low (in comparison to exports to Western
Europe), and knowledge of the local culture is already there. For West Europe, the organic production

Determinants of Foreign Direct Investment in the Emerging South-East European Countries
65
could be more than attractive, since Bosnia has huge areas of unpolluted, ecological land with clean
water springs and air. Therefore, there is a rather rare use of chemicals (FIPA 3, 2005).
Tourism is another sector worth mentioning. Sarajevo’s mountains are famous for winter tourism,
mainly skiing, and the winter Olympics 1984 were held here.
3.4.4 Macroeconomic outlook of Bosnia and Herzegovina
Table 20 Macroeconomic indicators in Bosnia and Herzegovina 2009
CEE Quarterly 01/2009 page 38 See last pages for disclaimer.
Economics & FI/FX Research
CEE Quarterly
Bosnia & Herzegovina
Outlook Growth will slow in 2009, along with the rest of the region, though the resumption ofproduction at the Bosanski Brod oil refinery will potentially see industrial production rising over20% y-o-y, contributing over 4%-points to growth. Additionally it will lower refined oil imports helping to close the current account deficit.
Author: Goran Faravanja, Chief Economist (Zagreba�ka banka) + 385 1 6006 678, [email protected]
MoodyPs S&P Fitch
Long-term foreign currency credit rating B2 Stable B+ Stable W
MACROECONOMIC DATA AND FORECASTS
2006 2007 2008e 2009f 2010f
GDP (EUR bn) 9.8 11.1 12.5 13.3 14.1Population (mn) 3.8 3.8 3.9 3.9 3.9GDP per capita (EUR) 2543 2876 3253 3447 3652GDP (constant prices y-o-y %) 6.9 6.8 5.8 2.5 3.0CPI (year end, y-o-y %) 4.6 4.9 3.2 3.2 2.8Unemployment rate (%) 44.5 44.0 40.3 42.0 41.5Budget balance / GDP (%) 2.9 1.0 -0.5 -2.5 -3.0Current account balance (EUR bn) -0.8 -1.4 -2.0 -1.1 -1.2Current account balance / GDP (%) -7.8 -12.6 -15.8 -8.0 -8.2Net FDI (EUR bn) 0.6 1.5 0.3 0.2 0.4FDI % GDP 5.8 13.8 2.7 1.5 2.9FX reserves (EUR bn) 2.8 3.4 3.1 2.6 2.9(Cur.Acc-FDI) / GDP (%) -2.0 1.2 -13.1 -6.5 -5.3Exchange rate to USD eop 1.5 1.3 1.4 1.4 1.4Exchange rate to EUR eop 2.0 2.0 2.0 2.0 2.0Exchange rate to USD AVG 1.6 1.4 1.3 1.4 1.4Exchange rate to EUR AVG 2.0 2.0 2.0 2.0 2.0
Source: UniCredit Research
Source: Bank Austria. CEE Quarterly, 01/2009.

Determinants of Foreign Direct Investment in the Emerging South-East European Countries
66
Table 21 Macroeconomic indicators in Bosnia and Herzegovina 2012
Source: Bank Austria. CEE Quarterly, 01/2012.
Surprisingly, Bosnia and Herzegovina has had pretty much a stable GDP growth over the last few
years. Even though the financial crisis hit not only Bosnia, but also the other neighboring countries,
Bosnia still managed to have a growing GDP. Table 21 shows a GDP growth of approx. 1.8% in 2011
even though the Volksbank research predicted growth of 3.5% earlier in May 2011. However, since
the leaders of the countries still did not form a unified government even 5 months after elections, it is
to be expected that this will impact the growth of the country. With respect to inflation in Bosnia and
Herzegovina, there is almost no inflation in this country. Bosnia and Herzegovina has kept its currency
BAM pegged against the Euro for years now. The risk of BAM losing its value is small at the moment.
Table 22 shows how inflation changed in Bosnia and Herzegovina from 2009 to the beginning of 2012.
It had the smallest inflation rate in the Balkan region, below 5% per year on average since 2009
(Volksbank, 2011).

Determinants of Foreign Direct Investment in the Emerging South-East European Countries
67
Table 22 Inflation rate in Bosnia and Herzegovina
Source: BiH Federal Office of Statistics, Monthly Review. March 2012, Number 3, Year XVI.
The unemployment rate is extremely high in Bosnia and Herzegovina. The civil war (1992-1995)
brought economic and political reforms which increased the unemployment rate. Also, crime,
corruption, violence and drug abuse, which resulted as a psychological response of many people to
the war, increased the unemployment. This especially affected the unemployment of younger people
that was almost three times higher than that of older people in 2004. The financial crisis was a huge
damage, causing a loss of about 60,000 jobs. According to the CIA, The World Factbook, the
unemployment rate reached 43.1% in 2010 and 43.3% in 2011 (Gurbuzer and Koseleci, 2008).
3.4.5 Tax regulations in Bosnia and Herzegovina
Tax regulations have a large influence on after tax profitability of the company and therefore represent
a very important factor in the decision-making process of foreign investors. It is known that the
investors want to have as much profit as possible after the tax is deducted. Therefore East European
countries had to lower their taxes, especially the corporate income tax, in order to attract more foreign
investments.
Bosnia and Herzegovina, similarly to the other East European countries, adopted the corporate
income tax of 10% in both, the Federation of BiH and Republika Srpska. Additional incentives are
offered, if more then 30% of total income is generated through exports. In the Federation of Bosnia
and Herzegovina, investments of BAM 20 million over five years in the production have been
exempted from corporate income tax. The requirement is that companies make an investment of BAM
4 million in the first year. Another option for companies to be exempted from the corporate income tax
is to employ more than 50% invalids or people with special needs. The value added tax is lower than
in the other Eastern countries (17% also for both, Federation of BiH and Republika Srpska). The
refund period is 60 days whereas export companies have 30 days to apply for refund
(PriceWaterhouseCoopers 2, 2009).
Personal income tax is 10% in the Federation of BiH and 8% in Republika Srpska. Social security
taxes are 10.5% for employers in the Federation of BiH and 30.6% in Republika Srpska. In addition to

Determinants of Foreign Direct Investment in the Emerging South-East European Countries
68
this, employees have to carry 31% tax in the Federation of BiH for the social security. Bosnia and
Herzegovina has the big advantage that the labor costs are extremely low, especially in comparison to
Western countries. The average monthly salary is KM 445. One would think that the labor has to be
very unskilled; however, this is not the case. Bosnia offers very skilled labor force, and there is no
problem with finding good skilled people. It is a very good incentive for foreign investors to be able to
offer competitive production with skilled labor and low labor costs. Incredibly, 95% of all exports from
Bosnia to EU countries are exempted from all taxes (Sahovic, 2003).
3.4.6 FDI in Bosnia and Herzegovina
From 1998 until 2004, Bosnia and Herzegovina was the thirteenth fastest growing economy, not only
in Europe, but in the world. After Bosnia adopted the Law on Foreign Trade Policy in 2000, it
conducted nine bilateral free trade agreements with all countries in South-Eastern Europe. The export
custom barriers on most of the goods were cut down, and the tax on imports were cut down gradually
in the period of three to four years. The CEFTA agreement, signed in 2006, replaced the bilateral
agreements a couple years later. In addition, with the EU Stabilisation and Association Agreements
(SAA) the agreement was made where the import customs on goods from the EU were cut down
(Causevic, 2010).
At the end of 2010 the FDI inflows in Bosnia in Herzegovina were estimated at €4.9 billion. In 2009
and 2010 a total of 354 million was invested in Bosnia and Herzegovina which is significantly less than
in the previous year. In 2008 FDI inflow was 683 million. The manufacturing sector received the largest
part of the foreign inflow in 2010 with 34%. The banking sector received 22% and telecommunication
13%. Figure 24 shows the FDI distribution by sector until 2010. The FDI flow in 2010 signified the end
of the downward trend caused by the world financial crisis. Due to the preliminary Foreign Investment
Promotion Agency of Bosnia and Herzegovina (FIPA) estimation, the FDI growth in the first half of
2011 was recorded at 1.4% (FIPA, 4 2012).

Determinants of Foreign Direct Investment in the Emerging South-East European Countries
69
Figure 24 FDI stocks by industry 1994-2010 in Bosnia and Herzegovina
Source: http://www.fipa.gov.ba/informacije/statistike/investicije/Default.aspx?id=180&pageIndex=1,
FDI Position and Performance. Accessed on April 6th, 2012.
Foreign banks in transitional markets are more successful and efficient that the domestic banks.
Accession of BiH into the EU will stabilize FDI inflows, where the doubts and risks foreign investors
are afraid of should disappear once the country is the member of the European Union. The country is
still an importing country. The main imported goods are information technology products, machines
and chemicals. Exporting goods are metals, wood and clothing. As of today, BiH shows instability in
production and has to make major improvements in order to increase growth (Ilgün and Coşkun,
2009).
The largest foreign investors, as well as trading partners in Bosnia and Herzegovina are Austria,
Serbia, Slovenia and Croatia (Table 23).

Determinants of Foreign Direct Investment in the Emerging South-East European Countries
70
Table 23 FDI stocks by country in million €
Source: FIPA.
http://www.fipa.gov.ba/informacije/statistike/investicije/Default.aspx?id=180&pageIndex=1. FDI
Position and Performance. Accessed on April 6th, 2012.

Determinants of Foreign Direct Investment in the Emerging South-East European Countries
71
4 Successful investments
4.1 Business Park Sofia, Lindner AG
Lindner AG is a German company established in 1965. This is one of the leading manufactures in the
flooring industry.
In the middle of the 1990´s, Lindner decided to enter the Bulgarian market and explore possibilities in
the real estate sector. Business Park Sofia is the project of the Lindner AG, started in the 1998 when
buying of the land began. The construction works started in 2001 and was finished in 2007. This was
completely funded by foreign investment, where Lindner invested €80 million in this project. When the
project was completed in 2007, Lindner had 14 buildings, besides the other 21 that were property of
other investors.
Lindner continued its investment in Bulgaria, and in 2007 near the Business Park Sofia the
construction of the Residential Park Sofia started. The Residential Park Sofia has about 370 family
houses and apartments. Total investments of the Lindner Group were over €200 million (Invest
Bulgaria Agency 4, 2011).
4.2 Nestle, Nestle Sofia
Nestle is one of the world’s largest food companies that succeeded in becoming a leading investor in
Eastern Europe. By the end of the 1990s, Nestle had twenty-three factories in the Eastern European
region. A constant increase in sales is a proof that this was a good strategic decision. In 2000 Nestle
had a growth of 18% in Eastern Europe, which was much more than in Western Europe.
In 1994 Nestle bought the biggest plant in the country, located just out of Sofia, and established Nestle
Sofia AD. They started producing chocolates, waffles and biscuits, very well appreciated by the
consumers. In the last seven years the company had invested more than $30 million (Invest Bulgaria
Agency 5, 2011).
4.3 Romania Telecommunications Reform and Privatization Support
Project
In 1996 the Romanian Government started reforming its telecommunication sector. Romania had to
meet the requirements for the accession into the EU and at the same time to comply with the World
Trade Organization requirements. World bank supported this reform, which ended up with the
establishment of a regulatory agency and privatization of Romtelecom. In 2003 Romtelecom’s

Determinants of Foreign Direct Investment in the Emerging South-East European Countries
72
exclusive right to offer voice telephony was removed. Romtelecom went private when the Greek
company OTE purchased 54% of the shares (World Bank 5, 2009).
4.4 OMV Refining & Marketing AG, Croatia
In June, 2004 OMV Refining & Marketing AG, a subsidiary of OMV AG signed an agreement with
Istrabenz holding Company d.d, where Istrabenz gave 50% of the ownership shares to OMV Istrabenz
d.d. The reason for sale was that the investment did not fulfil the expectations. The oil product trade
was moved to an Austrian partner. They formed a joint investment to trade petroleum products in four
markets. In the 12-year period, filling stations of the companies expanded almost four-fold (OMV,
2004).
4.5 Pepsi Co Investments (Europe) I.B. – “Marbo” for production and
trade Laktasi, BiH
PepsiCo is the leading company in in the food and beverage sector Europe with 43,000 employees.
PepsiCo invested over $3 billion in this region in the past three years. This investment includes
acquisition of Lebedyanasky, the Russian juice company. „Healthier for you“ is a marketing campaign
they focused on in this region where they decided to go with new, healthy snacks for the European
market. The Netherlands and BiH signed the Agreement on Avoidance of Double Taxation and
Agreement on Promotion and Protection of Investments (PepsiCo, 2008 and BH News 2012).

Determinants of Foreign Direct Investment in the Emerging South-East European Countries
73
5 Conclusion
The goal of this paper was to show the importance of foreign direct investments, their impact on the
countries that are invested into with all advantages and disadvantages they come with. As discussed
in the paper, foreign direct investments have an extremely important role in growing the general
business of the host country. Non-developed countries are developing different strategies for attracting
FDI. I focused on the ex-Yugoslavian and transition Eastern European markets in this paper, as these
are the countries that need the development the most.
As under-developed countries, Eastern European countries developed, and are still developing
incentive strategies in order to attract FDI. Hungary, the Czech Republic, Poland and Slovakia are the
top destinations for foreign investors. These countries, such as Hungary, started early with reforms,
which showed that they were seriously interested in moving forward and integrating with Western
countries.
The Balkan countries, unfortunately, did not develop as well as the rest of Eastern Europe. Even
though these countries have a big potential to exploit (important for foreign companies), they were
handicapped by the civil war between Croatia, Serbia and Bosnia and Herzegovina. These are serious
factors that made investors reconsider and rethink about their investment. Political instability certainly
moves investors to turn to more stable countries. Furthermore, corruption was also the reason why the
Balkan countries did not enjoy a big portion of the FDI. Croatia is most developed among the ex-
Yugoslavian countries (excluding Slovenia which is already an EU member), and is scheduled to enter
the European Union in 2013.
Foreign direct investments create many new opportunities: they create new jobs; they provide
knowledge transfer and further education that they bring from the West; they create more revenue and
provide possibility for earning higher profits abroad.
From a point of view of an investor, there are many advantages to foreign direct investments:
Investors can employ well-educated labor at lower cost; they can use money from tax incentives for
further investments in their business and have production in the host country in which they do not
have to deal with import and administrative procedures.
The financial crisis that affected the world’s economy (starting in the late 2000s) impacted Eastern
countries a lot. As mentioned earlier in this paper, the recovery from the crisis started in 2010; in the
next five years forecasts are predicting a significant growth of foreign direct investment in the
developing countries.

Determinants of Foreign Direct Investment in the Emerging South-East European Countries
74
IV. References
Antic, Teodor, “Central Government and Local Self-government in Croatia”: Decentralization and
Democratization, 2004
Asenova, Violeta, “Institutional Determinants of Foreign Direct Investment”, the cases of Bulgaria and
Turkey, 2009
Bachman, D. Ronald, “ed. Romania”: A Country Study. Washington: GPO for the Library of Congress,
1989.
Bank Austria. CEE Quarterly, 01/2009.
Bank Austria. CEE Quarterly, 01/2012.
Barolli, B., Takahashi,K., Tomizawa, T., “The impact of political volatility on foreign direct investment”:
Evidences from the Western Balkan Countries, Bulletin of Yamagata University. 2009; Volume 40, No
1, p. 65-78
Bitzenis, P., Artidis. Inward FDI in Bulgaria and its policy context, Columbia FDI profiles, 2012.
BiH Federal Office of Statistics, Monthly Review. March 2012, Number 3, Year XVI.
Bojkov, D. Victor, “Democracy in Bosnia and Herzegovina”: Post-1995 Political System and its
Functioning, London School of Economics and Political Science, UK, Volume IV, No 1, May 2003
Botric, Valerija. Foreign direct investment in the Western Balkans: privatization, institutional change,
and banking sector dominance, economic annals. October-December 2010, Volume LV, No. 187.
Botric, Valerija and Skuflic, Lorena, “Foreign direct investments in Croatia”, Regional perspective
analysed in period 1993-2008
Brada, C. Josef, Kutan, M. Ali and Yigit, M. Taner, “The Effects of Transition and Political Instability On
Foreign Direct Investment Inflows: Central Europe and the Balkans”, William Davidson Institute
Working Paper Number 729, November 2004
Causevic, Dr. Fikret, “Trade policy and competitiveness of Bosnia and Herzegovina”, 2010
Coman, Pena, Crai, Eugen, Radulescu, Monica and Stanciulescu, Gabriella, “Local Governments in
Central in Eastern Europe”, 2001, Chapter 8
Deutsche Bundesbank, “The role of FDI in emerging market economies compared to other forms of
financing”; Past developments and implications for financial stability, International Relations
Department J2/J2-2 24.02.2003, Frankfurt
Ernst&Young Croatia, “Grants and Incentives Advisory”, March 2007

Determinants of Foreign Direct Investment in the Emerging South-East European Countries
75
European Commission 1, Directorate- General for Economic and Financial Affairs, “Economic
forecast”, Spring 2008
European Commission 2, Directorate-General for Economic and Financial Affairs, “European
Economic Forecast”: CROATIA Recovery in the offing after two years of recession, Autumn 2010,
p.152
European Commission 3, “Screening report Croatia”, Chapter 16, 29 November 2006
Faculty of Economics and Business Zagreb, “The impact of foreign direct investments (FDI) on
Croatian economy” – comparisons with other Transition countries, Croatian Economy 2009/2010
Fatic, Aleksandar, “Stability and Corruption in South-Eastern Europe”, 2000
Foco, Salih, “The Political-Economic and Social Status of BOSNIA-HERZEGOVINA”, March 2002
Foreign investment promotion agency of BiH (FIPA 1), “Investment opportunities in Bosnia and
Herzegovina”, Fifth edition February 2008
Foreign Investment Promotion Agency of BiH (FIPA 3), “Agriculture and Food Processing Industry”,
Sarajevo, September 2005
Foreign Investors Council, “Short term measures to attract FDI in Romania”, September 2003
Fraser Institute, EFW Index data sheet
Glinavos, Ioannis, “Foreign Direct Investment in the Black Sea area”, October 2003
Graham, Benjamin, and Dodd, David, “Security analysis”, McGraw-Hill book company 1951
Gurbuzer, Leman Yonca and Koseleci, Ozge Nihan, “What hides behind extended periods of youth
unemployment”, June 2008
Hansa Bank Markets, “Bulgaria and Romania”, Macro Outlook, October 2008
Ilgün, Erkan and Coşkun, Ali, “Foreign direct investments in Bosnia and Herzegovina”: Banking Sector
Example, International Burch University, Sarajevo, Bosnia and Herzegovina, Fatih University, Istanbul,
Turkey. Vol 4, No2, Year 2009
Invest Bulgaria Agency 3, “Brief Investor´s Handbook”, 2010
Johnson, Andreas, “FDI inflows to the Transition Economies in Eastern Europe”: Magnitude and
Determinants 2006
Jordanova, Tzveta Zafirova, “FOREIGN DIRECT INVESTMENT (FDI) IN BULGARIA” – The basis for
the formation of strategic alliances of the type “East-West” in the process of preparation for joining the
EU, May 2001

Determinants of Foreign Direct Investment in the Emerging South-East European Countries
76
Kekic, Laza Regional Director, Economist Intelligence Unit, “Foreign direct investment in the Balkans”:
recent trends and prospects, December 2004
Kekic, Laza, “Emerging markets will attract more FDI inflows”, China daily interview 2009
Kinoshita, Yuko, “IMF working paper on sectoral composition of FDI and external vulnerability in
Eastern Europe”, May 2011
Kuecking, Dunja, Zugic, Milivoje, and Glibota, Marija, “The Croatian Legal System and Legal
Research”,(http://www.nyulawglobal.org/globalex/Croatia1.htm), October 2009
Marchick, M. David and Slaughter, J. Matthew, “Paper on global FDI policy”, June 2008
Mitroi, Mihaela,“Invest in Romania”, PriceWaterHouseCoopers. January 2009
Myles, D. Gareth, “Investment Analysis”, May 2003
Njegac, Dražen and Nejasmic, Ivo, Professors, “Zagreb as Croatia´s core region”, 2002
OECD 1, Organisation for economic co-operation and development, “Checklist for Foreign Direct
Investment Incentive Policies”, 2003, p. 7
OECD 2, ORGANISATION FOR ECONOMIC CO-OPERATION AND DEVELOPMENT, “Checklist for
Foreign Direct Investment Incentive Policies”, 2003, p.11
OECD 3, ORGANISATION FOR ECONOMIC CO-OPERATION AND DEVELOPMENT, “Checklist for
Foreign Direct Investment Incentive Policies”, 2003, p.12 (Definition proposed by UNCTAD (1994),
World investment Report)
OECD 4, ORGANISATION FOR ECONOMIC CO-OPERATION AND DEVELOPMENT, “Checklist for
Foreign Direct Investment Incentive Policies”, 2003, p.14
OECD 5, ORGANISATION FOR ECONOMIC CO-OPERATION AND DEVELOPMENT, “Checklist for
Foreign Direct Investment Incentive Policies”, 2003, p.21
OECD 6, ORGANISATION FOR ECONOMIC CO-OPERATION AND DEVELOPMENT, “Checklist for
Foreign Direct Investment Incentive Policies”, 2003, p.16
OMV Refining&Marketing AG and ISTRABENZ d. d. signed an agreement on the disposal of
ISTRABENZ's stake in OMV ISTRABENZ, d. d., Press release, 30 June 2004
Pauwels, Stefaan and Ionita, Lorena, “FDI in Romania”: from low-wage competition to higher value-
added sectors, February 2008
PKF, “Doing Business in Romania”, Accounts and Business Advisors, Chapter 2, Page 27, March
2010
PriceWaterHouseCoopers 1. Foreign direct investment in Central and Eastern Europe, March 2010

Determinants of Foreign Direct Investment in the Emerging South-East European Countries
77
PriceWaterhouseCoopers 2, “Tax at a glance”, 2009
Ranieri, Marko, Research Centre on Transition and Developing Countries, “Foreign Direct Investment
in the Western Balkans”, CIRPET, University of Turin, Italy 2008
Rusu, Nicoleta, “The dynamics of foreign direct investment in Romania after EU accession”, CES
working Paper II 2010
Sahovic, Tarik, “Investing in Bosnia and Herzegovina”, Volume II Spring 2003
Schuppert, Dr. Christiane and Nerre, Dr. Birger, Deutsche Gesellschaft für Technische
Zusammenarbeit (GTZ), “Combating tax evasion and tax avoidance”: tax reform in Croatia, November
2008
Sergi, S. Bruno, “FDI and the Balkans”, A regional investment agency and regional centred economic
choices to shape this decade 2003
Shteryanova, Bilyana, “Main Factors Behind the Substantial increase of FDI in Bulgaria in period
2003-2007”, 2009
Simic, Hrvoje, “Effective Corporate Income Tax Burden in Croatia”, February 2009
Sohinger, Galinec and Skudar, “The structure of FDI in Croatia and its impact on the domestic
economy”, 2005
Tesic, Jelena. Institutional environment and foreign direct investment in the Western Balkans, 2010.
The Institute of Economics Zagreb (EIZ), “Croatian Economic Outlook”, No.39, July 2009
Trade and Investment Promotion Agency of Republic Croatia, “Invest In Croatia”, 2009
Totev, Stoyan, “Foreign direct investment in Bulgaria”: advantages and disadvantages to investment,
SEER SouthEast Europe Review for Labour and Social Affairs, issue: 04/2005
UNCTAD 1, “DRAFT on advisory services on investment and training” - Investment promotion strategy
for Bosnia and Herzegovina, Geneva Switzerland November 2004
United Nations New York and Geneva, “Tax Incentives and Foreign Direct Investment”, a Global
Survey 2000
Volksbank AG Research, SEE Quarterly II 2011, May 2011
World Bank 1, “Investment horizons”: Western Balkans - Benchmarking FDI opportunities. May 2006
World Bank 2, “Bulgaria Investment Climate assessment”, Volume 1, October 2008

Determinants of Foreign Direct Investment in the Emerging South-East European Countries
78
World Bank 4, “Investment Horizons: Western Balkans”, A Study of Foreign Direct Investment Costs
and Conditions in Automotive Component Manufacturing and Food/Beverage Processing in Five
Countries, May 2006
World Bank 5, Sector Evaluation Division, “Project Performance Assessment report,” Romania
telecommunications reform and privatization support project, March 3, 2009
Internet Sources
BH News,http://www.bh-news.com/ba/vijest/13455/drzave_investitori_u_bih_kraljevina_holandija.html.
Accessed on April 11, 2012
Croatia Invest. http://www.croatiainvest.net/english/investpot.htm. Accessed on June 10th, 2011
Croatian National Bank. www.hnb.hr/publikac/prezent/spf.ppt. Accessed on April 6th, 2012
Encyclopedia of the Nations. http://www.nationsencyclopedia.com/economies/Europe/Romania-
INFRASTRUCTURE-POWER-AND-COMMUNICATIONS.html. Romania Infrastructure, Power and
Communications, Accessed on April 10th, 2012
Foreign Investment Promotion Agency of BiH (FIPA 2). http://www.fipa.gov.ba/. Attractive Sectors.
Accessed on July 20th, 2011
Foreign Investment Promotion Agency of BiH (FIPA 4),
http://www.fipa.gov.ba/informacije/statistike/investicije/Default.aspx?id=180&pageIndex=1. FDI
Position and Performance. Accessed on April 6th, 2012
Fraser Institute. http://www.fraserinstitute.org/research-news/research/display.aspx?id=16613.
Accessed on May 26th, 2012
Geographic Guide. http://www.geographicguide.com/europe-maps/bulgaria.htm. Accessed on April
10th, 2012
Greanwich Mean Time. http://wwp.greenwichmeantime.com/images/europe/romania.jpg. Accessed on
April 10th 2012
Infoplease.com, http://www.infoplease.com/atlas/country/bosniaandherzegovina.html. Accessed on
July 20th, 2011
Invest Bulgaria Agency 1. http://www.investbg.government.bg/index.php?sid=16&ssid=44. Regional
Information. Accessed on July 20th, 2011
Invest Bulgaria Agency 2. http://www.investbg.government.bg/index.php?sid=16&ssid=41. Accessed
on July 20th, 2011

Determinants of Foreign Direct Investment in the Emerging South-East European Countries
79
Invest Bulgaria Agency 4. http://www.investbg.government.bg/index.php?sid=21&ssid=178&c=770.
Accessed on July 20th, 2011
Invest Bulgaria Agency 5. http://www.investbg.government.bg/index.php?sid=21&ssid=109. Accessed
on July 20th, 2011
International Financial Corporation of the World Bank (DoingBusiness).
www.doingbusiness.org/rankings. Accessed on May 26th, 2012
Jane´s online magazine, Infrastructure (Bosnia-Herzegovina). http://articles.janes.com/articles/Janes-
Sentinel-Security-Assessment-The-Balkans/Infrastructure-Bosnia-Herzegovina.html. Accessed on
April 6th, 2012
Maps of Croatia, http://www.maps-of-croatia.co.uk/images/croatia-politcal-map.gif. Accessed on July
20th, 2011
Mongabay.com. http://www.mongabay.com/reference/new_profiles/138ro.html. Country study,
Romania Government, Accessed on July 20th, 2011
PepsiCo. http://www.pepsico.com/Annual-Reports/2008/financials/mda-01.html. Accessed on July
20th, 2011
Romania Company. http://www.romania-company.com/romania-taxes.php. Accessed on July 20th,
2011
Romania Trade & Invest 1. http://www.romtradeinvest.ro/index.php/De-ce-Romania/reasons-
invest.html. Accessed on April 10th, 2012
Romania Trade & Invest 2, http://www.romtradeinvest.ro/index.php/De-ce-Romania/fdi-statistics.html.
Accessed on April 6th, 2012
Trading Economics. http://www.tradingeconomics.com/romania/unemployment-rate. Accessed on
April 6th, 2012
Transparency International.
http://www.transparency.org/policy_research/surveys_indices/cpi/2010/results. Corruption Perception
Index, Report 2010. Accessed on July 20th, 2011
Transparency International. http://cpi.transparency.org/cpi2011/interactive/. Corruption Perception
Index Report 2011. Accessed on April 6th, 2012
UNCTAD 2. http://www.unctad-docs.org/files/UNCTAD-WIR2011-Full-en.pdf. Accessed on April 10th,
2012
Weastra. http://www.weastra.com/cee-countries/romania/-. CEE Countries, Romania. Accessed on
July 20th, 2011

Determinants of Foreign Direct Investment in the Emerging South-East European Countries
80
Wikipedia 1. http://en.wikipedia.org/wiki/Geography_of_Bulgaria. Accessed on July 20th, 2011
Wikipedia 2. http://en.wikipedia.org/wiki/Value_added_tax. Accessed on July 20th, 2011
Wikipedia 3. http://en.wikipedia.org/wiki/Demographics_of_Romania. Accessed on April 10th, 2012
Wikipedia 4. http://en.wikipedia.org/wiki/Croatia. Accessed on July 20th, 2011
Wikipedia 5. http://en.wikipedia.org/wiki/Bosnia_and_Herzegovina. Accessed on July 20th, 2011
World Bank 3. http://www.worldbank.org.ro. Accessed on October 27th, 2010

Determinants of Foreign Direct Investment in the Emerging South-East European Countries
81
V. Abstract in German
Das Thema dieser Diplomarbeit, direkte Investitionen in ex-jugoslawischen und sich entwickelnden
Länder Osteuropas, hat zum Ziel, die Wichtigkeit der direkten Investitionen zu zeigen, ihre Vorteile
und Nachteile, sowie welchen Einfluss direkte Investitionen auf die Länder, in die investiert wurde,
haben. Dieser Arbeit soll nachvollziehbar machen, dass für Wachstum und Weiterentwicklung
Investitionen aus dem Ausland gebraucht werden, und zwar bevorzugt aus den Länder am Anfang der
Entwicklungsskala. Ein weiterer wichtiger Punkt ist der Anreiz, der Investoren in ein bestimmtes Land
führen soll. Dafür benötigt man diverse Strategien, die entwickelt sein müssen, um den Investoren
einen hohen Profit zu gewährleisten. So haben viele Länder zum Beispiel steuerliche Vorteile
Investoren gegenüber als Anreiz benutzt.
Diese Arbeit ist in vier große Teile gegliedert. Der erste Teil ist die Einführung in das Thema dieser
Arbeit. Im zweiten Teil werden die Theorie der direkten Investitionen näher erklärt, deren Definition
und die verschiedenen möglichen Arten. Der dritte Teil befasst sich mit den verschiedenen Ländern
und deren jetziger Situation. Es wird beschrieben, wie sich die Länder im Laufe der Zeit entwickelt
haben, und welche Reformen eingeführt wurden, um die Investitionen an sich zu ziehen. Die
Arbeitssituation wird näher erklärt. Viele, fast alle Länder in Osteuropa haben die gleiche Problematik,
die hohe Arbeitslosigkeit. Obwohl junge Leute eine sehr gute Ausbildung haben, und mehrere
Fremdsprachen beherrschen, können sie trotzdem keine Anstellung finden, da der Markt schlicht
keine Möglichkeiten bietet. Viele Arbeitsplätze bieten keine Aufstiegsmöglichkeiten und sind zudem
häufig sehr schlecht bezahlt. Für die Investoren, die Arbeitsplätze bieten, wurden auch steuerliche
Vorteile entwickelt. Das gleiche gilt für Leute mit verschiedenen Arten von Behinderungen, da diese
fast gar keine Möglichkeit haben, eine Arbeitsstelle zu finden. In diesem Teil werden auch direkte
Investitionen in jedem Land einzeln näher erläutert. Es wird gezeigt, in welche Sektoren direkte
Investitionen geflossen sind, und warum diese Sektoren interessant für die Investoren waren. Der
vierte Teil ist das zusammenfassende Schlusswort dieser Arbeit.

Determinants of Foreign Direct Investment in the Emerging South-East European Countries
82
VI. Curriculum vitae
Frau Vanja Azabagic
Anschrift: Röderbergweg 11, 60314 Frankfurt am Main, Deutschland
Telefon: + 49 151 121 329 31
Email: [email protected]
Persönliche Daten
Geburtstag/-ort: 24.09.1982 in Tuzla, Bosnien-Herzegowina
Geschlecht: weiblich
Familienstand: ledig
Staatsbürgerschaft: Bosnien
Bildung
2001-2012 Studium der Internationalen Betriebswirtschaftslehre, Universität Wien
Schwerpunkt: Produktion und Logistik – Management und Internationales
Management
Nebenfach: Internationales Marketing
Erfahrungen in Bereichen:
Operations Management, Operations Research, Production Management, Human
Resources in Production and Services
International Strategy and Organisation: Vorstellung der typischen
Gestaltungsvarianten und deren Auswirkungen auf die Effizienz der Organisation
International Marketing Research: Datenanalyse in einem Internationalen Kontext
Advanced Strategy and Simulation: Internationale Marketing Entscheidungen in einem
Simulationsspiel (Country Manager)
2001 Matura mit sehr gutem Erfolg abgeschlossen, Gymnasium „Mesa Selimovic“ in
Tuzla, Bosnien-Herzegowina

Determinants of Foreign Direct Investment in the Emerging South-East European Countries
83
Berufserfahrung
01/2009 – laufend TeraRecon GmbH, Frankfurt am Main, Deutschland
Medical IT Sales / Application Specialist für Deutschland, Österreich, Schweiz,
Osteuropa und CIS Länder
07/2007 – 01/2009 TeraRecon Inc., Foster City, Kalifornien, USA
Sales Specialist für DACH Länder
03/2007 – 06/2007 Reed Messe Wien GmbH, Wien, Österreich
Assistentin der Messeleitung
Effiziente Zusammenarbeit von Kundenbetreuung und Verkauf, Kooperative
Kommunikation mit internationalen Kunden, Vorgesetzten und Kollegen
07/2006 – 10/2006 Emmedue Advanced Building System, Dublin, Irland
Produktionskostenanalyse, Marketing material design und sales promotion
09/1996 – 10/1997 Radio Tuzla, Bosnien-Herzegowina
Praktikum, Redakteurin einer Radiosendung, Moderation der Sendung mit
zahlreichen Mitarbeitern
Weitere Qualifikationen
Sprachkenntnisse
Bosnisch/Kroatisch/Serbisch Muttersprache
Deutsch Fließend in Wort und Schrift
Englisch Fließend in Wort und Schrift
Russisch Grundkenntnisse
EDV Kenntnisse
Kompetent in PC Programmen: Adobe Photoshop, AutoCad, MS Office
Kompetent in Programmiersprachen: Xpress-MP, SAP, ONYX
Grundkenntnisse: HTML, SQL

Determinants of Foreign Direct Investment in the Emerging South-East European Countries
84
Führerschein
Klasse B (EU)
Referenzen
Jonathan Beale
Emmedue Ireland, Contracts Director
Tel: +353 (0)57 8645 000
e-mail: [email protected]
Peter McKenna
Emmedue Ireland, Manager
Telefon: +353 57 8645 000
Email: [email protected]