![Implementation and validation of a Ground Source …...GHE Ground Heat Exchanger GSHP Ground Source Heat Pump H borehole active depth [m] HP Heat Pump HVAC Heating Ventilation and](https://static.fdocuments.net/doc/165x107/5f0b00d07e708231d42e605a/implementation-and-validation-of-a-ground-source-ghe-ground-heat-exchanger-gshp.jpg)
Vanier School Ground Source Heat Pump Project ...
49
Vanier School Ground Source Heat Pump Project - Hydrogeological Assessment prepared for: Energy Solution Center Inc. prepared by: Gartner Lee Limited reference: date: GLL 22-292 February, 2003 distribution: 2 Energy Solution Center Inc. 3 Gartner Lee Limited
Transcript of Vanier School Ground Source Heat Pump Project ...

Vanier School Ground Source HeatPump Project - HydrogeologicalAssessment
prepared for:Energy Solution Center Inc.
prepared by:Gartner Lee Limited
reference: date:GLL 22-292 February, 2003
distribution:2 Energy Solution Center Inc.3 Gartner Lee Limited

February 5, 2003
Ron Gee, Technical AdvisorEnergy Solutions Centre Inc.206A Lowe St. - 1st FloorWhitehorse, Yukon, Y1A 1W6
Dear Mr. Gee:
Re: 22-292 – Vanier School Ground Source Heat Pump Project - HydrogeologicalAssessment
We are pleased to provide the Final Report on the above noted project. This assessment includedtesting and characterization of both the overburden and bedrock aquifers at the subject site for thepotential use as a groundwater source in Ground Source Heat Pump System.
Thank you for allowing Gartner Lee Limited this opportunity to work with you on this excitingand promising sustainable energy technology for the North.
We look forward to receiving your comments once you have had an opportunity to review thisreport. If you have any questions or comments please do not hesitate to call me at (867) 633-6474, extension 27.
Yours very truly,GARTNER LEE LIMITED
Jonathan Kerr, M.Sc.Hydrogeologist
JK:jk

Page i(1rb012303_jk.doc/22-292/2003)
E x e c u t i v e S u m m a r y
Gartner Lee Limited (GLL) on behalf of the Energy Solution Centre Inc. has completed hydrogeologicalservices associated with the construction and testing of a test well, which for the purposes of this reporthas been formally identified as TH02-01. The study area is located within the subdivision of Riverdale,located within the City of Whitehorse, Yukon (Figure 1).
The objective of this hydrogeological assessment was to assess if the aquifers underlying the study site.The goal was to identify a groundwater supply capable of producing approximately 12.9 L/s (204USgpm). Additionally the study assessed groundwater quality (i.e. temperature, chemical composition)from each of the aquifers encountered to help predict heat pump performance and potential problemsassociated with heat pump operations.
The project scope of work included:
1. Drilling of an auger borehole for an observation well (not completed).
2. Construction of a 150 mm diameter test well including:• Setting of temporary well screen in overburden aquifer.• Short term pumping test and groundwater quality assessment of the overburden aquifer.• Advancement of well through the basalt bedrock aquifer.• Pumping tests and groundwater quality assessment of bedrock aquifer.• Downhole geophysical survey of borehole.
3. Completion of assessment report.
Please note that the proceeding conclusions and recommendations are based on a design assumption of aheat pump system consisting of three 90 ton nominal capacity groundwater supplied heat pumpsoperating in parallel at 68 US gpm per unit (Waterfurnace 2002).
The principal conclusions of the project are summarized as follows:
1. The presence of two relatively warm water aquifers below Vanier School has been confirmed by thecompletion to test well TH02-01. These aquifer systems consist of:
• The lower portion of the Selkirk Aquifer, composed of sand and gravel between depths of 54.9m and 60.4 m below ground surface (5.5 m aquifer thickness at TH02-01).
• Miles Canyon Basalt Aquifer, composed of fractured basalt bedrock between depths of 60.4 and143.1 m below ground surface (82.7 m aquifer thickness at TH02-01).
2. The Selkirk Aquifer appears to have potential to meet the anticipated heat pump source water flowrequirement of 12.9 L/s (204 USgpm). Furthermore, a properly sized well (i.e. 254 mm nominal

Page ii(1rb012303_jk.doc/22-292/2003)
diameter) across the entire thickness of the Selkirk Aquifer at this location would likely producemaximum long-term yields in excess of 25 L/s (330 igpm).
3. Long-term maximum well capacity of TH02-01 as completed in the Miles Canyon Basalt Aquifer isestimated at 10.6 L/sec. Therefore, if this well were to be used, the target yield of 12.9 L/s (204 USgpm) will potentially lower water levels in the well below the safe available drawdown. To overcomethis problem, two production wells would likely required to produce the desired flow rates.
4. Stabilized temperatures of pumped groundwater measured during the pumping tests were as follows:
• 5.8o C from the Selkirk Aquifer on July 28th, 2002; and• 6.9 to 7.1o C from the Miles Canyon Basalt Aquifer on December 3rd to 6th, 2002.
Very little fluctuation in the pumped groundwater temperatures was observed throughout the pumpingtest.
5. Groundwater quality from both aquifer systems is relatively good and meets all of the tested healthbased Canadian Drinking Water Quality Guidelines and Yukon Contaminated Sites RegulationsAquatic Life standards. No significant scaling or corrosion of heat pump equipment is anticipatedwith respect to groundwater usage from either aquifer system. The average hardness (as CaCO3) ingroundwater from the overburden and basalt aquifer at TH02-01 is 87 mg/L and 113 mg/Lrespectively.
Based on the conclusions, the principal recommendations of the project are summarized as follows:
1. Although both aquifers are productive and appear to be capable of providing a viable water source fora groundwater heat pump system, it is recommended that the Selkirk Aquifer be selected as thepreferred water source for the Vanier School Project. The rationale for this recommendation is asfollows:
• The groundwater temperature differential between the two aquifers is slightly more than 1º C, andtherefore the Miles Canyon Basalt Aquifer does not appear to provide a significant thermaladvantage.
• It is likely that a single production well in the Miles Canyon Basalt Aquifer at this location,regardless of diameter, may not be adequate to deliver the required flow rates.
• At the study location, drawdown levels in wells completed in the Miles Canyon Basalt Aquiferwill be greater than drawdown levels in wells completed in the Selkirk Aquifer. Consequently,pumping costs associated with well operations in the Mile Canyon Basalt Aquifer will be higher.

Page iii(1rb012303_jk.doc/22-292/2003)
• Water quality in the Selkirk Aquifer is marginally better than the Miles Canyon Basalt Aquifer,and therefore maintenance issues associated with water quality are anticipated to be reduced.
• Due to the relatively high estimated hydraulic conductivity identified in the Selkirk Aquifer,injection of the discharge water back into this aquifer system will require a lower injectionpressure and therefore will be simpler to build operate and maintain.

(2ra0212_jk.doc/22-292/2003)
T a b l e o f C o n t e n t s
Letter of TransmittalExecutive Summary
Page
1. Introduction ....................................................................................................................... 11.1 Background .........................................................................................................................11.2 Scope of Work ....................................................................................................................11.3 Site Description...................................................................................................................2
2. Well Completion................................................................................................................ 52.1 Observation Borehole .........................................................................................................52.2 Test Well TH02-01 .............................................................................................................5
2.2.1 Overburden Well Completion and Development...................................................52.2.2 Bedrock Well Completion and Development ........................................................7
2.3 Geophysical Survey ............................................................................................................92.4 Site Stratigraphy..................................................................................................................9
3. Hydrogeological Testing and Analyses.......................................................................... 123.1 Overburden Aquifer ..........................................................................................................12
3.1.1 Overburden Step Test Pumping Results ..............................................................133.1.2 Overburden Well Performance ............................................................................14
3.2 Bedrock Aquifer................................................................................................................163.2.1 Bedrock Step Pumping Test Results....................................................................163.2.2 Bedrock 72 hr Constant Rate Pumping Test ........................................................183.2.3 Bedrock Well Performance..................................................................................23
4. Groundwater Quality...................................................................................................... 264.1 Sample Collection .............................................................................................................264.2 Sample Analyses ...............................................................................................................26
4.2.1 Quality Assurance and Quality Control ...............................................................274.3 Discussion of Results ........................................................................................................27
4.3.1 Quality Control/Quality Assurance......................................................................274.3.2 Discussion of Drinking Water Quality Guidelines ..............................................294.3.3 Physical Tests.......................................................................................................294.3.4 Major Ions in Groundwater..................................................................................314.3.5 Dissolved Anions .................................................................................................314.3.6 Nutrients...............................................................................................................334.3.7 Total Metals .........................................................................................................334.3.8 Stability Indices and pH.......................................................................................34
5. Conclusions and Recommendations .............................................................................. 365.1 Conclusions.......................................................................................................................365.2 Recommendations .............................................................................................................39
6. References ........................................................................................................................ 40

(2ra0212_jk.doc/22-292/2003)
List of Figures
Figure 1. Site Location Map .....................................................................................................................3Figure 2. Test Well Location Map............................................................................................................4Figure 3. TH02-01 - Temporary Well Completion Diagram in Selkirk Aquifer......................................6Figure 4. TH02-01 - Final Well Completion Diagram in Miles Canyon Basalt Aquifer .........................8Figure 5. Geophysical Log of TH02-01 through the Miles Canyon Basalt ............................................11Figure 6. Overburden Aquifer - Short Duration Pumping Test Results .................................................13Figure 7. Overburden Aquifer - Flow Rate and Estimated Rate of Drawdown......................................15Figure 8. Bedrock Aquifer - Short Duration Pumping Test Results......................................................17Figure 9. Bedrock Aquifer - 72 hr Pumping Test Results ......................................................................20Figure 10. Water Levels in Observation Wells.........................................................................................21Figure 11. Bedrock Well 72 hr Pumping Test - Late Time Drawdown Data ...........................................23Figure 12. Predicted Drawdown After 100 Days of Sustained Pumping .................................................24Figure 13. Trilinear Diagram of Major Ions in Groundwater..................................................................32
List of Tables
Table 1. Simplified Stratigraphy at OB02-01 and TH02-02 ...................................................................9Table 2. Summary of Miles Canyon Basalt Aquifer Parameters...........................................................22Table 3. Summary of Groundwater Quality ..........................................................................................28Table 4. Classification of Hardness in Groundwater.............................................................................29Table 5. Interpretation of the Langelier Saturation Index .....................................................................35Table 6. Interpretation of the Ryznar Stability Index ............................................................................35Table 7. Results fo Stability Indices ......................................................................................................35Table 8. Summary of Results from TH02-01 ........................................................................................38
Appendices
Appendix A: Borehole LogsAppendix B: Pumping Test Data and AnalysesAppendix C: Original Laboratory ReportsAppendix D: Project Photographs

(2ra0212_jk.doc/22-292/2003) 1
1. Introduction
1.1 Background
In 2001 the Energy Solutions Centre Inc. (ESC) began assessing the feasibility of using Ground SourceHeat Pump technology in the Riverdale subdivision of Whitehorse. In January 2002 a site setting andconceptual design report was completed for the Vanier Catholic Secondary School in Riverdale (GartnerLee Limited 2002). This report concluded that there was significant potential at this school fordevelopment of an Open-Loop Groundwater Heat Pump system. Based on this potential, ESC filed aClass-B Water License Application to the Yukon Territorial Water Board for this project. In parallel,ESC initiated a hydrogeological assessment to determine the groundwater conditions within the aquifersunderlying the site. Gartner Lee Limited (GLL) was retained to conduct this work. This report providesthe results of the project findings.
The study area is located within the subdivision of Riverdale, located within the City of Whitehorse,Yukon (Figure 1).
1.2 Scope of Work
Fieldwork conducted as part of this project was completed between July 3, 2002 and December 6, 2002.The project scope consisted of the following tasks:
1. Construction of an observation well (OB02-01):
• Auger drilling of OB02-01 for completion of an observation well (not completed) to be usedduring the hydrogeological assessment of test well TH02-01.
• OB02-01 was not completed as an observation well due to limitations of the drilling rig.
2. Construction of test well TH02-01, which included the following:
• Advancement of the test well to bedrock;• completion of a temporary well screen, short term pumping test and water quality assessment
within the overburden aquifer;• advancement of the test well into the underlying basalt aquifer;• completion of a bedrock well within the basalt aquifer;• completion of a down hole geophysical survey; and• completion of a short term and 72 hr pumping test and water quality assessment within the
bedrock aquifer.
3. The completion of this report summarizing the results.

(2ra0212_jk.doc/22-292/2003) 2
The project team consisted of the following parties:
1) Midnight Sun Drilling Co. Ltd. of Whitehorse, Yukon (drilling contractor);2) Aurora Geosciences Ltd. of Whitehorse, Yukon (down hole geophysical consultant);3) Aqua Tech Supplies and Services Ltd. of Whitehorse, Yukon (pumping test contractor);4) Gartner Lee Limited of Whitehorse, Yukon (lead consultant).
1.3 Site Description
The study site is located approximately 250 m north of Vanier Catholic Secondary School, inWhitehorse, Yukon. The site is located on a parcel of land owned by the Yukon Territorial Government(YTG). The site is located near the edge of a forested area adjacent to the school’s soccer field. Directlyto the north of the drilling location, the ground surface drops in elevation slightly (approximately 3 m),onto a relatively flat forested area. Vegetation consists primarily of the pine-bearberry vegetationassociation. The forest floor consists of small depressions and swales (< 1 m deep). The location ofTH02-01 and OB02-01 is presented in Figure 2.

725
700
675
775
775
725
675700
650
675
675
700650
650
650675
650
675
700
675 650
650
675
VANIER CATHOLICSECONDARY SCHOOL(PROJECT LOCATION)
Riverdale
����������������������������������������������������������������������������������������������������������������������������������������������������������������������������������������������������
S c h w a t k a S c h w a t k a S c h w a t k a S c h w a t k a S c h w a t k a S c h w a t k a S c h w a t k a S c h w a t k a S c h w a t k a S c h w a t k a S c h w a t k a S c h w a t k a S c h w a t k a S c h w a t k a S c h w a t k a S c h w a t k a S c h w a t k a S c h w a t k a S c h w a t k a S c h w a t k a S c h w a t k a S c h w a t k a S c h w a t k a S c h w a t k a S c h w a t k a S c h w a t k a S c h w a t k a S c h w a t k a S c h w a t k a S c h w a t k a S c h w a t k a S c h w a t k a S c h w a t k a S c h w a t k a S c h w a t k a S c h w a t k a S c h w a t k a S c h w a t k a S c h w a t k a S c h w a t k a S c h w a t k a S c h w a t k a S c h w a t k a S c h w a t k a S c h w a t k a S c h w a t k a S c h w a t k a S c h w a t k a S c h w a t k a L a k eL a k eL a k eL a k eL a k eL a k eL a k eL a k eL a k eL a k eL a k eL a k eL a k eL a k eL a k eL a k eL a k eL a k eL a k eL a k eL a k eL a k eL a k eL a k eL a k eL a k eL a k eL a k eL a k eL a k eL a k eL a k eL a k eL a k eL a k eL a k eL a k eL a k eL a k eL a k eL a k eL a k eL a k eL a k eL a k eL a k eL a k eL a k eL a k e
H i d d e nH i d d e nH i d d e nH i d d e nH i d d e nH i d d e nH i d d e nH i d d e nH i d d e nH i d d e nH i d d e nH i d d e nH i d d e nH i d d e nH i d d e nH i d d e nH i d d e nH i d d e nH i d d e nH i d d e nH i d d e nH i d d e nH i d d e nH i d d e nH i d d e nH i d d e nH i d d e nH i d d e nH i d d e nH i d d e nH i d d e nH i d d e nH i d d e nH i d d e nH i d d e nH i d d e nH i d d e nH i d d e nH i d d e nH i d d e nH i d d e nH i d d e nH i d d e nH i d d e nH i d d e nH i d d e nH i d d e nH i d d e nH i d d e nL a k e sL a k e sL a k e sL a k e sL a k e sL a k e sL a k e sL a k e sL a k e sL a k e sL a k e sL a k e sL a k e sL a k e sL a k e sL a k e sL a k e sL a k e sL a k e sL a k e sL a k e sL a k e sL a k e sL a k e sL a k e sL a k e sL a k e sL a k e sL a k e sL a k e sL a k e sL a k e sL a k e sL a k e sL a k e sL a k e sL a k e sL a k e sL a k e sL a k e sL a k e sL a k e sL a k e sL a k e sL a k e sL a k e sL a k e sL a k e sL a k e s
WhitehorseWhitehorseWhitehorseWhitehorseWhitehorseWhitehorseWhitehorseWhitehorseWhitehorseWhitehorseWhitehorseWhitehorseWhitehorseWhitehorseWhitehorseWhitehorseWhitehorseWhitehorseWhitehorseWhitehorseWhitehorseWhitehorseWhitehorseWhitehorseWhitehorseWhitehorseWhitehorseWhitehorseWhitehorseWhitehorseWhitehorseWhitehorseWhitehorseWhitehorseWhitehorseWhitehorseWhitehorseWhitehorseWhitehorseWhitehorseWhitehorseWhitehorseWhitehorseWhitehorseWhitehorseWhitehorseWhitehorseWhitehorseWhitehorseRapidsRapidsRapidsRapidsRapidsRapidsRapidsRapidsRapidsRapidsRapidsRapidsRapidsRapidsRapidsRapidsRapidsRapidsRapidsRapidsRapidsRapidsRapidsRapidsRapidsRapidsRapidsRapidsRapidsRapidsRapidsRapidsRapidsRapidsRapidsRapidsRapidsRapidsRapidsRapidsRapidsRapidsRapidsRapidsRapidsRapidsRapidsRapidsRapids
HydroelectricHydroelectricHydroelectricHydroelectricHydroelectricHydroelectricHydroelectricHydroelectricHydroelectricHydroelectricHydroelectricHydroelectricHydroelectricHydroelectricHydroelectricHydroelectricHydroelectricHydroelectricHydroelectricHydroelectricHydroelectricHydroelectricHydroelectricHydroelectricHydroelectricHydroelectricHydroelectricHydroelectricHydroelectricHydroelectricHydroelectricHydroelectricHydroelectricHydroelectricHydroelectricHydroelectricHydroelectricHydroelectricHydroelectricHydroelectricHydroelectricHydroelectricHydroelectricHydroelectricHydroelectricHydroelectricHydroelectricHydroelectricHydroelectricProjectProjectProjectProjectProjectProjectProjectProjectProjectProjectProjectProjectProjectProjectProjectProjectProjectProjectProjectProjectProjectProjectProjectProjectProjectProjectProjectProjectProjectProjectProjectProjectProjectProjectProjectProjectProjectProjectProjectProjectProjectProjectProjectProjectProjectProjectProjectProjectProject
�
����������������������������������������������������������������������������������������������������������������������������������������������������������������������������������������������������
TH 02-1TH 02-1TH 02-1TH 02-1TH 02-1TH 02-1TH 02-1TH 02-1TH 02-1FFFFFFFFFFFFFFFFFFFFFFFFFFFFFFFFFFFFFFFFFFFFFFFFFFFFFFFFFFFFFFFFFFFFFFFFFFFFFFFFFFFFFFFFFFFFFFFFFFFFFFFFFFFFFFFFFFFFFFFFFFFFFFFFFFFFFFFFFFFFFFFFFFFFFFFFFFFFFFFFFFFFFFFFFFFFFFFFFFFFFFFFFFFFFFFFFFFF
N I S
U T
L I N
D R
.N
I S U
T L
I N D
R .
N I S
U T
L I N
D R
.N
I S U
T L
I N D
R .
N I S
U T
L I N
D R
.N
I S U
T L
I N D
R .
N I S
U T
L I N
D R
.N
I S U
T L
I N D
R .
N I S
U T
L I N
D R
.
A L S E K R D .
A L S E K R D .
A L S E K R D .A L S E K R D .
A L S E K R D .A L S E K R D .
A L S E K R D .
A L S E K R D .A L S E K R D .
FFFFFFFFFFFFFFFFFFFFFFFFFFFFFFFFFFFFFFFFFFFFFFFFFFFFFFFFFFFFFFFFFFFFFFFFFFFFFFFFFFFFFFFFFFFFFFFFFFFFFFFFFFFFFFFFFFFFFFFFFFFFFFFFFFFFFFFFFFFFFFFFFFFFFFFFFFFFFFFFFFFFFFFFFFFFFFFFFFFFFFFFFFFFFFFFFFFF
FFFFFFFFFFFFFFFFFFFFFFFFFFFFFFFFFFFFFFFFFFFFFFFFFFFFFFFFFFFFFFFFFFFFFFFFFFFFFFFFFFFFFFFFFFFFFFFFFFFFFFFFFFFFFFFFFFFFFFFFFFFFFFFFFFFFFFFFFFFFFFFFFFFFFFFFFFFFFFFFFFFFFFFFFFFFFFFFFFFFFFFFFFFFFFFFFFFF
ddddddddddddddddddddddddddddddddddddddddddddddddd
L E W E S B L V D .
L E W E S B L V D .
L E W E S B L V D .
L E W E S B L V D .
L E W E S B L V D .
L E W E S B L V D .
L E W E S B L V D .
L E W E S B L V D .
L E W E S B L V D .
����������������������������������������������������������������������������������������������������������������������������������������������������������������������������������������������������
��������������������������������������������������������������������������������������������������������������������������������������������������������������������������������������������������������������������������������������������������������������������������������������������������������������������������������������������������������������������������������������������������������
����������������������������������������������������������������������������������������������������������������������������������������������������������������������������������������������������
Well #6Well #6Well #6Well #6Well #6Well #6Well #6Well #6Well #6Well #6Well #6Well #6Well #6Well #6Well #6Well #6Well #6Well #6Well #6Well #6Well #6Well #6Well #6Well #6Well #6Well #6Well #6Well #6Well #6Well #6Well #6Well #6Well #6Well #6Well #6Well #6Well #6Well #6Well #6Well #6Well #6Well #6Well #6Well #6Well #6Well #6Well #6Well #6Well #6
����������������������������������������������������������������������������������������������������������������������������������������������������������������������������������������������������
��������������������������������������������������������������������������������������������������������������������������������������������������������������������������������������������������������������������������������������������������������������������������������������������������������������������������������������������������������������������������������������������������������
FFFFFFFFFFFFFFFFFFFFFFFFFFFFFFFFFFFFFFFFFFFFFFFFFFFFFFFFFFFFFFFFFFFFFFFFFFFFFFFFFFFFFFFFFFFFFFFFFFFFFFFFFFFFFFFFFFFFFFFFFFFFFFFFFFFFFFFFFFFFFFFFFFFFFFFFFFFFFFFFFFFFFFFFFFFFFFFFFFFFFFFFFFFFFFFFFFFFWell #1Well #1Well #1Well #1Well #1Well #1Well #1Well #1Well #1Well #1Well #1Well #1Well #1Well #1Well #1Well #1Well #1Well #1Well #1Well #1Well #1Well #1Well #1Well #1Well #1Well #1Well #1Well #1Well #1Well #1Well #1Well #1Well #1Well #1Well #1Well #1Well #1Well #1Well #1Well #1Well #1Well #1Well #1Well #1Well #1Well #1Well #1Well #1Well #1
Fish HatcheryFish HatcheryFish HatcheryFish HatcheryFish HatcheryFish HatcheryFish HatcheryFish HatcheryFish HatcheryFish HatcheryFish HatcheryFish HatcheryFish HatcheryFish HatcheryFish HatcheryFish HatcheryFish HatcheryFish HatcheryFish HatcheryFish HatcheryFish HatcheryFish HatcheryFish HatcheryFish HatcheryFish HatcheryFish HatcheryFish HatcheryFish HatcheryFish HatcheryFish HatcheryFish HatcheryFish HatcheryFish HatcheryFish HatcheryFish HatcheryFish HatcheryFish HatcheryFish HatcheryFish HatcheryFish HatcheryFish HatcheryFish HatcheryFish HatcheryFish HatcheryFish HatcheryFish HatcheryFish HatcheryFish HatcheryFish HatcheryWellWellWellWellWellWellWellWellWellWellWellWellWellWellWellWellWellWellWellWellWellWellWellWellWellWellWellWellWellWellWellWellWellWellWellWellWellWellWellWellWellWellWellWellWellWellWellWellWell
Well #4Well #4Well #4Well #4Well #4Well #4Well #4Well #4Well #4Well #4Well #4Well #4Well #4Well #4Well #4Well #4Well #4Well #4Well #4Well #4Well #4Well #4Well #4Well #4Well #4Well #4Well #4Well #4Well #4Well #4Well #4Well #4Well #4Well #4Well #4Well #4Well #4Well #4Well #4Well #4Well #4Well #4Well #4Well #4Well #4Well #4Well #4Well #4Well #4
SelkirkWellfield Well #5Well #5Well #5Well #5Well #5Well #5Well #5Well #5Well #5Well #5Well #5Well #5Well #5Well #5Well #5Well #5Well #5Well #5Well #5Well #5Well #5Well #5Well #5Well #5Well #5Well #5Well #5Well #5Well #5Well #5Well #5Well #5Well #5Well #5Well #5Well #5Well #5Well #5Well #5Well #5Well #5Well #5Well #5Well #5Well #5Well #5Well #5Well #5Well #5
Y u
k o
n R
i v e
r
Y u
k o
n R
i v e
r
Y u
k o
n R
i v e
r
Y u
k o
n R
i v e
r
Y u
k o
n R
i v e
r
Y u
k o
n R
i v e
r
Y u
k o
n R
i v e
r
Y u
k o
n R
i v e
r
Y u
k o
n R
i v e
r
Y u
k o
n R
i v e
r
Y u
k o
n R
i v e
r
Y u
k o
n R
i v e
r
Y u
k o
n R
i v e
r
Y u
k o
n R
i v e
r
Y u
k o
n R
i v e
r
Y u
k o
n R
i v e
r
Y u
k o
n R
i v e
r
Y u
k o
n R
i v e
r
Y u
k o
n R
i v e
r
Y u
k o
n R
i v e
r
Y u
k o
n R
i v e
r
Y u
k o
n R
i v e
r
Y u
k o
n R
i v e
r
Y u
k o
n R
i v e
r
Y u
k o
n R
i v e
r
Y u
k o
n R
i v e
r
Y u
k o
n R
i v e
r
Y u
k o
n R
i v e
r
Y u
k o
n R
i v e
r
Y u
k o
n R
i v e
r
Y u
k o
n R
i v e
r
Y u
k o
n R
i v e
r
Y u
k o
n R
i v e
r
Y u
k o
n R
i v e
r
Y u
k o
n R
i v e
r
Y u
k o
n R
i v e
r
Y u
k o
n R
i v e
r
Y u
k o
n R
i v e
r
Y u
k o
n R
i v e
r
Y u
k o
n R
i v e
r
Y u
k o
n R
i v e
r
Y u
k o
n R
i v e
r
Y u
k o
n R
i v e
r
Y u
k o
n R
i v e
r
Y u
k o
n R
i v e
r
Y u
k o
n R
i v e
r
Y u
k o
n R
i v e
r
Y u
k o
n R
i v e
r
Y u
k o
n R
i v e
r
DowntownWhitehorse
Site Name: WHITEHORSEFile Name: 22292-F1_2.WOR
Project No: 22-292Date Issued: DEC. 2002
ENERGY SOLUTIONS CENTRE INC.
Figure 1Project Location Map
VANIER SCHOOL GSHP PROJECTHYDROGEOLOGICAL ASSESSMENT
Scale: 1: 20,000
NNNN
400 0 400 800 1200
Metres
Scale: 1:20,000

Site Name: WHITEHORSEFile Name: 22292-F1_2.WOR
Project No: 22-292Date Issued: DEC. 2002
ENERGY SOLUTIONS CENTRE INC.
Figure 2Test Well Location
VANIER SCHOOL GSHP PROJECTHYDROGEOLOGICAL ASSESSMENT
Scale: 1: 3,000
A L S E K R D .
�
D U K E S T
.VANIER SCHOOL
L E W E S B L V D .
TH 02-1TH 02-1TH 02-1TH 02-1TH 02-1TH 02-1TH 02-1TH 02-1TH 02-1
N
60 0 60 120 180
Metres
Scale: 1:3,000

(2ra0212_jk.doc/22-292/2003) 5
2. Well Completion
2.1 Observation Borehole
On July 3, 2002, an observation borehole (OB02-01) was drilled using a CME 75 hollow stem auger drillrig provided and operated by Midnight Sun Drilling Co. Ltd of Whitehorse, Yukon. Split spoon samplesand or grab samples were collected throughout the drilling operations at approximately 1.5 m intervalsand were logged by Jonathan Kerr of GLL, according to standard geological methods. As the drillingdepth increased, the soils became saturated and non-cohesive, making sample recovery difficult. Theinterpreted borehole log for OB02-01 is provided in Appendix A.
It was intended that borehole OB02-01 would be used to install an observation well that could be usedduring the hydrogeological assessment of the overburden aquifer. However, fine grain soils (fine sandand silt) were encountered which limited the auger depth to a maximum of 35.1 m below ground surface(bgs). An observation well completed in the material encountered would not likely yield meaningful dataduring the proposed aquifer test. Therefore, a decision was made to abandon the borehole. The boreholewas filled with a mixture of drill cuttings (i.e. sandy silt) and bentonite to prevent the infiltration or short-circuiting of surface water.
2.2 Test Well TH02-01
Test well TH02-01 was constructed over a seven-day period from July 25, through July 31, 2002. TH02-01 was completed using a trailer-mounted air rotary Schramm T685 drill rig provided and operated byMidnight Sun Drilling Co. Ltd. The ODEX drilling method used a 168 mm outer diameter (6-inch)casing that was advanced into the ground as the borehole was drilled to a slightly larger diameter of 178mm. Grab soil samples were collected from the cutting return cyclone at approximately 1.5 m depthintervals and logged by Jonathan Kerr of GLL. Logging of the recovered geological material followedstandard geological methods. The borehole log for TH02-01 is provided in Appendix A.
2.2.1 Overburden Well Completion and Development
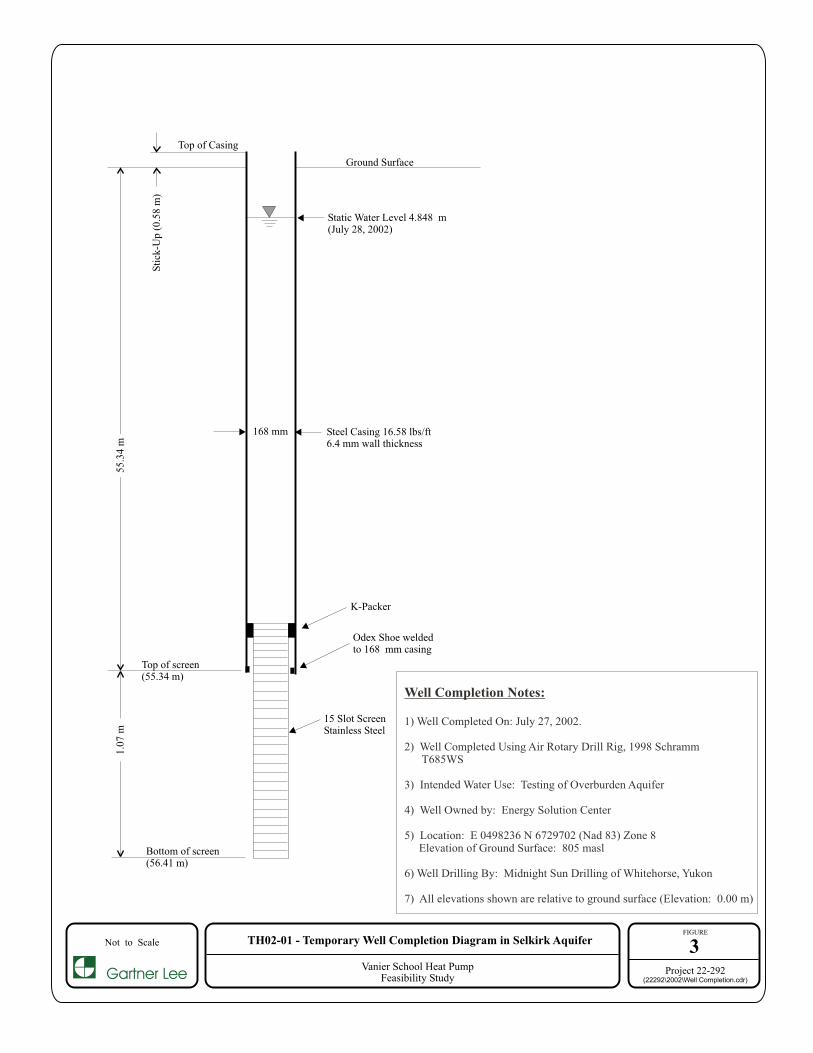
On July 27, 2002, upon drilling through the overburden to the top of the bedrock surface, a temporarywell screen was telescoped through the casing and placed within the sand and gravel aquifer. Thistemporary screen was installed across a depth interval of 55.34 to 56.41 m bgs. A schematic diagramshowing details of the temporary well completion is presented in Figure 3. A 4-inch (102 mm), 15 slot(0.38 mm) stainless steel well screen manufactured by Johnson Well Screens, was used for thecompletion of the temporary well.
FIGURE
3
Gartner Lee
Not to Scale
Project 22-292(22292\2002\Well Completion.cdr)
TH02-01 - Temporary Well Completion Diagram in Selkirk Aquifer
Vanier School Heat PumpFeasibility Study
Top of screen(55.34 m)
Odex Shoe weldedto 168 mm casing
168 mm
Ground Surface
Top of CasingS
tick
-Up
(0.5
8m
)
Steel Casing 16.58 lbs/ft6.4 mm wall thickness
1.0
7m
55.3
4m
Well Completion Notes:
1) Well Completed On: July 27, 2002.
2) Well Completed Using Air Rotary Drill Rig, 1998 SchrammT685WS
3) Intended Water Use: Testing of Overburden Aquifer
4) Well Owned by: Energy Solution Center
5) Location: E 0498236 N 6729702 (Nad 83) Zone 8Elevation of Ground Surface: 805 masl
6) Well Drilling By: Midnight Sun Drilling of Whitehorse, Yukon
7) All elevations shown are relative to ground surface (Elevation: 0.00 m)
Static Water Level 4.848 m(July 28, 2002)
K-Packer
Bottom of screen(56.41 m)
15 Slot ScreenStainless Steel

(2ra0212_jk.doc/22-292/2003) 7
Once the well screen was within the overburden aquifer, the well was developed for approximately 2hours using air surging. Throughout the development process an assessment of water quality (i.e. sandcontent and turbidity measurements) was not conducted as it was intended that the well be used fortemporary hydrogeological testing purposes only. However, based on visual inspections, thegroundwater appeared to reach a “sand free” condition.
Following the completion of the overburden well, a short-term pumping test and water quality assessmentwas conducted.
2.2.2 Bedrock Well Completion and Development
Following the completion of the pumping test in the overburden aquifer, the well screen was removedfrom the casing and the borehole was advanced into the underlying bedrock. To ensure adequate bedrockintegrity within the “open-hole” portion of the borehole, the casing was toed approximately 6.4 m intothe top of the bedrock surface (i.e. to a depth of 66.75 m bgs). A 133 mm (5 ¼ inch) diameter hole wasthen drilled out the bottom of the casing to a depth of 146.53 m bgs. Following the completion of thebedrock well, the top of the well casing was cut approximately 0.62 m above ground surface and alockable steel lid was installed to reduce the potential for vandalism. A schematic diagram showing thefinal well completion details is presented in Figure 4.
On August 1, 2002, following the completion of TH02-01 within the bedrock aquifer, air surgingdevelopment was conducted for approximately 4 hrs. Due to the nature of the bedrock, well developmentwas achieved relatively quickly. Based on visual inspections, the groundwater appeared to reach a “sandfree” condition.

FIGURE
4
Gartner Lee
Not to Scale
Project 22-292(22292\2002\Well Completion.cdr)
TH02-01 - Final Well Completion Diagram in Miles Canyon Basalt Aquifer
Vanier School Heat PumpFeasibility Study
Open Hole BedrockWell Completion
Bottom of 168 mmCasing (66.75 m)
Odex Shoe weldedto 168 mm casing
168 mm
133 mm
Ground Surface
Top of Casing
Sti
ck-U
p(0
.62
m)
Steel Casing 16.58 lbs/ft6.4 mm wall thickness
Depth of OpenHole (146.53 m)
79.7
8m
66.7
5m
Well Completion Notes:
1) Well Completed On: August 30, 2002.
2) Well Completed Using Air Rotary Drill Rig, 1998 SchrammT685WS
3) Intended Water Use: Open Loop Ground Source Heat Pump
4) Well Owned by: Energy Solution Center
5) Location: E 0498236 N 6729702 (Nad 83) Zone 8Elevation of Ground Surface: 805 masl
6) Well Drilling By: Midnight Sun Drilling of Whitehorse, Yukon
7) All elevations shown are relative to ground surface (Elevation: 0.00 m)
Static Water Level 4.941 m(August 5, 2002)

(2ra0212_jk.doc/22-292/2003) 9
2.3 Geophysical Survey
On August 29, 2002, approximately 28 days following final well construction, Aurora Geosciences, ofWhitehorse, Yukon, conducted a downhole geophysical survey of TH02-01. The survey was conductedover a 4-hour period. The purpose of the survey was to assess in-situ groundwater temperatures and tomeasure thermal gradients within the bedrock aquifer. In addition to temperature measurements, othergeophysical measurements were made to collect information on various ground properties (i.e. electricalresistivity). A downhole geophysical survey through the Miles Canyon Basalt Aquifer had never beenconducted before thus making this data set unique. The geophysical log associated with this work isprovided in Figure 5.
2.4 Site Stratigraphy
As discussed, borehole logs from each drilling operation (i.e. completion of OB02-01 and TH02-01) areprovided in Appendix A. The principal geological materials encountered at each location are verysimilar and have been summarized in Table 1.
Table 1. Simplified Stratigraphy at OB02-01 and TH02-02
Depth(meters below ground surface)
Material Texture Interpreted Stratigraphic Unit
0 - 5.8 mSAND and GRAVEL with trace
amounts of siltRecent Alluvium
5.8 - 54.9 m SILT and fine SAND Glaciolacustrine54.9 - 60.4 m coarse SAND to GRAVEL Lower Selkirk
60.4 - 143.1 m Basalt Miles Canyon Basalt143.1 - 146.5 m Granodiorite Whitehorse Batholith

(2ra0212_jk.doc/22-292/2003) 10

Figure 5. Geophysical Log of Test Well TH02-01Location: Vanier Catholic Secondary School, Whitehorse, YukonHole Logged By: Aurora Geosciences Ltd., August 16, 2002Logging Tool: IFG Corp. BFG-06 Multiparameter ProbeLog Prepared By: Gartner Lee Limited, Project# 22-292Well Location: 498233E 6729705N, Zone 8 (NAD83)Reference Point: +0.63m Above Ground Surface
Dep
th (m
etre
s be
low
refe
renc
e po
int)
Gamma(cps)0 130
K(cps)0 5
U(cps)0 5
Th(cps)0 5
Single Point Res.(ohm)1000 2000
16" Normal Res.(ohm-m)0 2000
Temperature(C)4 10
Delta T(C)-.005 .005
Magnetic Susp.150 200
0
-10
-20
-30
-40
-50
-60
-70
-80
-90
-100
-110
-120
-130
-140
Gravel (cased)
Sand (cased)
Silt (cased)
Sandy Silt (cased)
Sand & gravel (cased)Basalt gravel (cased)
Basalt (cased)
Basalt
Diorite

(2ra0212_jk.doc/22-292/2003) 12
3. Hydrogeological Testing and Analyses
Hydrogeological testing included pumping tests of both the overburden (Selkirk) and bedrock (MilesCanyon Basalt) aquifers. Based on a reinterpretation of the Yukon Waters Act, DIAND Water Resourcesdetermined that a Class-B water license (i.e. production over 300 m3/day) was required to conduct thenecessary long-term (72-hr) pumping test of the Miles Canyon Basalt Aquifer. Accordingly, anapplication for such a license was submitted by Ron Gee of ESC and ultimately obtained (MS02-201) inNovember 2002.
The pumping tests conducted as part of this hydrogeological assessment are discussed in the followingsections. Throughout the pumping tests, groundwater samples were collected and analyzed to assess thegroundwater quality of each aquifer systems (i.e. Selkirk and Miles Canyon Basalt Aquifers).
The objective of this hydrogeological assessment is to produce flow rates of approximately 12.9 L/s (204USgpm). This is assuming the operation of three WaterFurnace Versatec VL360 water-to-water heatpumps operating in parallel at 68 USgpm (4.3 L/s) per unit (Gartner Lee Limited 2002 and WaterFurnace2002).
3.1 Overburden Aquifer
Following the installation of a temporary well screen within the Selkirk Aquifer at TH02-01, a short-termvariable rate pumping test and water quality assessment was conducted on July 28th, 2002.
The variable rate (i.e step test) pumping test consisted of pumping the well at five different flow rates(i.e. steps) which occurred over a total pumping duration of 340 minutes. Each “step” lastedapproximately 70 minutes, and consisted of an incremental increase in flow of approximately 0.8 L/sec.The minimum pumping rate was 2.88 L/sec (38 igpm), while the maximum pumping rate prior to the endof the pumping test was 4.17 L/sec (55 igpm). The maximum observed drawdown in TH02-01 at the endof the pumping test, was 1.63 m.
Throughout the pumping test, Jonathan Kerr of GLL completed a groundwater quality assessment.Groundwater sampling methodology and results are presented in Section 4 of this report.

(2ra0212_jk.doc/22-292/2003) 13
3.1.1 Overburden Step Test Pumping Results
The drawdown of water levels in the pumped well over the duration of the step test, and the associatedpumping rate during each step is illustrated in Figure 6. The raw data is presented in Appendix B.
Figure 6. Overburden Aquifer - Short Duration Pumping Test Results
Analysis of the time-drawdown data obtained during the test shows that each increase in pumping rateproduced an initial drawdown, however the magnitude of the drawdown appeared to stabilize relativelyquickly. This type of hydraulic response (i.e. no additional change in drawdown with respect to time) isconsistent with that of a “confined leaky aquifer” that is receiving recharge likely from overlying and orunderlying, less permeable stratum. This interpretation is consistent with the aquifer materials identifiedin the borehole log (i.e. overlying silty fine sands).
Based on the character of the time-drawdown data collected during the first step, the hydraulic propertiesof the aquifer were estimated. The data suggests that early-time drawdown is likely to have beensignificantly affected by borehole storage. Consequently, only late-time data were analyzed and fit to theHantush-Jacob Solution (1955, 1961a, 1961b).
Step No. 1
Step No. 2
Step No. 3
Step No. 4
Step No. 5

(2ra0212_jk.doc/22-292/2003) 14
The following assumptions apply to the use of the Hantush-Jacob Solution (1955, 1961a, 1961b):
• aquifer has infinite aerial extent;• aquifer is homogeneous, isotropic and of uniform thickness;• pumping well is fully or partially penetrating;• flow to pumping well is horizontal when pumping well is fully penetrating;• aquifer is leaky;• flow is unsteady;• water is released instantaneously from storage with decline of hydraulic head;• diameter of pumping well is very small so that storage in the well can be neglected;• confining bed(s) has infinite aerial extent, uniform vertical hydraulic conductivity and uniform
thickness;• confining bed(s) is overlain or underlain by an infinite constant-head plane source;• flow in the aquitard(s) is vertical.
The results of the analyses indicate that the aquifer is moderately productive, having an interpretedtransmissivity (T) of approximately 83 m2/day. Transmissivity is defined as the hydraulic conductivity(K) multiplied by the thickness of the aquifer. Transmissivity is important for the prediction of long-termwell yield and potential for drawdown influence on neighboring wells. Given the thickness of the aquiferat this location (5.5 m) the aquifer’s interpreted hydraulic conductivity is estimated to be 1.75 x 10⁻⁴ m/s.This estimated hydraulic conductivity is consistent with results of previous pumping tests conducted inthe Selkirk Well Field to the north (GLL 1999, GLL 2000). Aquifer storativity could not be estimatedusing the test results due to the absence of a nearby observation well. A summary of the pumping testdata and analyses is provided in Appendix B.
3.1.2 Overburden Well Performance
The test results were used to estimate the maximum long-term well capacity based on a methodologyprovided by the B.C. Ministry of Environment, Lands and Parks 1999. The approach used for thisestimate considers the aquifer type as “confined”, based on the presence of the overlying sandy silts.
The total available drawdown (50.49 m) was calculated as the difference between the static water level(4.85m bgs) and the depth to the top of the well screen (55.34 m bgs). Safe available drawdown isdefined as the “safe” or “allowable” drawdown in a pumped well. Based on the interpreted confinednature of the aquifer, the safe available drawdown was considered as the distance from the static waterlevel (4.85 m bgs) to the to the top of the confined aquifer (54.90 m bgs). Given this assumption the safeavailable drawdown for the overburden well is 50.5 m (B.C. Ministry of Environment, Lands and Parks1999).
To estimate the maximum long-term well capacity (i.e. a pumping rate that will induce the safe availabledrawdown), the observed drawdowns at the end of each “step” were plotted with the associated flow ratethat induced that drawdown. During the overburden aquifer test, the size of the well screen was

(2ra0212_jk.doc/22-292/2003) 15
relatively small (length 1.07 m, dia 120 mm, slot size 0.38 mm). At low pumping rates it was observedthat the steady state drawdown values plotted along a relatively straight line, however at higher flow rates(i.e. > than 4 L/sec) a disproportionate increase in drawdown occurred. This effect is likely the result ofa decrease in well efficiency. Decreases in well efficiency associated with increases in pumping rate areoften the direct result of head loss associated with groundwater entering the well screen at highvelocities. To account for this observed decrease in well efficiency at high flow rates, a best-fitexponential line was placed through the data points and the equation of this line was calculated (Figure7). The equation of the best-fit line was then used to estimate the flow that would induce the safeavailable drawdown (50.5 m). Given this methodology, the maximum long-term well capacity of theoverburden well is estimated to be approximately 12.6 L/s.
Figure 7. Overburden Aquifer - Flow Rate and Estimated Rate of Drawdown
y = 0.2832e 0.41x
0
0.2
0.4
0.6
0.8
1
1.2
1.4
1.6
1.8
2
0 1 2 3 4 5 6Flow (L/sec)
Dra
wdo
wn
(m)
Best Fit Exponential Line
Linear Best Fit LineFirst 4 Data Pts. Only

(2ra0212_jk.doc/22-292/2003) 16
It should be understood that the maximum long-term well capacity is valid only for a specific wellconstruction in a given aquifer. Additionally, the methodology used to estimate the maximum long-termwell capacity assumes an exponential decrease in well efficiency at higher flow rates. Significantimprovements in well efficiency would likely be obtained with the installation of longer length, largerdiameter/slot size well screen. As a design requirement in well construction, screens are typicallyselected to maintain entrance velocities of approximately 0.03 m/sec or less. If this condition is met,head losses can be assumed to be negligible and high well efficiencies can be obtained (Mabillot 1979).
Given the thickness of the sand and gravel aquifer (~5.5 m) observed at TH02-01, it would be reasonableto complete a well screen 3 m in length and with a diameter of 254 mm (10-inch). Excluding theproperties of the aquifer and assuming a screen slot size of 100 (i.e. 2.54 mm), hydraulic well lossesassociated with high entrance velocities would likely not occur until flows of greater than 25 L/sec (330igpm). To incorporate the aquifer properties into a prediction of potential flow rates, the first four datapoints in Figure 7 were considered. Based on the open area of the test screen and the associated flowrates used to obtain these first four data points, estimated hydraulic well losses associated with highentrance velocities are likely negligible (i.e. less than or equal to 0.03 m/sec). Therefore these datapoints were considered representative of a 100% efficient well, and were linearly extrapolated to estimatea flow rate that would induce the safe available drawdown (50.5 m) (Figure 7). Based on this analysis, itwould be reasonable expect that the aquifer is capable of supplying as much as 170 L/sec (2244 igpm).
3.2 Bedrock Aquifer
Following the completion of TH01-02 within the Miles Canyon Basalt Aquifer, a short-term variable ratepumping test and water quality assessment were conducted on August 5, 2002. Pumping tests were alsoinitiated on August 6 and 7, 2002, however electrical failures occurred and the tests were terminatedshortly after they were started. Results from one incomplete tests conducted on August 6, 2002, didhowever provide a reasonable data set that was used to estimate aquifer properties. Additionally, onDecember 3 through Dec 6, 2003, a 72 hr constant rate pumping test was conducted on TH02-01.
3.2.1 Bedrock Step Pumping Test Results
The variable rate, pumping test (i.e. step test) consisted of pumping the well using three differentpumping rates (i.e. steps) over a period of 360 minutes. Each step lasted approximately 120 minutes andconsisted of a constant pumping rate with each consecutive step having an increase in pumping rate ofapproximately 5 L/sec. The flow rate of the third and final step however could not be increasedsignificantly due to pump cavitation (i.e. aeration of the water). A discussion of this problem is providedin section 3.2.3. The maximum flow rate achieved at the end of the step test was 10.9 L/sec. Totaldrawdown of water in the well at the end of the test was 39.5 m.

(2ra0212_jk.doc/22-292/2003) 17
Water levels (i.e. drawdown) in the well during the step test and the associated pumping rates arepresented in Figure 8. Raw data is provided in Appendix B.
Figure 8. Bedrock Aquifer - Short Duration Pumping Test Results
Although groundwater entering TH02-01 during the bedrock aquifer test was likely derived primarilyfrom fractures, the nature of the time drawdown curve (Figure 8) suggests the hydraulic behaviour of thebedrock aquifer is similar to that of a porous medium. Therefore, an equivalent porous media analyticalapproach and conventional porous media curve-matching techniques have been applied to the test results.
Based on an analysis of the time drawdown data, each increase in pumping rate produced an initialdrawdown, however throughout the observation period, the magnitude of the drawdown did not appear tocompletely stabilize. This type of hydraulic response is consistent with that of a “confined aquifer” thatis receiving water primarily from storage. Leakage from overlying or underlying stratum may beoccurring however, based on the duration of this test, a “recharge” boundary effect is not apparent. Thepumping data and analyses are presented in Appendix B.
Step No. 1
Step No. 2
Step No. 3

(2ra0212_jk.doc/22-292/2003) 18
Time drawdown data collected during one of the failed pumping tests provided a data set that was used toestimate the bedrock aquifer properties. This test consisted of a 143 minute constant rate (11.1 L/sec or147 igpm) pumping test which was inadvertently terminated due to pump failure on Aug 7, 2002. TheTheis (1935) aquifer solution was used to estimate the bedrock aquifer properties.
The time drawdown data was fit to the Theis (1935) solution, which assumes the following:
• The aquifer is confined and has an "apparent" infinite extent;• The aquifer is homogeneous, isotropic, and of uniform thickness over the area influenced by
pumping;• The piezometric surface was horizontal prior to pumping;• The well is fully penetrating and pumped at a constant rate;• Water removed from storage is discharged instantaneously with a decline in head;• The well diameter is small, so well storage is negligible.
The early time data (less than 5 minutes) was excluded from the analyses as it suggested that over thisinterval there appeared to be significant borehole storage effects. The results of this analysis arepresented in Appendix B. The aquifer transmissivity (T) is estimated at 14 m2/day. Estimates of aquiferstorativity provided by the analysis are not considered valid due to the absence of nearby observationwell data. Given that the open portion of the well has been completed through the entire basalt aquifer(82.7 m), the hydraulic conductivity is estimated at 2.0 x 10⁻⁶ m/s. This hydraulic conductivity value issimilar to other estimates obtained from pumping tests conducted elsewhere within the Miles CanyonBasalt (Pearson et al. 2001).
3.2.2 Bedrock 72 hr Constant Rate Pumping Test
A 72-hour constant rate pumping test of the bedrock aquifer (Miles Canyon Basalt Aquifer) wasconducted from December 3rd to December 6th, 2002. As the pumping rates during the test wereanticipated to exceed 300 m3/day, this test was conducted under a Class-B water license (MS02-201)issued under the Yukon Waters Act.
A temporary submersible pump was installed in the test well (TH02-01) by Aqua Tech Supplies &Services of Whitehorse, Yukon. Depth to pump suction was 61.9 m below top of casing. A dischargeline approximately 150 m long was used to convey pumped groundwater from the wellhead to thedischarge site. The discharge site consisted of a relatively low-lying forested area to the northwest of thewell. Water was pumped into a large plastic tub to dissipate its energy and prevent scouring of theground. Discharge water was allowed to overflow from the tub and infiltrate back into the aquifer.During the pumping test, the discharged area was cordoned off with flagging tape to prevent access bythe public.

(2ra0212_jk.doc/22-292/2003) 19
The pumping test was conducted by Aqua Tech under guidance from Gartner Lee Limited. Operationswere under 24-hr supervision by the pump contractor for the duration of the test. The discharge site wasinspected at least four times per day to ensure that no flooding of private property occurred.
Pumping rates were recorded routinely using an in-line digital flow meter. Pumped groundwatertemperatures were measured throughout the test using both an in-line mechanical thermometer mountedon the wellhead and a digital temperature probe (see section 4.3.3).
Water levels in the test well were measured routinely throughout the pumping test. To assess water levelchanges in other locations within the overburden Selkirk Aquifer, two observation wells (TH 1-78 andWW No. 5) located in the Selkirk Well Field were also monitored throughout the 72-hr pumping test.TH 1-78 is located adjacent to the Fish Hatchery Well and is completed in the lower portion of theSelkirk Aquifer. WW No. 5 is one of the City of Whitehorse’s production wells and is located at theeastern end of the well field within the Upper Selkirk Aquifer. TH 1-97, another deep well adjacent toWW No.5, could not be used as an observation well due to vandalism. A continuous water level datalogger was installed in WW No.5 during the pumping test. Manual water level measurements were madeat both observation wells throughout the 72-hr pumping test. A location map showing the observationwells relative to TH02-01 is provided in Figure 2.
Both the City of Whitehorse, Public Works Department and Yukon Energy Corporation (owners of theWhitehorse Rapids Fish Hatchery) were notified verbally of the pumping test prior to commencementand indicated no objections to the test. The City of Whitehorse provided access to their WW No. 5 andthe Fish Hatchery offered flow data from their production well.
At the end of the test, all equipment was removed from site. Ponded water at the discharge site infiltratedcompletely into the ground within two hours, and there was no significant accumulation of ice.
The pumping test consisted of a 72-hr pumping period followed by a 2.5-hr recovery period. At the startof the test, the static water level in TH02-01 was 5.70 m below top of casing. Following 72 hours ofcontinuous pumping, at an average rate of 8.98 L/s (118.5 igpm), the water level in TH02-01 was 44.98m below the top of the well casing (i.e. a total drawdown of 39.28 m). Two and half hours followingpump shut down, the water level in the well had recovered to 15.62 m below top of casing, a recovery ofapproximately 75%.
A graph showing the water levels (i.e. drawdown) in test well and the associated pumping rates ispresented in Figure 9. Detailed pumping test data is provided in Appendix B.

(2ra0212_jk.doc/22-292/2003) 20
Figure 9. Bedrock Aquifer - 72 hr Pumping Test Results
Groundwater elevation data collected from the two observation wells (TH1-78 and WW No.5) ispresented in Figure 10. These wells are 417 m northwest and 470 m north of the test well respectively.It is important to note that the City of Whitehorse could not cease operation of their well field for theduration of the pumping test. Therefore, water levels in the observation well are significantly influencedby the intermittent operation of WW No.6 and WW No.4. WW No.6 operated 79% of the time duringthe pumping test and at a pumping rate of approximately 130 L/s (1716 igpm). WW No.6 is 145 m westof WW No.5 and 272 m north of TH 1-78. The effect of the intermittent operation of WW No.6 isillustrated in the fluctuating water levels observed in both WW No.5 and TH 1-78 (Figure 10).
In addition, WW No.6, WW No.4 operated periodically for approximately 10 min every six hours toprevent freezing of the water lines. As part of this operation, a portion of the groundwater extracted fromWW No. 4 is diverted back into WW No.5. Over the testing period, the Fish Hatchery Well was pumpedcontinuously at a rate of 11.3 L/s (150 igpm). The Fish Hatchery well is located 16 m north of TH 1-78.Throughout the observation period, water levels in TH 1-78 and WW No.5 fluctuated 0.06 m and 0.12 mrespectively. Based on the good correlation between City of Whitehorse production well operation andwater levels in WW No. 5 and TH 1-78, it is likely that the fluctuations in these observation wells isattributable primarily to the operation of the production wells (WW No. 4 and 6).

(72-hour test data.xls / 9/30/2003 / 22292 / FKP)
Figure 10. Water Levels in Observation WellsVanier School 72-hr Pumping Test
4
4.2
4.4
4.6
4.8
5
5.2
5.4
5.6
5.8
612/3/2002 0:00 12/3/2002 12:00 12/4/2002 0:00 12/4/2002 12:00 12/5/2002 0:00 12/5/2002 12:00 12/6/2002 0:00 12/6/2002 12:00 12/7/2002 0:00
Time
Wat
er L
evel
(m b
elow
Top
of P
ipe)
0
50
100
150
200
250
300
Selk
irk
Prod
uctio
n W
ell P
umpi
ng R
ates
(L/s
)
WW #5 (Datalogger)
WW #5 (Manual)
TH 1-78
Operating Periods of Well #6
Operation Periods of Well #4

(2ra0212_jk.doc/22-292/2003) 22
Given the nature of the time drawdown data, the Theis Method and the Cooper-Jacob Method forconfined aquifers were used to estimate the aquifer properties based on data obtained from the 72-hrconstant rate pumping test. Recovery data was analyzed using the Theis-Jacob Recovery Method.Detailed pumping data and analyses are presented in Appendix B. A summary of the results is providedin Table 2.
Table 2. Summary of Miles Canyon Basalt Aquifer Parameters
Analysis Method Transmissivity (T) Hydraulic Conductivity (K)Theis 19 m2/day 2.7 x 10⁻⁶ m/secCooper-Jacob 18 m2/day 2.5 x 10⁻⁶ m/secTheis-Jacob Recovery 17 m2/day 2.4 x 10⁻⁶ m/sec
The transmissivity and hydraulic conductivity estimates provided in Table 2, are similar to otherestimates obtained from pumping tests conducted elsewhere within the Miles Canyon Basalt (Pearson etal. 2001). Additionally, the average transmissivity obtained during the 72-hr pumping test (18 m2/day), issimilar to the estimated transmissivity made during the failed pumping test (14 m2/day) conducted onAugust 6, 2002 (section 3.2).
Although the hydraulic response of the time drawdown data is consistent with that of a “confinedaquifer” it was observed that after approximately 1400 min (23hrs) the rate of drawdown in the welldecreased slightly suggesting the presence of a recharge boundary (i.e. potential leakage from overlyingor underlying stratum). This effect was not seen during the completion of the short term pumping testand can be seen on the log-log time-drawdown plot as a deflection (i.e. flattening) off the early time data,as shown in Figure 11.

(2ra0212_jk.doc/22-292/2003) 23
Figure 11. Bedrock Well 72 hr Pumping Test - Late Time Drawdown Data
3.2.3 Bedrock Well Performance
Data collected during the 72-hr pumping step test was used to estimate the maximum long-term wellcapacity for the well completed in the Miles Canyon Basalt Aquifer.
The total available drawdown in a bedrock aquifer is considered as the difference between the staticwater level and the uppermost major water bearing zone (B.C. Ministry of Environment, Lands and Parks1999). For the purposes of this report, given the configuration of the test well, total available drawdownwill be considered as the difference between the static water level (5.08 m bgs) and the top of the basaltaquifer (60.4 m bgs). Total available drawdown therefore is 55.3 m.
Safe available drawdown is “safe” or “allowable” drawdown in a pumped well. Given the largethickness of the basalt aquifer (82.7 m), it is anticipated that an adequate water column would be presentfor housing the submersible pump, seasonal water-level fluctuations, and potential decreases in wellefficiency through time. Therefore, safe available drawdown is assumed to equal the total availabledrawdown (i.e. 55.3 m).

(2ra0212_jk.doc/22-292/2003) 24
To estimate the long-term well capacity, (i.e. a pumping rate that will induce the safe availabledrawdown), the observed drawdown line shown in Figure 12 was projected forward in time to estimatethe drawdown that would occur after 100 days of sustained pumping. Note that this projection is basedon the late time-drawdown data, which incorporates the influence of the observed recharge boundaryeffect discussed previously. Using this methodology the drawdown value estimated at 100 days ofsustained pumping is estimated at 47 m. This drawdown estimate was then divided by the pumping rate(8.98 L/sec) to determine the specific capacity. The specific capacity (1.94 x 10⁻⁴ m2/sec) was thenmultiplied by the safe available drawdown (55.3 m) to produce and estimated long-term well capacity ofapproximately 10.6 L/sec.
Figure 12. Predicted Drawdown After 100 Days of Sustained Pumping
As discussed briefly in section 3.2, it was observed during the last step of the short-term pumping testthat the efficiency of the pump dropped significantly and the discharge water became quite aerated and“effervescent”. This phenomenon commonly occurs, particularly in deep, slightly alkaline groundwaters,if the hydrostatic pressure in the groundwater entering the pump becomes significantly reduced. Asdrawdown in the well increases, the height of the water column above the pump intake decreases, causinga non-equilibrium of the carbonate system and the formation of gaseous carbon dioxide in thegroundwater.
During the short term pumping test, the pump was set at a depth of approximately 44 m below the watertable. It was observed that the formation of gaseous carbon dioxide did not occur significantly until the

(2ra0212_jk.doc/22-292/2003) 25
column of water above the pump intake was reduced to less than 10 m. If this well or a similar well wereto be put into production it is likely that the pump would be set near the bottom of the well (i.e. 140 mbgs). This condition would effectively maintain an adequate water column above the pump intake andeliminate the formation of gaseous carbon dioxide.

(2ra0212_jk.doc/22-292/2003) 26
4. Groundwater Quality
A significant component of this project included an assessment of groundwater quality from both theoverburden and bedrock aquifers. Groundwater quality can have significant impact on the life span andefficiency of heat pump equipment. Specifically, groundwater conditions can cause either corrosion orencrustation of heat pump exchangers, auxiliary equipment and piping resulting in damage or reducedefficiency. Although the heat pumps only change water temperature and do not significantly alter thechemical quality of the water, characterizing the groundwater chemistr is required for assessing potentialwater disposal options. Disposal options may include re-injection of groundwater back into the aquifer,disposal to surface water bodies and/or use as potable water.
4.1 Sample Collection
All groundwater samples submitted for analyses were collected in pre-cleaned bottles supplied by theanalytical laboratory. The following sampling and preservation methods were used:
• Samples submitted for total metal analysis were collected in 250 mL high density polyethylene(HDPE) bottles and were preserved in the field (pH < 2) using laboratory-supplied and measuredaliquots of nitric acid.
• Samples submitted for general parameters (i.e. hardness) were placed into 1-L HDPE laboratory-supplied bottles and were not preserved.
Following sample collection, all samples were kept in a cool, dark environment and transported bycourier to the laboratory within 24 hours. A total of five groundwater samples were collected andanalyzed during the overburden short term pumping test. Three groundwater samples were collected andanalyzed during the bedrock pumping test.
A specific notation was used to identify the groundwater samples. For example, the groundwater sampleidentified as “ST#1-S1” was the first sample (S1) collected at the end of the first step (ST#1), during theoverburden pumping test. The notation “BR” was used to identify samples collected during the bedrockpumping test. The letter “R” in the sample ID was used to identify a sample taken in replicate.
4.2 Sample Analyses
ALS Environmental of Vancouver, BC (ALS), a member of the Canadian Association for EnvironmentalAnalytical Laboratories (CAEAL), conducted all water analyses.
(2ra0212_jk.doc/22-292/2003) 27
4.2.1 Quality Assurance and Quality Control
Quality assurance/quality (QA/QC) measures implemented as part of this program consisted of thefollowing:
• Collection, handling, storage and chemical analysis in accordance with “Standard Methods forExamination of Water and Wastewater” and “Gartner Lee Limited Standard Field Protocols”which are designed to minimize the potential for cross-contamination of samples;
• Documentation of sample field variability, consisting of the collection of two replicate samplesthat were analyzed for total metals and general parameters; and
• Internal laboratory QA/QC measures conducted by ALS.
4.3 Discussion of Results
The analytical results of the analyzed groundwater samples is presented in Table 3. Original laboratoryreports for the laboratory analyses are presented in Appendix C.
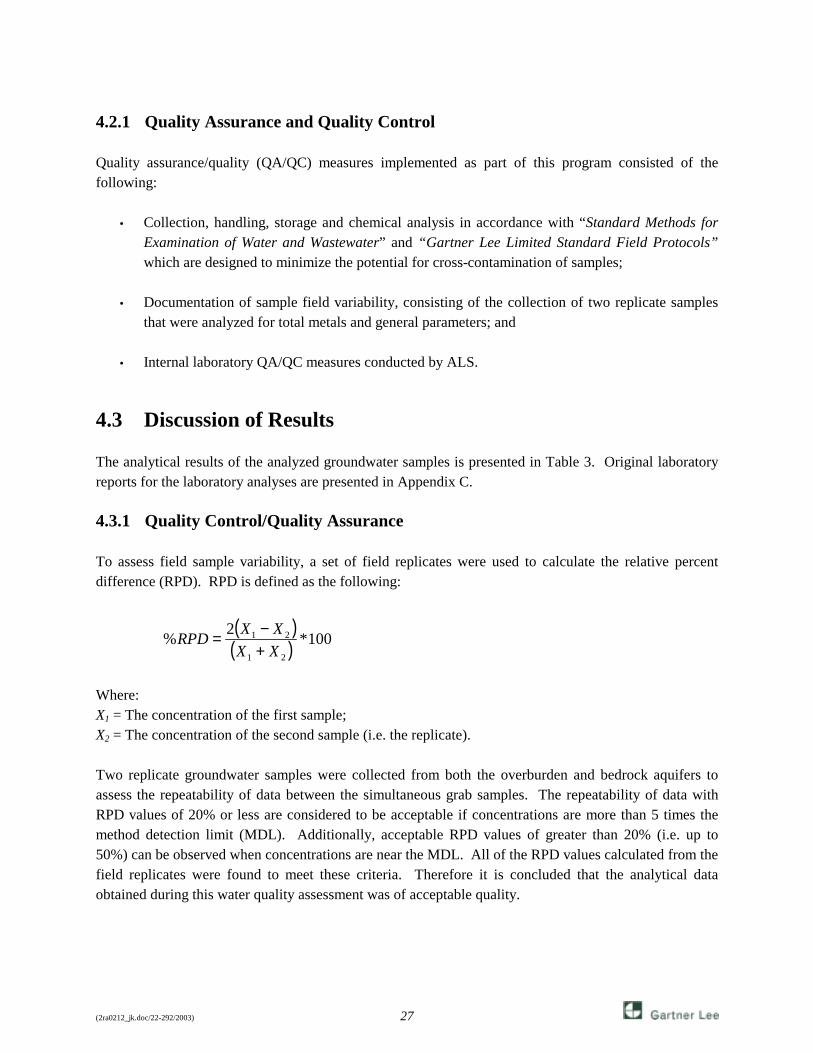
4.3.1 Quality Control/Quality Assurance
To assess field sample variability, a set of field replicates were used to calculate the relative percentdifference (RPD). RPD is defined as the following:
Where:X1 = The concentration of the first sample;X2 = The concentration of the second sample (i.e. the replicate).
Two replicate groundwater samples were collected from both the overburden and bedrock aquifers toassess the repeatability of data between the simultaneous grab samples. The repeatability of data withRPD values of 20% or less are considered to be acceptable if concentrations are more than 5 times themethod detection limit (MDL). Additionally, acceptable RPD values of greater than 20% (i.e. up to50%) can be observed when concentrations are near the MDL. All of the RPD values calculated from thefield replicates were found to meet these criteria. Therefore it is concluded that the analytical dataobtained during this water quality assessment was of acceptable quality.
( )( ) 100*2%
21
21
XXXXRPD
+−=

- - - 28-Jul-02 28-Jul-02 28-Jul-02 28-Jul-02 5-Aug-02 5-Aug-02- - - ST1-S1 ST2-S2 ST3-S3 ST5-S4R BR-ST2-S1 BR-ST3-S2 (R)- - - 1 2 3 5 3 1,2
Physical TestsCU 15 - 5 <5 <5 <5 <5 <5 <5umhos/cm - - 2 186 183 182 181 804 819
500 - 10 106 114 103 112.5 508 505CaCO3 - - 0.7 85.4 87.3 86.5 87 113 113
6.5 - 8.5 - 0.01 8.18 8.2 8.23 8.25 8.62 8.51NTU 1 - 0.1 8.2 2.7 2 1.15 2.6 2.35
Dissolved Anions (mg/L)CaCO3 - - 1 85 84 87 84 128 130.5Cl <=250 - 0.5 <0.5 <0.5 <0.5 <0.5 58.9 58.7F 1.5 3 @ H => 50 0.02 0.22 0.22 0.22 0.22 0.36 0.38SO4 <=500 1 000 1 12 12 12 12 187 188.5
Nutrients (mg/L)N 10 400 0.1 0.008 0.008 0.009 0.009 <0.005 0.009
N 10.2 @ Cl < 2mg/L or 2.0 @
Cl =>10mg/L0.1 <0.001 <0.001 <0.001 <0.001 0.001 <0.001
Total Metals (mg/L)Aluminum T-Al 0.1 - 0.01 0.05 0.05 0.02 0.055 0.09 0.035Antimony T-Sb 0.006 0.2 0.0005 <0.0005 <0.0005 <0.0005 <0.0005 <0.001 <0.001Arsenic T-As 0.025 0.05 0.001 0.006 0.006 0.006 0.006 <0.002 <0.002Barium T-Ba 1 10 0.02 <0.02 <0.02 <0.02 <0.02 <0.04 <0.04Boron T-B 5 - 0.1 <0.1 <0.1 <0.1 <0.1 <0.2 <0.2
Cadmium T-Cd 0.0050.0003 @ H = 30 - <90 or 0.0005 @ H = 90 - < 150
0.0002 <0.0002 <0.0002 <0.0002 <0.0002 <0.0004 <0.0004
Calcium T-Ca - - 0.1 15.5 16.1 15.9 15.9 24.7 24.6
Chromium T-Cr -0.01 for Cr+6 and 0.09 for
Cr+3 0.002 <0.002 <0.002 <0.002 <0.002 <0.004 <0.004
Copper T-Cu <=1.00.04 @ H = 75 - < 100 or 0.05 @ H = 100 - < 125
0.01 <0.001 0.001 <0.001 <0.001 <0.002 <0.002
Iron T-Fe <=0.3 - 0.03 0.91 0.32 0.26 0.145 0.2 0.16
Lead T-Pb 0.010.050 @ H = 50 - < 100 or 0.060 @ H = 100 - < 200
0.001 <0.001 <0.001 <0.001 <0.001 <0.002 <0.002
Magnesium T-Mg - - 0.1 11.3 11.4 11.4 11.6 12.6 12.5Manganese T-Mn <=0.05 - 0.002 0.011 0.006 0.006 0.0042 0.185 0.105Mercury T-Hg 0.001 0.001 0.0002 <0.0002 <0.0002 <0.0002 <0.0002 <0.0002 <0.0002Potassium T-K - - 0.1 1.5 1.5 1.5 1.6 2.1 2.1Selenium T-Se 0.01 0.01 0.001 0.008 0.007 0.006 0.004 <0.002 <0.002Sodium T-Na <=200 - 2 5 5 4 4 133 134.5Uranium T-U 0.02 3 0.0001 0.0011 0.0011 0.0011 0.0011 0.0031 0.0025
Zinc T-Zn <=5.00.075 @ H = < 90 or 0.150
@ H = 90 - < 1000.05 <0.05 <0.05 <0.05 <0.05 <0.1 <0.1
a Heath Canada. Guidelines for Canadian Drinking Water Quality, 2002b Yukon Environment. 2002. Contaminated Sites Regulations (YCSR). Generic Numerical Water Standards for Aquatic Life.c Indicates an average result based on replicates samplesH Indicates water hardness in mg/L (CaCO 3 )< Indicates less than detection limit- Indicates no guideline or analysis for this parameter
bold # Indicates parameter exceeds Aesthetic Objective (taste, odour, appearance, etc.)bold, itallic # Indicates parameter exceeds Maximum Acceptable Concentration (health related)
Detection Limits
Selkirk Aquifer TH02-01 Step #1
Miles Canyon Basalt Aquifer
TH02-01 Step #3 c
YCSR Aquatic Life Standard b
Miles Canyon Basalt Aquifer
TH02-01 Step #1
Selkirk Aquifer TH02-01 Step #3
Selkirk Aquifer TH02-01 Step #2
Selkirk Aquifer TH02-01 Step #4 c
Sample Collection DateSample IDALS Sample ID
Canadian Drinking Water
Quality Guidelines a
Nitrate Nitrogen
Nitrite
Alkalinity-Total ChlorideFluoride
Table 3. Summary of Groundwater Quality TH02-01 Vanier School, Whitehorse, Yukon
Parameter
Sulphate
Hardness pHLaboratory Turbidity
Colour Laboratory Conductivity Total Dissolved Solids
22345-9/30/2003-Table 3

(2ra0212_jk.doc/22-292/2003) 29
4.3.2 Discussion of Drinking Water Quality Guidelines
The water quality assessment conducted for this report was primarily related to evaluating the potentialfor corrosion or fouling of heat pump equipment (section 4.3.8). However, water quality data has alsobeen compared to the Canadian Drinking Water Quality Guidelines (CDWQG), (Health Canada 2002)and the Yukon Contaminated Site Regulation (YCSR) Aquatic Life Standards (Yukon Department ofEnvironment 2002). These comparisons have been performed to help assess potential water disposaloptions. Specifically, the comparison of groundwater quality to the CDWQG was performed to assessthe viability of re-injection to a water supply aquifer (i.e. back into the aquifer) and/or use of thegroundwater for drinking water. Comparison of the groundwater quality results to the YCSR AquaticLife Standard was also conducted to assess the potential disposal of the cooled groundwater to nearbysurface water bodies (i.e. the Yukon River).
4.3.3 Physical Tests
Physical water tests conducted as part of this study included measurements of turbidity, colour, totaldissolved solids, pH and hardness. The results of these parameters are discussed in the followingparagraphs.
HardnessHardness is a key parameter used to assess scaling potential. Scaling has a potential to decrease theefficiency of groundwater heat pump systems (Rafferty 2000). Water hardness is classified based on arange of calcium carbonate concentrations that commonly varies slightly from reference to reference.Table 4 provides a common interpretation.
Table 4. Classification of Hardness in Groundwater
Hardness (CaCO3 ) mg/L Classification Comments< 50 Soft -
50 – 100 Medium HardMay deposit in kettles and hot water
heaters.
100 – 200 HardScale build up or staining is likely
quite noticeable.
> 200 Very HardRecommended that water besoftened for household uses.
Notes: Table from Carrier (1965)
Based on the water quality results conducted during this assessment, the groundwater samples testedfrom both the overburden and bedrock aquifers would be classified as “medium hard” to “hard”. The

(2ra0212_jk.doc/22-292/2003) 30
groundwater from the bedrock aquifer, however, was found to be slightly harder (average hardness of113 mg/L as CaCO3) than the groundwater from the overburden aquifer (average hardness of 87 mg/L asCaCO3). A discussion of the scale and/or corrosion potential of the analyzed groundwater is presented insection 4.3.8 of this report.
Groundwater TemperatureGroundwater temperatures were continuously monitored throughout the short-term and long termpumping test using a digital temperature probe (YSI Model 30/10 FT Salinity Conductivity TemperatureProbe). The instrument measurements are considered to be accurate to 0.1 degrees Celsius.
Temperature monitoring of pumping groundwater throughout the short-term pumping test in theoverburden aquifer indicate the groundwater temperature was initially approximately 6.4º C, howeverafter approximately 300 min of pumping the temperature appeared to declined slightly to a stabilizedtemperature of approximately 5.8º C.
Similar temperature monitoring was conducted throughout the short term pumping test of the bedrockaquifer. The results indicated that during early time, the pumped groundwater temperature wasapproximately 7.4º C however after approximately 240 min of pumping the temperature appeared todecline slightly to a stabilized temperature of approximately 7.1º C. Similarly, over the duration of the72-hr pumping test, pumped groundwater temperatures remained constant between 6.9 and 7.1o C with noindication of significant fluctuations or trends.
Following well completion, the borehole was allowed to stabilize for approximately 3 weeks prior toconducting the down hole survey. The results of this survey are presented in Figure 5. The in-situgroundwater temperatures in the uncased portion of the well (i.e. the Miles Canyon Basalt Aquifer)ranged from 5.8o C to a maximum of 8.9o C. The temperatures appeared to increase relatively linearlywith depth. It was also observed that an inflection point in the groundwater temperature profile occurredat a depth of approximately 84 m bgs.
It should be noted that various groundwaters derived from different fractures may vary in temperature.Additionally, groundwater entering the well bore through these fractures is likely mixing as a result ofthe open nature of the bore hole column. Consequently, the groundwater temperature profile obtainedduring the down hole geophysical survey (Figure 5) is representative of a stabilized or “mixed”condition. As a result, representative groundwater temperature signatures from discrete fractures withinthe borehole could not be assessed during this investigation.
TurbidityAll of the groundwater samples submitted to the laboratory were analyzed for turbidity. CanadianDrinking Water Quality Guidelines (CDWQG) have both a Maximum Acceptable Concentration (MAC)for turbidy (1 NTU) applicable to water entering a distribution system and an Aesthetic Objective (AO)for turbidity of 5 NTU. All groundwater samples exceeded the 1 NTU threshold. It is suspected thisresult may be caused by insufficient well development and/or, in the case of samples containing elevated

(2ra0212_jk.doc/22-292/2003) 31
iron and or manganese concentrations, the result of inorganic compounds (i.e. metal oxides andhydroxides) precipitating out of the groundwater after sample collection. It is anticipated that acceptableturbidity levels would be obtained with prolonged pumping and adequate well development.
4.3.4 Major Ions in Groundwater
A Trilinear Diagram showing the relative concentrations of major ions in the analyzed groundwatersamples is presented in Figure 13. The diagram illustrates the nature and difference between thegroundwater analyzed from the two aquifer systems (i.e. bedrock groundwater and overburdengroundwater). The diagram presented is useful for visually assessing differences in major-ion chemistryin groundwater flow system. There is also a need to be able to refer in a convenient manner to watercompositions by identifiable groups or categories (Freeze and Cherry 1979). Such diagrams provided ameans of meeting such needs.
Information shown in the Trilinear Diagram (Figure 13) suggests a notable distinction between the twogroundwaters. Groundwater from the bedrock aquifer is considerably more mineralized (i.e. higher totaldissolved solids) and is characterized as “Sodium Type” while the groundwater in the overburden ischaracterized as “Calcium/Bicarbonate Type” (Morgan et al. 1962). Based on this finding, there appearsto be a significant difference with respect to the degree and type of dissolved mineralization in thegroundwater between the overburden and bedrock aquifers.
4.3.5 Dissolved Anions
Dissolved anion concentrations were measured in all analyzed groundwater samples. Concentrations ofdissolved anions in the groundwater samples were found to meet both the Canadian Drinking WaterQuality Guidelines (2002) (CDWQG), and the Yukon Environment, Contaminated Sites Regulations(2002) (YCSR), Generic Numerical Water Standards for Aquatic Life.
The groundwater analyzed from the bedrock aquifer however was found to contain higher concentrationsof dissolved sulphate (average concentration of 188 mg/L) than the groundwater analyzed from theoverburden aquifer (average concentration of 12 mg/L).
The low concentrations of sulphate in the analyzed groundwater suggest that poor tasting waterassociated with the presence of this anion is unlikely. The aesthetic (AO) CDWQG for dissolvedsulphate is 500 mg/L.
Additionally, groundwater from the bedrock aquifer contains considerably higher concentrations ofdissolved chloride (average concentration of 58.8 mg/L) than the groundwater from the overburdenaquifer (< 0.05 mg/L). It is suspected that this is the result of the differences in mineralization betweenof the bedrock aquifer material and the overburden aquifer material. The AO CDWQG for dissolvedchloride is 250 mg/L.


(2ra0212_jk.doc/22-292/2003) 33
4.3.6 Nutrients
Nutrients (i.e. nitrate) were measured in all analyzed groundwater samples. Concentrations of all testednutrient related parameters in the analyzed samples met both the CDWQG and the YCSR, GenericNumerical Water Standards for Aquatic Life. All of the samples tested for nitrate were found to be onlyslightly above or below the method detection limit of 0.005 mg/L. The maximum allowableconcentration (MAC) for nitrate under the CDWQG is 10 mg/L.
4.3.7 Total Metals
All of the samples tested for total metal concentrations met both the health related CDWQG and theYCSR, Generic Numerical Water Standards for Aquatic Life.
4.3.7.1 Total Iron Concentrations
Total iron concentrations from two groundwater samples collected at the end of Step #1 and Step #2 ofthe overburden short term pumping test, exceeded the AO CDWQG of 0.3 mg/L (i.e. 0.91 mg/L and 0.32mg/L respectively). This exceedance may be an effect of incomplete well development as iron fromsuspended particulate matter in the groundwater could have dissolved into the sample after acidpreservation and transport to the laboratory. This hypothesis is supported by the slightly elevatedturbidity measurements, believed to be the result of incomplete well development. Groundwater samplesfrom other wells in the Selkirk Aquifer typically have total iron concentrations less than 0.3 mg/L. It isunlikely that a fully developed production well in the overburden would produce similar elevated totaliron concentrations. Total iron concentrations from all samples collected during the short term bedrockpumping test were found to meet the AO CDWQG and had an average concentration from all foursamples of 0.16 mg/L.
High concentrations of total iron commonly contribute to secondary hardness issues as it may precipitateout of solution (i.e. forming iron oxides and the accumulation of microbial growths) following entry intothe well or pump assembly or exposure to air. This effect can lead to aesthetic problems such as stainingof household toilets or clogging of distribution pipes through time. Such effects have not been observedwith operation wells from the Selkirk Well Field.
4.3.7.2 Total Manganese Concentrations
The AO CDWQG for total manganese concentrations in drinking water is 0.05 mg/L. Similar tosecondary hardness issues associated with elevated iron concentrations, elevated manganeseconcentrations (greater than 0.15 mg/L) could also be problematic. Additionally, elevated manganesehas been known to produce undesirable tastes in beverages.
Exceedances of the AO CDWQG with respect to total manganese concentrations have been detected ingroundwater samples collected from the bedrock aquifer (i.e. Miles Canyon Basalt). Total manganese

(2ra0212_jk.doc/22-292/2003) 34
concentrations from groundwater samples collected during the bedrock short-term pumping test werefound to be approximately 2.6 times higher than the AO CDWQG of 0.05 mg/L, with an averageconcentration from 3 samples of 0.13 mg/L.
Other wells completed within the Miles Canyon Basalt have been sampled and found to have manganeseconcentrations below the AO CDWQG. Specifically, the Wolf Creek North Subdivision test well had amanganese concentration of 0.098 mg/L (Gartner Lee Ltd. 2001) and the Wolf Creek Observation Wellhad a total manganese concentration of 0.085 (Gartner Lee Ltd. 2003b).
Groundwater samples from 11 domestic water wells completed in Miles Canyon Basalt in the WolfCreek Subdivision were found to contain total manganese concentrations averaging 0.014 mg/L with amaximum detected concentration of 0.058 mg/L. (Gartner Lee Ltd. 2003a). This observation suggeststhat the elevated manganese concentrations detected in TH02-01 may be related to incompletedevelopment and that with routine usage, the total manganese concentrations may be lowered.
Total manganese concentrations from groundwater sampled during the overburden short term pumpingtest were found to meet the AO CDWQG of 0.05 mg/L with an average concentration from 5 samples of0.0062 mg/L.
4.3.8 Stability Indices and pH
The Ryznar Stability Index (RSI) and the Langelier Saturation Index (LSI) are used for predicting thepotential reaction of metal objects in saturated subsurface environments. Specifically, these indices helppredict the potential of water to corrode and or deposit scales (encrustation). Depending on its specificchemistry, water can promote scaling, corrosion or both. Scaling, according to the Water QualityAssociation, is the number one water quality issue in the United States (Rafferty 2000). Scale can beformed from a variety of dissolved chemical species but two reliable indicators are hardness andalkalinity. Calcium carbonate is the most common form of scale deposition attributable to groundwaterused in Ground Source Heat Pump systems (Rafferty 2000).
Both the RSI and LSI are based upon a calculated pH of saturation for calcium carbonate (pHs). Thecalculated pHs value is then used in conjunction with the groundwater’s actual pH, and other waterchemistry, to calculate the index values as follows:
• RSI - 2pHs - pH• LSI = pH - pHs
Table 5 and Table 6 presents the interpretation of both the RSI and LSI indices.

(2ra0212_jk.doc/22-292/2003) 35
Table 5. Interpretation of the Langelier Saturation Index
LSI Index Value Indication2.0 Scale forming but non corrosive0.5 Slightly scale forming and corrosive
0.02 Balanced but pitting corrosion possible-0.5 Slightly corrosive but non-scale forming-2.0 Serious corrosion
Notes: Table from Carrier (1965)
Table 6. Interpretation of the Ryznar Stability Index
RSI Index Value Indication4.0 - 5.0 Heavy scale5.0 - 6.0 Light scale6.0 - 7.0 Little scale or corrosion7.0 - 7.5 Corrosion significant7.5 - 9.0 Heavy corrosion
> 9.0 Corrosion intolerable
Notes: Table from Carrier (1965)
Table 7 presents the results of the calculated LSI and RSI based on the groundwater quality datacollected during the assessment. It should be noted however, that the RSI and LSI indices are mostuseful as predictors of scaling potential rather than of corrosion potential.
Table 7. Results fo Stability Indices
Stability IndexOverburden Aquifer
(Calculated Index Value)Bedrock Aquifer
(Calculated Index Value)
Langelier Saturation Index (LSI) -0.183 0.404
Ryznar Stability Index (RSI) 8.588 7.735
These indices suggest that water from both aquifers are near balanced and that significant scaling shouldnot occur. The groundwater may be mildly corrosive, but not sufficiently corrosive to warrant use ofspecial alloys in the heat pump equipment (i.e. cupronickel heat exchangers). By way of comparison, theRSI for water from the City of Whitehorse’s WW No. 6, is 8.2. This well has been operating since 1974and a down hole video inspection of the well conducted in 2000 indicated no evidence of encrustation orsignificant corrosion (Gartner Lee Ltd. 2001)

(2ra0212_jk.doc/22-292/2003) 36
5. Conclusions and Recommendations
The objective of this hydrogeological assessment was to assess if the aquifers underlying the study siteare capable of sustaining a design flow rate of approximately 12.9 L/s (204 USgpm). This is assumingthe operation of three WaterFurnace Versatec VL360 water-to-water heat pumps operating in parallel at68 USgpm (4.3 L/s) per unit (Gartner Lee Limited 2002, WaterFurnace 2002). Additionally the studyassessed groundwater quality from each of the aquifers to help predict potential problems associated withheat pump systems and or operations.
Photographs of the project work are presented in Appendix D.
5.1 Conclusions
The principal conclusions of the project are summarized as follows:
Please note that the proceeding conclusions are based on a design assumption of a heat pump systemconsisting of three 90 ton nominal capacity groundwater supplied heat pumps operating in parallel at 68US gpm per unit (Waterfurnace 2002).
1. The presence of two relatively warm water aquifers below Vanier School has been confirmed by thecompletion to test well TH02-01. These aquifer systems consist of:
• The lower portion of the Selkirk Aquifer, composed of sand and gravel between depths of 54.9m and 60.4 m below ground surface (5.5 m aquifer thickness at TH02-01).
• Miles Canyon Basalt Aquifer, composed of fractured basalt bedrock between depths of 60.4and 143.1 m below ground surface (82.7 m aquifer thickness at TH02-01).
2. The Selkirk Aquifer appears to have potential to meet the anticipated heat pump source water flowrequirement of 12.9 L/s (204 USgpm). Furthermore, a properly sized well (i.e. 254 mm nominaldiameter) across the entire thickness of the Selkirk Aquifer at this location would likely producemaximum long-term yields in excess of 25 L/s (330 igpm).
3. Long-term maximum well capacity of TH02-01 as completed in the Miles Canyon Basalt Aquifer isestimated at 10.6 L/sec. Therefore, if this well were to be used, the target yield of 12.9 L/s (204 USgpm) will potentially lower water levels in the well below the safe available drawdown. Toovercome this problem, two production wells would likely required to produce the desired flow rates.
4. Stabilized temperatures of pumped groundwater measured during the pumping tests were as follows:
• 5.8o C from the Selkirk Aquifer on July 28th, 2002; and

(2ra0212_jk.doc/22-292/2003) 37
• 6.9 to 7.1o C from the Miles Canyon Basalt Aquifer on December 3rd to 6th, 2002.
Very little fluctuation in the pumped groundwater temperatures was observed throughout the pumpingtest.
5. In-situ groundwater temperatures within the Miles Canyon Basalt Aquifer ranged between 5.8o C to amaximum of 8.9o C with a relatively linear temperature increase with depth.
6. Groundwater quality from both aquifer systems is relatively good and meets all of the tested healthbased Canadian Drinking Water Quality Guidelines and Yukon Contaminated Sites RegulationsAquatic Life standards. No significant scaling or corrosion of heat pump equipment is anticipatedwith respect to groundwater usage from either aquifer system. The average hardness (as CaCO3) ingroundwater from the overburden and basalt aquifer at TH02-01 is 87 mg/L and 113 mg/Lrespectively.
7. Quality of groundwater from samples collected during the short term pumping test in the SelkirkAquifer met the health related Canadian Drinking Water Quality Guidelines (2002) (CDWQG) forthe parameters tested, with the exception of turbidity. The tested parameters from samples collectedfrom the Selkirk Aquifer were also found to meet the Yukon Contaminated Site Regulations (YCSR)Aquatic Life Standards (Yukon Department of Environment 2002). It is anticipated that withadditional well development, a production well completed within this aquifer could produceacceptable turbidity levels. The water quality results from the Selkirk Aquifer also indicate anexceedance of the CDWQG Aesthetic Objective (AO) for total iron concentrations. It is suspectedthat elevated total iron concentrations may be related to the presence of elevated turbidity and withadequate well development acceptable iron concentrations will be achieved. Groundwater from theCity of Whitehorse’s well field, completed within the Selkirk Aquifer, typically producesgroundwater that meets the CDWQG for both turbidity (1 NTU) and total iron (0.3 mg/L).
8. Groundwater samples collected during the short term pumping test in the Miles Canyon BasaltAquifer were found to meet all of the tested health related CDWQG (2002). Concentrations from alltested parameters in groundwater samples collected from the Miles Canyon Basalt Aquifer were alsofound to meet the YCSR Aquatic Life Standards (Yukon Department of Environment 2002).However, the average manganese concentration in analyzed groundwater from the Miles CanyonBasalt Aquifer was 0.13 mg/L, which exceeds the CDWQG AO for manganese (0.05 mg/L). Basedon other wells completed with the Miles Canyon Basalt Aquifer however, it is suspected thismarginal exceedance may also be related to slightly elevated turbidity and may decrease in time withadditional well development and/or future well usage.
9. A summary of well construction details and estimated aquifer properties is presented in Table 8below. The data presented from the Selkirk Aquifer was collected during the short-term pumpingtest described in this report. The data presented from the Miles Canyon Basalt Aquifer was collectedduring the 72-hr long-term pumping test described in Appendix B.

(2ra0212_jk.doc/22-292/2003) 38
Table 8. Summary of Results from TH02-01
ParameterSelkirk Aquifer
Step TestJuly 28, 2002
Miles Canyon Basalt Aquifer72-hr Pumping TestDec 3 - Dec 6, 2002
Total Well Depth (m bgs) 56.41 146.53Screen/Production Interval (m bgs) 55.34 – 56.41 60.4 – 143.1Static Water Level (m bgs) 4.85 5.08
Pumping Test Rate L/sec (minimum)
4.17 L/sec (maximum)8.98 L/sec (constant rate)
Pumping Test Duration 340 min. 72 hoursMaximum Observed Pumped Drawdown 1.63 m 39.28 mSafe Available Drawdown 54.9 m 60.4 mEstimated Average Aquifer Transmissivity 83 m2/day 18 m2/day (Dec, 2002)Observed Aquifer Thickness 5.5 m 82.7 mEstimated Hydraulic Conductivity 1.75 x 10⁻⁴ m/s 2.5 x 10⁻⁶ m/sEstimated Long-Term Well Capacity > 25 L/sec 10.6 L/secPumped Groundwater Temperatures 5.8 º C 7.1 º C

(2ra0212_jk.doc/22-292/2003) 39
5.2 Recommendations
Based on the conclusions, the principal recommendations of the project are:
1. Although both aquifers are productive and appear to be capable of providing a viable water sourcefor a groundwater heat pump system, it is recommended that the Selkirk Aquifer be selected as thepreferred water source for the Vanier School Project. The rationale for this recommendation is asfollows:
• The groundwater temperature differential between the two aquifers is slightly more than 1ºC, and therefore the Miles Canyon Basalt Aquifer does not appear to provide a significantthermal advantage.
• It is likely that a single production well in the Miles Canyon Basalt Aquifer at this location,regardless of diameter, may not be adequate to deliver the required flow rates.
• At the study location, drawdown levels in wells completed in the Miles Canyon BasaltAquifer will be greater than drawdown levels in wells completed in the Selkirk Aquifer.Consequently, pumping costs associated with well operations in the Mile Canyon BasaltAquifer will be higher.
• Water quality in the Selkirk Aquifer is marginally better than the Miles Canyon BasaltAquifer, and therefore maintenance issues associated with water quality are anticipated to bereduced.
• Due to the relatively high estimated hydraulic conductivity identified in the Selkirk Aquifer,injection of the discharge water back into this aquifer system will require a lower injectionpressure and therefore will be simpler to build operate and maintain.
2. Production well(s) for this project should be completed to a nominal diameter of at least 200 mm (8-inch) to accommodate submersible pumps capable of producing the required flow rates.Additionally, the pump should be set to a depth whereby a minimum 10 m water column will bemaintained above the pump at all times to reduce the potential for degassing of the groundwater (i.e.aeration) which can lead to a significant reduction in pump efficiency.
Report Prepared By:
Jonathan Kerr, M.Sc.Hydrogeologist

(2ra0212_jk.doc/22-292/2003) 40
6. References
B.C. Ministry of Environment, Lands and Parks, 1999:Evaluating Long-Term Well Capacity for a Certificate of Public Convenience and Necessity, AGuidance Document. Water Management Branch, Victorica, B.C.
Driscoll, F. G., 1986:Groundwater and Wells, Second Edition. Johnson Filtration Systems Inc., St. Paul, Minnesota.
Carrier Air Conditioning Company, 1965;Handbook of Air Conditioning System Design. McGraw-Hill Books, New York.
Gartner Lee Limited 2002:Vanier School Ground Source Heat Pump Project Site Setting and Conceptual Design. Preparedfor Energy Solution Centre. Whitehorse, Yukon.
Gartner Lee Limited 2003a:Wolf Creek/Pineridge Subdivisions Groundwater Quality Study. Prepared for Water Resources,Department of Indian and Northern Affairs Canada. Whitehorse, Yukon. In preparation.
Gartner Lee Limited 2003b:Wolf Creek Long-Term Observation Well. Prepared for Water Resources, Department of Indianand Northern Affairs Canada. Whitehorse, Yukon. In preparation.
Hantush, M.S. and C.E. Jacob, 1955:Non-steady radial flow in an infinite leaky aquifer, Am. Geophys. Union Trans., vol. 36, pp.95-100.
Hantush, M.S., 1961a:Drawdown around a partially penetrating well, Jour. of the Hyd. Div., Proc. of the Am. Soc. ofCivil Eng., vol. 87, no. HY4, pp. 83-98.
Hantush, M.S., 1961b:Aquifer tests on partially penetrating wells, Jour. of the Hyd. Div., Proc. of the Am. Soc. of CivilEng., vol. 87, no. HY5, pp. 171-194.
Health Canada 2002:Summary of Guidelines for Canadian Drinking Water Quality, prepared by the Federal-Provincial-Territorial Committee on Drinking Water of the Federal-Provincial-TerritorialCommittee on Environmental and Occupational Health, April, 2002.

(2ra0212_jk.doc/22-292/2003) 41
Mabillot, A., 1979:Le Forage D’Eau, Guide Pratique. D’Edit Offset a Saint Etienne, Loire, France.
Morgan and Winner, 1962, Hydrochemical facies in the 400 ft and 600 ft sands of the Baton Rouge Area,Louisiana, U.S. Geol. Surv. Prof. Paper 450_B, pp B120-121.
Pearson, F.K., C.J.R. Hart, and M. Powers, 2001:Distribution of Miles Canyon Basalt in the Whitehorse Area and Implications For Groundwater
Resources, Yukon Exploration and Geology, 2001. Yukon Geology Program, Whitehorse Yukon.
Rafferty, K., 2000:“Scaling in Geothermal Heat Pumps, Systems.” Geo-Heat Center, Klamath Falls, OR, 2000.Geo-Heat Center, Oregon Institute of Technology, Klamath Falls, OR.
Theis, 1935:The lowering of the piezometer surface and the rate and discharge of a well using ground-waterstorage. Transactions, American Geophysical Union 16:519-24
Morgan and Winner, 1962:Hydrochemical facies in the 400 ft and 600 ft sands of the Baton Rouge Area, Louisiana, U.S.Geol. Surv. Prof. Paper 450_B, pp B120-121.
WaterFurnace, 2002:Versatec Water-to-Water Heat Pumps: Nominal 15 and 30 Ton Capacities. Commercial ModelsSpecification Catalog. WF1063. Fort Wayne, IN.
Yukon Environment. 2002Yukon Contaminated Sites Regulations (YCSR). Generic Numerical Water Standards forAquatic Life.

Appendices Provided in Report Hardcopy