Vanguard STAR Fund · 2019-12-19 · • For the 12 months ended October 31, 2019, Vanguard STAR...
24
See the inside front cover for important information about access to your fund’s annual and semiannual shareholder reports. Annual Report | October 31, 2019 Vanguard STAR ® Fund
Transcript of Vanguard STAR Fund · 2019-12-19 · • For the 12 months ended October 31, 2019, Vanguard STAR...

See the inside front cover for important information about accessto your fund’s annual and semiannual shareholder reports.
Annual Report | October 31, 2019
Vanguard STAR® Fund

Contents
Please note: The opinions expressed in this report are just that—informed opinions. They should not be considered promisesor advice. Also, please keep in mind that the information and opinions cover the period through the date on the front of thisreport. Of course, the risks of investing in your fund are spelled out in the prospectus.
Important information about access to shareholder reports
Beginning on January 1, 2021, as permitted by regulations adopted by theSecurities and Exchange Commission, paper copies of your fund’s annual andsemiannual shareholder reports will no longer be sent to you by mail, unless youspecifically request them. Instead, you will be notified by mail each time a reportis posted on the website and will be provided with a link to access the report.
If you have already elected to receive shareholder reports electronically, you will notbe affected by this change and do not need to take any action. You may elect toreceive shareholder reports and other communications from the fund electronicallyby contacting your financial intermediary (such as a broker-dealer or bank) or, if youinvest directly with the fund, by calling Vanguard at one of the phone numbers onthe back cover of this report or by logging on to vanguard.com.
You may elect to receive paper copies of all future shareholder reports freeof charge. If you invest through a financial intermediary, you can contact theintermediary to request that you continue to receive paper copies. If you investdirectly with the fund, you can call Vanguard at one of the phone numbers on theback cover of this report or log on to vanguard.com. Your election to receive papercopies will apply to all the funds you hold through an intermediary or directly withVanguard.
A Note From Our Chairman. . . . . . . . . . . . . . . . . . . . . . . . . . 1
Your Fund’s Performance at a Glance. . . . . . . . . . . . . . . . . . 2
About Your Fund’s Expenses. . . . . . . . . . . . . . . . . . . . . . . . . 3
Performance Summary. . . . . . . . . . . . . . . . . . . . . . . . . . . . . .5
Financial Statements. . . . . . . . . . . . . . . . . . . . . . . . . . . . . . . 7

Dear Shareholder,
Recent volatility in financial markets—affecting stocks, bonds, and commodities— has been a good reminder of the wise old adage, “Never keep all your eggs in one basket.” Maintaining balance and diversification in your investment portfolio can help to both limit risk and set you up for long-term success.
It’s understandable why some investors might become complacent after a long market run-up like the one that lifted stock prices, especially U.S. stock prices, in the years following the global financial crisis. But failing to rebalance regularly can leave a portfolio with a much different mix of assets than intended and, often, more risk than intended.
Balance across and diversification within asset classes are powerful tools for managing risk and achieving your investment goals. A portfolio’s allocation will determine a large portion of its long- term return and also the majority of its volatility risk. A well-diversified portfolio is less vulnerable to significant swings in the performance of any one segment of the asset classes in which it invests.
Balance and diversification will never eliminate the risk of loss, nor will they guarantee positive returns in a declining market. But they should reduce the chance that you’ll suffer disproportionate losses in one particular high-flying asset class or sector when it comes back to earth. And exposure to all key market components should give you at least some participation in the sectors that are performing best at any given time.
Vanguard is committed to helping you achieve balance and diversification in your portfolios to help meet your invest-ment goals. We thank you for your continued loyalty.
Sincerely,
Mortimer J. Buckley Chairman and Chief Executive Officer November 18, 2019
A Note From Our Chairman
Tim BuckleyChairman and Chief Executive Officer
1

• For the 12 months ended October 31, 2019, Vanguard STAR Fund returned 12.72%,
ahead of the 12.18% return of its composite benchmark.
• The broad U.S. stock market climbed with support from the Federal Reserve’s
accommodative stance and from corporate earnings that largely exceeded investor
expectations. International stocks advanced but didn’t keep pace with their U.S.
counterparts. U.S. bond prices rose as yields declined.
• As a “fund of funds,” the STAR Fund reflects the combined results of ten underlying
actively managed Vanguard funds. Of those, the seven stock funds made up more than
62% of fund assets.
• The returns of the five underlying U.S. stock funds ranged from about 10% to more
than 15%. For the two underlying international stock funds, Vanguard International
Value Fund returned more than 8% and Vanguard International Growth Fund more
than 14%.
• The three U.S. bond funds that make up the remainder of STAR’s holdings generated
returns ranging from more than 6% to nearly 25%.
Your Fund’s Performance at a Glance
Market Barometer Average Annual Total Returns
Periods Ended October 31, 2019
One Year Three Years Five Years
Stocks
Russell 1000 Index (Large-caps) 14.15% 14.73% 10.55%
Russell 2000 Index (Small-caps) 4.90 10.96 7.37
Russell 3000 Index (Broad U.S. market) 13.49 14.47 10.31
FTSE All-World ex US Index (International) 11.52 8.21 4.16
Bonds
Bloomberg Barclays U.S. Aggregate Bond Index
(Broad taxable market) 11.51% 3.29% 3.24%
Bloomberg Barclays Municipal Bond Index
(Broad tax-exempt market) 9.42 3.62 3.55
FTSE Three-Month U.S. Treasury Bill Index 2.35 1.57 0.98
CPI
Consumer Price Index 1.76% 2.11% 1.62%
2

About Your Fund’s Expenses
3
As a shareholder of the fund, you incur ongoing costs, which include costs for portfolio management, administrative services, and shareholder reports (like this one), among others. Operating expenses, which are deducted from a fund’s gross income, directly reduce the investment return of the fund.
A typical fund’s expenses are expressed as a percentage of its average net assets. The STAR Fund has no direct expenses, but bears its proportionate share of the costs for the underlying funds in which it invests. These indirect expenses make up the acquired fund fees and expenses, also expressed as a percentage of average net assets.
The following examples are intended to help you understand the ongoing cost (in dollars) of investing in your fund and to compare these costs with those of other mutual funds. The examples are based on an investment of $1,000 made at the beginning of the period shown and held for the entire period. The costs were calculated using the acquired fund fees and expenses for the STAR Fund.
The accompanying table illustrates your fund’s costs in two ways:
• Based on actual fund return. This section helps you to estimate the actual expenses that you paid over the period. The ”Ending Account Value“ shown is derived from the fund‘s actual return, and the third column shows the dollar amount that would have been paid by an investor who started with $1,000 in the fund. You may use the information here, together with the amount you invested, to estimate the expenses that you paid over the period.
To do so, simply divide your account value by $1,000 (for example, an $8,600 account value divided by $1,000 = 8.6), then multiply the result by the number given for your fund under the heading ”Expenses Paid During Period.“
• Based on hypothetical 5% yearly return. This section is intended to help you compare your fund‘s costs with those of other mutual funds. It assumes that the fund had a yearly return of 5% before expenses, but that the expense ratio is unchanged. In this case—because the return used is not the fund’s actual return—the results do not apply to your investment. The example is useful in making comparisons because the Securities and Exchange Commission requires all mutual funds to calculate expenses based on a 5% return. You can assess your fund’s costs by comparing this hypothetical example with the hypothetical examples that appear in shareholder reports of other funds.
Note that the expenses shown in the table are meant to highlight and help you compare ongoing costs only and do not reflect transaction costs incurred by the fund for buying and selling securities. Further, the expenses do not include any purchase, redemption, or account service fees described in the fund prospectus. If such fees were applied to your account, your costs would be higher. Your fund does not carry a “sales load.”
The calculations assume no shares were bought or sold during the period. Your actual costs may have been higher or lower, depending on the amount of your investment and the timing of any purchases or redemptions.
You can find more information about the fund’s expenses, including annual expense ratios, in the Financial Statements section of this report. For additional information on operating expenses and other shareholder costs, please refer to your fund’s current prospectus.

4
Six Months Ended October 31, 2019
STAR Fund
BeginningAccount Value
4/30/2019
EndingAccount Value
10/31/2019
ExpensesPaid During
Period
Based on Actual Fund Return $1,000.00 $1,038.44 $1.59
Based on Hypothetical 5% Yearly Return 1,000.00 1,023.64 1.58
The calculations are based on acquired fund fees and expenses charged by the underlying mutual funds in which the STAR Fund invests.The STAR Fund’s annualized expense figure for the period is 0.31%. The dollar amounts shown as ”Expenses Paid” are equal to theannualized average weighted expense ratio for the underlying funds multiplied by the average account value over the period, multiplied bythe number of days in the most recent six-month period, then divided by the number of days in the most recent 12-month period (184/365).

All of the returns in this report represent past performance, which is not a guarantee of future results that may be achieved by the fund. (Current performance may be lower or higher thanthe performance data cited. For performance data current to the most recent month-end, visitour website at vanguard.com/performance.) Note, too, that both investment returns and principal value can fluctuate widely, so an investor’s shares, when sold, could be worth more or less than their original cost. The returns shown do not reflect taxes that a shareholder would pay on fund distributions or on the sale of fund shares.
Performance Summary
See Financial Highlights for dividend and capital gains information.
STAR Fund
5
Cumulative Performance: October 31, 2009, Through October 31, 2019Initial Investment of $10,000
2019201820172016201520142013201220112010
$38,000
7,000
23,671
Average Annual Total ReturnsPeriods Ended October 31, 2019
OneYear
FiveYears
TenYears
Final Valueof a $10,000Investment
STAR Fund 12.72% 6.99% 9.00% $23,671
• • • • • • • • STAR Composite Index 12.18 6.64 8.50 22,618
________ Dow Jones U.S. Total Stock MarketFloat Adjusted Index 13.39 10.26 13.62 35,859
STAR Composite Index: 62.5% Dow Jones U.S. Total Stock Market Index, 25% Bloomberg Barclays U.S. Aggregate Bond Index, and 12.5%Citigroup 3 Month U.S. Treasury Bill Index through December 31, 2002; 50% Dow Jones U.S. Total Stock Market Index, 25% BloombergBarclays U.S. Aggregate Bond Index, 12.5% Bloomberg Barclays U.S. 1–5 Year Credit Bond Index, and 12.5% MSCI EAFE Index throughApril 22, 2005; 50% MSCI US Broad Market Index, 25% Bloomberg Barclays U.S. Aggregate Bond Index, 12.5% Bloomberg Barclays U.S.1–5 Year Credit Bond Index, and 12.5% MSCI EAFE Index through September 30, 2010; and 43.75% MSCI US Broad Market Index, 25%Bloomberg Barclays U.S. Aggregate Bond Index, 12.5% Bloomberg Barclays U.S. 1–5 Year Credit Bond Index, and 18.75% MSCI AllCountry World Index ex USA thereafter. MSCI international benchmark returns are adjusted for withholding taxes.
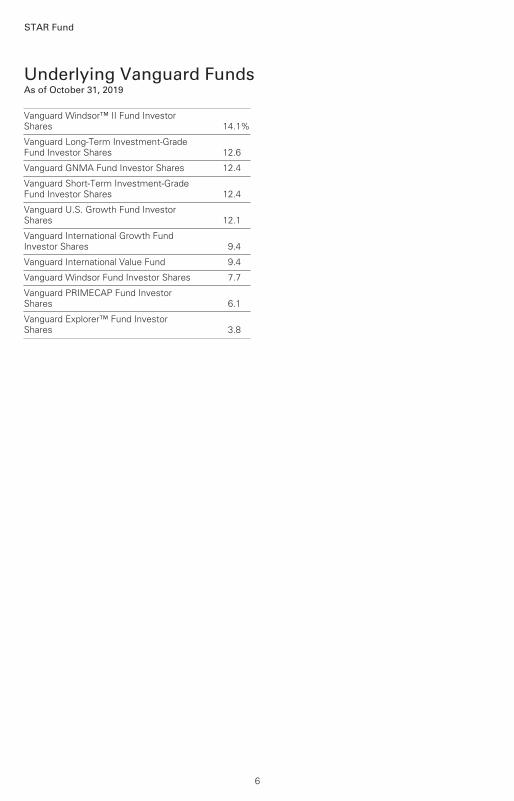
Underlying Vanguard FundsAs of October 31, 2019
STAR Fund
6
Vanguard Windsor™ II Fund InvestorShares 14.1%
Vanguard Long-Term Investment-GradeFund Investor Shares 12.6
Vanguard GNMA Fund Investor Shares 12.4
Vanguard Short-Term Investment-GradeFund Investor Shares 12.4
Vanguard U.S. Growth Fund InvestorShares 12.1
Vanguard International Growth FundInvestor Shares 9.4
Vanguard International Value Fund 9.4
Vanguard Windsor Fund Investor Shares 7.7
Vanguard PRIMECAP Fund InvestorShares 6.1
Vanguard Explorer™ Fund InvestorShares 3.8

Investment Companies (100.0%)
U.S. Stock Funds (43.8%)
Vanguard Windsor II Fund Investor Shares 84,736,016 3,153,875
Vanguard U.S. Growth Fund Investor Shares 64,583,985 2,683,465
Vanguard Windsor Fund Investor Shares 78,767,336 1,713,977
Vanguard PRIMECAP Fund Investor Shares 9,714,460 1,345,064
Vanguard Explorer Fund Investor Shares 8,215,928 835,231
9,731,612
International Stock Funds (18.8%)
Vanguard International Growth Fund Investor Shares 70,088,969 2,093,558
Vanguard International Value Fund 57,164,812 2,093,375
4,186,933
U.S. Bond Funds (37.4%)
Vanguard Long-Term Investment-Grade Fund Investor Shares 249,238,833 2,793,967
Vanguard GNMA Fund Investor Shares 260,754,370 2,758,781
Vanguard Short-Term Investment-Grade Fund Investor Shares 256,187,621 2,754,017
8,306,765
Total Investment Companies (Cost $14,517,761) 22,225,310
Temporary Cash Investment (0.0%)
Money Market Fund (0.0%)1 Vanguard Market Liquidity Fund, 1.984% (Cost $1,845) 18,450 1,845
Total Investments (100.0%) (Cost $14,519,606) 22,227,155
Other Assets and Liabilities (0.0%)
Other Assets 64,199
Liabilities (66,654)
(2,455)
Net Assets (100%)
Applicable to 807,938,848 outstanding $.001 par value shares of
beneficial interest (unlimited authorization) 22,224,700
Net Asset Value Per Share $27.51
Market
Value•
Shares ($000)
STAR Fund
Statement of Net AssetsAs of October 31, 2019
Financial Statements
The fund files its complete schedule of portfolio holdings with the Securities and Exchange
Commission (SEC) for the first and third quarters of each fiscal year as an exhibit to its reports
on Form N-PORT. The fund’s Form N-PORT reports are available on the SEC’s website at
www.sec.gov.
7

STAR Fund
Statement of Assets and Liabilities
Assets
Investments in Securities, at Value—Affiliated Funds 22,227,155
Receivables for Investment Securities Sold 40,507
Receivables for Capital Shares Issued 3,560
Receivables for Accrued Income 20,132
Total Assets 22,291,354
Liabilities
Payables for Investment Securities Purchased 20,132
Payables for Capital Shares Redeemed 46,522
Total Liabilities 66,654
Net Assets 22,224,700
At October 31, 2019, net assets consisted of:
Amount
($000)
Paid-in Capital 13,590,914
Total Distributable Earnings (Loss) 8,633,786
Net Assets 22,224,700
• See Note A in Notes to Financial Statements.
1 Affiliated money market fund available only to Vanguard funds and certain trusts and accounts managed by Vanguard. Rate shown is the 7-day yield.
Amount
($000)
See accompanying Notes, which are an integral part of the Financial Statements.
8

Year Ended October 31, 2019
($000)
Investment Income
Income
Income Distributions Received from Affiliated Funds 469,974
Net Investment Income—Note B 469,974
Realized Net Gain (Loss)
Capital Gain Distributions Received from Affiliated Funds 960,488
Affiliated Funds Sold 28,089
Realized Net Gain (Loss) 988,577
Change in Unrealized Appreciation (Depreciation) from Affiliated Funds 1,098,776
Net Increase (Decrease) in Net Assets Resulting from Operations 2,557,327
Statement of Operations
STAR Fund
See accompanying Notes, which are an integral part of the Financial Statements.
9

Statement of Changes in Net Assets
STAR Fund
See accompanying Notes, which are an integral part of the Financial Statements.
Year Ended October 31,
2019 2018
($000) ($000)
Increase (Decrease) in Net Assets
Operations
Net Investment Income 469,974 430,097
Realized Net Gain (Loss) 988,577 868,774
Change in Unrealized Appreciation (Depreciation) 1,098,776 (1,168,247)
Net Increase (Decrease) in Net Assets Resulting from Operations 2,557,327 130,624
Distributions
Net Investment Income (488,116) (405,043)
Realized Capital Gain1 (818,346) (556,667)
Total Distributions (1,306,462) (961,710)
Capital Share Transactions
Issued 1,219,901 1,734,769
Issued in Lieu of Cash Distributions 1,238,073 916,139
Redeemed (2,282,638) (2,291,074)
Net Increase (Decrease) from Capital Share Transactions 175,336 359,834
Total Increase (Decrease) 1,426,201 (471,252)
Net Assets
Beginning of Period 20,798,499 21,269,751
End of Period 22,224,700 20,798,499
1 Includes fiscal 2019 and 2018 short-term gain distributions totaling $94,461,000 and $126,242,000, respectively. Short-term gain distributions are treated as ordinary income dividends for tax purposes.
10

For a Share Outstanding Year Ended October 31,
Throughout Each Period 2019 2018 2017 2016 2015
Net Asset Value, Beginning of Period $26.10 $27.15 $24.32 $24.76 $25.27
Investment Operations
Net Investment Income .5761 .5371 .5031 .470 .523
Capital Gain Distributions Received 1.1771 .7111 .4701 .683 .319
Net Realized and Unrealized Gain (Loss)
on Investments 1.310 (1.070) 2.993 (.293) (.329)
Total from Investment Operations 3.063 .178 3.966 .860 .513
Distributions
Dividends from Net Investment Income (.613) (.514) (.499) (.477) (.530)
Distributions from Realized Capital Gains (1.040) (.714) (.637) (.823) (.493)
Total Distributions (1.653) (1.228) (1.136) (1.300) (1.023)
Net Asset Value, End of Period $27.51 $26.10 $27.15 $24.32 $24.76
Total Return2 12.72% 0.54% 16.96% 3.68% 2.03%
Ratios/Supplemental Data
Net Assets, End of Period (Millions) $22,225 $20,798 $21,270 $18,715 $18,830
Ratio of Total Expenses to Average Net Assets — — — — —
Acquired Fund Fees and Expenses 0.31% 0.31% 0.32% 0.32% 0.34%
Ratio of Net Investment Income to
Average Net Assets 2.20% 1.98% 1.98% 1.95% 2.06%
Portfolio Turnover Rate 14% 11% 7% 12% 8%
1 Calculated based on average shares outstanding.
2 Total returns do not include account service fees that may have applied in the periods shown. Fund prospectuses provide information about any applicable account service fees.
Financial Highlights
See accompanying Notes, which are an integral part of the Financial Statements.
STAR Fund
11

Notes to Financial Statements
STAR Fund
Vanguard STAR Fund is registered under the Investment Company Act of 1940 as an open-end
investment company, or mutual fund. The fund follows a balanced investment strategy by
investing in selected Vanguard funds. The fund invests 60% to 70% of its net assets in stock
funds (predominantly large-capitalization U.S. stock funds), 20% to 30% in intermediate- to
long-term bond funds, and 10% to 20% in a short-term bond fund. Financial statements and
other information about each underlying fund are available on vanguard.com.
A. The following significant accounting policies conform to generally accepted accounting
principles for U.S. investment companies. The fund consistently follows such policies in preparing
its financial statements.
1. Security Valuation: Investments are valued at the net asset value of each underlying Vanguard
fund determined as of the close of the New York Stock Exchange (generally 4 p.m., Eastern time)
on the valuation date.
2. Federal Income Taxes: The fund intends to continue to qualify as a regulated investment
company and distribute all of its taxable income. Management has analyzed the fund’s tax positions
taken for all open federal income tax years (October 31, 2016–2019), and has concluded that no
provision for federal income tax is required in the fund’s financial statements.
3. Distributions: Distributions to shareholders are recorded on the ex-dividend date. Distributions
are determined on a tax basis and may differ from net investment income and realized capital gains
for financial reporting purposes.
4. Credit Facility: The fund and certain other funds managed by The Vanguard Group (“Vanguard”)
participate in a $4.3 billion committed credit facility provided by a syndicate of lenders pursuant to
a credit agreement that may be renewed annually; each fund is individually liable for its borrowings,
if any, under the credit facility. Borrowings may be utilized for temporary and emergency purposes,
and are subject to the fund’s regulatory and contractual borrowing restrictions. The participating
funds are charged administrative fees and an annual commitment fee of 0.10% of the undrawn
amount of the facility; these fees are allocated to the funds based on a method approved by the
fund’s board of trustees and borne by the funds in which the fund invests (see Note B). Any
borrowings under this facility bear interest at a rate based upon the higher of the one-month
London Interbank Offered Rate, federal funds effective rate, or overnight bank funding rate plus
an agreed-upon spread.
The fund had no borrowings outstanding at October 31, 2019, or at any time during the period
then ended.
5. Other: Income and capital gain distributions received are recorded on the ex-dividend date.
Security transactions are accounted for on the date securities are bought or sold. Costs used to
determine realized gains (losses) on the sale of investment securities are those of the specific
securities sold.
B. In accordance with the terms of a Funds’ Service Agreement (the “FSA”) between Vanguard
and the fund, Vanguard furnishes to the fund investment advisory, corporate management,
administrative, marketing, and distribution services at Vanguard’s cost of operations (as defined
by the FSA). These costs of operations are allocated to the fund based on methods and guidelines
approved by the board of trustees. The FSA provides that expenses otherwise allocable to
Vanguard funds-of-funds may be reduced or eliminated to the extent of savings realized by the
12

STAR Fund
underlying Vanguard funds by virtue of being part of a fund-of-funds. Accordingly, all expenses
for services provided by Vanguard to the fund and all other expenses incurred by the fund during
the period ended October 31, 2019, were borne by the underlying Vanguard funds in which the
fund invests. The fund’s trustees and officers are also trustees and officers, respectively, of the
underlying Vanguard funds, as well as directors and employees, respectively, of Vanguard.
C. Various inputs may be used to determine the value of the fund’s investments. These inputs are
summarized in three broad levels for financial statement purposes. The inputs or methodologies
used to value securities are not necessarily an indication of the risk associated with investing in
those securities.
Level 1—Quoted prices in active markets for identical securities.
Level 2—Other significant observable inputs (including quoted prices for similar securities, interest
rates, prepayment speeds, credit risk, etc.).
Level 3—Significant unobservable inputs (including the fund’s own assumptions used to determine
the fair value of investments). Any investments valued with significant unobservable inputs are
noted on the Statement of Net Assets.
At October 31, 2019, 100% of the market value of the fund’s investments was determined based
on Level 1 inputs.
D. Permanent differences between book-basis and tax-basis components of net assets are
reclassified among capital accounts in the financial statements to reflect their tax character.
These reclassifications have no effect on net assets or net asset value per share. As of period
end, permanent differences primarily attributable to the accounting for distributions in connection
with fund share redemptions were reclassified between the following accounts:
Amount
($000)
Paid-in Capital 76,627
Total Distributable Earnings (Loss) (76,627)
Temporary differences between book-basis and tax-basis components of total distributable
earnings (loss) arise when certain items of income, gain, or loss are recognized in different periods
for financial statement and tax purposes; these differences will reverse at some time in the future.
The differences are primarily related to the tax deferral of losses on wash sales. As of period end,
the tax-basis components of total distributable earnings (loss) are detailed in the table as follows:
Amount
($000)
Undistributed Ordinary Income 106,482
Undistributed Long-Term Gains 819,755
Capital Loss Carryforwards (Non-Expiring) —
Net Unrealized Gains (Losses) 7,707,549
13

STAR Fund
As of October 31, 2019, gross unrealized appreciation and depreciation for investments based on
cost for U.S. federal income tax purposes were as follows:
Amount
($000)
Tax Cost 14,519,606
Gross Unrealized Appreciation 7,717,376
Gross Unrealized Depreciation (9,827)
Net Unrealized Appreciation (Depreciation) 7,707,549
E. Capital shares issued and redeemed were:
Year Ended October 31,
2019 2018
Shares Shares
(000) (000)
Issued 46,933 63,732
Issued in Lieu of Cash Distributions 51,615 34,030
Redeemed (87,627) (84,239)
Net Increase (Decrease) in Shares Outstanding 10,921 13,523
14

15
STAR Fund
F. Transactions during the period in affiliated underlying Vanguard funds were as follows:
Current Period Transactions
Oct. 31, Proceeds Realized Oct. 31, 2018 from Net Change in Capital Gain 2019 Market Purchases Securities Gain Unrealized Distributions Market Value at Cost Sold1 (Loss) App. (Dep.) Income Received Value ($000) ($000) ($000) ($000) ($000) ($000) ($000) ($000)
Vanguard Market Liquidity Fund 1 NA2 NA2 1 — 21 — 1,845
Vanguard Explorer Fund 786,050 119,337 81,685 1,470 10,059 2,201 68,315 835,231
Vanguard GNMA Fund 2,604,411 422,255 403,846 (7,202) 143,163 76,575 — 2,758,781
Vanguard International Growth Fund 1,938,719 168,298 196,094 (238) 182,873 28,357 65,254 2,093,558
Vanguard International Value Fund 1,933,873 180,726 81,559 (5,436) 65,771 50,849 57,164 2,093,375
Vanguard Long-Term Investment-Grade Fund 2,588,373 332,271 624,039 4,282 493,080 106,027 — 2,793,967
Vanguard Morgan™ Growth Fund3 1,256,033 329,531 123,787 3,445 (775,712) 9,228 233,344 —
Vanguard PRIMECAP Fund 1,261,409 185,743 151,160 16,001 33,071 13,730 76,983 1,345,064
Vanguard Short-Term Investment-Grade Fund 2,603,243 395,244 329,358 (2,362) 87,250 75,860 — 2,754,017
Vanguard U.S. Growth Fund3 1,259,640 300,375 369,713 15,680 802,430 4,201 98,515 2,683,465
Vanguard Windsor Fund 1,609,089 332,625 246,001 2,510 15,754 32,649 142,633 1,713,977
Vanguard Windsor II Fund 2,958,651 543,474 389,225 (62) 41,037 70,276 218,280 3,153,875
Total 20,799,492 3,309,879 2,996,467 28,089 1,098,776 469,974 960,488 22,227,155
1 Does not include adjustments related to return of capital.
2 Not applicable—purchases and sales are for temporary cash investment purposes.
3 In April 2019, Vanguard Morgan Growth Fund reorganized with and into Vanguard U.S. Growth Fund through a tax-free reorganization. As a result of the merger, the fund received shares of Vanguard U.S. Growth Fund valued at $1,340,882,000, which consisted of cost of $689,510,000 and unrealized appreciation of $651,372,000.
G. Management has determined that no events or transactions occurred subsequent to October 31, 2019, that would require recognition or disclosure in these financial statements.

To the Board of Trustees of Vanguard STAR Funds and Shareholders of Vanguard STAR Fund
Opinion on the Financial Statements
We have audited the accompanying statement of net assets and statement of assets and liabilities of Vanguard STAR Fund (one of the funds constituting Vanguard STAR Funds, referred to hereafter as the “Fund”) as of October 31, 2019, the related statement of operations for the year ended October 31, 2019, the statement of changes in net assets for each of the two years in the period ended October 31, 2019, including the related notes, and the financial highlights for each of the five years in the period ended October 31, 2019 (collectively referred to as the “financial statements”). In our opinion, the financial statements present fairly, in all material respects, the financial position of the Fund as of October 31, 2019, the results of its operations for the year then ended, the changes in its net assets for each of the two years in the period ended October 31, 2019 and the financial highlights for each of the five years in the period ended October 31, 2019 in conformity with accounting principles generally accepted in the United States of America.
Basis for Opinion
These financial statements are the responsibility of the Fund’s management. Our responsibility is to express an opinion on the Fund’s financial statements based on our audits. We are a public accounting firm registered with the Public Company Accounting Oversight Board (United States) (“PCAOB”) and are required to be independent with respect to the Fund in accordance with the U.S. federal securities laws and the applicable rules and regulations of the Securities and Exchange Commission and the PCAOB.
We conducted our audits of these financial statements in accordance with the standards of the PCAOB. Those standards require that we plan and perform the audit to obtain reasonable assurance about whether the financial statements are free of material misstatement, whether due to error or fraud.
Our audits included performing procedures to assess the risks of material misstatement of the financial statements, whether due to error or fraud, and performing procedures that respond to those risks. Such procedures included examining, on a test basis, evidence regarding the amounts and disclosures in the financial statements. Our audits also included evaluating the accounting principles used and significant estimates made by management, as well as evaluating the overall presentation of the financial statements. Our procedures included confirmation of securities owned as of October 31, 2019 by correspondence with the transfer agent. We believe that our audits provide a reasonable basis for our opinion.
/s/PricewaterhouseCoopers LLP Philadelphia, Pennsylvania December 13, 2019
We have served as the auditor of one or more investment companies in The Vanguard Group of Funds since 1975.
Report of Independent Registered Public Accounting Firm
16

Special 2019 tax information (unaudited) for Vanguard STAR Fund
This information for the fiscal year ended October 31, 2019, is included pursuant to provisions
of the Internal Revenue Code.
The fund distributed $798,588,000 as capital gain dividends (20% rate gain distributions) to
shareholders during the fiscal year.
For nonresident alien shareholders, 100% of short-term capital gain dividends distributed by
the fund are qualified short-term capital gains.
The fund distributed $202,132,000 of qualified dividend income to shareholders during the
fiscal year.
For corporate shareholders, 21.7% of investment income (dividend income plus short-term gains,
if any) qualifies for the dividends-received deduction.
The fund designates to shareholders foreign source income of $85,978,000 and foreign taxes paid
of $6,774,000. Shareholders will receive more detailed information with their Form 1099-DIV in
January 2020 to determine the calendar-year amounts to be included on their 2019 tax returns.
17

BLOOMBERG is a trademark and service mark of Bloomberg Finance L.P. BARCLAYS is a trademark and service mark
of Barclays Bank Plc, used under license. Bloomberg Finance L.P. and its affiliates, including Bloomberg Index Services
Limited (BISL) (collectively, Bloomberg), or Bloomberg’s licensors, own all proprietary rights in the Bloomberg Barclays
U.S. Aggregate Bond Index and Bloomberg Barclays U.S. 1–5 Year Credit Bond Index (the Indices or Bloomberg
Barclays Indices).
Neither Barclays Bank Plc, Barclays Capital Inc., or any affiliate (collectively Barclays) or Bloomberg is the issuer or
producer of the STAR Fund (including the Long-Term Investment-Grade Fund, GNMA Fund, and Short-Term Investment-
Grade Fund) and neither Bloomberg nor Barclays has any responsibilities, obligations or duties to investors in the STAR
Fund. The Indices are licensed for use by The Vanguard Group, Inc. (Vanguard) as the sponsor of the STAR Fund. Bloomberg
and Barclays’ only relationship with Vanguard in respect to the Indices is the licensing of the Indices, which is determined,
composed and calculated by BISL, or any successor thereto, without regard to the Issuer or the STAR Fund or the owners
of the STAR Fund.
Additionally, Vanguard may for itself execute transaction(s) with Barclays in or relating to the Indices in connection with
the STAR Fund. Investors acquire the STAR Fund from Vanguard and investors neither acquire any interest in the Indices
nor enter into any relationship of any kind whatsoever with Bloomberg or Barclays upon making an investment in the
STAR Fund. The STAR Fund is not sponsored, endorsed, sold or promoted by Bloomberg or Barclays. Neither Bloomberg
nor Barclays makes any representation or warranty, express or implied regarding the advisability of investing in the STAR
Fund or the advisability of investing in securities generally or the ability of the Indices to track corresponding or relative
market performance. Neither Bloomberg nor Barclays has passed on the legality or suitability of the STAR Fund with
respect to any person or entity. Neither Bloomberg nor Barclays is responsible for and has not participated in the
determination of the timing of, prices at, or quantities of the STAR Fund to be issued. Neither Bloomberg nor Barclays
has any obligation to take the needs of the Issuer or the owners of the STAR Fund or any other third party into
consideration in determining, composing or calculating the Indices. Neither Bloomberg nor Barclays has any
obligation or liability in connection with administration, marketing or trading of the STAR Fund.
The licensing agreement between Bloomberg and Barclays is solely for the benefit of Bloomberg and Barclays and not for
the benefit of the owners of the STAR Fund, investors or other third parties. In addition, the licensing agreement between
Vanguard and Bloomberg is solely for the benefit of Vanguard and Bloomberg and not for the benefit of the owners of the
STAR Fund, investors or other third parties.
NEITHER BLOOMBERG NOR BARCLAYS SHALL HAVE ANY LIABILITY TO THE ISSUER, INVESTORS OR TO OTHER THIRD
PARTIES FOR THE QUALITY, ACCURACY AND/OR COMPLETENESS OF THE BLOOMBERG BARCLAYS INDICES OR ANY
DATA INCLUDED THEREIN OR FOR INTERRUPTIONS IN THE DELIVERY OF THE BLOOMBERG BARCLAYS INDICES.
NEITHER BLOOMBERG NOR BARCLAYS MAKES ANY WARRANTY, EXPRESS OR IMPLIED, AS TO RESULTS TO BE
OBTAINED BY THE ISSUER, THE INVESTORS OR ANY OTHER PERSON OR ENTITY FROM THE USE OF THE BLOOMBERG
BARCLAYS INDICES OR ANY DATA INCLUDED THEREIN. NEITHER BLOOMBERG NOR BARCLAYS MAKES ANY EXPRESS
OR IMPLIED WARRANTIES, AND EACH HEREBY EXPRESSLY DISCLAIMS ALL WARRANTIES OF MERCHANTABILITY
OR FITNESS FOR A PARTICULAR PURPOSE OR USE WITH RESPECT TO BLOOMBERG BARCLAYS INDICES OR ANY
DATA INCLUDED THEREIN. BLOOMBERG RESERVES THE RIGHT TO CHANGE THE METHODS OF CALCULATION OR
PUBLICATION, OR TO CEASE THE CALCULATION OR PUBLICATION OF THE BLOOMBERG BARCLAYS INDICES, AND
NEITHER BLOOMBERG NOR BARCLAYS SHALL BE LIABLE FOR ANY MISCALCULATION OF OR ANY INCORRECT,
DELAYED OR INTERRUPTED PUBLICATION WITH RESPECT TO ANY OF THE BLOOMBERG BARCLAYS INDICES.
NEITHER BLOOMBERG NOR BARCLAYS SHALL BE LIABLE FOR ANY DAMAGES, INCLUDING, WITHOUT LIMITATION,
ANY SPECIAL, INDIRECT OR CONSEQUENTIAL DAMAGES, OR ANY LOST PROFITS AND EVEN IF ADVISED OF THE
POSSIBILITY OF SUCH, RESULTING FROM THE USE OF BLOOMBERG BARCLAYS INDICES OR ANY DATA INCLUDED
THEREIN OR WITH RESPECT TO THE STAR FUND.
None of the information supplied by Bloomberg or Barclays and used in this publication may be reproduced in any manner
without the prior written permission of both Bloomberg and Barclays Capital, the investment banking division of Barclays
Bank Plc. Barclays Bank Plc is registered in England No. 1026167. Registered office 1 Churchill Place London E14 5HP.
© 2019 Bloomberg. Used with Permission.
Source: Bloomberg Index Services Limited. Copyright 2019, Bloomberg. All rights reserved.
18

The People Who Govern Your Fund
The trustees of your mutual fund are there to see that the fund is operated and managed in your
best interests since, as a shareholder, you are a part owner of the fund. Your fund’s trustees also
serve on the board of directors of The Vanguard Group, Inc., which is owned by the Vanguard
funds and provides services to them.
A majority of Vanguard’s board members are independent, meaning that they have no affiliation
with Vanguard or the funds they oversee, apart from the sizable personal investments they have
made as private individuals. The independent board members have distinguished backgrounds
in business, academia, and public service. Each of the trustees and executive officers oversees
213 Vanguard funds.
Information for each trustee and executive officer of the fund appears below. That information,
as well as the Vanguard fund count, is as of the date on the cover of this fund report. The mailing
address of the trustees and officers is P.O. Box 876, Valley Forge, PA 19482. More information
about the trustees is in the Statement of Additional Information, which can be obtained, without
charge, by contacting Vanguard at 800-662-7447, or online at vanguard.com.
Interested Trustee1
Mortimer J. Buckley
Born in 1969. Trustee since January 2018. Principal
occupation(s) during the past five years and other
experience: chairman of the board (January 2019–
present) of Vanguard and of each of the investment
companies served by Vanguard; chief executive officer
(January 2018–present) of Vanguard; chief executive
officer, president, and trustee (January 2018–present)
of each of the investment companies served by
Vanguard; president and director (2017–present) of
Vanguard; and president (February 2018–present) of
Vanguard Marketing Corporation. Chief investment
officer (2013–2017), managing director (2002–2017),
head of the Retail Investor Group (2006–2012), and
chief information officer (2001–2006) of Vanguard.
Chairman of the board (2011–2017) and trustee
(2009–2017) of the Children’s Hospital of Philadelphia;
trustee (2018–present) of The Shipley School.
Independent Trustees
Emerson U. Fullwood
Born in 1948. Trustee since January 2008. Principal
occupation(s) during the past five years and other
experience: executive chief staff and marketing officer
for North America and corporate vice president (retired
2008) of Xerox Corporation (document management
products and services). Former president of the
Worldwide Channels Group, Latin America, and
Worldwide Customer Service and executive chief
staff officer of Developing Markets of Xerox. Executive
in residence and 2009–2010 Distinguished Minett
Professor at the Rochester Institute of Technology.
Director of SPX FLOW, Inc. (multi-industry manufac-
turing). Director of the University of Rochester Medical
Center, the Monroe Community College Foundation,
the United Way of Rochester, North Carolina A&T
University, and Roberts Wesleyan College. Trustee
of the University of Rochester.
Amy Gutmann
Born in 1949. Trustee since June 2006. Principal
occupation(s) during the past five years and other
experience: president (2004–present) of the University
of Pennsylvania. Christopher H. Browne Distinguished
Professor of Political Science, School of Arts and
Sciences, and professor of communication, Annenberg
School for Communication, with secondary faculty
appointments in the Department of Philosophy, School
of Arts and Sciences, and at the Graduate School of
Education, University of Pennsylvania. Trustee of the
National Constitution Center.
F. Joseph Loughrey
Born in 1949. Trustee since October 2009. Principal
occupation(s) during the past five years and other
experience: president and chief operating officer
(retired 2009) and vice chairman of the board
(2008–2009) of Cummins Inc. (industrial machinery).
Chairman of the board of Hillenbrand, Inc. (specialized
consumer services), and the Lumina Foundation.
1 Mr. Buckley is considered an “interested person,” as defined in the Investment Company Act of 1940, because he is an officer of the Vanguard funds.

Director of the V Foundation and Oxfam America.
Member of the advisory council for the College of
Arts and Letters and chair of the advisory board to
the Kellogg Institute for International Studies, both
at the University of Notre Dame.
Mark Loughridge
Born in 1953. Trustee since March 2012. Principal
occupation(s) during the past five years and other
experience: senior vice president and chief financial
officer (retired 2013) of IBM (information technology
services). Fiduciary member of IBM’s Retirement
Plan Committee (2004–2013), senior vice president
and general manager (2002–2004) of IBM Global
Financing, vice president and controller (1998–2002)
of IBM, and a variety of other prior management roles
at IBM. Member of the Council on Chicago Booth.
Scott C. Malpass
Born in 1962. Trustee since March 2012. Principal
occupation(s) during the past five years and other
experience: chief investment officer (1989–present)
and vice president (1996–present) of the University
of Notre Dame. Assistant professor of finance at the
Mendoza College of Business, University of Notre
Dame, and member of the Notre Dame 403(b)
Investment Committee. Chairman of the board of
TIFF Advisory Services, Inc. Member of the board
of Catholic Investment Services, Inc. (investment
advisors) and the board of superintendence
of the Institute for the Works of Religion.
Deanna Mulligan
Born in 1963. Trustee since January 2018. Principal
occupation(s) during the past five years and other
experience: president (2010–present) and chief
executive officer (2011–present) of The Guardian
Life Insurance Company of America. Chief operating
officer (2010–2011) and executive vice president
(2008–2010) of Individual Life and Disability of
The Guardian Life Insurance Company of America.
Member of the board of The Guardian Life Insurance
Company of America, the American Council of Life
Insurers, the Partnership for New York City (business
leadership), and the Committee Encouraging Corporate
Philanthropy. Trustee of the Economic Club of New
York and the Bruce Museum (arts and science).
Member of the Advisory Council for the Stanford
Graduate School of Business.
André F. Perold
Born in 1952. Trustee since December 2004. Principal
occupation(s) during the past five years and other
experience: George Gund Professor of Finance and
Banking, Emeritus at the Harvard Business School
(retired 2011). Chief investment officer and co-
managing partner of HighVista Strategies (private
investment firm). Board of advisors and investment
committee member of the Museum of Fine Arts
Boston. Board member (2018–present) of RIT Capital
Partners (investment firm); investment committee
member of Partners Health Care System.
Sarah Bloom Raskin
Born in 1961. Trustee since January 2018. Principal
occupation(s) during the past five years and other
experience: deputy secretary (2014–2017) of
the United States Department of the Treasury.
Governor (2010–2014) of the Federal Reserve
Board. Commissioner (2007–2010) of financial
regulation for the State of Maryland. Member of
the board of directors (2012–2014) of Neighborhood
Reinvestment Corporation. Director (2017–present)
of i(x) Investments; director (2017–present) of Reserve
Trust. Rubinstein Fellow (2017–present) of Duke
University; trustee (2017–present) of Amherst College.
Peter F. Volanakis
Born in 1955. Trustee since July 2009. Principal
occupation(s) during the past five years and other
experience: president and chief operating officer
(retired 2010) of Corning Incorporated (communications
equipment) and director of Corning Incorporated
(2000–2010) and Dow Corning (2001–2010).
Director (2012) of SPX Corporation (multi-industry
manufacturing). Overseer of the Amos Tuck School
of Business Administration, Dartmouth College
(2001–2013). Chairman of the board of trustees of
Colby-Sawyer College. Member of the board of
Hypertherm Inc. (industrial cutting systems, software,
and consumables).

Executive Officers
John Bendl
Born in 1970. Principal occupation(s) during the past
five years and other experience: principal of Vanguard.
Chief financial officer (October 2019–present) of each
of the investment companies served by Vanguard.
Chief accounting officer, treasurer, and controller of
Vanguard (2017–present). Partner (2003–2016) at
KPMG (audit, tax, and advisory services).
Glenn Booraem
Born in 1967. Principal occupation(s) during the past
five years and other experience: principal of Vanguard.
Investment stewardship officer (2017–present),
treasurer (2015–2017), controller (2010–2015),
and assistant controller (2001–2010) of each of
the investment companies served by Vanguard.
Christine M. Buchanan
Born in 1970. Principal occupation(s) during the past
five years and other experience: principal of Vanguard.
Treasurer (2017–present) of each of the investment
companies served by Vanguard. Partner (2005–2017)
at KPMG (audit, tax, and advisory services).
David Cermak
Born in 1960. Principal occupation(s) during the past
five years and other experience: principal of Vanguard.
Finance director (October 2019–present) of each
of the investment companies served by Vanguard.
Managing director and head (2017–present) of
Vanguard Investments Singapore. Managing director
and head (2017–2019) of Vanguard Investments Hong
Kong. Representative director and head (2014–2017)
of Vanguard Investments Japan.
Thomas J. Higgins
Born in 1957. Principal occupation(s) during the
past five years and other experience: principal of
Vanguard. Finance director (October 2019–present),
chief financial officer (2008–2019), and treasurer
(1998–2008) of each of the investment companies
served by Vanguard.
Peter Mahoney
Born in 1974. Principal occupation(s) during the past
five years and other experience: principal of Vanguard.
Controller (2015–present) of each of the investment
companies served by Vanguard. Head of International
Fund Services (2008–2014) at Vanguard.
Anne E. Robinson
Born in 1970. Principal occupation(s) during the
past five years and other experience: general
counsel (2016–present) of Vanguard. Secretary
(2016–present) of Vanguard and of each of the
investment companies served by Vanguard.
Managing director (2016–present) of Vanguard.
Managing director and general counsel of Global
Cards and Consumer Services (2014–2016) at
Citigroup. Counsel (2003–2014) at American Express.
Michael Rollings
Born in 1963. Principal occupation(s) during the
past five years and other experience: finance
director (2017–present) and treasurer (2017) of each
of the investment companies served by Vanguard.
Managing director (2016–present) of Vanguard. Chief
financial officer (2016–present) of Vanguard. Director
(2016–present) of Vanguard Marketing Corporation.
Executive vice president and chief financial officer
(2006–2016) of MassMutual Financial Group.
John E. Schadl
Born in 1972. Principal occupation(s) during the
past five years and other experience: principal of
Vanguard. Chief compliance officer (2019–present)
of Vanguard and of each of the investment companies
served by Vanguard. Assistant vice president (May
2019–present) of Vanguard Marketing Corporation.
Vanguard Senior Management Team
Joseph Brennan Chris D. McIsaac
Mortimer J. Buckley James M. Norris
Gregory Davis Thomas M. Rampulla
John James Karin A. Risi
Martha G. King Anne E. Robinson
John T. Marcante Michael Rollings

P.O. Box 2600Valley Forge, PA 19482-2600
Connect with Vanguard® > vanguard.com
Fund Information > 800-662-7447
Direct Investor Account Services > 800-662-2739
Institutional Investor Services > 800-523-1036
Text Telephone for PeopleWho Are Deaf or Hard of Hearing > 800-749-7273
This material may be used in conjunctionwith the offering of shares of any Vanguardfund only if preceded or accompanied bythe fund’s current prospectus.
All comparative mutual fund data are from Morningstar,Inc., unless otherwise noted.
You can obtain a free copy of Vanguard’s proxy votingguidelines by visiting vanguard.com/proxyreporting or bycalling Vanguard at 800-662-2739. The guidelines arealso available from the SEC’s website, www.sec.gov. Inaddition, you may obtain a free report on how your fundvoted the proxies for securities it owned during the 12months ended June 30. To get the report, visit eithervanguard.com/proxyreporting or www.sec.gov.
You can review information about your fund on theSEC’s website, and you can receive copies of thisinformation, for a fee, by sending a request via emailaddressed to [email protected].
© 2019 The Vanguard Group, Inc.All rights reserved.Vanguard Marketing Corporation, Distributor.
Q560 122019