Vanguard California Tax-Exempt Funds · Vanguard California Tax-Exempt Funds ... In contrast, the...
193
Vanguard California Tax-Exempt Funds Vanguard California Municipal Money Market Fund Vanguard California Intermediate-Term Tax-Exempt Fund Vanguard California Long-Term Tax-Exempt Fund Semiannual Report | May 31, 2017
Transcript of Vanguard California Tax-Exempt Funds · Vanguard California Tax-Exempt Funds ... In contrast, the...
Vanguard California Tax-Exempt Funds
Vanguard California Municipal Money Market Fund
Vanguard California Intermediate-Term Tax-Exempt Fund
Vanguard California Long-Term Tax-Exempt Fund
Semiannual Report | May 31, 2017

Contents
Please note: The opinions expressed in this report are just that—informed opinions. They should not be considered promises or advice.Also, please keep in mind that the information and opinions cover the period through the date on the front of this report. Of course, therisks of investing in your fund are spelled out in the prospectus.
See the Glossary for definitions of investment terms used in this report.About the cover: No matter what language you speak, Vanguard has one consistent message and set of principles. Our primary focus is on you, our clients. We conduct our business with integrity as a faithful steward of your assets. This message is showntranslated into seven languages, reflecting our expanding global presence.
A new format, unwavering commitment
As you begin reading this report, you’ll notice that we’ve made some improvementsto the opening sections—based on feedback from you, our clients.
Page 1 starts with a new ”Your Fund’s Performance at a Glance,” a concise, handysummary of how your fund performed during the period.
In the renamed ”Chairman’s Perspective,” Bill McNabb will focus on enduringprinciples and investment insights.
We’ve modified some tables, and eliminated some redundancy, but we haven’tremoved any information.
At Vanguard, we’re always looking for better ways to communicate and to help youmake sound investment decisions. Thank you for entrusting your assets to us.
Your Fund’s Performance at a Glance. . . . . . . . . . . . . . . . . . 1
Chairman’s Perspective. . . . . . . . . . . . . . . . . . . . . . . . . . . . . 3
Advisor’s Report. . . . . . . . . . . . . . . . . . . . . . . . . . . . . . . . . . . 7
California Municipal Money Market Fund. . . . . . . . . . . . . . .11
California Intermediate-Term Tax-Exempt Fund. . . . . . . . . .30
California Long-Term Tax-Exempt Fund. . . . . . . . . . . . . . . 143
About Your Fund’s Expenses. . . . . . . . . . . . . . . . . . . . . . . 182
Trustees Approve Advisory Arrangements. . . . . . . . . . . . .184
Glossary. . . . . . . . . . . . . . . . . . . . . . . . . . . . . . . . . . . . . . . 186

Your Fund’s Performance at a Glance
1
Total Returns: Six Months Ended May 31, 2017
SECYield
Taxable-Equivalent
YieldIncomeReturns
CapitalReturns
TotalReturns
Vanguard California Municipal Money Market Fund 0.64% 1.30% 0.29% 0.00% 0.29%
California Tax-Exempt Money Market FundsAverage 0.10
California Tax-Exempt Money Market Funds Average: Derived from data provided by Lipper, a Thomson Reuters Company.
Vanguard California Intermediate-Term Tax-Exempt Fund
Investor Shares 1.75% 3.57% 1.35% 3.59% 4.94%
Admiral™ Shares 1.85 3.77 1.40 3.59 4.99
Bloomberg Barclays Municipal CaliforniaIntermediate Bond Index 5.15
California Intermediate Municipal Debt FundsAverage 4.27
California Intermediate Municipal Debt Funds Average: Derived from data provided by Lipper, a Thomson Reuters Company.
• For the six months ended May 31, 2017, Vanguard California Intermediate-Term Tax-
Exempt Bond Fund returned 4.94% for Investor Shares and 4.99% for Admiral Shares.
The fund’s benchmark returned 5.15%; the average return of peer funds was 4.27%.
• Vanguard California Long-Term Tax-Exempt Bond Fund returned 5.94% for Investor
Shares and 5.99% for Admiral Shares, outpacing its benchmark index and the average
return of its peers.
• Vanguard California Municipal Money Market Fund returned 0.29%, outperforming the
average return of its peers.
• Municipal bond prices slumped in the wake of the U.S. presidential election but later
regained ground.
• Overweight positions in securities at the lower end of the investment-grade spectrum,
which benefited from spreads tightening, helped the Long- and Intermediate-Term Funds.
So, too, did greater exposure to the long end of the yield curve.

2
SECYield
Taxable-Equivalent
YieldIncomeReturns
CapitalReturns
TotalReturns
Vanguard California Long-Term Tax-Exempt Fund
Investor Shares 2.31% 4.71% 1.74% 4.20% 5.94%
Admiral Shares 2.41 4.91 1.79 4.20 5.99
Bloomberg Barclays CA Municipal Bond Index 5.21
California Municipal Debt Funds Average 5.10
California Municipal Debt Funds Average: Derived from data provided by Lipper, a Thomson Reuters Company.
7-day SEC yield for the California Municipal Money Market Fund; 30-day SEC yield for the California Intermediate-Term Tax-Exempt Fund andCalifornia Long-Term Tax-Exempt Fund.
The calculation of taxable-equivalent yield assumes a typical itemized tax return and is based on the maximum federal tax rate of 43.4% andthe maximum income tax rate for the state. Local taxes were not considered. Please see the prospectus for a detailed explanation of thecalculation.
Admiral Shares carry lower expenses and are available to investors who meet certain account-balance requirements.
Expense RatiosYour Fund Compared With Its Peer Group
Investor
Shares
Admiral
Shares
Peer Group
Average
California Municipal Money Market Fund 0.16% — 0.16%
California Intermediate-Term Tax-Exempt Fund 0.19 0.09% 0.74
California Long-Term Tax-Exempt Fund 0.19 0.09 0.92
The fund expense ratios shown are from the prospectus dated March 28, 2017, and represent estimated costs for the current fiscal year. Forthe six months ended May 31, 2017, the funds’ annualized expense ratios were: for the California Municipal Money Market Fund, 0.16%; forthe California Intermediate-Term Tax-Exempt Fund, 0.19% for Investor Shares and 0.09% for Admiral Shares; and for the California Long-TermTax-Exempt Fund, 0.19% for Investor Shares and 0.09% for Admiral Shares. Peer-group expense ratios are derived from data provided byLipper, a Thomson Reuters Company, and capture information through year-end 2016.
Peer groups: For the California Municipal Money Market Fund, California Tax-Exempt Money Market Funds; for the CaliforniaIntermediate-Term Tax-Exempt Fund, California Intermediate Municipal Debt Funds; for the California Long-Term Tax-Exempt Fund, CaliforniaMunicipal Debt Funds. In most, if not all, cases, the expense ratios for the funds in the peer groups are based on net operating expenses afterreimbursement and/or fee waivers by fund sponsors. In contrast, the Vanguard money market funds’ expense ratios in the table above do notreflect expense reductions.

3
Dear Shareholder,
At the end of May, we completed the
latest round of expense ratio changes
for our U.S.-based funds. The estimated
savings for our investors during the
six-month period was more than $300
million across our fund lineup—another
record for us.1
That’s a remarkable amount, but it’s
also business as usual here at Vanguard.
After all, we’ve been cutting costs for
investors for more than 40 years. Indeed,
we’ve become so synonymous with
driving down costs that when other
investment companies lower their fees,
the financial press often refers to it as
the “Vanguard effect.”
To be sure, high costs persist in some
areas of the industry. But the good news
is, our 40-year campaign to lower costs
seems to be approaching its mathematical
limits, with some fund expenses now
near zero not just at Vanguard but at other
investment companies as well.
What makes investors successful?While we’ll continue our drive for cost
efficiency, we’ll also keep vigorously
promoting our three other linchpin
investment principles:
• Goals. Create clear, appropriate
investment goals.
• Balance. Develop a suitable asset
allocation using broadly diversified funds.
Chairman’s Perspective
Bill McNabbChairman and Chief Executive Officer
1 This figure represents cumulative net savings from expense ratio changes for all Vanguard fund share classes announced from December 2016 through May 2017. The estimated savings is the difference between prior and current expense ratios multiplied by average assets under management (AUM). Average AUM is based on averaging one month’s daily average assets over the 12 months of each fund’s fiscal year.

• Discipline. Maintain perspective and
long-term discipline.
Today, these tenets are more relevant
than ever. They’re essential elements
of our Personal Advisor Services recom-
mendations, the model portfolios we
develop for financial advisors, and our
target-date funds.
We’re convinced that as investors
increasingly adopt low-cost portfolios,
focusing on goals, balance, and discipline
could make the difference between
achieving financial objectives and
falling short.
Of course, there’s nothing new about our
philosophy. And it seems simple enough.
But unfortunately, we all have built-in
behavioral biases that can make it hard to
stick to the plan. We might, for example,
allow natural inertia to keep us from
rebalancing our portfolios to control risk,
or we may become too wedded to an
opinion or approach.
Lessons from the last crisisAlthough it can be difficult at times to
follow proven investing principles, it’s
not impossible, even under the most
challenging circumstances.
During the financial crisis of 2008–2009,
various media outlets asked me whether
our investors were pulling out of the
Market Barometer Total Returns
Periods Ended May 31, 2017
Six One Five Years
Months Year (Annualized)
Stocks
Russell 1000 Index (Large-caps) 10.55% 17.48% 15.37%
Russell 2000 Index (Small-caps) 4.33 20.36 14.04
Russell 3000 Index (Broad U.S. market) 10.06 17.69 15.26
FTSE All-World ex US Index (International) 16.80 18.45 8.86
Bonds
Bloomberg Barclays U.S. Aggregate Bond Index
(Broad taxable market) 2.52% 1.58% 2.24%
Bloomberg Barclays Municipal Bond Index
(Broad tax-exempt market) 5.16 1.46 3.31
Citigroup Three-Month U.S. Treasury Bill Index 0.26 0.41 0.12
CPI
Consumer Price Index 1.40% 1.87% 1.27%
4

market and running for the hills. In
actuality, we didn’t see that at Vanguard.
Our clients were certainly nervous, and
they contacted us more often. But for
the most part, they didn’t engage in the
excessive, panicked trading that can be
so destructive to building wealth. Those
who relied on financial advisors who
follow our philosophy were wisely
counseled to stay the course.
The accompanying chart shows the
importance of patience and discipline.
Investors who maintained a 60% stock/
40% bond mix through the bear market
were amply rewarded afterward, while
those who fled stocks when they hit
bottom were left far behind.
It’s not different this timeToday, nearly a decade after the global
financial crisis, the world seems very
different. Market indexes recently hit a
series of all-time highs. With the wind at
their backs and the increasing availability
of low-cost funds, investors may be
tempted to ask, “What could go wrong?”
The answer is, “A lot.” Performance
chasing and market-timing won’t be any
more effective with low-cost funds than
they are with high-cost funds.
Reacting to volatility can hurt returns
Investors who kept a balanced portfolio through the 2008–2009 crash were rewarded
2007 2009 2011 2013 2015 2016
Po
rtfo
lio v
alu
e
(in
itia
l valu
e s
et
at
10
0)
40
60
100
80
140
120
160
1%
38%
117%February 28, 2009: –35%
Trough to peak
100% fixed income
100% cash
60% equity/40% fixed income
Notes: On October 31, 2007, close to the equity market’s peak, the value of a hypothetical 60/40 portfolio is set at 100. Subsequent returns are calculated relative to this starting value of 100. It is assumed that all dividends and income are reinvested in the components of the indexes. The initial allocation for the portfolios was 42% U.S. stocks, 18% international stocks, and 40% U.S. bonds. The rebalanced portfolio is returned to this allocation every month-end. Returns for the U.S. stock allocation are based on the MSCI US Broad Market Index. Returns for the international stock allocation are based on the MSCI All Country World Index ex USA. Returns for the bond allocation are based on the Bloomberg Barclays U.S. Aggregate Bond Index. Returns for the cash allocation are based on the Citigroup 3-Month U.S. Treasury Bill Index.
Sources: Vanguard, using data provided by Thomson Reuters Datastream.
5

Whether markets are sunny or stormy,
investors need to stick to their investment
plans, maintain balanced and diversified
portfolios, and think long-term.
We strive to help investors follow the
principles that lead to enduring success.
I’d like to think that will be the real
“Vanguard effect.”
As always, thank you for investing
with Vanguard.
Sincerely,
F. William McNabb III
Chairman and Chief Executive Officer
June 14, 2017
6

Advisor’s Report
7
For the six months ended May 31, 2017,
Vanguard California Intermediate-Term
Tax-Exempt Fund returned 4.94% for
Investor Shares and 4.99% for Admiral
Shares, underperforming its benchmark
but outperforming the average return of its
peer funds. Vanguard California Long-Term
Tax-Exempt Fund returned 5.94% for
Investor Shares and 5.99% for Admiral
Shares, outpacing both its benchmark
index and the average return of its peers.
Vanguard California Municipal Money
Market Fund returned 0.29%; the average
return of peer funds was 0.10%.
With municipal bond prices gaining ground
during the period, the Intermediate-Term
Fund’s 30-day SEC yield fell from 1.80% to
1.75% for Investor Shares and from 1.92%
to 1.85% for Admiral Shares over the
period. The yield for the Long-Term Fund
fell from 2.35% to 2.31% for Investor
Shares and from 2.47% to 2.41% for
Admiral Shares. The Money Market
Fund’s 7-day SEC yield rose from 0.40%
to 0.64%.
The investment environmentDuring the period, the Federal Reserve
increased interest rates twice; the second
move, in March, put the federal funds rate
at 0.75%–1.00% and marked just the third
time the Fed has raised rates since the
financial crisis.
The Fed’s decisions signaled a
normalization of monetary policy and
came as the U.S. economy posted mostly
positive results. Fourth-quarter economic
Yields of Municipal Securities(AAA-Rated General Obligation Issues)
November 30, May 31,
Maturity 2016 2017
2 years 1.16% 0.89%
5 years 1.85 1.22
10 years 2.52 1.90
30 years 3.26 2.74
Source: Vanguard.

8
growth was in line with estimates. But
GDP growth was lackluster in the first
quarter of 2017, largely because of a
drop-off in consumer spending. The
housing and manufacturing sectors
reported decent activity during the
six months under review, and in May
unemployment hit 4.3%, its lowest level
in 16 years. Wages ticked up and some
commodities, including oil, posted price
increases, helping inflation come closer to
the Fed’s 2% target. Against this backdrop,
the Fed signaled that further hikes could
be in the offing.
Municipal bond supply was down modestly
from the same period last year, largely
because refunding issuance declined as
interest rates climbed higher. Municipal
bond fund cash flows turned negative
in the wake of the U.S. elections but
reversed somewhat as the period came
to a close. Short- and medium-term muni
bonds outperformed Treasuries.
In California, the state’s economy grew
faster than the U.S. economy as a whole,
according to a gauge of current economic
conditions published monthly by the Federal
Reserve Bank of Philadelphia. The bank’s
index for California rose by about 2%, while
the increase at the national level was closer
to 1%. (Each state’s index incorporates
data on nonfarm payroll employment, the
jobless rate, average hours worked in
manufacturing, and inflation-adjusted
wage and salary payments.)
The most significant revenue
developments at the state level were
the expiration and extension of the 2012
Proposition 30 temporary taxes that had
been in place since January 1, 2013.
The sales tax portion (a 0.25% increase
statewide) expired as expected on
December 31, 2016. The income tax
portion (tiered increases for single filers/
joint filers making over $250,000/$500,000
a year) had been set to expire in 2019, but
Proposition 55, which passed by a large
margin in November 2016, extended it
through 2030. Actual revenues have been
lagging the state’s rosy projections, but
they are picking up: Although revenues
for the ten months ended April 30, 2017,
trailed the original projections by 1.9%,
they were up 1.8% from the same period
the year before.
At the local level, cities and counties
continue to operate in an environment
conducive to fiscal strength and stability.
California’s extension of the Proposition
30 income tax increase ensures a solid
funding source for its school districts, and
its cities and counties have seen virtually
no negative budget repercussions since
the state put its fiscal house in order.
Because of a change in Moody’s lease-
backed methodology, nearly all California
cities and counties had their lease-backed
obligation ratings upgraded one notch in
the fourth quarter of 2016. Some of our
largest exposures in the City of Los
Angeles and Los Angeles County
received such upgrades.
Overall credit trends continue to be
positive, although there is deep concern
with how federal policy may affect state
and local budgets, mostly with respect to
the repeal of the Affordable Care Act.

9
Issuance has been average to brisk. The
state issued $2.4 billion mostly in refunding
general obligation debt in March 2017 and
$1.2 billion for high speed rail in April 2017.
Local governments continue to use the
low-rate environment to take advantage
of refunding opportunities and issue new
general obligation bonds from the spate of
authorizations that have been granted over
the past three years.
Management of the fundsOur investment process at Vanguard
relies on risk management as we strive
to add value through a diversified mix of
strategies that include duration, yield-curve
positioning, credit-quality decisions, and
security selection. Vanguard’s experienced
team of credit analysts perform objective
and independent analyses of bonds owned
by the funds.
The Intermediate-Term and Long-Term
Funds’ performance compared to their
state-specific benchmarks got a boost
from their A-rated and Baa-rated bonds
and bonds with maturities of 10–20 years.
On the other hand, the funds’ bonds with
maturities of 5–10 years hindered their
relative performance.
For the Money Market Fund, we
maintained high levels of liquidity and a
short weighted average maturity. That
positioning allowed us to take advantage
of the increase in yields on money market-
eligible securities and, along with its low
expense ratio compared with peers, helped
the fund outperform for the period.
The funds are permitted to invest in bonds
whose income is subject to the alternative
minimum tax (AMT). As of May 31, 2017,
neither the Intermediate-Term Fund nor
the Long-Term Fund owned bonds that
would generate income distributions
subject to the AMT, but the Money
Market Fund did.
None of the funds had any exposure to
bonds issued by Puerto Rico, whose debt
relief negotiations are ongoing. (Because
the commonwealth’s bonds are exempt
from federal, state, and local income tax,
they often appear in state and national
muni bond funds.)
The outlookAfter the close of the period, the Fed
raised rates by 25 basis points, and it has
hinted there may be another hike in 2017.
That aligns with our expectations that the
Fed will raise rates gradually to 1.5% in
2017, while leaving the federal funds rate
below 2% through at least 2018. The pace
of future rate hikes will likely depend on
the rate of economic growth.
The U.S. economy looks set to continue
its steady growth, with real GDP likely to
be around 2% in 2017, or perhaps closer
to 2.5% if the implementation of the
Trump administration’s agenda actually
has a positive effect on the economy.
While job growth may slow given the
tightening we’ve seen in the labor market,
competition for labor could push up the
pace of annual wage increases. That
should provide some support to inflation
in the short term, but not so much as to
make it significantly overshoot the central
bank’s 2% target.

10
If growth and inflation remain modest,
the cost of borrowing shouldn’t get out
of hand, especially if yields in the United
States remain attractive compared with
those of other developed economies.
International demand should help cap
how high U.S. bond yields can rise.
Of course, market conditions could
change, but we are confident that our
team of experienced managers, analysts,
and traders can handle whatever the
market brings and find opportunities
that will produce competitive returns.
Christopher W. Alwine, CFA, Principal,
Head of Municipal Group
John M. Carbone, Principal,
Portfolio Manager
James M. D’Arcy, CFA, Portfolio Manager
Adam M. Ferguson, CFA,
Portfolio Manager
Vanguard Fixed Income Group
June 15, 2017

1 The expense ratio shown is from the prospectus dated March 28, 2017, and represents estimated costs for the current fiscal year. For the six months ended May 31, 2017, the annualized expense ratio was 0.16%.
Fund ProfileAs of May 31, 2017
California Municipal Money Market Fund
11
Financial Attributes
Ticker Symbol VCTXXExpense Ratio1 0.16%
7-Day SEC Yield 0.64%
Average WeightedMaturity 12 days

See Financial Highlights for dividend information.
Performance Summary
Investment returns will fluctuate. All of the returns in this report represent past performance, which is not a guarantee of future results that may be achieved by the fund. (Current performance may be lower or higher than the performance data cited. For performance data current to the most recent month-end, visit our website at vanguard.com/performance.) The
returns shown do not reflect taxes that a shareholder would pay on fund distributions. The fund is only available to retail investors (natural persons). You could lose money by investing in the fund. Although the fund seeks to preserve the value of your investment at $1.00 per share, it cannot guarantee it will do so. The fund may impose a fee upon the sale of your shares or may temporarily suspend your ability to sell shares if the fund’s liquidity falls below required minimums because of market conditions or other factors. An investment in the fund is not insured or guaranteed by the Federal Deposit Insurance Corporation or any other government agency. The fund’s sponsor has no legal obligation to provide financial support to the fund, and you should not expect that the sponsor will provide financial support to the fund at any time.The fund’s 7-day SEC yield reflects its current earnings more closely than do the average annual
returns.
California Municipal Money Market Fund
12
Fiscal-Year Total Returns (%): November 30, 2006, Through May 31, 2017
Fiscal Year Total Returns
CA Tax-ExemptMoney MktFunds Avg
Total Returns
2007 3.55% 3.06%
2008 2.21 1.81
2009 0.37 0.17
2010 0.11 0.01
2011 0.07 0.01
2012 0.03 0.00
2013 0.01 0.00
2014 0.01 0.00
2015 0.01 0.00
2016 0.25 0.11
2017 0.29 0.10
7-day SEC yield (5/31/2017): 0.64%
California Tax-Exempt Money Market Funds Average: Derived from data provided by Lipper, a Thomson Reuters Company.
Note: For 2017, performance data reflect the six months ended May 31, 2017.
Average Annual Total Returns: Periods Ended March 31, 2017This table presents returns through the latest calendar quarter—rather than through the end of the fiscal period.Securities and Exchange Commission rules require that we provide this information.
InceptionDate
OneYear
FiveYears
TenYears
California Municipal Money MarketFund 6/1/1987 0.42% 0.10% 0.56%

California Municipal Money Market Fund
Financial Statements (unaudited)
Statement of Net AssetsAs of May 31, 2017
The fund reports a complete list of its holdings in various monthly and quarterly regulatory filings. The
fund publishes its holdings on a monthly basis at vanguard.com and files them with the Securities and
Exchange Commission on Form N-MFP. The fund’s Form N-MFP filings may be viewed at sec.gov or
via a link on the “Portfolio Holdings” page on vanguard.com. For the second and fourth fiscal quarters,
the lists appear in the fund’s semiannual and annual reports to shareholders. For the first and third
fiscal quarters, the fund files the lists with the SEC on Form N-Q. Shareholders can look up the fund’s
Forms N-Q on the SEC’s website at sec.gov. Forms N-Q may also be reviewed and copied at the
SEC’s Public Reference Room (see the back cover of this report for further information).
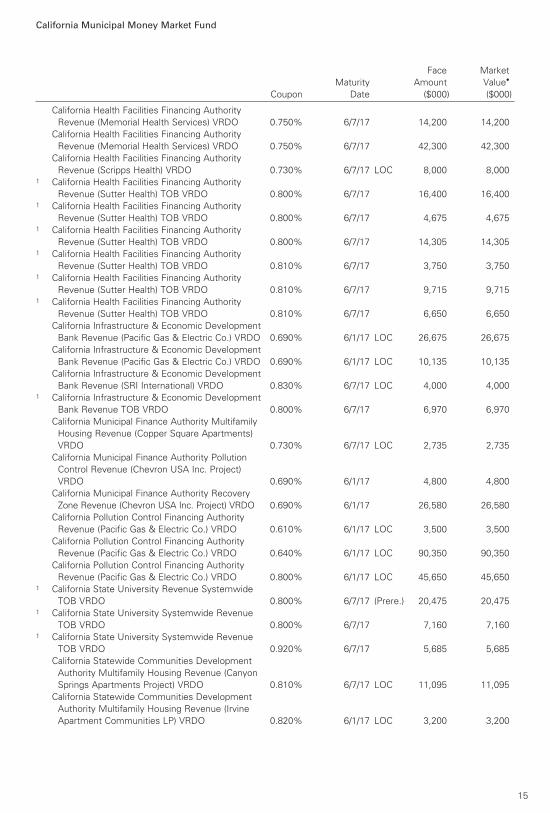
Tax-Exempt Municipal Bonds (100.0%)
California (100.0%)
ABAG Finance Authority for Nonprofit Corps.
California Revenue (Branson School) VRDO 0.770% 6/7/17 LOC 21,300 21,300
ABAG Finance Authority for Nonprofit Corps.
California Revenue (Computer History Museum)
VRDO 0.790% 6/7/17 LOC 7,000 7,000
ABAG Finance Authority for Nonprofit Corps.
California Revenue (Lakeside Village Apartments)
VRDO 0.760% 6/7/17 LOC 30,700 30,700
ABAG Finance Authority for Nonprofit Corps.
California Revenue (Public Policy Institute)
VRDO 0.780% 6/7/17 LOC 12,705 12,705
Anaheim CA Housing Finance Agency Home
Mortgage Revenue VRDO 0.800% 6/7/17 LOC 5,485 5,4851 Bay Area Toll Authority California Toll Bridge
Revenue (San Francisco Bay Area) TOB VRDO 0.810% 6/7/17 13,330 13,3301 Bay Area Toll Authority California Toll Bridge
Revenue (San Francisco Bay Area) TOB VRDO 0.820% 6/7/17 3,700 3,700
Bay Area Toll Authority California Toll Bridge
Revenue (San Francisco Bay Area) VRDO 0.720% 6/7/17 LOC 5,000 5,000
Big Bear Lake CA Industrial Revenue (Southwest
Gas Corp. Project) VRDO 0.770% 6/7/17 LOC 24,000 24,000
California Department of Water Resources Water
System Revenue CP 0.870% 6/1/17 33,553 33,553
California Department of Water Resources Water
System Revenue CP 0.860% 7/6/17 3,437 3,4371 California Educational Facilities Authority Revenue
(California Institute of Technology) TOB VRDO 0.810% 6/7/17 3,365 3,365
California Educational Facilities Authority Revenue
(California Institute of Technology) VRDO 0.790% 6/7/17 55,800 55,800
California Educational Facilities Authority Revenue
(Stanford Hospital) CP 0.950% 7/6/17 36,550 36,550
California Educational Facilities Authority Revenue
(Stanford University) CP 0.800% 6/7/17 30,000 30,000
California Educational Facilities Authority Revenue
(Stanford University) CP 0.800% 6/7/17 1,200 1,200
Face Market
Maturity Amount Value•
Coupon Date ($000) ($000)
13

California Municipal Money Market Fund
California Educational Facilities Authority
Revenue (Stanford University) CP 0.920% 7/12/17 40,000 40,0001 California Educational Facilities Authority
Revenue (Stanford University) TOB VRDO 0.800% 6/7/17 8,000 8,0001 California Educational Facilities Authority
Revenue (Stanford University) TOB VRDO 0.810% 6/7/17 3,000 3,0001 California Educational Facilities Authority
Revenue (Stanford University) TOB VRDO 0.810% 6/7/17 3,590 3,5901 California Educational Facilities Authority
Revenue (Stanford University) VRDO 0.700% 6/7/17 10,900 10,9001 California Educational Facilities Authority
Revenue (Stanford University) VRDO 0.700% 6/7/17 14,600 14,600
California GO CP 0.760% 6/5/17 LOC 13,525 13,525
California GO CP 0.930% 6/8/17 LOC 14,190 14,190
California GO CP 0.870% 7/6/17 LOC 20,000 20,000
California GO CP 0.950% 7/20/17 LOC 25,000 25,0001 California GO TOB VRDO 0.790% 6/7/17 3,000 3,0001 California GO TOB VRDO 0.800% 6/7/17 2,370 2,3701 California GO TOB VRDO 0.800% 6/7/17 6,815 6,8151 California GO TOB VRDO 0.800% 6/7/17 4,200 4,200
California GO VRDO 0.680% 6/7/17 LOC 5,470 5,470
California GO VRDO 0.680% 6/7/17 LOC 10,160 10,160
California GO VRDO 0.720% 6/7/17 LOC 10,000 10,000
California GO VRDO 0.740% 6/7/17 LOC 10,000 10,000
California GO VRDO 0.750% 6/7/17 LOC 19,335 19,335
California GO VRDO 0.750% 6/7/17 LOC 3,530 3,530
California Health Facilities Financing Authority
Revenue (Catholic Healthcare West) VRDO 0.720% 6/7/17 LOC 6,725 6,725
California Health Facilities Financing Authority
Revenue (Catholic Healthcare West) VRDO 0.760% 6/7/17 LOC 41,000 41,000
California Health Facilities Financing Authority
Revenue (Catholic Healthcare West) VRDO 0.800% 6/7/17 LOC 14,000 14,000
California Health Facilities Financing Authority
Revenue (Children’s Hospital of Orange County)
VRDO 0.740% 6/7/17 LOC 9,525 9,525
California Health Facilities Financing Authority
Revenue (Children’s Hospital of Orange County)
VRDO 0.740% 6/7/17 LOC 2,400 2,400
California Health Facilities Financing Authority
Revenue (Children’s Hospital of Orange County)
VRDO 0.740% 6/7/17 LOC 22,345 22,3451 California Health Facilities Financing Authority
Revenue (Lucile Salter Packard Children’s
Hospital at Stanford) TOB VRDO 0.800% 6/7/17 3,375 3,3751 California Health Facilities Financing Authority
Revenue (Lucile Salter Packard Children’s
Hospital at Stanford) TOB VRDO 0.810% 6/7/17 6,665 6,6651 California Health Facilities Financing Authority
Revenue (Lucile Salter Packard Children’s
Hospital at Stanford) TOB VRDO 0.850% 6/7/17 7,705 7,7051 California Health Facilities Financing Authority
Revenue (Lucile Salter Packard Children’s
Hospital at Stanford) TOB VRDO 0.850% 6/7/17 2,060 2,060
Face Market
Maturity Amount Value•
Coupon Date ($000) ($000)
14
California Municipal Money Market Fund
California Health Facilities Financing Authority
Revenue (Memorial Health Services) VRDO 0.750% 6/7/17 14,200 14,200
California Health Facilities Financing Authority
Revenue (Memorial Health Services) VRDO 0.750% 6/7/17 42,300 42,300
California Health Facilities Financing Authority
Revenue (Scripps Health) VRDO 0.730% 6/7/17 LOC 8,000 8,0001 California Health Facilities Financing Authority
Revenue (Sutter Health) TOB VRDO 0.800% 6/7/17 16,400 16,4001 California Health Facilities Financing Authority
Revenue (Sutter Health) TOB VRDO 0.800% 6/7/17 4,675 4,6751 California Health Facilities Financing Authority
Revenue (Sutter Health) TOB VRDO 0.800% 6/7/17 14,305 14,3051 California Health Facilities Financing Authority
Revenue (Sutter Health) TOB VRDO 0.810% 6/7/17 3,750 3,7501 California Health Facilities Financing Authority
Revenue (Sutter Health) TOB VRDO 0.810% 6/7/17 9,715 9,7151 California Health Facilities Financing Authority
Revenue (Sutter Health) TOB VRDO 0.810% 6/7/17 6,650 6,650
California Infrastructure & Economic Development
Bank Revenue (Pacific Gas & Electric Co.) VRDO 0.690% 6/1/17 LOC 26,675 26,675
California Infrastructure & Economic Development
Bank Revenue (Pacific Gas & Electric Co.) VRDO 0.690% 6/1/17 LOC 10,135 10,135
California Infrastructure & Economic Development
Bank Revenue (SRI International) VRDO 0.830% 6/7/17 LOC 4,000 4,0001 California Infrastructure & Economic Development
Bank Revenue TOB VRDO 0.800% 6/7/17 6,970 6,970
California Municipal Finance Authority Multifamily
Housing Revenue (Copper Square Apartments)
VRDO 0.730% 6/7/17 LOC 2,735 2,735
California Municipal Finance Authority Pollution
Control Revenue (Chevron USA Inc. Project)
VRDO 0.690% 6/1/17 4,800 4,800
California Municipal Finance Authority Recovery
Zone Revenue (Chevron USA Inc. Project) VRDO 0.690% 6/1/17 26,580 26,580
California Pollution Control Financing Authority
Revenue (Pacific Gas & Electric Co.) VRDO 0.610% 6/1/17 LOC 3,500 3,500
California Pollution Control Financing Authority
Revenue (Pacific Gas & Electric Co.) VRDO 0.640% 6/1/17 LOC 90,350 90,350
California Pollution Control Financing Authority
Revenue (Pacific Gas & Electric Co.) VRDO 0.800% 6/1/17 LOC 45,650 45,6501 California State University Revenue Systemwide
TOB VRDO 0.800% 6/7/17 (Prere.) 20,475 20,4751 California State University Systemwide Revenue
TOB VRDO 0.800% 6/7/17 7,160 7,1601 California State University Systemwide Revenue
TOB VRDO 0.920% 6/7/17 5,685 5,685
California Statewide Communities Development
Authority Multifamily Housing Revenue (Canyon
Springs Apartments Project) VRDO 0.810% 6/7/17 LOC 11,095 11,095
California Statewide Communities Development
Authority Multifamily Housing Revenue (Irvine
Apartment Communities LP) VRDO 0.820% 6/1/17 LOC 3,200 3,200
Face Market
Maturity Amount Value•
Coupon Date ($000) ($000)
15

California Municipal Money Market Fund
California Statewide Communities Development
Authority Multifamily Housing Revenue
(Ridgeway Apartments) VRDO 0.770% 6/7/17 LOC 26,955 26,955
California Statewide Communities Development
Authority Multifamily Housing Revenue
(Wilshire Court Project) VRDO 0.810% 6/7/17 LOC 11,900 11,900
California Statewide Communities Development
Authority Pollution Control Revenue (Chevron
USA Inc. Project) VRDO 0.690% 6/1/17 8,300 8,300
California Statewide Communities Development
Authority Revenue (Community Hospital of the
Monterey Peninsula) VRDO 0.750% 6/7/17 LOC 40,200 40,200
California Statewide Communities Development
Authority Revenue (Kaiser Permanente) CP 0.970% 7/6/17 16,250 16,250
California Statewide Communities Development
Authority Revenue (Kaiser Permanente) VRDO 0.720% 6/7/17 2,100 2,100
California Statewide Communities Development
Authority Revenue (Kaiser Permanente) VRDO 0.720% 6/7/17 21,500 21,500
California Statewide Communities Development
Authority Revenue (Kaiser Permanente) VRDO 0.760% 6/7/17 41,985 41,985
California Statewide Communities Development
Authority Revenue (Kaiser Permanente) VRDO 0.760% 6/7/17 30,100 30,100
California Statewide Communities Development
Authority Revenue (Kaiser Permanente) VRDO 0.770% 6/7/17 9,600 9,600
California Statewide Communities Development
Authority Revenue (Scripps Health) VRDO 0.730% 6/7/17 LOC 8,200 8,2001 California Statewide Communities Development
Authority Revenue (St. Joseph Health System)
TOB VRDO 0.840% 6/7/17 (Prere.) 57,233 57,2331 California Statewide Communities Development
Authority Revenue (Sutter Health) TOB VRDO 0.810% 6/7/17 8,740 8,7401 California Statewide Communities Development
Authority Revenue (Sutter Health) TOB VRDO 0.810% 6/7/17 12,230 12,2301 California Statewide Communities Development
Authority Revenue (Sutter Health) TOB VRDO 0.820% 6/7/17 6,270 6,2701 California Statewide Communities Development
Authority Revenue (Trinity Health) TOB VRDO 0.800% 6/7/17 2,175 2,175
Calleguas-Las Virgenes CA Public Financing
Authority Revenue (Municipal Water District
Project) VRDO 0.730% 6/7/17 LOC 4,555 4,555
Chula Vista CA Multifamily Housing Revenue
(Teresina Apartments) VRDO 0.800% 6/7/17 LOC 27,940 27,940
Contra Costa CA Municipal Water District
Revenue (Extendible) CP 0.910% 2/2/18 15,000 15,000
Contra Costa County CA Multifamily Housing
Revenue (Park Regency) VRDO 0.800% 6/7/17 LOC 30,000 30,0001,2 Culver City CA Unified School District GO TOB
PUT 0.850% 6/1/17 4,450 4,4501 Cupertino CA Union School District GO TOB
VRDO 0.820% 6/7/17 8,870 8,8701 Desert CA Community College District GO TOB
VRDO 0.800% 6/7/17 6,000 6,0001 Desert CA Community College District GO TOB
VRDO 0.810% 6/7/17 9,295 9,295
Face Market
Maturity Amount Value•
Coupon Date ($000) ($000)
16

California Municipal Money Market Fund
East Bay CA Municipal Utility District Water
System Revenue CP 0.750% 6/5/17 10,000 10,000
East Bay CA Municipal Utility District Water
System Revenue CP 0.940% 6/5/17 8,000 8,000
East Bay CA Municipal Utility District Water
System Revenue CP 0.970% 7/6/17 20,000 20,000
East Bay CA Municipal Utility District Water
System Revenue CP 0.930% 7/7/17 10,000 10,000
East Bay CA Municipal Utility District Water
System Revenue CP 0.970% 7/17/17 10,000 10,000
East Bay CA Municipal Utility District Water
System Revenue CP 0.960% 8/2/17 15,000 15,0001 East Bay CA Municipal Utility District Water
System Revenue TOB VRDO 0.800% 6/7/17 9,260 9,2601 Eastern California Municipal Water District
Financing Authority Water & Wastewater
Revenue TOB VRDO 0.790% 6/7/17 5,000 5,0001 Eastern California Municipal Water District Water
& Sewer COP TOB VRDO 0.800% 6/7/17 (Prere.) 1,595 1,595
Eastern California Municipal Water District Water
& Wastewater Revenue VRDO 0.700% 6/7/17 18,700 18,700
Eastern California Municipal Water District Water
& Wastewater Revenue VRDO 0.750% 6/7/17 LOC 5,000 5,000
Eastern California Municipal Water District Water
& Wastewater Revenue VRDO 0.750% 6/7/17 5,000 5,0001 Elk Grove CA Unified School District GO TOB PUT 0.930% 6/1/17 3,200 3,200
Elsinore Valley CA Municipal Water District COP
VRDO 0.720% 6/7/17 LOC 4,400 4,400
Escondido CA Community Development Multifamily
Revenue (Heritage Park Apartments) VRDO 0.800% 6/7/17 LOC 4,250 4,250
Grossmont CA Healthcare District GO 5.000% 7/15/17 (Prere.) 15,770 15,8491 Huntington Beach CA City School District GO TOB
PUT 0.930% 8/23/17 3,045 3,045
Irvine CA Assessment District No. 94-13
Improvement Revenue (Oak Creek) VRDO 0.760% 6/1/17 LOC 4,085 4,085
Irvine CA Assessment District No. 97-16
Improvement Revenue VRDO 0.760% 6/1/17 LOC 6,700 6,700
Irvine CA Assessment District No. 97-17
Improvement Revenue VRDO 0.760% 6/1/17 LOC 7,214 7,214
Irvine CA Public Facilities & Infrastructure
Authority Assessment Revenue VRDO 0.760% 6/1/17 LOC 12,978 12,9782 Irvine CA Ranch Water District Revenue PUT 0.850% 3/7/18 10,000 10,0002 Irvine CA Ranch Water District Revenue PUT 0.850% 3/7/18 8,290 8,290
Irvine CA Reassessment District No. 05-21
Improvement Revenue VRDO 0.760% 6/1/17 LOC 27,794 27,794
Irvine CA Reassessment District No. 85-7A
Improvement Revenue VRDO 0.760% 6/1/17 LOC 31,811 31,8111 Irvine Ranch CA Water District Revenue TOB
VRDO 0.810% 6/7/17 4,160 4,160
Livermore CA Redevelopment Agency Multi-Family
Housing Revenue (Livermore Independent Senior
Apartments) VRDO 0.770% 6/7/17 LOC 13,040 13,040
Livermore CA Redevelopment Agency Multi-Family
Housing Revenue (Richards Manor) VRDO 0.800% 6/7/17 LOC 4,770 4,770
Face Market
Maturity Amount Value•
Coupon Date ($000) ($000)
17
California Municipal Money Market Fund
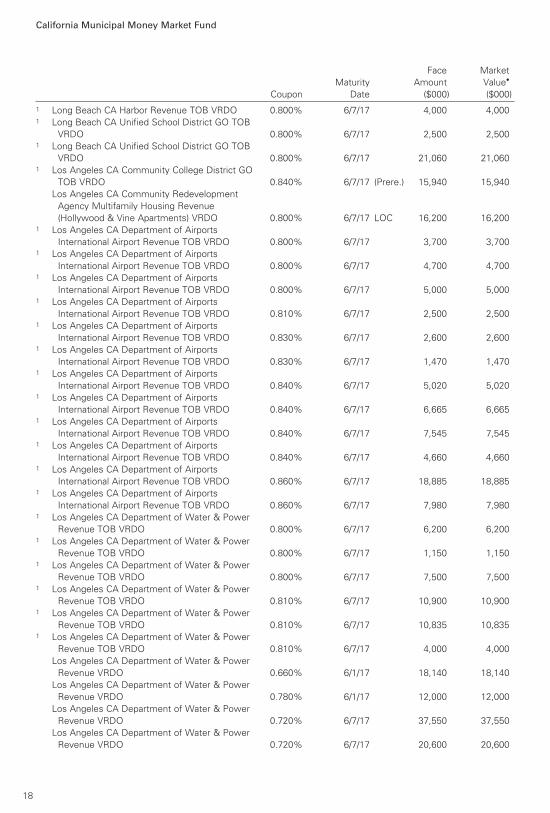
1 Long Beach CA Harbor Revenue TOB VRDO 0.800% 6/7/17 4,000 4,0001 Long Beach CA Unified School District GO TOB
VRDO 0.800% 6/7/17 2,500 2,5001 Long Beach CA Unified School District GO TOB
VRDO 0.800% 6/7/17 21,060 21,0601 Los Angeles CA Community College District GO
TOB VRDO 0.840% 6/7/17 (Prere.) 15,940 15,940
Los Angeles CA Community Redevelopment
Agency Multifamily Housing Revenue
(Hollywood & Vine Apartments) VRDO 0.800% 6/7/17 LOC 16,200 16,2001 Los Angeles CA Department of Airports
International Airport Revenue TOB VRDO 0.800% 6/7/17 3,700 3,7001 Los Angeles CA Department of Airports
International Airport Revenue TOB VRDO 0.800% 6/7/17 4,700 4,7001 Los Angeles CA Department of Airports
International Airport Revenue TOB VRDO 0.800% 6/7/17 5,000 5,0001 Los Angeles CA Department of Airports
International Airport Revenue TOB VRDO 0.810% 6/7/17 2,500 2,5001 Los Angeles CA Department of Airports
International Airport Revenue TOB VRDO 0.830% 6/7/17 2,600 2,6001 Los Angeles CA Department of Airports
International Airport Revenue TOB VRDO 0.830% 6/7/17 1,470 1,4701 Los Angeles CA Department of Airports
International Airport Revenue TOB VRDO 0.840% 6/7/17 5,020 5,0201 Los Angeles CA Department of Airports
International Airport Revenue TOB VRDO 0.840% 6/7/17 6,665 6,6651 Los Angeles CA Department of Airports
International Airport Revenue TOB VRDO 0.840% 6/7/17 7,545 7,5451 Los Angeles CA Department of Airports
International Airport Revenue TOB VRDO 0.840% 6/7/17 4,660 4,6601 Los Angeles CA Department of Airports
International Airport Revenue TOB VRDO 0.860% 6/7/17 18,885 18,8851 Los Angeles CA Department of Airports
International Airport Revenue TOB VRDO 0.860% 6/7/17 7,980 7,9801 Los Angeles CA Department of Water & Power
Revenue TOB VRDO 0.800% 6/7/17 6,200 6,2001 Los Angeles CA Department of Water & Power
Revenue TOB VRDO 0.800% 6/7/17 1,150 1,1501 Los Angeles CA Department of Water & Power
Revenue TOB VRDO 0.800% 6/7/17 7,500 7,5001 Los Angeles CA Department of Water & Power
Revenue TOB VRDO 0.810% 6/7/17 10,900 10,9001 Los Angeles CA Department of Water & Power
Revenue TOB VRDO 0.810% 6/7/17 10,835 10,8351 Los Angeles CA Department of Water & Power
Revenue TOB VRDO 0.810% 6/7/17 4,000 4,000
Los Angeles CA Department of Water & Power
Revenue VRDO 0.660% 6/1/17 18,140 18,140
Los Angeles CA Department of Water & Power
Revenue VRDO 0.780% 6/1/17 12,000 12,000
Los Angeles CA Department of Water & Power
Revenue VRDO 0.720% 6/7/17 37,550 37,550
Los Angeles CA Department of Water & Power
Revenue VRDO 0.720% 6/7/17 20,600 20,600
Face Market
Maturity Amount Value•
Coupon Date ($000) ($000)
18

California Municipal Money Market Fund
Los Angeles CA Department of Water & Power
Revenue VRDO 0.730% 6/7/17 12,150 12,150
Los Angeles CA Department of Water & Power
Revenue VRDO 0.730% 6/7/17 10,000 10,000
Los Angeles CA Department of Water & Power
Revenue VRDO 0.730% 6/7/17 4,200 4,2001 Los Angeles CA Department of Water & Power
Revenue TOB VRDO 0.790% 6/7/17 12,675 12,6751 Los Angeles CA Harbor Department Revenue TOB
VRDO 0.820% 6/7/17 (Prere.) 8,150 8,1501 Los Angeles CA Harbor Department Revenue TOB
VRDO 0.860% 6/7/17 2,220 2,220
Los Angeles CA Metropolitan Transportation
Authority CP 0.950% 7/12/17 LOC 3,100 3,100
Los Angeles CA Multifamily Housing Revenue
(Queen Portfolio Apartments Project) VRDO 0.800% 6/7/17 LOC 6,050 6,050
Los Angeles CA Multifamily Housing Revenue
(San Regis Project) VRDO 0.810% 6/7/17 LOC 23,600 23,600
Los Angeles CA Municipal Improvement Corp.
Lease Revenue CP 0.950% 7/18/17 LOC 7,000 7,000
Los Angeles CA Municipal Improvement Corp.
Lease Revenue CP A4 0.950% 7/18/17 LOC 3,000 3,000
Los Angeles CA Municipal Improvement Corp.
Lease Revenue CP A4 0.950% 9/20/17 5,500 5,500
Los Angeles CA TRAN 3.000% 6/29/17 100,000 100,163
Los Angeles CA Unified School District GO 5.000% 7/1/17 (Prere.) 6,980 7,0041 Los Angeles CA Unified School District GO TOB
VRDO 0.800% 6/7/17 6,665 6,6651 Los Angeles CA Unified School District GO TOB
VRDO 0.800% 6/7/17 10,000 10,000
Los Angeles County CA Capital Asset Leasing
Corp. 0.910% 6/8/17 LOC 7,290 7,290
Los Angeles County CA Capital Asset Leasing
Corp. 0.960% 6/29/17 LOC 5,000 5,000
Los Angeles County CA Multifamily Housing
Revenue (Valencia Village Project) VRDO 0.800% 6/7/17 LOC 20,650 20,650
Manteca CA Redevelopment Agency Tax
Allocation Revenue VRDO 0.750% 6/1/17 LOC 8,705 8,705
Metropolitan Water District of Southern
California Revenue VRDO 0.720% 6/7/17 39,200 39,200
Metropolitan Water District of Southern
California Revenue VRDO 0.720% 6/7/17 27,150 27,150
Metropolitan Water District of Southern
California Revenue VRDO 0.730% 6/7/17 34,645 34,645
Metropolitan Water District of Southern
California Revenue VRDO 0.760% 6/7/17 8,965 8,965
Modesto CA Multifamily Housing Revenue
(Westdale Commons Apartments) VRDO 0.760% 6/7/17 LOC 3,800 3,800
Modesto CA Water Revenue VRDO 0.790% 6/7/17 LOC 9,850 9,8501 Mountain View-Whisman CA School District GO
TOB VRDO 0.800% 6/7/17 4,800 4,800
Napa Valley CA Unified School District GO 2.000% 8/1/17 9,135 9,1551 Nuveen California AMT-Free Quality Municipal
Income Fund VRDP VRDO 0.860% 6/7/17 LOC 39,500 39,500
Face Market
Maturity Amount Value•
Coupon Date ($000) ($000)
19

California Municipal Money Market Fund
1 Nuveen California AMT-Free Quality Municipal
Income Fund VRDP VRDO 0.860% 6/7/17 LOC 16,200 16,2001 Nuveen California AMT-Free Quality Municipal
Income Fund VRDP VRDO 0.860% 6/7/17 LOC 40,000 40,0001 Nuveen California AMT-Free Quality Municipal
Income Fund VRDP VRDO 0.860% 6/7/17 LOC 5,000 5,0001 Nuveen California Dividend Advantage Municipal
Fund VRDP VRDO 0.900% 6/7/17 LOC 12,000 12,0001 Nuveen California Dividend Advantage Municipal
Fund VRDP VRDO 0.900% 6/7/17 LOC 9,000 9,0001 Nuveen California Dividend Advantage Municipal
Fund VRDP VRDO 0.910% 6/7/17 LOC 24,000 24,0001 Nuveen California Dividend Advantage Municipal
Fund VRDP VRDO 0.910% 6/7/17 LOC 26,800 26,8001 Nuveen California Dividend Advantage Municipal
Fund VRDP VRDO 0.910% 6/7/17 LOC 41,600 41,6001 Nuveen California Dividend Advantage Municipal
Fund VRDP VRDO 0.910% 6/7/17 LOC 40,900 40,900
Oceanside CA Multifamily Housing Revenue
(Shadow Way Apartments Project) VRDO 0.780% 6/7/17 LOC 7,425 7,425
Orange County CA Apartment Development
Revenue VRDO 0.790% 6/7/17 LOC 9,550 9,5501 Palomar CA Community College District GO
TOB VRDO 0.800% 6/7/17 6,400 6,400
Palomar Pomerado Health California GO 5.000% 8/1/17 (Prere.) 11,290 11,3671 Peralta CA Community College District Revenue
TOB VRDO 0.810% 6/7/17 15,000 15,000
Rancho CA Water District Finance Authority
Revenue VRDO 0.700% 6/7/17 LOC 18,000 18,0001 Regents of the University of California Revenue
TOB VRDO 0.800% 6/7/17 5,125 5,1251 Regents of the University of California Revenue
TOB VRDO 0.810% 6/7/17 4,109 4,1091 Regents of the University of California Revenue
TOB VRDO 0.850% 6/7/17 (Prere.) 25,293 25,293
Riverside CA COP VRDO 0.760% 6/7/17 LOC 22,100 22,1001 Riverside CA Electric Revenue TOB VRDO 0.800% 6/7/17 9,700 9,700
Riverside County CA GO 3.000% 6/30/17 33,500 33,559
Riverside County CA Teeter Revenue 3.000% 10/11/17 8,500 8,5641 Sacramento CA Area Flood Control Agency Special
Assessment Revenue TOB VRDO 0.800% 6/7/17 6,000 6,0001 Sacramento CA Area Flood Control Agency Special
Assessment Revenue TOB VRDO 0.800% 6/7/17 10,000 10,000
Sacramento CA Municipal Utility District
Revenue CP 0.940% 6/21/17 LOC 35,000 35,000
Sacramento CA Transportation Authority Sales Tax
Revenue VRDO 0.740% 6/7/17 86,100 86,100
Sacramento County CA Multifamily Housing
Revenue (River Pointe Apartments) VRDO 0.800% 6/7/17 LOC 12,300 12,300
Sacramento County CA Multifamily Housing
Revenue (River Pointe Apartments) VRDO 0.800% 6/7/17 LOC 9,700 9,700
Sacramento County CA Sanitation Districts
Financing Authority Revenue VRDO 0.730% 6/7/17 LOC 17,670 17,670
Face Market
Maturity Amount Value•
Coupon Date ($000) ($000)
20

California Municipal Money Market Fund
1 San Bernardino CA Community College District
GO TOB VRDO 0.810% 6/7/17 4,620 4,6201 San Bernardino County CA Transportation
Authority Revenue TOB VRDO 0.800% 6/7/17 12,100 12,1001 San Diego CA Community College District GO
TOB VRDO 0.800% 6/7/17 (Prere.) 5,710 5,7101 San Diego CA Community College District GO
TOB VRDO 0.830% 6/7/17 (Prere.) 3,490 3,490
San Diego CA Housing Authority Multifamily
Housing Revenue (Bay Vista Apartments
Project) VRDO 0.810% 6/7/17 LOC 9,690 9,6901 San Diego CA Public Facilities Financing
Authority Sewer Revenue TOB VRDO 0.830% 6/7/17 4,210 4,2101 San Diego CA Public Facilities Financing
Authority Water Revenue TOB VRDO 0.800% 6/7/17 3,800 3,800
San Diego CA Unified School District GO 2.000% 6/30/17 36,310 36,347
San Diego County CA Regional Transportation
Authority Sales Tax Revenue VRDO 0.730% 6/7/17 43,100 43,1001 San Diego County CA Regional Transportation
Commission Sales Tax Revenue TOB VRDO 0.800% 6/7/17 4,445 4,445
San Diego County CA Regional Transportation
Commission Sales Tax Revenue VRDO 0.730% 6/7/17 1,600 1,600
San Diego County CA Regional Transportation
Commission Sales Tax Revenue VRDO 0.730% 6/7/17 59,230 59,230
San Diego County CA Water Authority Revenue
(Extendible) CP 0.990% 12/29/17 17,500 17,500
San Diego County CA Water Authority Revenue
(Extendible) CP 0.850% 2/12/18 12,500 12,5001 San Diego County CA Water Authority Revenue
COP TOB VRDO 0.800% 6/7/17 10,100 10,100
San Diego County CA Water Authority Revenue
CP 0.840% 6/23/17 5,000 5,000
San Diego Public Facilities CP 0.970% 7/18/17 LOC 2,000 2,000
San Diego Public Facilities CP 0.990% 8/3/17 LOC 5,449 5,449
San Francisco CA Bay Area Rapid Transit District
GO 5.000% 8/1/17 (Prere.) 15,000 15,1061 San Francisco CA Bay Area Rapid Transit District
Sales Tax Revenue TOB VRDO 0.800% 6/7/17 3,750 3,7501 San Francisco CA Bay Area Rapid Transit District
Sales Tax Revenue TOB VRDO 0.810% 6/7/17 9,900 9,900
San Francisco CA City & County Finance Corp.
Lease Revenue (Moscone Center Expansion)
VRDO 0.750% 6/7/17 LOC 38,855 38,855
San Francisco CA City & County Finance Corp.
Lease Revenue (Moscone Center Expansion)
VRDO 0.750% 6/7/17 LOC 9,815 9,815
San Francisco CA City & County GO 2.000% 6/15/17 47,360 47,3831 San Francisco CA City & County GO TOB VRDO 0.790% 6/7/17 11,450 11,450
San Francisco CA City & County International
Airport Revenue CP Series A-4 0.990% 8/24/17 LOC 10,000 10,000
San Francisco CA City & County International
Airport Revenue CP Series B-1 0.960% 8/23/17 LOC 58,000 58,000
San Francisco CA City & County International
Airport Revenue VRDO 0.720% 6/7/17 LOC 7,750 7,750
Face Market
Maturity Amount Value•
Coupon Date ($000) ($000)
21

California Municipal Money Market Fund
San Francisco CA City & County International
Airport Revenue VRDO 0.720% 6/7/17 LOC 12,600 12,600
San Francisco CA City & County International
Airport Revenue VRDO 0.730% 6/7/17 LOC 17,600 17,600
San Francisco CA City & County Lease Revenue
CP 0.880% 6/7/17 17,533 17,533
San Francisco CA City & County Public Utilities
Commission Sewer Revenue CP 0.880% 6/6/17 10,121 10,1211 San Francisco CA City & County Public Utilities
Commission Water Revenue TOB VRDO 0.820% 6/7/17 (Prere.) 47,850 47,850
San Francisco CA City & County Redevelopment
Agency Multifamily Housing Revenue (Third &
Mission Streets) VRDO 0.790% 6/7/17 LOC 45,100 45,100
San Francisco CA Public Utilities Commission CP 0.930% 6/7/17 LOC 5,500 5,5001 San Joaquin Delta CA Community College
District GO TOB VRDO 0.880% 6/7/17 4,835 4,835
San Jose CA Multifamily Housing Revenue
(Cinnabar Commons) VRDO 0.810% 6/7/17 LOC 15,200 15,2001 San Jose CA Unified School District Santa Clara
County GO TOB VRDO 0.800% 6/7/17 6,000 6,0001 San Jose CA Unified School District Santa Clara
County GO TOB VRDO 0.900% 6/7/17 7,310 7,3101 San Luis Obispo County CA Financing Authority
Revenue (Nacimiento Water Project) TOB VRDO 0.810% 6/7/17 (13) 23,570 23,570
Santa Clara CA Electric Revenue VRDO 0.750% 6/7/17 LOC 2,250 2,2501 Santa Clara County CA Financing Authority Lease
Revenue (Multiple Facilities Projects) TOB VRDO 1.040% 6/7/17 (Prere.) 7,500 7,500
Santa Clara Valley CA Transportation Authority
Sales Tax Revenue VRDO 0.740% 6/7/17 15,200 15,2001 Santa Monica CA Community College District GO
TOB VRDO 0.800% 6/7/17 1,200 1,2001 Solano County CA Community College District GO
TOB VRDO 0.800% 6/7/17 3,000 3,000
Sonoma County CA Junior College District GO 3.000% 8/1/17 3,350 3,362
Southern California Public Power Authority
Revenue VRDO 0.730% 6/7/17 LOC 22,600 22,600
Turlock CA Irrigation District Revenue CP 0.950% 7/13/17 LOC 4,997 4,9971 University of California Revenue TOB VRDO 0.800% 6/7/17 5,000 5,0001 University of California Revenue TOB VRDO 0.820% 6/7/17 3,040 3,0401 University of California Revenue TOB VRDO 0.820% 6/7/17 2,675 2,675
University of California Revenue VRDO 0.740% 6/7/17 19,100 19,100
University of California Revenue VRDO 0.750% 6/7/17 90,150 90,150
Total Tax-Exempt Municipal Bonds (Cost $3,822,746) 3,822,746
Face Market
Maturity Amount Value•
Coupon Date ($000) ($000)
22
California Municipal Money Market Fund
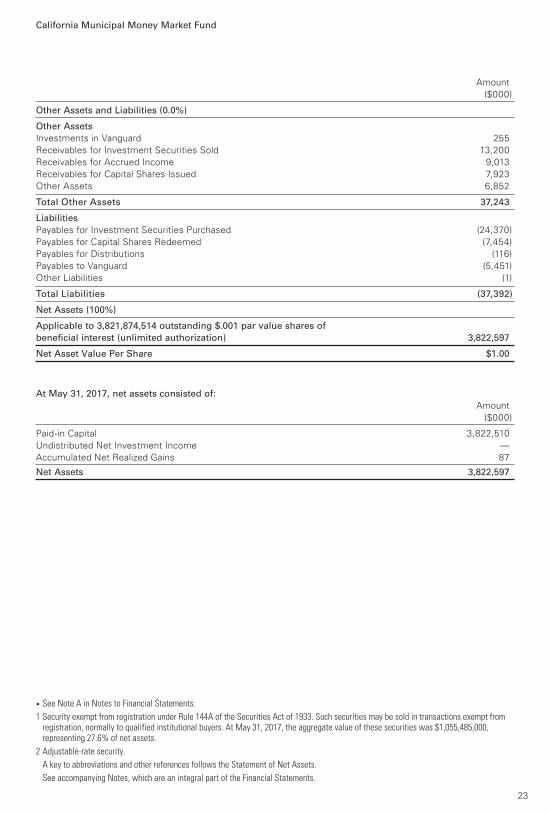
Other Assets and Liabilities (0.0%)
Other Assets
Investments in Vanguard 255
Receivables for Investment Securities Sold 13,200
Receivables for Accrued Income 9,013
Receivables for Capital Shares Issued 7,923
Other Assets 6,852
Total Other Assets 37,243
Liabilities
Payables for Investment Securities Purchased (24,370)
Payables for Capital Shares Redeemed (7,454)
Payables for Distributions (116)
Payables to Vanguard (5,451)
Other Liabilities (1)
Total Liabilities (37,392)
Net Assets (100%)
Applicable to 3,821,874,514 outstanding $.001 par value shares of
beneficial interest (unlimited authorization) 3,822,597
Net Asset Value Per Share $1.00
At May 31, 2017, net assets consisted of:
Amount
($000)
Paid-in Capital 3,822,510
Undistributed Net Investment Income —
Accumulated Net Realized Gains 87
Net Assets 3,822,597
Amount
($000)
• See Note A in Notes to Financial Statements.
1 Security exempt from registration under Rule 144A of the Securities Act of 1933. Such securities may be sold in transactions exempt from registration, normally to qualified institutional buyers. At May 31, 2017, the aggregate value of these securities was $1,055,485,000, representing 27.6% of net assets.
2 Adjustable-rate security.
A key to abbreviations and other references follows the Statement of Net Assets.
See accompanying Notes, which are an integral part of the Financial Statements.
23

California Municipal Money Market Fund
Key to Abbreviations
ARS—Auction Rate Security.
BAN—Bond Anticipation Note.
COP—Certificate of Participation.
CP—Commercial Paper.
FR—Floating Rate.
GAN—Grant Anticipation Note.
GO—General Obligation Bond.
PILOT—Payments in Lieu of Taxes.
PUT—Put Option Obligation.
RAN—Revenue Anticipation Note.
TAN—Tax Anticipation Note.
TOB—Tender Option Bond.
TRAN—Tax Revenue Anticipation Note.
VRDO—Variable Rate Demand Obligation.
VRDP—Variable Rate Demand Preferred.
(ETM)—Escrowed to Maturity.
(Prere.)—Prerefunded.
Scheduled principal and interest payments are guaranteed by:
(1) MBIA (Municipal Bond Investors Assurance).
(2) AMBAC (Ambac Assurance Corporation).
(3) FGIC (Financial Guaranty Insurance Company).
(4) AGM (Assured Guaranty Municipal Corporation).
(5) BIGI (Bond Investors Guaranty Insurance).
(6) Connie Lee Inc.
(7) FHA (Federal Housing Authority).
(8) CapMAC (Capital Markets Assurance Corporation).
(9) American Capital Access Financial Guaranty Corporation.
(10) XL Capital Assurance Inc.
(11) CIFG (CDC IXIS Financial Guaranty).
(12) AGC (Assured Guaranty Corporation).
(13) BHAC (Berkshire Hathaway Assurance Corporation).
(14) NPFG (National Public Finance Guarantee Corporation).
(15) BAM (Build America Mutual Assurance Company).
(16) MAC (Municipal Assurance Corporation).
(17) RAA (Radian Asset Assurance Inc.).
(18) SBLF (Michigan School Bond Loan Fund).
The insurance does not guarantee the market value of the municipal bonds.
LOC—Scheduled principal and interest payments are guaranteed by bank letter of credit.
24

Six Months Ended
May 31, 2017
($000)
Investment Income
Income
Interest 13,560
Total Income 13,560
Expenses
The Vanguard Group—Note B
Investment Advisory Services 513
Management and Administrative 1,945
Marketing and Distribution 431
Custodian Fees 18
Shareholders’ Reports 32
Trustees’ Fees and Expenses 1
Total Expenses 2,940
Net Investment Income 10,620
Realized Net Gain (Loss) on Investment Securities Sold 97
Net Increase (Decrease) in Net Assets Resulting from Operations 10,717
Statement of Operations
California Municipal Money Market Fund
See accompanying Notes, which are an integral part of the Financial Statements.
25

Statement of Changes in Net Assets
California Municipal Money Market Fund
See accompanying Notes, which are an integral part of the Financial Statements.
Six Months Ended Year Ended
May 31, November 30,
2017 2016
($000) ($000)
Increase (Decrease) in Net Assets
Operations
Net Investment Income 10,620 8,193
Realized Net Gain (Loss) 97 (6)
Net Increase (Decrease) in Net Assets Resulting from Operations 10,717 8,187
Distributions
Net Investment Income (10,622) (8,191)
Realized Capital Gain — —
Total Distributions (10,622) (8,191)
Capital Share Transactions (at $1.00 per share)
Issued 1,302,836 2,330,153
Issued in Lieu of Cash Distributions 9,967 7,719
Redeemed (995,368) (2,223,425)
Net Increase (Decrease) from Capital Share Transactions 317,435 114,447
Total Increase (Decrease) 317,530 114,443
Net Assets
Beginning of Period 3,505,067 3,390,624
End of Period1 3,822,597 3,505,067
1 Net Assets—End of Period includes undistributed (overdistributed) net investment income of $0 and $2,000.
26

Six Months
Ended
For a Share Outstanding May 31, Year Ended November 30,
Throughout Each Period 2017 2016 2015 2014 2013 2012
Net Asset Value, Beginning of Period $1.00 $1.00 $1.00 $1.00 $1.00 $1.00
Investment Operations
Net Investment Income .003 .002 .0001 .0001 .0001 .0003
Net Realized and Unrealized Gain (Loss)
on Investments — — — — — —
Total from Investment Operations .003 .002 .0001 .0001 .0001 .0003
Distributions
Dividends from Net Investment Income (.003) (.002) (.0001) (.0001) (.0001) (.0003)
Distributions from Realized Capital Gains — — — — — —
Total Distributions (.003) (.002) (.0001) (.0001) (.0001) (.0003)
Net Asset Value, End of Period $1.00 $1.00 $1.00 $1.00 $1.00 $1.00
Total Return1 0.29% 0.25% 0.01% 0.01% 0.01% 0.03%
Ratios/Supplemental Data
Net Assets, End of Period (Millions) $3,823 $3,505 $3,391 $3,586 $3,872 $3,813
Ratio of Total Expenses to
Average Net Assets 0.16% 0.13%2 0.06%2 0.07%2 0.11%2 0.15%2
Ratio of Net Investment Income to
Average Net Assets 0.58% 0.25% 0.01% 0.01% 0.01% 0.03%
The expense ratio and net investment income ratio for the current period have been annualized.
1 Total returns do not include account service fees that may have applied in the periods shown. Fund prospectuses provide information about any applicable account service fees.
2 The ratio of total expenses to average net assets before an expense reduction was 0.16% for 2016, 0.16% for 2015, 0.16% for 2014, 0.16% for 2013, and 0.16% for 2012. See Note B in Notes to Financial Statements.
Financial Highlights
See accompanying Notes, which are an integral part of the Financial Statements.
California Municipal Money Market Fund
27

Notes to Financial Statements
California Municipal Money Market Fund
Vanguard California Municipal Money Market Fund is registered under the Investment Company Act
of 1940 as an open-end investment company, or mutual fund. The fund invests in debt instruments
of municipal issuers whose ability to meet their obligations may be affected by economic and political
developments in the state. The fund changed its name from Vanguard California Tax-Exempt Money
Market Fund to Vanguard California Municipal Money Market Fund in March 2017.
A. The following significant accounting policies conform to generally accepted accounting principles
for U.S. investment companies. The fund consistently follows such policies in preparing its financial
statements.
1. Security Valuation: Securities are valued as of the close of trading on the New York Stock Exchange
(generally 4 p.m., Eastern time) on the valuation date. Securities are valued at amortized cost, which
approximates market value.
2. Federal Income Taxes: The fund intends to continue to qualify as a regulated investment company
and distribute all of its income. Management has analyzed the fund’s tax positions taken for all open
federal income tax years (November 30, 2013–2016), and for the period ended May 31, 2017, and has
concluded that no provision for federal income tax is required in the fund’s financial statements.
3. Distributions: Distributions from net investment income are declared daily and paid on the first
business day of the following month.
4. Credit Facility: The fund and certain other funds managed by The Vanguard Group (“Vanguard”)
participate in a $3.1 billion committed credit facility provided by a syndicate of lenders pursuant to a
credit agreement that may be renewed annually; each fund is individually liable for its borrowings, if
any, under the credit facility. Borrowings may be utilized for temporary and emergency purposes, and
are subject to the fund’s regulatory and contractual borrowing restrictions. The participating funds are
charged administrative fees and an annual commitment fee of 0.10% of the undrawn amount of the
facility; these fees are allocated to the funds based on a method approved by the fund’s board of
trustees and included in Management and Administrative expenses on the fund’s Statement of
Operations. Any borrowings under this facility bear interest at a rate based upon the higher of the
one-month London Interbank Offered Rate, federal funds effective rate, or overnight bank funding
rate plus an agreed-upon spread.
The fund had no borrowings outstanding at May 31, 2017, or at any time during the period
then ended.
5. Other: Interest income is accrued daily. Premiums and discounts on debt securities purchased are
amortized and accreted, respectively, to interest income over the lives of the respective securities.
Security transactions are accounted for on the date securities are bought or sold. Costs used to
determine realized gains (losses) on the sale of investment securities are those of the specific
securities sold.
B. In accordance with the terms of a Funds’ Service Agreement (the “FSA”) between Vanguard and
the fund, Vanguard furnishes to the fund investment advisory, corporate management, administrative,
marketing, and distribution services at Vanguard’s cost of operations (as defined by the FSA). These
costs of operations are allocated to the fund based on methods and guidelines approved by the board
of trustees. Vanguard does not require reimbursement in the current period for certain costs of
operations (such as deferred compensation/benefits and risk/insurance costs); the fund’s liability
for these costs of operations is included in Payables to Vanguard on the Statement of Net Assets.
28

California Municipal Money Market Fund
Upon the request of Vanguard, the fund may invest up to 0.40% of its net assets as capital in
Vanguard. At May 31, 2017, the fund had contributed to Vanguard capital in the amount of $255,000,
representing 0.01% of the fund’s net assets and 0.10% of Vanguard’s capitalization. The fund’s
trustees and officers are also directors and employees, respectively, of Vanguard.
Vanguard and the board of trustees have agreed to temporarily limit certain net operating expenses
in excess of the fund’s daily yield in order to maintain a zero or positive yield for the fund. Vanguard
and the board of trustees may terminate the temporary expense limitation at any time. The fund is
not obligated to repay this amount to Vanguard. For the period ended May 31, 2017, the fund did
not receive an expense reduction from Vanguard.
C. Various inputs may be used to determine the value of the fund’s investments. These inputs are
summarized in three broad levels for financial statement purposes. The inputs or methodologies
used to value securities are not necessarily an indication of the risk associated with investing in
those securities.
Level 1—Quoted prices in active markets for identical securities.
Level 2—Other significant observable inputs (including quoted prices for similar securities, interest
rates, prepayment speeds, credit risk, etc.).
Level 3—Significant unobservable inputs (including the fund’s own assumptions used to determine
the fair value of investments).
At May 31, 2017, 100% of the market value of the fund’s investments was determined using
amortized cost, in accordance with rules under the Investment Company Act of 1940. Amortized cost
approximates the current fair value of a security, but since the value is not obtained from a quoted price
in an active market, securities valued at amortized cost are considered to be valued using Level 2 inputs.
D. The fund purchased securities from and sold securities to other Vanguard funds or accounts
managed by Vanguard or its affiliates, in accordance with procedures adopted by the board of trustees
in compliance with Rule 17a-7 of the Investment Act of 1940. For the six months ended May 31,2017,
such purchases and sales were $267,351,000 and $198,016,000 respectively.
E. Management has determined that no material events or transactions occurred subsequent to
May 31, 2017, that would require recognition or disclosure in these financial statements.
29

1 The expense ratios shown are from the prospectus dated March 28, 2017, and represent estimated costs for the current fiscal year. For the six months ended May 31, 2017, the annualized expense ratios were 0.19% for Investor Shares and 0.09% for Admiral Shares.
Financial Attributes
Fund
Bloomberg
Barclays
Muni
CA IT
Bond
Index
Bloomberg
Barclays
Municipal
Bond Index
Number of Bonds 3,016 1,666 50,785
Yield to Maturity
(before expenses) 1.8% 1.6% 2.1%
Average Coupon 4.4% 4.7% 4.8%
Average Duration 5.4 years 5.0 years 6.2 years
Average Stated
Maturity 8.9 years 7.4 years 12.9 years
Short-Term Reserves 2.4% — —
Volatility Measures
Bloomberg
Barclays Muni
CA IT
Bond Index
Bloomberg
Barclays
Municipal
Bond Index
R-Squared 0.96 0.99
Beta 1.00 0.97
These measures show the degree and timing of the fund’s fluctuations compared with the indexes over 36 months.
Fund ProfileAs of May 31, 2017
Share-Class Characteristics
InvestorShares
AdmiralShares
Ticker Symbol VCAIX VCADXExpense Ratio1 0.19% 0.09%
30-Day SEC Yield 1.75% 1.85%
California Intermediate-Term Tax-Exempt Fund
30
Distribution by Stated Maturity
(% of portfolio)
Under 1 Year 4.7%
1 - 3 Years 12.6
3 - 5 Years 10.9
5 - 10 Years 26.3
10 - 20 Years 45.1
20 - 30 Years 0.4
Distribution by Credit Quality (% of portfolio)
AAA 6.7%
AA 71.3
A 14.6
BBB 5.6
BB 0.3
B 0.1
Not Rated 1.4
Credit-quality ratings are obtained from Moody's and S&P, and the higher rating for each issue is shown. "Not Rated" is used to classify securities for which a rating is not available. Not rated securities include a fund's investment in Vanguard Market Liquidity Fund or Vanguard Municipal Cash Management Fund, each of which invests in high-quality money market instruments and may serve as a cash management vehicle for the Vanguard funds, trusts, and accounts. For more information about these ratings, see the Glossary entry for Credit Quality.

California Intermediate-Term Tax-Exempt Fund
31
Investment Focus
Average Maturity
Short
High
Medium
Low
Med. Long
Credit Quality

All of the returns in this report represent past performance, which is not a guarantee of future results that may be achieved by the fund. (Current performance may be lower or higher thanthe performance data cited. For performance data current to the most recent month-end, visitour website at vanguard.com/performance.) Note, too, that both investment returns and principalvalue can fluctuate widely, so an investor’s shares, when sold, could be worth more or less than their original cost. The returns shown do not reflect taxes that a shareholder would pay on fund
distributions or on the sale of fund shares.
See Financial Highlights for dividend and capital gains information.
Performance Summary
California Intermediate-Term Tax-Exempt Fund
32
Fiscal-Year Total Returns (%): November 30, 2006, Through May 31, 2017
Investor Shares
BloombergBarclays Muni
CA ITBond Index
Fiscal Year Income Returns Capital Returns Total Returns Total Returns
2007 3.99% -1.53% 2.46% 3.84%
2008 3.79 -6.50 -2.71 1.84
2009 4.19 6.37 10.56 9.03
2010 3.79 0.64 4.43 6.89
2011 3.88 2.29 6.17 6.79
2012 3.52 6.62 10.14 9.08
2013 3.12 -5.03 -1.91 -1.15
2014 3.23 4.06 7.29 6.12
2015 2.85 0.08 2.93 2.85
2016 2.52 -3.14 -0.62 -1.16
2017 1.35 3.59 4.94 5.15
Note: For 2017, performance data reflect the six months ended May 31, 2017.
Average Annual Total Returns: Periods Ended March 31, 2017 This table presents returns through the latest calendar quarter—rather than through the end of the fiscal period.
Securities and Exchange Commission rules require that we provide this information.
Ten Years
Inception Date One Year Five Years Income Capital Total
Investor Shares 3/4/1994 -0.41% 3.22% 3.45% 0.56% 4.01%
Admiral Shares 11/12/2001 -0.31 3.31 3.53 0.56 4.09

California Intermediate-Term Tax-Exempt Fund
Financial Statements (unaudited)
Statement of Net AssetsAs of May 31, 2017
The fund reports a complete list of its holdings in regulatory filings four times in each fiscal year, at
the quarter-ends. For the second and fourth fiscal quarters, the lists appear in the fund’s semiannual
and annual reports to shareholders. For the first and third fiscal quarters, the fund files the lists with
the Securities and Exchange Commission on Form N-Q. Shareholders can look up the fund’s Forms
N-Q on the SEC’s website at sec.gov. Forms N-Q may also be reviewed and copied at the SEC’s
Public Reference Room (see the back cover of this report for further information).
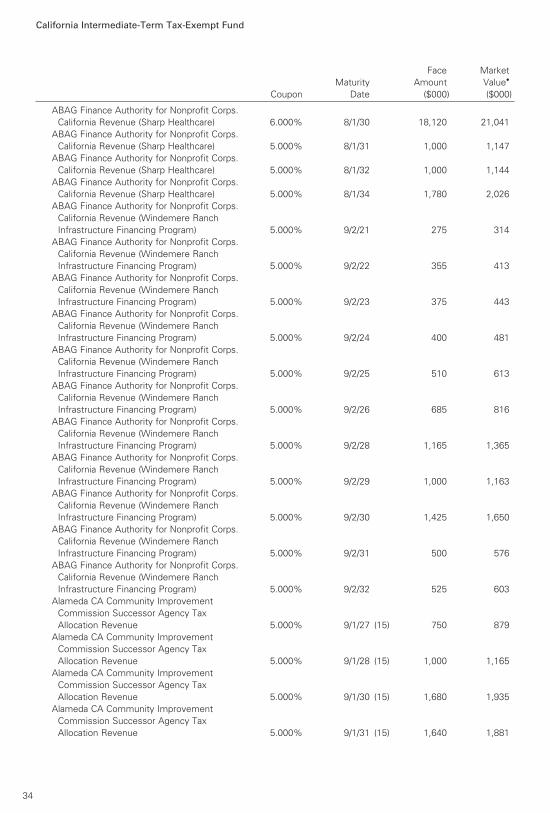
Tax-Exempt Municipal Bonds (99.7%)
California (99.4%)
ABAG Finance Authority for Nonprofit Corps.
California Revenue (Episcopal Senior
Communities) 5.000% 7/1/23 700 799
ABAG Finance Authority for Nonprofit Corps.
California Revenue (Episcopal Senior
Communities) 5.000% 7/1/24 1,195 1,355
ABAG Finance Authority for Nonprofit Corps.
California Revenue (Episcopal Senior
Communities) 6.000% 7/1/31 2,750 3,065
ABAG Finance Authority for Nonprofit Corps.
California Revenue (Episcopal Senior
Communities) 5.000% 7/1/32 1,060 1,161
ABAG Finance Authority for Nonprofit Corps.
California Revenue (Eskaton Properties Inc.
Obligated Group) 5.000% 11/15/35 3,250 3,504
ABAG Finance Authority for Nonprofit Corps.
California Revenue (Jackson Laboratory) 5.000% 7/1/20 850 943
ABAG Finance Authority for Nonprofit Corps.
California Revenue (Jackson Laboratory) 5.000% 7/1/22 555 646
ABAG Finance Authority for Nonprofit Corps.
California Revenue (Jackson Laboratory) 5.000% 7/1/23 1,000 1,155
ABAG Finance Authority for Nonprofit Corps.
California Revenue (Jackson Laboratory) 5.000% 7/1/24 1,265 1,451
ABAG Finance Authority for Nonprofit Corps.
California Revenue (Odd Fellows Home) 5.000% 4/1/32 7,250 8,347
ABAG Finance Authority for Nonprofit Corps.
California Revenue (Sharp Healthcare) 5.000% 8/1/21 1,000 1,152
ABAG Finance Authority for Nonprofit Corps.
California Revenue (Sharp Healthcare) 5.250% 8/1/23 1,000 1,150
ABAG Finance Authority for Nonprofit Corps.
California Revenue (Sharp Healthcare) 5.000% 8/1/24 960 1,103
ABAG Finance Authority for Nonprofit Corps.
California Revenue (Sharp Healthcare) 5.000% 8/1/25 950 1,089
ABAG Finance Authority for Nonprofit Corps.
California Revenue (Sharp Healthcare) 5.000% 8/1/26 2,490 2,837
ABAG Finance Authority for Nonprofit Corps.
California Revenue (Sharp Healthcare) 5.000% 8/1/28 900 1,023
Face Market
Maturity Amount Value•
Coupon Date ($000) ($000)
33
California Intermediate-Term Tax-Exempt Fund
ABAG Finance Authority for Nonprofit Corps.
California Revenue (Sharp Healthcare) 6.000% 8/1/30 18,120 21,041
ABAG Finance Authority for Nonprofit Corps.
California Revenue (Sharp Healthcare) 5.000% 8/1/31 1,000 1,147
ABAG Finance Authority for Nonprofit Corps.
California Revenue (Sharp Healthcare) 5.000% 8/1/32 1,000 1,144
ABAG Finance Authority for Nonprofit Corps.
California Revenue (Sharp Healthcare) 5.000% 8/1/34 1,780 2,026
ABAG Finance Authority for Nonprofit Corps.
California Revenue (Windemere Ranch
Infrastructure Financing Program) 5.000% 9/2/21 275 314
ABAG Finance Authority for Nonprofit Corps.
California Revenue (Windemere Ranch
Infrastructure Financing Program) 5.000% 9/2/22 355 413
ABAG Finance Authority for Nonprofit Corps.
California Revenue (Windemere Ranch
Infrastructure Financing Program) 5.000% 9/2/23 375 443
ABAG Finance Authority for Nonprofit Corps.
California Revenue (Windemere Ranch
Infrastructure Financing Program) 5.000% 9/2/24 400 481
ABAG Finance Authority for Nonprofit Corps.
California Revenue (Windemere Ranch
Infrastructure Financing Program) 5.000% 9/2/25 510 613
ABAG Finance Authority for Nonprofit Corps.
California Revenue (Windemere Ranch
Infrastructure Financing Program) 5.000% 9/2/26 685 816
ABAG Finance Authority for Nonprofit Corps.
California Revenue (Windemere Ranch
Infrastructure Financing Program) 5.000% 9/2/28 1,165 1,365
ABAG Finance Authority for Nonprofit Corps.
California Revenue (Windemere Ranch
Infrastructure Financing Program) 5.000% 9/2/29 1,000 1,163
ABAG Finance Authority for Nonprofit Corps.
California Revenue (Windemere Ranch
Infrastructure Financing Program) 5.000% 9/2/30 1,425 1,650
ABAG Finance Authority for Nonprofit Corps.
California Revenue (Windemere Ranch
Infrastructure Financing Program) 5.000% 9/2/31 500 576
ABAG Finance Authority for Nonprofit Corps.
California Revenue (Windemere Ranch
Infrastructure Financing Program) 5.000% 9/2/32 525 603
Alameda CA Community Improvement
Commission Successor Agency Tax
Allocation Revenue 5.000% 9/1/27 (15) 750 879
Alameda CA Community Improvement
Commission Successor Agency Tax
Allocation Revenue 5.000% 9/1/28 (15) 1,000 1,165
Alameda CA Community Improvement
Commission Successor Agency Tax
Allocation Revenue 5.000% 9/1/30 (15) 1,680 1,935
Alameda CA Community Improvement
Commission Successor Agency Tax
Allocation Revenue 5.000% 9/1/31 (15) 1,640 1,881
Face Market
Maturity Amount Value•
Coupon Date ($000) ($000)
34
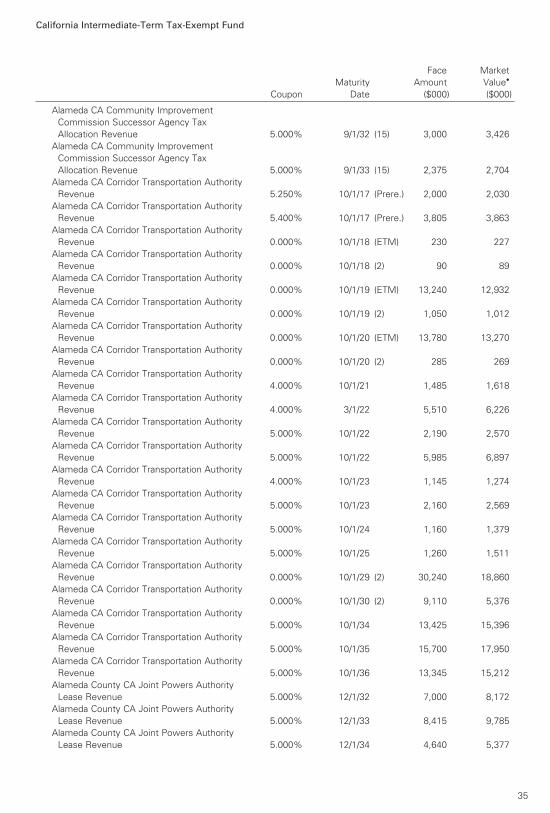
California Intermediate-Term Tax-Exempt Fund
Alameda CA Community Improvement
Commission Successor Agency Tax
Allocation Revenue 5.000% 9/1/32 (15) 3,000 3,426
Alameda CA Community Improvement
Commission Successor Agency Tax
Allocation Revenue 5.000% 9/1/33 (15) 2,375 2,704
Alameda CA Corridor Transportation Authority
Revenue 5.250% 10/1/17 (Prere.) 2,000 2,030
Alameda CA Corridor Transportation Authority
Revenue 5.400% 10/1/17 (Prere.) 3,805 3,863
Alameda CA Corridor Transportation Authority
Revenue 0.000% 10/1/18 (ETM) 230 227
Alameda CA Corridor Transportation Authority
Revenue 0.000% 10/1/18 (2) 90 89
Alameda CA Corridor Transportation Authority
Revenue 0.000% 10/1/19 (ETM) 13,240 12,932
Alameda CA Corridor Transportation Authority
Revenue 0.000% 10/1/19 (2) 1,050 1,012
Alameda CA Corridor Transportation Authority
Revenue 0.000% 10/1/20 (ETM) 13,780 13,270
Alameda CA Corridor Transportation Authority
Revenue 0.000% 10/1/20 (2) 285 269
Alameda CA Corridor Transportation Authority
Revenue 4.000% 10/1/21 1,485 1,618
Alameda CA Corridor Transportation Authority
Revenue 4.000% 3/1/22 5,510 6,226
Alameda CA Corridor Transportation Authority
Revenue 5.000% 10/1/22 2,190 2,570
Alameda CA Corridor Transportation Authority
Revenue 5.000% 10/1/22 5,985 6,897
Alameda CA Corridor Transportation Authority
Revenue 4.000% 10/1/23 1,145 1,274
Alameda CA Corridor Transportation Authority
Revenue 5.000% 10/1/23 2,160 2,569
Alameda CA Corridor Transportation Authority
Revenue 5.000% 10/1/24 1,160 1,379
Alameda CA Corridor Transportation Authority
Revenue 5.000% 10/1/25 1,260 1,511
Alameda CA Corridor Transportation Authority
Revenue 0.000% 10/1/29 (2) 30,240 18,860
Alameda CA Corridor Transportation Authority
Revenue 0.000% 10/1/30 (2) 9,110 5,376
Alameda CA Corridor Transportation Authority
Revenue 5.000% 10/1/34 13,425 15,396
Alameda CA Corridor Transportation Authority
Revenue 5.000% 10/1/35 15,700 17,950
Alameda CA Corridor Transportation Authority
Revenue 5.000% 10/1/36 13,345 15,212
Alameda County CA Joint Powers Authority
Lease Revenue 5.000% 12/1/32 7,000 8,172
Alameda County CA Joint Powers Authority
Lease Revenue 5.000% 12/1/33 8,415 9,785
Alameda County CA Joint Powers Authority
Lease Revenue 5.000% 12/1/34 4,640 5,377
Face Market
Maturity Amount Value•
Coupon Date ($000) ($000)
35

California Intermediate-Term Tax-Exempt Fund
Alameda County CA Unified School District GO 5.000% 8/1/34 2,890 3,386
Alum Rock CA Union Elementary School
District GO 5.000% 8/1/22 (15) 500 590
Alum Rock CA Union Elementary School
District GO 5.000% 8/1/23 (15) 800 963
Alum Rock CA Union Elementary School
District GO 5.000% 8/1/24 (15) 1,000 1,220
Alum Rock CA Union Elementary School
District GO 5.000% 8/1/25 (15) 1,000 1,235
Alvord CA Unified School District GO 5.900% 2/1/21 (14) 2,230 2,583
Alvord CA Unified School District GO 5.900% 2/1/24 (4) 3,865 4,582
Anaheim CA Housing & Public Improvements
Authority Revenue (Electric Utility Distribution
System) 5.000% 10/1/31 4,225 4,800
Anaheim CA Housing & Public Improvements
Authority Revenue (Electric Utility Distribution
System) 5.000% 10/1/32 2,605 2,944
Anaheim CA Housing & Public Improvements
Authority Revenue (Electric Utility Distribution
System) 5.000% 10/1/33 4,500 5,076
Anaheim CA Housing & Public Improvements
Authority Revenue (Electric Utility Distribution
System) 5.000% 10/1/34 7,500 8,437
Anaheim CA Housing & Public Improvements
Authority Revenue (Electric Utility Distribution
System) 5.000% 10/1/36 1,955 2,197
Anaheim CA Housing & Public Improvements
Authority Revenue (Water System Project) 5.000% 10/1/31 300 344
Anaheim CA Housing & Public Improvements
Authority Revenue (Water System Project) 5.000% 10/1/32 300 342
Anaheim CA Housing & Public Improvements
Authority Revenue (Water System Project) 5.000% 10/1/33 765 870
Anaheim CA Housing & Public Improvements
Authority Revenue (Water System Project) 5.000% 10/1/34 1,000 1,132
Anaheim CA Housing & Public Improvements
Authority Revenue (Water System Project) 5.000% 10/1/35 505 570
Anaheim CA Housing & Public Improvements
Authority Revenue (Water System Project) 5.000% 10/1/36 500 563
Anaheim CA Public Financing Authority
Revenue (Electric System) 5.250% 10/1/30 5,585 6,337
Anaheim CA Public Financing Authority
Revenue (Electric System) 4.000% 10/1/31 12,000 12,995
Arcadia CA Unified School District GO 4.000% 8/1/28 2,125 2,398
Arcadia CA Unified School District GO 4.000% 8/1/29 2,675 2,991
Bakersfield CA Wastewater Revenue 5.000% 9/15/17 (Prere.) 7,600 7,692
Bay Area Toll Authority California Toll Bridge
Revenue (San Francisco Bay Area) 5.000% 4/1/18 2,610 2,619
Bay Area Toll Authority California Toll Bridge
Revenue (San Francisco Bay Area) 5.000% 4/1/19 (Prere.) 75 81
Bay Area Toll Authority California Toll Bridge
Revenue (San Francisco Bay Area) 5.250% 4/1/19 (Prere.) 11,355 12,250
Bay Area Toll Authority California Toll Bridge
Revenue (San Francisco Bay Area) 5.000% 4/1/25 6,275 7,362
Face Market
Maturity Amount Value•
Coupon Date ($000) ($000)
36

California Intermediate-Term Tax-Exempt Fund
Bay Area Toll Authority California Toll Bridge
Revenue (San Francisco Bay Area) 5.000% 4/1/28 5,000 5,851
Bay Area Toll Authority California Toll Bridge
Revenue (San Francisco Bay Area) 5.000% 4/1/28 5,000 5,882
Bay Area Toll Authority California Toll Bridge
Revenue (San Francisco Bay Area) 5.000% 4/1/29 7,000 8,184
Bay Area Toll Authority California Toll Bridge
Revenue (San Francisco Bay Area) 5.000% 4/1/29 8,000 9,384
Bay Area Toll Authority California Toll Bridge
Revenue (San Francisco Bay Area) 5.000% 4/1/30 16,700 19,238
Bay Area Toll Authority California Toll Bridge
Revenue (San Francisco Bay Area) 4.000% 4/1/31 4,000 4,232
Bay Area Toll Authority California Toll Bridge
Revenue (San Francisco Bay Area) 5.000% 4/1/31 7,645 8,883
Bay Area Toll Authority California Toll Bridge
Revenue (San Francisco Bay Area) 5.000% 4/1/31 16,125 18,576
Bay Area Toll Authority California Toll Bridge
Revenue (San Francisco Bay Area) PUT 1.500% 4/2/18 14,275 14,303
Bay Area Toll Authority California Toll Bridge
Revenue (San Francisco Bay Area) PUT 1.875% 4/1/19 4,500 4,553
Bay Area Toll Authority California Toll Bridge
Revenue (San Francisco Bay Area) PUT 1.875% 4/1/20 25,000 25,3241 Bay Area Toll Authority California Toll Bridge
Revenue (San Francisco Bay Area) PUT 1.480% 4/1/21 20,500 20,482
Bay Area Toll Authority California Toll Bridge
Revenue (San Francisco Bay Area) PUT 2.000% 4/1/21 34,000 34,7911 Bay Area Toll Authority California Toll Bridge
Revenue (San Francisco Bay Area) PUT 1.680% 5/1/23 19,000 19,0961 Bay Area Toll Authority California Toll Bridge
Revenue (San Francisco Bay Area) PUT 1.680% 5/1/23 4,350 4,3721 Bay Area Toll Authority California Toll Bridge
Revenue (San Francisco Bay Area) PUT 1.880% 4/1/24 6,100 6,192
Bay Area Toll Authority California Toll Bridge
Revenue (San Francisco Bay Area) PUT 2.850% 4/1/25 11,250 11,870
Brea CA Redevelopment Agency Successor
Agency Tax Allocation Revenue
(Redevelopment Project AB) 5.000% 8/1/21 5,500 6,295
Brea CA Redevelopment Agency Successor
Agency Tax Allocation Revenue
(Redevelopment Project AB) 5.000% 8/1/24 5,110 6,035
Brea CA Redevelopment Agency Successor
Agency Tax Allocation Revenue
(Redevelopment Project AB) 0.000% 8/1/29 (2) 3,065 1,975
Brentwood CA Infrastructure Financing
Authority Revenue 5.000% 9/2/24 (4) 1,000 1,215
Brentwood CA Infrastructure Financing
Authority Revenue 5.000% 9/2/25 (4) 1,430 1,721
Brentwood CA Infrastructure Financing
Authority Revenue 5.000% 9/2/26 (4) 2,000 2,392
Brentwood CA Infrastructure Financing
Authority Revenue 5.000% 9/2/27 (4) 2,375 2,816
Brentwood CA Infrastructure Financing
Authority Revenue 5.000% 9/2/29 (4) 1,240 1,449
Face Market
Maturity Amount Value•
Coupon Date ($000) ($000)
37
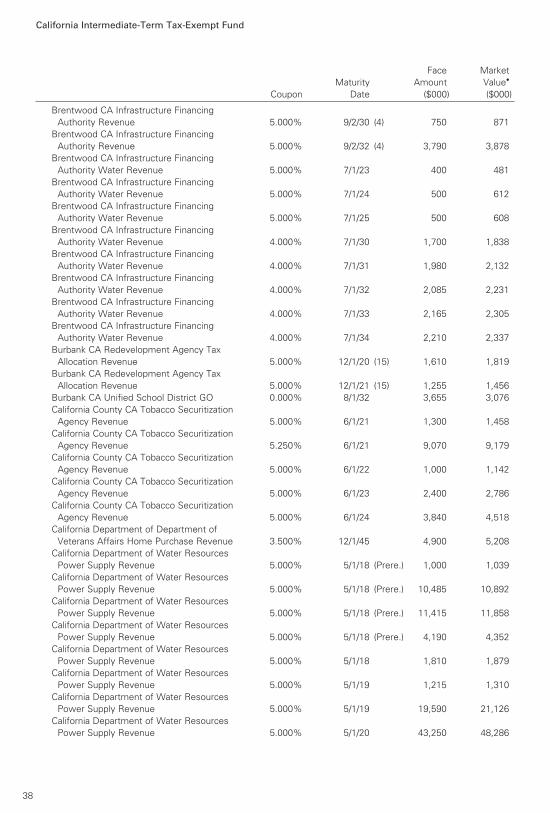
California Intermediate-Term Tax-Exempt Fund
Brentwood CA Infrastructure Financing
Authority Revenue 5.000% 9/2/30 (4) 750 871
Brentwood CA Infrastructure Financing
Authority Revenue 5.000% 9/2/32 (4) 3,790 3,878
Brentwood CA Infrastructure Financing
Authority Water Revenue 5.000% 7/1/23 400 481
Brentwood CA Infrastructure Financing
Authority Water Revenue 5.000% 7/1/24 500 612
Brentwood CA Infrastructure Financing
Authority Water Revenue 5.000% 7/1/25 500 608
Brentwood CA Infrastructure Financing
Authority Water Revenue 4.000% 7/1/30 1,700 1,838
Brentwood CA Infrastructure Financing
Authority Water Revenue 4.000% 7/1/31 1,980 2,132
Brentwood CA Infrastructure Financing
Authority Water Revenue 4.000% 7/1/32 2,085 2,231
Brentwood CA Infrastructure Financing
Authority Water Revenue 4.000% 7/1/33 2,165 2,305
Brentwood CA Infrastructure Financing
Authority Water Revenue 4.000% 7/1/34 2,210 2,337
Burbank CA Redevelopment Agency Tax
Allocation Revenue 5.000% 12/1/20 (15) 1,610 1,819
Burbank CA Redevelopment Agency Tax
Allocation Revenue 5.000% 12/1/21 (15) 1,255 1,456
Burbank CA Unified School District GO 0.000% 8/1/32 3,655 3,076
California County CA Tobacco Securitization
Agency Revenue 5.000% 6/1/21 1,300 1,458
California County CA Tobacco Securitization
Agency Revenue 5.250% 6/1/21 9,070 9,179
California County CA Tobacco Securitization
Agency Revenue 5.000% 6/1/22 1,000 1,142
California County CA Tobacco Securitization
Agency Revenue 5.000% 6/1/23 2,400 2,786
California County CA Tobacco Securitization
Agency Revenue 5.000% 6/1/24 3,840 4,518
California Department of Department of
Veterans Affairs Home Purchase Revenue 3.500% 12/1/45 4,900 5,208
California Department of Water Resources
Power Supply Revenue 5.000% 5/1/18 (Prere.) 1,000 1,039
California Department of Water Resources
Power Supply Revenue 5.000% 5/1/18 (Prere.) 10,485 10,892
California Department of Water Resources
Power Supply Revenue 5.000% 5/1/18 (Prere.) 11,415 11,858
California Department of Water Resources
Power Supply Revenue 5.000% 5/1/18 (Prere.) 4,190 4,352
California Department of Water Resources
Power Supply Revenue 5.000% 5/1/18 1,810 1,879
California Department of Water Resources
Power Supply Revenue 5.000% 5/1/19 1,215 1,310
California Department of Water Resources
Power Supply Revenue 5.000% 5/1/19 19,590 21,126
California Department of Water Resources
Power Supply Revenue 5.000% 5/1/20 43,250 48,286
Face Market
Maturity Amount Value•
Coupon Date ($000) ($000)
38

California Intermediate-Term Tax-Exempt Fund
California Department of Water Resources
Power Supply Revenue 5.000% 5/1/20 (Prere.) 3,100 3,458
California Department of Water Resources
Power Supply Revenue 5.000% 5/1/20 (Prere.) 6,715 7,490
California Department of Water Resources
Power Supply Revenue 5.000% 5/1/20 23,890 26,672
California Department of Water Resources
Power Supply Revenue 5.000% 5/1/21 6,500 7,484
California Department of Water Resources
Power Supply Revenue 5.000% 5/1/21 15,000 17,270
California Department of Water Resources
Power Supply Revenue 5.000% 5/1/21 1,910 2,129
California Department of Water Resources
Power Supply Revenue 5.000% 5/1/22 31,570 37,265
California Department of Water Resources
Power Supply Revenue 5.000% 5/1/22 4,110 4,578
California Department of Water Resources Water
System Revenue (Central Valley Project) 5.000% 6/1/18 (Prere.) 4,905 5,111
California Department of Water Resources Water
System Revenue (Central Valley Project) 5.000% 6/1/18 (Prere.) 8,280 8,627
California Department of Water Resources Water
System Revenue (Central Valley Project) 4.000% 12/1/19 6,020 6,484
California Department of Water Resources Water
System Revenue (Central Valley Project) 5.000% 12/1/19 (Prere.) 7,960 8,760
California Department of Water Resources Water
System Revenue (Central Valley Project) 5.000% 12/1/19 (ETM) 10 11
California Department of Water Resources Water
System Revenue (Central Valley Project) 5.000% 12/1/19 4,340 4,782
California Department of Water Resources Water
System Revenue (Central Valley Project) 4.000% 12/1/20 4,000 4,416
California Department of Water Resources Water
System Revenue (Central Valley Project) 5.000% 12/1/20 (ETM) 30 34
California Department of Water Resources Water
System Revenue (Central Valley Project) 5.000% 12/1/20 1,220 1,389
California Department of Water Resources Water
System Revenue (Central Valley Project) 5.250% 12/1/20 (Prere.) 1,850 2,121
California Department of Water Resources Water
System Revenue (Central Valley Project) 5.250% 12/1/20 (Prere.) 2,905 3,331
California Department of Water Resources Water
System Revenue (Central Valley Project) 5.250% 12/1/20 (Prere.) 3,355 3,847
California Department of Water Resources Water
System Revenue (Central Valley Project) 5.250% 12/1/20 (Prere.) 3,455 3,961
California Department of Water Resources Water
System Revenue (Central Valley Project) 5.250% 12/1/20 (Prere.) 25 29
California Department of Water Resources Water
System Revenue (Central Valley Project) 5.250% 12/1/20 (Prere.) 30 34
California Department of Water Resources Water
System Revenue (Central Valley Project) 5.250% 12/1/20 (Prere.) 30 34
California Department of Water Resources Water
System Revenue (Central Valley Project) 5.000% 12/1/21 (Prere.) 2,720 3,181
California Department of Water Resources Water
System Revenue (Central Valley Project) 5.000% 12/1/21 (Prere.) 3,910 4,572
California Department of Water Resources Water
System Revenue (Central Valley Project) 5.000% 12/1/21 (ETM) 1,045 1,221
Face Market
Maturity Amount Value•
Coupon Date ($000) ($000)
39

California Intermediate-Term Tax-Exempt Fund
California Department of Water Resources Water
System Revenue (Central Valley Project) 5.000% 12/1/21 4,600 5,385
California Department of Water Resources Water
System Revenue (Central Valley Project) 5.000% 12/1/21 2,410 2,822
California Department of Water Resources Water
System Revenue (Central Valley Project) 5.000% 12/1/21 (Prere.) 3,320 3,881
California Department of Water Resources Water
System Revenue (Central Valley Project) 5.000% 12/1/21 (Prere.) 3,500 4,091
California Department of Water Resources Water
System Revenue (Central Valley Project) 5.000% 12/1/22 (ETM) 1,105 1,323
California Department of Water Resources Water
System Revenue (Central Valley Project) 5.000% 12/1/22 (Prere.) 505 605
California Department of Water Resources Water
System Revenue (Central Valley Project) 5.000% 12/1/22 4,895 5,873
California Department of Water Resources Water
System Revenue (Central Valley Project) 5.000% 12/1/23 (ETM) 55 67
California Department of Water Resources Water
System Revenue (Central Valley Project) 5.000% 12/1/24 95 99
California Department of Water Resources Water
System Revenue (Central Valley Project) 5.000% 12/1/24 (ETM) 30 38
California Department of Water Resources Water
System Revenue (Central Valley Project) 5.000% 12/1/24 (Prere.) 5 6
California Department of Water Resources Water
System Revenue (Central Valley Project) 5.000% 12/1/24 (Prere.) 10 13
California Department of Water Resources Water
System Revenue (Central Valley Project) 5.000% 12/1/24 9,470 11,820
California Department of Water Resources Water
System Revenue (Central Valley Project) 5.000% 12/1/26 285 297
California Department of Water Resources Water
System Revenue (Central Valley Project) 5.000% 12/1/26 1,945 2,398
California Department of Water Resources Water
System Revenue (Central Valley Project) 5.000% 12/1/27 840 924
California Department of Water Resources Water
System Revenue (Central Valley Project) 5.000% 12/1/27 4,050 4,958
California Department of Water Resources Water
System Revenue (Central Valley Project) 5.250% 12/1/27 970 1,108
California Department of Water Resources Water
System Revenue (Central Valley Project) 5.000% 12/1/28 30 35
California Department of Water Resources Water
System Revenue (Central Valley Project) 5.250% 12/1/28 1,120 1,279
California Department of Water Resources Water
System Revenue (Central Valley Project) 5.000% 12/1/29 7,750 9,181
California Department of Water Resources Water
System Revenue (Central Valley Project) 5.000% 12/1/29 30 34
California Department of Water Resources Water
System Revenue (Central Valley Project) 5.250% 12/1/29 1,155 1,3192 California Department of Water Resources Water
System Revenue (Central Valley Project) TOB
VRDO 0.800% 6/7/17 (Prere.) 3,985 3,985
California Economic Recovery GO 5.000% 7/1/19 (Prere.) 43,745 47,457
California Economic Recovery GO 5.000% 7/1/19 (ETM) 32,330 35,0743 California Economic Recovery GO 5.250% 7/1/19 (Prere.) 28,845 31,441
California Economic Recovery GO 5.250% 7/1/19 (Prere.) 16,540 18,029
Face Market
Maturity Amount Value•
Coupon Date ($000) ($000)
40
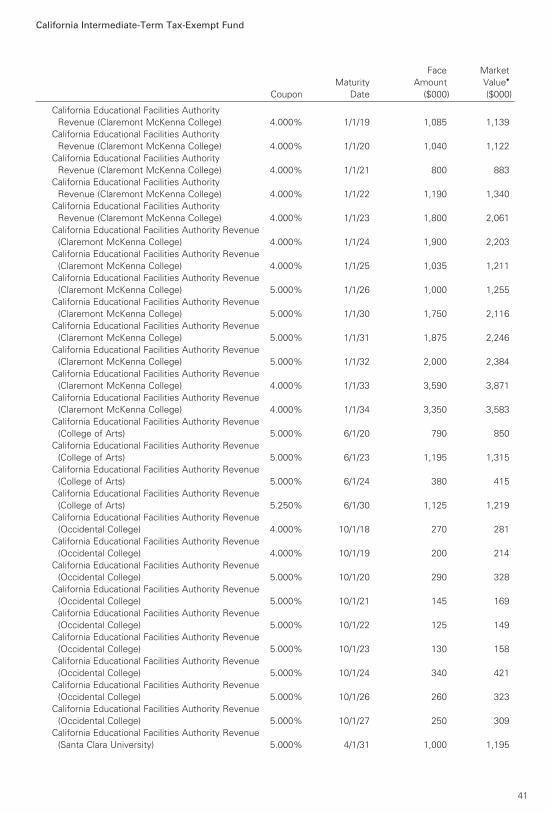
California Intermediate-Term Tax-Exempt Fund
California Educational Facilities Authority
Revenue (Claremont McKenna College) 4.000% 1/1/19 1,085 1,139
California Educational Facilities Authority
Revenue (Claremont McKenna College) 4.000% 1/1/20 1,040 1,122
California Educational Facilities Authority
Revenue (Claremont McKenna College) 4.000% 1/1/21 800 883
California Educational Facilities Authority
Revenue (Claremont McKenna College) 4.000% 1/1/22 1,190 1,340
California Educational Facilities Authority
Revenue (Claremont McKenna College) 4.000% 1/1/23 1,800 2,061
California Educational Facilities Authority Revenue
(Claremont McKenna College) 4.000% 1/1/24 1,900 2,203
California Educational Facilities Authority Revenue
(Claremont McKenna College) 4.000% 1/1/25 1,035 1,211
California Educational Facilities Authority Revenue
(Claremont McKenna College) 5.000% 1/1/26 1,000 1,255
California Educational Facilities Authority Revenue
(Claremont McKenna College) 5.000% 1/1/30 1,750 2,116
California Educational Facilities Authority Revenue
(Claremont McKenna College) 5.000% 1/1/31 1,875 2,246
California Educational Facilities Authority Revenue
(Claremont McKenna College) 5.000% 1/1/32 2,000 2,384
California Educational Facilities Authority Revenue
(Claremont McKenna College) 4.000% 1/1/33 3,590 3,871
California Educational Facilities Authority Revenue
(Claremont McKenna College) 4.000% 1/1/34 3,350 3,583
California Educational Facilities Authority Revenue
(College of Arts) 5.000% 6/1/20 790 850
California Educational Facilities Authority Revenue
(College of Arts) 5.000% 6/1/23 1,195 1,315
California Educational Facilities Authority Revenue
(College of Arts) 5.000% 6/1/24 380 415
California Educational Facilities Authority Revenue
(College of Arts) 5.250% 6/1/30 1,125 1,219
California Educational Facilities Authority Revenue
(Occidental College) 4.000% 10/1/18 270 281
California Educational Facilities Authority Revenue
(Occidental College) 4.000% 10/1/19 200 214
California Educational Facilities Authority Revenue
(Occidental College) 5.000% 10/1/20 290 328
California Educational Facilities Authority Revenue
(Occidental College) 5.000% 10/1/21 145 169
California Educational Facilities Authority Revenue
(Occidental College) 5.000% 10/1/22 125 149
California Educational Facilities Authority Revenue
(Occidental College) 5.000% 10/1/23 130 158
California Educational Facilities Authority Revenue
(Occidental College) 5.000% 10/1/24 340 421
California Educational Facilities Authority Revenue
(Occidental College) 5.000% 10/1/26 260 323
California Educational Facilities Authority Revenue
(Occidental College) 5.000% 10/1/27 250 309
California Educational Facilities Authority Revenue
(Santa Clara University) 5.000% 4/1/31 1,000 1,195
Face Market
Maturity Amount Value•
Coupon Date ($000) ($000)
41

California Intermediate-Term Tax-Exempt Fund
California Educational Facilities Authority Revenue
(Santa Clara University) 5.000% 4/1/32 1,000 1,190
California Educational Facilities Authority Revenue
(Santa Clara University) 5.000% 4/1/33 1,545 1,829
California Educational Facilities Authority Revenue
(Santa Clara University) 5.000% 4/1/34 2,625 3,085
California Educational Facilities Authority Revenue
(Santa Clara University) 5.000% 4/1/35 3,100 3,634
California Educational Facilities Authority Revenue
(University of Southern California) 5.000% 10/1/25 5,000 6,2802 California Educational Facilities Authority Revenue
(University of Southern California) TOB VRDO 0.810% 6/7/17 614 6142 California Educational Facilities Authority Revenue
(University of Southern California) TOB VRDO 0.840% 6/7/17 11,242 11,242
California Educational Facilities Authority Revenue
(University of the Pacific) 5.000% 11/1/20 1,770 1,994
California Educational Facilities Authority Revenue
(University of the Pacific) 5.000% 11/1/21 2,100 2,430
California Educational Facilities Authority Revenue
(University of the Pacific) 5.000% 11/1/22 2,130 2,516
California Educational Facilities Authority Revenue
(University of the Pacific) 5.000% 11/1/23 1,870 2,250
California Educational Facilities Authority Revenue
(University of the Pacific) 5.000% 11/1/24 2,500 3,057
California Educational Facilities Authority Revenue
(University of the Pacific) 5.000% 11/1/25 2,315 2,863
California Educational Facilities Authority Revenue
(University of the Pacific) 5.000% 11/1/31 1,005 1,175
California GO 4.000% 9/1/17 1,375 1,386
California GO 5.000% 12/1/17 (Prere.) 2,000 2,042
California GO 5.250% 2/1/18 (14) 8,000 8,238
California GO 6.000% 2/1/18 (2) 6,240 6,457
California GO 5.000% 3/1/18 1,850 1,908
California GO 5.500% 4/1/18 15,250 15,848
California GO 5.000% 8/1/18 1,065 1,117
California GO 5.000% 8/1/18 5 5
California GO 5.000% 8/1/18 12,000 12,584
California GO 5.000% 10/1/18 14,095 14,876
California GO 5.000% 10/1/18 20,000 21,109
California GO 5.000% 2/1/19 4,715 5,039
California GO 5.500% 4/1/19 11,245 12,190
California GO 5.000% 8/1/19 35,445 38,558
California GO 5.000% 8/1/19 12,695 13,810
California GO 4.000% 9/1/19 2,100 2,244
California GO 5.000% 9/1/19 5,000 5,455
California GO 5.000% 9/1/19 9,000 9,819
California GO 5.000% 10/1/19 21,000 22,978
California GO 2.000% 11/1/19 6,695 6,868
California GO 5.000% 2/1/20 2,950 3,262
California GO 5.250% 2/1/20 7,500 8,343
California GO 5.000% 3/1/20 19,535 21,662
California GO 5.000% 8/1/20 35 35
California GO 5.000% 9/1/20 17,445 19,657
California GO 5.000% 9/1/20 3,690 4,158
Face Market
Maturity Amount Value•
Coupon Date ($000) ($000)
42

California Intermediate-Term Tax-Exempt Fund
California GO 5.000% 9/1/20 6,000 6,761
California GO 5.000% 10/1/20 5,555 6,276
California GO 5.250% 10/1/20 4,500 4,945
California GO 5.000% 11/1/20 47,795 54,137
California GO 5.000% 2/1/21 2,000 2,282
California GO 5.000% 3/1/21 2,250 2,491
California GO 5.000% 4/1/21 2,240 2,568
California GO 5.500% 4/1/21 2,000 2,171
California GO 5.000% 9/1/21 9,800 11,365
California GO 5.000% 9/1/21 13,700 15,887
California GO 5.000% 9/1/21 1,310 1,519
California GO 5.000% 10/1/21 2,575 2,993
California GO 5.000% 11/1/21 2,820 3,285
California GO 5.000% 2/1/22 1,210 1,418
California GO 5.000% 2/1/22 8,155 9,557
California GO 5.000% 4/1/22 4,550 5,355
California GO 5.000% 9/1/22 12,710 15,110
California GO 5.000% 9/1/22 10,000 11,888
California GO 5.250% 9/1/22 17,400 20,906
California GO 5.000% 10/1/22 15,000 17,868
California GO 5.000% 11/1/22 31,890 38,060
California GO 5.000% 2/1/23 15,000 17,968
California GO 5.000% 2/1/23 15,880 18,485
California GO 5.000% 9/1/23 7,000 8,271
California GO 5.000% 9/1/23 10,075 12,218
California GO 5.250% 9/1/23 2,455 2,881
California GO 5.000% 10/1/23 12,450 15,123
California GO 5.000% 10/1/23 3,135 3,808
California GO 5.000% 11/1/23 20,000 24,335
California GO 5.000% 2/1/24 11,000 13,098
California GO 5.000% 3/1/24 3,000 3,322
California GO 5.000% 8/1/24 1,000 1,231
California GO 5.000% 8/1/24 25 25
California GO 5.000% 9/1/24 10,000 11,805
California GO 5.000% 9/1/24 1,000 1,233
California GO 5.000% 10/1/24 8,725 10,770
California GO 5.000% 11/1/24 5,000 5,653
California GO 5.000% 12/1/24 15,500 18,782
California GO 5.000% 2/1/25 12,940 15,012
California GO 5.500% 2/1/25 21,045 26,784
California GO 5.125% 3/1/25 2,100 2,167
California GO 5.000% 8/1/25 45 45
California GO 5.000% 9/1/25 1,500 1,576
California GO 5.000% 9/1/25 2,185 2,577
California GO 5.000% 9/1/25 2,110 2,541
California GO 5.000% 9/1/25 4,000 4,983
California GO 5.000% 10/1/25 8,490 8,780
California GO 5.000% 10/1/25 13,865 16,508
California GO 5.000% 11/1/25 14,125 17,242
California GO 5.000% 11/1/25 1,500 1,696
California GO 5.000% 3/1/26 5,000 5,534
California GO 5.000% 4/1/26 27,480 28,415
California GO 5.000% 8/1/26 20,040 25,125
California GO 5.000% 9/1/26 2,500 2,627
Face Market
Maturity Amount Value•
Coupon Date ($000) ($000)
43

California Intermediate-Term Tax-Exempt Fund
California GO 5.000% 9/1/26 5,400 6,775
California GO 5.000% 11/1/26 7,500 8,476
California GO 5.000% 4/1/27 24,285 25,109
California GO 5.750% 4/1/27 31,455 34,268
California GO 3.500% 8/1/27 26,345 29,129
California GO 4.500% 8/1/27 95 95
California GO 5.000% 8/1/27 17,000 21,048
California GO 5.000% 9/1/27 5,500 5,779
California GO 5.000% 10/1/27 13,875 16,346
California GO 5.250% 10/1/27 5,000 5,848
California GO 5.750% 4/1/28 30,000 32,683
California GO 5.000% 8/1/28 6,415 7,791
California GO 4.000% 9/1/28 7,000 7,961
California GO 5.000% 9/1/28 17,500 18,384
California GO 5.000% 9/1/28 15,000 18,483
California GO 5.250% 9/1/28 6,000 6,985
California GO 5.250% 2/1/29 2,790 3,222
California GO 5.000% 8/1/29 4,000 4,884
California GO 5.000% 8/1/29 44,320 54,114
California GO 5.000% 9/1/29 16,000 16,806
California GO 5.000% 9/1/29 1,395 1,705
California GO 5.000% 9/1/29 6,000 6,923
California GO 5.000% 9/1/29 6,000 7,333
California GO 5.000% 10/1/29 10,245 10,591
California GO 4.500% 12/1/29 2,525 2,893
California GO 5.250% 3/1/30 20,000 22,198
California GO 5.000% 5/1/30 13,870 16,391
California GO 4.500% 8/1/30 40 40
California GO 5.000% 8/1/30 19,885 24,131
California GO 5.000% 8/1/30 6,500 7,888
California GO 5.000% 9/1/30 10,180 10,684
California GO 5.000% 9/1/30 10,000 11,494
California GO 5.000% 9/1/30 9,100 10,934
California GO 5.250% 9/1/30 5,000 5,972
California GO 5.000% 10/1/30 5,800 6,909
California GO 5.000% 12/1/30 3,760 4,437
California GO 5.750% 4/1/31 37,030 40,256
California GO 5.000% 5/1/31 13,000 15,296
California GO 5.000% 8/1/31 18,000 21,682
California GO 5.000% 8/1/31 10,000 11,834
California GO 5.250% 8/1/31 5,755 7,022
California GO 5.000% 9/1/31 3,020 3,643
California GO 5.000% 9/1/31 7,000 8,017
California GO 5.000% 10/1/31 5,500 6,525
California GO 5.000% 12/1/31 6,000 7,060
California GO 5.000% 12/1/31 6,500 7,654
California GO 5.000% 2/1/32 2,540 2,889
California GO 5.000% 8/1/32 5,000 5,944
California GO 5.250% 8/1/32 2,000 2,429
California GO 5.000% 9/1/32 15,000 18,011
California GO 5.000% 10/1/32 23,500 27,776
California GO 5.000% 2/1/33 1,760 2,020
California GO 5.000% 2/1/33 1,750 1,989
California GO 5.000% 3/1/33 3,395 3,982
Face Market
Maturity Amount Value•
Coupon Date ($000) ($000)
44
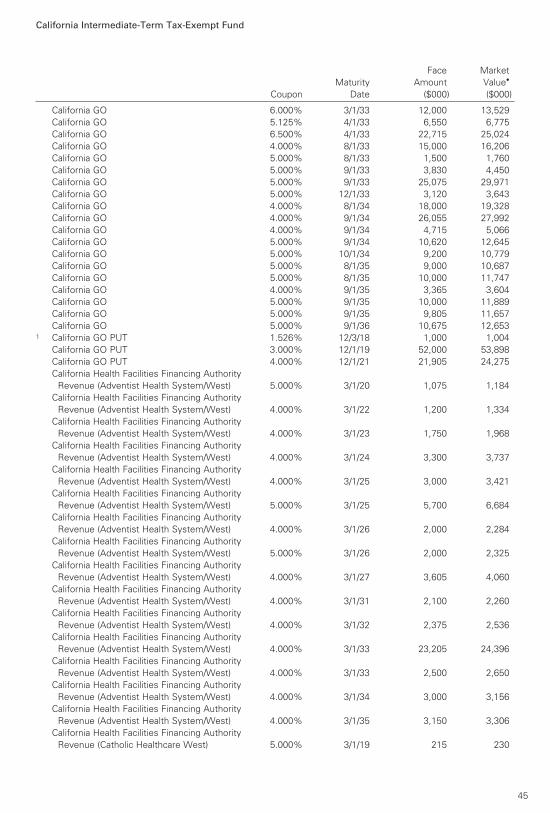
California Intermediate-Term Tax-Exempt Fund
California GO 6.000% 3/1/33 12,000 13,529
California GO 5.125% 4/1/33 6,550 6,775
California GO 6.500% 4/1/33 22,715 25,024
California GO 4.000% 8/1/33 15,000 16,206
California GO 5.000% 8/1/33 1,500 1,760
California GO 5.000% 9/1/33 3,830 4,450
California GO 5.000% 9/1/33 25,075 29,971
California GO 5.000% 12/1/33 3,120 3,643
California GO 4.000% 8/1/34 18,000 19,328
California GO 4.000% 9/1/34 26,055 27,992
California GO 4.000% 9/1/34 4,715 5,066
California GO 5.000% 9/1/34 10,620 12,645
California GO 5.000% 10/1/34 9,200 10,779
California GO 5.000% 8/1/35 9,000 10,687
California GO 5.000% 8/1/35 10,000 11,747
California GO 4.000% 9/1/35 3,365 3,604
California GO 5.000% 9/1/35 10,000 11,889
California GO 5.000% 9/1/35 9,805 11,657
California GO 5.000% 9/1/36 10,675 12,6531 California GO PUT 1.526% 12/3/18 1,000 1,004
California GO PUT 3.000% 12/1/19 52,000 53,898
California GO PUT 4.000% 12/1/21 21,905 24,275
California Health Facilities Financing Authority
Revenue (Adventist Health System/West) 5.000% 3/1/20 1,075 1,184
California Health Facilities Financing Authority
Revenue (Adventist Health System/West) 4.000% 3/1/22 1,200 1,334
California Health Facilities Financing Authority
Revenue (Adventist Health System/West) 4.000% 3/1/23 1,750 1,968
California Health Facilities Financing Authority
Revenue (Adventist Health System/West) 4.000% 3/1/24 3,300 3,737
California Health Facilities Financing Authority
Revenue (Adventist Health System/West) 4.000% 3/1/25 3,000 3,421
California Health Facilities Financing Authority
Revenue (Adventist Health System/West) 5.000% 3/1/25 5,700 6,684
California Health Facilities Financing Authority
Revenue (Adventist Health System/West) 4.000% 3/1/26 2,000 2,284
California Health Facilities Financing Authority
Revenue (Adventist Health System/West) 5.000% 3/1/26 2,000 2,325
California Health Facilities Financing Authority
Revenue (Adventist Health System/West) 4.000% 3/1/27 3,605 4,060
California Health Facilities Financing Authority
Revenue (Adventist Health System/West) 4.000% 3/1/31 2,100 2,260
California Health Facilities Financing Authority
Revenue (Adventist Health System/West) 4.000% 3/1/32 2,375 2,536
California Health Facilities Financing Authority
Revenue (Adventist Health System/West) 4.000% 3/1/33 23,205 24,396
California Health Facilities Financing Authority
Revenue (Adventist Health System/West) 4.000% 3/1/33 2,500 2,650
California Health Facilities Financing Authority
Revenue (Adventist Health System/West) 4.000% 3/1/34 3,000 3,156
California Health Facilities Financing Authority
Revenue (Adventist Health System/West) 4.000% 3/1/35 3,150 3,306
California Health Facilities Financing Authority
Revenue (Catholic Healthcare West) 5.000% 3/1/19 215 230
Face Market
Maturity Amount Value•
Coupon Date ($000) ($000)
45

California Intermediate-Term Tax-Exempt Fund
California Health Facilities Financing Authority
Revenue (Catholic Healthcare West) 5.000% 7/1/19 (ETM) 1,000 1,085
California Health Facilities Financing Authority
Revenue (Catholic Healthcare West) 6.000% 7/1/19 (Prere.) 4,260 4,706
California Health Facilities Financing Authority
Revenue (Catholic Healthcare West) 5.000% 3/1/20 4,750 5,237
California Health Facilities Financing Authority
Revenue (Catholic Healthcare West) 5.000% 3/1/21 3,810 4,322
California Health Facilities Financing Authority
Revenue (Catholic Healthcare West) 5.250% 3/1/22 8,000 9,092
California Health Facilities Financing Authority
Revenue (Catholic Healthcare West) 5.250% 3/1/23 1,555 1,771
California Health Facilities Financing Authority
Revenue (Catholic Healthcare West) 5.500% 7/1/25 5,300 5,540
California Health Facilities Financing Authority
Revenue (Catholic Healthcare West) 5.625% 7/1/25 19,820 21,490
California Health Facilities Financing Authority
Revenue (Catholic Healthcare West) 5.250% 3/1/27 7,500 8,471
California Health Facilities Financing Authority
Revenue (Cedars-Sinai Medical Center) 5.000% 8/15/19 1,000 1,087
California Health Facilities Financing Authority
Revenue (Cedars-Sinai Medical Center) 5.000% 8/15/20 2,100 2,355
California Health Facilities Financing Authority
Revenue (Cedars-Sinai Medical Center) 5.000% 8/15/21 2,000 2,306
California Health Facilities Financing Authority
Revenue (Cedars-Sinai Medical Center) 5.000% 11/15/26 6,905 8,493
California Health Facilities Financing Authority
Revenue (Cedars-Sinai Medical Center) 5.000% 11/15/29 7,250 8,678
California Health Facilities Financing Authority
Revenue (Cedars-Sinai Medical Center) 5.000% 11/15/31 1,600 1,896
California Health Facilities Financing Authority
Revenue (Cedars-Sinai Medical Center) 4.000% 8/15/35 14,000 14,875
California Health Facilities Financing Authority
Revenue (Children’s Hospital of Los Angeles) 5.000% 11/15/22 3,500 4,094
California Health Facilities Financing Authority
Revenue (Children’s Hospital of Los Angeles) 5.000% 11/15/23 1,370 1,590
California Health Facilities Financing Authority
Revenue (Children’s Hospital of Los Angeles) 5.000% 11/15/24 7,410 8,543
California Health Facilities Financing Authority
Revenue (Children’s Hospital of Los Angeles) 5.000% 11/15/27 4,000 4,531
California Health Facilities Financing Authority
Revenue (Children’s Hospital of Los Angeles) 5.000% 11/15/29 2,890 3,2404 California Health Facilities Financing Authority
Revenue (Children’s Hospital of Los Angeles) 5.000% 8/15/32 350 4054 California Health Facilities Financing Authority
Revenue (Children’s Hospital of Los Angeles) 5.000% 8/15/33 620 7154 California Health Facilities Financing Authority
Revenue (Children’s Hospital of Los Angeles) 4.000% 8/15/34 215 2204 California Health Facilities Financing Authority
Revenue (Children’s Hospital of Los Angeles) 5.000% 8/15/35 3,650 4,1974 California Health Facilities Financing Authority
Revenue (Children’s Hospital of Los Angeles) 5.000% 8/15/36 4,000 4,5844 California Health Facilities Financing Authority
Revenue (Children’s Hospital of Los Angeles) 5.000% 8/15/37 1,335 1,525
Face Market
Maturity Amount Value•
Coupon Date ($000) ($000)
46

California Intermediate-Term Tax-Exempt Fund
1 California Health Facilities Financing Authority
Revenue (Children’s Hospital of Los Angeles)
PUT 2.580% 7/1/17 5,255 5,255
California Health Facilities Financing Authority
Revenue (Children’s Hospital of Orange County) 6.250% 11/1/29 5,000 5,609
California Health Facilities Financing Authority
Revenue (Children’s Hospital of Orange County) 5.000% 11/1/31 2,000 2,223
California Health Facilities Financing Authority
Revenue (Chinese Hospital Association) 5.000% 6/1/19 300 322
California Health Facilities Financing Authority
Revenue (Chinese Hospital Association) 5.000% 6/1/21 450 511
California Health Facilities Financing Authority
Revenue (Chinese Hospital Association) 5.000% 6/1/22 875 1,016
California Health Facilities Financing Authority
Revenue (Chinese Hospital Association) 5.000% 6/1/23 760 879
California Health Facilities Financing Authority
Revenue (Chinese Hospital Association) 5.000% 6/1/25 310 359
California Health Facilities Financing Authority
Revenue (Chinese Hospital Association) 5.000% 6/1/26 805 912
California Health Facilities Financing Authority
Revenue (City of Hope Medical Center) 5.000% 11/15/19 800 874
California Health Facilities Financing Authority
Revenue (City of Hope Medical Center) 4.000% 11/15/20 750 819
California Health Facilities Financing Authority
Revenue (City of Hope Medical Center) 5.000% 11/15/21 1,400 1,617
California Health Facilities Financing Authority
Revenue (City of Hope Medical Center) 5.000% 11/15/23 1,500 1,763
California Health Facilities Financing Authority
Revenue (City of Hope Medical Center) 5.000% 11/15/24 1,700 1,994
California Health Facilities Financing Authority
Revenue (City of Hope Medical Center) 5.000% 11/15/25 2,250 2,626
California Health Facilities Financing Authority
Revenue (City of Hope Medical Center) 5.000% 11/15/32 12,500 14,235
California Health Facilities Financing Authority
Revenue (City of Hope Medical Center) 5.000% 11/15/35 3,500 3,984
California Health Facilities Financing Authority
Revenue (El Camino Hospital) 3.000% 2/1/19 1,235 1,275
California Health Facilities Financing Authority
Revenue (El Camino Hospital) 4.000% 2/1/20 1,715 1,841
California Health Facilities Financing Authority
Revenue (El Camino Hospital) 5.000% 2/1/27 1,250 1,538
California Health Facilities Financing Authority
Revenue (El Camino Hospital) 5.000% 2/1/28 1,350 1,640
California Health Facilities Financing Authority
Revenue (El Camino Hospital) 5.000% 2/1/28 3,000 3,524
California Health Facilities Financing Authority
Revenue (El Camino Hospital) 5.000% 2/1/29 2,500 3,001
California Health Facilities Financing Authority
Revenue (El Camino Hospital) 5.000% 2/1/29 1,000 1,167
California Health Facilities Financing Authority
Revenue (El Camino Hospital) 5.000% 2/1/30 2,205 2,545
California Health Facilities Financing Authority
Revenue (El Camino Hospital) 5.000% 2/1/31 5,930 6,793
Face Market
Maturity Amount Value•
Coupon Date ($000) ($000)
47
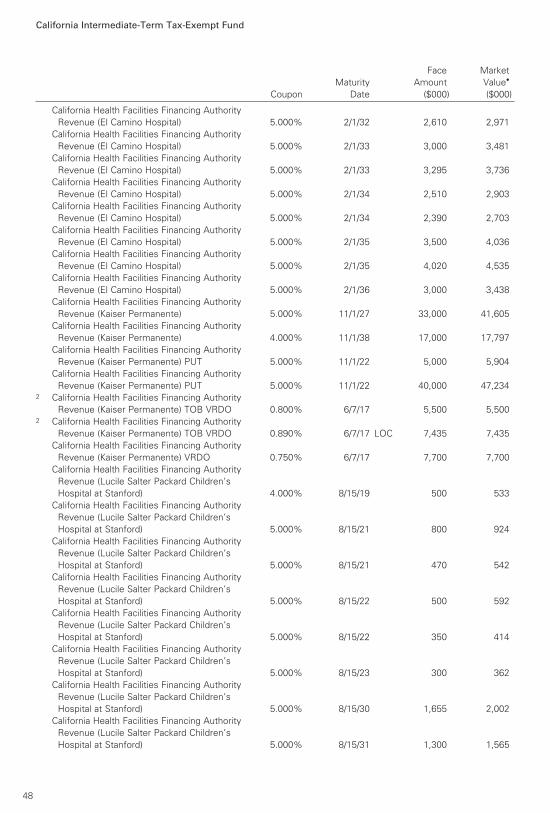
California Intermediate-Term Tax-Exempt Fund
California Health Facilities Financing Authority
Revenue (El Camino Hospital) 5.000% 2/1/32 2,610 2,971
California Health Facilities Financing Authority
Revenue (El Camino Hospital) 5.000% 2/1/33 3,000 3,481
California Health Facilities Financing Authority
Revenue (El Camino Hospital) 5.000% 2/1/33 3,295 3,736
California Health Facilities Financing Authority
Revenue (El Camino Hospital) 5.000% 2/1/34 2,510 2,903
California Health Facilities Financing Authority
Revenue (El Camino Hospital) 5.000% 2/1/34 2,390 2,703
California Health Facilities Financing Authority
Revenue (El Camino Hospital) 5.000% 2/1/35 3,500 4,036
California Health Facilities Financing Authority
Revenue (El Camino Hospital) 5.000% 2/1/35 4,020 4,535
California Health Facilities Financing Authority
Revenue (El Camino Hospital) 5.000% 2/1/36 3,000 3,438
California Health Facilities Financing Authority
Revenue (Kaiser Permanente) 5.000% 11/1/27 33,000 41,605
California Health Facilities Financing Authority
Revenue (Kaiser Permanente) 4.000% 11/1/38 17,000 17,797
California Health Facilities Financing Authority
Revenue (Kaiser Permanente) PUT 5.000% 11/1/22 5,000 5,904
California Health Facilities Financing Authority
Revenue (Kaiser Permanente) PUT 5.000% 11/1/22 40,000 47,2342 California Health Facilities Financing Authority
Revenue (Kaiser Permanente) TOB VRDO 0.800% 6/7/17 5,500 5,5002 California Health Facilities Financing Authority
Revenue (Kaiser Permanente) TOB VRDO 0.890% 6/7/17 LOC 7,435 7,435
California Health Facilities Financing Authority
Revenue (Kaiser Permanente) VRDO 0.750% 6/7/17 7,700 7,700
California Health Facilities Financing Authority
Revenue (Lucile Salter Packard Children’s
Hospital at Stanford) 4.000% 8/15/19 500 533
California Health Facilities Financing Authority
Revenue (Lucile Salter Packard Children’s
Hospital at Stanford) 5.000% 8/15/21 800 924
California Health Facilities Financing Authority
Revenue (Lucile Salter Packard Children’s
Hospital at Stanford) 5.000% 8/15/21 470 542
California Health Facilities Financing Authority
Revenue (Lucile Salter Packard Children’s
Hospital at Stanford) 5.000% 8/15/22 500 592
California Health Facilities Financing Authority
Revenue (Lucile Salter Packard Children’s
Hospital at Stanford) 5.000% 8/15/22 350 414
California Health Facilities Financing Authority
Revenue (Lucile Salter Packard Children’s
Hospital at Stanford) 5.000% 8/15/23 300 362
California Health Facilities Financing Authority
Revenue (Lucile Salter Packard Children’s
Hospital at Stanford) 5.000% 8/15/30 1,655 2,002
California Health Facilities Financing Authority
Revenue (Lucile Salter Packard Children’s
Hospital at Stanford) 5.000% 8/15/31 1,300 1,565
Face Market
Maturity Amount Value•
Coupon Date ($000) ($000)
48

California Intermediate-Term Tax-Exempt Fund
California Health Facilities Financing Authority
Revenue (Lucile Salter Packard Children’s
Hospital at Stanford) 5.000% 8/15/32 1,500 1,796
California Health Facilities Financing Authority
Revenue (Lucile Salter Packard Children’s
Hospital at Stanford) 5.000% 8/15/33 1,610 1,917
California Health Facilities Financing Authority
Revenue (Lucile Salter Packard Children’s
Hospital at Stanford) 4.000% 8/15/34 1,500 1,568
California Health Facilities Financing Authority
Revenue (Marshall Medical Center) 5.000% 11/1/24 850 1,024
California Health Facilities Financing Authority
Revenue (Marshall Medical Center) 5.000% 11/1/25 425 507
California Health Facilities Financing Authority
Revenue (Marshall Medical Center) 5.000% 11/1/26 775 916
California Health Facilities Financing Authority
Revenue (Memorial Health Services) 5.000% 10/1/18 1,320 1,393
California Health Facilities Financing Authority
Revenue (Memorial Health Services) 4.000% 10/1/19 1,520 1,625
California Health Facilities Financing Authority
Revenue (Memorial Health Services) 5.000% 10/1/19 1,000 1,093
California Health Facilities Financing Authority
Revenue (Memorial Health Services) 4.000% 10/1/20 1,800 1,968
California Health Facilities Financing Authority
Revenue (Memorial Health Services) 4.000% 10/1/21 1,020 1,136
California Health Facilities Financing Authority
Revenue (Memorial Health Services) 5.000% 10/1/21 1,000 1,159
California Health Facilities Financing Authority
Revenue (Memorial Health Services) 4.000% 10/1/22 2,250 2,546
California Health Facilities Financing Authority
Revenue (Memorial Health Services) 5.000% 10/1/22 2,400 2,848
California Health Facilities Financing Authority
Revenue (Memorial Health Services) 5.000% 10/1/24 5,000 5,840
California Health Facilities Financing Authority
Revenue (Memorial Health Services) 5.000% 10/1/25 5,000 5,826
California Health Facilities Financing Authority
Revenue (Northern California Presbyterian
Homes & Services) 5.000% 7/1/17 380 381
California Health Facilities Financing Authority
Revenue (Northern California Presbyterian
Homes & Services) 5.000% 7/1/18 335 350
California Health Facilities Financing Authority
Revenue (Northern California Presbyterian
Homes & Services) 5.000% 7/1/20 300 335
California Health Facilities Financing Authority
Revenue (Northern California Presbyterian
Homes & Services) 5.000% 7/1/21 465 534
California Health Facilities Financing Authority
Revenue (Northern California Presbyterian
Homes & Services) 5.000% 7/1/22 175 206
California Health Facilities Financing Authority
Revenue (Northern California Presbyterian
Homes & Services) 5.000% 7/1/24 370 451
Face Market
Maturity Amount Value•
Coupon Date ($000) ($000)
49

California Intermediate-Term Tax-Exempt Fund
California Health Facilities Financing Authority
Revenue (Northern California Presbyterian
Homes & Services) 5.000% 7/1/25 500 616
California Health Facilities Financing Authority
Revenue (Northern California Presbyterian
Homes & Services) 5.000% 7/1/26 750 910
California Health Facilities Financing Authority
Revenue (Northern California Presbyterian
Homes & Services) 5.000% 7/1/28 880 1,044
California Health Facilities Financing Authority
Revenue (Northern California Presbyterian
Homes & Services) 5.000% 7/1/29 855 1,001
California Health Facilities Financing Authority
Revenue (Northern California Presbyterian
Homes & Services) 5.000% 7/1/31 870 1,005
California Health Facilities Financing Authority
Revenue (Providence Health & Services) 6.250% 10/1/18 (Prere.) 3,030 3,248
California Health Facilities Financing Authority
Revenue (Providence Health & Services) 6.250% 10/1/18 (Prere.) 4,000 4,287
California Health Facilities Financing Authority
Revenue (Providence Health & Services) 5.000% 10/1/25 2,610 3,193
California Health Facilities Financing Authority
Revenue (Providence Health & Services) 5.000% 10/1/26 2,700 3,261
California Health Facilities Financing Authority
Revenue (Providence Health & Services) 5.000% 10/1/28 1,840 2,187
California Health Facilities Financing Authority
Revenue (Providence Health & Services) 5.000% 10/1/30 4,000 4,700
California Health Facilities Financing Authority
Revenue (Providence Health & Services) 5.000% 10/1/31 5,000 5,862
California Health Facilities Financing Authority
Revenue (Providence Health & Services) 5.000% 10/1/33 5,000 5,829
California Health Facilities Financing Authority
Revenue (Providence Health & Services) 5.000% 10/1/34 5,650 6,566
California Health Facilities Financing Authority
Revenue (Providence St. Joseph Health
Obligated Group) 5.000% 10/1/30 2,015 2,414
California Health Facilities Financing Authority
Revenue (Providence St. Joseph Health
Obligated Group) 5.000% 10/1/31 2,000 2,384
California Health Facilities Financing Authority
Revenue (Providence St. Joseph Health
Obligated Group) 4.000% 10/1/34 2,250 2,377
California Health Facilities Financing Authority
Revenue (Providence St. Joseph Health
Obligated Group) 4.000% 10/1/35 8,000 8,427
California Health Facilities Financing Authority
Revenue (Providence St. Joseph Health
Obligated Group) PUT 1.250% 10/1/20 6,420 6,399
California Health Facilities Financing Authority
Revenue (Providence St. Joseph Health
Obligated Group) PUT 2.000% 10/1/25 18,000 17,532
California Health Facilities Financing Authority
Revenue (Rady Children’s Hospital) 5.000% 8/15/20 500 556
Face Market
Maturity Amount Value•
Coupon Date ($000) ($000)
50

California Intermediate-Term Tax-Exempt Fund
California Health Facilities Financing Authority
Revenue (Rady Children’s Hospital) 5.500% 8/15/26 6,000 6,937
California Health Facilities Financing Authority
Revenue (Rady Children’s Hospital) 5.000% 8/15/31 2,865 3,206
California Health Facilities Financing Authority
Revenue (Scripps Health) 5.000% 10/1/17 2,515 2,550
California Health Facilities Financing Authority
Revenue (Scripps Health) 5.000% 10/1/18 3,000 3,163
California Health Facilities Financing Authority
Revenue (Scripps Health) 5.000% 11/15/25 750 870
California Health Facilities Financing Authority
Revenue (Scripps Health) 5.000% 11/15/27 850 978
California Health Facilities Financing Authority
Revenue (Scripps Health) 5.000% 11/15/28 1,175 1,349
California Health Facilities Financing Authority
Revenue (Scripps Health) 5.000% 11/15/32 1,000 1,138
California Health Facilities Financing Authority
Revenue (St. Joseph Health System) 5.000% 7/1/29 4,970 5,769
California Health Facilities Financing Authority
Revenue (St. Joseph Health System) 5.500% 7/1/29 10,000 10,842
California Health Facilities Financing Authority
Revenue (St. Joseph Health System) 5.000% 7/1/33 6,250 7,168
California Health Facilities Financing Authority
Revenue (St. Joseph Health System) PUT 5.000% 10/17/17 1,250 1,269
California Health Facilities Financing Authority
Revenue (St. Joseph Health System) PUT 5.000% 10/15/20 12,500 13,991
California Health Facilities Financing Authority
Revenue (Stanford Hospital) 5.000% 8/15/19 2,000 2,177
California Health Facilities Financing Authority
Revenue (Stanford Hospital) 4.000% 8/15/21 2,250 2,505
California Health Facilities Financing Authority
Revenue (Stanford Hospital) 5.000% 8/15/23 1,830 2,173
California Health Facilities Financing Authority
Revenue (Stanford Hospital) 5.250% 11/15/31 2,000 2,234
California Health Facilities Financing Authority
Revenue (Sutter Health) 5.000% 8/15/19 2,000 2,177
California Health Facilities Financing Authority
Revenue (Sutter Health) 5.000% 8/15/20 2,200 2,470
California Health Facilities Financing Authority
Revenue (Sutter Health) 5.000% 8/15/21 1,275 1,472
California Health Facilities Financing Authority
Revenue (Sutter Health) 5.000% 11/15/21 500 580
California Health Facilities Financing Authority
Revenue (Sutter Health) 5.000% 8/15/22 1,090 1,269
California Health Facilities Financing Authority
Revenue (Sutter Health) 5.000% 11/15/22 200 238
California Health Facilities Financing Authority
Revenue (Sutter Health) 5.000% 11/15/23 300 362
California Health Facilities Financing Authority
Revenue (Sutter Health) 5.000% 11/15/24 400 490
California Health Facilities Financing Authority
Revenue (Sutter Health) 5.000% 11/15/24 1,000 1,225
California Health Facilities Financing Authority
Revenue (Sutter Health) 5.000% 11/15/25 400 495
Face Market
Maturity Amount Value•
Coupon Date ($000) ($000)
51

California Intermediate-Term Tax-Exempt Fund
California Health Facilities Financing Authority
Revenue (Sutter Health) 5.000% 11/15/25 600 743
California Health Facilities Financing Authority
Revenue (Sutter Health) 5.500% 8/15/26 4,750 5,389
California Health Facilities Financing Authority
Revenue (Sutter Health) 5.000% 11/15/26 400 488
California Health Facilities Financing Authority
Revenue (Sutter Health) 5.000% 11/15/26 1,000 1,243
California Health Facilities Financing Authority
Revenue (Sutter Health) 5.000% 11/15/27 400 482
California Health Facilities Financing Authority
Revenue (Sutter Health) 5.000% 11/15/28 500 599
California Health Facilities Financing Authority
Revenue (Sutter Health) 5.000% 11/15/28 1,250 1,524
California Health Facilities Financing Authority
Revenue (Sutter Health) 5.000% 11/15/29 850 1,026
California Health Facilities Financing Authority
Revenue (Sutter Health) 5.000% 11/15/30 1,150 1,380
California Health Facilities Financing Authority
Revenue (Sutter Health) 5.250% 8/15/31 5,505 6,341
California Health Facilities Financing Authority
Revenue (Sutter Health) 5.875% 8/15/31 5,000 5,714
California Health Facilities Financing Authority
Revenue (Sutter Health) 5.000% 11/15/31 1,110 1,326
California Health Facilities Financing Authority
Revenue (Sutter Health) 5.000% 11/15/32 1,400 1,662
California Health Facilities Financing Authority
Revenue (Sutter Health) 5.000% 11/15/33 3,580 4,224
California Health Facilities Financing Authority
Revenue (Sutter Health) 5.000% 11/15/34 4,000 4,701
California Health Facilities Financing Authority
Revenue (Sutter Health) 5.000% 11/15/35 2,500 2,931
California Health Facilities Financing Authority
Revenue (Sutter Health) 5.000% 11/15/36 3,000 3,507
California Health Facilities Financing Authority
Revenue (Sutter Health) PUT 1.000% 8/15/19 6,000 5,967
California Infrastructure & Economic
Development Bank Revenue 5.000% 7/1/20 200 223
California Infrastructure & Economic
Development Bank Revenue 5.000% 7/1/21 300 344
California Infrastructure & Economic
Development Bank Revenue 5.000% 7/1/22 200 234
California Infrastructure & Economic
Development Bank Revenue 4.000% 10/1/22 1,000 1,143
California Infrastructure & Economic
Development Bank Revenue 5.000% 10/1/22 1,400 1,672
California Infrastructure & Economic
Development Bank Revenue 5.000% 7/1/23 200 238
California Infrastructure & Economic
Development Bank Revenue 5.000% 10/1/23 1,800 2,197
California Infrastructure & Economic
Development Bank Revenue 5.000% 7/1/24 600 727
California Infrastructure & Economic
Development Bank Revenue 5.000% 10/1/24 1,300 1,616
Face Market
Maturity Amount Value•
Coupon Date ($000) ($000)
52

California Intermediate-Term Tax-Exempt Fund
California Infrastructure & Economic
Development Bank Revenue 5.000% 10/1/24 1,175 1,460
California Infrastructure & Economic
Development Bank Revenue 5.000% 10/1/25 1,500 1,892
California Infrastructure & Economic
Development Bank Revenue 5.000% 7/1/26 760 938
California Infrastructure & Economic
Development Bank Revenue 5.000% 10/1/26 1,500 1,911
California Infrastructure & Economic
Development Bank Revenue 5.000% 7/1/27 1,775 2,163
California Infrastructure & Economic
Development Bank Revenue 4.000% 7/1/29 910 991
California Infrastructure & Economic Development
Bank Revenue (Academy of Motion Picture Arts
& Sciences Obligated Group) 5.000% 11/1/20 1,000 1,127
California Infrastructure & Economic Development
Bank Revenue (Academy of Motion Picture Arts
& Sciences Obligated Group) 5.000% 11/1/21 800 926
California Infrastructure & Economic Development
Bank Revenue (Academy of Motion Picture Arts
& Sciences Obligated Group) 5.000% 11/1/29 1,500 1,772
California Infrastructure & Economic Development
Bank Revenue (Independent System Operator
Corp. Project) 5.000% 2/1/34 10,000 11,3301 California Infrastructure & Economic Development
Bank Revenue (Index-Museum Art Project) PUT 2.473% 8/1/18 6,000 6,035
California Infrastructure & Economic Development
Bank Revenue (Pacific Gas & Electric Co.) VRDO 0.690% 6/1/17 LOC 9,200 9,200
California Infrastructure & Economic Development
Bank Revenue (Salvation Army Western Territory) 5.000% 9/1/26 825 1,020
California Infrastructure & Economic Development
Bank Revenue (Salvation Army Western Territory) 5.000% 9/1/27 500 610
California Infrastructure & Economic Development
Bank Revenue (Salvation Army Western Territory) 5.000% 9/1/28 555 671
California Infrastructure & Economic Development
Bank Revenue (Salvation Army Western Territory) 5.000% 9/1/29 1,000 1,199
California Infrastructure & Economic Development
Bank Revenue (Salvation Army Western Territory) 4.000% 9/1/31 1,760 1,885
California Infrastructure & Economic Development
Bank Revenue (Salvation Army Western Territory) 4.000% 9/1/34 715 753
California Infrastructure & Economic Development
Bank Revenue (Salvation Army Western Territory) 4.000% 9/1/35 750 790
California Infrastructure & Economic Development
Bank Revenue (Sanford Consortium for
Regenerative Medicine) 5.000% 5/15/28 1,030 1,263
California Infrastructure & Economic Development
Bank Revenue (Sanford Consortium for
Regenerative Medicine) 5.000% 5/15/29 740 899
California Infrastructure & Economic Development
Bank Revenue (Sanford Consortium for
Regenerative Medicine) 5.000% 5/15/30 1,080 1,303
California Infrastructure & Economic Development
Bank Revenue (Sanford Consortium for
Regenerative Medicine) 5.000% 5/15/31 1,225 1,469
Face Market
Maturity Amount Value•
Coupon Date ($000) ($000)
53
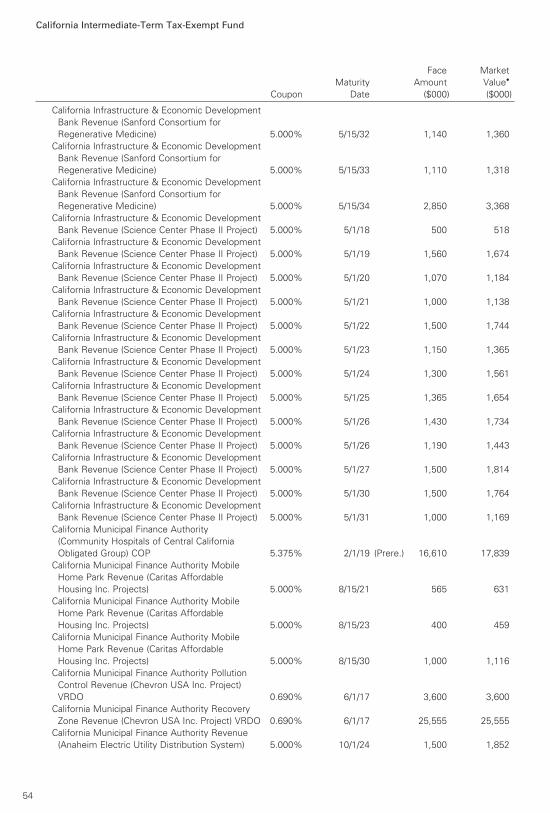
California Intermediate-Term Tax-Exempt Fund
California Infrastructure & Economic Development
Bank Revenue (Sanford Consortium for
Regenerative Medicine) 5.000% 5/15/32 1,140 1,360
California Infrastructure & Economic Development
Bank Revenue (Sanford Consortium for
Regenerative Medicine) 5.000% 5/15/33 1,110 1,318
California Infrastructure & Economic Development
Bank Revenue (Sanford Consortium for
Regenerative Medicine) 5.000% 5/15/34 2,850 3,368
California Infrastructure & Economic Development
Bank Revenue (Science Center Phase II Project) 5.000% 5/1/18 500 518
California Infrastructure & Economic Development
Bank Revenue (Science Center Phase II Project) 5.000% 5/1/19 1,560 1,674
California Infrastructure & Economic Development
Bank Revenue (Science Center Phase II Project) 5.000% 5/1/20 1,070 1,184
California Infrastructure & Economic Development
Bank Revenue (Science Center Phase II Project) 5.000% 5/1/21 1,000 1,138
California Infrastructure & Economic Development
Bank Revenue (Science Center Phase II Project) 5.000% 5/1/22 1,500 1,744
California Infrastructure & Economic Development
Bank Revenue (Science Center Phase II Project) 5.000% 5/1/23 1,150 1,365
California Infrastructure & Economic Development
Bank Revenue (Science Center Phase II Project) 5.000% 5/1/24 1,300 1,561
California Infrastructure & Economic Development
Bank Revenue (Science Center Phase II Project) 5.000% 5/1/25 1,365 1,654
California Infrastructure & Economic Development
Bank Revenue (Science Center Phase II Project) 5.000% 5/1/26 1,430 1,734
California Infrastructure & Economic Development
Bank Revenue (Science Center Phase II Project) 5.000% 5/1/26 1,190 1,443
California Infrastructure & Economic Development
Bank Revenue (Science Center Phase II Project) 5.000% 5/1/27 1,500 1,814
California Infrastructure & Economic Development
Bank Revenue (Science Center Phase II Project) 5.000% 5/1/30 1,500 1,764
California Infrastructure & Economic Development
Bank Revenue (Science Center Phase II Project) 5.000% 5/1/31 1,000 1,169
California Municipal Finance Authority
(Community Hospitals of Central California
Obligated Group) COP 5.375% 2/1/19 (Prere.) 16,610 17,839
California Municipal Finance Authority Mobile
Home Park Revenue (Caritas Affordable
Housing Inc. Projects) 5.000% 8/15/21 565 631
California Municipal Finance Authority Mobile
Home Park Revenue (Caritas Affordable
Housing Inc. Projects) 5.000% 8/15/23 400 459
California Municipal Finance Authority Mobile
Home Park Revenue (Caritas Affordable
Housing Inc. Projects) 5.000% 8/15/30 1,000 1,116
California Municipal Finance Authority Pollution
Control Revenue (Chevron USA Inc. Project)
VRDO 0.690% 6/1/17 3,600 3,600
California Municipal Finance Authority Recovery
Zone Revenue (Chevron USA Inc. Project) VRDO 0.690% 6/1/17 25,555 25,555
California Municipal Finance Authority Revenue
(Anaheim Electric Utility Distribution System) 5.000% 10/1/24 1,500 1,852
Face Market
Maturity Amount Value•
Coupon Date ($000) ($000)
54

California Intermediate-Term Tax-Exempt Fund
California Municipal Finance Authority Revenue
(Anaheim Electric Utility Distribution System) 5.000% 10/1/26 5,360 6,6361 California Municipal Finance Authority Revenue
(Anaheim Electric Utility Distribution System)
PUT 1.280% 4/2/18 6,000 5,986
California Municipal Finance Authority Revenue
(Anaheim Water System Project Revenue) 4.000% 10/1/31 3,955 4,304
California Municipal Finance Authority Revenue
(Anaheim Water System Project Revenue) 4.000% 10/1/32 4,220 4,562
California Municipal Finance Authority Revenue
(Anaheim Water System Project Revenue) 4.000% 10/1/33 4,390 4,726
California Municipal Finance Authority Revenue
(Azusa Pacific University) 5.000% 4/1/19 1,450 1,534
California Municipal Finance Authority Revenue
(Azusa Pacific University) 5.000% 4/1/20 1,760 1,907
California Municipal Finance Authority Revenue
(Azusa Pacific University) 5.000% 4/1/21 1,300 1,436
California Municipal Finance Authority Revenue
(Azusa Pacific University) 5.000% 4/1/22 1,000 1,122
California Municipal Finance Authority Revenue
(Azusa Pacific University) 5.000% 4/1/23 1,285 1,458
California Municipal Finance Authority Revenue
(Azusa Pacific University) 5.000% 4/1/24 1,325 1,517
California Municipal Finance Authority Revenue
(Azusa Pacific University) 5.000% 4/1/25 1,180 1,352
California Municipal Finance Authority Revenue
(Azusa Pacific University) 5.000% 4/1/35 2,490 2,701
California Municipal Finance Authority Revenue
(Biola University) 4.000% 10/1/19 205 218
California Municipal Finance Authority Revenue
(Biola University) 5.000% 10/1/21 375 429
California Municipal Finance Authority Revenue
(Biola University) 5.000% 10/1/22 130 152
California Municipal Finance Authority Revenue
(Biola University) 5.000% 10/1/24 375 449
California Municipal Finance Authority Revenue
(Biola University) 5.000% 10/1/25 305 368
California Municipal Finance Authority Revenue
(Biola University) 5.000% 10/1/30 585 694
California Municipal Finance Authority Revenue
(Biola University) 5.000% 10/1/31 550 649
California Municipal Finance Authority Revenue
(Biola University) 5.000% 10/1/32 500 586
California Municipal Finance Authority Revenue
(Biola University) 5.000% 10/1/34 570 661
California Municipal Finance Authority Revenue
(Biola University) 5.000% 10/1/35 600 694
California Municipal Finance Authority Revenue
(Biola University) 5.000% 10/1/36 625 720
California Municipal Finance Authority Revenue
(Community Hospitals of Central California
Obligated Group) 5.000% 2/1/18 500 513
Face Market
Maturity Amount Value•
Coupon Date ($000) ($000)
55

California Intermediate-Term Tax-Exempt Fund
California Municipal Finance Authority Revenue
(Community Hospitals of Central California
Obligated Group) 5.000% 2/1/19 500 531
California Municipal Finance Authority Revenue
(Community Hospitals of Central California
Obligated Group) 5.000% 2/1/20 625 684
California Municipal Finance Authority Revenue
(Community Hospitals of Central California
Obligated Group) 5.000% 2/1/20 2,005 2,193
California Municipal Finance Authority Revenue
(Community Hospitals of Central California
Obligated Group) 5.000% 2/1/21 1,000 1,122
California Municipal Finance Authority Revenue
(Community Hospitals of Central California
Obligated Group) 5.000% 2/1/21 1,000 1,122
California Municipal Finance Authority Revenue
(Community Hospitals of Central California
Obligated Group) 5.000% 2/1/22 500 573
California Municipal Finance Authority Revenue
(Community Hospitals of Central California
Obligated Group) 5.000% 2/1/22 1,000 1,146
California Municipal Finance Authority Revenue
(Community Hospitals of Central California
Obligated Group) 5.000% 2/1/23 835 974
California Municipal Finance Authority Revenue
(Community Hospitals of Central California
Obligated Group) 5.000% 2/1/23 1,000 1,166
California Municipal Finance Authority Revenue
(Community Hospitals of Central California
Obligated Group) 5.000% 2/1/24 2,390 2,824
California Municipal Finance Authority Revenue
(Community Hospitals of Central California
Obligated Group) 5.000% 2/1/24 500 591
California Municipal Finance Authority Revenue
(Community Hospitals of Central California
Obligated Group) 5.000% 2/1/25 1,700 2,029
California Municipal Finance Authority Revenue
(Community Hospitals of Central California
Obligated Group) 5.000% 2/1/25 650 776
California Municipal Finance Authority Revenue
(Community Hospitals of Central California
Obligated Group) 5.000% 2/1/26 2,000 2,401
California Municipal Finance Authority Revenue
(Community Hospitals of Central California
Obligated Group) 5.000% 2/1/26 700 826
California Municipal Finance Authority Revenue
(Community Hospitals of Central California
Obligated Group) 5.000% 2/1/27 1,500 1,814
California Municipal Finance Authority Revenue
(Community Hospitals of Central California
Obligated Group) 5.000% 2/1/27 600 700
California Municipal Finance Authority Revenue
(Community Hospitals of Central California
Obligated Group) 5.000% 2/1/28 750 867
Face Market
Maturity Amount Value•
Coupon Date ($000) ($000)
56
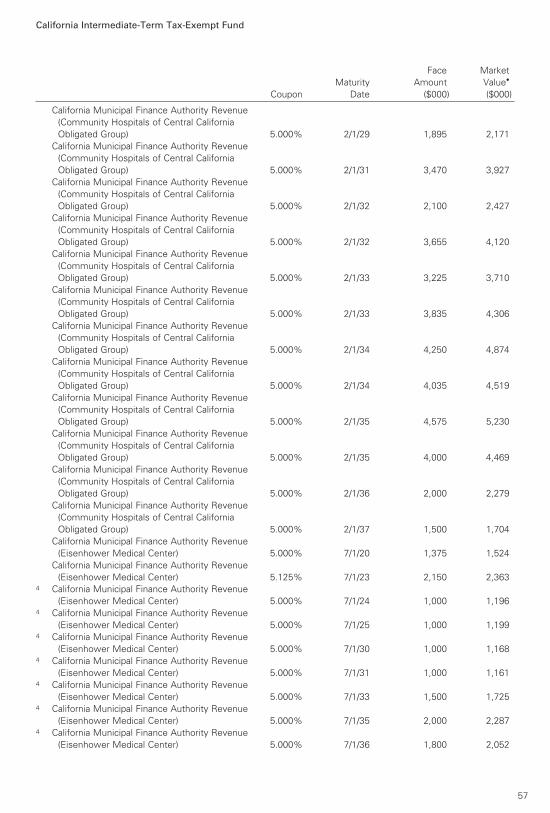
California Intermediate-Term Tax-Exempt Fund
California Municipal Finance Authority Revenue
(Community Hospitals of Central California
Obligated Group) 5.000% 2/1/29 1,895 2,171
California Municipal Finance Authority Revenue
(Community Hospitals of Central California
Obligated Group) 5.000% 2/1/31 3,470 3,927
California Municipal Finance Authority Revenue
(Community Hospitals of Central California
Obligated Group) 5.000% 2/1/32 2,100 2,427
California Municipal Finance Authority Revenue
(Community Hospitals of Central California
Obligated Group) 5.000% 2/1/32 3,655 4,120
California Municipal Finance Authority Revenue
(Community Hospitals of Central California
Obligated Group) 5.000% 2/1/33 3,225 3,710
California Municipal Finance Authority Revenue
(Community Hospitals of Central California
Obligated Group) 5.000% 2/1/33 3,835 4,306
California Municipal Finance Authority Revenue
(Community Hospitals of Central California
Obligated Group) 5.000% 2/1/34 4,250 4,874
California Municipal Finance Authority Revenue
(Community Hospitals of Central California
Obligated Group) 5.000% 2/1/34 4,035 4,519
California Municipal Finance Authority Revenue
(Community Hospitals of Central California
Obligated Group) 5.000% 2/1/35 4,575 5,230
California Municipal Finance Authority Revenue
(Community Hospitals of Central California
Obligated Group) 5.000% 2/1/35 4,000 4,469
California Municipal Finance Authority Revenue
(Community Hospitals of Central California
Obligated Group) 5.000% 2/1/36 2,000 2,279
California Municipal Finance Authority Revenue
(Community Hospitals of Central California
Obligated Group) 5.000% 2/1/37 1,500 1,704
California Municipal Finance Authority Revenue
(Eisenhower Medical Center) 5.000% 7/1/20 1,375 1,524
California Municipal Finance Authority Revenue
(Eisenhower Medical Center) 5.125% 7/1/23 2,150 2,3634 California Municipal Finance Authority Revenue
(Eisenhower Medical Center) 5.000% 7/1/24 1,000 1,1964 California Municipal Finance Authority Revenue
(Eisenhower Medical Center) 5.000% 7/1/25 1,000 1,1994 California Municipal Finance Authority Revenue
(Eisenhower Medical Center) 5.000% 7/1/30 1,000 1,1684 California Municipal Finance Authority Revenue
(Eisenhower Medical Center) 5.000% 7/1/31 1,000 1,1614 California Municipal Finance Authority Revenue
(Eisenhower Medical Center) 5.000% 7/1/33 1,500 1,7254 California Municipal Finance Authority Revenue
(Eisenhower Medical Center) 5.000% 7/1/35 2,000 2,2874 California Municipal Finance Authority Revenue
(Eisenhower Medical Center) 5.000% 7/1/36 1,800 2,052
Face Market
Maturity Amount Value•
Coupon Date ($000) ($000)
57

California Intermediate-Term Tax-Exempt Fund
4 California Municipal Finance Authority Revenue
(Eisenhower Medical Center) 5.000% 7/1/37 1,500 1,704
California Municipal Finance Authority Revenue
(Institute on Aging Project) 5.000% 8/15/26 630 775
California Municipal Finance Authority Revenue
(Institute on Aging Project) 5.000% 8/15/28 940 1,149
California Municipal Finance Authority Revenue
(Institute on Aging Project) 5.000% 8/15/30 1,000 1,199
California Municipal Finance Authority Revenue
(Institute on Aging Project) 5.000% 8/15/31 875 1,041
California Municipal Finance Authority Revenue
(Institute on Aging Project) 5.000% 8/15/35 750 876
California Municipal Finance Authority Revenue
(NorthBay Healthcare Group) 4.000% 11/1/22 1,000 1,090
California Municipal Finance Authority Revenue
(NorthBay Healthcare Group) 4.000% 11/1/23 2,000 2,191
California Municipal Finance Authority Revenue
(NorthBay Healthcare Group) 5.000% 11/1/23 1,000 1,157
California Municipal Finance Authority Revenue
(NorthBay Healthcare Group) 5.000% 11/1/24 1,000 1,166
California Municipal Finance Authority Revenue
(NorthBay Healthcare Group) 5.000% 11/1/24 1,825 2,133
California Municipal Finance Authority Revenue
(NorthBay Healthcare Group) 5.000% 11/1/25 1,000 1,174
California Municipal Finance Authority Revenue
(NorthBay Healthcare Group) 5.000% 11/1/25 1,000 1,177
California Municipal Finance Authority Revenue
(NorthBay Healthcare Group) 5.000% 11/1/26 1,000 1,182
California Municipal Finance Authority Revenue
(NorthBay Healthcare Group) 5.000% 11/1/27 1,500 1,758
California Municipal Finance Authority Revenue
(NorthBay Healthcare Group) 5.000% 11/1/28 1,500 1,746
California Municipal Finance Authority Revenue
(NorthBay Healthcare Group) 5.000% 11/1/28 3,500 4,161
California Municipal Finance Authority Revenue
(NorthBay Healthcare Group) 5.250% 11/1/29 1,250 1,477
California Municipal Finance Authority Revenue
(NorthBay Healthcare Group) 5.000% 11/1/30 1,450 1,659
California Municipal Finance Authority Revenue
(NorthBay Healthcare Group) 5.250% 11/1/31 1,250 1,461
California Municipal Finance Authority Revenue
(NorthBay Healthcare Group) 5.250% 11/1/36 4,000 4,582
California Municipal Finance Authority Revenue
(University of La Verne) 4.000% 6/1/18 250 258
California Municipal Finance Authority Revenue
(University of La Verne) 4.750% 6/1/18 (ETM) 2,325 2,417
California Municipal Finance Authority Revenue
(University of La Verne) 4.000% 6/1/19 400 424
California Municipal Finance Authority Revenue
(University of La Verne) 5.000% 6/1/19 (ETM) 2,375 2,567
California Municipal Finance Authority Revenue
(University of La Verne) 5.000% 6/1/20 300 334
California Municipal Finance Authority Revenue
(University of La Verne) 5.000% 6/1/21 350 400
Face Market
Maturity Amount Value•
Coupon Date ($000) ($000)
58

California Intermediate-Term Tax-Exempt Fund
California Municipal Finance Authority Revenue
(University of La Verne) 5.000% 6/1/22 250 292
California Municipal Finance Authority Revenue
(University of La Verne) 5.000% 6/1/23 600 713
California Municipal Finance Authority Revenue
(University of La Verne) 5.000% 6/1/24 350 422
California Municipal Finance Authority Revenue
(University of La Verne) 5.000% 6/1/25 1,000 1,216
California Municipal Finance Authority Water
Revenue (San Bernardino Municipal Water
Department) 5.000% 8/1/31 (15) 1,455 1,721
California Municipal Finance Authority Water
Revenue (San Bernardino Municipal Water
Department) 5.000% 8/1/36 (15) 1,805 2,092
California Pollution Control Financing Authority
Revenue (Pacific Gas & Electric Co.) VRDO 0.610% 6/1/17 LOC 25,800 25,800
California Public Finance Authority Revenue
(Henry Mayo Newhall Memorial Hospital) 5.000% 10/15/29 700 797
California Public Finance Authority Revenue
(Henry Mayo Newhall Memorial Hospital) 5.000% 10/15/30 500 564
California Public Finance Authority Revenue
(Henry Mayo Newhall Memorial Hospital) 5.000% 10/15/31 535 600
California Public Finance Authority Revenue
(Henry Mayo Newhall Memorial Hospital) 5.000% 10/15/32 500 559
California Public Finance Authority Revenue
(Henry Mayo Newhall Memorial Hospital) 5.000% 10/15/33 500 557
California Public Works Board Lease Revenue 5.000% 3/1/19 7,155 7,670
California Public Works Board Lease Revenue 5.000% 10/1/19 9,410 10,296
California Public Works Board Lease Revenue 5.000% 3/1/20 7,955 8,819
California Public Works Board Lease Revenue 5.000% 10/1/20 14,810 16,711
California Public Works Board Lease Revenue 5.000% 3/1/21 1,800 2,055
California Public Works Board Lease Revenue 5.000% 10/1/21 7,450 8,638
California Public Works Board Lease Revenue 5.000% 3/1/22 1,600 1,872
California Public Works Board Lease Revenue 5.000% 10/1/22 5,750 6,826
California Public Works Board Lease Revenue 5.000% 10/1/28 13,610 16,838
California Public Works Board Lease Revenue 5.000% 10/1/29 12,235 14,964
California Public Works Board Lease Revenue
(Department of Corrections) 5.000% 6/1/18 11,625 12,112
California Public Works Board Lease Revenue
(Department of Corrections) 5.000% 6/1/19 12,200 13,194
California Public Works Board Lease Revenue
(Department of Corrections) 5.000% 10/1/19 5,380 5,887
California Public Works Board Lease Revenue
(Department of Corrections) 5.000% 6/1/20 4,180 4,669
California Public Works Board Lease Revenue
(Department of Corrections) 5.000% 9/1/20 13,000 14,632
California Public Works Board Lease Revenue
(Department of Corrections) 5.000% 10/1/20 5,655 6,381
California Public Works Board Lease Revenue
(Department of Corrections) 5.000% 6/1/21 7,375 8,476
California Public Works Board Lease Revenue
(Department of Corrections) 5.000% 10/1/21 1,375 1,594
California Public Works Board Lease Revenue
(Department of Corrections) 5.000% 10/1/21 5,945 6,893
Face Market
Maturity Amount Value•
Coupon Date ($000) ($000)
59

California Intermediate-Term Tax-Exempt Fund
California Public Works Board Lease Revenue
(Department of Corrections) 5.000% 6/1/22 9,425 11,096
California Public Works Board Lease Revenue
(Department of Corrections) 5.000% 10/1/22 1,500 1,781
California Public Works Board Lease Revenue
(Department of Corrections) 5.000% 10/1/22 6,250 7,420
California Public Works Board Lease Revenue
(Department of Corrections) 5.000% 10/1/23 2,350 2,842
California Public Works Board Lease Revenue
(Department of Corrections) 5.000% 10/1/23 5,270 6,373
California Public Works Board Lease Revenue
(Department of Corrections) 5.000% 9/1/24 4,250 5,207
California Public Works Board Lease Revenue
(Department of Corrections) 5.000% 10/1/24 1,925 2,362
California Public Works Board Lease Revenue
(Department of Corrections) 5.000% 6/1/25 2,935 3,619
California Public Works Board Lease Revenue
(Department of Corrections) 5.000% 9/1/31 5,000 5,860
California Public Works Board Lease Revenue
(Department of Corrections) 5.750% 10/1/31 6,000 7,038
California Public Works Board Lease Revenue
(Department of Corrections) 5.000% 9/1/32 5,000 5,838
California Public Works Board Lease Revenue
(Department of Corrections) 5.250% 10/1/32 5,000 5,964
California Public Works Board Lease Revenue
(Department of Corrections) 5.000% 9/1/33 5,000 5,813
California Public Works Board Lease Revenue
(Department of Corrections) 5.250% 10/1/33 3,000 3,563
California Public Works Board Lease Revenue
(Department of Corrections) 4.500% 9/1/35 25,000 27,392
California Public Works Board Lease Revenue
(Department of General Services) 6.000% 4/1/19 (Prere.) 5,000 5,464
California Public Works Board Lease Revenue
(Department of State Hospitals) 5.000% 6/1/28 5,825 6,792
California Public Works Board Lease Revenue
(Department of State Hospitals) 5.000% 6/1/29 8,975 10,408
California Public Works Board Lease Revenue
(Judicial Council Projects) 5.000% 12/1/24 400 462
California Public Works Board Lease Revenue
(Judicial Council Projects) 5.000% 3/1/25 1,500 1,760
California Public Works Board Lease Revenue
(Judicial Council Projects) 5.250% 12/1/25 1,550 1,803
California Public Works Board Lease Revenue
(Judicial Council Projects) 5.000% 3/1/26 1,500 1,758
California Public Works Board Lease Revenue
(Judicial Council Projects) 5.000% 12/1/27 7,000 8,035
California Public Works Board Lease Revenue
(Judicial Council Projects) 5.000% 3/1/28 2,860 3,319
California Public Works Board Lease Revenue
(Judicial Council Projects) 5.000% 12/1/28 4,980 5,708
California Public Works Board Lease Revenue
(Judicial Council Projects) 5.000% 3/1/29 2,500 2,886
California Public Works Board Lease Revenue
(Judicial Council Projects) 5.000% 12/1/29 5,000 5,717
Face Market
Maturity Amount Value•
Coupon Date ($000) ($000)
60

California Intermediate-Term Tax-Exempt Fund
California Public Works Board Lease Revenue
(Judicial Council Projects) 5.000% 3/1/32 3,200 3,655
California Public Works Board Lease Revenue
(Judicial Council Projects) 5.000% 3/1/33 1,650 1,878
California Public Works Board Lease Revenue
(Regents of The University of California) 5.000% 6/1/20 (ETM) 7,670 8,577
California Public Works Board Lease Revenue
(Regents of The University of California) 5.000% 10/1/20 (ETM) 2,015 2,279
California Public Works Board Lease Revenue
(Regents of The University of California) 5.000% 10/1/21 (ETM) 1,650 1,920
California Public Works Board Lease Revenue
(Various Capital Projects) 5.000% 11/1/18 4,000 4,235
California Public Works Board Lease Revenue
(Various Capital Projects) 5.000% 12/1/18 1,080 1,147
California Public Works Board Lease Revenue
(Various Capital Projects) 5.250% 11/1/19 (Prere.) 5,000 5,517
California Public Works Board Lease Revenue
(Various Capital Projects) 5.000% 1/1/20 10,000 11,028
California Public Works Board Lease Revenue
(Various Capital Projects) 5.375% 3/1/20 (Prere.) 9,065 10,150
California Public Works Board Lease Revenue
(Various Capital Projects) 5.000% 4/1/20 4,160 4,624
California Public Works Board Lease Revenue
(Various Capital Projects) 5.000% 5/1/20 5,850 6,519
California Public Works Board Lease Revenue
(Various Capital Projects) 5.000% 12/1/20 1,600 1,814
California Public Works Board Lease Revenue
(Various Capital Projects) 5.000% 12/1/21 (Prere.) 5,000 5,833
California Public Works Board Lease Revenue
(Various Capital Projects) 5.000% 12/1/21 (ETM) 5,400 6,310
California Public Works Board Lease Revenue
(Various Capital Projects) 5.000% 12/1/21 (Prere.) 2,645 3,085
California Public Works Board Lease Revenue
(Various Capital Projects) 5.000% 12/1/21 2,965 3,453
California Public Works Board Lease Revenue
(Various Capital Projects) 5.000% 12/1/21 1,110 1,293
California Public Works Board Lease Revenue
(Various Capital Projects) 5.000% 5/1/22 2,670 3,137
California Public Works Board Lease Revenue
(Various Capital Projects) 5.000% 9/1/22 (Prere.) 3,000 3,563
California Public Works Board Lease Revenue
(Various Capital Projects) 5.000% 9/1/22 (Prere.) 3,000 3,563
California Public Works Board Lease Revenue
(Various Capital Projects) 5.000% 11/1/22 1,500 1,784
California Public Works Board Lease Revenue
(Various Capital Projects) 5.000% 12/1/22 1,195 1,425
California Public Works Board Lease Revenue
(Various Capital Projects) 5.000% 4/1/23 4,180 4,868
California Public Works Board Lease Revenue
(Various Capital Projects) 5.000% 11/1/23 1,000 1,180
California Public Works Board Lease Revenue
(Various Capital Projects) 5.000% 11/1/24 2,000 2,357
California Public Works Board Lease Revenue
(Various Capital Projects) 5.000% 11/1/25 3,560 4,192
Face Market
Maturity Amount Value•
Coupon Date ($000) ($000)
61

California Intermediate-Term Tax-Exempt Fund
California Public Works Board Lease Revenue
(Various Capital Projects) 5.000% 5/1/28 4,250 5,052
California Public Works Board Lease Revenue
(Various Capital Projects) 5.000% 5/1/29 1,140 1,343
California Public Works Board Lease Revenue
(Various Capital Projects) 4.000% 4/1/30 14,980 16,428
California Public Works Board Lease Revenue
(Various Capital Projects) 5.000% 5/1/30 1,250 1,464
California Public Works Board Lease Revenue
(Various Capital Projects) 5.500% 11/1/30 5,545 6,738
California Public Works Board Lease Revenue
(Various Capital Projects) 5.000% 11/1/31 1,650 1,914
California Public Works Board Lease Revenue
(Various Capital Projects) 5.500% 11/1/31 7,000 8,487
California Public Works Board Lease Revenue
(Various Capital Projects) 4.000% 4/1/32 14,895 16,061
California Public Works Board Lease Revenue
(Various Capital Projects) 5.000% 11/1/32 11,465 13,254
California Public Works Board Lease Revenue
(Various Capital Projects) 5.500% 11/1/33 4,670 5,628
California State University Systemwide Revenue 5.000% 5/1/18 (Prere.) 8,250 8,570
California State University Systemwide Revenue 5.000% 5/1/18 (Prere.) 11,225 11,660
California State University Systemwide Revenue 5.000% 5/1/18 (Prere.) 4,840 5,028
California State University Systemwide Revenue 5.000% 5/1/18 (Prere.) 7,410 7,697
California State University Systemwide Revenue 5.250% 5/1/19 (Prere.) 3,515 3,806
California State University Systemwide Revenue 5.000% 11/1/19 2,300 2,527
California State University Systemwide Revenue 5.000% 11/1/20 1,670 1,893
California State University Systemwide Revenue 5.000% 11/1/22 1,500 1,791
California State University Systemwide Revenue 5.000% 11/1/23 3,960 4,594
California State University Systemwide Revenue 5.000% 11/1/24 2,915 3,382
California State University Systemwide Revenue 5.000% 11/1/24 4,505 5,570
California State University Systemwide Revenue 5.000% 11/1/24 440 456
California State University Systemwide Revenue 5.000% 11/1/25 1,010 1,265
California State University Systemwide Revenue 5.000% 11/1/25 595 617
California State University Systemwide Revenue 5.000% 11/1/26 2,000 2,496
California State University Systemwide Revenue 5.000% 11/1/26 405 420
California State University Systemwide Revenue 5.000% 11/1/27 5,740 6,593
California State University Systemwide Revenue 5.000% 11/1/27 2,000 2,458
California State University Systemwide Revenue 5.000% 11/1/27 160 166
California State University Systemwide Revenue 5.000% 11/1/28 5,000 6,007
California State University Systemwide Revenue 5.000% 11/1/28 2,610 3,191
California State University Systemwide Revenue 4.000% 11/1/29 3,900 4,280
California State University Systemwide Revenue 5.000% 11/1/30 2,920 3,528
California State University Systemwide Revenue 5.000% 11/1/30 2,000 2,421
California State University Systemwide Revenue 5.000% 11/1/30 (4) 250 259
California State University Systemwide Revenue 5.000% 11/1/31 8,900 10,523
California State University Systemwide Revenue 5.000% 11/1/31 10,080 12,109
California State University Systemwide Revenue 5.000% 11/1/31 4,000 4,820
California State University Systemwide Revenue 5.000% 11/1/32 6,000 7,304
California State University Systemwide Revenue 5.000% 11/1/32 12,895 15,414
California State University Systemwide Revenue 5.000% 11/1/32 5,000 6,002
California State University Systemwide Revenue 5.000% 11/1/33 6,335 7,669
California State University Systemwide Revenue 5.000% 11/1/33 5,775 6,869
California State University Systemwide Revenue 5.000% 11/1/33 10,000 11,960
Face Market
Maturity Amount Value•
Coupon Date ($000) ($000)
62

California Intermediate-Term Tax-Exempt Fund
California State University Systemwide Revenue 4.000% 11/1/34 9,875 10,642
California State University Systemwide Revenue 5.000% 11/1/34 5,000 6,024
California State University Systemwide Revenue 5.000% 11/1/34 5,000 5,838
California State University Systemwide Revenue 4.000% 11/1/35 8,875 9,522
California State University Systemwide Revenue 5.000% 11/1/35 8,000 9,599
California State University Systemwide Revenue 5.000% 11/1/35 5,975 6,954
California State University Systemwide Revenue 5.000% 11/1/35 13,205 15,587
California State University Systemwide Revenue 5.000% 11/1/36 3,000 3,533
California State University Systemwide Revenue 5.000% 11/1/37 3,640 4,336
California State University Systemwide Revenue
PUT 4.000% 11/1/21 23,465 25,927
California State University Systemwide Revenue
PUT 4.000% 11/1/23 19,435 22,104
California Statewide Communities Development
Authority Health Facility Revenue (Catholic
Healthcare West) 5.500% 7/1/17 (Prere.) 6,320 6,345
California Statewide Communities Development
Authority Pollution Control Revenue (Southern
California Edison Co.) PUT 1.375% 4/2/18 2,500 2,510
California Statewide Communities Development
Authority Pollution Control Revenue (Southern
California Edison Co.) PUT 2.625% 12/1/23 10,500 10,866
California Statewide Communities Development
Authority Revenue (899 Charleston Project) 5.000% 11/1/19 550 569
California Statewide Communities Development
Authority Revenue (899 Charleston Project) 5.000% 11/1/24 1,000 1,067
California Statewide Communities Development
Authority Revenue (899 Charleston Project) 5.000% 11/1/29 1,650 1,722
California Statewide Communities Development
Authority Revenue (899 Charleston Project) 5.000% 11/1/34 3,700 3,779
California Statewide Communities Development
Authority Revenue (Adventist Health
System/West) 3.000% 3/1/18 450 457
California Statewide Communities Development
Authority Revenue (Adventist Health
System/West) 4.000% 3/1/19 500 525
California Statewide Communities Development
Authority Revenue (Adventist Health
System/West) 4.000% 3/1/20 750 806
California Statewide Communities Development
Authority Revenue (Adventist Health
System/West) 5.000% 3/1/22 1,500 1,740
California Statewide Communities Development
Authority Revenue (Adventist Health
System/West) 5.000% 3/1/23 1,500 1,774
California Statewide Communities Development
Authority Revenue (Adventist Health
System/West) 5.000% 3/1/24 1,000 1,203
California Statewide Communities Development
Authority Revenue (Adventist Health
System/West) 5.000% 3/1/25 765 933
California Statewide Communities Development
Authority Revenue (Adventist Health
System/West) 5.000% 3/1/26 1,500 1,845
Face Market
Maturity Amount Value•
Coupon Date ($000) ($000)
63

California Intermediate-Term Tax-Exempt Fund
California Statewide Communities Development
Authority Revenue (Adventist Health
System/West) 5.000% 3/1/32 5,000 5,844
California Statewide Communities Development
Authority Revenue (Beverly Community
Hospital Association) 4.000% 11/1/21 215 231
California Statewide Communities Development
Authority Revenue (Beverly Community
Hospital Association) 5.000% 11/1/22 225 256
California Statewide Communities Development
Authority Revenue (Beverly Community
Hospital Association) 5.000% 11/1/23 235 270
California Statewide Communities Development
Authority Revenue (Beverly Community
Hospital Association) 3.000% 11/1/24 245 250
California Statewide Communities Development
Authority Revenue (Beverly Community
Hospital Association) 3.000% 11/1/25 260 263
California Statewide Communities Development
Authority Revenue (Beverly Community
Hospital Association) 3.125% 11/1/26 265 268
California Statewide Communities Development
Authority Revenue (Beverly Community
Hospital Association) 5.000% 11/1/27 270 316
California Statewide Communities Development
Authority Revenue (Buck Institute for Age
Research) 5.000% 11/15/18 275 291
California Statewide Communities Development
Authority Revenue (Buck Institute for Age
Research) 5.000% 11/15/19 (4) 250 274
California Statewide Communities Development
Authority Revenue (Buck Institute for Age
Research) 5.000% 11/15/20 (4) 210 237
California Statewide Communities Development
Authority Revenue (Buck Institute for Age
Research) 5.000% 11/15/21 (4) 200 232
California Statewide Communities Development
Authority Revenue (Buck Institute for Age
Research) 5.000% 11/15/22 (4) 200 236
California Statewide Communities Development
Authority Revenue (Buck Institute for Age
Research) 5.000% 11/15/23 (4) 400 481
California Statewide Communities Development
Authority Revenue (Buck Institute for Age
Research) 5.000% 11/15/24 (4) 500 609
California Statewide Communities Development
Authority Revenue (Buck Institute for Age
Research) 5.000% 11/15/27 (4) 1,660 1,978
California Statewide Communities Development
Authority Revenue (Buck Institute for Age
Research) 5.000% 11/15/28 (4) 900 1,065
California Statewide Communities Development
Authority Revenue (Buck Institute for Age
Research) 5.000% 11/15/34 (4) 2,500 2,877
Face Market
Maturity Amount Value•
Coupon Date ($000) ($000)
64
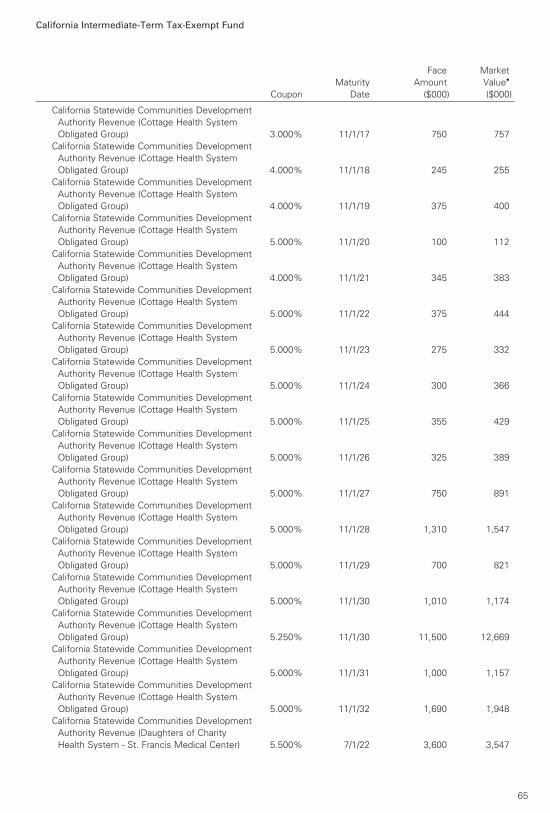
California Intermediate-Term Tax-Exempt Fund
California Statewide Communities Development
Authority Revenue (Cottage Health System
Obligated Group) 3.000% 11/1/17 750 757
California Statewide Communities Development
Authority Revenue (Cottage Health System
Obligated Group) 4.000% 11/1/18 245 255
California Statewide Communities Development
Authority Revenue (Cottage Health System
Obligated Group) 4.000% 11/1/19 375 400
California Statewide Communities Development
Authority Revenue (Cottage Health System
Obligated Group) 5.000% 11/1/20 100 112
California Statewide Communities Development
Authority Revenue (Cottage Health System
Obligated Group) 4.000% 11/1/21 345 383
California Statewide Communities Development
Authority Revenue (Cottage Health System
Obligated Group) 5.000% 11/1/22 375 444
California Statewide Communities Development
Authority Revenue (Cottage Health System
Obligated Group) 5.000% 11/1/23 275 332
California Statewide Communities Development
Authority Revenue (Cottage Health System
Obligated Group) 5.000% 11/1/24 300 366
California Statewide Communities Development
Authority Revenue (Cottage Health System
Obligated Group) 5.000% 11/1/25 355 429
California Statewide Communities Development
Authority Revenue (Cottage Health System
Obligated Group) 5.000% 11/1/26 325 389
California Statewide Communities Development
Authority Revenue (Cottage Health System
Obligated Group) 5.000% 11/1/27 750 891
California Statewide Communities Development
Authority Revenue (Cottage Health System
Obligated Group) 5.000% 11/1/28 1,310 1,547
California Statewide Communities Development
Authority Revenue (Cottage Health System
Obligated Group) 5.000% 11/1/29 700 821
California Statewide Communities Development
Authority Revenue (Cottage Health System
Obligated Group) 5.000% 11/1/30 1,010 1,174
California Statewide Communities Development
Authority Revenue (Cottage Health System
Obligated Group) 5.250% 11/1/30 11,500 12,669
California Statewide Communities Development
Authority Revenue (Cottage Health System
Obligated Group) 5.000% 11/1/31 1,000 1,157
California Statewide Communities Development
Authority Revenue (Cottage Health System
Obligated Group) 5.000% 11/1/32 1,690 1,948
California Statewide Communities Development
Authority Revenue (Daughters of Charity
Health System - St. Francis Medical Center) 5.500% 7/1/22 3,600 3,547
Face Market
Maturity Amount Value•
Coupon Date ($000) ($000)
65

California Intermediate-Term Tax-Exempt Fund
California Statewide Communities Development
Authority Revenue (Daughters of Charity Health
System - St. Francis Medical Center) 5.750% 7/1/25 1,405 1,388
California Statewide Communities Development
Authority Revenue (Daughters of Charity Health
System) 5.750% 7/1/24 10,040 9,959
California Statewide Communities Development
Authority Revenue (Enloe Medical Center) 5.000% 8/15/30 2,500 2,977
California Statewide Communities Development
Authority Revenue (Enloe Medical Center) 5.000% 8/15/31 4,020 4,764
California Statewide Communities Development
Authority Revenue (Enloe Medical Center) 5.000% 8/15/33 4,000 4,689
California Statewide Communities Development
Authority Revenue (Enloe Medical Center) 5.000% 8/15/34 4,795 5,601
California Statewide Communities Development
Authority Revenue (Enloe Medical Center) 5.000% 8/15/35 1,000 1,165
California Statewide Communities Development
Authority Revenue (Episcopal Communities &
Services) 5.000% 5/15/18 610 632
California Statewide Communities Development
Authority Revenue (Episcopal Communities &
Services) 5.000% 5/15/27 500 561
California Statewide Communities Development
Authority Revenue (Episcopal Communities &
Services) 5.000% 5/15/32 680 747
California Statewide Communities Development
Authority Revenue (Eskaton Properties Inc.
Obligated Group) 5.250% 11/15/34 4,350 4,763
California Statewide Communities Development
Authority Revenue (Huntington Memorial
Hospital) 5.000% 7/1/18 500 521
California Statewide Communities Development
Authority Revenue (Huntington Memorial
Hospital) 5.000% 7/1/18 1,035 1,053
California Statewide Communities Development
Authority Revenue (Huntington Memorial
Hospital) 5.000% 7/1/19 500 538
California Statewide Communities Development
Authority Revenue (Huntington Memorial
Hospital) 5.000% 7/1/20 325 361
California Statewide Communities Development
Authority Revenue (Huntington Memorial
Hospital) 5.000% 7/1/21 275 313
California Statewide Communities Development
Authority Revenue (Huntington Memorial
Hospital) 5.000% 7/1/22 250 291
California Statewide Communities Development
Authority Revenue (Huntington Memorial
Hospital) 5.000% 7/1/23 650 768
California Statewide Communities Development
Authority Revenue (Huntington Memorial
Hospital) 5.000% 7/1/24 750 899
Face Market
Maturity Amount Value•
Coupon Date ($000) ($000)
66
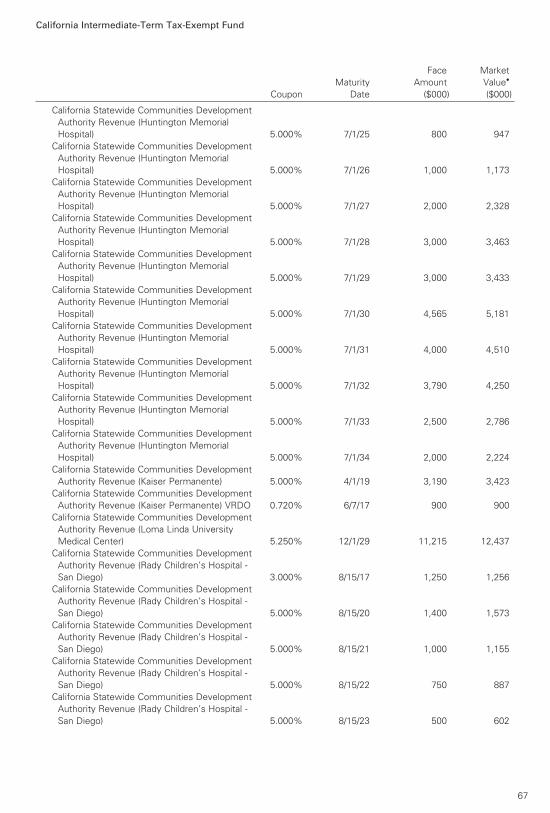
California Intermediate-Term Tax-Exempt Fund
California Statewide Communities Development
Authority Revenue (Huntington Memorial
Hospital) 5.000% 7/1/25 800 947
California Statewide Communities Development
Authority Revenue (Huntington Memorial
Hospital) 5.000% 7/1/26 1,000 1,173
California Statewide Communities Development
Authority Revenue (Huntington Memorial
Hospital) 5.000% 7/1/27 2,000 2,328
California Statewide Communities Development
Authority Revenue (Huntington Memorial
Hospital) 5.000% 7/1/28 3,000 3,463
California Statewide Communities Development
Authority Revenue (Huntington Memorial
Hospital) 5.000% 7/1/29 3,000 3,433
California Statewide Communities Development
Authority Revenue (Huntington Memorial
Hospital) 5.000% 7/1/30 4,565 5,181
California Statewide Communities Development
Authority Revenue (Huntington Memorial
Hospital) 5.000% 7/1/31 4,000 4,510
California Statewide Communities Development
Authority Revenue (Huntington Memorial
Hospital) 5.000% 7/1/32 3,790 4,250
California Statewide Communities Development
Authority Revenue (Huntington Memorial
Hospital) 5.000% 7/1/33 2,500 2,786
California Statewide Communities Development
Authority Revenue (Huntington Memorial
Hospital) 5.000% 7/1/34 2,000 2,224
California Statewide Communities Development
Authority Revenue (Kaiser Permanente) 5.000% 4/1/19 3,190 3,423
California Statewide Communities Development
Authority Revenue (Kaiser Permanente) VRDO 0.720% 6/7/17 900 900
California Statewide Communities Development
Authority Revenue (Loma Linda University
Medical Center) 5.250% 12/1/29 11,215 12,437
California Statewide Communities Development
Authority Revenue (Rady Children’s Hospital -
San Diego) 3.000% 8/15/17 1,250 1,256
California Statewide Communities Development
Authority Revenue (Rady Children’s Hospital -
San Diego) 5.000% 8/15/20 1,400 1,573
California Statewide Communities Development
Authority Revenue (Rady Children’s Hospital -
San Diego) 5.000% 8/15/21 1,000 1,155
California Statewide Communities Development
Authority Revenue (Rady Children’s Hospital -
San Diego) 5.000% 8/15/22 750 887
California Statewide Communities Development
Authority Revenue (Rady Children’s Hospital -
San Diego) 5.000% 8/15/23 500 602
Face Market
Maturity Amount Value•
Coupon Date ($000) ($000)
67
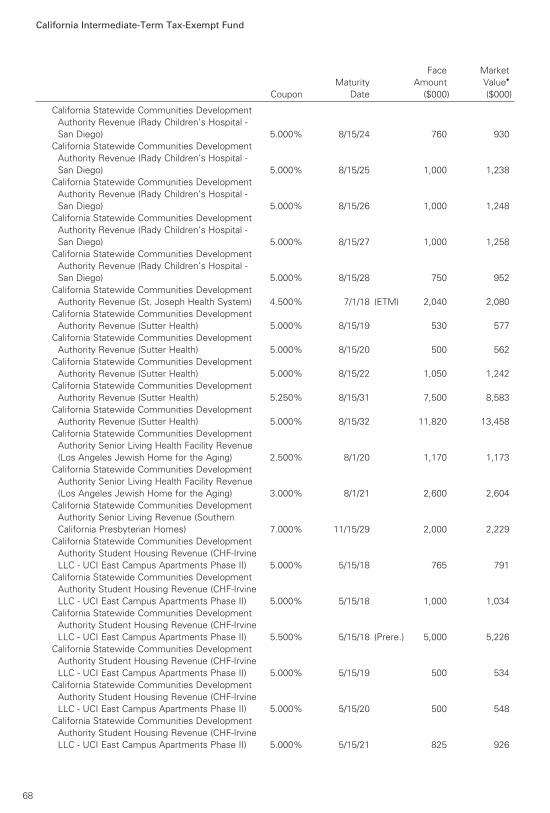
California Intermediate-Term Tax-Exempt Fund
California Statewide Communities Development
Authority Revenue (Rady Children’s Hospital -
San Diego) 5.000% 8/15/24 760 930
California Statewide Communities Development
Authority Revenue (Rady Children’s Hospital -
San Diego) 5.000% 8/15/25 1,000 1,238
California Statewide Communities Development
Authority Revenue (Rady Children’s Hospital -
San Diego) 5.000% 8/15/26 1,000 1,248
California Statewide Communities Development
Authority Revenue (Rady Children’s Hospital -
San Diego) 5.000% 8/15/27 1,000 1,258
California Statewide Communities Development
Authority Revenue (Rady Children’s Hospital -
San Diego) 5.000% 8/15/28 750 952
California Statewide Communities Development
Authority Revenue (St. Joseph Health System) 4.500% 7/1/18 (ETM) 2,040 2,080
California Statewide Communities Development
Authority Revenue (Sutter Health) 5.000% 8/15/19 530 577
California Statewide Communities Development
Authority Revenue (Sutter Health) 5.000% 8/15/20 500 562
California Statewide Communities Development
Authority Revenue (Sutter Health) 5.000% 8/15/22 1,050 1,242
California Statewide Communities Development
Authority Revenue (Sutter Health) 5.250% 8/15/31 7,500 8,583
California Statewide Communities Development
Authority Revenue (Sutter Health) 5.000% 8/15/32 11,820 13,458
California Statewide Communities Development
Authority Senior Living Health Facility Revenue
(Los Angeles Jewish Home for the Aging) 2.500% 8/1/20 1,170 1,173
California Statewide Communities Development
Authority Senior Living Health Facility Revenue
(Los Angeles Jewish Home for the Aging) 3.000% 8/1/21 2,600 2,604
California Statewide Communities Development
Authority Senior Living Revenue (Southern
California Presbyterian Homes) 7.000% 11/15/29 2,000 2,229
California Statewide Communities Development
Authority Student Housing Revenue (CHF-Irvine
LLC - UCI East Campus Apartments Phase II) 5.000% 5/15/18 765 791
California Statewide Communities Development
Authority Student Housing Revenue (CHF-Irvine
LLC - UCI East Campus Apartments Phase II) 5.000% 5/15/18 1,000 1,034
California Statewide Communities Development
Authority Student Housing Revenue (CHF-Irvine
LLC - UCI East Campus Apartments Phase II) 5.500% 5/15/18 (Prere.) 5,000 5,226
California Statewide Communities Development
Authority Student Housing Revenue (CHF-Irvine
LLC - UCI East Campus Apartments Phase II) 5.000% 5/15/19 500 534
California Statewide Communities Development
Authority Student Housing Revenue (CHF-Irvine
LLC - UCI East Campus Apartments Phase II) 5.000% 5/15/20 500 548
California Statewide Communities Development
Authority Student Housing Revenue (CHF-Irvine
LLC - UCI East Campus Apartments Phase II) 5.000% 5/15/21 825 926
Face Market
Maturity Amount Value•
Coupon Date ($000) ($000)
68
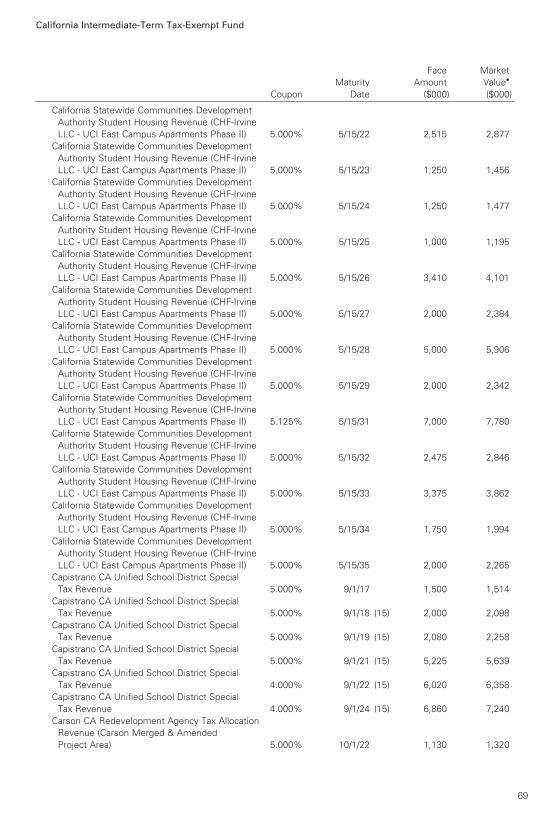
California Intermediate-Term Tax-Exempt Fund
California Statewide Communities Development
Authority Student Housing Revenue (CHF-Irvine
LLC - UCI East Campus Apartments Phase II) 5.000% 5/15/22 2,515 2,877
California Statewide Communities Development
Authority Student Housing Revenue (CHF-Irvine
LLC - UCI East Campus Apartments Phase II) 5.000% 5/15/23 1,250 1,456
California Statewide Communities Development
Authority Student Housing Revenue (CHF-Irvine
LLC - UCI East Campus Apartments Phase II) 5.000% 5/15/24 1,250 1,477
California Statewide Communities Development
Authority Student Housing Revenue (CHF-Irvine
LLC - UCI East Campus Apartments Phase II) 5.000% 5/15/25 1,000 1,195
California Statewide Communities Development
Authority Student Housing Revenue (CHF-Irvine
LLC - UCI East Campus Apartments Phase II) 5.000% 5/15/26 3,410 4,101
California Statewide Communities Development
Authority Student Housing Revenue (CHF-Irvine
LLC - UCI East Campus Apartments Phase II) 5.000% 5/15/27 2,000 2,384
California Statewide Communities Development
Authority Student Housing Revenue (CHF-Irvine
LLC - UCI East Campus Apartments Phase II) 5.000% 5/15/28 5,000 5,906
California Statewide Communities Development
Authority Student Housing Revenue (CHF-Irvine
LLC - UCI East Campus Apartments Phase II) 5.000% 5/15/29 2,000 2,342
California Statewide Communities Development
Authority Student Housing Revenue (CHF-Irvine
LLC - UCI East Campus Apartments Phase II) 5.125% 5/15/31 7,000 7,780
California Statewide Communities Development
Authority Student Housing Revenue (CHF-Irvine
LLC - UCI East Campus Apartments Phase II) 5.000% 5/15/32 2,475 2,846
California Statewide Communities Development
Authority Student Housing Revenue (CHF-Irvine
LLC - UCI East Campus Apartments Phase II) 5.000% 5/15/33 3,375 3,862
California Statewide Communities Development
Authority Student Housing Revenue (CHF-Irvine
LLC - UCI East Campus Apartments Phase II) 5.000% 5/15/34 1,750 1,994
California Statewide Communities Development
Authority Student Housing Revenue (CHF-Irvine
LLC - UCI East Campus Apartments Phase II) 5.000% 5/15/35 2,000 2,265
Capistrano CA Unified School District Special
Tax Revenue 5.000% 9/1/17 1,500 1,514
Capistrano CA Unified School District Special
Tax Revenue 5.000% 9/1/18 (15) 2,000 2,098
Capistrano CA Unified School District Special
Tax Revenue 5.000% 9/1/19 (15) 2,080 2,258
Capistrano CA Unified School District Special
Tax Revenue 5.000% 9/1/21 (15) 5,225 5,639
Capistrano CA Unified School District Special
Tax Revenue 4.000% 9/1/22 (15) 6,020 6,358
Capistrano CA Unified School District Special
Tax Revenue 4.000% 9/1/24 (15) 6,860 7,240
Carson CA Redevelopment Agency Tax Allocation
Revenue (Carson Merged & Amended
Project Area) 5.000% 10/1/22 1,130 1,320
Face Market
Maturity Amount Value•
Coupon Date ($000) ($000)
69
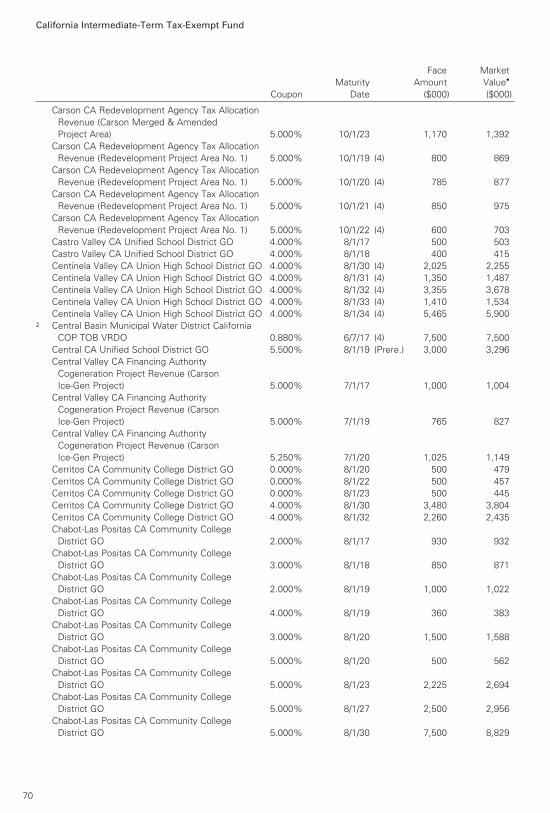
California Intermediate-Term Tax-Exempt Fund
Carson CA Redevelopment Agency Tax Allocation
Revenue (Carson Merged & Amended
Project Area) 5.000% 10/1/23 1,170 1,392
Carson CA Redevelopment Agency Tax Allocation
Revenue (Redevelopment Project Area No. 1) 5.000% 10/1/19 (4) 800 869
Carson CA Redevelopment Agency Tax Allocation
Revenue (Redevelopment Project Area No. 1) 5.000% 10/1/20 (4) 785 877
Carson CA Redevelopment Agency Tax Allocation
Revenue (Redevelopment Project Area No. 1) 5.000% 10/1/21 (4) 850 975
Carson CA Redevelopment Agency Tax Allocation
Revenue (Redevelopment Project Area No. 1) 5.000% 10/1/22 (4) 600 703
Castro Valley CA Unified School District GO 4.000% 8/1/17 500 503
Castro Valley CA Unified School District GO 4.000% 8/1/18 400 415
Centinela Valley CA Union High School District GO 4.000% 8/1/30 (4) 2,025 2,255
Centinela Valley CA Union High School District GO 4.000% 8/1/31 (4) 1,350 1,487
Centinela Valley CA Union High School District GO 4.000% 8/1/32 (4) 3,355 3,678
Centinela Valley CA Union High School District GO 4.000% 8/1/33 (4) 1,410 1,534
Centinela Valley CA Union High School District GO 4.000% 8/1/34 (4) 5,465 5,9002 Central Basin Municipal Water District California
COP TOB VRDO 0.880% 6/7/17 (4) 7,500 7,500
Central CA Unified School District GO 5.500% 8/1/19 (Prere.) 3,000 3,296
Central Valley CA Financing Authority
Cogeneration Project Revenue (Carson
Ice-Gen Project) 5.000% 7/1/17 1,000 1,004
Central Valley CA Financing Authority
Cogeneration Project Revenue (Carson
Ice-Gen Project) 5.000% 7/1/19 765 827
Central Valley CA Financing Authority
Cogeneration Project Revenue (Carson
Ice-Gen Project) 5.250% 7/1/20 1,025 1,149
Cerritos CA Community College District GO 0.000% 8/1/20 500 479
Cerritos CA Community College District GO 0.000% 8/1/22 500 457
Cerritos CA Community College District GO 0.000% 8/1/23 500 445
Cerritos CA Community College District GO 4.000% 8/1/30 3,480 3,804
Cerritos CA Community College District GO 4.000% 8/1/32 2,260 2,435
Chabot-Las Positas CA Community College
District GO 2.000% 8/1/17 930 932
Chabot-Las Positas CA Community College
District GO 3.000% 8/1/18 850 871
Chabot-Las Positas CA Community College
District GO 2.000% 8/1/19 1,000 1,022
Chabot-Las Positas CA Community College
District GO 4.000% 8/1/19 360 383
Chabot-Las Positas CA Community College
District GO 3.000% 8/1/20 1,500 1,588
Chabot-Las Positas CA Community College
District GO 5.000% 8/1/20 500 562
Chabot-Las Positas CA Community College
District GO 5.000% 8/1/23 2,225 2,694
Chabot-Las Positas CA Community College
District GO 5.000% 8/1/27 2,500 2,956
Chabot-Las Positas CA Community College
District GO 5.000% 8/1/30 7,500 8,829
Face Market
Maturity Amount Value•
Coupon Date ($000) ($000)
70

California Intermediate-Term Tax-Exempt Fund
Chabot-Las Positas CA Community College
District GO 5.000% 8/1/31 7,500 8,777
Chabot-Las Positas CA Community College
District GO 5.000% 8/1/32 13,000 15,170
Chaffey CA Community College District GO 5.000% 6/1/32 5,000 5,882
Chaffey CA Union High School District GO 0.000% 8/1/20 400 383
Chaffey CA Union High School District GO 0.000% 8/1/21 500 469
Chaffey CA Union High School District GO 0.000% 8/1/22 500 459
Chaffey CA Union High School District GO 0.000% 8/1/23 600 535
Chaffey CA Union High School District GO 0.000% 8/1/24 500 433
Chaffey CA Union High School District GO 0.000% 8/1/25 655 534
Chaffey CA Union High School District GO 0.000% 8/1/26 1,430 1,106
Chaffey CA Union High School District GO 0.000% 8/1/28 2,000 1,398
Chico CA Unified School District GO 3.000% 8/1/18 3,145 3,223
Chico CA Unified School District GO 3.000% 8/1/18 640 656
Chico CA Unified School District GO 3.000% 8/1/19 1,500 1,566
Chico CA Unified School District GO 4.000% 8/1/20 1,330 1,452
Chico CA Unified School District GO 4.000% 8/1/21 1,200 1,336
Chico CA Unified School District GO 4.000% 8/1/22 400 453
Chico CA Unified School District GO 4.000% 8/1/23 450 516
Chino Basin Regional Financing Authority
California Revenue (Inland Empire Utilities
Agency) VRDO 0.750% 6/7/17 LOC 4,160 4,160
Chino CA Public Financing Authority Special
Tax Revenue 5.000% 9/1/24 (4) 675 813
Chino CA Public Financing Authority Special
Tax Revenue 5.000% 9/1/25 (4) 1,000 1,216
Chino CA Redevelopment Agency Successor
Agency Tax Allocation Revenue 5.000% 9/1/20 (15) 625 701
Chino CA Redevelopment Agency Successor
Agency Tax Allocation Revenue 5.000% 9/1/27 (15) 1,195 1,417
Chino CA Redevelopment Agency Successor
Agency Tax Allocation Revenue 5.000% 9/1/30 (15) 1,170 1,359
Chula Vista CA Industrial Development Revenue
(San Diego Gas & Electric Co.) 1.650% 7/1/18 6,245 6,249
Chula Vista CA Municipal Financing Authority
Special Tax Revenue 4.000% 9/1/17 700 705
Chula Vista CA Municipal Financing Authority
Special Tax Revenue 5.000% 9/1/18 1,165 1,221
Chula Vista CA Municipal Financing Authority
Special Tax Revenue 5.000% 9/1/19 2,265 2,454
Chula Vista CA Municipal Financing Authority
Special Tax Revenue 5.000% 9/1/20 1,185 1,319
Chula Vista CA Municipal Financing Authority
Special Tax Revenue 5.000% 9/1/21 2,500 2,853
Chula Vista CA Municipal Financing Authority
Special Tax Revenue 5.000% 9/1/23 2,615 3,047
Chula Vista CA Municipal Financing Authority
Special Tax Revenue 5.250% 9/1/24 3,225 3,778
Chula Vista CA Municipal Financing Authority
Special Tax Revenue 5.500% 9/1/25 3,495 4,139
Chula Vista CA Municipal Financing Authority
Special Tax Revenue 5.500% 9/1/26 3,685 4,344
Face Market
Maturity Amount Value•
Coupon Date ($000) ($000)
71

California Intermediate-Term Tax-Exempt Fund
Chula Vista CA Municipal Financing Authority
Special Tax Revenue 5.500% 9/1/27 970 1,139
Citrus CA Community College District GO 0.000% 8/1/33 1,000 847
Citrus CA Community College District GO 0.000% 8/1/35 3,150 2,642
Clovis CA Unified School District GO 0.000% 8/1/18 (14) 3,645 3,5962 Coachella Valley CA Unified School District TOB
VRDO 0.980% 6/7/17 7,500 7,500
Coast CA Community College District GO 0.000% 8/1/33 8,000 4,308
Coast CA Community College District GO 5.000% 8/1/33 3,000 3,568
Colton CA Joint Unified School District GO 5.000% 8/1/23 (4) 765 918
Colton CA Joint Unified School District GO 5.000% 8/1/25 (4) 1,000 1,199
Colton CA Redevelopment Agency Successor
Agency Tax Allocation Revenue 4.000% 8/1/18 1,000 1,034
Colton CA Redevelopment Agency Successor
Agency Tax Allocation Revenue 5.000% 8/1/19 1,040 1,124
Colton CA Redevelopment Agency Successor
Agency Tax Allocation Revenue 5.000% 8/1/20 (15) 1,230 1,368
Colton CA Redevelopment Agency Successor
Agency Tax Allocation Revenue 5.000% 8/1/22 (15) 1,215 1,418
Conejo Valley CA Unified School District GO 0.000% 8/1/21 (4) 2,000 1,872
Conejo Valley CA Unified School District GO 0.000% 8/1/22 (4) 2,750 2,508
Conejo Valley CA Unified School District GO 0.000% 8/1/23 (4) 2,500 2,220
Conejo Valley CA Unified School District GO 0.000% 8/1/24 (4) 3,000 2,570
Conejo Valley CA Unified School District GO 0.000% 8/1/25 (4) 3,380 2,744
Conejo Valley CA Unified School District GO 0.000% 8/1/26 (4) 3,500 2,678
Conejo Valley CA Unified School District GO 0.000% 8/1/27 (4) 3,000 2,170
Conejo Valley CA Unified School District GO 0.000% 8/1/28 (4) 2,290 1,561
Contra Costa CA Community College District GO 5.000% 8/1/24 4,140 4,882
Contra Costa CA Community College District GO 5.000% 8/1/32 3,000 3,501
Contra Costa CA Community College District GO 5.000% 8/1/33 4,000 4,647
Contra Costa CA Municipal Water District
Revenue 3.000% 10/1/19 10,000 10,431
Contra Costa CA Transportation Authority Sales
Tax Revenue 5.000% 3/1/20 (Prere.) 1,080 1,1984 Contra Costa CA Transportation Authority Sales
Tax Revenue 5.000% 3/1/30 2,000 2,4774 Contra Costa CA Transportation Authority Sales
Tax Revenue 5.000% 3/1/31 1,250 1,5374 Contra Costa CA Transportation Authority Sales
Tax Revenue 5.000% 3/1/32 2,000 2,446
Contra Costa CA Transportation Authority Sales
Tax Revenue 5.000% 3/1/32 1,600 1,8664 Contra Costa CA Transportation Authority Sales
Tax Revenue 5.000% 3/1/33 6,060 7,369
Contra Costa CA Transportation Authority Sales
Tax Revenue 5.000% 3/1/33 1,800 2,0924 Contra Costa CA Transportation Authority Sales
Tax Revenue 5.000% 3/1/34 5,665 6,856
Contra Costa County CA Public Financing
Authority Lease Revenue 3.000% 6/1/20 1,000 1,053
Contra Costa County CA Public Financing
Authority Lease Revenue 5.000% 6/1/20 800 889
Contra Costa County CA Public Financing
Authority Lease Revenue 5.000% 6/1/21 700 800
Face Market
Maturity Amount Value•
Coupon Date ($000) ($000)
72

California Intermediate-Term Tax-Exempt Fund
Contra Costa County CA Public Financing
Authority Lease Revenue 5.000% 6/1/22 600 702
Contra Costa County CA Public Financing
Authority Lease Revenue 5.000% 6/1/22 (14) 10,105 10,105
Contra Costa County CA Public Financing
Authority Lease Revenue 5.000% 6/1/23 1,130 1,350
Contra Costa County CA Public Financing
Authority Lease Revenue 5.000% 6/1/23 2,335 2,789
Corona-Norco CA School District Public
Financing Authority Special Tax Revenue 5.000% 9/1/21 500 572
Corona-Norco CA School District Public
Financing Authority Special Tax Revenue 5.000% 9/1/23 500 593
Corona-Norco CA Unified School District GO 0.000% 8/1/20 (12) 1,825 1,746
Corona-Norco CA Unified School District GO 0.000% 8/1/21 (12) 2,010 1,886
Corona-Norco CA Unified School District GO 0.000% 8/1/22 (12) 1,700 1,555
Corona-Norco CA Unified School District GO 0.000% 8/1/23 (12) 1,000 890
Corona-Norco CA Unified School District GO 0.000% 8/1/25 (12) 1,325 1,104
Corona-Norco CA Unified School District GO 0.000% 8/1/26 (12) 1,530 1,219
Corona-Norco CA Unified School District GO 0.000% 8/1/27 (12) 1,500 1,148
Corona-Norco CA Unified School District GO 0.000% 8/1/28 (12) 1,290 935
Corona-Norco CA Unified School District GO 4.000% 8/1/33 2,525 2,734
Corona-Norco CA Unified School District GO 4.000% 8/1/33 2,000 2,166
Corona-Norco CA Unified School District GO 4.000% 8/1/34 2,000 2,148
Corona-Norco CA Unified School District GO 4.000% 8/1/34 3,000 3,221
Corona-Norco CA Unified School District Special
Tax Revenue (Community Facilities District
No. 98-1) 5.000% 9/1/23 1,145 1,358
Corona-Norco CA Unified School District Special
Tax Revenue (Community Facilities District
No. 98-1) 5.000% 9/1/24 1,325 1,560
Corona-Norco CA Unified School District Special
Tax Revenue (Community Facilities District
No. 98-1) 5.000% 9/1/25 2,525 2,948
Corona-Norco CA Unified School District Special
Tax Revenue (Community Facilities District
No. 98-1) 5.000% 9/1/27 1,000 1,150
Corona-Norco CA Unified School District Special
Tax Revenue (Community Facilities District
No. 98-1) 5.000% 9/1/28 1,590 1,819
Cupertino CA Union School District GO 5.000% 8/1/25 3,235 3,910
Cupertino CA Union School District GO 5.000% 8/1/32 480 585
Cupertino CA Union School District GO 5.000% 8/1/33 545 660
Cupertino CA Union School District GO 5.000% 8/1/34 245 296
Del Mar CA Race Track Authority Revenue 4.000% 10/1/21 1,380 1,457
Del Mar CA Race Track Authority Revenue 5.000% 10/1/24 1,585 1,752
Del Mar CA Race Track Authority Revenue 5.000% 10/1/26 1,745 1,901
Del Mar CA Race Track Authority Revenue 5.000% 10/1/27 1,835 1,993
Del Mar CA Race Track Authority Revenue 5.000% 10/1/29 1,010 1,093
Del Mar CA Race Track Authority Revenue 5.000% 10/1/35 1,665 1,795
Desert CA Community College District GO 4.000% 8/1/19 1,500 1,600
Desert CA Community College District GO 5.000% 8/1/20 1,760 1,980
East Bay CA Municipal Utility District Waste
Water System Revenue 5.000% 6/1/35 8,455 10,033
Face Market
Maturity Amount Value•
Coupon Date ($000) ($000)
73
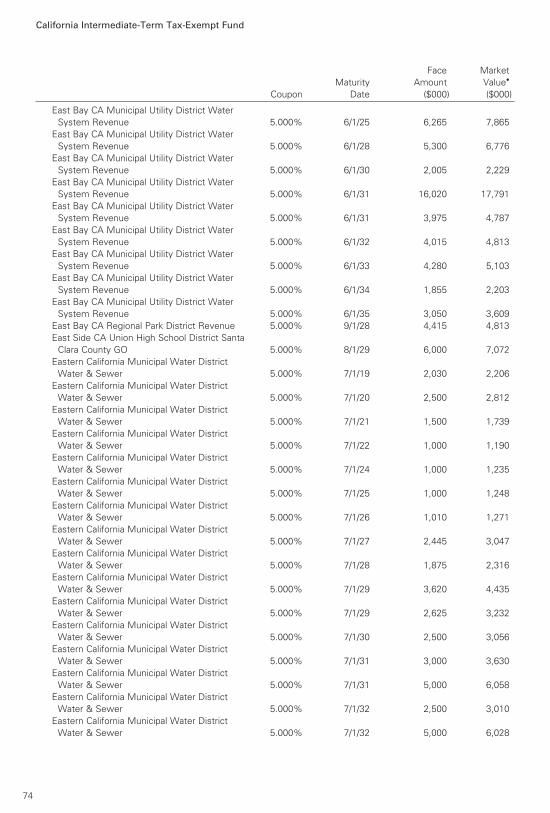
California Intermediate-Term Tax-Exempt Fund
East Bay CA Municipal Utility District Water
System Revenue 5.000% 6/1/25 6,265 7,865
East Bay CA Municipal Utility District Water
System Revenue 5.000% 6/1/28 5,300 6,776
East Bay CA Municipal Utility District Water
System Revenue 5.000% 6/1/30 2,005 2,229
East Bay CA Municipal Utility District Water
System Revenue 5.000% 6/1/31 16,020 17,791
East Bay CA Municipal Utility District Water
System Revenue 5.000% 6/1/31 3,975 4,787
East Bay CA Municipal Utility District Water
System Revenue 5.000% 6/1/32 4,015 4,813
East Bay CA Municipal Utility District Water
System Revenue 5.000% 6/1/33 4,280 5,103
East Bay CA Municipal Utility District Water
System Revenue 5.000% 6/1/34 1,855 2,203
East Bay CA Municipal Utility District Water
System Revenue 5.000% 6/1/35 3,050 3,609
East Bay CA Regional Park District Revenue 5.000% 9/1/28 4,415 4,813
East Side CA Union High School District Santa
Clara County GO 5.000% 8/1/29 6,000 7,072
Eastern California Municipal Water District
Water & Sewer 5.000% 7/1/19 2,030 2,206
Eastern California Municipal Water District
Water & Sewer 5.000% 7/1/20 2,500 2,812
Eastern California Municipal Water District
Water & Sewer 5.000% 7/1/21 1,500 1,739
Eastern California Municipal Water District
Water & Sewer 5.000% 7/1/22 1,000 1,190
Eastern California Municipal Water District
Water & Sewer 5.000% 7/1/24 1,000 1,235
Eastern California Municipal Water District
Water & Sewer 5.000% 7/1/25 1,000 1,248
Eastern California Municipal Water District
Water & Sewer 5.000% 7/1/26 1,010 1,271
Eastern California Municipal Water District
Water & Sewer 5.000% 7/1/27 2,445 3,047
Eastern California Municipal Water District
Water & Sewer 5.000% 7/1/28 1,875 2,316
Eastern California Municipal Water District
Water & Sewer 5.000% 7/1/29 3,620 4,435
Eastern California Municipal Water District
Water & Sewer 5.000% 7/1/29 2,625 3,232
Eastern California Municipal Water District
Water & Sewer 5.000% 7/1/30 2,500 3,056
Eastern California Municipal Water District
Water & Sewer 5.000% 7/1/31 3,000 3,630
Eastern California Municipal Water District
Water & Sewer 5.000% 7/1/31 5,000 6,058
Eastern California Municipal Water District
Water & Sewer 5.000% 7/1/32 2,500 3,010
Eastern California Municipal Water District
Water & Sewer 5.000% 7/1/32 5,000 6,028
Face Market
Maturity Amount Value•
Coupon Date ($000) ($000)
74

California Intermediate-Term Tax-Exempt Fund
Eastern California Municipal Water District
Water & Sewer 5.000% 7/1/33 3,750 4,491
Eastern California Municipal Water District
Water & Sewer 5.000% 7/1/33 5,000 5,992
Eastern California Municipal Water District
Water & Sewer 5.000% 7/1/34 4,720 5,627
Eastern California Municipal Water District
Water & Sewer 5.000% 7/1/35 4,970 5,903
Eastern California Municipal Water District
Water & Sewer 5.000% 7/1/36 2,310 2,735
Eastern California Municipal Water District
Water & Sewer COP 5.000% 7/1/18 (Prere.) 5,245 5,483
Eastern California Municipal Water District
Water & Sewer COP 5.000% 7/1/18 (Prere.) 6,220 6,502
Eastern California Municipal Water District
Water & Sewer COP 5.000% 7/1/18 (Prere.) 1,000 1,045
Eastern California Municipal Water District
Water & Wastewater Revenue VRDO 0.750% 6/7/17 LOC 9,410 9,4101,2 Eaton Vance California Municipal Bond Fund II 1.630% 7/1/19 8,300 8,298
El Camino CA Community College District GO 2.000% 8/1/17 1,750 1,754
El Camino CA Community College District GO 2.000% 8/1/17 2,200 2,205
El Camino CA Community College District GO 0.000% 8/1/29 8,065 5,647
El Camino CA Community College District GO 0.000% 8/1/32 10,000 6,114
El Camino CA Community College District GO 0.000% 8/1/33 3,500 2,036
El Camino CA Community College District GO 5.000% 8/1/34 1,100 1,311
El Camino CA Community College District GO 5.000% 8/1/35 1,230 1,462
El Camino CA Community College District GO 5.000% 8/1/36 1,400 1,659
El Camino CA Healthcare District GO 4.000% 8/1/33 3,000 3,255
El Dorado CA Irrigation District Revenue 4.500% 3/1/19 (4) 2,000 2,125
El Dorado CA Irrigation District Revenue 4.750% 3/1/20 (4) 1,500 1,652
El Dorado CA Irrigation District Revenue 5.000% 3/1/21 (4) 2,280 2,605
El Dorado CA Irrigation District Revenue 5.000% 3/1/28 (4) 1,500 1,782
El Dorado CA Irrigation District Revenue 5.000% 3/1/34 (4) 5,460 6,284
El Dorado County CA Community Facilities
District No. 92-1 Special Tax Revenue 5.000% 9/1/21 2,000 2,289
Elk Grove CA Finance Authority Special Tax
Revenue 3.000% 9/1/18 425 435
Elk Grove CA Finance Authority Special Tax
Revenue 4.000% 9/1/19 655 695
Elk Grove CA Finance Authority Special Tax
Revenue 4.000% 9/1/20 560 607
Elk Grove CA Finance Authority Special Tax
Revenue 5.000% 9/1/21 450 515
Elk Grove CA Finance Authority Special Tax
Revenue 5.000% 9/1/22 425 496
Elk Grove CA Finance Authority Special Tax
Revenue 5.000% 9/1/33 (15) 2,000 2,303
Elk Grove CA Finance Authority Special Tax
Revenue 5.000% 9/1/34 (15) 3,970 4,559
Elk Grove CA Finance Authority Special Tax
Revenue 5.000% 9/1/35 (15) 3,735 4,274
Encinitas CA Community Facilities District
No. 1 Special Tax Revenue 5.000% 9/1/28 1,000 1,122
Face Market
Maturity Amount Value•
Coupon Date ($000) ($000)
75
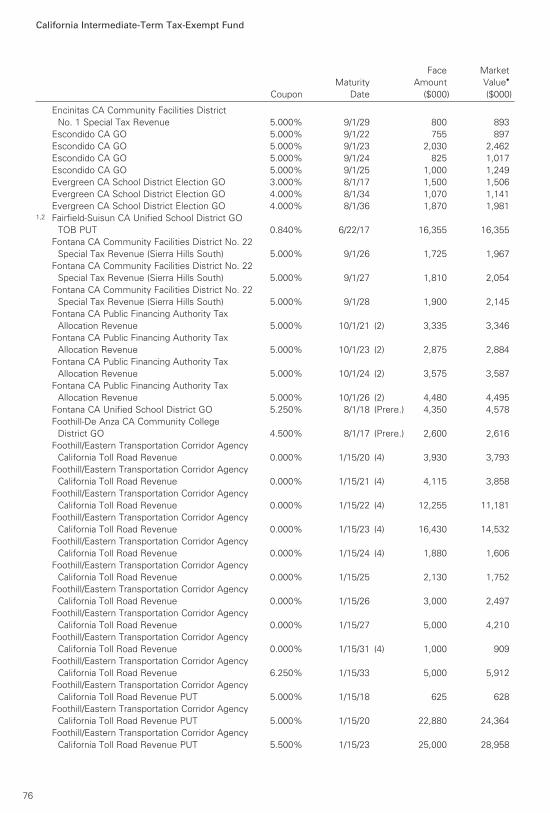
California Intermediate-Term Tax-Exempt Fund
Encinitas CA Community Facilities District
No. 1 Special Tax Revenue 5.000% 9/1/29 800 893
Escondido CA GO 5.000% 9/1/22 755 897
Escondido CA GO 5.000% 9/1/23 2,030 2,462
Escondido CA GO 5.000% 9/1/24 825 1,017
Escondido CA GO 5.000% 9/1/25 1,000 1,249
Evergreen CA School District Election GO 3.000% 8/1/17 1,500 1,506
Evergreen CA School District Election GO 4.000% 8/1/34 1,070 1,141
Evergreen CA School District Election GO 4.000% 8/1/36 1,870 1,9811,2 Fairfield-Suisun CA Unified School District GO
TOB PUT 0.840% 6/22/17 16,355 16,355
Fontana CA Community Facilities District No. 22
Special Tax Revenue (Sierra Hills South) 5.000% 9/1/26 1,725 1,967
Fontana CA Community Facilities District No. 22
Special Tax Revenue (Sierra Hills South) 5.000% 9/1/27 1,810 2,054
Fontana CA Community Facilities District No. 22
Special Tax Revenue (Sierra Hills South) 5.000% 9/1/28 1,900 2,145
Fontana CA Public Financing Authority Tax
Allocation Revenue 5.000% 10/1/21 (2) 3,335 3,346
Fontana CA Public Financing Authority Tax
Allocation Revenue 5.000% 10/1/23 (2) 2,875 2,884
Fontana CA Public Financing Authority Tax
Allocation Revenue 5.000% 10/1/24 (2) 3,575 3,587
Fontana CA Public Financing Authority Tax
Allocation Revenue 5.000% 10/1/26 (2) 4,480 4,495
Fontana CA Unified School District GO 5.250% 8/1/18 (Prere.) 4,350 4,578
Foothill-De Anza CA Community College
District GO 4.500% 8/1/17 (Prere.) 2,600 2,616
Foothill/Eastern Transportation Corridor Agency
California Toll Road Revenue 0.000% 1/15/20 (4) 3,930 3,793
Foothill/Eastern Transportation Corridor Agency
California Toll Road Revenue 0.000% 1/15/21 (4) 4,115 3,858
Foothill/Eastern Transportation Corridor Agency
California Toll Road Revenue 0.000% 1/15/22 (4) 12,255 11,181
Foothill/Eastern Transportation Corridor Agency
California Toll Road Revenue 0.000% 1/15/23 (4) 16,430 14,532
Foothill/Eastern Transportation Corridor Agency
California Toll Road Revenue 0.000% 1/15/24 (4) 1,880 1,606
Foothill/Eastern Transportation Corridor Agency
California Toll Road Revenue 0.000% 1/15/25 2,130 1,752
Foothill/Eastern Transportation Corridor Agency
California Toll Road Revenue 0.000% 1/15/26 3,000 2,497
Foothill/Eastern Transportation Corridor Agency
California Toll Road Revenue 0.000% 1/15/27 5,000 4,210
Foothill/Eastern Transportation Corridor Agency
California Toll Road Revenue 0.000% 1/15/31 (4) 1,000 909
Foothill/Eastern Transportation Corridor Agency
California Toll Road Revenue 6.250% 1/15/33 5,000 5,912
Foothill/Eastern Transportation Corridor Agency
California Toll Road Revenue PUT 5.000% 1/15/18 625 628
Foothill/Eastern Transportation Corridor Agency
California Toll Road Revenue PUT 5.000% 1/15/20 22,880 24,364
Foothill/Eastern Transportation Corridor Agency
California Toll Road Revenue PUT 5.500% 1/15/23 25,000 28,958
Face Market
Maturity Amount Value•
Coupon Date ($000) ($000)
76

California Intermediate-Term Tax-Exempt Fund
Fremont CA Unified School District GO 4.000% 8/1/29 1,070 1,178
Fremont CA Unified School District GO 4.000% 8/1/30 1,415 1,547
Fremont CA Unified School District GO 4.000% 8/1/31 1,790 1,936
Fremont CA Unified School District GO 4.000% 8/1/32 2,195 2,365
Fremont CA Unified School District GO 4.000% 8/1/33 2,630 2,816
Fremont CA Unified School District GO 4.000% 8/1/34 3,105 3,304
Fremont CA Union High School District GO 4.000% 8/1/17 3,750 3,771
Fremont CA Union High School District GO 4.000% 8/1/32 1,000 1,085
Fremont CA Union High School District GO 4.000% 8/1/34 2,085 2,234
Fresno CA Joint Powers Financing Authority
Lease Revenue 5.000% 4/1/18 600 619
Fresno CA Joint Powers Financing Authority
Lease Revenue 5.000% 4/1/19 1,130 1,206
Fresno CA Joint Powers Financing Authority
Lease Revenue 5.000% 4/1/20 1,000 1,100
Fresno CA Joint Powers Financing Authority
Lease Revenue 5.000% 4/1/21 1,250 1,409
Fresno CA Joint Powers Financing Authority
Lease Revenue 5.000% 4/1/22 (4) 425 492
Fresno CA Joint Powers Financing Authority
Lease Revenue 5.000% 4/1/23 (4) 800 942
Fresno CA Joint Powers Financing Authority
Lease Revenue 5.000% 4/1/24 (4) 675 805
Fresno CA Joint Powers Financing Authority
Lease Revenue 5.000% 4/1/26 (4) 1,650 1,996
Fresno CA Joint Powers Financing Authority
Lease Revenue 5.000% 4/1/27 (4) 1,300 1,588
Fresno CA Joint Powers Financing Authority
Lease Revenue 5.000% 4/1/30 (4) 675 804
Fresno CA Joint Powers Financing Authority
Lease Revenue 5.000% 4/1/31 (4) 1,000 1,183
Fresno CA Joint Powers Financing Authority
Lease Revenue 5.000% 4/1/32 (4) 1,500 1,765
Fresno CA Joint Powers Financing Authority
Lease Revenue 5.000% 4/1/36 (4) 2,055 2,380
Fresno CA Joint Powers Financing Authority
Lease Revenue 5.000% 4/1/37 (4) 1,200 1,386
Fresno CA Sewer Revenue 5.000% 9/1/24 (12) 830 871
Fullerton CA Community Facilities District No. 1
Special Tax Revenue (Amerige Heights) 5.000% 9/1/26 1,000 1,142
Fullerton CA Community Facilities District No. 1
Special Tax Revenue (Amerige Heights) 5.000% 9/1/32 1,600 1,789
Gavilan CA Joint Community College District GO 5.000% 8/1/32 4,200 4,978
Gilroy CA School Facilities Finance Authority
Revenue 5.000% 8/1/33 2,400 2,736
Glendale CA Redevelopment Agency Successor
Agency Tax Allocation Revenue (Central
Glendale Redevelopment Project) 4.000% 12/1/22 (15) 1,555 1,746
Glendale CA Redevelopment Agency Successor
Agency Tax Allocation Revenue (Central
Glendale Redevelopment Project) 4.000% 12/1/23 (15) 2,310 2,614
Glendale CA Redevelopment Agency Successor
Agency Tax Allocation Revenue (Central
Glendale Redevelopment Project) 5.000% 12/1/24 (15) 1,400 1,691
Face Market
Maturity Amount Value•
Coupon Date ($000) ($000)
77

California Intermediate-Term Tax-Exempt Fund
Golden State Tobacco Securitization Corp.
California Revenue 3.000% 6/1/17 2,000 2,000
Golden State Tobacco Securitization Corp.
California Revenue 5.000% 6/1/17 610 610
Golden State Tobacco Securitization Corp.
California Revenue 4.000% 6/1/18 16,500 16,990
Golden State Tobacco Securitization Corp.
California Revenue 5.000% 6/1/19 1,500 1,620
Golden State Tobacco Securitization Corp.
California Revenue 5.000% 6/1/19 5,640 6,066
Golden State Tobacco Securitization Corp.
California Revenue 5.000% 6/1/20 1,750 1,950
Golden State Tobacco Securitization Corp.
California Revenue 5.000% 6/1/20 3,335 3,698
Golden State Tobacco Securitization Corp.
California Revenue 5.000% 6/1/21 1,000 1,146
Golden State Tobacco Securitization Corp.
California Revenue 5.000% 6/1/21 2,750 3,111
Golden State Tobacco Securitization Corp.
California Revenue 4.550% 6/1/22 (4) 470 486
Golden State Tobacco Securitization Corp.
California Revenue 5.000% 6/1/22 3,670 4,235
Golden State Tobacco Securitization Corp.
California Revenue 5.000% 6/1/23 7,500 8,774
Golden State Tobacco Securitization Corp.
California Revenue 5.000% 6/1/24 11,000 13,032
Golden State Tobacco Securitization Corp.
California Revenue 5.000% 6/1/25 8,000 9,565
Golden State Tobacco Securitization Corp.
California Revenue 5.000% 6/1/26 11,500 13,793
Golden State Tobacco Securitization Corp.
California Revenue 0.000% 6/1/27 (2) 6,500 4,908
Golden State Tobacco Securitization Corp.
California Revenue 5.000% 6/1/27 5,000 6,041
Golden State Tobacco Securitization Corp.
California Revenue 4.000% 6/1/31 3,700 3,970
Golden State Tobacco Securitization Corp.
California Revenue 5.000% 6/1/33 7,000 8,097
Golden State Tobacco Securitization Corp.
California Revenue 5.000% 6/1/34 11,000 12,681
Golden State Tobacco Securitization Corp.
California Revenue 4.000% 6/1/35 1,170 1,213
Golden State Tobacco Securitization Corp.
California Revenue 5.000% 6/1/35 3,605 4,1422 Golden State Tobacco Securitization Corp.
California Revenue TOB VRDO 0.910% 6/7/17 LOC 12,205 12,205
Grossmont CA Union High School District GO 5.000% 8/1/22 1,250 1,483
Grossmont CA Union High School District GO 0.000% 2/1/25 (4) 1,400 1,186
Grossmont CA Union High School District GO 0.000% 8/1/26 (4) 2,040 1,574
Grossmont CA Union High School District GO 0.000% 8/1/27 (4) 2,825 2,068
Grossmont CA Union High School District GO 0.000% 8/1/28 (4) 2,905 2,013
Grossmont CA Union High School District GO 0.000% 8/1/28 3,210 2,326
Grossmont CA Union High School District GO 0.000% 8/1/29 6,965 4,819
Grossmont CA Union High School District GO 4.000% 8/1/33 10,000 10,749
Face Market
Maturity Amount Value•
Coupon Date ($000) ($000)
78
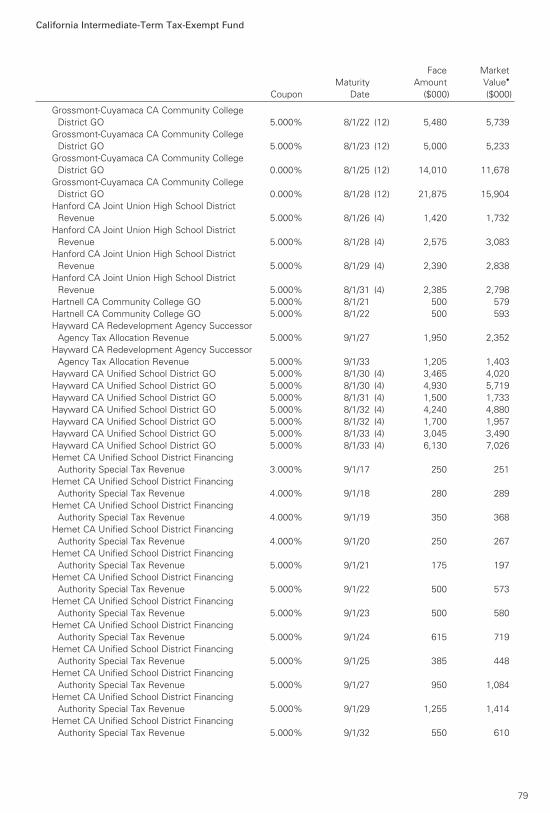
California Intermediate-Term Tax-Exempt Fund
Grossmont-Cuyamaca CA Community College
District GO 5.000% 8/1/22 (12) 5,480 5,739
Grossmont-Cuyamaca CA Community College
District GO 5.000% 8/1/23 (12) 5,000 5,233
Grossmont-Cuyamaca CA Community College
District GO 0.000% 8/1/25 (12) 14,010 11,678
Grossmont-Cuyamaca CA Community College
District GO 0.000% 8/1/28 (12) 21,875 15,904
Hanford CA Joint Union High School District
Revenue 5.000% 8/1/26 (4) 1,420 1,732
Hanford CA Joint Union High School District
Revenue 5.000% 8/1/28 (4) 2,575 3,083
Hanford CA Joint Union High School District
Revenue 5.000% 8/1/29 (4) 2,390 2,838
Hanford CA Joint Union High School District
Revenue 5.000% 8/1/31 (4) 2,385 2,798
Hartnell CA Community College GO 5.000% 8/1/21 500 579
Hartnell CA Community College GO 5.000% 8/1/22 500 593
Hayward CA Redevelopment Agency Successor
Agency Tax Allocation Revenue 5.000% 9/1/27 1,950 2,352
Hayward CA Redevelopment Agency Successor
Agency Tax Allocation Revenue 5.000% 9/1/33 1,205 1,403
Hayward CA Unified School District GO 5.000% 8/1/30 (4) 3,465 4,020
Hayward CA Unified School District GO 5.000% 8/1/30 (4) 4,930 5,719
Hayward CA Unified School District GO 5.000% 8/1/31 (4) 1,500 1,733
Hayward CA Unified School District GO 5.000% 8/1/32 (4) 4,240 4,880
Hayward CA Unified School District GO 5.000% 8/1/32 (4) 1,700 1,957
Hayward CA Unified School District GO 5.000% 8/1/33 (4) 3,045 3,490
Hayward CA Unified School District GO 5.000% 8/1/33 (4) 6,130 7,026
Hemet CA Unified School District Financing
Authority Special Tax Revenue 3.000% 9/1/17 250 251
Hemet CA Unified School District Financing
Authority Special Tax Revenue 4.000% 9/1/18 280 289
Hemet CA Unified School District Financing
Authority Special Tax Revenue 4.000% 9/1/19 350 368
Hemet CA Unified School District Financing
Authority Special Tax Revenue 4.000% 9/1/20 250 267
Hemet CA Unified School District Financing
Authority Special Tax Revenue 5.000% 9/1/21 175 197
Hemet CA Unified School District Financing
Authority Special Tax Revenue 5.000% 9/1/22 500 573
Hemet CA Unified School District Financing
Authority Special Tax Revenue 5.000% 9/1/23 500 580
Hemet CA Unified School District Financing
Authority Special Tax Revenue 5.000% 9/1/24 615 719
Hemet CA Unified School District Financing
Authority Special Tax Revenue 5.000% 9/1/25 385 448
Hemet CA Unified School District Financing
Authority Special Tax Revenue 5.000% 9/1/27 950 1,084
Hemet CA Unified School District Financing
Authority Special Tax Revenue 5.000% 9/1/29 1,255 1,414
Hemet CA Unified School District Financing
Authority Special Tax Revenue 5.000% 9/1/32 550 610
Face Market
Maturity Amount Value•
Coupon Date ($000) ($000)
79
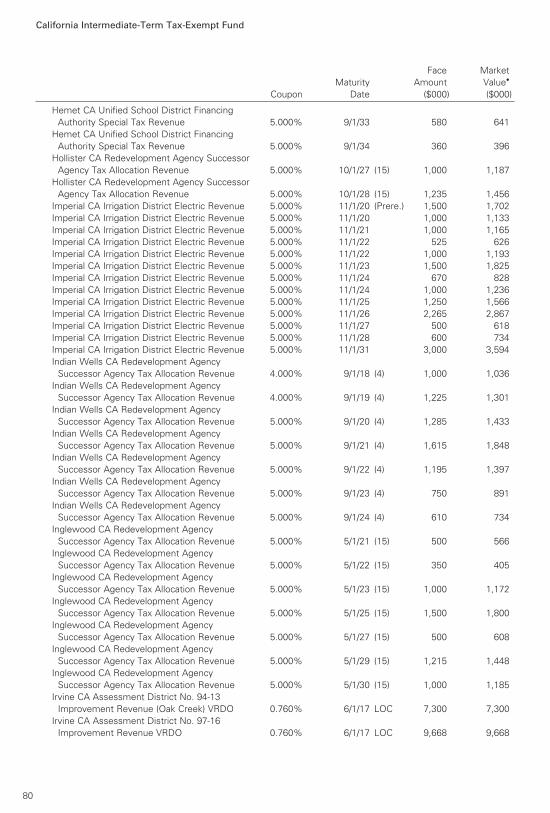
California Intermediate-Term Tax-Exempt Fund
Hemet CA Unified School District Financing
Authority Special Tax Revenue 5.000% 9/1/33 580 641
Hemet CA Unified School District Financing
Authority Special Tax Revenue 5.000% 9/1/34 360 396
Hollister CA Redevelopment Agency Successor
Agency Tax Allocation Revenue 5.000% 10/1/27 (15) 1,000 1,187
Hollister CA Redevelopment Agency Successor
Agency Tax Allocation Revenue 5.000% 10/1/28 (15) 1,235 1,456
Imperial CA Irrigation District Electric Revenue 5.000% 11/1/20 (Prere.) 1,500 1,702
Imperial CA Irrigation District Electric Revenue 5.000% 11/1/20 1,000 1,133
Imperial CA Irrigation District Electric Revenue 5.000% 11/1/21 1,000 1,165
Imperial CA Irrigation District Electric Revenue 5.000% 11/1/22 525 626
Imperial CA Irrigation District Electric Revenue 5.000% 11/1/22 1,000 1,193
Imperial CA Irrigation District Electric Revenue 5.000% 11/1/23 1,500 1,825
Imperial CA Irrigation District Electric Revenue 5.000% 11/1/24 670 828
Imperial CA Irrigation District Electric Revenue 5.000% 11/1/24 1,000 1,236
Imperial CA Irrigation District Electric Revenue 5.000% 11/1/25 1,250 1,566
Imperial CA Irrigation District Electric Revenue 5.000% 11/1/26 2,265 2,867
Imperial CA Irrigation District Electric Revenue 5.000% 11/1/27 500 618
Imperial CA Irrigation District Electric Revenue 5.000% 11/1/28 600 734
Imperial CA Irrigation District Electric Revenue 5.000% 11/1/31 3,000 3,594
Indian Wells CA Redevelopment Agency
Successor Agency Tax Allocation Revenue 4.000% 9/1/18 (4) 1,000 1,036
Indian Wells CA Redevelopment Agency
Successor Agency Tax Allocation Revenue 4.000% 9/1/19 (4) 1,225 1,301
Indian Wells CA Redevelopment Agency
Successor Agency Tax Allocation Revenue 5.000% 9/1/20 (4) 1,285 1,433
Indian Wells CA Redevelopment Agency
Successor Agency Tax Allocation Revenue 5.000% 9/1/21 (4) 1,615 1,848
Indian Wells CA Redevelopment Agency
Successor Agency Tax Allocation Revenue 5.000% 9/1/22 (4) 1,195 1,397
Indian Wells CA Redevelopment Agency
Successor Agency Tax Allocation Revenue 5.000% 9/1/23 (4) 750 891
Indian Wells CA Redevelopment Agency
Successor Agency Tax Allocation Revenue 5.000% 9/1/24 (4) 610 734
Inglewood CA Redevelopment Agency
Successor Agency Tax Allocation Revenue 5.000% 5/1/21 (15) 500 566
Inglewood CA Redevelopment Agency
Successor Agency Tax Allocation Revenue 5.000% 5/1/22 (15) 350 405
Inglewood CA Redevelopment Agency
Successor Agency Tax Allocation Revenue 5.000% 5/1/23 (15) 1,000 1,172
Inglewood CA Redevelopment Agency
Successor Agency Tax Allocation Revenue 5.000% 5/1/25 (15) 1,500 1,800
Inglewood CA Redevelopment Agency
Successor Agency Tax Allocation Revenue 5.000% 5/1/27 (15) 500 608
Inglewood CA Redevelopment Agency
Successor Agency Tax Allocation Revenue 5.000% 5/1/29 (15) 1,215 1,448
Inglewood CA Redevelopment Agency
Successor Agency Tax Allocation Revenue 5.000% 5/1/30 (15) 1,000 1,185
Irvine CA Assessment District No. 94-13
Improvement Revenue (Oak Creek) VRDO 0.760% 6/1/17 LOC 7,300 7,300
Irvine CA Assessment District No. 97-16
Improvement Revenue VRDO 0.760% 6/1/17 LOC 9,668 9,668
Face Market
Maturity Amount Value•
Coupon Date ($000) ($000)
80

California Intermediate-Term Tax-Exempt Fund
Irvine CA Assessment District No. 97-17
Improvement Revenue VRDO 0.760% 6/1/17 LOC 4,200 4,200
Irvine CA Reassessment District No. 12-1
Improvement Revenue 4.000% 9/2/18 1,350 1,398
Irvine CA Reassessment District No. 12-1
Improvement Revenue 4.000% 9/2/19 2,000 2,121
Irvine CA Reassessment District No. 12-1
Improvement Revenue 4.000% 9/2/20 2,425 2,616
Irvine CA Reassessment District No. 12-1
Improvement Revenue 4.000% 9/2/21 1,750 1,920
Irvine CA Reassessment District No. 12-1
Improvement Revenue 5.000% 9/2/23 400 463
Irvine CA Reassessment District No. 13-1
Improvement Revenue 5.000% 9/2/20 350 386
Irvine CA Reassessment District No. 13-1
Improvement Revenue 5.000% 9/2/22 1,125 1,290
Irvine CA Reassessment District No. 15-1
Improvement Revenue 5.000% 9/2/22 1,000 1,169
Irvine CA Reassessment District No. 15-2
Improvement Revenue 3.000% 9/2/17 400 402
Irvine CA Reassessment District No. 15-2
Improvement Revenue 4.000% 9/2/18 500 516
Irvine CA Reassessment District No. 15-2
Improvement Revenue 4.000% 9/2/20 750 803
Irvine CA Reassessment District No. 15-2
Improvement Revenue 5.000% 9/2/21 675 761
Irvine CA Reassessment District No. 15-2
Improvement Revenue 5.000% 9/2/22 650 745
Irvine CA Reassessment District No. 15-2
Improvement Revenue 5.000% 9/2/23 800 930
Irvine CA Reassessment District No. 15-2
Improvement Revenue 5.000% 9/2/24 850 996
Irvine CA Reassessment District No. 15-2
Improvement Revenue 5.000% 9/2/25 450 529
Irvine CA Reassessment District No. 15-2
Improvement Revenue 5.000% 9/2/26 800 931
Irvine CA Reassessment District No. 85-7A
Improvement Revenue VRDO 0.760% 6/1/17 LOC 1,800 1,800
Irvine Ranch CA Water District COP 5.000% 3/1/32 3,630 4,415
Irvine Ranch CA Water District COP 5.000% 3/1/33 2,790 3,376
Irvine Ranch CA Water District COP 5.000% 3/1/34 1,300 1,566
Irvine Ranch CA Water District COP 5.000% 3/1/35 1,540 1,848
Irvine Ranch CA Water District COP 5.000% 3/1/36 1,000 1,196
Irvine Ranch CA Water District Revenue 5.000% 2/1/33 1,000 1,205
Irvine Ranch CA Water District Revenue 5.000% 2/1/34 2,000 2,398
Irvine Ranch CA Water District Revenue 5.000% 2/1/35 2,500 2,986
Irvine Ranch CA Water District Revenue 5.000% 2/1/36 2,665 3,174
Jefferson CA Union High School District GO 4.000% 8/1/18 (15) 750 777
Jefferson CA Union High School District GO 5.000% 8/1/19 (15) 625 678
Jefferson CA Union High School District GO 5.000% 8/1/20 (15) 500 560
Jefferson CA Union High School District GO 5.000% 8/1/21 (15) 500 575
Jefferson CA Union High School District GO 5.000% 8/1/22 (15) 700 824
Jefferson CA Union High School District GO 5.000% 8/1/23 (15) 1,000 1,200
Jefferson CA Union High School District GO 5.000% 8/1/24 (15) 875 1,068
Face Market
Maturity Amount Value•
Coupon Date ($000) ($000)
81
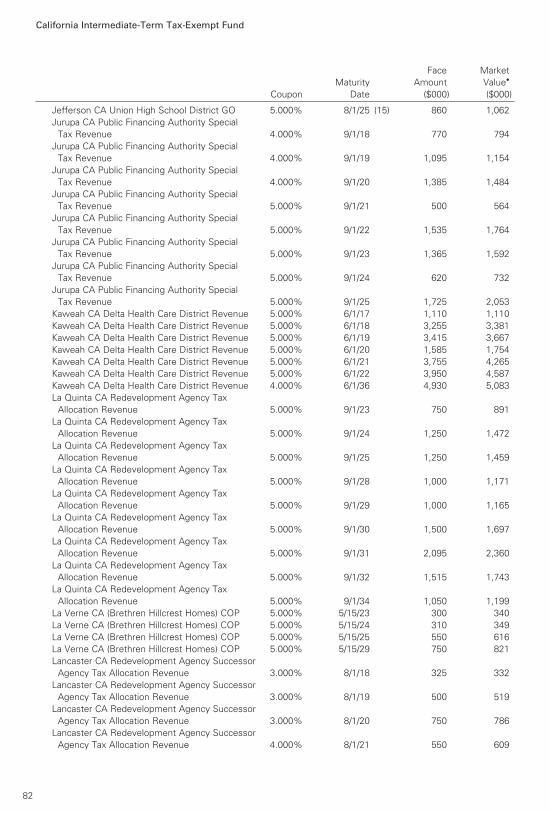
California Intermediate-Term Tax-Exempt Fund
Jefferson CA Union High School District GO 5.000% 8/1/25 (15) 860 1,062
Jurupa CA Public Financing Authority Special
Tax Revenue 4.000% 9/1/18 770 794
Jurupa CA Public Financing Authority Special
Tax Revenue 4.000% 9/1/19 1,095 1,154
Jurupa CA Public Financing Authority Special
Tax Revenue 4.000% 9/1/20 1,385 1,484
Jurupa CA Public Financing Authority Special
Tax Revenue 5.000% 9/1/21 500 564
Jurupa CA Public Financing Authority Special
Tax Revenue 5.000% 9/1/22 1,535 1,764
Jurupa CA Public Financing Authority Special
Tax Revenue 5.000% 9/1/23 1,365 1,592
Jurupa CA Public Financing Authority Special
Tax Revenue 5.000% 9/1/24 620 732
Jurupa CA Public Financing Authority Special
Tax Revenue 5.000% 9/1/25 1,725 2,053
Kaweah CA Delta Health Care District Revenue 5.000% 6/1/17 1,110 1,110
Kaweah CA Delta Health Care District Revenue 5.000% 6/1/18 3,255 3,381
Kaweah CA Delta Health Care District Revenue 5.000% 6/1/19 3,415 3,667
Kaweah CA Delta Health Care District Revenue 5.000% 6/1/20 1,585 1,754
Kaweah CA Delta Health Care District Revenue 5.000% 6/1/21 3,755 4,265
Kaweah CA Delta Health Care District Revenue 5.000% 6/1/22 3,950 4,587
Kaweah CA Delta Health Care District Revenue 4.000% 6/1/36 4,930 5,083
La Quinta CA Redevelopment Agency Tax
Allocation Revenue 5.000% 9/1/23 750 891
La Quinta CA Redevelopment Agency Tax
Allocation Revenue 5.000% 9/1/24 1,250 1,472
La Quinta CA Redevelopment Agency Tax
Allocation Revenue 5.000% 9/1/25 1,250 1,459
La Quinta CA Redevelopment Agency Tax
Allocation Revenue 5.000% 9/1/28 1,000 1,171
La Quinta CA Redevelopment Agency Tax
Allocation Revenue 5.000% 9/1/29 1,000 1,165
La Quinta CA Redevelopment Agency Tax
Allocation Revenue 5.000% 9/1/30 1,500 1,697
La Quinta CA Redevelopment Agency Tax
Allocation Revenue 5.000% 9/1/31 2,095 2,360
La Quinta CA Redevelopment Agency Tax
Allocation Revenue 5.000% 9/1/32 1,515 1,743
La Quinta CA Redevelopment Agency Tax
Allocation Revenue 5.000% 9/1/34 1,050 1,199
La Verne CA (Brethren Hillcrest Homes) COP 5.000% 5/15/23 300 340
La Verne CA (Brethren Hillcrest Homes) COP 5.000% 5/15/24 310 349
La Verne CA (Brethren Hillcrest Homes) COP 5.000% 5/15/25 550 616
La Verne CA (Brethren Hillcrest Homes) COP 5.000% 5/15/29 750 821
Lancaster CA Redevelopment Agency Successor
Agency Tax Allocation Revenue 3.000% 8/1/18 325 332
Lancaster CA Redevelopment Agency Successor
Agency Tax Allocation Revenue 3.000% 8/1/19 500 519
Lancaster CA Redevelopment Agency Successor
Agency Tax Allocation Revenue 3.000% 8/1/20 750 786
Lancaster CA Redevelopment Agency Successor
Agency Tax Allocation Revenue 4.000% 8/1/21 550 609
Face Market
Maturity Amount Value•
Coupon Date ($000) ($000)
82
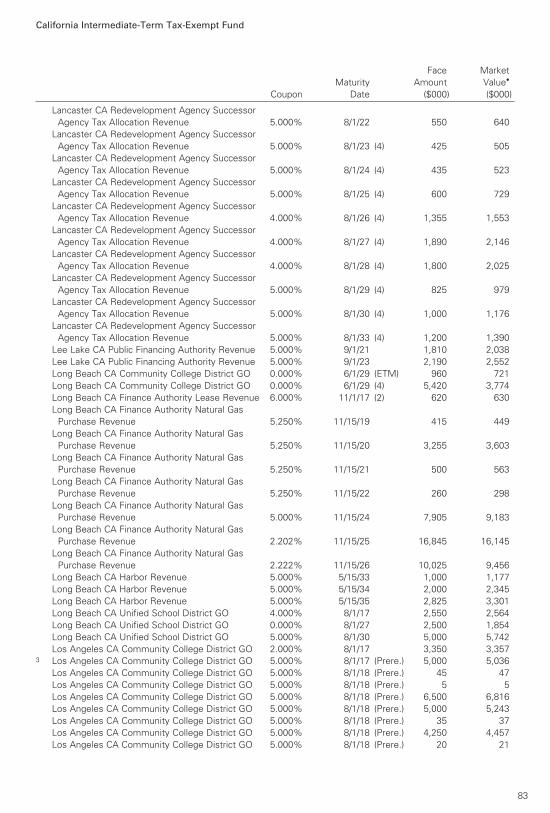
California Intermediate-Term Tax-Exempt Fund
Lancaster CA Redevelopment Agency Successor
Agency Tax Allocation Revenue 5.000% 8/1/22 550 640
Lancaster CA Redevelopment Agency Successor
Agency Tax Allocation Revenue 5.000% 8/1/23 (4) 425 505
Lancaster CA Redevelopment Agency Successor
Agency Tax Allocation Revenue 5.000% 8/1/24 (4) 435 523
Lancaster CA Redevelopment Agency Successor
Agency Tax Allocation Revenue 5.000% 8/1/25 (4) 600 729
Lancaster CA Redevelopment Agency Successor
Agency Tax Allocation Revenue 4.000% 8/1/26 (4) 1,355 1,553
Lancaster CA Redevelopment Agency Successor
Agency Tax Allocation Revenue 4.000% 8/1/27 (4) 1,890 2,146
Lancaster CA Redevelopment Agency Successor
Agency Tax Allocation Revenue 4.000% 8/1/28 (4) 1,800 2,025
Lancaster CA Redevelopment Agency Successor
Agency Tax Allocation Revenue 5.000% 8/1/29 (4) 825 979
Lancaster CA Redevelopment Agency Successor
Agency Tax Allocation Revenue 5.000% 8/1/30 (4) 1,000 1,176
Lancaster CA Redevelopment Agency Successor
Agency Tax Allocation Revenue 5.000% 8/1/33 (4) 1,200 1,390
Lee Lake CA Public Financing Authority Revenue 5.000% 9/1/21 1,810 2,038
Lee Lake CA Public Financing Authority Revenue 5.000% 9/1/23 2,190 2,552
Long Beach CA Community College District GO 0.000% 6/1/29 (ETM) 960 721
Long Beach CA Community College District GO 0.000% 6/1/29 (4) 5,420 3,774
Long Beach CA Finance Authority Lease Revenue 6.000% 11/1/17 (2) 620 630
Long Beach CA Finance Authority Natural Gas
Purchase Revenue 5.250% 11/15/19 415 449
Long Beach CA Finance Authority Natural Gas
Purchase Revenue 5.250% 11/15/20 3,255 3,603
Long Beach CA Finance Authority Natural Gas
Purchase Revenue 5.250% 11/15/21 500 563
Long Beach CA Finance Authority Natural Gas
Purchase Revenue 5.250% 11/15/22 260 298
Long Beach CA Finance Authority Natural Gas
Purchase Revenue 5.000% 11/15/24 7,905 9,183
Long Beach CA Finance Authority Natural Gas
Purchase Revenue 2.202% 11/15/25 16,845 16,145
Long Beach CA Finance Authority Natural Gas
Purchase Revenue 2.222% 11/15/26 10,025 9,456
Long Beach CA Harbor Revenue 5.000% 5/15/33 1,000 1,177
Long Beach CA Harbor Revenue 5.000% 5/15/34 2,000 2,345
Long Beach CA Harbor Revenue 5.000% 5/15/35 2,825 3,301
Long Beach CA Unified School District GO 4.000% 8/1/17 2,550 2,564
Long Beach CA Unified School District GO 0.000% 8/1/27 2,500 1,854
Long Beach CA Unified School District GO 5.000% 8/1/30 5,000 5,742
Los Angeles CA Community College District GO 2.000% 8/1/17 3,350 3,3573 Los Angeles CA Community College District GO 5.000% 8/1/17 (Prere.) 5,000 5,036
Los Angeles CA Community College District GO 5.000% 8/1/18 (Prere.) 45 47
Los Angeles CA Community College District GO 5.000% 8/1/18 (Prere.) 5 5
Los Angeles CA Community College District GO 5.000% 8/1/18 (Prere.) 6,500 6,816
Los Angeles CA Community College District GO 5.000% 8/1/18 (Prere.) 5,000 5,243
Los Angeles CA Community College District GO 5.000% 8/1/18 (Prere.) 35 37
Los Angeles CA Community College District GO 5.000% 8/1/18 (Prere.) 4,250 4,457
Los Angeles CA Community College District GO 5.000% 8/1/18 (Prere.) 20 21
Face Market
Maturity Amount Value•
Coupon Date ($000) ($000)
83

California Intermediate-Term Tax-Exempt Fund
Los Angeles CA Community College District GO 3.000% 8/1/19 3,200 3,348
Los Angeles CA Community College District GO 5.000% 8/1/19 (Prere.) 6,960 7,571
Los Angeles CA Community College District GO 5.500% 8/1/19 (Prere.) 5,000 5,493
Los Angeles CA Community College District GO 4.000% 8/1/20 1,000 1,095
Los Angeles CA Community College District GO 4.000% 8/1/21 555 621
Los Angeles CA Community College District GO 5.000% 8/1/22 3,000 3,567
Los Angeles CA Community College District GO 5.000% 8/1/24 12,420 15,361
Los Angeles CA Community College District GO 5.000% 8/1/24 4,735 5,856
Los Angeles CA Community College District GO 5.000% 8/1/25 10,925 13,710
Los Angeles CA Community College District GO 5.000% 8/1/27 7,535 9,151
Los Angeles CA Community College District GO 5.000% 8/1/28 24,745 29,904
Los Angeles CA Community College District GO 5.000% 8/1/29 1,390 1,673
Los Angeles CA Community College District GO 4.000% 8/1/30 4,045 4,461
Los Angeles CA Community College District GO 4.000% 8/1/30 1,000 1,090
Los Angeles CA Community College District GO 5.000% 8/1/30 7,035 8,449
Los Angeles CA Community College District GO 4.000% 8/1/31 4,320 4,723
Los Angeles CA Community College District GO 4.000% 8/1/31 6,145 6,645
Los Angeles CA Community College District GO 5.000% 8/1/31 20,000 23,861
Los Angeles CA Community College District GO 4.000% 8/1/32 5,205 5,668
Los Angeles CA Community College District GO 4.000% 8/1/32 14,500 15,789
Los Angeles CA Community College District GO 4.000% 8/1/33 19,215 20,793
Los Angeles CA Community College District GO 5.000% 8/1/36 8,705 10,3362 Los Angeles CA Community College District GO
TOB VRDO 0.800% 6/7/17 (Prere.) 2,800 2,800
Los Angeles CA Community Facilities District
No.4 Special Tax Revenue (Playa Vista - Phase 1) 5.000% 9/1/23 800 933
Los Angeles CA Community Facilities District
No.4 Special Tax Revenue (Playa Vista - Phase 1) 5.000% 9/1/24 1,000 1,180
Los Angeles CA Community Facilities District
No.4 Special Tax Revenue (Playa Vista - Phase 1) 5.000% 9/1/25 1,500 1,753
Los Angeles CA Community Facilities District
No.4 Special Tax Revenue (Playa Vista - Phase 1) 5.000% 9/1/26 1,200 1,389
Los Angeles CA Community Facilities District
No.4 Special Tax Revenue (Playa Vista - Phase 1) 5.000% 9/1/27 2,000 2,300
Los Angeles CA Department of Airports
International Airport Revenue 5.000% 5/15/18 (Prere.) 4,000 4,162
Los Angeles CA Department of Airports
International Airport Revenue 5.250% 5/15/18 (Prere.) 3,000 3,129
Los Angeles CA Department of Airports
International Airport Revenue 4.500% 5/15/19 1,305 1,398
Los Angeles CA Department of Airports
International Airport Revenue 5.000% 5/15/21 1,145 1,314
Los Angeles CA Department of Airports
International Airport Revenue 5.000% 5/15/22 1,000 1,176
Los Angeles CA Department of Airports
International Airport Revenue 5.000% 5/15/23 950 1,139
Los Angeles CA Department of Airports
International Airport Revenue 5.000% 5/15/23 1,420 1,662
Los Angeles CA Department of Airports
International Airport Revenue 5.000% 5/15/24 1,700 1,980
Los Angeles CA Department of Airports
International Airport Revenue 5.000% 5/15/25 1,300 1,602
Los Angeles CA Department of Airports
International Airport Revenue 5.000% 5/15/25 1,500 1,742
Face Market
Maturity Amount Value•
Coupon Date ($000) ($000)
84

California Intermediate-Term Tax-Exempt Fund
Los Angeles CA Department of Airports
International Airport Revenue 5.000% 5/15/26 1,500 1,843
Los Angeles CA Department of Airports
International Airport Revenue 5.000% 5/15/26 5,500 6,138
Los Angeles CA Department of Airports
International Airport Revenue 5.000% 5/15/27 2,000 2,433
Los Angeles CA Department of Airports
International Airport Revenue 5.000% 5/15/28 2,000 2,416
Los Angeles CA Department of Airports
International Airport Revenue 5.250% 5/15/28 10,000 11,223
Los Angeles CA Department of Airports
International Airport Revenue 5.000% 5/15/29 1,115 1,308
Los Angeles CA Department of Airports
International Airport Revenue 5.000% 5/15/29 4,385 4,858
Los Angeles CA Department of Airports
International Airport Revenue 5.250% 5/15/29 10,000 11,220
Los Angeles CA Department of Airports
International Airport Revenue 5.000% 5/15/30 1,200 1,415
Los Angeles CA Department of Airports
International Airport Revenue 5.000% 5/15/30 1,835 2,019
Los Angeles CA Department of Airports
International Airport Revenue 5.000% 5/15/31 1,190 1,390
Los Angeles CA Department of Airports
International Airport Revenue 5.000% 5/15/32 1,700 1,980
Los Angeles CA Department of Airports
International Airport Revenue 5.000% 5/15/33 1,510 1,752
Los Angeles CA Department of Airports
International Airport Revenue 5.000% 5/15/34 4,135 4,783
Los Angeles CA Department of Airports
International Airport Revenue 5.000% 5/15/34 4,750 5,561
Los Angeles CA Department of Airports
International Airport Revenue 5.000% 5/15/35 2,000 2,338
Los Angeles CA Department of Water & Power
Revenue 5.000% 7/1/17 5,000 5,018
Los Angeles CA Department of Water & Power
Revenue 5.000% 7/1/21 (Prere.) 140 162
Los Angeles CA Department of Water & Power
Revenue 4.000% 7/1/22 1,000 1,141
Los Angeles CA Department of Water & Power
Revenue 5.000% 7/1/22 1,000 1,188
Los Angeles CA Department of Water & Power
Revenue 5.000% 7/1/22 2,500 2,975
Los Angeles CA Department of Water & Power
Revenue 5.000% 7/1/22 9,870 11,360
Los Angeles CA Department of Water & Power
Revenue 5.000% 7/1/23 5,605 6,580
Los Angeles CA Department of Water & Power
Revenue 5.000% 7/1/23 1,335 1,423
Los Angeles CA Department of Water & Power
Revenue 5.000% 7/1/24 2,770 2,954
Los Angeles CA Department of Water & Power
Revenue 5.000% 7/1/24 810 1,003
Los Angeles CA Department of Water & Power
Revenue 5.000% 7/1/24 3,000 3,704
Face Market
Maturity Amount Value•
Coupon Date ($000) ($000)
85

California Intermediate-Term Tax-Exempt Fund
Los Angeles CA Department of Water & Power
Revenue 5.000% 7/1/25 10,000 11,918
Los Angeles CA Department of Water & Power
Revenue 5.000% 7/1/25 510 640
Los Angeles CA Department of Water & Power
Revenue 5.000% 7/1/25 1,375 1,720
Los Angeles CA Department of Water & Power
Revenue 5.000% 7/1/26 1,500 1,754
Los Angeles CA Department of Water & Power
Revenue 5.000% 7/1/26 2,350 2,506
Los Angeles CA Department of Water & Power
Revenue 5.000% 7/1/26 2,000 2,088
Los Angeles CA Department of Water & Power
Revenue 5.000% 7/1/26 750 934
Los Angeles CA Department of Water & Power
Revenue 5.000% 7/1/26 1,670 2,083
Los Angeles CA Department of Water & Power
Revenue 5.000% 7/1/26 6,000 7,483
Los Angeles CA Department of Water & Power
Revenue 5.000% 7/1/27 1,655 1,761
Los Angeles CA Department of Water & Power
Revenue 5.000% 7/1/28 8,000 9,634
Los Angeles CA Department of Water & Power
Revenue 5.000% 7/1/28 2,000 2,126
Los Angeles CA Department of Water & Power
Revenue 5.000% 7/1/29 1,500 1,775
Los Angeles CA Department of Water & Power
Revenue 5.000% 7/1/29 1,670 1,772
Los Angeles CA Department of Water & Power
Revenue 5.000% 7/1/30 2,000 2,381
Los Angeles CA Department of Water & Power
Revenue 5.000% 7/1/30 10,000 11,778
Los Angeles CA Department of Water & Power
Revenue 5.000% 7/1/30 500 604
Los Angeles CA Department of Water & Power
Revenue 5.000% 7/1/31 2,500 2,960
Los Angeles CA Department of Water & Power
Revenue 5.000% 7/1/31 4,690 5,564
Los Angeles CA Department of Water & Power
Revenue 5.000% 7/1/31 15,000 17,754
Los Angeles CA Department of Water & Power
Revenue 5.000% 7/1/31 10,000 12,204
Los Angeles CA Department of Water & Power
Revenue 5.000% 7/1/31 7,000 8,204
Los Angeles CA Department of Water & Power
Revenue 5.000% 7/1/32 7,000 8,245
Los Angeles CA Department of Water & Power
Revenue 5.000% 7/1/32 3,300 3,891
Los Angeles CA Department of Water & Power
Revenue 5.000% 7/1/32 6,080 7,182
Los Angeles CA Department of Water & Power
Revenue 5.000% 7/1/32 7,500 8,833
Los Angeles CA Department of Water & Power
Revenue 5.000% 7/1/32 14,205 16,732
Face Market
Maturity Amount Value•
Coupon Date ($000) ($000)
86

California Intermediate-Term Tax-Exempt Fund
Los Angeles CA Department of Water & Power
Revenue 5.000% 7/1/32 (2) 1,940 1,947
Los Angeles CA Department of Water & Power
Revenue 5.000% 7/1/32 6,730 7,856
Los Angeles CA Department of Water & Power
Revenue 5.000% 7/1/33 5,000 5,861
Los Angeles CA Department of Water & Power
Revenue 5.000% 7/1/33 1,500 1,784
Los Angeles CA Department of Water & Power
Revenue 5.000% 7/1/33 5,525 6,572
Los Angeles CA Department of Water & Power
Revenue 5.000% 7/1/34 2,000 2,340
Los Angeles CA Department of Water & Power
Revenue 5.000% 7/1/34 5,305 6,217
Los Angeles CA Department of Water & Power
Revenue 5.000% 7/1/34 12,005 14,044
Los Angeles CA Department of Water & Power
Revenue 5.000% 7/1/34 7,500 8,760
Los Angeles CA Department of Water & Power
Revenue 5.000% 7/1/34 4,500 5,330
Los Angeles CA Department of Water & Power
Revenue 5.000% 7/1/35 1,500 1,770
Los Angeles CA Department of Water & Power
Revenue 5.000% 7/1/35 2,250 2,655
Los Angeles CA Department of Water & Power
Revenue 5.000% 7/1/36 4,000 4,780
Los Angeles CA Department of Water & Power
Revenue 5.000% 7/1/36 1,050 1,236
Los Angeles CA Department of Water & Power
Revenue 5.000% 7/1/37 5,000 5,951
Los Angeles CA Department of Water & Power
Revenue VRDO 0.660% 6/1/17 7,300 7,300
Los Angeles CA Department of Water & Power
Revenue VRDO 0.780% 6/1/17 9,300 9,300
Los Angeles CA GO 5.000% 9/1/21 (Prere.) 5,850 6,815
Los Angeles CA GO 5.000% 9/1/21 (Prere.) 5,850 6,815
Los Angeles CA GO 5.000% 9/1/22 10,010 11,658
Los Angeles CA Harbor Department Revenue 5.000% 8/1/20 500 563
Los Angeles CA Harbor Department Revenue 5.000% 8/1/21 750 870
Los Angeles CA Harbor Department Revenue 5.000% 8/1/25 3,795 4,373
Los Angeles CA Harbor Department Revenue 5.000% 8/1/30 4,000 4,878
Los Angeles CA Harbor Department Revenue 5.000% 8/1/31 2,400 2,908
Los Angeles CA Harbor Department Revenue 5.000% 8/1/32 4,300 5,183
Los Angeles CA Harbor Department Revenue 5.000% 8/1/33 2,560 2,979
Los Angeles CA Harbor Department Revenue 5.000% 8/1/33 3,500 4,197
Los Angeles CA Harbor Department Revenue 4.000% 8/1/34 3,000 3,226
Los Angeles CA Harbor Department Revenue 4.000% 8/1/35 2,660 2,847
Los Angeles CA Harbor Department Revenue 5.000% 8/1/35 1,925 2,225
Los Angeles CA Harbor Department Revenue 4.000% 8/1/36 2,500 2,664
Los Angeles CA Harbor Department Revenue 5.000% 8/1/36 1,985 2,289
Los Angeles CA Municipal Improvement Corp.
Lease Revenue 5.000% 11/1/24 6,275 7,683
Los Angeles CA Municipal Improvement Corp.
Lease Revenue 5.000% 11/1/25 5,000 6,189
Face Market
Maturity Amount Value•
Coupon Date ($000) ($000)
87

California Intermediate-Term Tax-Exempt Fund
Los Angeles CA Municipal Improvement Corp.
Lease Revenue 5.000% 11/1/25 8,000 9,903
Los Angeles CA Municipal Improvement Corp.
Lease Revenue 5.000% 11/1/26 3,000 3,745
Los Angeles CA Municipal Improvement Corp.
Lease Revenue 5.000% 11/1/27 4,000 4,938
Los Angeles CA Municipal Improvement Corp.
Lease Revenue 5.000% 11/1/29 9,805 11,888
Los Angeles CA Municipal Improvement Corp.
Lease Revenue 4.000% 11/1/33 10,400 11,142
Los Angeles CA Municipal Improvement Corp.
Lease Revenue 4.000% 11/1/34 5,780 6,153
Los Angeles CA Municipal Improvement Corp.
Lease Revenue 4.000% 11/1/35 15,880 16,866
Los Angeles CA Municipal Improvement Corp.
Lease Revenue 4.000% 11/1/36 4,825 5,100
Los Angeles CA Unified School District GO 5.000% 7/1/17 (4) 1,000 1,004
Los Angeles CA Unified School District GO 5.000% 7/1/17 (4) 3,515 3,527
Los Angeles CA Unified School District GO 5.500% 7/1/17 (3) 2,900 2,912
Los Angeles CA Unified School District GO 5.000% 7/1/19 4,860 5,272
Los Angeles CA Unified School District GO 5.000% 7/1/19 12,690 13,767
Los Angeles CA Unified School District GO 5.000% 7/1/19 8,740 9,482
Los Angeles CA Unified School District GO 5.000% 7/1/19 53,000 57,498
Los Angeles CA Unified School District GO 3.000% 7/1/20 16,030 17,011
Los Angeles CA Unified School District GO 3.000% 7/1/20 13,000 13,796
Los Angeles CA Unified School District GO 5.000% 7/1/20 15,000 16,827
Los Angeles CA Unified School District GO 5.000% 7/1/20 28,975 32,504
Los Angeles CA Unified School District GO 4.000% 7/1/21 10,000 11,155
Los Angeles CA Unified School District GO 5.000% 7/1/21 12,500 14,441
Los Angeles CA Unified School District GO 5.000% 7/1/21 9,945 10,787
Los Angeles CA Unified School District GO 4.000% 7/1/22 18,320 20,789
Los Angeles CA Unified School District GO 5.000% 7/1/23 3,465 4,191
Los Angeles CA Unified School District GO 5.000% 7/1/23 5,000 6,048
Los Angeles CA Unified School District GO 5.000% 7/1/24 10,900 13,405
Los Angeles CA Unified School District GO 5.000% 7/1/24 4,000 4,611
Los Angeles CA Unified School District GO 5.000% 7/1/24 13,035 16,031
Los Angeles CA Unified School District GO 5.000% 7/1/25 17,000 21,206
Los Angeles CA Unified School District GO 5.000% 7/1/25 6,010 6,923
Los Angeles CA Unified School District GO 5.000% 7/1/25 1,300 1,594
Los Angeles CA Unified School District GO 5.250% 7/1/25 1,600 1,742
Los Angeles CA Unified School District GO 5.000% 7/1/26 9,000 11,348
Los Angeles CA Unified School District GO 5.000% 7/1/26 5,710 6,185
Los Angeles CA Unified School District GO 5.000% 7/1/26 2,500 2,875
Los Angeles CA Unified School District GO 5.000% 7/1/27 1,595 1,727
Los Angeles CA Unified School District GO 5.000% 7/1/27 8,375 9,791
Los Angeles CA Unified School District GO 5.000% 1/1/28 8,395 9,792
Los Angeles CA Unified School District GO 5.000% 7/1/28 2,600 2,987
Los Angeles CA Unified School District GO 5.000% 7/1/28 12,000 14,446
Los Angeles CA Unified School District GO 5.250% 7/1/28 5,000 5,635
Los Angeles CA Unified School District GO 5.000% 7/1/29 2,500 2,870
Los Angeles CA Unified School District GO 5.000% 7/1/29 17,510 20,963
Los Angeles CA Unified School District GO 5.000% 7/1/30 3,000 3,434
Los Angeles CA Unified School District GO 5.000% 7/1/30 1,985 2,395
Los Angeles CA Unified School District GO 5.000% 7/1/31 3,000 3,427
Face Market
Maturity Amount Value•
Coupon Date ($000) ($000)
88

California Intermediate-Term Tax-Exempt Fund
Los Angeles CA Unified School District GO 5.000% 7/1/32 2,700 3,077
Los Angeles CA Unified School District GO 5.000% 1/1/34 1,385 1,497
Los Angeles CA Unified School District GO 5.000% 1/1/34 1,580 1,708
Los Angeles CA Wastewater System Revenue 5.000% 6/1/20 1,800 2,017
Los Angeles CA Wastewater System Revenue 5.000% 6/1/21 2,000 2,310
Los Angeles CA Wastewater System Revenue 5.000% 6/1/22 2,750 3,259
Los Angeles CA Wastewater System Revenue 5.000% 6/1/23 1,250 1,515
Los Angeles CA Wastewater System Revenue 5.000% 6/1/26 13,045 15,326
Los Angeles CA Wastewater System Revenue 5.000% 6/1/29 10,000 11,696
Los Angeles CA Wastewater System Revenue 5.000% 6/1/31 5,420 6,322
Los Angeles CA Wastewater System Revenue 5.000% 6/1/32 10,880 12,643
Los Angeles CA Wastewater System Revenue 5.000% 6/1/33 16,925 19,585
Los Angeles CA Wastewater System Revenue 5.000% 6/1/33 1,500 1,787
Los Angeles CA Wastewater System Revenue 5.000% 6/1/34 2,355 2,852
Los Angeles CA Wastewater System Revenue 5.000% 6/1/34 5,000 5,807
Los Angeles CA Wastewater System Revenue 5.000% 6/1/35 2,840 3,426
Los Angeles CA Wastewater System Revenue 5.000% 6/1/35 2,985 3,601
Los Angeles CA Wastewater System Revenue 5.000% 6/1/35 4,500 5,213
Los Angeles CA Wastewater System Revenue 5.000% 6/1/36 3,000 3,607
Los Angeles CA Wastewater System Revenue 5.000% 6/1/36 6,250 7,515
Los Angeles CA Wastewater System Revenue 5.000% 6/1/37 7,000 8,382
Los Angeles CA Wastewater System Revenue 5.000% 6/1/37 3,640 4,359
Los Angeles County CA Metropolitan
Transportation Authority Revenue
(Union Station Gateway Project) 5.000% 7/1/25 1,000 1,251
Los Angeles County CA Metropolitan
Transportation Authority Revenue
(Union Station Gateway Project) 5.000% 7/1/26 2,000 2,467
Los Angeles County CA Metropolitan
Transportation Authority Sales Tax Revenue 5.000% 6/1/19 1,600 1,732
Los Angeles County CA Metropolitan
Transportation Authority Sales Tax Revenue 5.000% 7/1/20 4,000 4,339
Los Angeles County CA Metropolitan
Transportation Authority Sales Tax Revenue 5.000% 7/1/21 3,000 3,474
Los Angeles County CA Metropolitan
Transportation Authority Sales Tax Revenue 5.000% 7/1/22 5,075 6,019
Los Angeles County CA Metropolitan
Transportation Authority Sales Tax Revenue 5.000% 7/1/22 10,035 11,646
Los Angeles County CA Metropolitan
Transportation Authority Sales Tax Revenue 5.000% 7/1/23 10,000 11,592
Los Angeles County CA Metropolitan
Transportation Authority Sales Tax Revenue 5.000% 7/1/24 4,000 4,939
Los Angeles County CA Metropolitan
Transportation Authority Sales Tax Revenue 5.000% 7/1/24 1,255 1,471
Los Angeles County CA Metropolitan
Transportation Authority Sales Tax Revenue 5.000% 7/1/25 6,065 7,589
Los Angeles County CA Metropolitan
Transportation Authority Sales Tax Revenue 5.000% 7/1/33 5,000 6,093
Los Angeles County CA Metropolitan
Transportation Authority Sales Tax Revenue 4.000% 6/1/34 6,500 7,068
Los Angeles County CA Metropolitan
Transportation Authority Sales Tax Revenue 5.000% 7/1/34 5,000 6,063
Los Angeles County CA Metropolitan
Transportation Authority Sales Tax Revenue 5.000% 6/1/35 10,000 11,915
Face Market
Maturity Amount Value•
Coupon Date ($000) ($000)
89
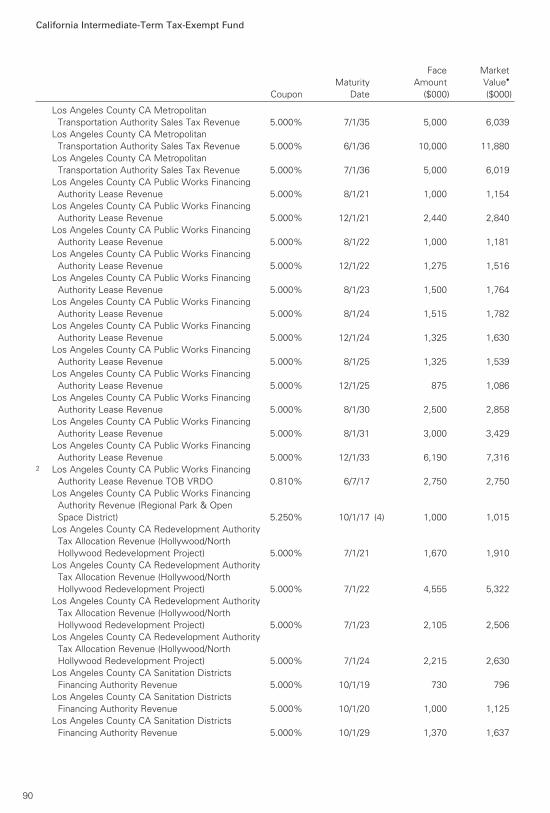
California Intermediate-Term Tax-Exempt Fund
Los Angeles County CA Metropolitan
Transportation Authority Sales Tax Revenue 5.000% 7/1/35 5,000 6,039
Los Angeles County CA Metropolitan
Transportation Authority Sales Tax Revenue 5.000% 6/1/36 10,000 11,880
Los Angeles County CA Metropolitan
Transportation Authority Sales Tax Revenue 5.000% 7/1/36 5,000 6,019
Los Angeles County CA Public Works Financing
Authority Lease Revenue 5.000% 8/1/21 1,000 1,154
Los Angeles County CA Public Works Financing
Authority Lease Revenue 5.000% 12/1/21 2,440 2,840
Los Angeles County CA Public Works Financing
Authority Lease Revenue 5.000% 8/1/22 1,000 1,181
Los Angeles County CA Public Works Financing
Authority Lease Revenue 5.000% 12/1/22 1,275 1,516
Los Angeles County CA Public Works Financing
Authority Lease Revenue 5.000% 8/1/23 1,500 1,764
Los Angeles County CA Public Works Financing
Authority Lease Revenue 5.000% 8/1/24 1,515 1,782
Los Angeles County CA Public Works Financing
Authority Lease Revenue 5.000% 12/1/24 1,325 1,630
Los Angeles County CA Public Works Financing
Authority Lease Revenue 5.000% 8/1/25 1,325 1,539
Los Angeles County CA Public Works Financing
Authority Lease Revenue 5.000% 12/1/25 875 1,086
Los Angeles County CA Public Works Financing
Authority Lease Revenue 5.000% 8/1/30 2,500 2,858
Los Angeles County CA Public Works Financing
Authority Lease Revenue 5.000% 8/1/31 3,000 3,429
Los Angeles County CA Public Works Financing
Authority Lease Revenue 5.000% 12/1/33 6,190 7,3162 Los Angeles County CA Public Works Financing
Authority Lease Revenue TOB VRDO 0.810% 6/7/17 2,750 2,750
Los Angeles County CA Public Works Financing
Authority Revenue (Regional Park & Open
Space District) 5.250% 10/1/17 (4) 1,000 1,015
Los Angeles County CA Redevelopment Authority
Tax Allocation Revenue (Hollywood/North
Hollywood Redevelopment Project) 5.000% 7/1/21 1,670 1,910
Los Angeles County CA Redevelopment Authority
Tax Allocation Revenue (Hollywood/North
Hollywood Redevelopment Project) 5.000% 7/1/22 4,555 5,322
Los Angeles County CA Redevelopment Authority
Tax Allocation Revenue (Hollywood/North
Hollywood Redevelopment Project) 5.000% 7/1/23 2,105 2,506
Los Angeles County CA Redevelopment Authority
Tax Allocation Revenue (Hollywood/North
Hollywood Redevelopment Project) 5.000% 7/1/24 2,215 2,630
Los Angeles County CA Sanitation Districts
Financing Authority Revenue 5.000% 10/1/19 730 796
Los Angeles County CA Sanitation Districts
Financing Authority Revenue 5.000% 10/1/20 1,000 1,125
Los Angeles County CA Sanitation Districts
Financing Authority Revenue 5.000% 10/1/29 1,370 1,637
Face Market
Maturity Amount Value•
Coupon Date ($000) ($000)
90
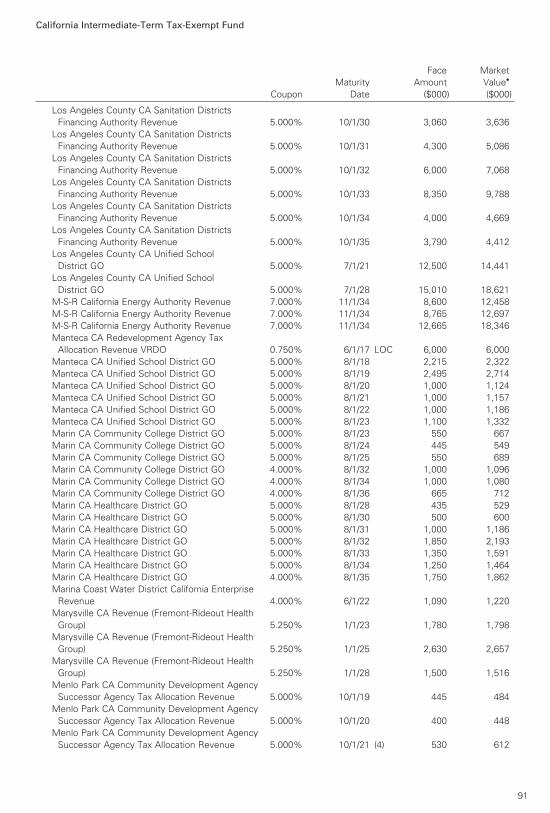
California Intermediate-Term Tax-Exempt Fund
Los Angeles County CA Sanitation Districts
Financing Authority Revenue 5.000% 10/1/30 3,060 3,636
Los Angeles County CA Sanitation Districts
Financing Authority Revenue 5.000% 10/1/31 4,300 5,086
Los Angeles County CA Sanitation Districts
Financing Authority Revenue 5.000% 10/1/32 6,000 7,068
Los Angeles County CA Sanitation Districts
Financing Authority Revenue 5.000% 10/1/33 8,350 9,788
Los Angeles County CA Sanitation Districts
Financing Authority Revenue 5.000% 10/1/34 4,000 4,669
Los Angeles County CA Sanitation Districts
Financing Authority Revenue 5.000% 10/1/35 3,790 4,412
Los Angeles County CA Unified School
District GO 5.000% 7/1/21 12,500 14,441
Los Angeles County CA Unified School
District GO 5.000% 7/1/28 15,010 18,621
M-S-R California Energy Authority Revenue 7.000% 11/1/34 8,600 12,458
M-S-R California Energy Authority Revenue 7.000% 11/1/34 8,765 12,697
M-S-R California Energy Authority Revenue 7.000% 11/1/34 12,665 18,346
Manteca CA Redevelopment Agency Tax
Allocation Revenue VRDO 0.750% 6/1/17 LOC 6,000 6,000
Manteca CA Unified School District GO 5.000% 8/1/18 2,215 2,322
Manteca CA Unified School District GO 5.000% 8/1/19 2,495 2,714
Manteca CA Unified School District GO 5.000% 8/1/20 1,000 1,124
Manteca CA Unified School District GO 5.000% 8/1/21 1,000 1,157
Manteca CA Unified School District GO 5.000% 8/1/22 1,000 1,186
Manteca CA Unified School District GO 5.000% 8/1/23 1,100 1,332
Marin CA Community College District GO 5.000% 8/1/23 550 667
Marin CA Community College District GO 5.000% 8/1/24 445 549
Marin CA Community College District GO 5.000% 8/1/25 550 689
Marin CA Community College District GO 4.000% 8/1/32 1,000 1,096
Marin CA Community College District GO 4.000% 8/1/34 1,000 1,080
Marin CA Community College District GO 4.000% 8/1/36 665 712
Marin CA Healthcare District GO 5.000% 8/1/28 435 529
Marin CA Healthcare District GO 5.000% 8/1/30 500 600
Marin CA Healthcare District GO 5.000% 8/1/31 1,000 1,186
Marin CA Healthcare District GO 5.000% 8/1/32 1,850 2,193
Marin CA Healthcare District GO 5.000% 8/1/33 1,350 1,591
Marin CA Healthcare District GO 5.000% 8/1/34 1,250 1,464
Marin CA Healthcare District GO 4.000% 8/1/35 1,750 1,862
Marina Coast Water District California Enterprise
Revenue 4.000% 6/1/22 1,090 1,220
Marysville CA Revenue (Fremont-Rideout Health
Group) 5.250% 1/1/23 1,780 1,798
Marysville CA Revenue (Fremont-Rideout Health
Group) 5.250% 1/1/25 2,630 2,657
Marysville CA Revenue (Fremont-Rideout Health
Group) 5.250% 1/1/28 1,500 1,516
Menlo Park CA Community Development Agency
Successor Agency Tax Allocation Revenue 5.000% 10/1/19 445 484
Menlo Park CA Community Development Agency
Successor Agency Tax Allocation Revenue 5.000% 10/1/20 400 448
Menlo Park CA Community Development Agency
Successor Agency Tax Allocation Revenue 5.000% 10/1/21 (4) 530 612
Face Market
Maturity Amount Value•
Coupon Date ($000) ($000)
91
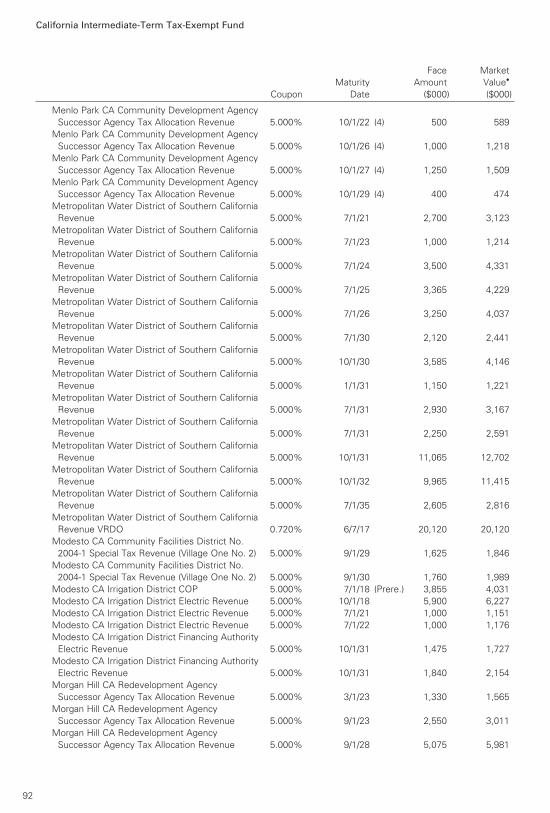
California Intermediate-Term Tax-Exempt Fund
Menlo Park CA Community Development Agency
Successor Agency Tax Allocation Revenue 5.000% 10/1/22 (4) 500 589
Menlo Park CA Community Development Agency
Successor Agency Tax Allocation Revenue 5.000% 10/1/26 (4) 1,000 1,218
Menlo Park CA Community Development Agency
Successor Agency Tax Allocation Revenue 5.000% 10/1/27 (4) 1,250 1,509
Menlo Park CA Community Development Agency
Successor Agency Tax Allocation Revenue 5.000% 10/1/29 (4) 400 474
Metropolitan Water District of Southern California
Revenue 5.000% 7/1/21 2,700 3,123
Metropolitan Water District of Southern California
Revenue 5.000% 7/1/23 1,000 1,214
Metropolitan Water District of Southern California
Revenue 5.000% 7/1/24 3,500 4,331
Metropolitan Water District of Southern California
Revenue 5.000% 7/1/25 3,365 4,229
Metropolitan Water District of Southern California
Revenue 5.000% 7/1/26 3,250 4,037
Metropolitan Water District of Southern California
Revenue 5.000% 7/1/30 2,120 2,441
Metropolitan Water District of Southern California
Revenue 5.000% 10/1/30 3,585 4,146
Metropolitan Water District of Southern California
Revenue 5.000% 1/1/31 1,150 1,221
Metropolitan Water District of Southern California
Revenue 5.000% 7/1/31 2,930 3,167
Metropolitan Water District of Southern California
Revenue 5.000% 7/1/31 2,250 2,591
Metropolitan Water District of Southern California
Revenue 5.000% 10/1/31 11,065 12,702
Metropolitan Water District of Southern California
Revenue 5.000% 10/1/32 9,965 11,415
Metropolitan Water District of Southern California
Revenue 5.000% 7/1/35 2,605 2,816
Metropolitan Water District of Southern California
Revenue VRDO 0.720% 6/7/17 20,120 20,120
Modesto CA Community Facilities District No.
2004-1 Special Tax Revenue (Village One No. 2) 5.000% 9/1/29 1,625 1,846
Modesto CA Community Facilities District No.
2004-1 Special Tax Revenue (Village One No. 2) 5.000% 9/1/30 1,760 1,989
Modesto CA Irrigation District COP 5.000% 7/1/18 (Prere.) 3,855 4,031
Modesto CA Irrigation District Electric Revenue 5.000% 10/1/18 5,900 6,227
Modesto CA Irrigation District Electric Revenue 5.000% 7/1/21 1,000 1,151
Modesto CA Irrigation District Electric Revenue 5.000% 7/1/22 1,000 1,176
Modesto CA Irrigation District Financing Authority
Electric Revenue 5.000% 10/1/31 1,475 1,727
Modesto CA Irrigation District Financing Authority
Electric Revenue 5.000% 10/1/31 1,840 2,154
Morgan Hill CA Redevelopment Agency
Successor Agency Tax Allocation Revenue 5.000% 3/1/23 1,330 1,565
Morgan Hill CA Redevelopment Agency
Successor Agency Tax Allocation Revenue 5.000% 9/1/23 2,550 3,011
Morgan Hill CA Redevelopment Agency
Successor Agency Tax Allocation Revenue 5.000% 9/1/28 5,075 5,981
Face Market
Maturity Amount Value•
Coupon Date ($000) ($000)
92

California Intermediate-Term Tax-Exempt Fund
Morgan Hill CA Redevelopment Agency
Successor Agency Tax Allocation Revenue 5.000% 9/1/29 5,430 6,363
Morgan Hill CA Redevelopment Agency
Successor Agency Tax Allocation Revenue 5.000% 9/1/31 2,990 3,476
Morgan Hill CA Redevelopment Agency
Successor Agency Tax Allocation Revenue 5.000% 9/1/32 4,315 5,000
Morgan Hill CA Redevelopment Agency
Successor Agency Tax Allocation Revenue 5.000% 9/1/33 2,000 2,309
Mount Diablo CA Unified School District GO 5.000% 8/1/17 2,000 2,014
Mount Diablo CA Unified School District GO 5.000% 8/1/18 1,500 1,570
Mount Diablo CA Unified School District GO 5.000% 8/1/19 650 707
Mount Diablo CA Unified School District GO 5.000% 8/1/20 700 787
Mount Diablo CA Unified School District GO 5.000% 8/1/21 765 885
Mount San Antonio CA Community College
District GO 0.000% 8/1/25 2,000 1,674
Mount San Antonio CA Community College
District GO 0.000% 8/1/28 3,000 2,844
Mountain View-Whisman CA School District COP 4.000% 6/1/19 400 423
Mountain View-Whisman CA School District COP 4.000% 6/1/20 500 542
Mountain View-Whisman CA School District COP 5.000% 6/1/21 285 326
Mountain View-Whisman CA School District COP 5.000% 6/1/22 400 469
Mountain View-Whisman CA School District GO 5.000% 9/1/24 400 496
Mountain View-Whisman CA School District GO 5.000% 9/1/25 610 768
Mountain View-Whisman CA School District GO 5.000% 9/1/26 1,050 1,338
Murrieta Valley CA Unified School District GO 2.000% 9/1/17 (4) 500 501
Murrieta Valley CA Unified School District GO 3.000% 9/1/18 (4) 500 513
Murrieta Valley CA Unified School District GO 5.000% 9/1/19 (4) 575 626
Murrieta Valley CA Unified School District GO 5.000% 9/1/20 (4) 775 870
Murrieta Valley CA Unified School District GO 4.000% 9/1/21 (4) 250 278
Murrieta Valley CA Unified School District GO 5.000% 9/1/21 (4) 1,605 1,851
Murrieta Valley CA Unified School District GO 4.000% 9/1/22 (4) 320 360
Murrieta Valley CA Unified School District GO 4.000% 9/1/23 (4) 850 968
Murrieta Valley CA Unified School District GO 5.000% 9/1/23 (4) 1,450 1,742
Murrieta Valley CA Unified School District GO 4.000% 9/1/24 (4) 350 402
Murrieta Valley CA Unified School District GO 5.000% 9/1/25 (4) 700 856
Murrieta Valley CA Unified School District GO 5.000% 9/1/25 (4) 1,400 1,712
Murrieta Valley CA Unified School District GO 5.000% 9/1/26 (4) 520 628
Murrieta Valley CA Unified School District GO 5.000% 9/1/26 (4) 1,625 1,964
Murrieta Valley CA Unified School District GO 5.000% 9/1/27 (4) 465 557
Murrieta Valley CA Unified School District GO 5.000% 9/1/28 (4) 300 356
Newport Beach CA Revenue (Hoag Memorial
Hospital Presbyterian) 5.875% 12/1/21 (Prere.) 5,150 6,164
Newport Mesa CA Unified School District GO 0.000% 8/1/29 4,625 3,270
Newport Mesa CA Unified School District GO 0.000% 8/1/30 3,000 2,027
Newport Mesa CA Unified School District GO 0.000% 8/1/31 1,500 969
Newport Mesa CA Unified School District GO 0.000% 8/1/32 14,000 8,637
Northern California Gas Authority No. 1 Revenue 1.369% 7/1/17 6,620 6,620
Northern California Power Agency Capital
Facilities Revenue 5.000% 8/1/20 1,000 1,102
Northern California Power Agency Revenue
(Hydroelectric Project) 5.000% 7/1/17 3,290 3,302
Northern California Power Agency Revenue
(Hydroelectric Project) 5.000% 7/1/20 3,500 3,788
Face Market
Maturity Amount Value•
Coupon Date ($000) ($000)
93

California Intermediate-Term Tax-Exempt Fund
Northern California Power Agency Revenue
(Hydroelectric Project) 5.000% 7/1/21 2,500 2,701
Northern California Power Agency Revenue
(Hydroelectric Project) 5.000% 7/1/22 3,395 3,666
Northern California Power Agency Revenue
(Hydroelectric Project) 5.000% 7/1/28 5,000 5,784
Northern California Power Agency Revenue
(Hydroelectric Project) 5.000% 7/1/29 3,000 3,456
Northern California Power Agency Revenue
(Hydroelectric Project) 5.000% 7/1/30 1,605 1,827
Northern California Power Agency Revenue
(Hydroelectric Project) 5.000% 7/1/31 1,600 1,822
Northern California Transmission Agency Revenue 5.000% 5/1/20 250 278
Northern California Transmission Agency Revenue 5.000% 5/1/21 245 281
Northern California Transmission Agency Revenue 5.000% 5/1/22 200 235
Northern California Transmission Agency Revenue 5.000% 5/1/23 375 449
Northern California Transmission Agency Revenue 5.000% 5/1/24 500 609
Northern California Transmission Agency Revenue 5.000% 5/1/25 1,895 2,340
Northern California Transmission Agency Revenue 5.000% 5/1/27 1,250 1,539
Northern California Transmission Agency Revenue 5.000% 5/1/28 1,000 1,220
Northern California Transmission Agency Revenue 5.000% 5/1/29 1,500 1,815
Northern California Transmission Agency Revenue 5.000% 5/1/31 1,250 1,493
Northern California Transmission Agency Revenue 5.000% 5/1/32 2,500 2,973
Northern California Transmission Agency Revenue 5.000% 5/1/33 4,245 5,021
Northern California Transmission Agency Revenue 5.000% 5/1/34 3,100 3,651
Northern California Transmission Agency Revenue 5.000% 5/1/36 5,000 5,854
Northern California Transmission Agency Revenue 5.000% 5/1/37 3,500 4,089
Northstar Community Services District California
Community Facilities District No. 1 Special Tax
Revenue 4.000% 9/1/17 1,650 1,662
Northstar Community Services District California
Community Facilities District No. 1 Special Tax
Revenue 4.000% 9/1/18 1,860 1,908
Northstar Community Services District California
Community Facilities District No. 1 Special Tax
Revenue 5.000% 9/1/19 2,085 2,210
Northstar Community Services District California
Community Facilities District No. 1 Special Tax
Revenue 5.000% 9/1/20 2,340 2,530
Northstar Community Services District California
Community Facilities District No. 1 Special Tax
Revenue 5.000% 9/1/21 1,220 1,335
Northstar Community Services District California
Community Facilities District No. 1 Special Tax
Revenue 5.000% 9/1/22 1,360 1,504
Northstar Community Services District California
Community Facilities District No. 1 Special Tax
Revenue 5.000% 9/1/23 1,500 1,672
Northstar Community Services District California
Community Facilities District No. 1 Special Tax
Revenue 5.000% 9/1/24 1,660 1,8492 Nuveen California AMT-Free Quality Municipal
Income Fund VRDP VRDO 0.860% 6/7/17 LOC 31,500 31,500
Oakdale CA Irrigation District Water Revenue 5.000% 8/1/26 240 286
Face Market
Maturity Amount Value•
Coupon Date ($000) ($000)
94

California Intermediate-Term Tax-Exempt Fund
Oakdale CA Irrigation District Water Revenue 5.000% 8/1/27 350 416
Oakdale CA Irrigation District Water Revenue 5.000% 8/1/29 455 537
Oakdale CA Irrigation District Water Revenue 5.000% 8/1/30 415 489
Oakdale CA Irrigation District Water Revenue 5.000% 8/1/33 350 407
Oakdale CA Irrigation District Water Revenue 5.000% 8/1/34 400 463
Oakdale CA Irrigation District Water Revenue 5.000% 8/1/35 300 348
Oakland CA GO 5.000% 1/15/23 5,600 6,705
Oakland CA GO 5.000% 1/15/31 3,000 3,350
Oakland CA Joint Powers Financing Authority
Lease Revenue (Administration Buildings) 5.000% 8/1/23 (12) 5,000 5,219
Oakland CA Joint Powers Financing Authority
Lease Revenue (Administration Buildings) 5.000% 8/1/24 (12) 3,810 3,973
Oakland CA Joint Powers Financing Authority
Lease Revenue (Administration Buildings) 5.000% 8/1/25 (12) 5,405 5,630
Oakland CA Joint Powers Financing Authority
Lease Revenue (Administration Buildings) 5.000% 8/1/26 (12) 4,190 4,359
Oakland CA Redevelopment Agency Tax
Allocation Revenue (Central District Project) 5.000% 9/1/21 3,000 3,433
Oakland CA Unified School District GO 5.000% 8/1/17 2,760 2,780
Oakland CA Unified School District GO 5.000% 8/1/18 6,145 6,444
Oakland CA Unified School District GO 5.000% 8/1/19 6,565 7,143
Oakland CA Unified School District GO 5.000% 8/1/19 (4) 13,425 13,520
Oakland CA Unified School District GO 5.000% 8/1/20 2,500 2,812
Oakland CA Unified School District GO 5.000% 8/1/20 5,000 5,624
Oakland CA Unified School District GO 5.000% 8/1/21 1,600 1,853
Oakland CA Unified School District GO 5.000% 8/1/21 (4) 3,000 3,474
Oakland CA Unified School District GO 6.250% 8/1/21 (Prere.) 2,000 2,418
Oakland CA Unified School District GO 5.000% 8/1/22 1,300 1,543
Oakland CA Unified School District GO 5.000% 8/1/22 (4) 2,325 2,760
Oakland CA Unified School District GO 5.000% 8/1/23 (14) 3,700 3,726
Oakland CA Unified School District GO 5.500% 8/1/23 1,000 1,205
Oakland CA Unified School District GO 5.000% 8/1/24 1,275 1,570
Oakland CA Unified School District GO 5.000% 8/1/25 (4) 2,175 2,711
Oakland CA Unified School District GO 5.000% 8/1/26 1,035 1,278
Oakland CA Unified School District GO 5.000% 8/1/26 (4) 1,270 1,572
Oakland CA Unified School District GO 5.000% 8/1/27 1,295 1,588
Oakland CA Unified School District GO 5.000% 8/1/27 (4) 1,160 1,423
Oakland CA Unified School District GO 5.000% 8/1/28 1,000 1,216
Oakland CA Unified School District GO 5.000% 8/1/28 (4) 1,230 1,496
Oakland CA Unified School District GO 5.000% 8/1/29 1,000 1,208
Oakland CA Unified School District GO 5.000% 8/1/31 2,350 2,798
Oakland CA Unified School District GO 5.000% 8/1/32 1,515 1,796
Oakland CA Unified School District GO 5.000% 8/1/33 1,245 1,468
Oakland CA Unified School District GO 5.000% 8/1/34 2,500 2,929
Ohlone CA Community College District GO 5.000% 8/1/21 (Prere.) 1,770 2,051
Ohlone CA Community College District GO 5.000% 8/1/22 750 890
Ontario CA Public Financing Authority Water
Revenue 5.250% 7/1/27 1,285 1,547
Ontario CA Public Financing Authority Water
Revenue 5.250% 7/1/28 1,765 2,117
Ontario CA Public Financing Authority Water
Revenue 5.250% 7/1/29 2,280 2,726
Ontario CA Public Financing Authority Water
Revenue 5.250% 7/1/30 1,400 1,673
Face Market
Maturity Amount Value•
Coupon Date ($000) ($000)
95

California Intermediate-Term Tax-Exempt Fund
Ontario CA Public Financing Authority Water
Revenue 5.250% 7/1/31 2,525 3,000
Ontario CA Public Financing Authority Water
Revenue 5.250% 7/1/32 2,660 3,153
Ontario CA Public Financing Authority Water
Revenue 5.250% 7/1/33 2,165 2,557
Orange County CA Development Agency Tax
Allocation Revenue (Santa Ana Heights Project) 5.000% 9/1/21 1,200 1,373
Orange County CA Development Agency Tax
Allocation Revenue (Santa Ana Heights Project) 5.000% 3/1/22 1,230 1,418
Orange County CA Development Agency Tax
Allocation Revenue (Santa Ana Heights Project) 5.000% 9/1/22 1,260 1,468
Orange County CA Development Agency Tax
Allocation Revenue (Santa Ana Heights Project) 5.000% 3/1/23 1,290 1,516
Orange County CA Development Agency Tax
Allocation Revenue (Santa Ana Heights Project) 5.000% 9/1/23 1,320 1,565
Orange County CA Sanitation District Wastewater
Revenue 5.000% 2/1/30 9,925 11,954
Orange County CA Transportation Authority Toll
Road Revenue 5.000% 8/15/22 1,000 1,183
Orange County CA Transportation Authority Toll
Road Revenue 5.000% 8/15/27 2,500 2,958
Orange County CA Transportation Authority Toll
Road Revenue 5.000% 8/15/28 2,545 2,997
Orange County CA Water District COP 5.000% 8/15/19 (Prere.) 6,925 7,544
Orange County CA Water District Revenue 5.000% 8/15/33 8,000 9,471
Palm Desert CA Redevelopment Agency Tax
Allocation Revenue 5.000% 10/1/21 (15) 425 487
Palm Desert CA Redevelopment Agency Tax
Allocation Revenue 5.000% 10/1/24 (15) 1,000 1,201
Palm Desert CA Redevelopment Agency Tax
Allocation Revenue 5.000% 10/1/25 (15) 1,000 1,213
Palm Desert CA Redevelopment Agency Tax
Allocation Revenue 5.000% 10/1/26 (15) 1,100 1,343
Palm Springs CA Unified School District GO 5.000% 8/1/22 1,565 1,856
Palm Springs CA Unified School District GO 5.000% 8/1/24 4,270 5,258
Palm Springs CA Unified School District GO 5.000% 8/1/25 4,775 5,959
Palm Springs CA Unified School District GO 5.000% 8/1/26 5,800 7,316
Palm Springs CA Unified School District GO 5.000% 8/1/28 1,000 1,138
Palm Springs CA Unified School District GO 5.000% 8/1/29 1,500 1,698
Palm Springs CA Unified School District GO 5.000% 8/1/30 1,500 1,689
Palm Springs CA Unified School District GO 5.000% 8/1/31 1,500 1,686
Palmdale CA Community Redevelopment
Agency Tax Allocation Revenue 5.000% 9/1/20 450 503
Palmdale CA Community Redevelopment
Agency Tax Allocation Revenue 5.000% 9/1/21 350 402
Palmdale CA Community Redevelopment
Agency Tax Allocation Revenue 5.000% 9/1/22 565 662
Palmdale CA Community Redevelopment
Agency Tax Allocation Revenue 5.000% 9/1/23 400 478
Palmdale CA Community Redevelopment
Agency Tax Allocation Revenue 5.000% 9/1/24 725 878
Palmdale CA Community Redevelopment
Agency Tax Allocation Revenue 5.000% 9/1/25 475 579
Face Market
Maturity Amount Value•
Coupon Date ($000) ($000)
96

California Intermediate-Term Tax-Exempt Fund
Palmdale CA Community Redevelopment
Agency Tax Allocation Revenue 5.000% 9/1/25 525 640
Palmdale CA Community Redevelopment
Agency Tax Allocation Revenue 5.000% 9/1/26 555 685
Palmdale CA Community Redevelopment
Agency Tax Allocation Revenue 5.000% 9/1/26 550 679
Palmdale CA Community Redevelopment
Agency Tax Allocation Revenue 5.000% 9/1/27 430 525
Palmdale CA Community Redevelopment
Agency Tax Allocation Revenue 5.000% 9/1/28 1,355 1,639
Palmdale CA Community Redevelopment
Agency Tax Allocation Revenue 5.000% 9/1/29 1,275 1,529
Palmdale CA Community Redevelopment
Agency Tax Allocation Revenue 5.000% 9/1/31 415 492
Palmdale CA Community Redevelopment
Agency Tax Allocation Revenue 5.000% 9/1/32 1,435 1,693
Palmdale CA Community Redevelopment
Agency Tax Allocation Revenue 5.000% 9/1/33 750 880
Palmdale CA Community Redevelopment
Agency Tax Allocation Revenue 5.000% 9/1/34 500 584
Palmdale CA Community Redevelopment
Agency Tax Allocation Revenue 5.000% 9/1/34 (14) 2,000 2,335
Palo Alto CA Improvement Revenue (University
Avenue Area Parking) 4.000% 9/2/19 1,000 1,052
Palo Alto CA Improvement Revenue (University
Avenue Area Parking) 4.000% 9/2/20 250 267
Palo Alto CA Improvement Revenue (University
Avenue Area Parking) 4.000% 9/2/21 400 433
Palo Alto CA Improvement Revenue (University
Avenue Area Parking) 5.000% 9/2/27 1,000 1,115
Palo Alto CA Unified School District GO 0.000% 8/1/24 15,890 13,817
Palomar CA Community College District GO 5.000% 8/1/29 450 565
Palomar CA Community College District GO 5.000% 8/1/30 520 647
Palomar CA Community College District GO 5.000% 8/1/31 400 493
Palomar CA Community College District GO 5.000% 8/1/32 300 368
Palomar CA Community College District GO 4.000% 8/1/33 2,140 2,307
Palomar CA Community College District GO 5.000% 8/1/33 2,750 3,347
Palomar CA Community College District GO 4.000% 8/1/34 2,390 2,558
Palomar CA Community College District GO 5.000% 8/1/34 4,500 5,446
Palomar CA Community College District GO 5.000% 8/1/35 2,485 2,997
Palomar Pomerado Health California COP 6.625% 11/1/19 (Prere.) 5,000 5,680
Palomar Pomerado Health California GO 0.000% 8/1/22 (14) 7,055 6,392
Palomar Pomerado Health California GO 0.000% 8/1/24 (12) 5,130 4,321
Palomar Pomerado Health California GO 0.000% 8/1/27 (12) 3,095 2,253
Palomar Pomerado Health California GO 0.000% 8/1/27 (14) 16,165 11,769
Palomar Pomerado Health California GO 5.000% 8/1/28 1,490 1,804
Palomar Pomerado Health California GO 5.000% 8/1/28 7,370 8,921
Palomar Pomerado Health California GO 5.000% 8/1/29 795 951
Palomar Pomerado Health California GO 5.000% 8/1/29 4,000 4,785
Palomar Pomerado Health California GO 5.000% 8/1/30 1,130 1,338
Palomar Pomerado Health California GO 5.000% 8/1/31 775 910
Palomar Pomerado Health California GO 4.000% 8/1/32 4,000 4,295
Palomar Pomerado Health California GO 5.000% 8/1/33 1,200 1,396
Palomar Pomerado Health California Revenue 4.000% 11/1/18 810 834
Face Market
Maturity Amount Value•
Coupon Date ($000) ($000)
97

California Intermediate-Term Tax-Exempt Fund
Palomar Pomerado Health California Revenue 4.000% 11/1/19 1,250 1,309
Palomar Pomerado Health California Revenue 5.000% 11/1/20 1,125 1,232
Palomar Pomerado Health California Revenue 5.000% 11/1/21 1,375 1,531
Palomar Pomerado Health California Revenue 5.000% 11/1/23 2,410 2,753
Palomar Pomerado Health California Revenue 5.000% 11/1/24 2,390 2,755
Palomar Pomerado Health California Revenue 5.000% 11/1/25 2,250 2,605
Palomar Pomerado Health California Revenue 5.000% 11/1/26 1,875 2,177
Paramount CA Redevelopment Agency Successor
Agency Tax Allocation Revenue (Redevelopment
Project Area No. 1) 4.000% 8/1/17 880 884
Paramount CA Redevelopment Agency Successor
Agency Tax Allocation Revenue (Redevelopment
Project Area No. 1) 5.000% 8/1/18 925 967
Paramount CA Redevelopment Agency Successor
Agency Tax Allocation Revenue (Redevelopment
Project Area No. 1) 5.000% 8/1/19 1,415 1,529
Paramount CA Redevelopment Agency Successor
Agency Tax Allocation Revenue (Redevelopment
Project Area No. 1) 5.000% 8/1/20 (4) 1,505 1,682
Paramount CA Redevelopment Agency Successor
Agency Tax Allocation Revenue (Redevelopment
Project Area No. 1) 5.000% 8/1/21 (4) 1,455 1,673
Paramount CA Redevelopment Agency Successor
Agency Tax Allocation Revenue (Redevelopment
Project Area No. 1) 5.000% 8/1/22 (4) 2,965 3,479
Paramount CA Redevelopment Agency Successor
Agency Tax Allocation Revenue (Redevelopment
Project Area No. 1) 5.000% 8/1/23 (4) 2,485 2,972
Paramount CA Redevelopment Agency Successor
Agency Tax Allocation Revenue (Redevelopment
Project Area No. 1) 0.000% 8/1/26 (14) 6,050 4,432
Pasadena CA COP VRDO 0.760% 6/7/17 LOC 7,060 7,060
Pasadena CA Unified School District GO 5.000% 8/1/23 835 1,011
Pasadena CA Unified School District GO 5.000% 8/1/24 1,000 1,231
Pasadena CA Unified School District GO 5.000% 8/1/25 750 936
Pasadena CA Unified School District GO 5.000% 8/1/25 1,000 1,248
Pasadena CA Unified School District GO 5.000% 8/1/26 500 631
Pasadena CA Unified School District GO 5.000% 8/1/26 1,000 1,261
Pasadena CA Unified School District GO 5.000% 5/1/30 3,695 4,243
Pasadena CA Unified School District GO 5.000% 5/1/31 1,500 1,717
Pasadena CA Unified School District GO 5.000% 5/1/32 2,000 2,284
Peralta CA Community College District Revenue 5.000% 8/1/23 1,000 1,211
Peralta CA Community College District Revenue 5.000% 8/1/24 1,325 1,632
Peralta CA Community College District Revenue 5.000% 8/1/25 250 312
Peralta CA Community College District Revenue 4.000% 8/1/26 1,375 1,584
Peralta CA Community College District Revenue 5.000% 8/1/27 815 1,000
Peralta CA Community College District Revenue 5.000% 8/1/28 2,455 2,989
Peralta CA Community College District Revenue 5.000% 8/1/29 2,985 3,610
Peralta CA Community College District Revenue 5.000% 8/1/30 2,260 2,716
Peralta CA Community College District Revenue 5.000% 8/1/31 1,490 1,776
Peralta CA Community College District Revenue 5.000% 8/1/32 2,340 2,773
Peralta CA Community College District Revenue 5.000% 8/1/34 2,925 3,427
Face Market
Maturity Amount Value•
Coupon Date ($000) ($000)
98
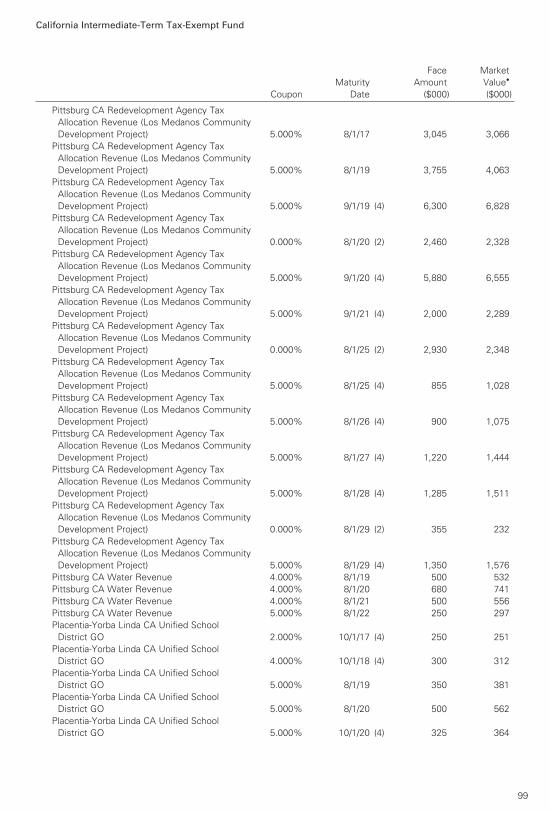
California Intermediate-Term Tax-Exempt Fund
Pittsburg CA Redevelopment Agency Tax
Allocation Revenue (Los Medanos Community
Development Project) 5.000% 8/1/17 3,045 3,066
Pittsburg CA Redevelopment Agency Tax
Allocation Revenue (Los Medanos Community
Development Project) 5.000% 8/1/19 3,755 4,063
Pittsburg CA Redevelopment Agency Tax
Allocation Revenue (Los Medanos Community
Development Project) 5.000% 9/1/19 (4) 6,300 6,828
Pittsburg CA Redevelopment Agency Tax
Allocation Revenue (Los Medanos Community
Development Project) 0.000% 8/1/20 (2) 2,460 2,328
Pittsburg CA Redevelopment Agency Tax
Allocation Revenue (Los Medanos Community
Development Project) 5.000% 9/1/20 (4) 5,880 6,555
Pittsburg CA Redevelopment Agency Tax
Allocation Revenue (Los Medanos Community
Development Project) 5.000% 9/1/21 (4) 2,000 2,289
Pittsburg CA Redevelopment Agency Tax
Allocation Revenue (Los Medanos Community
Development Project) 0.000% 8/1/25 (2) 2,930 2,348
Pittsburg CA Redevelopment Agency Tax
Allocation Revenue (Los Medanos Community
Development Project) 5.000% 8/1/25 (4) 855 1,028
Pittsburg CA Redevelopment Agency Tax
Allocation Revenue (Los Medanos Community
Development Project) 5.000% 8/1/26 (4) 900 1,075
Pittsburg CA Redevelopment Agency Tax
Allocation Revenue (Los Medanos Community
Development Project) 5.000% 8/1/27 (4) 1,220 1,444
Pittsburg CA Redevelopment Agency Tax
Allocation Revenue (Los Medanos Community
Development Project) 5.000% 8/1/28 (4) 1,285 1,511
Pittsburg CA Redevelopment Agency Tax
Allocation Revenue (Los Medanos Community
Development Project) 0.000% 8/1/29 (2) 355 232
Pittsburg CA Redevelopment Agency Tax
Allocation Revenue (Los Medanos Community
Development Project) 5.000% 8/1/29 (4) 1,350 1,576
Pittsburg CA Water Revenue 4.000% 8/1/19 500 532
Pittsburg CA Water Revenue 4.000% 8/1/20 680 741
Pittsburg CA Water Revenue 4.000% 8/1/21 500 556
Pittsburg CA Water Revenue 5.000% 8/1/22 250 297
Placentia-Yorba Linda CA Unified School
District GO 2.000% 10/1/17 (4) 250 251
Placentia-Yorba Linda CA Unified School
District GO 4.000% 10/1/18 (4) 300 312
Placentia-Yorba Linda CA Unified School
District GO 5.000% 8/1/19 350 381
Placentia-Yorba Linda CA Unified School
District GO 5.000% 8/1/20 500 562
Placentia-Yorba Linda CA Unified School
District GO 5.000% 10/1/20 (4) 325 364
Face Market
Maturity Amount Value•
Coupon Date ($000) ($000)
99

California Intermediate-Term Tax-Exempt Fund
Placentia-Yorba Linda CA Unified School
District GO 5.000% 8/1/21 750 868
Placentia-Yorba Linda CA Unified School
District GO 5.000% 10/1/21 (4) 300 345
Placentia-Yorba Linda CA Unified School
District GO 5.000% 8/1/22 1,315 1,560
Placentia-Yorba Linda CA Unified School
District GO 5.000% 10/1/22 (4) 300 351
Placentia-Yorba Linda CA Unified School
District GO 5.000% 8/1/23 2,540 3,076
Placentia-Yorba Linda CA Unified School
District GO 5.000% 10/1/23 (4) 500 595
Placentia-Yorba Linda CA Unified School
District GO 5.000% 8/1/24 1,000 1,231
Placentia-Yorba Linda CA Unified School
District GO 5.000% 8/1/25 1,775 2,215
Pomona CA Single Family Mortgage Revenue 7.600% 5/1/23 (ETM) 6,435 7,721
Pomona CA Unified School District GO 5.000% 8/1/22 (15) 440 522
Pomona CA Unified School District GO 5.000% 8/1/26 (15) 450 542
Port of Oakland CA Revenue 5.000% 11/1/20 (14) 4,825 4,908
Port of Oakland CA Revenue 5.000% 11/1/26 (14) 9,800 9,967
Poway CA Redevelopment Agency Successor
Agency Tax Allocation Revenue 5.000% 6/15/22 2,215 2,572
Poway CA Redevelopment Agency Successor
Agency Tax Allocation Revenue 5.000% 12/15/22 3,535 4,144
Poway CA Redevelopment Agency Successor
Agency Tax Allocation Revenue 5.000% 6/15/23 3,325 3,929
Poway CA Redevelopment Agency Successor
Agency Tax Allocation Revenue 5.000% 12/15/26 1,370 1,653
Poway CA Unified School District GO 0.000% 8/1/17 2,000 1,997
Poway CA Unified School District GO 4.000% 9/1/17 250 252
Poway CA Unified School District GO 0.000% 8/1/18 4,565 4,506
Poway CA Unified School District GO 4.000% 9/1/18 450 464
Poway CA Unified School District GO 0.000% 8/1/19 5,425 5,273
Poway CA Unified School District GO 5.000% 9/1/19 980 1,054
Poway CA Unified School District GO 0.000% 8/1/20 3,280 3,136
Poway CA Unified School District GO 5.000% 9/1/20 610 673
Poway CA Unified School District GO 5.000% 9/1/21 320 361
Poway CA Unified School District GO 5.000% 9/1/22 455 523
Poway CA Unified School District GO 5.000% 9/1/23 1,565 1,789
Poway CA Unified School District GO 5.000% 8/1/26 5,125 5,901
Poway CA Unified School District GO 5.000% 9/1/26 990 1,115
Poway CA Unified School District GO 5.000% 8/1/27 1,625 1,966
Poway CA Unified School District GO 0.000% 8/1/28 9,070 6,594
Poway CA Unified School District GO 5.000% 9/1/29 1,195 1,331
Poway CA Unified School District GO 5.000% 9/1/30 2,545 2,829
Poway CA Unified School District GO 0.000% 8/1/31 1,095 685
Poway CA Unified School District Public
Financing Authority Special Tax Revenue 4.000% 9/1/20 1,145 1,240
Poway CA Unified School District Public
Financing Authority Special Tax Revenue 4.000% 9/1/21 1,000 1,103
Poway CA Unified School District Public
Financing Authority Special Tax Revenue 4.000% 9/1/22 860 962
Face Market
Maturity Amount Value•
Coupon Date ($000) ($000)
100
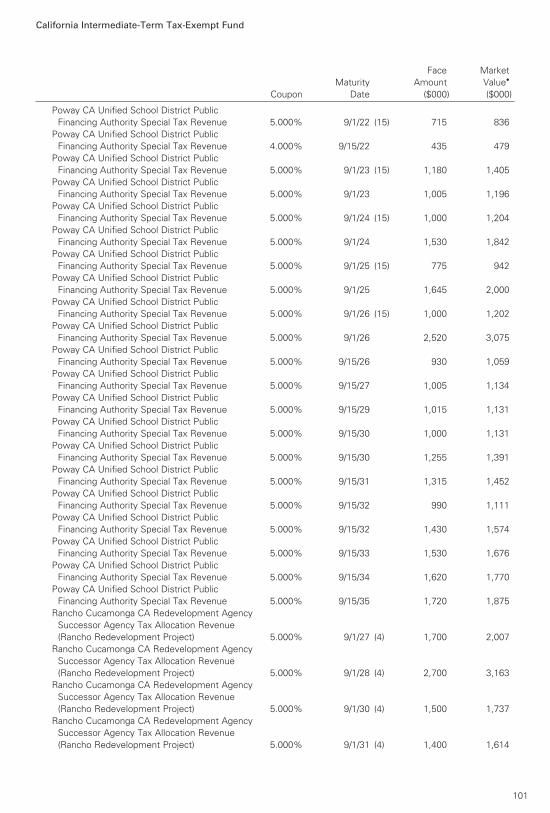
California Intermediate-Term Tax-Exempt Fund
Poway CA Unified School District Public
Financing Authority Special Tax Revenue 5.000% 9/1/22 (15) 715 836
Poway CA Unified School District Public
Financing Authority Special Tax Revenue 4.000% 9/15/22 435 479
Poway CA Unified School District Public
Financing Authority Special Tax Revenue 5.000% 9/1/23 (15) 1,180 1,405
Poway CA Unified School District Public
Financing Authority Special Tax Revenue 5.000% 9/1/23 1,005 1,196
Poway CA Unified School District Public
Financing Authority Special Tax Revenue 5.000% 9/1/24 (15) 1,000 1,204
Poway CA Unified School District Public
Financing Authority Special Tax Revenue 5.000% 9/1/24 1,530 1,842
Poway CA Unified School District Public
Financing Authority Special Tax Revenue 5.000% 9/1/25 (15) 775 942
Poway CA Unified School District Public
Financing Authority Special Tax Revenue 5.000% 9/1/25 1,645 2,000
Poway CA Unified School District Public
Financing Authority Special Tax Revenue 5.000% 9/1/26 (15) 1,000 1,202
Poway CA Unified School District Public
Financing Authority Special Tax Revenue 5.000% 9/1/26 2,520 3,075
Poway CA Unified School District Public
Financing Authority Special Tax Revenue 5.000% 9/15/26 930 1,059
Poway CA Unified School District Public
Financing Authority Special Tax Revenue 5.000% 9/15/27 1,005 1,134
Poway CA Unified School District Public
Financing Authority Special Tax Revenue 5.000% 9/15/29 1,015 1,131
Poway CA Unified School District Public
Financing Authority Special Tax Revenue 5.000% 9/15/30 1,000 1,131
Poway CA Unified School District Public
Financing Authority Special Tax Revenue 5.000% 9/15/30 1,255 1,391
Poway CA Unified School District Public
Financing Authority Special Tax Revenue 5.000% 9/15/31 1,315 1,452
Poway CA Unified School District Public
Financing Authority Special Tax Revenue 5.000% 9/15/32 990 1,111
Poway CA Unified School District Public
Financing Authority Special Tax Revenue 5.000% 9/15/32 1,430 1,574
Poway CA Unified School District Public
Financing Authority Special Tax Revenue 5.000% 9/15/33 1,530 1,676
Poway CA Unified School District Public
Financing Authority Special Tax Revenue 5.000% 9/15/34 1,620 1,770
Poway CA Unified School District Public
Financing Authority Special Tax Revenue 5.000% 9/15/35 1,720 1,875
Rancho Cucamonga CA Redevelopment Agency
Successor Agency Tax Allocation Revenue
(Rancho Redevelopment Project) 5.000% 9/1/27 (4) 1,700 2,007
Rancho Cucamonga CA Redevelopment Agency
Successor Agency Tax Allocation Revenue
(Rancho Redevelopment Project) 5.000% 9/1/28 (4) 2,700 3,163
Rancho Cucamonga CA Redevelopment Agency
Successor Agency Tax Allocation Revenue
(Rancho Redevelopment Project) 5.000% 9/1/30 (4) 1,500 1,737
Rancho Cucamonga CA Redevelopment Agency
Successor Agency Tax Allocation Revenue
(Rancho Redevelopment Project) 5.000% 9/1/31 (4) 1,400 1,614
Face Market
Maturity Amount Value•
Coupon Date ($000) ($000)
101

California Intermediate-Term Tax-Exempt Fund
Rancho Cucamonga CA Redevelopment Agency
Successor Agency Tax Allocation Revenue
(Rancho Redevelopment Project) 5.000% 9/1/32 (4) 1,710 1,964
Rancho Mirage CA Joint Powers Financing
Authority Revenue (Eisenhower Medical Center) 5.000% 7/1/27 12,500 12,533
Rancho Santiago CA Community College
District GO 5.125% 9/1/29 (4) 5,000 6,453
Redding CA Electric System Revenue 5.000% 6/1/21 400 457
Redding CA Electric System Revenue 5.000% 6/1/22 395 462
Redding CA Electric System Revenue 5.000% 6/1/23 500 597
Redding CA Electric System Revenue 5.000% 6/1/24 1,000 1,211
Redding CA Electric System Revenue 5.000% 6/1/25 830 1,017
Redding CA Electric System Revenue 5.000% 6/1/26 1,000 1,236
Redding CA Electric System Revenue 5.000% 6/1/27 1,350 1,686
Redding CA Electric System Revenue 5.000% 6/1/28 1,275 1,578
Redding CA Electric System Revenue 5.000% 6/1/29 1,495 1,831
Redding CA Joint Powers Financing Authority
Electric System Revenue 4.000% 6/1/23 325 364
Redding CA Joint Powers Financing Authority
Electric System Revenue 5.000% 6/1/24 300 358
Redding CA Joint Powers Financing Authority
Electric System Revenue 5.000% 6/1/25 375 453
Redding CA Joint Powers Financing Authority
Electric System Revenue 5.000% 6/1/26 675 817
Redding CA Joint Powers Financing Authority
Electric System Revenue 5.000% 6/1/27 1,000 1,199
Redding CA Joint Powers Financing Authority
Electric System Revenue 5.000% 6/1/28 1,000 1,194
Redding CA Joint Powers Financing Authority
Electric System Revenue 5.000% 6/1/30 775 911
Redding CA Joint Powers Financing Authority
Electric System Revenue 5.000% 6/1/32 475 553
Redwood City CA Redevelopment Agency
Redevelopment Project Area No. 2 Tax
Allocation Revenue 0.000% 7/15/25 (2) 3,350 2,631
Rio CA Elementary School District Community
Facilities District Special Tax Revenue 5.000% 9/1/27 1,000 1,130
Rio CA Elementary School District Community
Facilities District Special Tax Revenue 5.000% 9/1/28 1,000 1,125
Rio CA Elementary School District Community
Facilities District Special Tax Revenue 5.000% 9/1/30 1,000 1,110
Rio CA Elementary School District Community
Facilities District Special Tax Revenue 5.000% 9/1/35 2,300 2,511
Rio Hondo CA Community College District GO 0.000% 8/1/31 2,000 1,267
Riverside CA Community College District GO 0.000% 8/1/27 2,755 2,018
Riverside CA Community College District GO 0.000% 8/1/28 1,650 1,144
Riverside CA Community College District GO 5.000% 8/1/28 3,060 3,749
Riverside CA Electric Revenue 5.000% 10/1/24 (4) 1,000 1,053
Riverside CA Electric Revenue 5.000% 10/1/25 (4) 2,000 2,105
Riverside CA Electric Revenue 5.000% 10/1/26 (4) 2,500 2,630
Riverside CA Electric Revenue 5.000% 10/1/27 (4) 3,570 3,7562 Riverside CA Electric Revenue TOB VRDO 0.800% 6/7/17 2,500 2,500
Riverside CA Redevelopment Successor Agency
Tax Allocation Revenue 5.000% 9/1/29 1,265 1,491
Face Market
Maturity Amount Value•
Coupon Date ($000) ($000)
102

California Intermediate-Term Tax-Exempt Fund
Riverside CA Redevelopment Successor Agency
Tax Allocation Revenue 5.000% 9/1/31 1,045 1,219
Riverside CA Redevelopment Successor Agency
Tax Allocation Revenue 5.000% 10/1/31 (4) 2,930 3,395
Riverside CA Redevelopment Successor Agency
Tax Allocation Revenue 5.000% 10/1/32 (4) 3,075 3,549
Riverside CA Redevelopment Successor Agency
Tax Allocation Revenue 5.000% 9/1/33 1,055 1,221
Riverside CA Redevelopment Successor Agency
Tax Allocation Revenue 5.000% 10/1/33 (4) 1,230 1,414
Riverside CA Sewer Revenue 5.000% 8/1/20 1,635 1,834
Riverside CA Sewer Revenue 5.000% 8/1/21 2,000 2,306
Riverside CA Sewer Revenue 5.000% 8/1/22 2,160 2,544
Riverside CA Sewer Revenue 5.000% 8/1/23 3,750 4,497
Riverside CA Sewer Revenue 5.000% 8/1/24 2,000 2,437
Riverside CA Unified School District Financing
Authority Revenue 5.000% 9/1/19 1,220 1,328
Riverside CA Unified School District Financing
Authority Revenue 5.000% 9/1/20 1,280 1,436
Riverside CA Unified School District Financing
Authority Revenue 5.000% 9/1/23 1,410 1,649
Riverside CA Unified School District Financing
Authority Revenue 5.000% 9/1/25 1,555 1,784
Riverside CA Unified School District Financing
Authority Revenue 5.000% 9/1/26 1,615 1,835
Riverside CA Unified School District Financing
Authority Revenue 5.000% 9/1/27 1,710 1,931
Riverside County CA Asset Leasing Corp.
Leasehold Revenue (Riverside County
Hospital Project) 5.000% 6/1/19 3,660 3,936
Riverside County CA Public Financing Authority
Lease Revenue 5.000% 11/1/22 1,800 2,111
Riverside County CA Public Financing Authority
Lease Revenue 5.000% 11/1/23 2,000 2,388
Riverside County CA Public Financing Authority
Lease Revenue 5.000% 11/1/24 1,600 1,931
Riverside County CA Public Financing Authority
Lease Revenue 5.000% 11/1/30 9,885 11,581
Riverside County CA Public Financing Authority
Lease Revenue 5.000% 11/1/32 10,620 12,318
Riverside County CA Public Financing Authority
Tax Allocation Revenue 3.000% 9/1/17 1,635 1,644
Riverside County CA Public Financing Authority
Tax Allocation Revenue 3.000% 10/1/17 500 503
Riverside County CA Public Financing Authority
Tax Allocation Revenue 4.000% 9/1/18 2,460 2,551
Riverside County CA Public Financing Authority
Tax Allocation Revenue 4.000% 10/1/18 325 338
Riverside County CA Public Financing Authority
Tax Allocation Revenue 4.000% 9/1/19 2,560 2,720
Riverside County CA Public Financing Authority
Tax Allocation Revenue 5.000% 10/1/19 225 245
Riverside County CA Public Financing Authority
Tax Allocation Revenue 5.000% 9/1/20 2,665 2,976
Face Market
Maturity Amount Value•
Coupon Date ($000) ($000)
103

California Intermediate-Term Tax-Exempt Fund
Riverside County CA Public Financing Authority
Tax Allocation Revenue 5.000% 10/1/20 375 419
Riverside County CA Public Financing Authority
Tax Allocation Revenue 5.000% 9/1/21 (4) 2,550 2,939
Riverside County CA Public Financing Authority
Tax Allocation Revenue 5.000% 10/1/21 250 286
Riverside County CA Public Financing Authority
Tax Allocation Revenue 5.000% 9/1/22 (4) 1,830 2,151
Riverside County CA Public Financing Authority
Tax Allocation Revenue 5.000% 10/1/22 300 350
Riverside County CA Public Financing Authority
Tax Allocation Revenue 5.000% 9/1/23 (4) 2,445 2,928
Riverside County CA Redevelopment Successor
Agency Tax Allocation Revenue 4.000% 10/1/17 (4) 375 379
Riverside County CA Redevelopment Successor
Agency Tax Allocation Revenue 4.000% 10/1/18 (4) 500 520
Riverside County CA Redevelopment Successor
Agency Tax Allocation Revenue 5.000% 10/1/19 (4) 1,000 1,090
Riverside County CA Redevelopment Successor
Agency Tax Allocation Revenue 5.000% 10/1/21 (4) 1,150 1,328
Riverside County CA Redevelopment Successor
Agency Tax Allocation Revenue 5.000% 10/1/22 (4) 1,320 1,554
Riverside County CA Redevelopment Successor
Agency Tax Allocation Revenue 5.000% 10/1/23 (4) 1,905 2,285
Riverside County CA Redevelopment Successor
Agency Tax Allocation Revenue 5.000% 10/1/24 (4) 2,005 2,425
Riverside County CA Redevelopment Successor
Agency Tax Allocation Revenue 5.000% 10/1/25 (4) 1,440 1,751
Riverside County CA Redevelopment Successor
Agency Tax Allocation Revenue 5.000% 10/1/27 (4) 1,160 1,392
Riverside County CA Transportation Commission
Sales Tax Revenue 5.250% 6/1/30 3,000 3,570
Riverside County CA Transportation Commission
Sales Tax Revenue 5.250% 6/1/31 4,000 4,742
Riverside County CA Transportation Commission
Sales Tax Revenue 5.250% 6/1/32 3,000 3,547
Riverside County CA Transportation Commission
Sales Tax Revenue 5.250% 6/1/33 2,000 2,356
Riverside County CA Transportation Commission
Toll Revenue 0.000% 6/1/22 2,500 2,114
Riverside County CA Transportation Commission
Toll Revenue 0.000% 6/1/23 3,630 2,944
Riverside County CA Transportation Commission
Toll Revenue 0.000% 6/1/24 6,985 5,415
Riverside County CA Transportation Commission
Toll Revenue 0.000% 6/1/31 5,000 2,719
Riverside County CA Transportation Commission
Toll Revenue 0.000% 6/1/32 4,000 2,069
Riverside County CA Transportation Commission
Toll Revenue 0.000% 6/1/33 5,500 2,698
Riverside County CA Transportation Commission
Toll Revenue 0.000% 6/1/34 3,500 1,630
Rocklin CA Unified School District GO 0.000% 8/1/23 (14) 7,030 6,258
Rocklin CA Unified School District GO 0.000% 8/1/24 (14) 2,965 2,556
Face Market
Maturity Amount Value•
Coupon Date ($000) ($000)
104

California Intermediate-Term Tax-Exempt Fund
Roseville CA Financing Authority Electric System
Revenue 5.000% 2/1/20 (Prere.) 6,120 6,762
Roseville CA Financing Authority Electric System
Revenue 5.000% 2/1/29 330 407
Roseville CA Financing Authority Electric System
Revenue 5.000% 2/1/30 200 246
Roseville CA Financing Authority Electric System
Revenue 5.000% 2/1/30 750 892
Roseville CA Financing Authority Electric System
Revenue 5.000% 2/1/31 515 609
Roseville CA Financing Authority Electric System
Revenue 5.000% 2/1/32 250 302
Roseville CA Financing Authority Electric System
Revenue 5.000% 2/1/32 1,290 1,523
Roseville CA Financing Authority Electric System
Revenue 5.000% 2/1/33 350 419
Roseville CA Financing Authority Electric System
Revenue 5.000% 2/1/33 1,000 1,175
Roseville CA Financing Authority Electric System
Revenue 5.000% 2/1/34 250 298
Roseville CA Financing Authority Electric System
Revenue 5.000% 2/1/34 2,000 2,349
Roseville CA Financing Authority Electric System
Revenue 4.000% 2/1/36 4,500 4,809
Roseville CA Natural Gas Financing Authority Gas
Revenue 5.000% 2/15/18 4,205 4,304
Roseville CA Natural Gas Financing Authority Gas
Revenue 5.000% 2/15/19 10,000 10,523
Roseville CA Natural Gas Financing Authority Gas
Revenue 5.000% 2/15/20 2,160 2,326
Roseville CA Natural Gas Financing Authority Gas
Revenue 5.000% 2/15/24 600 686
Roseville CA Natural Gas Financing Authority Gas
Revenue 5.000% 2/15/27 200 233
Roseville CA Special Tax Revenue 5.000% 9/1/20 1,055 1,160
Roseville CA Special Tax Revenue 5.000% 9/1/21 500 562
Sacramento CA Area Flood Control Agency
Special Assessment Revenue (Natomas
Basin Local Assessment) 5.000% 10/1/22 (15) 445 524
Sacramento CA Area Flood Control Agency
Special Assessment Revenue (Natomas
Basin Local Assessment) 5.000% 10/1/24 (15) 300 365
Sacramento CA Area Flood Control Agency
Special Assessment Revenue (Natomas
Basin Local Assessment) 5.000% 10/1/26 (15) 280 337
Sacramento CA Area Flood Control Agency
Special Assessment Revenue (Natomas
Basin Local Assessment) 5.000% 10/1/27 (15) 425 508
Sacramento CA Area Flood Control Agency
Special Assessment Revenue (Natomas
Basin Local Assessment) 5.000% 10/1/28 (15) 250 297
Sacramento CA Area Flood Control Agency
Special Assessment Revenue (Natomas
Basin Local Assessment) 5.000% 10/1/29 (15) 500 589
Face Market
Maturity Amount Value•
Coupon Date ($000) ($000)
105

California Intermediate-Term Tax-Exempt Fund
Sacramento CA Area Flood Control Agency
Special Assessment Revenue (Natomas
Basin Local Assessment) 5.000% 10/1/31 (15) 1,160 1,354
Sacramento CA Area Flood Control Agency
Special Assessment Revenue (Natomas
Basin Local Assessment) 5.000% 10/1/33 (15) 1,280 1,481
Sacramento CA Area Flood Control Agency
Special Assessment Revenue (Natomas
Basin Local Assessment) 5.000% 10/1/34 (15) 1,340 1,545
Sacramento CA City Financing Authority Revenue 5.000% 12/1/19 3,990 4,377
Sacramento CA City Financing Authority Revenue 4.000% 12/1/20 3,700 4,056
Sacramento CA City Financing Authority Revenue 5.000% 12/1/20 2,000 2,261
Sacramento CA City Financing Authority Revenue 5.000% 12/1/32 (15) 1,200 1,406
Sacramento CA City Financing Authority Revenue 5.000% 12/1/33 (15) 1,725 2,012
Sacramento CA City Financing Authority Tax
Allocation Revenue 0.000% 12/1/25 (14) 5,000 4,092
Sacramento CA City Financing Authority Tax
Allocation Revenue 0.000% 12/1/27 (14) 15,815 11,661
Sacramento CA City Financing Authority Tax
Allocation Revenue 0.000% 12/1/31 (14) 5,000 2,938
Sacramento CA City Financing Authority Tax
Allocation Revenue 0.000% 12/1/34 (14) 3,990 1,988
Sacramento CA City Unified School District GO 5.000% 7/1/20 (4) 500 560
Sacramento CA City Unified School District GO 5.000% 7/1/21 (4) 400 461
Sacramento CA City Unified School District GO 5.000% 7/1/22 (4) 700 826
Sacramento CA Cogeneration Authority Revenue 5.000% 7/1/17 1,250 1,255
Sacramento CA Cogeneration Authority Revenue 5.000% 7/1/18 725 758
Sacramento CA Cogeneration Authority Revenue 5.000% 7/1/19 1,155 1,251
Sacramento CA Cogeneration Authority Revenue 5.250% 7/1/20 1,250 1,405
Sacramento CA Cogeneration Authority Revenue 5.250% 7/1/21 1,000 1,158
Sacramento CA Financing Authority Lease
Revenue 4.000% 12/1/18 3,660 3,829
Sacramento CA Financing Authority Lease
Revenue 5.000% 12/1/18 2,000 2,122
Sacramento CA Municipal Utility District
Financing Authority Revenue 5.000% 7/1/20 1,405 1,576
Sacramento CA Municipal Utility District Revenue 5.000% 8/15/18 (Prere.) 2,920 3,069
Sacramento CA Municipal Utility District Revenue 5.000% 8/15/18 (Prere.) 5,895 6,196
Sacramento CA Municipal Utility District Revenue 5.250% 7/1/24 (2) 10,085 12,114
Sacramento CA Municipal Utility District Revenue 5.000% 8/15/24 1,325 1,633
Sacramento CA Municipal Utility District Revenue 5.000% 8/15/24 (4) 4,630 4,862
Sacramento CA Municipal Utility District Revenue 5.000% 8/15/25 2,450 3,062
Sacramento CA Municipal Utility District Revenue 5.000% 8/15/25 (4) 9,380 9,848
Sacramento CA Municipal Utility District Revenue 5.000% 8/15/25 5,455 6,409
Sacramento CA Municipal Utility District Revenue 5.000% 8/15/26 2,400 3,031
Sacramento CA Municipal Utility District Revenue 5.000% 8/15/26 (4) 3,070 3,222
Sacramento CA Municipal Utility District Revenue 5.000% 8/15/27 4,905 5,835
Sacramento CA Municipal Utility District Revenue 5.000% 8/15/28 2,000 2,366
Sacramento CA Municipal Utility District Revenue 5.000% 8/15/30 6,435 7,395
Sacramento CA Regional Transportation District
Farebox Revenue 5.000% 9/1/20 (Prere.) 405 456
Sacramento CA Regional Transportation District
Farebox Revenue 5.000% 9/1/20 (Prere.) 925 1,041
Face Market
Maturity Amount Value•
Coupon Date ($000) ($000)
106

California Intermediate-Term Tax-Exempt Fund
Sacramento CA Regional Transportation District
Farebox Revenue 5.000% 9/1/20 (Prere.) 975 1,097
Sacramento CA Regional Transportation District
Farebox Revenue 5.000% 9/1/20 (Prere.) 1,100 1,238
Sacramento CA Regional Transportation District
Farebox Revenue 5.000% 9/1/20 (Prere.) 1,155 1,300
Sacramento CA Regional Transportation District
Farebox Revenue 5.000% 3/1/22 680 757
Sacramento CA Regional Transportation District
Farebox Revenue 5.000% 3/1/28 1,575 1,743
Sacramento CA Regional Transportation District
Farebox Revenue 5.000% 3/1/29 1,660 1,834
Sacramento CA Regional Transportation District
Farebox Revenue 5.000% 3/1/30 1,875 2,058
Sacramento CA Regional Transportation District
Farebox Revenue 5.000% 3/1/31 1,970 2,163
Sacramento CA Transportation Authority Sales
Tax Revenue 5.000% 10/1/21 2,300 2,667
Sacramento CA Unified School District GO 2.000% 8/1/18 (4) 1,545 1,567
Sacramento CA Unified School District GO 3.000% 8/1/19 (4) 1,215 1,269
Sacramento CA Unified School District GO 3.000% 8/1/20 (4) 1,000 1,061
Sacramento CA Unified School District GO 4.000% 8/1/21 (4) 1,000 1,115
Sacramento CA Unified School District GO 4.000% 8/1/22 (4) 750 850
Sacramento CA Unified School District GO 5.000% 8/1/23 (4) 1,115 1,346
Sacramento CA Water Revenue 5.000% 9/1/27 3,210 3,818
Sacramento County CA Airport Revenue 5.000% 7/1/18 (Prere.) 265 277
Sacramento County CA Airport Revenue 5.000% 7/1/18 (Prere.) 330 345
Sacramento County CA Airport Revenue 5.000% 7/1/23 (4) 1,735 1,810
Sacramento County CA Airport Revenue 5.000% 7/1/24 (4) 2,170 2,263
Sacramento County CA Airport Revenue 5.000% 7/1/24 (4) 1,785 1,861
Sacramento County CA Airport Revenue 5.000% 7/1/28 1,250 1,389
Sacramento County CA Airport Revenue 5.000% 7/1/30 5,240 5,780
Sacramento County CA Airport Revenue 5.000% 7/1/35 1,000 1,152
Sacramento County CA Airport Revenue 5.000% 7/1/36 2,000 2,295
Saddleback Valley CA Unified School District GO 4.000% 8/1/20 2,100 2,295
Saddleback Valley CA Unified School District GO 4.000% 8/1/21 2,240 2,501
Saddleback Valley CA Unified School District GO 4.000% 8/1/24 2,515 2,922
Saddleback Valley CA Unified School District GO 4.000% 8/1/26 2,725 3,201
San Bernardino CA City Unified School District GO 5.000% 8/1/18 2,350 2,457
San Bernardino CA City Unified School District GO 5.000% 8/1/20 (4) 765 856
San Bernardino CA City Unified School District GO 5.000% 8/1/21 (4) 1,230 1,416
San Bernardino CA City Unified School District GO 5.000% 8/1/22 (4) 1,500 1,765
San Bernardino CA City Unified School District GO 5.000% 8/1/23 (4) 1,100 1,320
San Bernardino CA City Unified School District GO 5.000% 8/1/24 (4) 1,400 1,673
San Bernardino CA Community College
District GO 0.000% 8/1/23 (4) 2,655 2,363
San Bernardino CA Community College
District GO 5.000% 8/1/24 4,375 5,282
San Bernardino CA Community College
District GO 5.000% 8/1/25 4,550 5,461
San Bernardino CA Community College
District GO 5.000% 8/1/26 4,150 4,950
San Bernardino CA Community College
District GO 0.000% 8/1/29 1,000 666
Face Market
Maturity Amount Value•
Coupon Date ($000) ($000)
107
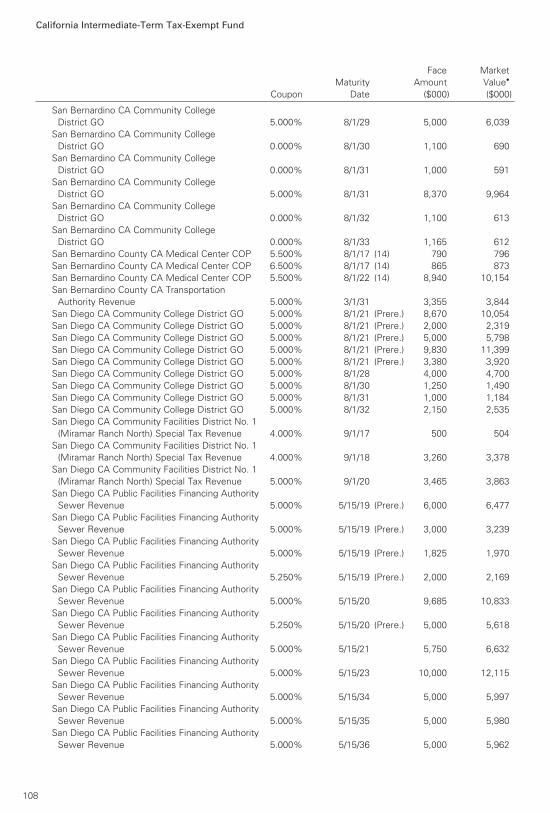
California Intermediate-Term Tax-Exempt Fund
San Bernardino CA Community College
District GO 5.000% 8/1/29 5,000 6,039
San Bernardino CA Community College
District GO 0.000% 8/1/30 1,100 690
San Bernardino CA Community College
District GO 0.000% 8/1/31 1,000 591
San Bernardino CA Community College
District GO 5.000% 8/1/31 8,370 9,964
San Bernardino CA Community College
District GO 0.000% 8/1/32 1,100 613
San Bernardino CA Community College
District GO 0.000% 8/1/33 1,165 612
San Bernardino County CA Medical Center COP 5.500% 8/1/17 (14) 790 796
San Bernardino County CA Medical Center COP 6.500% 8/1/17 (14) 865 873
San Bernardino County CA Medical Center COP 5.500% 8/1/22 (14) 8,940 10,154
San Bernardino County CA Transportation
Authority Revenue 5.000% 3/1/31 3,355 3,844
San Diego CA Community College District GO 5.000% 8/1/21 (Prere.) 8,670 10,054
San Diego CA Community College District GO 5.000% 8/1/21 (Prere.) 2,000 2,319
San Diego CA Community College District GO 5.000% 8/1/21 (Prere.) 5,000 5,798
San Diego CA Community College District GO 5.000% 8/1/21 (Prere.) 9,830 11,399
San Diego CA Community College District GO 5.000% 8/1/21 (Prere.) 3,380 3,920
San Diego CA Community College District GO 5.000% 8/1/28 4,000 4,700
San Diego CA Community College District GO 5.000% 8/1/30 1,250 1,490
San Diego CA Community College District GO 5.000% 8/1/31 1,000 1,184
San Diego CA Community College District GO 5.000% 8/1/32 2,150 2,535
San Diego CA Community Facilities District No. 1
(Miramar Ranch North) Special Tax Revenue 4.000% 9/1/17 500 504
San Diego CA Community Facilities District No. 1
(Miramar Ranch North) Special Tax Revenue 4.000% 9/1/18 3,260 3,378
San Diego CA Community Facilities District No. 1
(Miramar Ranch North) Special Tax Revenue 5.000% 9/1/20 3,465 3,863
San Diego CA Public Facilities Financing Authority
Sewer Revenue 5.000% 5/15/19 (Prere.) 6,000 6,477
San Diego CA Public Facilities Financing Authority
Sewer Revenue 5.000% 5/15/19 (Prere.) 3,000 3,239
San Diego CA Public Facilities Financing Authority
Sewer Revenue 5.000% 5/15/19 (Prere.) 1,825 1,970
San Diego CA Public Facilities Financing Authority
Sewer Revenue 5.250% 5/15/19 (Prere.) 2,000 2,169
San Diego CA Public Facilities Financing Authority
Sewer Revenue 5.000% 5/15/20 9,685 10,833
San Diego CA Public Facilities Financing Authority
Sewer Revenue 5.250% 5/15/20 (Prere.) 5,000 5,618
San Diego CA Public Facilities Financing Authority
Sewer Revenue 5.000% 5/15/21 5,750 6,632
San Diego CA Public Facilities Financing Authority
Sewer Revenue 5.000% 5/15/23 10,000 12,115
San Diego CA Public Facilities Financing Authority
Sewer Revenue 5.000% 5/15/34 5,000 5,997
San Diego CA Public Facilities Financing Authority
Sewer Revenue 5.000% 5/15/35 5,000 5,980
San Diego CA Public Facilities Financing Authority
Sewer Revenue 5.000% 5/15/36 5,000 5,962
Face Market
Maturity Amount Value•
Coupon Date ($000) ($000)
108

California Intermediate-Term Tax-Exempt Fund
San Diego CA Public Facilities Financing Authority
Water Revenue 5.000% 8/1/19 (Prere.) 4,215 4,582
San Diego CA Public Facilities Financing Authority
Water Revenue 5.125% 8/1/19 (Prere.) 5,000 5,449
San Diego CA Public Facilities Financing Authority
Water Revenue 5.250% 8/1/20 (Prere.) 5,355 6,061
San Diego CA Public Facilities Financing Authority
Water Revenue 5.000% 8/1/21 10,000 11,579
San Diego CA Public Facilities Financing Authority
Water Revenue 5.000% 8/1/22 3,200 3,799
San Diego CA Public Facilities Financing Authority
Water Revenue 5.000% 8/1/24 10,010 12,358
San Diego CA Public Facilities Financing Authority
Water Revenue 5.000% 8/1/25 4,080 5,110
San Diego CA Public Facilities Financing Authority
Water Revenue 5.000% 8/1/26 10,680 13,492
San Diego CA Public Facilities Financing Authority
Water Revenue 5.000% 8/1/30 2,000 2,297
San Diego CA Public Facilities Financing Authority
Water Revenue 5.000% 8/1/32 4,190 4,811
San Diego CA Redevelopment Agency Tax
Allocation 4.000% 9/1/18 2,950 3,068
San Diego CA Redevelopment Agency Tax
Allocation 5.000% 9/1/19 1,000 1,090
San Diego CA Redevelopment Agency Tax
Allocation 5.000% 9/1/20 1,000 1,126
San Diego CA Redevelopment Agency Tax
Allocation 5.000% 9/1/21 2,000 2,319
San Diego CA Redevelopment Agency Tax
Allocation 5.000% 9/1/22 1,000 1,191
San Diego CA Redevelopment Agency Tax
Allocation 5.000% 9/1/23 1,000 1,214
San Diego CA Unified School District GO 0.000% 7/1/18 (14) 9,500 9,389
San Diego CA Unified School District GO 5.500% 7/1/20 (4) 9,490 10,796
San Diego CA Unified School District GO 5.000% 7/1/21 15,000 17,349
San Diego CA Unified School District GO 5.000% 7/1/22 1,500 1,780
San Diego CA Unified School District GO 5.500% 7/1/22 (4) 12,790 15,484
San Diego CA Unified School District GO 4.000% 7/1/24 4,000 4,652
San Diego CA Unified School District GO 5.000% 7/1/24 1,735 2,142
San Diego CA Unified School District GO 4.000% 7/1/25 2,500 2,935
San Diego CA Unified School District GO 5.000% 7/1/25 1,695 2,120
San Diego CA Unified School District GO 5.500% 7/1/25 (14) 1,000 1,291
San Diego CA Unified School District GO 0.000% 7/1/26 8,425 6,699
San Diego CA Unified School District GO 5.000% 7/1/26 20,040 24,768
San Diego CA Unified School District GO 5.500% 7/1/26 (4) 7,490 9,672
San Diego CA Unified School District GO 5.500% 7/1/26 (4) 20,885 26,969
San Diego CA Unified School District GO 0.000% 7/1/27 8,500 6,460
San Diego CA Unified School District GO 0.000% 7/1/28 8,000 5,814
San Diego CA Unified School District GO 5.000% 7/1/28 6,535 7,948
San Diego CA Unified School District GO 5.000% 7/1/28 700 851
San Diego CA Unified School District GO 0.000% 7/1/29 3,250 2,245
San Diego CA Unified School District GO 5.000% 7/1/29 3,230 3,968
San Diego CA Unified School District GO 5.000% 7/1/29 750 906
San Diego CA Unified School District GO 0.000% 7/1/30 9,985 6,600
Face Market
Maturity Amount Value•
Coupon Date ($000) ($000)
109

California Intermediate-Term Tax-Exempt Fund
San Diego CA Unified School District GO 0.000% 7/1/30 2,500 1,652
San Diego CA Unified School District GO 5.000% 7/1/31 1,200 1,428
San Diego CA Unified School District GO 4.000% 7/1/32 1,000 1,091
San Diego CA Unified School District GO 4.000% 7/1/33 2,000 2,166
San Diego CA Unified School District GO 4.000% 7/1/34 3,000 3,225
San Diego CA Unified School District GO 4.000% 7/1/35 3,500 3,755
San Diego County CA COP 5.000% 10/15/24 2,115 2,620
San Diego County CA COP 5.000% 10/15/25 5,225 6,405
San Diego County CA COP 5.000% 10/15/26 2,590 3,174
San Diego County CA COP 5.000% 10/15/27 2,000 2,438
San Diego County CA COP 5.000% 10/15/28 1,400 1,698
San Diego County CA COP 5.000% 10/15/29 2,000 2,416
San Diego County CA Limited Obligation
Revenue (Sanford Burnham Prebys Medical
Discovery Institute) 4.000% 11/1/17 510 516
San Diego County CA Limited Obligation
Revenue (Sanford Burnham Prebys Medical
Discovery Institute) 5.000% 11/1/18 460 485
San Diego County CA Limited Obligation
Revenue (Sanford Burnham Prebys Medical
Discovery Institute) 5.000% 11/1/19 480 522
San Diego County CA Limited Obligation
Revenue (Sanford Burnham Prebys Medical
Discovery Institute) 5.000% 11/1/22 425 495
San Diego County CA Limited Obligation
Revenue (Sanford Burnham Prebys Medical
Discovery Institute) 4.000% 11/1/23 1,665 1,866
San Diego County CA Limited Obligation
Revenue (Sanford Burnham Prebys Medical
Discovery Institute) 5.000% 11/1/24 750 895
San Diego County CA Limited Obligation
Revenue (Sanford Burnham Prebys Medical
Discovery Institute) 5.000% 11/1/26 1,145 1,358
San Diego County CA Limited Obligation
Revenue (Sanford Burnham Prebys Medical
Discovery Institute) 5.000% 11/1/28 1,450 1,686
San Diego County CA Limited Obligation
Revenue (Sanford Burnham Prebys Medical
Discovery Institute) 5.000% 11/1/30 1,205 1,379
San Diego County CA Regional Airport Authority
Revenue 5.000% 7/1/23 3,900 4,350
San Diego County CA Regional Airport Authority
Revenue 5.000% 7/1/25 9,000 10,015
San Diego County CA Regional Airport Authority
Revenue 5.000% 7/1/26 6,000 6,669
San Diego County CA Regional Airport Authority
Revenue 5.000% 7/1/28 3,000 3,326
San Diego County CA Regional Building Authority
Lease Revenue (County Operations Center &
Annex Redevelopment Project) 5.000% 2/1/19 (Prere.) 4,285 4,576
San Diego County CA Regional Building Authority
Lease Revenue (County Operations Center &
Annex Redevelopment Project) 5.000% 2/1/19 (Prere.) 4,820 5,148
Face Market
Maturity Amount Value•
Coupon Date ($000) ($000)
110
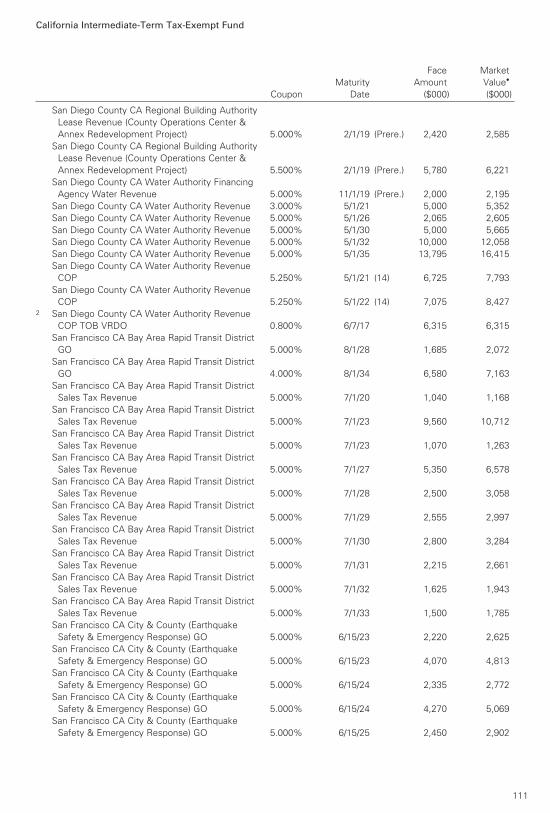
California Intermediate-Term Tax-Exempt Fund
San Diego County CA Regional Building Authority
Lease Revenue (County Operations Center &
Annex Redevelopment Project) 5.000% 2/1/19 (Prere.) 2,420 2,585
San Diego County CA Regional Building Authority
Lease Revenue (County Operations Center &
Annex Redevelopment Project) 5.500% 2/1/19 (Prere.) 5,780 6,221
San Diego County CA Water Authority Financing
Agency Water Revenue 5.000% 11/1/19 (Prere.) 2,000 2,195
San Diego County CA Water Authority Revenue 3.000% 5/1/21 5,000 5,352
San Diego County CA Water Authority Revenue 5.000% 5/1/26 2,065 2,605
San Diego County CA Water Authority Revenue 5.000% 5/1/30 5,000 5,665
San Diego County CA Water Authority Revenue 5.000% 5/1/32 10,000 12,058
San Diego County CA Water Authority Revenue 5.000% 5/1/35 13,795 16,415
San Diego County CA Water Authority Revenue
COP 5.250% 5/1/21 (14) 6,725 7,793
San Diego County CA Water Authority Revenue
COP 5.250% 5/1/22 (14) 7,075 8,4272 San Diego County CA Water Authority Revenue
COP TOB VRDO 0.800% 6/7/17 6,315 6,315
San Francisco CA Bay Area Rapid Transit District
GO 5.000% 8/1/28 1,685 2,072
San Francisco CA Bay Area Rapid Transit District
GO 4.000% 8/1/34 6,580 7,163
San Francisco CA Bay Area Rapid Transit District
Sales Tax Revenue 5.000% 7/1/20 1,040 1,168
San Francisco CA Bay Area Rapid Transit District
Sales Tax Revenue 5.000% 7/1/23 9,560 10,712
San Francisco CA Bay Area Rapid Transit District
Sales Tax Revenue 5.000% 7/1/23 1,070 1,263
San Francisco CA Bay Area Rapid Transit District
Sales Tax Revenue 5.000% 7/1/27 5,350 6,578
San Francisco CA Bay Area Rapid Transit District
Sales Tax Revenue 5.000% 7/1/28 2,500 3,058
San Francisco CA Bay Area Rapid Transit District
Sales Tax Revenue 5.000% 7/1/29 2,555 2,997
San Francisco CA Bay Area Rapid Transit District
Sales Tax Revenue 5.000% 7/1/30 2,800 3,284
San Francisco CA Bay Area Rapid Transit District
Sales Tax Revenue 5.000% 7/1/31 2,215 2,661
San Francisco CA Bay Area Rapid Transit District
Sales Tax Revenue 5.000% 7/1/32 1,625 1,943
San Francisco CA Bay Area Rapid Transit District
Sales Tax Revenue 5.000% 7/1/33 1,500 1,785
San Francisco CA City & County (Earthquake
Safety & Emergency Response) GO 5.000% 6/15/23 2,220 2,625
San Francisco CA City & County (Earthquake
Safety & Emergency Response) GO 5.000% 6/15/23 4,070 4,813
San Francisco CA City & County (Earthquake
Safety & Emergency Response) GO 5.000% 6/15/24 2,335 2,772
San Francisco CA City & County (Earthquake
Safety & Emergency Response) GO 5.000% 6/15/24 4,270 5,069
San Francisco CA City & County (Earthquake
Safety & Emergency Response) GO 5.000% 6/15/25 2,450 2,902
Face Market
Maturity Amount Value•
Coupon Date ($000) ($000)
111
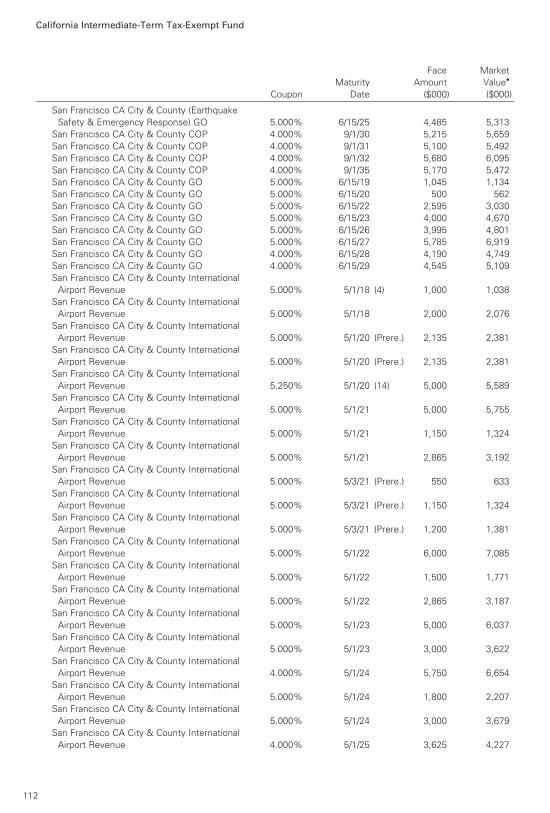
California Intermediate-Term Tax-Exempt Fund
San Francisco CA City & County (Earthquake
Safety & Emergency Response) GO 5.000% 6/15/25 4,485 5,313
San Francisco CA City & County COP 4.000% 9/1/30 5,215 5,659
San Francisco CA City & County COP 4.000% 9/1/31 5,100 5,492
San Francisco CA City & County COP 4.000% 9/1/32 5,680 6,095
San Francisco CA City & County COP 4.000% 9/1/35 5,170 5,472
San Francisco CA City & County GO 5.000% 6/15/19 1,045 1,134
San Francisco CA City & County GO 5.000% 6/15/20 500 562
San Francisco CA City & County GO 5.000% 6/15/22 2,595 3,030
San Francisco CA City & County GO 5.000% 6/15/23 4,000 4,670
San Francisco CA City & County GO 5.000% 6/15/26 3,995 4,801
San Francisco CA City & County GO 5.000% 6/15/27 5,785 6,919
San Francisco CA City & County GO 4.000% 6/15/28 4,190 4,749
San Francisco CA City & County GO 4.000% 6/15/29 4,545 5,109
San Francisco CA City & County International
Airport Revenue 5.000% 5/1/18 (4) 1,000 1,038
San Francisco CA City & County International
Airport Revenue 5.000% 5/1/18 2,000 2,076
San Francisco CA City & County International
Airport Revenue 5.000% 5/1/20 (Prere.) 2,135 2,381
San Francisco CA City & County International
Airport Revenue 5.000% 5/1/20 (Prere.) 2,135 2,381
San Francisco CA City & County International
Airport Revenue 5.250% 5/1/20 (14) 5,000 5,589
San Francisco CA City & County International
Airport Revenue 5.000% 5/1/21 5,000 5,755
San Francisco CA City & County International
Airport Revenue 5.000% 5/1/21 1,150 1,324
San Francisco CA City & County International
Airport Revenue 5.000% 5/1/21 2,865 3,192
San Francisco CA City & County International
Airport Revenue 5.000% 5/3/21 (Prere.) 550 633
San Francisco CA City & County International
Airport Revenue 5.000% 5/3/21 (Prere.) 1,150 1,324
San Francisco CA City & County International
Airport Revenue 5.000% 5/3/21 (Prere.) 1,200 1,381
San Francisco CA City & County International
Airport Revenue 5.000% 5/1/22 6,000 7,085
San Francisco CA City & County International
Airport Revenue 5.000% 5/1/22 1,500 1,771
San Francisco CA City & County International
Airport Revenue 5.000% 5/1/22 2,865 3,187
San Francisco CA City & County International
Airport Revenue 5.000% 5/1/23 5,000 6,037
San Francisco CA City & County International
Airport Revenue 5.000% 5/1/23 3,000 3,622
San Francisco CA City & County International
Airport Revenue 4.000% 5/1/24 5,750 6,654
San Francisco CA City & County International
Airport Revenue 5.000% 5/1/24 1,800 2,207
San Francisco CA City & County International
Airport Revenue 5.000% 5/1/24 3,000 3,679
San Francisco CA City & County International
Airport Revenue 4.000% 5/1/25 3,625 4,227
Face Market
Maturity Amount Value•
Coupon Date ($000) ($000)
112

California Intermediate-Term Tax-Exempt Fund
San Francisco CA City & County International
Airport Revenue 5.000% 5/1/25 2,050 2,553
San Francisco CA City & County International
Airport Revenue 5.000% 5/1/25 6,000 7,473
San Francisco CA City & County International
Airport Revenue 5.000% 5/1/26 1,580 1,982
San Francisco CA City & County International
Airport Revenue 5.000% 5/1/27 1,930 2,392
San Francisco CA City & County International
Airport Revenue 5.000% 5/1/28 7,525 8,777
San Francisco CA City & County International
Airport Revenue 5.000% 5/1/28 2,175 2,667
San Francisco CA City & County International
Airport Revenue 5.000% 5/1/28 2,305 2,639
San Francisco CA City & County International
Airport Revenue 4.900% 5/1/29 8,625 9,388
San Francisco CA City & County International
Airport Revenue 5.000% 5/1/29 1,755 2,131
San Francisco CA City & County International
Airport Revenue 5.000% 5/1/30 1,000 1,203
San Francisco CA City & County International
Airport Revenue 5.000% 5/1/30 4,790 5,359
San Francisco CA City & County International
Airport Revenue 5.000% 5/1/31 635 758
San Francisco CA City & County International
Airport Revenue 5.000% 5/1/31 5,030 5,628
San Francisco CA City & County Public Utilities
Commission Wastewater Revenue 5.000% 10/1/26 5,865 7,263
San Francisco CA City & County Public Utilities
Commission Wastewater Revenue 5.000% 10/1/26 1,795 2,223
San Francisco CA City & County Public Utilities
Commission Wastewater Revenue 5.000% 10/1/27 1,885 2,314
San Francisco CA City & County Public Utilities
Commission Wastewater Revenue 5.000% 10/1/30 13,170 15,173
San Francisco CA City & County Public Utilities
Commission Wastewater Revenue 5.000% 10/1/34 9,495 11,231
San Francisco CA City & County Public Utilities
Commission Wastewater Revenue 5.000% 10/1/35 9,980 11,764
San Francisco CA City & County Public Utilities
Commission Wastewater Revenue 5.000% 10/1/36 10,495 12,302
San Francisco CA City & County Public Utilities
Commission Water Revenue 3.000% 11/1/18 1,400 1,443
San Francisco CA City & County Public Utilities
Commission Water Revenue 5.000% 11/1/19 1,000 1,099
San Francisco CA City & County Public Utilities
Commission Water Revenue 5.000% 11/1/19 (Prere.) 440 483
San Francisco CA City & County Public Utilities
Commission Water Revenue 5.000% 11/1/19 (Prere.) 2,555 2,802
San Francisco CA City & County Public Utilities
Commission Water Revenue 5.000% 11/1/19 (Prere.) 2,960 3,247
San Francisco CA City & County Public Utilities
Commission Water Revenue 5.000% 11/1/19 (Prere.) 2,705 2,967
San Francisco CA City & County Public Utilities
Commission Water Revenue 5.000% 11/1/19 (Prere.) 1,000 1,097
Face Market
Maturity Amount Value•
Coupon Date ($000) ($000)
113

California Intermediate-Term Tax-Exempt Fund
San Francisco CA City & County Public Utilities
Commission Water Revenue 5.000% 11/1/19 (Prere.) 10,000 10,969
San Francisco CA City & County Public Utilities
Commission Water Revenue 5.000% 11/1/20 2,000 2,270
San Francisco CA City & County Public Utilities
Commission Water Revenue 5.000% 11/1/21 1,100 1,285
San Francisco CA City & County Public Utilities
Commission Water Revenue 5.000% 11/1/22 900 1,077
San Francisco CA City & County Public Utilities
Commission Water Revenue 5.000% 11/1/23 4,185 5,115
San Francisco CA City & County Public Utilities
Commission Water Revenue 5.000% 11/1/24 4,550 5,647
San Francisco CA City & County Public Utilities
Commission Water Revenue 5.000% 11/1/25 6,000 7,460
San Francisco CA City & County Public Utilities
Commission Water Revenue 5.000% 11/1/27 7,755 9,484
San Francisco CA City & County Public Utilities
Commission Water Revenue 5.000% 11/1/27 1,000 1,191
San Francisco CA City & County Public Utilities
Commission Water Revenue 5.000% 10/1/28 10,235 11,984
San Francisco CA City & County Public Utilities
Commission Water Revenue 5.000% 11/1/28 5,355 6,500
San Francisco CA City & County Public Utilities
Commission Water Revenue 5.000% 11/1/29 12,685 15,285
San Francisco CA City & County Public Utilities
Commission Water Revenue 5.000% 11/1/29 6,530 7,589
San Francisco CA City & County Public Utilities
Commission Water Revenue 5.000% 11/1/29 11,000 12,762
San Francisco CA City & County Public Utilities
Commission Water Revenue 4.000% 11/1/30 3,660 4,080
San Francisco CA City & County Public Utilities
Commission Water Revenue 5.000% 11/1/30 10,335 11,937
San Francisco CA City & County Public Utilities
Commission Water Revenue 5.000% 10/1/31 14,015 16,147
San Francisco CA City & County Public Utilities
Commission Water Revenue 5.000% 10/1/31 2,000 2,399
San Francisco CA City & County Public Utilities
Commission Water Revenue 5.000% 11/1/31 1,000 1,161
San Francisco CA City & County Public Utilities
Commission Water Revenue 5.000% 11/1/31 5,730 6,602
San Francisco CA City & County Public Utilities
Commission Water Revenue 5.000% 10/1/32 3,000 3,581
San Francisco CA City & County Public Utilities
Commission Water Revenue 5.000% 11/1/32 2,625 3,119
San Francisco CA City & County Public Utilities
Commission Water Revenue 5.000% 11/1/33 9,000 10,351
San Francisco CA City & County Public Utilities
Commission Water Revenue 5.000% 11/1/33 6,000 7,218
San Francisco CA City & County Public Utilities
Commission Water Revenue 5.000% 11/1/34 5,000 5,738
San Francisco CA City & County Public Utilities
Commission Water Revenue 5.000% 11/1/34 4,000 4,790
San Francisco CA City & County Public Utilities
Commission Water Revenue 5.000% 11/1/35 7,000 8,350
Face Market
Maturity Amount Value•
Coupon Date ($000) ($000)
114

California Intermediate-Term Tax-Exempt Fund
San Francisco CA City & County Redevelopment
Agency Community Facilities District No. 7
Special Tax Revenue (Hunters Point Shipyard
Improvements) 5.000% 8/1/30 525 579
San Francisco CA City & County Redevelopment
Agency Community Facilities District No. 7
Special Tax Revenue (Hunters Point Shipyard
Improvements) 5.000% 8/1/33 680 742
San Francisco CA City & County Redevelopment
Financing Authority Tax Allocation Revenue
(Mission Bays Redevelopment Project) 5.000% 8/1/17 100 101
San Francisco CA City & County Redevelopment
Financing Authority Tax Allocation Revenue
(Mission Bays Redevelopment Project) 5.000% 8/1/19 220 238
San Francisco CA City & County Redevelopment
Financing Authority Tax Allocation Revenue
(Mission Bays Redevelopment Project) 5.000% 8/1/20 130 145
San Francisco CA City & County Redevelopment
Financing Authority Tax Allocation Revenue
(Mission Bays Redevelopment Project) 5.000% 8/1/21 160 183
San Francisco CA City & County Redevelopment
Financing Authority Tax Allocation Revenue
(Mission Bays Redevelopment Project) 5.000% 8/1/22 125 146
San Francisco CA City & County Redevelopment
Financing Authority Tax Allocation Revenue
(Mission Bays Redevelopment Project) 5.000% 8/1/23 120 143
San Francisco CA City & County Redevelopment
Financing Authority Tax Allocation Revenue
(Mission Bays Redevelopment Project) 5.000% 8/1/24 135 162
San Francisco CA City & County Redevelopment
Financing Authority Tax Allocation Revenue
(Mission Bays Redevelopment Project) 5.000% 8/1/24 440 531
San Francisco CA City & County Redevelopment
Financing Authority Tax Allocation Revenue
(Mission Bays Redevelopment Project) 5.000% 8/1/24 860 1,038
San Francisco CA City & County Redevelopment
Financing Authority Tax Allocation Revenue
(Mission Bays Redevelopment Project) 5.000% 8/1/24 275 334
San Francisco CA City & County Redevelopment
Financing Authority Tax Allocation Revenue
(Mission Bays Redevelopment Project) 5.000% 8/1/25 240 288
San Francisco CA City & County Redevelopment
Financing Authority Tax Allocation Revenue
(Mission Bays Redevelopment Project) 5.000% 8/1/25 400 489
San Francisco CA City & County Redevelopment
Financing Authority Tax Allocation Revenue
(Mission Bays Redevelopment Project) 5.000% 8/1/25 400 490
San Francisco CA City & County Redevelopment
Financing Authority Tax Allocation Revenue
(Mission Bays Redevelopment Project) 5.000% 8/1/26 1,405 1,720
San Francisco CA City & County Redevelopment
Financing Authority Tax Allocation Revenue
(Mission Bays Redevelopment Project) 5.000% 8/1/26 500 618
Face Market
Maturity Amount Value•
Coupon Date ($000) ($000)
115

California Intermediate-Term Tax-Exempt Fund
San Francisco CA City & County Redevelopment
Financing Authority Tax Allocation Revenue
(Mission Bays Redevelopment Project) 5.000% 8/1/27 140 165
San Francisco CA City & County Redevelopment
Financing Authority Tax Allocation Revenue
(Mission Bays Redevelopment Project) 5.000% 8/1/27 500 610
San Francisco CA City & County Redevelopment
Financing Authority Tax Allocation Revenue
(Mission Bays Redevelopment Project) 5.000% 8/1/27 500 610
San Francisco CA City & County Redevelopment
Financing Authority Tax Allocation Revenue
(Mission Bays Redevelopment Project) 5.000% 8/1/28 710 859
San Francisco CA City & County Redevelopment
Financing Authority Tax Allocation Revenue
(Mission Bays Redevelopment Project) 5.000% 8/1/29 460 534
San Francisco CA City & County Redevelopment
Financing Authority Tax Allocation Revenue
(Mission Bays Redevelopment Project) 5.000% 8/1/29 745 893
San Francisco CA City & County Redevelopment
Financing Authority Tax Allocation Revenue
(Mission Bays Redevelopment Project) 5.000% 8/1/30 550 655
San Francisco CA City & County Redevelopment
Financing Authority Tax Allocation Revenue
(Mission Bays Redevelopment Project) 5.000% 8/1/31 400 460
San Francisco CA City & County Redevelopment
Financing Authority Tax Allocation Revenue
(Mission Bays Redevelopment Project) 5.000% 8/1/31 710 841
San Francisco CA City & County Redevelopment
Financing Authority Tax Allocation Revenue
(Mission Bays Redevelopment Project) 5.000% 8/1/32 525 602
San Francisco CA City & County Redevelopment
Financing Authority Tax Allocation Revenue
(Mission Bays Redevelopment Project) 5.000% 8/1/32 450 531
San Francisco CA City & County Redevelopment
Financing Authority Tax Allocation Revenue
(Mission Bays Redevelopment Project) 5.000% 8/1/32 1,000 1,179
San Francisco CA City & County Redevelopment
Financing Authority Tax Allocation Revenue
(Mission Bays Redevelopment Project) 5.000% 8/1/32 860 1,014
San Francisco CA City & County Redevelopment
Financing Authority Tax Allocation Revenue
(Mission Bays Redevelopment Project) 5.000% 8/1/33 345 404
San Francisco CA City & County Redevelopment
Financing Authority Tax Allocation Revenue
(Mission Bays Redevelopment Project) 5.000% 8/1/33 660 774
San Francisco CA City & County Redevelopment
Financing Authority Tax Allocation Revenue
(Mission Bays Redevelopment Project) 5.000% 8/1/33 750 879
San Francisco CA City & County Redevelopment
Financing Authority Tax Allocation Revenue
(Mission Bays Redevelopment Project) 5.000% 8/1/34 225 256
San Francisco CA City & County Redevelopment
Financing Authority Tax Allocation Revenue
(Mission Bays Redevelopment Project) 5.000% 8/1/34 700 817
Face Market
Maturity Amount Value•
Coupon Date ($000) ($000)
116

California Intermediate-Term Tax-Exempt Fund
San Francisco CA City & County Redevelopment
Financing Authority Tax Allocation Revenue
(Mission Bays Redevelopment Project) 5.000% 8/1/34 660 770
San Francisco CA City & County Redevelopment
Financing Authority Tax Allocation Revenue
(Mission Bays Redevelopment Project) 5.000% 8/1/34 555 648
San Francisco CA City & County Redevelopment
Financing Authority Tax Allocation Revenue
(Mission Bays Redevelopment Project) 5.000% 8/1/35 400 464
San Francisco CA City & County Redevelopment
Financing Authority Tax Allocation Revenue
(Mission Bays Redevelopment Project) 5.000% 8/1/35 900 1,045
San Francisco CA City & County Redevelopment
Financing Authority Tax Allocation Revenue
(Mission Bays Redevelopment Project) 5.000% 8/1/35 595 690
San Francisco CA City & County Redevelopment
Financing Authority Tax Allocation Revenue
(Mission Bays Redevelopment Project) 5.000% 8/1/36 350 405
San Francisco CA City & County Redevelopment
Financing Authority Tax Allocation Revenue
(Mission Bays Redevelopment Project) 5.000% 8/1/36 625 722
San Francisco CA City & County Redevelopment
Financing Authority Tax Allocation Revenue
(Mission Bays Redevelopment Project) 5.000% 8/1/36 780 901
San Francisco CA City & County Redevelopment
Financing Authority Tax Allocation Revenue
(Redevelopment Projects) 5.000% 8/1/21 2,000 2,294
San Francisco CA City & County Unified School
District GO 5.000% 6/15/24 1,080 1,333
San Francisco CA City & County Unified School
District GO 5.000% 6/15/27 6,445 7,767
San Francisco CA City & County Unified School
District GO 5.000% 6/15/28 10,170 12,189
San Francisco CA City & County Unified School
District GO 4.000% 6/15/30 2,470 2,589
San Francisco CA City & County Unified School
District GO 5.000% 6/15/31 7,965 8,760
San Francisco CA City & County Unified School
District GO 4.000% 6/15/32 5,300 5,659
San Francisco CA Community College District GO 3.000% 6/15/17 11,380 11,390
San Francisco CA Municipal Transportation
Agency Revenue 5.000% 3/1/29 1,585 1,852
San Francisco CA Municipal Transportation
Agency Revenue 5.000% 3/1/32 2,170 2,509
San Francisco CA Municipal Transportation
Agency Revenue 5.000% 3/1/33 3,025 3,484
San Francisco CA Municipal Transportation
Agency Revenue 5.000% 3/1/34 1,640 1,911
San Joaquin County CA Delta Community
College District Election GO 0.000% 8/1/26 (4) 15,500 9,774
San Joaquin County CA Delta Community
College District Election GO 0.000% 8/1/27 (4) 15,500 9,203
San Joaquin County CA Transportation
Authority Revenue 4.000% 3/1/19 2,000 2,110
Face Market
Maturity Amount Value•
Coupon Date ($000) ($000)
117

California Intermediate-Term Tax-Exempt Fund
San Joaquin County CA Transportation
Authority Revenue 4.000% 3/1/20 1,000 1,084
San Joaquin County CA Transportation
Authority Revenue 4.000% 3/1/21 710 788
San Joaquin County CA Transportation
Authority Revenue 5.000% 3/1/22 300 353
San Joaquin County CA Transportation
Authority Revenue 5.000% 3/1/33 7,010 8,477
San Joaquin County CA Transportation
Authority Revenue 5.000% 3/1/35 5,750 6,893
San Joaquin Hills CA Transportation Corridor
Agency Toll Road Revenue 0.000% 1/1/23 (ETM) 16,000 14,703
San Joaquin Hills CA Transportation Corridor
Agency Toll Road Revenue 0.000% 1/15/24 (14) 7,000 5,638
San Joaquin Hills CA Transportation Corridor
Agency Toll Road Revenue 0.000% 1/1/25 (ETM) 14,750 12,828
San Joaquin Hills CA Transportation Corridor
Agency Toll Road Revenue 5.000% 1/15/29 4,375 4,924
San Joaquin Hills CA Transportation Corridor
Agency Toll Road Revenue 5.000% 1/15/34 2,435 2,700
San Jose CA Airport Revenue 5.000% 3/1/26 4,610 5,205
San Jose CA Airport Revenue 5.000% 3/1/29 200 243
San Jose CA Airport Revenue 5.000% 3/1/30 250 302
San Jose CA Airport Revenue 5.000% 3/1/33 500 593
San Jose CA Airport Revenue 5.000% 3/1/34 500 591
San Jose CA Airport Revenue 5.000% 3/1/36 3,000 3,520
San Jose CA Redevelopment Agency Tax
Allocation Revenue 5.000% 8/1/19 (14) 1,150 1,165
San Jose CA Redevelopment Agency Tax
Allocation Revenue 5.000% 8/1/20 (2) 8,000 8,054
San Jose CA Redevelopment Agency Tax
Allocation Revenue 5.000% 8/1/21 (2) 2,495 2,512
San Jose CA Redevelopment Agency Tax
Allocation Revenue 5.000% 8/1/21 1,270 1,414
San Jose CA Redevelopment Agency Tax
Allocation Revenue 5.000% 8/1/22 (2) 5,100 5,134
San Jose CA Redevelopment Agency Tax
Allocation Revenue 4.250% 8/1/23 (10) 50 50
San Jose CA Redevelopment Agency Tax
Allocation Revenue 5.000% 8/1/23 1,140 1,268
San Jose CA Redevelopment Agency Tax
Allocation Revenue 5.000% 8/1/24 (14) 16,360 16,470
San Jose CA Redevelopment Agency Tax
Allocation Revenue 5.000% 8/1/25 (14) 11,505 11,582
San Jose CA Redevelopment Agency Tax
Allocation Revenue 5.125% 8/1/25 570 635
San Jose CA Redevelopment Agency Tax
Allocation Revenue 5.250% 8/1/26 800 894
San Jose CA Redevelopment Agency Tax
Allocation Revenue 5.375% 8/1/29 1,355 1,514
San Jose CA Redevelopment Agency Tax
Allocation Revenue (Merged Area
Redevelopment Project) 5.000% 8/1/17 (14) 600 602
Face Market
Maturity Amount Value•
Coupon Date ($000) ($000)
118

California Intermediate-Term Tax-Exempt Fund
San Jose CA Redevelopment Agency Tax
Allocation Revenue (Merged Area
Redevelopment Project) 4.500% 8/1/21 (2) 1,000 1,005
San Jose CA Special Hotel Tax Revenue
(Convention Center Expansion &
Renovation Project) 6.125% 5/1/31 5,000 5,767
San Jose CA Unified School District Santa Clara
County GO 5.000% 8/1/19 1,000 1,089
San Jose CA Unified School District Santa Clara
County GO 5.000% 8/1/20 1,000 1,126
San Juan CA Unified School District GO 2.000% 8/1/18 2,780 2,818
San Juan CA Unified School District GO 2.000% 8/1/18 2,850 2,889
San Juan CA Unified School District GO 2.000% 8/1/18 6,595 6,686
San Juan CA Unified School District GO 2.000% 8/1/19 14,365 14,707
San Juan CA Unified School District GO 2.500% 8/1/19 9,725 10,061
San Juan CA Unified School District GO 0.000% 8/1/25 (4) 10,000 8,336
San Juan CA Unified School District GO 0.000% 8/1/26 (4) 12,215 9,729
San Luis & Delta Mendota CA Water Authority
Revenue 5.000% 3/1/24 (15) 855 1,006
San Luis & Delta Mendota CA Water Authority
Revenue 5.000% 3/1/25 (15) 970 1,141
San Luis & Delta Mendota CA Water Authority
Revenue 5.000% 3/1/26 (15) 500 587
San Luis & Delta Mendota CA Water Authority
Revenue 5.000% 3/1/27 (15) 1,070 1,245
San Luis & Delta Mendota CA Water Authority
Revenue 5.000% 3/1/28 (15) 600 694
San Luis & Delta Mendota CA Water Authority
Revenue 5.000% 3/1/33 (15) 2,790 3,153
San Marcos CA Unified School District GO 0.000% 8/1/25 2,300 1,908
San Marcos CA Unified School District GO 0.000% 8/1/30 2,000 1,325
San Marcos CA Unified School District GO 0.000% 8/1/31 2,000 1,260
San Marcos CA Unified School District GO 0.000% 8/1/32 2,500 1,490
San Mateo CA Union High School District GO 0.000% 9/1/23 (Prere.) 2,725 2,364
San Mateo CA Union High School District GO 5.000% 9/1/23 (Prere.) 1,315 1,600
San Mateo CA Union High School District GO 5.000% 9/1/23 (Prere.) 725 882
San Mateo CA Union High School District GO 0.000% 9/1/24 2,665 2,248
San Mateo CA Union High School District GO 5.000% 9/1/30 1,285 1,515
San Mateo CA Union High School District GO 5.000% 9/1/31 715 838
San Mateo CA Union High School District GO 4.000% 9/1/32 3,155 3,471
San Mateo County CA Community College
District GO 0.000% 9/1/21 (14) 4,645 4,361
San Mateo County CA Community College
District GO 0.000% 9/1/22 (14) 5,675 5,214
San Mateo County CA Community College
District GO 0.000% 9/1/24 (14) 2,825 2,451
San Mateo County CA Community College
District GO 0.000% 9/1/25 (14) 4,000 3,349
San Mateo County CA Joint Powers Financing
Authority Lease Revenue (Maple Street
Correctional Center) 5.000% 6/15/23 1,000 1,202
San Mateo County CA Joint Powers Financing
Authority Lease Revenue (Maple Street
Correctional Center) 5.000% 6/15/27 2,000 2,403
Face Market
Maturity Amount Value•
Coupon Date ($000) ($000)
119

California Intermediate-Term Tax-Exempt Fund
San Mateo County CA Joint Powers Financing
Authority Lease Revenue (Youth Services
Campus) 4.625% 7/15/18 (Prere.) 2,455 2,562
San Mateo County CA Joint Powers Financing
Authority Lease Revenue (Youth Services
Campus) 4.000% 7/15/19 3,250 3,460
San Mateo County CA Joint Powers Financing
Authority Lease Revenue (Youth Services
Campus) 4.000% 7/15/20 3,095 3,376
San Mateo County CA Joint Powers Financing
Authority Lease Revenue (Youth Services
Campus) 4.000% 7/15/21 1,000 1,114
San Mateo County CA Joint Powers Financing
Authority Lease Revenue (Youth Services
Campus) 5.000% 7/15/22 1,245 1,470
San Mateo County CA Joint Powers Financing
Authority Lease Revenue (Youth Services
Campus) 5.000% 7/15/23 1,505 1,812
San Mateo County CA Joint Powers Financing
Authority Lease Revenue (Youth Services
Campus) 4.000% 7/15/33 5,000 5,405
San Mateo County CA Transportation Authority
Revenue 4.000% 6/1/20 770 839
San Mateo County CA Transportation Authority
Revenue 5.000% 6/1/20 750 841
San Mateo County CA Transportation Authority
Revenue 5.000% 6/1/21 1,350 1,561
San Mateo County CA Transportation Authority
Revenue 4.000% 6/1/22 600 681
San Mateo County CA Transportation Authority
Revenue 5.000% 6/1/22 750 891
San Mateo County CA Transportation Authority
Revenue 4.000% 6/1/23 1,520 1,750
San Mateo County CA Transportation Authority
Revenue 5.000% 6/1/23 840 1,020
San Mateo County CA Transportation Authority
Revenue 4.000% 6/1/24 750 872
San Mateo County CA Transportation Authority
Revenue 5.000% 6/1/24 1,200 1,483
San Mateo County CA Transportation Authority
Revenue 5.000% 6/1/25 1,200 1,504
San Mateo County CA Transportation Authority
Revenue 5.000% 6/1/31 1,365 1,642
San Mateo-Foster City CA School District GO 4.000% 8/1/19 1,000 1,067
San Mateo-Foster City CA School District GO 4.000% 8/1/34 1,580 1,694
San Pablo CA Redevelopment Agency Successor
Agency Tax Allocation Revenue 4.000% 6/15/18 (4) 925 954
San Pablo CA Redevelopment Agency Successor
Agency Tax Allocation Revenue 5.000% 6/15/22 (4) 1,000 1,170
San Pablo CA Redevelopment Agency Successor
Agency Tax Allocation Revenue 5.000% 6/15/23 (4) 1,200 1,432
San Pablo CA Redevelopment Agency Successor
Agency Tax Allocation Revenue 5.000% 6/15/27 (4) 1,770 2,091
Face Market
Maturity Amount Value•
Coupon Date ($000) ($000)
120

California Intermediate-Term Tax-Exempt Fund
San Pablo CA Redevelopment Agency Successor
Agency Tax Allocation Revenue 5.000% 6/15/28 (4) 1,860 2,183
San Pablo CA Redevelopment Agency Successor
Agency Tax Allocation Revenue 5.000% 6/15/30 (4) 2,275 2,634
San Rafael CA High School District GO 0.000% 8/1/29 (14) 6,505 4,501
San Ramon CA Public Financing Authority Tax
Allocation Revenue 0.000% 2/1/25 (2) 1,020 829
San Ramon CA Public Financing Authority Tax
Allocation Revenue 0.000% 2/1/27 (2) 1,700 1,254
San Ramon CA Public Financing Authority Tax
Allocation Revenue 0.000% 2/1/28 (2) 1,800 1,261
San Ramon CA Redevelopment Agency
Successor Agency Tax Allocation Revenue 5.000% 2/1/25 (15) 1,520 1,856
San Ramon CA Redevelopment Agency
Successor Agency Tax Allocation Revenue 5.000% 2/1/26 (15) 1,595 1,925
San Ramon CA Redevelopment Agency
Successor Agency Tax Allocation Revenue 5.000% 2/1/27 (15) 1,670 1,991
San Ramon Valley CA Unified School District GO 4.000% 8/1/32 2,000 2,174
Santa Ana CA Community Redevelopment Agency
Tax Allocation Revenue (South Main Street) 5.000% 9/1/18 (14) 2,685 2,694
Santa Ana CA Unified School District GO 0.000% 8/1/31 (14) 3,775 2,345
Santa Clara CA Electric Revenue 5.000% 7/1/30 1,000 1,135
Santa Clara CA Electric Revenue 5.250% 7/1/32 2,500 2,868
Santa Clara CA Unified School District GO 5.000% 7/1/21 2,290 2,646
Santa Clara CA Unified School District GO 5.000% 7/1/22 2,060 2,441
Santa Clara CA Unified School District GO 5.000% 7/1/23 2,185 2,647
Santa Clara CA Unified School District GO 5.000% 7/1/25 3,120 3,811
Santa Clara CA Unified School District GO 5.000% 7/1/25 3,595 4,392
Santa Clara CA Unified School District GO 5.000% 7/1/28 3,775 4,210
Santa Clara CA Unified School District GO 5.000% 7/1/29 4,115 4,590
Santa Clara CA Unified School District GO 5.000% 7/1/30 4,405 4,892
Santa Clara CA Unified School District GO 5.000% 7/1/31 4,715 5,237
Santa Clara County CA East Side Union High
School District GO 5.000% 8/1/17 5,410 5,448
Santa Clara County CA East Side Union High
School District GO 5.000% 8/1/18 5,690 5,966
Santa Clara County CA Financing Authority Lease
Revenue (Multiple Facilities Projects) 5.000% 11/15/17 11,540 11,763
Santa Clara County CA Financing Authority Lease
Revenue (Multiple Facilities Projects) 5.000% 5/15/18 (Prere.) 10,000 10,405
Santa Clara County CA Financing Authority Lease
Revenue (Multiple Facilities Projects) 5.000% 5/15/20 4,140 4,626
Santa Clara County CA Financing Authority Lease
Revenue (Multiple Facilities Projects) 5.000% 5/15/21 5,770 6,643
Santa Clara County CA Financing Authority Lease
Revenue (Multiple Facilities Projects) 5.000% 5/15/22 6,060 7,159
Santa Clara County CA Financing Authority
Revenue 5.000% 5/15/22 4,090 4,832
Santa Clara County CA Financing Authority
Revenue 5.000% 5/15/24 6,260 7,701
Santa Clara County CA Financing Authority
Revenue 5.000% 5/15/25 6,510 8,127
Santa Clara County CA Financing Authority
Revenue 5.000% 5/15/26 6,800 8,399
Face Market
Maturity Amount Value•
Coupon Date ($000) ($000)
121

California Intermediate-Term Tax-Exempt Fund
Santa Clara County CA GO 5.000% 8/1/28 8,830 10,356
Santa Clara Valley CA Joint Powers Authority
Revenue 5.000% 8/1/22 685 813
Santa Clara Valley CA Joint Powers Authority
Revenue 5.000% 8/1/23 375 455
Santa Clara Valley CA Joint Powers Authority
Revenue 5.000% 8/1/24 275 339
Santa Clara Valley CA Joint Powers Authority
Revenue 4.000% 8/1/25 500 588
Santa Clara Valley CA Joint Powers Authority
Revenue 4.000% 8/1/26 550 650
Santa Clara Valley CA Joint Powers Authority
Revenue 5.000% 8/1/29 525 647
Santa Clara Valley CA Joint Powers Authority
Revenue 5.000% 8/1/30 1,100 1,346
Santa Clara Valley CA Water District COP 4.000% 6/1/18 520 537
Santa Clara Valley CA Water District COP 4.000% 6/1/19 1,000 1,063
Santa Clara Valley CA Water District COP 5.000% 6/1/20 575 644
Santa Clara Valley CA Water District COP 5.000% 6/1/21 450 520
Santa Clara Valley CA Water District COP 5.000% 6/1/22 450 533
Santa Clara Valley CA Water District COP 5.000% 6/1/23 750 909
Santa Clarita CA Community College District GO 0.000% 8/1/29 (4) 2,480 1,716
Santa Clarita CA Community College District GO 5.000% 8/1/32 5,450 6,258
Santa Monica CA Community College District GO 0.000% 8/1/24 4,500 3,880
Santa Monica CA Community College District GO 0.000% 8/1/26 11,025 8,845
Santa Monica CA Community College District GO 4.000% 8/1/30 2,000 2,186
Santa Monica CA Community College District GO 4.000% 8/1/32 2,565 2,783
Santa Monica CA Community College District GO 4.000% 8/1/33 3,510 3,784
Santa Monica-Malibu CA Unified School
District GO 4.000% 8/1/31 1,600 1,761
Santa Monica-Malibu CA Unified School
District GO 4.000% 8/1/33 1,150 1,249
Santa Rosa CA High School District GO 4.000% 5/1/18 2,230 2,294
Santa Rosa CA High School District GO 5.000% 5/1/19 2,040 2,199
Santa Rosa CA High School District GO 5.000% 5/1/20 1,150 1,283
Santa Rosa CA Wastewater Revenue 5.000% 9/1/21 1,250 1,451
Santa Rosa CA Wastewater Revenue 5.000% 9/1/22 1,010 1,201
Santa Rosa CA Wastewater Revenue 5.000% 9/1/23 900 1,094
Santa Rosa CA Wastewater Revenue 5.000% 9/1/24 800 988
Santa Rosa CA Wastewater Revenue 5.000% 9/1/25 750 939
Santa Rosa CA Wastewater Revenue 5.000% 9/1/26 790 1,000
Santa Rosa CA Wastewater Revenue 0.000% 9/1/28 (4) 11,095 7,928
Santa Rosa CA Wastewater Revenue 5.000% 9/1/29 2,870 3,306
Santa Rosa CA Wastewater Revenue 5.000% 9/1/30 3,055 3,514
Santa Rosa CA Wastewater Revenue 5.000% 9/1/33 1,425 1,636
Santee CA CDC Successor Agency Tax
Allocation Revenue 4.000% 8/1/20 590 638
Santee CA CDC Successor Agency Tax
Allocation Revenue 4.000% 8/1/21 600 660
Santee CA CDC Successor Agency Tax
Allocation Revenue 5.000% 8/1/22 570 663
Signal Hill CA Redevelopment Agency
Successor Agency Tax Allocation Revenue 3.000% 10/1/17 1,915 1,928
Face Market
Maturity Amount Value•
Coupon Date ($000) ($000)
122

California Intermediate-Term Tax-Exempt Fund
Signal Hill CA Redevelopment Agency Successor
Agency Tax Allocation Revenue 4.000% 10/1/18 1,960 2,035
Signal Hill CA Redevelopment Agency Successor
Agency Tax Allocation Revenue 5.000% 10/1/19 2,040 2,216
Signal Hill CA Redevelopment Agency Successor
Agency Tax Allocation Revenue 5.000% 10/1/20 (15) 2,120 2,382
Silicon Valley CA Clean Water Wastewater
Revenue 5.000% 8/1/20 350 394
Silicon Valley CA Clean Water Wastewater
Revenue 5.000% 8/1/21 725 841
Silicon Valley CA Clean Water Wastewater
Revenue 5.000% 8/1/24 1,000 1,236
Silicon Valley CA Clean Water Wastewater
Revenue 5.000% 8/1/28 1,000 1,218
Silicon Valley CA Clean Water Wastewater
Revenue 5.000% 8/1/35 1,000 1,176
Simi Valley CA Unified School District GO 5.000% 8/1/20 1,500 1,686
Simi Valley CA Unified School District GO 5.000% 8/1/21 1,220 1,412
Simi Valley CA Unified School District GO 5.000% 8/1/22 1,500 1,779
Simi Valley CA Unified School District GO 5.000% 8/1/23 2,500 3,031
Simi Valley CA Unified School District GO 5.000% 8/1/24 3,435 4,233
Simi Valley CA Unified School District GO 5.000% 8/1/25 2,785 3,481
Simi Valley CA Unified School District GO 0.000% 8/1/26 (4) 3,030 2,402
Simi Valley CA Unified School District GO 5.000% 8/1/26 2,000 2,525
Simi Valley CA Unified School District GO 0.000% 8/1/27 (4) 2,900 2,198
Solana Beach CA School District Special Tax
Revenue 5.000% 9/1/29 2,125 2,372
Solana Beach CA School District Special Tax
Revenue 5.000% 9/1/32 2,665 2,942
Solano County CA COP 5.000% 11/1/17 (14) 4,110 4,178
Solano County CA COP 5.000% 11/1/18 (14) 3,810 3,874
Solano County CA COP 5.000% 11/1/19 (14) 3,995 4,062
Solano County CA COP 5.000% 11/1/20 (14) 4,195 4,266
Solano County CA COP 5.000% 11/1/21 (14) 4,405 4,479
Sonoma County CA Transportation Authority
Sales Tax Revenue 5.000% 12/1/20 1,405 1,597
Sonoma County CA Transportation Authority
Sales Tax Revenue 5.000% 12/1/22 2,445 2,925
South Orange County CA Public Financing
Authority Special Tax Revenue 5.000% 8/15/23 1,000 1,142
South Orange County CA Public Financing
Authority Special Tax Revenue 5.000% 8/15/25 1,250 1,4221,2 South San Francisco CA Unified School District
GO TOB PUT 0.830% 6/22/17 6,490 6,490
Southern California Public Power Authority
Revenue 5.000% 1/1/19 (Prere.) 4,500 4,791
Southern California Public Power Authority
Revenue 5.000% 7/1/23 500 531
Southern California Public Power Authority
Revenue 5.000% 7/1/25 6,735 8,299
Southern California Public Power Authority
Revenue 5.000% 7/1/28 10,000 11,147
Southern California Public Power Authority
Revenue 5.000% 7/1/29 5,000 5,561
Face Market
Maturity Amount Value•
Coupon Date ($000) ($000)
123
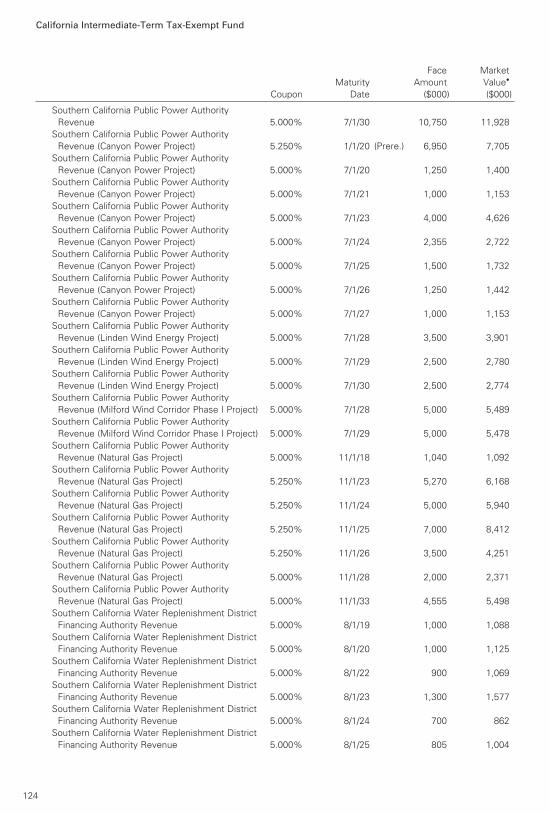
California Intermediate-Term Tax-Exempt Fund
Southern California Public Power Authority
Revenue 5.000% 7/1/30 10,750 11,928
Southern California Public Power Authority
Revenue (Canyon Power Project) 5.250% 1/1/20 (Prere.) 6,950 7,705
Southern California Public Power Authority
Revenue (Canyon Power Project) 5.000% 7/1/20 1,250 1,400
Southern California Public Power Authority
Revenue (Canyon Power Project) 5.000% 7/1/21 1,000 1,153
Southern California Public Power Authority
Revenue (Canyon Power Project) 5.000% 7/1/23 4,000 4,626
Southern California Public Power Authority
Revenue (Canyon Power Project) 5.000% 7/1/24 2,355 2,722
Southern California Public Power Authority
Revenue (Canyon Power Project) 5.000% 7/1/25 1,500 1,732
Southern California Public Power Authority
Revenue (Canyon Power Project) 5.000% 7/1/26 1,250 1,442
Southern California Public Power Authority
Revenue (Canyon Power Project) 5.000% 7/1/27 1,000 1,153
Southern California Public Power Authority
Revenue (Linden Wind Energy Project) 5.000% 7/1/28 3,500 3,901
Southern California Public Power Authority
Revenue (Linden Wind Energy Project) 5.000% 7/1/29 2,500 2,780
Southern California Public Power Authority
Revenue (Linden Wind Energy Project) 5.000% 7/1/30 2,500 2,774
Southern California Public Power Authority
Revenue (Milford Wind Corridor Phase I Project) 5.000% 7/1/28 5,000 5,489
Southern California Public Power Authority
Revenue (Milford Wind Corridor Phase I Project) 5.000% 7/1/29 5,000 5,478
Southern California Public Power Authority
Revenue (Natural Gas Project) 5.000% 11/1/18 1,040 1,092
Southern California Public Power Authority
Revenue (Natural Gas Project) 5.250% 11/1/23 5,270 6,168
Southern California Public Power Authority
Revenue (Natural Gas Project) 5.250% 11/1/24 5,000 5,940
Southern California Public Power Authority
Revenue (Natural Gas Project) 5.250% 11/1/25 7,000 8,412
Southern California Public Power Authority
Revenue (Natural Gas Project) 5.250% 11/1/26 3,500 4,251
Southern California Public Power Authority
Revenue (Natural Gas Project) 5.000% 11/1/28 2,000 2,371
Southern California Public Power Authority
Revenue (Natural Gas Project) 5.000% 11/1/33 4,555 5,498
Southern California Water Replenishment District
Financing Authority Revenue 5.000% 8/1/19 1,000 1,088
Southern California Water Replenishment District
Financing Authority Revenue 5.000% 8/1/20 1,000 1,125
Southern California Water Replenishment District
Financing Authority Revenue 5.000% 8/1/22 900 1,069
Southern California Water Replenishment District
Financing Authority Revenue 5.000% 8/1/23 1,300 1,577
Southern California Water Replenishment District
Financing Authority Revenue 5.000% 8/1/24 700 862
Southern California Water Replenishment District
Financing Authority Revenue 5.000% 8/1/25 805 1,004
Face Market
Maturity Amount Value•
Coupon Date ($000) ($000)
124

California Intermediate-Term Tax-Exempt Fund
Southern California Water Replenishment District
Financing Authority Revenue 5.000% 8/1/26 725 896
Southern California Water Replenishment District
Financing Authority Revenue 5.000% 8/1/27 1,315 1,610
Southern California Water Replenishment District
Financing Authority Revenue 5.000% 8/1/29 1,500 1,818
Southern California Water Replenishment District
Financing Authority Revenue 5.000% 8/1/30 1,120 1,351
Southern California Water Replenishment District
Financing Authority Revenue 5.000% 8/1/31 1,470 1,763
Southern California Water Replenishment District
Financing Authority Revenue 5.000% 8/1/32 2,410 2,876
Southern California Water Replenishment District
Financing Authority Revenue 5.000% 8/1/33 2,325 2,761
Southern California Water Replenishment District
Financing Authority Revenue 5.000% 8/1/34 3,400 4,022
Southern California Water Replenishment District
Financing Authority Revenue 5.000% 8/1/35 2,840 3,348
Southern California Water Replenishment District
Financing Authority Revenue 5.000% 8/1/36 3,000 3,527
Southwestern California Community College
District GO 0.000% 8/1/24 750 647
Southwestern California Community College
District GO 0.000% 8/1/25 1,090 888
Southwestern California Community College
District GO 0.000% 8/1/26 2,000 1,543
Southwestern California Community College
District GO 0.000% 8/1/27 2,000 1,465
Southwestern California Community College
District GO 0.000% 8/1/28 2,535 1,758
Southwestern California Community College
District GO 5.000% 8/1/29 1,000 1,226
Southwestern California Community College
District GO 4.000% 8/1/32 1,000 1,091
Southwestern California Community College
District GO 4.000% 8/1/33 2,150 2,328
Southwestern California Community College
District GO 4.000% 8/1/34 1,750 1,879
Southwestern California Community College
District GO 4.000% 8/1/35 1,500 1,606
St. Helena CA Unified School District GO 0.000% 8/1/27 4,550 4,081
State Center California Community College
District GO 5.000% 8/1/17 (Prere.) 5,880 5,921
Stockton CA Public Financing Authority Revenue 4.000% 9/2/20 (15) 580 628
Stockton CA Public Financing Authority Revenue 4.000% 9/2/21 (15) 450 496
Stockton CA Public Financing Authority Revenue 4.000% 9/2/22 (15) 950 1,059
Stockton CA Public Financing Authority Revenue 4.000% 9/2/23 (15) 660 743
Stockton CA Public Financing Authority Revenue 4.000% 9/2/24 (15) 1,025 1,163
Stockton CA Public Financing Authority Revenue 4.000% 9/2/25 (15) 1,075 1,223
Stockton CA Public Financing Authority Revenue 4.000% 9/2/26 (15) 1,115 1,267
Stockton CA Public Financing Authority
Wastewater Revenue 5.000% 9/1/22 (15) 1,000 1,175
Stockton CA Public Financing Authority
Wastewater Revenue 5.000% 9/1/23 (15) 1,000 1,198
Face Market
Maturity Amount Value•
Coupon Date ($000) ($000)
125
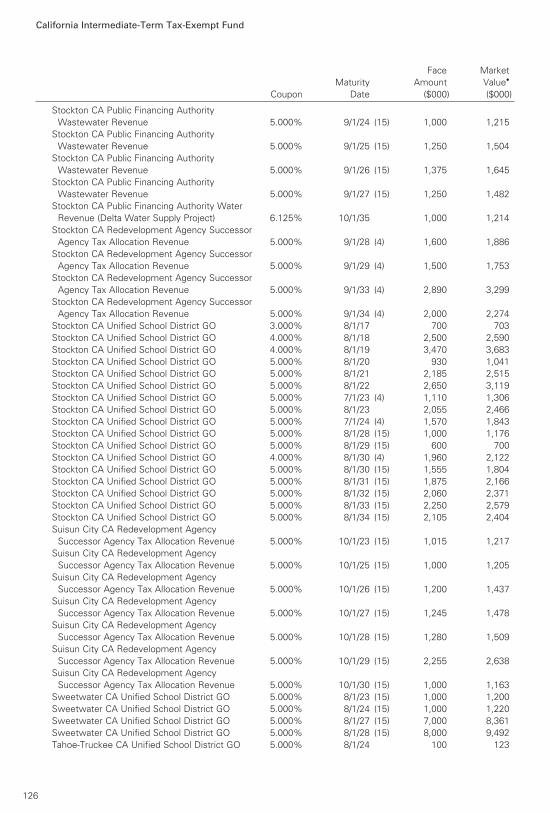
California Intermediate-Term Tax-Exempt Fund
Stockton CA Public Financing Authority
Wastewater Revenue 5.000% 9/1/24 (15) 1,000 1,215
Stockton CA Public Financing Authority
Wastewater Revenue 5.000% 9/1/25 (15) 1,250 1,504
Stockton CA Public Financing Authority
Wastewater Revenue 5.000% 9/1/26 (15) 1,375 1,645
Stockton CA Public Financing Authority
Wastewater Revenue 5.000% 9/1/27 (15) 1,250 1,482
Stockton CA Public Financing Authority Water
Revenue (Delta Water Supply Project) 6.125% 10/1/35 1,000 1,214
Stockton CA Redevelopment Agency Successor
Agency Tax Allocation Revenue 5.000% 9/1/28 (4) 1,600 1,886
Stockton CA Redevelopment Agency Successor
Agency Tax Allocation Revenue 5.000% 9/1/29 (4) 1,500 1,753
Stockton CA Redevelopment Agency Successor
Agency Tax Allocation Revenue 5.000% 9/1/33 (4) 2,890 3,299
Stockton CA Redevelopment Agency Successor
Agency Tax Allocation Revenue 5.000% 9/1/34 (4) 2,000 2,274
Stockton CA Unified School District GO 3.000% 8/1/17 700 703
Stockton CA Unified School District GO 4.000% 8/1/18 2,500 2,590
Stockton CA Unified School District GO 4.000% 8/1/19 3,470 3,683
Stockton CA Unified School District GO 5.000% 8/1/20 930 1,041
Stockton CA Unified School District GO 5.000% 8/1/21 2,185 2,515
Stockton CA Unified School District GO 5.000% 8/1/22 2,650 3,119
Stockton CA Unified School District GO 5.000% 7/1/23 (4) 1,110 1,306
Stockton CA Unified School District GO 5.000% 8/1/23 2,055 2,466
Stockton CA Unified School District GO 5.000% 7/1/24 (4) 1,570 1,843
Stockton CA Unified School District GO 5.000% 8/1/28 (15) 1,000 1,176
Stockton CA Unified School District GO 5.000% 8/1/29 (15) 600 700
Stockton CA Unified School District GO 4.000% 8/1/30 (4) 1,960 2,122
Stockton CA Unified School District GO 5.000% 8/1/30 (15) 1,555 1,804
Stockton CA Unified School District GO 5.000% 8/1/31 (15) 1,875 2,166
Stockton CA Unified School District GO 5.000% 8/1/32 (15) 2,060 2,371
Stockton CA Unified School District GO 5.000% 8/1/33 (15) 2,250 2,579
Stockton CA Unified School District GO 5.000% 8/1/34 (15) 2,105 2,404
Suisun City CA Redevelopment Agency
Successor Agency Tax Allocation Revenue 5.000% 10/1/23 (15) 1,015 1,217
Suisun City CA Redevelopment Agency
Successor Agency Tax Allocation Revenue 5.000% 10/1/25 (15) 1,000 1,205
Suisun City CA Redevelopment Agency
Successor Agency Tax Allocation Revenue 5.000% 10/1/26 (15) 1,200 1,437
Suisun City CA Redevelopment Agency
Successor Agency Tax Allocation Revenue 5.000% 10/1/27 (15) 1,245 1,478
Suisun City CA Redevelopment Agency
Successor Agency Tax Allocation Revenue 5.000% 10/1/28 (15) 1,280 1,509
Suisun City CA Redevelopment Agency
Successor Agency Tax Allocation Revenue 5.000% 10/1/29 (15) 2,255 2,638
Suisun City CA Redevelopment Agency
Successor Agency Tax Allocation Revenue 5.000% 10/1/30 (15) 1,000 1,163
Sweetwater CA Unified School District GO 5.000% 8/1/23 (15) 1,000 1,200
Sweetwater CA Unified School District GO 5.000% 8/1/24 (15) 1,000 1,220
Sweetwater CA Unified School District GO 5.000% 8/1/27 (15) 7,000 8,361
Sweetwater CA Unified School District GO 5.000% 8/1/28 (15) 8,000 9,492
Tahoe-Truckee CA Unified School District GO 5.000% 8/1/24 100 123
Face Market
Maturity Amount Value•
Coupon Date ($000) ($000)
126

California Intermediate-Term Tax-Exempt Fund
Tahoe-Truckee CA Unified School District GO 5.000% 8/1/25 200 250
Tahoe-Truckee CA Unified School District GO 5.000% 8/1/26 330 416
Temecula Valley CA Unified School District GO 0.000% 8/1/32 (15) 2,000 2,000
Tracy CA Community Development Agency
Successor Agency Tax Allocation Revenue 3.000% 8/1/17 275 276
Tracy CA Community Development Agency
Successor Agency Tax Allocation Revenue 4.000% 8/1/18 350 363
Tracy CA Community Development Agency
Successor Agency Tax Allocation Revenue 5.000% 8/1/19 250 271
Tracy CA Community Development Agency
Successor Agency Tax Allocation Revenue 5.000% 8/1/20 250 279
Tracy CA Community Development Agency
Successor Agency Tax Allocation Revenue 5.000% 8/1/21 900 1,031
Tracy CA Community Development Agency
Successor Agency Tax Allocation Revenue 5.000% 8/1/23 (4) 400 477
Tracy CA Community Development Agency
Successor Agency Tax Allocation Revenue 5.000% 8/1/24 (4) 400 484
Tracy CA Community Development Agency
Successor Agency Tax Allocation Revenue 5.000% 8/1/25 (4) 960 1,177
Tuolumne CA Wind Project Authority Revenue 5.250% 1/1/19 (Prere.) 5,115 5,466
Turlock CA Irrigation District Revenue 5.000% 1/1/20 (Prere.) 1,620 1,788
Turlock CA Irrigation District Revenue 5.000% 1/1/20 (Prere.) 2,105 2,324
Turlock CA Irrigation District Revenue 5.000% 1/1/21 2,185 2,404
Turlock CA Irrigation District Revenue 5.000% 1/1/22 3,310 3,639
Turlock CA Irrigation District Revenue 5.000% 1/1/28 7,020 7,932
Turlock CA Irrigation District Revenue 5.000% 1/1/29 6,400 7,224
Turlock CA Irrigation District Revenue 5.000% 1/1/30 7,770 8,733
Tustin CA Unified School District Special Tax
Revenue 5.000% 9/1/22 1,390 1,595
Tustin CA Unified School District Special Tax
Revenue 5.000% 9/1/23 750 875
Tustin CA Unified School District Special Tax
Revenue 5.000% 9/1/24 760 897
Tustin CA Unified School District Special Tax
Revenue 5.000% 9/1/25 2,820 3,356
Tustin CA Unified School District Special Tax
Revenue 5.000% 9/1/26 2,300 2,708
Tustin CA Unified School District Special Tax
Revenue 5.000% 9/1/27 3,915 4,574
Tustin CA Unified School District Special Tax
Revenue 5.000% 9/1/29 3,640 4,195
Tustin CA Unified School District Special Tax
Revenue 5.000% 9/1/30 3,500 4,010
Twin Rivers CA Unified School District GO 4.000% 8/1/17 300 302
Twin Rivers CA Unified School District GO 4.000% 8/1/17 275 276
Twin Rivers CA Unified School District GO 4.000% 8/1/18 625 648
Twin Rivers CA Unified School District GO 4.000% 8/1/18 600 622
Twin Rivers CA Unified School District GO 5.000% 8/1/19 1,645 1,785
Twin Rivers CA Unified School District GO 5.000% 8/1/19 600 651
Twin Rivers CA Unified School District GO 5.000% 8/1/20 (4) 475 532
Twin Rivers CA Unified School District GO 5.000% 8/1/20 (4) 750 840
Twin Rivers CA Unified School District GO 5.000% 8/1/21 (4) 550 633
Twin Rivers CA Unified School District GO 5.000% 8/1/21 (4) 850 978
Twin Rivers CA Unified School District GO 5.000% 8/1/22 (4) 500 588
Face Market
Maturity Amount Value•
Coupon Date ($000) ($000)
127

California Intermediate-Term Tax-Exempt Fund
Twin Rivers CA Unified School District GO 5.000% 8/1/22 (4) 625 736
Union City CA Community Redevelopment
Agency Successor Agency Tax Allocation
Revenue 5.000% 10/1/31 1,820 2,139
Union City CA Community Redevelopment Agency
Successor Agency Tax Allocation Revenue 5.000% 10/1/32 1,360 1,592
Union City CA Community Redevelopment Agency
Successor Agency Tax Allocation Revenue 5.000% 10/1/33 3,000 3,492
Union City CA Community Redevelopment Agency
Successor Agency Tax Allocation Revenue 5.000% 10/1/35 1,250 1,446
Union City CA Community Redevelopment Agency
Successor Agency Tax Allocation Revenue 5.000% 10/1/36 1,000 1,153
University of California Regents Medical Center
Pooled Revenue 5.000% 5/15/24 6,000 7,340
University of California Regents Medical Center
Pooled Revenue 4.000% 5/15/25 10,000 11,639
University of California Regents Medical Center
Pooled Revenue 4.000% 5/15/26 10,000 11,644
University of California Regents Medical Center
Pooled Revenue 5.000% 5/15/28 5,000 6,090
University of California Regents Medical Center
Pooled Revenue 5.000% 5/15/29 5,000 6,030
University of California Regents Medical Center
Pooled Revenue 5.000% 5/15/30 3,000 3,588
University of California Regents Medical Center
Pooled Revenue 5.000% 5/15/32 8,440 9,990
University of California Regents Medical Center
Pooled Revenue 5.000% 5/15/33 12,105 14,243
University of California Regents Medical Center
Pooled Revenue 5.000% 5/15/34 14,000 16,400
University of California Regents Medical Center
Pooled Revenue 5.000% 5/15/35 10,125 11,835
University of California Regents Medical Center
Pooled Revenue 4.500% 5/15/36 10,000 11,038
University of California Regents Medical Center
Revenue 5.000% 5/15/32 14,940 17,454
University of California Regents Medical Center
Revenue 5.000% 5/15/33 5,000 5,820
University of California Revenue 5.000% 5/15/19 5,250 5,678
University of California Revenue 5.000% 5/15/19 15,815 17,092
University of California Revenue 5.750% 5/15/19 (Prere.) 3,000 3,282
University of California Revenue 5.000% 5/15/20 4,360 4,884
University of California Revenue 5.000% 5/15/20 8,250 9,231
University of California Revenue 5.000% 5/15/21 3,000 3,465
University of California Revenue 5.000% 5/15/22 5,420 6,217
University of California Revenue 5.000% 5/15/23 1,865 2,263
University of California Revenue 5.000% 5/15/24 5,010 6,188
University of California Revenue 5.000% 5/15/25 2,400 2,997
University of California Revenue 5.000% 5/15/25 9,030 11,276
University of California Revenue 5.000% 5/15/27 7,000 8,590
University of California Revenue 5.000% 5/15/27 10,900 12,436
University of California Revenue 5.000% 5/15/28 9,125 11,110
University of California Revenue 5.000% 5/15/28 7,080 8,562
University of California Revenue 5.000% 5/15/28 11,680 13,311
Face Market
Maturity Amount Value•
Coupon Date ($000) ($000)
128

California Intermediate-Term Tax-Exempt Fund
University of California Revenue 5.000% 5/15/30 1,000 1,215
University of California Revenue 5.000% 5/15/30 1,400 1,654
University of California Revenue 5.000% 5/15/31 2,290 2,717
University of California Revenue 5.000% 5/15/32 14,020 16,138
University of California Revenue 5.000% 5/15/32 8,450 10,151
University of California Revenue 5.250% 5/15/32 5,000 6,007
University of California Revenue 5.000% 5/15/33 15,240 17,795
University of California Revenue 5.000% 5/15/33 10,110 11,805
University of California Revenue 5.000% 5/15/33 5,000 5,975
University of California Revenue 5.000% 5/15/33 6,995 8,277
University of California Revenue 5.000% 5/15/34 15,900 18,507
University of California Revenue 5.000% 5/15/34 3,915 4,658
University of California Revenue 5.000% 5/15/35 1,910 2,264
University of California Revenue 5.000% 5/15/36 5,425 6,412
University of California Revenue PUT 1.400% 5/15/21 4,300 4,301
University of California Revenue PUT 5.000% 5/15/23 52,095 62,839
University of California Revenue VRDO 0.740% 6/7/17 22,000 22,000
Upland CA Community Facilities District No.
2003-2 Improvement Area No. 1 Special Tax
Revenue 5.000% 9/1/31 1,110 1,229
Vacaville CA Redevelopment Agency Tax
Allocation Revenue 5.000% 9/1/22 600 701
Vacaville CA Redevelopment Agency Tax
Allocation Revenue 5.000% 9/1/23 575 683
Vacaville CA Redevelopment Agency Tax
Allocation Revenue 5.000% 9/1/24 1,325 1,595
Vacaville CA Redevelopment Agency Tax
Allocation Revenue 5.000% 9/1/25 1,390 1,656
Vacaville CA Redevelopment Agency Tax
Allocation Revenue 5.000% 9/1/26 1,460 1,722
Vacaville CA Redevelopment Agency Tax
Allocation Revenue 5.000% 9/1/27 1,200 1,405
Vacaville CA Redevelopment Agency Tax
Allocation Revenue 5.000% 9/1/28 1,200 1,393
Ventura County CA Community College
District GO 5.000% 8/1/25 1,915 2,207
Ventura County CA Community College
District GO 5.000% 8/1/27 2,205 2,539
Ventura County CA Community College
District GO 0.000% 8/1/28 15,000 11,002
Ventura County CA Public Financing Authority
Lease Revenue 5.000% 11/1/24 1,200 1,412
Ventura County CA Public Financing Authority
Lease Revenue 5.000% 11/1/29 1,000 1,159
Ventura County CA Public Financing Authority
Lease Revenue 5.000% 11/1/32 2,000 2,338
Ventura County CA Public Financing Authority
Lease Revenue 5.000% 11/1/33 1,250 1,456
Vista CA Joint Powers Financing Authority
Revenue 4.000% 5/1/18 300 309
Vista CA Joint Powers Financing Authority
Revenue 5.000% 5/1/20 500 558
Vista CA Joint Powers Financing Authority
Revenue 5.000% 5/1/21 325 373
Face Market
Maturity Amount Value•
Coupon Date ($000) ($000)
129

California Intermediate-Term Tax-Exempt Fund
Vista CA Joint Powers Financing Authority
Revenue 5.000% 5/1/22 400 472
Vista CA Joint Powers Financing Authority
Revenue 5.250% 5/1/35 5,975 7,129
Vista CA Redevelopment Agency Successor
Agency Tax Allocation Revenue 5.000% 9/1/18 (4) 400 420
Vista CA Redevelopment Agency Successor
Agency Tax Allocation Revenue 5.000% 9/1/19 (4) 300 325
Vista CA Redevelopment Agency Successor
Agency Tax Allocation Revenue 5.000% 9/1/20 (4) 275 307
Vista CA Redevelopment Agency Successor
Agency Tax Allocation Revenue 5.000% 9/1/21 (4) 265 303
Vista CA Redevelopment Agency Successor
Agency Tax Allocation Revenue 5.000% 9/1/22 (4) 335 392
Vista CA Redevelopment Agency Successor
Agency Tax Allocation Revenue 5.000% 9/1/23 (4) 400 476
Vista CA Redevelopment Agency Successor
Agency Tax Allocation Revenue 5.000% 9/1/24 (4) 585 706
Vista CA Unified School District GO 5.000% 8/1/24 5,000 5,896
Walnut CA Energy Center Authority Revenue 5.000% 1/1/30 2,000 2,169
Walnut Valley CA Unified School District GO 5.000% 8/1/23 250 303
Walnut Valley CA Unified School District GO 5.000% 8/1/24 350 431
Washington Township CA Health Care District GO 5.000% 8/1/23 170 204
Washington Township CA Health Care District GO 4.000% 8/1/24 625 721
Washington Township CA Health Care District GO 5.000% 8/1/25 1,425 1,762
Washington Township CA Health Care District GO 5.000% 8/1/26 1,395 1,735
Washington Township CA Health Care District
Revenue 5.000% 7/1/17 760 762
Washington Township CA Health Care District
Revenue 4.000% 7/1/18 325 334
Washington Township CA Health Care District
Revenue 4.000% 7/1/19 445 467
Washington Township CA Health Care District
Revenue 5.000% 7/1/19 500 535
Washington Township CA Health Care District
Revenue 4.000% 7/1/20 375 401
Washington Township CA Health Care District
Revenue 5.000% 7/1/20 465 511
Washington Township CA Health Care District
Revenue 5.000% 7/1/21 350 393
Washington Township CA Health Care District
Revenue 4.000% 7/1/22 540 590
Washington Township CA Health Care District
Revenue 5.000% 7/1/22 725 827
Washington Township CA Health Care District
Revenue 5.000% 7/1/23 400 463
Washington Township CA Health Care District
Revenue 5.000% 7/1/23 570 660
Washington Township CA Health Care District
Revenue 5.000% 7/1/24 750 876
Washington Township CA Health Care District
Revenue 5.000% 7/1/24 610 713
Washington Township CA Health Care District
Revenue 4.000% 7/1/25 650 716
Face Market
Maturity Amount Value•
Coupon Date ($000) ($000)
130
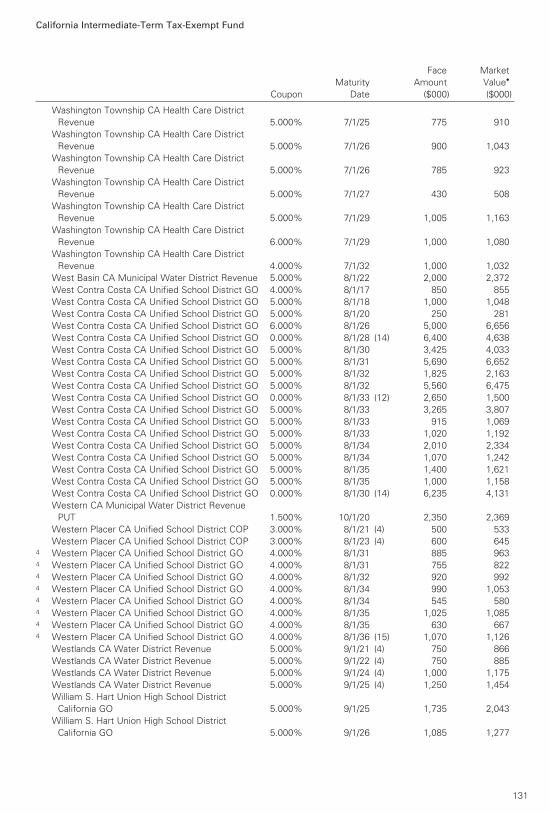
California Intermediate-Term Tax-Exempt Fund
Washington Township CA Health Care District
Revenue 5.000% 7/1/25 775 910
Washington Township CA Health Care District
Revenue 5.000% 7/1/26 900 1,043
Washington Township CA Health Care District
Revenue 5.000% 7/1/26 785 923
Washington Township CA Health Care District
Revenue 5.000% 7/1/27 430 508
Washington Township CA Health Care District
Revenue 5.000% 7/1/29 1,005 1,163
Washington Township CA Health Care District
Revenue 6.000% 7/1/29 1,000 1,080
Washington Township CA Health Care District
Revenue 4.000% 7/1/32 1,000 1,032
West Basin CA Municipal Water District Revenue 5.000% 8/1/22 2,000 2,372
West Contra Costa CA Unified School District GO 4.000% 8/1/17 850 855
West Contra Costa CA Unified School District GO 5.000% 8/1/18 1,000 1,048
West Contra Costa CA Unified School District GO 5.000% 8/1/20 250 281
West Contra Costa CA Unified School District GO 6.000% 8/1/26 5,000 6,656
West Contra Costa CA Unified School District GO 0.000% 8/1/28 (14) 6,400 4,638
West Contra Costa CA Unified School District GO 5.000% 8/1/30 3,425 4,033
West Contra Costa CA Unified School District GO 5.000% 8/1/31 5,690 6,652
West Contra Costa CA Unified School District GO 5.000% 8/1/32 1,825 2,163
West Contra Costa CA Unified School District GO 5.000% 8/1/32 5,560 6,475
West Contra Costa CA Unified School District GO 0.000% 8/1/33 (12) 2,650 1,500
West Contra Costa CA Unified School District GO 5.000% 8/1/33 3,265 3,807
West Contra Costa CA Unified School District GO 5.000% 8/1/33 915 1,069
West Contra Costa CA Unified School District GO 5.000% 8/1/33 1,020 1,192
West Contra Costa CA Unified School District GO 5.000% 8/1/34 2,010 2,334
West Contra Costa CA Unified School District GO 5.000% 8/1/34 1,070 1,242
West Contra Costa CA Unified School District GO 5.000% 8/1/35 1,400 1,621
West Contra Costa CA Unified School District GO 5.000% 8/1/35 1,000 1,158
West Contra Costa CA Unified School District GO 0.000% 8/1/30 (14) 6,235 4,131
Western CA Municipal Water District Revenue
PUT 1.500% 10/1/20 2,350 2,369
Western Placer CA Unified School District COP 3.000% 8/1/21 (4) 500 533
Western Placer CA Unified School District COP 3.000% 8/1/23 (4) 600 6454 Western Placer CA Unified School District GO 4.000% 8/1/31 885 9634 Western Placer CA Unified School District GO 4.000% 8/1/31 755 8224 Western Placer CA Unified School District GO 4.000% 8/1/32 920 9924 Western Placer CA Unified School District GO 4.000% 8/1/34 990 1,0534 Western Placer CA Unified School District GO 4.000% 8/1/34 545 5804 Western Placer CA Unified School District GO 4.000% 8/1/35 1,025 1,0854 Western Placer CA Unified School District GO 4.000% 8/1/35 630 6674 Western Placer CA Unified School District GO 4.000% 8/1/36 (15) 1,070 1,126
Westlands CA Water District Revenue 5.000% 9/1/21 (4) 750 866
Westlands CA Water District Revenue 5.000% 9/1/22 (4) 750 885
Westlands CA Water District Revenue 5.000% 9/1/24 (4) 1,000 1,175
Westlands CA Water District Revenue 5.000% 9/1/25 (4) 1,250 1,454
William S. Hart Union High School District
California GO 5.000% 9/1/25 1,735 2,043
William S. Hart Union High School District
California GO 5.000% 9/1/26 1,085 1,277
Face Market
Maturity Amount Value•
Coupon Date ($000) ($000)
131

California Intermediate-Term Tax-Exempt Fund
William S. Hart Union High School District
California GO 5.000% 9/1/27 1,500 1,757
William S. Hart Union High School District
California GO 0.000% 8/1/34 (4) 3,880 2,071
Yucaipa Valley CA Water District Water System
Revenue 5.000% 9/1/18 500 526
Yucaipa Valley CA Water District Water System
Revenue 5.000% 9/1/19 1,020 1,107
11,947,409
Guam (0.3%)
Guam Government Business Privilege Tax
Revenue 5.000% 11/15/20 750 819
Guam Government Business Privilege Tax
Revenue 5.000% 11/15/21 1,125 1,251
Guam Government Business Privilege Tax
Revenue 5.000% 11/15/22 1,500 1,695
Guam Government Waterworks Authority Water
& Waste Water System Revenue 5.000% 7/1/20 540 591
Guam Government Waterworks Authority Water
& Waste Water System Revenue 5.000% 7/1/21 400 445
Guam Government Waterworks Authority Water
& Waste Water System Revenue 5.000% 7/1/22 500 565
Guam Government Waterworks Authority Water
& Waste Water System Revenue 5.000% 7/1/28 2,115 2,364
Guam Government Waterworks Authority Water
& Waste Water System Revenue 5.000% 7/1/29 5,035 5,663
Guam Government Waterworks Authority Water
& Waste Water System Revenue 5.250% 7/1/33 4,000 4,448
Guam Government Waterworks Authority Water
& Waste Water System Revenue 5.000% 7/1/35 4,450 4,889
Guam Government Waterworks Authority Water
& Waste Water System Revenue 5.000% 7/1/36 1,450 1,605
Guam Power Authority Revenue 5.000% 10/1/22 1,605 1,815
Guam Power Authority Revenue 5.000% 10/1/26 1,810 2,047
Guam Power Authority Revenue 5.000% 10/1/30 1,470 1,623
29,820
Virgin Islands (0.0%)
Virgin Islands Public Finance Authority Revenue 5.000% 10/1/17 1,500 1,499
Total Tax-Exempt Municipal Bonds (Cost $11,486,480) 11,978,728
Face Market
Maturity Amount Value•
Coupon Date ($000) ($000)
132
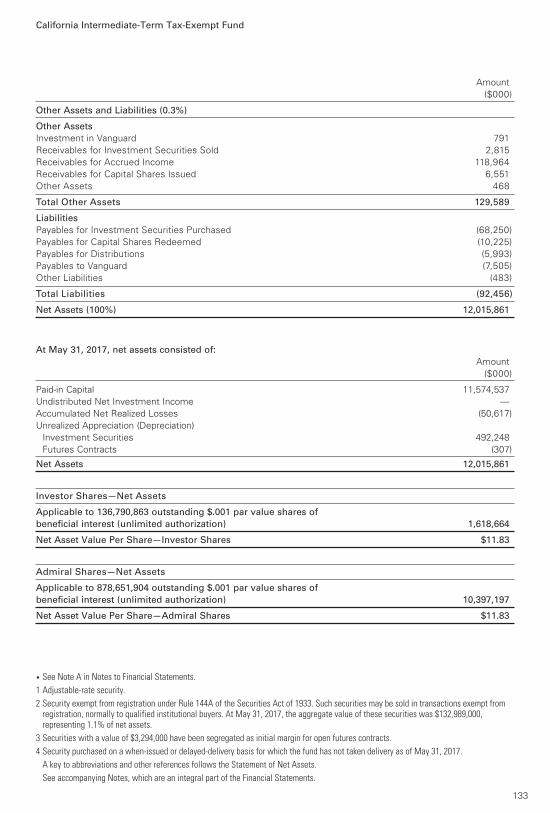
California Intermediate-Term Tax-Exempt Fund
Amount
($000)
• See Note A in Notes to Financial Statements.
1 Adjustable-rate security.
2 Security exempt from registration under Rule 144A of the Securities Act of 1933. Such securities may be sold in transactions exempt from registration, normally to qualified institutional buyers. At May 31, 2017, the aggregate value of these securities was $132,989,000, representing 1.1% of net assets.
3 Securities with a value of $3,294,000 have been segregated as initial margin for open futures contracts.
4 Security purchased on a when-issued or delayed-delivery basis for which the fund has not taken delivery as of May 31, 2017.
A key to abbreviations and other references follows the Statement of Net Assets.
See accompanying Notes, which are an integral part of the Financial Statements.
Other Assets and Liabilities (0.3%)
Other Assets
Investment in Vanguard 791
Receivables for Investment Securities Sold 2,815
Receivables for Accrued Income 118,964
Receivables for Capital Shares Issued 6,551
Other Assets 468
Total Other Assets 129,589
Liabilities
Payables for Investment Securities Purchased (68,250)
Payables for Capital Shares Redeemed (10,225)
Payables for Distributions (5,993)
Payables to Vanguard (7,505)
Other Liabilities (483)
Total Liabilities (92,456)
Net Assets (100%) 12,015,861
At May 31, 2017, net assets consisted of:
Amount
($000)
Paid-in Capital 11,574,537
Undistributed Net Investment Income —
Accumulated Net Realized Losses (50,617)
Unrealized Appreciation (Depreciation)
Investment Securities 492,248
Futures Contracts (307)
Net Assets 12,015,861
Investor Shares—Net Assets
Applicable to 136,790,863 outstanding $.001 par value shares of
beneficial interest (unlimited authorization) 1,618,664
Net Asset Value Per Share—Investor Shares $11.83
Admiral Shares—Net Assets
Applicable to 878,651,904 outstanding $.001 par value shares of
beneficial interest (unlimited authorization) 10,397,197
Net Asset Value Per Share—Admiral Shares $11.83
133

California Intermediate-Term Tax-Exempt Fund
Key to Abbreviations
ARS—Auction Rate Security.
BAN—Bond Anticipation Note.
COP—Certificate of Participation.
CP—Commercial Paper.
FR—Floating Rate.
GAN—Grant Anticipation Note.
GO—General Obligation Bond.
PILOT—Payments in Lieu of Taxes.
PUT—Put Option Obligation.
RAN—Revenue Anticipation Note.
TAN—Tax Anticipation Note.
TOB—Tender Option Bond.
TRAN—Tax Revenue Anticipation Note.
VRDO—Variable Rate Demand Obligation.
VRDP—Variable Rate Demand Preferred.
(ETM)—Escrowed to Maturity.
(Prere.)—Prerefunded.
Scheduled principal and interest payments are guaranteed by:
(1) MBIA (Municipal Bond Investors Assurance).
(2) AMBAC (Ambac Assurance Corporation).
(3) FGIC (Financial Guaranty Insurance Company).
(4) AGM (Assured Guaranty Municipal Corporation).
(5) BIGI (Bond Investors Guaranty Insurance).
(6) Connie Lee Inc.
(7) FHA (Federal Housing Authority).
(8) CapMAC (Capital Markets Assurance Corporation).
(9) American Capital Access Financial Guaranty Corporation.
(10) XL Capital Assurance Inc.
(11) CIFG (CDC IXIS Financial Guaranty).
(12) AGC (Assured Guaranty Corporation).
(13) BHAC (Berkshire Hathaway Assurance Corporation).
(14) NPFG (National Public Finance Guarantee Corporation).
(15) BAM (Build America Mutual Assurance Company).
(16) MAC (Municipal Assurance Corporation).
(17) RAA (Radian Asset Assurance Inc.).
(18) SBLF (Michigan School Bond Loan Fund).
The insurance does not guarantee the market value of the municipal bonds.
LOC—Scheduled principal and interest payments are guaranteed by bank letter of credit.
134
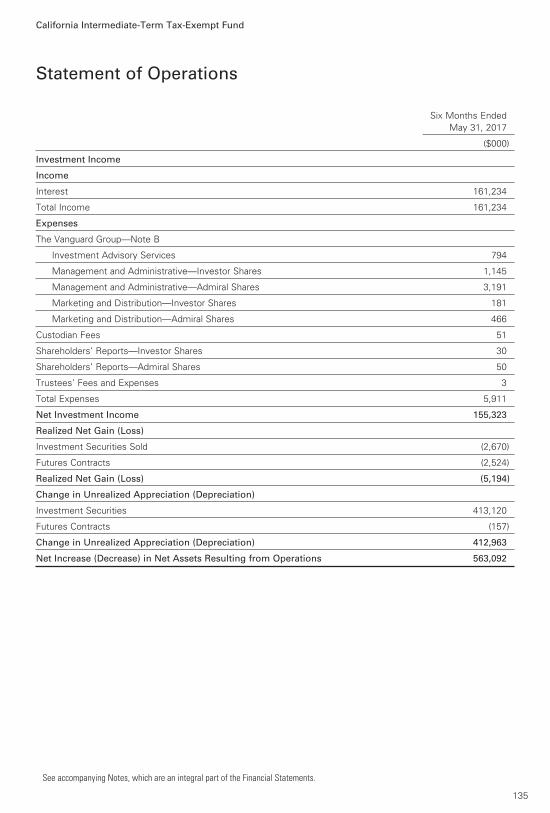
Six Months Ended
May 31, 2017
($000)
Investment Income
Income
Interest 161,234
Total Income 161,234
Expenses
The Vanguard Group—Note B
Investment Advisory Services 794
Management and Administrative—Investor Shares 1,145
Management and Administrative—Admiral Shares 3,191
Marketing and Distribution—Investor Shares 181
Marketing and Distribution—Admiral Shares 466
Custodian Fees 51
Shareholders’ Reports—Investor Shares 30
Shareholders’ Reports—Admiral Shares 50
Trustees’ Fees and Expenses 3
Total Expenses 5,911
Net Investment Income 155,323
Realized Net Gain (Loss)
Investment Securities Sold (2,670)
Futures Contracts (2,524)
Realized Net Gain (Loss) (5,194)
Change in Unrealized Appreciation (Depreciation)
Investment Securities 413,120
Futures Contracts (157)
Change in Unrealized Appreciation (Depreciation) 412,963
Net Increase (Decrease) in Net Assets Resulting from Operations 563,092
Statement of Operations
California Intermediate-Term Tax-Exempt Fund
See accompanying Notes, which are an integral part of the Financial Statements.
135
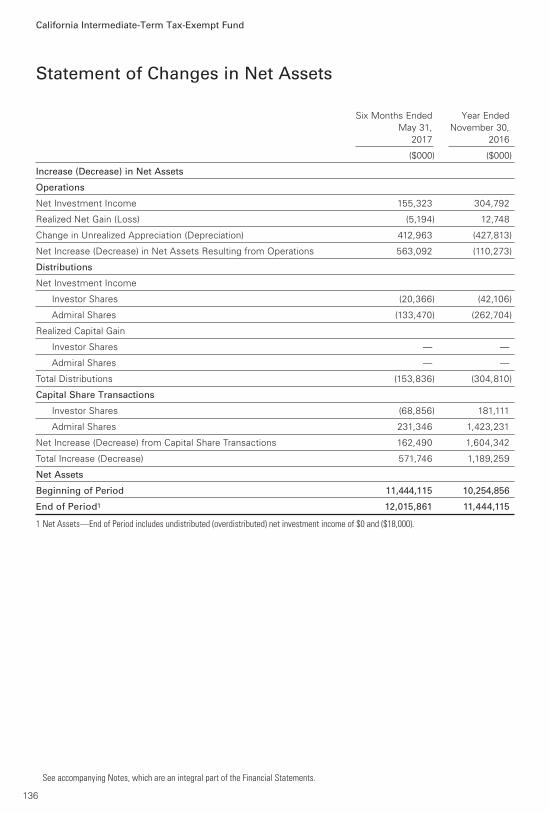
Statement of Changes in Net Assets
California Intermediate-Term Tax-Exempt Fund
See accompanying Notes, which are an integral part of the Financial Statements.
Six Months Ended Year Ended
May 31, November 30,
2017 2016
($000) ($000)
Increase (Decrease) in Net Assets
Operations
Net Investment Income 155,323 304,792
Realized Net Gain (Loss) (5,194) 12,748
Change in Unrealized Appreciation (Depreciation) 412,963 (427,813)
Net Increase (Decrease) in Net Assets Resulting from Operations 563,092 (110,273)
Distributions
Net Investment Income
Investor Shares (20,366) (42,106)
Admiral Shares (133,470) (262,704)
Realized Capital Gain
Investor Shares — —
Admiral Shares — —
Total Distributions (153,836) (304,810)
Capital Share Transactions
Investor Shares (68,856) 181,111
Admiral Shares 231,346 1,423,231
Net Increase (Decrease) from Capital Share Transactions 162,490 1,604,342
Total Increase (Decrease) 571,746 1,189,259
Net Assets
Beginning of Period 11,444,115 10,254,856
End of Period1 12,015,861 11,444,115
1 Net Assets—End of Period includes undistributed (overdistributed) net investment income of $0 and ($18,000).
136

Investor Shares
Six Months
Ended
For a Share Outstanding May 31, Year Ended November 30,
Throughout Each Period 2017 2016 2015 2014 2013 2012
Net Asset Value, Beginning of Period $11.42 $11.79 $11.78 $11.32 $11.92 $11.18
Investment Operations
Net Investment Income .152 .307 .331 .355 .373 .379
Net Realized and Unrealized Gain (Loss)
on Investments .409 (.370) .010 .460 (.600) .740
Total from Investment Operations .561 (.063) .341 .815 (.227) 1.119
Distributions
Dividends from Net Investment Income (.151) (.307) (.331) (.355) (.373) (.379)
Distributions from Realized Capital Gains — — — — — —
Total Distributions (.151) (.307) (.331) (.355) (.373) (.379)
Net Asset Value, End of Period $11.83 $11.42 $11.79 $11.78 $11.32 $11.92
Total Return1 4.94% -0.62% 2.93% 7.29% -1.91% 10.14%
Ratios/Supplemental Data
Net Assets, End of Period (Millions) $1,619 $1,631 $1,509 $1,444 $1,227 $1,375
Ratio of Total Expenses to
Average Net Assets 0.19% 0.19% 0.20% 0.20% 0.20% 0.20%
Ratio of Net Investment Income to
Average Net Assets 2.63% 2.56% 2.81% 3.06% 3.24% 3.26%
Portfolio Turnover Rate 16% 16% 17% 11% 12% 9%
The expense ratio, net investment income ratio, and turnover rate for the current period have been annualized.
1 Total returns do not include account service fees that may have applied in the periods shown. Fund prospectuses provide information about any applicable account service fees.
Financial Highlights
See accompanying Notes, which are an integral part of the Financial Statements.
California Intermediate-Term Tax-Exempt Fund
137
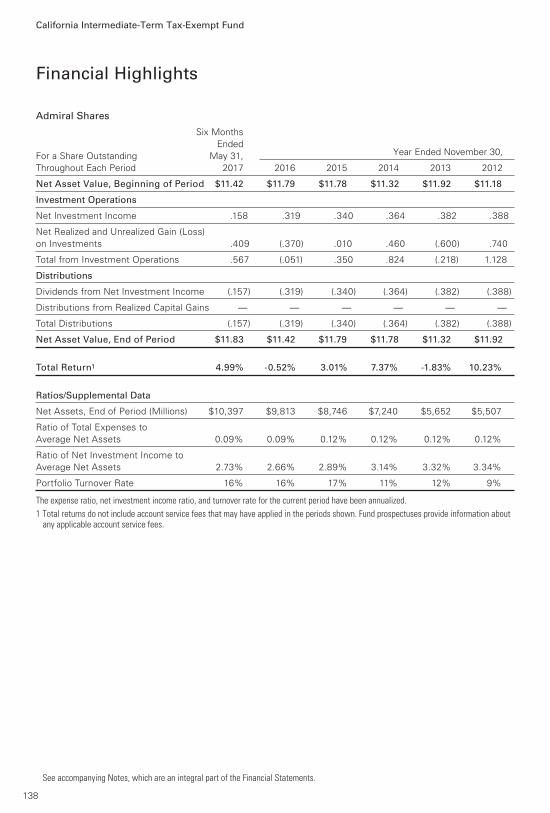
Admiral Shares
Six Months
Ended
For a Share Outstanding May 31, Year Ended November 30,
Throughout Each Period 2017 2016 2015 2014 2013 2012
Net Asset Value, Beginning of Period $11.42 $11.79 $11.78 $11.32 $11.92 $11.18
Investment Operations
Net Investment Income .158 .319 .340 .364 .382 .388
Net Realized and Unrealized Gain (Loss)
on Investments .409 (.370) .010 .460 (.600) .740
Total from Investment Operations .567 (.051) .350 .824 (.218) 1.128
Distributions
Dividends from Net Investment Income (.157) (.319) (.340) (.364) (.382) (.388)
Distributions from Realized Capital Gains — — — — — —
Total Distributions (.157) (.319) (.340) (.364) (.382) (.388)
Net Asset Value, End of Period $11.83 $11.42 $11.79 $11.78 $11.32 $11.92
Total Return1 4.99% -0.52% 3.01% 7.37% -1.83% 10.23%
Ratios/Supplemental Data
Net Assets, End of Period (Millions) $10,397 $9,813 $8,746 $7,240 $5,652 $5,507
Ratio of Total Expenses to
Average Net Assets 0.09% 0.09% 0.12% 0.12% 0.12% 0.12%
Ratio of Net Investment Income to
Average Net Assets 2.73% 2.66% 2.89% 3.14% 3.32% 3.34%
Portfolio Turnover Rate 16% 16% 17% 11% 12% 9%
The expense ratio, net investment income ratio, and turnover rate for the current period have been annualized.
1 Total returns do not include account service fees that may have applied in the periods shown. Fund prospectuses provide information about any applicable account service fees.
Financial Highlights
See accompanying Notes, which are an integral part of the Financial Statements.
California Intermediate-Term Tax-Exempt Fund
138

Notes to Financial Statements
California Intermediate-Term Tax-Exempt Fund
Vanguard California Intermediate-Term Tax-Exempt Fund is registered under the Investment Company
Act of 1940 as an open-end investment company, or mutual fund. The fund invests in debt
instruments of municipal issuers whose ability to meet their obligations may be affected by economic
and political developments in the state. The fund offers two classes of shares: Investor Shares and
Admiral Shares. Investor Shares are available to any investor who meets the fund’s minimum
purchase requirements. Admiral Shares are designed for investors who meet certain administrative,
service, and account-size criteria.
A. The following significant accounting policies conform to generally accepted accounting principles
for U.S. investment companies. The fund consistently follows such policies in preparing its financial
statements.
1. Security Valuation: Securities are valued as of the close of trading on the New York Stock Exchange
(generally 4 p.m., Eastern time) on the valuation date. Bonds and temporary cash investments are
valued using the latest bid prices or using valuations based on a matrix system (which considers such
factors as security prices, yields, maturities, and ratings), both as furnished by independent pricing
services. Securities for which market quotations are not readily available, or whose values have been
affected by events occurring before the fund’s pricing time but after the close of the securities’
primary markets, are valued by methods deemed by the board of trustees to represent fair value.
2. Futures Contracts: The fund uses futures contracts to invest in fixed income asset classes with
greater efficiency and lower cost than is possible through direct investment, to add value when these
instruments are attractively priced, or to adjust sensitivity to changes in interest rates. The primary
risks associated with the use of futures contracts are imperfect correlation between changes in
market values of bonds held by the fund and the prices of futures contracts, and the possibility of an
illiquid market. Counterparty risk involving futures is mitigated because a regulated clearinghouse is
the counterparty instead of the clearing broker. To further mitigate counterparty risk, the fund trades
futures contracts on an exchange, monitors the financial strength of its clearing brokers and
clearinghouse, and has entered into clearing agreements with its clearing brokers. The clearinghouse
imposes initial margin requirements to secure the fund’s performance and requires daily settlement
of variation margin representing changes in the market value of each contract.
Futures contracts are valued at their quoted daily settlement prices. The aggregate settlement values
of the contracts are not recorded in the Statement of Net Assets. Fluctuations in the value of the
contracts are recorded in the Statement of Net Assets as an asset (liability) and in the Statement of
Operations as unrealized appreciation (depreciation) until the contracts are closed, when they are
recorded as realized futures gains (losses).
During the six months ended May 31, 2017, the fund’s average investments in long and short futures
contracts represented 4% and 1% of net assets, respectively, based on the average of aggregate
settlement values at each quarter-end during the period.
3. Federal Income Taxes: The fund intends to continue to qualify as a regulated investment company
and distribute all of its income. Management has analyzed the fund’s tax positions taken for all open
federal income tax years (November 30, 2013–2016), and for the period ended May 31, 2017, and has
concluded that no provision for federal income tax is required in the fund’s financial statements.
4. Distributions: Distributions from net investment income are declared daily and paid on the first
business day of the following month. Annual distributions from realized capital gains, if any, are
recorded on the ex-dividend date.
139

California Intermediate-Term Tax-Exempt Fund
5. Credit Facility: The fund and certain other funds managed by The Vanguard Group (“Vanguard”)
participate in a $3.1 billion committed credit facility provided by a syndicate of lenders pursuant to a
credit agreement that may be renewed annually; each fund is individually liable for its borrowings, if
any, under the credit facility. Borrowings may be utilized for temporary and emergency purposes, and
are subject to the fund’s regulatory and contractual borrowing restrictions. The participating funds are
charged administrative fees and an annual commitment fee of 0.10% of the undrawn amount of the
facility; these fees are allocated to the funds based on a method approved by the fund’s board of
trustees and included in Management and Administrative expenses on the fund’s Statement of
Operations. Any borrowings under this facility bear interest at a rate based upon the higher of the
one-month London Interbank Offered Rate, federal funds effective rate, or overnight bank funding
rate plus an agreed-upon spread.
The fund had no borrowings outstanding at May 31, 2017, or at any time during the period
then ended.
6. Other: Interest income is accrued daily. Premiums and discounts on debt securities purchased are
amortized and accreted, respectively, to interest income over the lives of the respective securities.
Security transactions are accounted for on the date securities are bought or sold. Costs used to
determine realized gains (losses) on the sale of investment securities are those of the specific
securities sold.
Each class of shares has equal rights as to assets and earnings, except that each class separately
bears certain class-specific expenses related to maintenance of shareholder accounts (included in
Management and Administrative expenses) and shareholder reporting. Marketing and distribution
expenses are allocated to each class of shares based on a method approved by the board of trustees.
Income, other non-class-specific expenses, and gains and losses on investments are allocated to
each class of shares based on its relative net assets.
B. In accordance with the terms of a Funds’ Service Agreement (the “FSA”) between Vanguard and
the fund, Vanguard furnishes to the fund investment advisory, corporate management, administrative,
marketing, and distribution services at Vanguard’s cost of operations (as defined by the FSA). These
costs of operations are allocated to the fund based on methods and guidelines approved by the board
of trustees. Vanguard does not require reimbursement in the current period for certain costs of
operations (such as deferred compensation/benefits and risk/insurance costs); the fund’s liability
for these costs of operations is included in Payables to Vanguard on the Statement of Net Assets.
Upon the request of Vanguard, the fund may invest up to 0.40% of its net assets as capital in
Vanguard. At May 31, 2017, the fund had contributed to Vanguard capital in the amount of $791,000,
representing 0.01% of the fund’s net assets and 0.32% of Vanguard’s capitalization. The fund’s
trustees and officers are also directors and employees, respectively, of Vanguard.
C. Various inputs may be used to determine the value of the fund’s investments. These inputs are
summarized in three broad levels for financial statement purposes. The inputs or methodologies
used to value securities are not necessarily an indication of the risk associated with investing in
those securities.
Level 1—Quoted prices in active markets for identical securities.
Level 2—Other significant observable inputs (including quoted prices for similar securities, interest
rates, prepayment speeds, credit risk, etc.).
Level 3—Significant unobservable inputs (including the fund’s own assumptions used to determine
the fair value of investments).
140

California Intermediate-Term Tax-Exempt Fund
The following table summarizes the market value of the fund’s investments as of May 31, 2017, based
on the inputs used to value them:
Level 1 Level 2 Level 3
Investments ($000) ($000) ($000)
Tax-Exempt Municipal Bonds — 11,978,728 —
Futures Contracts—Assets1 110 — —
Futures Contracts—Liabilities1 (433) — —
Total (323) 11,978,728 —
1 Represents variation margin on the last day of the reporting period.
D. At May 31, 2017, the aggregate settlement value of open futures contracts and the related
unrealized appreciation (depreciation) were:
($000)
Aggregate
Number of Settlement Unrealized
Long (Short) Value Appreciation
Futures Contracts Expiration Contracts Long (Short) (Depreciation)
2-Year U.S. Treasury Note September 2017 1,082 234,236 206
5-Year U.S. Treasury Note September 2017 1,908 225,740 325
Ultra 10-Year U.S. Treasury Note September 2017 (1,227) (166,546) (809)
10-Year U.S. Treasury Note September 2017 (254) (32,079) (29)
(307)
Unrealized appreciation (depreciation) on open futures contracts is required to be treated as realized
gain (loss) for tax purposes.
E. Capital gain distributions are determined on a tax basis and may differ from realized capital gains for
financial reporting purposes. Differences may be permanent or temporary. Permanent differences are
reclassified among capital accounts in the financial statements to reflect their tax character. Temporary
differences arise when gains or losses are recognized in different periods for financial statement and
tax purposes. These differences will reverse at some time in the future.
The fund’s tax-basis capital gains and losses are determined only at the end of each fiscal year.
For tax purposes, at November 30, 2016, the fund had available capital losses totaling $45,481,000
to offset future net capital gains of $38,406,000 through November 30, 2017, $990,000 through
November 30, 2018, and $6,085,000 through November 30, 2019. The fund will use these capital
losses to offset net taxable capital gains, if any, realized during the year ending November 30, 2017;
should the fund realize net capital losses for the year, the losses will be added to the loss
carryforward balance above.
At May 31, 2017, the cost of investment securities for tax purposes was $11,486,571,000. Net
unrealized appreciation of investment securities for tax purposes was $492,157,000, consisting
of unrealized gains of $522,279,000 on securities that had risen in value since their purchase
and $30,122,000 in unrealized losses on securities that had fallen in value since their purchase.
F. During the six months ended May 31, 2017, the fund purchased $1,183,259,000 of investment
securities and sold $880,250,000 of investment securities, other than temporary cash investments.
141
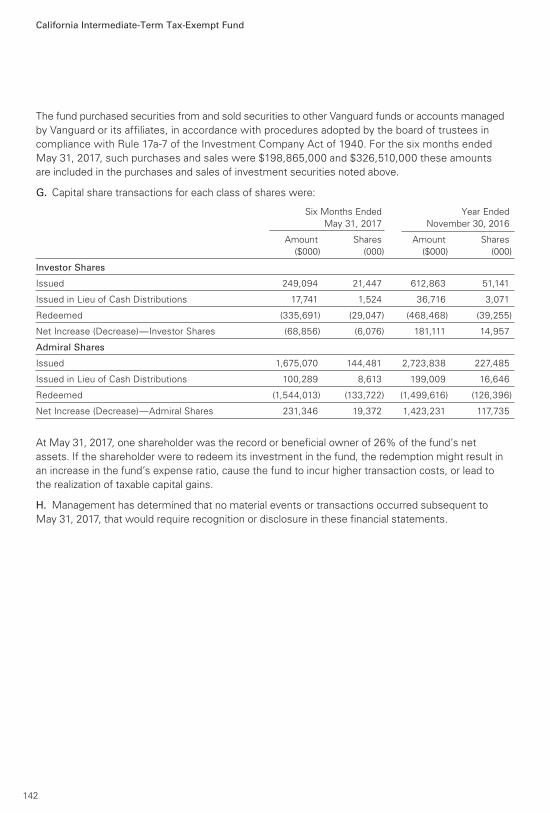
California Intermediate-Term Tax-Exempt Fund
The fund purchased securities from and sold securities to other Vanguard funds or accounts managed
by Vanguard or its affiliates, in accordance with procedures adopted by the board of trustees in
compliance with Rule 17a-7 of the Investment Company Act of 1940. For the six months ended
May 31, 2017, such purchases and sales were $198,865,000 and $326,510,000 these amounts
are included in the purchases and sales of investment securities noted above.
G. Capital share transactions for each class of shares were:
Six Months Ended Year Ended
May 31, 2017 November 30, 2016
Amount Shares Amount Shares
($000) (000) ($000) (000)
Investor Shares
Issued 249,094 21,447 612,863 51,141
Issued in Lieu of Cash Distributions 17,741 1,524 36,716 3,071
Redeemed (335,691) (29,047) (468,468) (39,255)
Net Increase (Decrease)—Investor Shares (68,856) (6,076) 181,111 14,957
Admiral Shares
Issued 1,675,070 144,481 2,723,838 227,485
Issued in Lieu of Cash Distributions 100,289 8,613 199,009 16,646
Redeemed (1,544,013) (133,722) (1,499,616) (126,396)
Net Increase (Decrease)—Admiral Shares 231,346 19,372 1,423,231 117,735
At May 31, 2017, one shareholder was the record or beneficial owner of 26% of the fund’s net
assets. If the shareholder were to redeem its investment in the fund, the redemption might result in
an increase in the fund’s expense ratio, cause the fund to incur higher transaction costs, or lead to
the realization of taxable capital gains.
H. Management has determined that no material events or transactions occurred subsequent to
May 31, 2017, that would require recognition or disclosure in these financial statements.
142

1 The expense ratios shown are from the prospectus dated March 28, 2017, and represent estimated costs for the current fiscal year. For the six months ended May 31, 2017, the annualized expense ratios were 0.19% for Investor Shares and 0.09% for Admiral Shares.
Financial Attributes
Fund
Bloomberg
Barclays
CA
Muni Bond
Index
Bloomberg
Barclays
Municipal
Bond Index
Number of Bonds 813 7,181 50,785
Yield to Maturity
(before expenses) 2.3% 2.0% 2.1%
Average Coupon 4.3% 4.7% 4.8%
Average Duration 7.3 years 6.3 years 6.2 years
Average Stated
Maturity 16.9 years 13.6 years 12.9 years
Short-Term Reserves 3.9% — —
Volatility Measures
Bloomberg
Barclays CA
Muni Bond
Index
Bloomberg
Barclays
Municipal
Bond Index
R-Squared 0.98 0.98
Beta 1.23 1.25
These measures show the degree and timing of the fund’s fluctuations compared with the indexes over 36 months.
Fund ProfileAs of May 31, 2017
Share-Class Characteristics
InvestorShares
AdmiralShares
Ticker Symbol VCITX VCLAXExpense Ratio1 0.19% 0.09%
30-Day SEC Yield 2.31% 2.41%
California Long-Term Tax-Exempt Fund
143
Distribution by Stated Maturity
(% of portfolio)
Under 1 Year 4.1%
1 - 3 Years 4.1
3 - 5 Years 2.6
5 - 10 Years 7.6
10 - 20 Years 42.9
20 - 30 Years 34.5
Over 30 Years 4.2
Distribution by Credit Quality (% of portfolio)
AAA 6.7%
AA 70.9
A 14.2
BBB 6.4
BB 0.1
B 0.4
Not Rated 1.3
Credit-quality ratings are obtained from Moody's and S&P, and the higher rating for each issue is shown. "Not Rated" is used to classify securities for which a rating is not available. Not rated securities include a fund's investment in Vanguard Market Liquidity Fund or Vanguard Municipal Cash Management Fund, each of which invests in high-quality money market instruments and may serve as a cash management vehicle for the Vanguard funds, trusts, and accounts. For more information about these ratings, see the Glossary entry for Credit Quality.

California Long-Term Tax-Exempt Fund
144
Investment Focus
Average Maturity
Short
High
Medium
Low
Med. Long
Credit Quality

All of the returns in this report represent past performance, which is not a guarantee of future results that may be achieved by the fund. (Current performance may be lower or higher thanthe performance data cited. For performance data current to the most recent month-end, visitour website at vanguard.com/performance.) Note, too, that both investment returns and principalvalue can fluctuate widely, so an investor’s shares, when sold, could be worth more or less than their original cost. The returns shown do not reflect taxes that a shareholder would pay on fund
distributions or on the sale of fund shares.
See Financial Highlights for dividend and capital gains information.
Performance Summary
California Long-Term Tax-Exempt Fund
145
Fiscal-Year Total Returns (%): November 30, 2006, Through May 31, 2017
Investor Shares
BloombergBarclays CAMuni Bond
Index
Fiscal Year Income Returns Capital Returns Total Returns Total Returns
2007 4.52% -3.37% 1.15% 2.17%
2008 4.13 -11.08 -6.95 -5.18
2009 4.96 7.75 12.71 13.21
2010 4.36 0.27 4.63 5.80
2011 4.51 2.09 6.60 7.49
2012 4.30 8.90 13.20 11.80
2013 3.64 -7.60 -3.96 -2.92
2014 4.07 6.72 10.79 9.32
2015 3.62 0.41 4.03 3.30
2016 3.25 -3.80 -0.55 -0.55
2017 1.74 4.20 5.94 5.21
Note: For 2017, performance data reflect the six months ended May 31, 2017.
Average Annual Total Returns: Periods Ended March 31, 2017 This table presents returns through the latest calendar quarter—rather than through the end of the fiscal period.
Securities and Exchange Commission rules require that we provide this information.
Ten Years
Inception Date One Year Five Years Income Capital Total
Investor Shares 4/7/1986 -0.35% 4.15% 4.10% 0.14% 4.24%
Admiral Shares 11/12/2001 -0.24 4.24 4.19 0.14 4.33

California Long-Term Tax-Exempt Fund
Financial Statements (unaudited)
Statement of Net AssetsAs of May 31, 2017
The fund reports a complete list of its holdings in regulatory filings four times in each fiscal year, at
the quarter-ends. For the second and fourth fiscal quarters, the lists appear in the fund’s semiannual
and annual reports to shareholders. For the first and third fiscal quarters, the fund files the lists with
the Securities and Exchange Commission on Form N-Q. Shareholders can look up the fund’s Forms
N-Q on the SEC’s website at sec.gov. Forms N-Q may also be reviewed and copied at the SEC’s
Public Reference Room (see the back cover of this report for further information).
Face Market
Maturity Amount Value•
Coupon Date ($000) ($000)
Tax-Exempt Municipal Bonds (100.1%)
California (99.9%)
ABAG Finance Authority for Nonprofit Corps.
California Revenue (Episcopal Senior
Communities) 5.000% 7/1/42 1,000 1,078
ABAG Finance Authority for Nonprofit Corps.
California Revenue (Eskaton Properties Inc.
Obligated Group) 5.000% 11/15/35 3,250 3,504
ABAG Finance Authority for Nonprofit Corps.
California Revenue (Jackson Laboratory) 5.000% 7/1/37 7,565 8,299
ABAG Finance Authority for Nonprofit Corps.
California Revenue (Sharp Healthcare) 5.000% 8/1/43 15,830 17,799
Alameda CA Community Improvement
Commission Successor Agency Tax
Allocation Revenue 5.000% 9/1/29 (15) 1,500 1,735
Alameda CA Corridor Transportation Authority
Revenue 0.000% 10/1/30 (2) 30,375 17,925
Alameda CA Corridor Transportation Authority
Revenue 5.000% 10/1/35 1,000 1,143
Alameda CA Corridor Transportation Authority
Revenue 5.000% 10/1/36 1,000 1,140
Alameda CA Corridor Transportation Authority
Revenue 4.000% 10/1/37 (4) 1,500 1,560
Alameda CA Corridor Transportation Authority
Revenue 5.000% 10/1/37 6,550 7,444
Alameda County CA Unified School District GO 0.000% 8/1/24 (4) 3,510 3,026
Alameda County CA Unified School District GO 0.000% 8/1/29 (4) 5,000 3,459
Anaheim CA Housing & Public Improvements
Authority Revenue (Electric Utility Distribution
System) 5.000% 10/1/41 2,225 2,499
Anaheim CA Housing & Public Improvements
Authority Revenue (Water System Project) 5.000% 10/1/41 2,250 2,535
Anaheim CA Housing & Public Improvements
Authority Revenue (Water System Project) 5.000% 10/1/46 3,255 3,667
Anaheim CA Public Financing Authority Revenue
(Electric System) 4.000% 10/1/31 5,080 5,5011 Bay Area Toll Authority California Toll Bridge
Revenue (San Francisco Bay Area) 5.625% 4/1/19 (Prere.) 10,000 10,856
146

California Long-Term Tax-Exempt Fund
Face Market
Maturity Amount Value•
Coupon Date ($000) ($000)
Bay Area Toll Authority California Toll Bridge
Revenue (San Francisco Bay Area) 5.000% 4/1/31 4,000 4,648
Bay Area Toll Authority California Toll Bridge
Revenue (San Francisco Bay Area) 5.000% 10/1/42 5,000 5,517
Bay Area Toll Authority California Toll Bridge
Revenue (San Francisco Bay Area) 5.000% 4/1/43 4,000 4,544
Bay Area Toll Authority California Toll Bridge
Revenue (San Francisco Bay Area) 5.250% 4/1/53 2,350 2,688
Bay Area Toll Authority California Toll Bridge
Revenue (San Francisco Bay Area) 5.000% 10/1/54 25,260 28,249
Bay Area Toll Authority California Toll Bridge
Revenue (San Francisco Bay Area) 5.000% 4/1/56 20,000 23,034
Beverly Hills CA Unified School District GO 4.000% 8/1/40 5,000 5,348
Brentwood CA Infrastructure Financing Authority
Revenue 5.000% 9/2/28 (4) 2,135 2,514
Cabrillo CA Community College District Revenue 0.000% 5/1/26 (2) 9,000 6,289
California County CA Tobacco Securitization
Agency Revenue 5.450% 6/1/28 7,500 7,689
California Department of Water Resources Water
System Revenue (Central Valley Project) 5.000% 12/1/24 (Prere.) 25 31
California Department of Water Resources Water
System Revenue (Central Valley Project) 5.000% 12/1/28 2,500 3,132
California Department of Water Resources Water
System Revenue (Central Valley Project) 5.000% 12/1/29 6,475 7,825
California Department of Water Resources Water
System Revenue (Central Valley Project) 5.000% 12/1/33 2,010 2,438
California Educational Facilities Authority Revenue
(Claremont McKenna College) 5.000% 1/1/28 1,250 1,536
California Educational Facilities Authority Revenue
(Claremont McKenna College) 5.000% 1/1/29 1,000 1,219
California Educational Facilities Authority Revenue
(Claremont McKenna College) 4.000% 1/1/39 10,000 10,489
California Educational Facilities Authority Revenue
(College of Arts & Crafts) 6.875% 6/1/19 1,190 1,268
California Educational Facilities Authority Revenue
(College of Arts) 5.250% 6/1/30 1,125 1,219
California Educational Facilities Authority Revenue
(Occidental College) 5.000% 10/1/37 1,130 1,328
California Educational Facilities Authority Revenue
(Occidental College) 5.000% 10/1/45 1,425 1,653
California Educational Facilities Authority Revenue
(Pepperdine College) 5.000% 9/1/33 3,000 3,453
California Educational Facilities Authority Revenue
(Pepperdine College) 5.000% 12/1/39 2,000 2,339
California Educational Facilities Authority Revenue
(Pepperdine College) 5.000% 9/1/45 5,000 5,793
California Educational Facilities Authority Revenue
(Santa Clara University) 5.000% 4/1/39 5,880 6,829
California Educational Facilities Authority Revenue
(Santa Clara University) 5.000% 4/1/45 6,500 7,485
California Educational Facilities Authority Revenue
(Stanford University) 5.000% 3/15/26 3,000 3,794
California Educational Facilities Authority Revenue
(Stanford University) 5.250% 4/1/40 6,000 8,159
147

California Long-Term Tax-Exempt Fund
Face Market
Maturity Amount Value•
Coupon Date ($000) ($000)
California Educational Facilities Authority Revenue
(Stanford University) 5.000% 6/1/43 3,760 5,029
California Educational Facilities Authority Revenue
(Stanford University) 5.000% 5/1/45 4,000 5,395
California Educational Facilities Authority Revenue
(Stanford University) 5.000% 6/1/46 9,000 12,192
California Educational Facilities Authority Revenue
(University of San Francisco) 6.125% 10/1/36 1,250 1,477
California Educational Facilities Authority Revenue
(University of Southern California) 5.250% 10/1/18 (Prere.) 3,420 3,6222 California Educational Facilities Authority Revenue
(University of Southern California) TOB VRDO 0.840% 6/7/17 7,388 7,388
California Educational Facilities Authority Revenue
(University of the Pacific) 5.000% 11/1/30 3,225 3,792
California Educational Facilities Authority Revenue
(University of the Pacific) 5.000% 11/1/36 3,235 3,713
California GO 5.250% 3/1/18 (Prere.) 5,335 5,513
California GO 5.250% 8/1/18 (Prere.) 5,115 5,383
California GO 6.000% 8/1/19 (14) 210 212
California GO 5.000% 4/1/20 1,460 1,571
California GO 5.000% 9/1/20 5,000 5,634
California GO 5.000% 9/1/21 5,000 5,798
California GO 5.000% 9/1/21 11,000 12,756
California GO 5.000% 11/1/23 7,000 8,517
California GO 5.000% 5/1/24 3,000 3,676
California GO 5.000% 11/1/24 6,670 8,245
California GO 5.000% 3/1/25 7,000 7,750
California GO 5.000% 3/1/27 10,000 12,165
California GO 3.500% 8/1/27 9,000 9,951
California GO 5.250% 10/1/27 5,000 5,848
California GO 5.100% 11/1/27 1,475 1,671
California GO 5.000% 3/1/28 10,000 12,064
California GO 5.000% 8/1/28 2,875 3,492
California GO 5.000% 8/1/28 6,400 7,877
California GO 4.000% 9/1/28 6,000 6,824
California GO 5.000% 9/1/28 5,930 7,307
California GO 5.000% 10/1/29 1,400 1,529
California GO 5.250% 10/1/29 4,700 5,161
California GO 5.250% 3/1/30 10,000 11,099
California GO 4.500% 8/1/30 15 15
California GO 5.000% 8/1/30 3,225 3,914
California GO 5.000% 9/1/30 1,500 1,724
California GO 5.250% 9/1/30 6,000 6,958
California GO 5.750% 4/1/31 15,875 17,258
California GO 5.000% 8/1/31 9,460 11,297
California GO 5.000% 9/1/31 1,800 2,062
California GO 5.000% 9/1/31 8,380 10,108
California GO 5.000% 10/1/31 4,500 5,339
California GO 4.000% 8/1/32 10,000 10,888
California GO 4.000% 9/1/32 7,500 8,171
California GO 5.000% 9/1/32 1,045 1,192
California GO 5.000% 9/1/32 2,775 3,332
California GO 5.000% 10/1/32 8,790 10,389
California GO 5.000% 2/1/33 2,615 3,002
148

California Long-Term Tax-Exempt Fund
Face Market
Maturity Amount Value•
Coupon Date ($000) ($000)
California GO 6.000% 3/1/33 7,000 7,892
California GO 5.125% 4/1/33 8,500 8,792
California GO 6.500% 4/1/33 33,000 36,354
California GO 5.000% 8/1/33 2,635 3,091
California GO 5.000% 8/1/33 5,000 5,968
California GO 5.000% 10/1/33 4,000 4,707
California GO 5.250% 4/1/35 5,000 5,752
California GO 4.000% 8/1/35 10,000 10,705
California GO 4.000% 9/1/35 9,550 10,228
California GO 6.000% 11/1/35 5,000 5,597
California GO 4.000% 8/1/36 10,000 10,672
California GO 5.000% 9/1/36 8,500 9,769
California GO 5.000% 4/1/37 5,000 5,712
California GO 5.250% 3/1/38 2,665 2,747
California GO 6.000% 4/1/38 21,190 23,152
California GO 5.250% 8/1/38 4,885 5,116
California GO 5.000% 10/1/39 7,615 8,828
California GO 5.500% 11/1/39 3,690 4,049
California GO 6.000% 11/1/39 2,700 3,023
California GO 5.500% 3/1/40 11,500 12,777
California GO 4.000% 12/1/40 5,000 5,204
California GO 5.000% 10/1/41 5,000 5,597
California GO 5.000% 4/1/42 2,000 2,260
California GO 5.000% 9/1/42 8,515 9,713
California GO 5.000% 2/1/43 6,265 7,095
California GO 5.000% 4/1/43 6,500 7,384
California GO 5.000% 11/1/43 12,425 14,272
California GO 5.000% 12/1/43 5,335 6,138
California GO 5.000% 5/1/44 5,000 5,735
California GO 5.000% 8/1/45 11,735 13,608
California GO 5.000% 8/1/46 10,000 11,688
California Health Facilities Financing Authority
Revenue (Adventist Health System/West) 5.000% 3/1/25 3,000 3,518
California Health Facilities Financing Authority
Revenue (Adventist Health System/West) 4.000% 3/1/33 1,000 1,051
California Health Facilities Financing Authority
Revenue (Adventist Health System/West) 4.000% 3/1/39 10,000 10,374
California Health Facilities Financing Authority
Revenue (Catholic Healthcare West) 6.000% 7/1/19 (Prere.) 5,000 5,524
California Health Facilities Financing Authority
Revenue (Catholic Healthcare West) 5.625% 7/1/25 5,000 5,421
California Health Facilities Financing Authority
Revenue (Catholic Healthcare West) 5.250% 3/1/27 2,500 2,824
California Health Facilities Financing Authority
Revenue (Catholic Healthcare West) 5.250% 3/1/41 9,000 9,766
California Health Facilities Financing Authority
Revenue (Cedars-Sinai Medical Center) 5.000% 11/15/27 5,000 6,096
California Health Facilities Financing Authority
Revenue (Cedars-Sinai Medical Center) 5.000% 11/15/30 2,000 2,383
California Health Facilities Financing Authority
Revenue (Cedars-Sinai Medical Center) 5.000% 8/15/32 5,000 5,968
California Health Facilities Financing Authority
Revenue (Cedars-Sinai Medical Center) 5.000% 8/15/35 5,000 5,896
149

California Long-Term Tax-Exempt Fund
Face Market
Maturity Amount Value•
Coupon Date ($000) ($000)
California Health Facilities Financing Authority
Revenue (Cedars-Sinai Medical Center) 4.000% 8/15/39 5,000 5,259
California Health Facilities Financing Authority
Revenue (Children’s Hospital of Los Angeles) 5.000% 11/15/29 3,500 3,9243 California Health Facilities Financing Authority
Revenue (Children’s Hospital of Los Angeles) 5.000% 8/15/42 7,500 8,505
California Health Facilities Financing Authority
Revenue (Children’s Hospital of Orange County) 6.500% 11/1/38 3,000 3,381
California Health Facilities Financing Authority
Revenue (Children’s Hospital of Orange County) 5.250% 11/1/41 4,025 4,516
California Health Facilities Financing Authority
Revenue (Chinese Hospital Association) 5.000% 6/1/37 2,000 2,238
California Health Facilities Financing Authority
Revenue (Chinese Hospital Association) 5.000% 6/1/42 5,000 5,602
California Health Facilities Financing Authority
Revenue (City of Hope Medical Center) 5.000% 11/15/32 4,250 4,840
California Health Facilities Financing Authority
Revenue (City of Hope Medical Center) 5.000% 11/15/35 7,750 8,821
California Health Facilities Financing Authority
Revenue (City of Hope Medical Center) 5.000% 11/15/39 4,465 5,055
California Health Facilities Financing Authority
Revenue (El Camino Hospital) 5.000% 2/1/26 2,740 3,279
California Health Facilities Financing Authority
Revenue (El Camino Hospital) 5.000% 2/1/27 1,840 2,184
California Health Facilities Financing Authority
Revenue (El Camino Hospital) 5.000% 2/1/40 6,000 6,703
California Health Facilities Financing Authority
Revenue (El Camino Hospital) 5.000% 2/1/47 7,000 7,903
California Health Facilities Financing Authority
Revenue (Kaiser Permanente) 5.000% 11/1/27 7,000 8,825
California Health Facilities Financing Authority
Revenue (Kaiser Permanente) 4.000% 11/1/44 14,000 14,458
California Health Facilities Financing Authority
Revenue (Kaiser Permanente) 5.000% 11/1/47 16,800 21,568
California Health Facilities Financing Authority
Revenue (Kaiser Permanente) 4.000% 11/1/51 4,000 4,0722 California Health Facilities Financing Authority
Revenue (Kaiser Permanente) TOB VRDO 0.800% 6/7/17 15,000 15,000
California Health Facilities Financing Authority
Revenue (Lucile Salter Packard Children’s
Hospital at Stanford) 5.000% 8/15/43 5,300 5,949
California Health Facilities Financing Authority
Revenue (Lucile Salter Packard Children’s
Hospital at Stanford) 5.000% 8/15/55 7,000 7,919
California Health Facilities Financing Authority
Revenue (Marshall Medical Center) 5.000% 11/1/29 1,000 1,158
California Health Facilities Financing Authority
Revenue (Marshall Medical Center) 5.000% 11/1/33 1,100 1,252
California Health Facilities Financing Authority
Revenue (Memorial Health Services) 5.000% 10/1/25 2,750 3,204
California Health Facilities Financing Authority
Revenue (Memorial Health Services) 5.000% 10/1/26 5,000 5,803
California Health Facilities Financing Authority
Revenue (Memorial Health Services) 5.000% 10/1/33 2,500 2,848
150

California Long-Term Tax-Exempt Fund
Face Market
Maturity Amount Value•
Coupon Date ($000) ($000)
California Health Facilities Financing Authority
Revenue (Northern California Presbyterian
Homes & Services) 5.000% 7/1/34 645 735
California Health Facilities Financing Authority
Revenue (Northern California Presbyterian
Homes & Services) 5.000% 7/1/39 1,600 1,818
California Health Facilities Financing Authority
Revenue (Northern California Presbyterian
Homes & Services) 5.000% 7/1/44 1,500 1,697
California Health Facilities Financing Authority
Revenue (Providence Health & Services) 6.500% 10/1/18 (Prere.) 2,000 2,150
California Health Facilities Financing Authority
Revenue (Providence Health & Services) 5.000% 10/1/29 2,390 2,823
California Health Facilities Financing Authority
Revenue (Providence Health & Services) 5.000% 10/1/38 6,000 6,908
California Health Facilities Financing Authority
Revenue (Providence Health & Services) 5.500% 10/1/39 6,500 7,080
California Health Facilities Financing Authority
Revenue (Providence St. Joseph Health
Obligated Group) 4.000% 10/1/47 10,000 10,322
California Health Facilities Financing Authority
Revenue (Rady Children’s Hospital) 5.500% 8/15/33 3,920 4,464
California Health Facilities Financing Authority
Revenue (Scripps Health) 5.000% 11/15/40 8,000 9,033
California Health Facilities Financing Authority
Revenue (St. Joseph Health System) 5.750% 7/1/39 7,000 7,593
California Health Facilities Financing Authority
Revenue (Stanford Hospital) 5.000% 8/15/42 5,000 5,627
California Health Facilities Financing Authority
Revenue (Stanford Hospital) 5.000% 8/15/51 5,000 5,596
California Health Facilities Financing Authority
Revenue (Stanford Hospital) 5.000% 8/15/54 2,000 2,250
California Health Facilities Financing Authority
Revenue (Sutter Health) 5.875% 8/15/31 4,000 4,571
California Health Facilities Financing Authority
Revenue (Sutter Health) 4.000% 8/15/40 6,500 6,735
California Health Facilities Financing Authority
Revenue (Sutter Health) 5.000% 8/15/43 9,000 10,202
California Health Facilities Financing Authority
Revenue (Sutter Health) 5.000% 11/15/46 26,000 29,746
California Health Facilities Financing Authority
Revenue (Sutter Health) 5.000% 11/15/46 22,000 25,038
California Infrastructure & Economic
Development Bank Revenue 5.000% 10/1/26 5,000 6,304
California Infrastructure & Economic
Development Bank Revenue 5.000% 10/1/28 3,400 4,217
California Infrastructure & Economic
Development Bank Revenue 5.000% 10/1/29 3,445 4,280
California Infrastructure & Economic
Development Bank Revenue 5.000% 10/1/33 3,000 3,646
California Infrastructure & Economic
Development Bank Revenue 5.000% 10/1/34 5,000 5,998
California Infrastructure & Economic Development
Bank Revenue (Academy of Motion Picture Arts
& Sciences Obligated Group) 5.000% 11/1/30 2,000 2,353
151

California Long-Term Tax-Exempt Fund
Face Market
Maturity Amount Value•
Coupon Date ($000) ($000)
California Infrastructure & Economic Development
Bank Revenue (Academy of Motion Picture
Arts & Sciences Obligated Group) 5.000% 11/1/41 6,000 6,865
California Infrastructure & Economic Development
Bank Revenue (Pacific Gas & Electric Co.) VRDO 0.690% 6/1/17 LOC 10,000 10,000
California Infrastructure & Economic Development
Bank Revenue (Science Center Phase II Project) 5.000% 5/1/28 1,220 1,459
California Infrastructure & Economic Development
Bank Revenue (Science Center Phase II Project) 5.000% 5/1/29 1,290 1,529
California Municipal Finance Authority
(Community Hospitals of Central California
Obligated Group) COP 5.500% 2/1/19 (Prere.) 11,000 11,837
California Municipal Finance Authority Pollution
Control Revenue (Chevron USA Inc. Project)
VRDO 0.690% 6/1/17 2,555 2,555
California Municipal Finance Authority Recovery
Zone Revenue (Chevron USA Inc. Project) VRDO 0.690% 6/1/17 1,300 1,300
California Municipal Finance Authority Revenue
(Anaheim Electric Utility Distribution System) 5.000% 10/1/23 1,200 1,459
California Municipal Finance Authority Revenue
(Anaheim Electric Utility Distribution System) 5.000% 10/1/33 2,120 2,506
California Municipal Finance Authority Revenue
(Anaheim Electric Utility Distribution System) 5.000% 10/1/34 1,340 1,574
California Municipal Finance Authority Revenue
(Anaheim Water System Project Revenue) 4.000% 10/1/34 4,560 4,886
California Municipal Finance Authority Revenue
(Azusa Pacific University) 5.000% 4/1/35 2,000 2,170
California Municipal Finance Authority Revenue
(Azusa Pacific University) 5.000% 4/1/41 4,000 4,306
California Municipal Finance Authority Revenue
(Biola University) 5.000% 10/1/33 625 729
California Municipal Finance Authority Revenue
(Biola University) 5.000% 10/1/38 1,255 1,388
California Municipal Finance Authority Revenue
(Biola University) 5.000% 10/1/42 2,500 2,756
California Municipal Finance Authority Revenue
(Community Hospitals of Central California
Obligated Group) 5.000% 2/1/28 1,800 2,151
California Municipal Finance Authority Revenue
(Community Hospitals of Central California
Obligated Group) 5.000% 2/1/31 2,370 2,761
California Municipal Finance Authority Revenue
(Community Hospitals of Central California
Obligated Group) 5.000% 2/1/40 5,000 5,532
California Municipal Finance Authority Revenue
(Community Hospitals of Central California
Obligated Group) 5.000% 2/1/47 9,200 10,3313 California Municipal Finance Authority Revenue
(Eisenhower Medical Center) 5.000% 7/1/32 750 8673 California Municipal Finance Authority Revenue
(Eisenhower Medical Center) 5.000% 7/1/34 1,750 2,0063 California Municipal Finance Authority Revenue
(Eisenhower Medical Center) 5.000% 7/1/42 5,250 5,942
152

California Long-Term Tax-Exempt Fund
Face Market
Maturity Amount Value•
Coupon Date ($000) ($000)
California Municipal Finance Authority Revenue
(Institute on Aging Project) 5.000% 8/15/37 930 1,085
California Municipal Finance Authority Revenue
(NorthBay Healthcare Group) 5.000% 11/1/35 690 764
California Municipal Finance Authority Revenue
(NorthBay Healthcare Group) 5.250% 11/1/41 5,000 5,671
California Municipal Finance Authority Revenue
(NorthBay Healthcare Group) 5.000% 11/1/44 1,800 1,969
California Municipal Finance Authority Revenue
(University of La Verne) 5.250% 6/1/20 (ETM) 2,420 2,723
California Municipal Finance Authority Student
Housing Revenue (Bowles Hall Foundation) 5.000% 6/1/50 2,580 2,746
California Municipal Finance Authority Water
Revenue (San Bernardino Municipal Water
Department) 5.000% 8/1/46 (15) 7,500 8,578
California Pollution Control Financing Authority
Revenue (Pacific Gas & Electric Co.) VRDO 0.610% 6/1/17 LOC 59,025 59,025
California Pollution Control Financing Authority
Revenue (Pacific Gas & Electric Co.) VRDO 0.640% 6/1/17 LOC 1,250 1,250
California Pollution Control Financing Authority
Water Furnishing Revenue (San Diego County
Water Authority Desalination Project Pipeline) 5.000% 11/21/45 1,500 1,503
California Public Works Board Lease Revenue
(Department of Corrections) 4.500% 9/1/35 4,000 4,383
California Public Works Board Lease Revenue
(Department of General Services) 6.000% 4/1/19 (Prere.) 6,000 6,557
California Public Works Board Lease Revenue
(Department of General Services) 6.250% 4/1/19 (Prere.) 8,250 9,053
California Public Works Board Lease Revenue
(Judicial Council Projects) 5.000% 3/1/29 2,500 2,886
California Public Works Board Lease Revenue
(Judicial Council Projects) 5.000% 3/1/34 1,300 1,475
California Public Works Board Lease Revenue
(Judicial Council Projects) 5.000% 3/1/38 3,375 3,801
California Public Works Board Lease Revenue
(Various Capital Projects) 6.250% 11/1/19 (Prere.) 5,000 5,636
California Public Works Board Lease Revenue
(Various Capital Projects) 5.000% 4/1/23 4,180 4,868
California Public Works Board Lease Revenue
(Various Capital Projects) 5.000% 11/1/23 2,000 2,359
California Public Works Board Lease Revenue
(Various Capital Projects) 5.000% 11/1/26 5,000 5,872
California Public Works Board Lease Revenue
(Various Capital Projects) 4.000% 11/1/30 6,000 6,578
California Public Works Board Lease Revenue
(Various Capital Projects) 4.000% 4/1/33 2,220 2,379
California Public Works Board Lease Revenue
(Various Capital Projects) 5.500% 11/1/33 2,330 2,808
California Public Works Board Lease Revenue
(Various Capital Projects) 5.000% 11/1/37 5,000 5,706
California Public Works Board Lease Revenue
(Various Capital Projects) 5.000% 9/1/39 3,000 3,445
California State University Systemwide Revenue 5.250% 5/1/19 (Prere.) 5,000 5,4141 California State University Systemwide Revenue 5.250% 5/1/19 (Prere.) 3,280 3,551
153

California Long-Term Tax-Exempt Fund
Face Market
Maturity Amount Value•
Coupon Date ($000) ($000)
California State University Systemwide Revenue 5.750% 5/1/19 (Prere.) 4,500 4,915
California State University Systemwide Revenue 5.000% 11/1/24 2,000 2,320
California State University Systemwide Revenue 5.000% 11/1/26 3,000 3,714
California State University Systemwide Revenue 5.000% 11/1/30 13,650 16,522
California State University Systemwide Revenue 5.000% 11/1/30 2,500 3,021
California State University Systemwide Revenue 5.000% 11/1/31 5,150 6,205
California State University Systemwide Revenue 5.000% 11/1/31 7,000 8,277
California State University Systemwide Revenue 5.000% 11/1/32 6,535 7,845
California State University Systemwide Revenue 5.000% 11/1/32 7,000 8,240
California State University Systemwide Revenue 4.000% 11/1/37 1,875 1,994
California State University Systemwide Revenue 5.000% 11/1/37 10,000 11,346
California State University Systemwide Revenue 5.000% 11/1/37 3,750 4,348
California State University Systemwide Revenue 4.000% 11/1/38 1,385 1,469
California State University Systemwide Revenue 5.000% 11/1/38 4,000 4,682
California State University Systemwide Revenue 5.000% 11/1/42 1,355 1,527
California State University Systemwide Revenue 5.000% 11/1/43 1,810 2,102
California State University Systemwide Revenue 5.000% 11/1/47 8,620 9,970
California State University Systemwide Revenue 5.000% 11/1/47 5,720 6,738
California State University Systemwide Revenue
PUT 3.000% 11/1/19 7,000 7,262
California Statewide Communities Development
Authority Pollution Control Revenue (Chevron
USA Inc. Project) VRDO 0.690% 6/1/17 5,100 5,100
California Statewide Communities Development
Authority Revenue (899 Charleston Project) 5.250% 11/1/44 1,000 1,027
California Statewide Communities Development
Authority Revenue (899 Charleston Project) 5.375% 11/1/49 2,300 2,376
California Statewide Communities Development
Authority Revenue (Adventist Health
System/West) 5.000% 3/1/27 2,000 2,438
California Statewide Communities Development
Authority Revenue (Adventist Health
System/West) 5.000% 3/1/31 4,745 5,590
California Statewide Communities Development
Authority Revenue (Adventist Health
System/West) 5.000% 3/1/45 4,315 4,861
California Statewide Communities Development
Authority Revenue (Buck Institute for Age
Research) 5.000% 11/15/29 (4) 940 1,104
California Statewide Communities Development
Authority Revenue (Buck Institute for Age
Research) 5.000% 11/15/44 (4) 5,500 6,234
California Statewide Communities Development
Authority Revenue (Buck Institute for Age
Research) 5.000% 11/15/49 (4) 1,000 1,130
California Statewide Communities Development
Authority Revenue (Cottage Health System
Obligated Group) 5.000% 11/1/39 310 350
California Statewide Communities Development
Authority Revenue (Cottage Health System
Obligated Group) 5.000% 11/1/40 7,200 7,756
California Statewide Communities Development
Authority Revenue (Cottage Health System
Obligated Group) 5.000% 11/1/43 13,705 15,370
154

California Long-Term Tax-Exempt Fund
Face Market
Maturity Amount Value•
Coupon Date ($000) ($000)
California Statewide Communities Development
Authority Revenue (Covenant Retirement
Communities Inc.) 5.625% 12/1/36 4,000 4,553
California Statewide Communities Development
Authority Revenue (Daughters of Charity Health
System) 5.750% 7/1/30 5,000 4,865
California Statewide Communities Development
Authority Revenue (Daughters of Charity Health
System) 5.750% 7/1/35 1,515 1,443
California Statewide Communities Development
Authority Revenue (Episcopal Communities &
Services) 5.000% 5/15/42 2,500 2,700
California Statewide Communities Development
Authority Revenue (Episcopal Communities &
Services) 5.000% 5/15/47 2,000 2,150
California Statewide Communities Development
Authority Revenue (Huntington Memorial
Hospital) 5.000% 7/1/44 5,800 6,342
California Statewide Communities Development
Authority Revenue (John Muir Health) 5.000% 8/15/46 1,500 1,697
California Statewide Communities Development
Authority Revenue (John Muir Health) 5.000% 8/15/51 3,000 3,389
California Statewide Communities Development
Authority Revenue (Kaiser Permanente) 5.000% 4/1/42 15,425 17,185
California Statewide Communities Development
Authority Revenue (Redlands Community
Hospital) 5.000% 10/1/46 1,600 1,762
California Statewide Communities Development
Authority Revenue (Sutter Health) 5.000% 8/15/17 (Prere.) 2,900 2,924
California Statewide Communities Development
Authority Revenue (Sutter Health) 5.250% 8/15/31 2,500 2,861
California Statewide Communities Development
Authority Revenue (Sutter Health) 5.000% 8/15/32 11,000 12,524
California Statewide Communities Development
Authority Revenue (Sutter Health) 5.000% 11/15/38 4,250 4,386
California Statewide Communities Development
Authority Revenue (The Culinary Institute of
America Project) 5.000% 7/1/41 800 884
California Statewide Communities Development
Authority Revenue (Trinity Health) 5.000% 12/1/41 11,000 12,348
California Statewide Communities Development
Authority Senior Living Revenue (Southern
California Presbyterian Homes) 7.250% 11/15/41 3,000 3,332
California Statewide Communities Development
Authority Student Housing Revenue (CHF-Irvine
LLC - UCI East Campus Apartments Phase II) 5.000% 5/15/29 2,000 2,342
California Statewide Communities Development
Authority Student Housing Revenue (CHF-Irvine
LLC - UCI East Campus Apartments Phase II) 5.000% 5/15/30 3,500 4,059
California Statewide Communities Development
Authority Student Housing Revenue (CHF-Irvine
LLC - UCI East Campus Apartments Phase II) 5.000% 5/15/32 2,500 2,875
155

California Long-Term Tax-Exempt Fund
Face Market
Maturity Amount Value•
Coupon Date ($000) ($000)
California Statewide Communities Development
Authority Student Housing Revenue (CHF-Irvine
LLC - UCI East Campus Apartments Phase II) 5.000% 5/15/40 4,445 4,979
Centinela Valley CA Union High School
District GO 6.000% 8/1/23 (Prere.) 3,000 3,821
Centinela Valley CA Union High School
District GO 4.000% 8/1/50 (4) 3,000 3,127
Central School District San Bernardino
California GO 5.000% 8/1/47 3,000 3,493
Cerritos CA Community College District GO 4.000% 8/1/33 2,135 2,286
Cerritos CA Community College District GO 0.000% 8/1/34 4,000 2,135
Cerritos CA Community College District GO 0.000% 8/1/35 1,730 875
Cerritos CA Community College District GO 5.000% 8/1/38 7,000 7,912
Chabot-Las Positas CA Community College
District GO 5.000% 8/1/25 5,000 5,952
Chabot-Las Positas CA Community College
District GO 5.000% 8/1/30 3,500 4,120
Charter Oak CA Unified School District GO 5.000% 8/1/31 (4) 1,380 1,619
Charter Oak CA Unified School District GO 5.000% 8/1/33 (4) 1,755 2,039
Chula Vista CA Redevelopment Agency
Successor Agency Tax Allocation Revenue 4.000% 10/1/25 2,130 2,453
Chula Vista CA Redevelopment Agency
Successor Agency Tax Allocation Revenue 4.000% 10/1/26 1,175 1,352
Citrus CA Community College District GO 0.000% 8/1/36 1,810 1,514
Citrus CA Community College District GO 0.000% 8/1/37 2,475 2,063
Citrus CA Community College District GO 0.000% 8/1/38 2,150 1,787
Coast CA Community College District GO 5.000% 8/1/27 5,700 6,801
Colton CA Joint Unified School District GO 5.000% 8/1/27 (4) 2,535 3,007
Conejo Valley CA Unified School District GO 0.000% 8/1/29 (4) 2,000 1,281
Conejo Valley CA Unified School District GO 0.000% 8/1/30 (4) 1,865 1,120
Contra Costa CA Community College District GO 5.000% 8/1/38 3,600 4,1513 Contra Costa CA Transportation Authority Sales
Tax Revenue 5.000% 3/1/28 900 1,1333 Contra Costa CA Transportation Authority Sales
Tax Revenue 5.000% 3/1/29 1,325 1,654
Contra Costa CA Transportation Authority Sales
Tax Revenue 5.000% 3/1/34 1,970 2,283
Cotati-Rohnert Park CA Unified School District GO 5.000% 8/1/44 (4) 3,000 3,380
Cupertino CA Union School District GO 5.000% 8/1/36 3,000 3,509
Del Mar CA Race Track Authority Revenue 5.000% 10/1/38 1,500 1,502
East Bay CA Municipal Utility District Water
System Revenue 5.000% 6/1/30 3,305 3,919
East Bay CA Municipal Utility District Water
System Revenue 5.000% 6/1/30 1,500 1,779
East Bay CA Regional Park District Revenue 5.000% 9/1/25 2,000 2,183
Eastern California Municipal Water District Water
& Sewer 5.000% 7/1/39 2,030 2,386
Eastern California Municipal Water District Water
& Wastewater Revenue 4.000% 7/1/35 3,780 4,060
El Camino CA Community College District GO 5.000% 8/1/32 1,000 1,207
El Camino CA Community College District GO 5.000% 8/1/33 1,115 1,338
El Camino CA Community College District GO 5.000% 8/1/37 1,550 1,831
El Camino CA Healthcare District GO 4.000% 8/1/34 5,000 5,378
El Dorado CA Irrigation District Revenue 5.250% 3/1/39 (4) 7,500 8,768
156
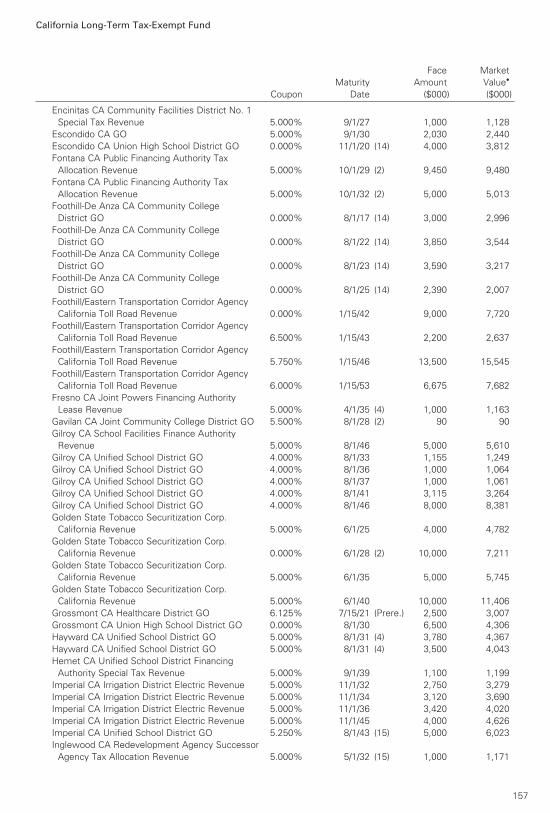
California Long-Term Tax-Exempt Fund
Face Market
Maturity Amount Value•
Coupon Date ($000) ($000)
Encinitas CA Community Facilities District No. 1
Special Tax Revenue 5.000% 9/1/27 1,000 1,128
Escondido CA GO 5.000% 9/1/30 2,030 2,440
Escondido CA Union High School District GO 0.000% 11/1/20 (14) 4,000 3,812
Fontana CA Public Financing Authority Tax
Allocation Revenue 5.000% 10/1/29 (2) 9,450 9,480
Fontana CA Public Financing Authority Tax
Allocation Revenue 5.000% 10/1/32 (2) 5,000 5,013
Foothill-De Anza CA Community College
District GO 0.000% 8/1/17 (14) 3,000 2,996
Foothill-De Anza CA Community College
District GO 0.000% 8/1/22 (14) 3,850 3,544
Foothill-De Anza CA Community College
District GO 0.000% 8/1/23 (14) 3,590 3,217
Foothill-De Anza CA Community College
District GO 0.000% 8/1/25 (14) 2,390 2,007
Foothill/Eastern Transportation Corridor Agency
California Toll Road Revenue 0.000% 1/15/42 9,000 7,720
Foothill/Eastern Transportation Corridor Agency
California Toll Road Revenue 6.500% 1/15/43 2,200 2,637
Foothill/Eastern Transportation Corridor Agency
California Toll Road Revenue 5.750% 1/15/46 13,500 15,545
Foothill/Eastern Transportation Corridor Agency
California Toll Road Revenue 6.000% 1/15/53 6,675 7,682
Fresno CA Joint Powers Financing Authority
Lease Revenue 5.000% 4/1/35 (4) 1,000 1,163
Gavilan CA Joint Community College District GO 5.500% 8/1/28 (2) 90 90
Gilroy CA School Facilities Finance Authority
Revenue 5.000% 8/1/46 5,000 5,610
Gilroy CA Unified School District GO 4.000% 8/1/33 1,155 1,249
Gilroy CA Unified School District GO 4.000% 8/1/36 1,000 1,064
Gilroy CA Unified School District GO 4.000% 8/1/37 1,000 1,061
Gilroy CA Unified School District GO 4.000% 8/1/41 3,115 3,264
Gilroy CA Unified School District GO 4.000% 8/1/46 8,000 8,381
Golden State Tobacco Securitization Corp.
California Revenue 5.000% 6/1/25 4,000 4,782
Golden State Tobacco Securitization Corp.
California Revenue 0.000% 6/1/28 (2) 10,000 7,211
Golden State Tobacco Securitization Corp.
California Revenue 5.000% 6/1/35 5,000 5,745
Golden State Tobacco Securitization Corp.
California Revenue 5.000% 6/1/40 10,000 11,406
Grossmont CA Healthcare District GO 6.125% 7/15/21 (Prere.) 2,500 3,007
Grossmont CA Union High School District GO 0.000% 8/1/30 6,500 4,306
Hayward CA Unified School District GO 5.000% 8/1/31 (4) 3,780 4,367
Hayward CA Unified School District GO 5.000% 8/1/31 (4) 3,500 4,043
Hemet CA Unified School District Financing
Authority Special Tax Revenue 5.000% 9/1/39 1,100 1,199
Imperial CA Irrigation District Electric Revenue 5.000% 11/1/32 2,750 3,279
Imperial CA Irrigation District Electric Revenue 5.000% 11/1/34 3,120 3,690
Imperial CA Irrigation District Electric Revenue 5.000% 11/1/36 3,420 4,020
Imperial CA Irrigation District Electric Revenue 5.000% 11/1/45 4,000 4,626
Imperial CA Unified School District GO 5.250% 8/1/43 (15) 5,000 6,023
Inglewood CA Redevelopment Agency Successor
Agency Tax Allocation Revenue 5.000% 5/1/32 (15) 1,000 1,171
157

California Long-Term Tax-Exempt Fund
Face Market
Maturity Amount Value•
Coupon Date ($000) ($000)
Inglewood CA Redevelopment Agency Successor
Agency Tax Allocation Revenue 5.000% 5/1/34 (15) 600 696
Inglewood CA Redevelopment Agency Successor
Agency Tax Allocation Revenue 5.000% 5/1/38 (15) 500 574
Irvine CA Assessment District No. 97-17
Improvement Revenue VRDO 0.760% 6/1/17 LOC 240 240
Irvine CA Public Facilities & Infrastructure
Authority Assessment Revenue VRDO 0.760% 6/1/17 LOC 3,623 3,623
Irvine CA Reassessment District No. 05-21
Improvement Revenue VRDO 0.760% 6/1/17 LOC 2,400 2,400
Irvine Ranch CA Water District COP 5.000% 3/1/46 5,000 5,900
Jefferson CA Union High School District GO 5.000% 8/1/26 (15) 1,000 1,220
Kern County CA GO 5.750% 2/1/19 (Prere.) 2,000 2,161
La Quinta CA Redevelopment Agency Tax
Allocation Revenue 5.000% 9/1/34 1,050 1,199
La Verne CA (Brethren Hillcrest Homes) COP 5.000% 5/15/36 2,450 2,596
Lancaster CA Redevelopment Agency Successor
Agency Tax Allocation Revenue 5.000% 8/1/29 1,000 1,173
Lancaster CA Redevelopment Agency Successor
Agency Tax Allocation Revenue 5.000% 8/1/30 1,255 1,467
Las Virgenes CA Unified School District GO 0.000% 9/1/26 (14) 6,140 4,894
Long Beach CA Airport Revenue 5.000% 6/1/40 4,440 4,848
Long Beach CA Community College District GO 0.000% 8/1/34 2,520 1,345
Long Beach CA Finance Authority Natural Gas
Purchase Revenue 2.222% 11/15/26 1,800 1,698
Long Beach CA Finance Authority Natural Gas
Purchase Revenue 5.000% 11/15/29 1,165 1,386
Long Beach CA Finance Authority Natural Gas
Purchase Revenue 5.000% 11/15/35 1,180 1,426
Long Beach CA Finance Authority Natural Gas
Purchase Revenue 5.500% 11/15/37 2,600 3,355
Long Beach CA Finance Authority Tax Revenue 5.500% 8/1/26 (2) 7,570 9,097
Long Beach CA Finance Authority Tax Revenue 5.500% 8/1/31 (2) 4,015 5,039
Long Beach CA Harbor Revenue 5.000% 5/15/39 1,500 1,741
Long Beach CA Harbor Revenue 5.000% 5/15/42 2,000 2,316
Long Beach CA Unified School District GO 0.000% 8/1/26 1,870 1,453
Los Angeles CA Community College District GO 5.250% 8/1/20 (Prere.) 5,000 5,664
Los Angeles CA Community College District GO 5.000% 8/1/28 3,500 4,230
Los Angeles CA Community College District GO 5.000% 8/1/28 6,000 7,251
Los Angeles CA Community College District GO 4.000% 8/1/29 1,250 1,423
Los Angeles CA Community College District GO 5.000% 8/1/30 5,500 6,606
Los Angeles CA Community College District GO 4.000% 8/1/31 1,700 1,892
Los Angeles CA Community College District GO 4.000% 8/1/33 3,500 3,787
Los Angeles CA Department of Airports
International Airport Revenue 5.250% 5/15/27 5,000 5,615
Los Angeles CA Department of Airports
International Airport Revenue 5.000% 5/15/29 5,000 5,572
Los Angeles CA Department of Airports
International Airport Revenue 5.000% 5/15/30 3,195 3,516
Los Angeles CA Department of Airports
International Airport Revenue 5.000% 5/15/30 14,590 16,092
Los Angeles CA Department of Airports
International Airport Revenue 5.000% 5/15/35 16,000 18,254
Los Angeles CA Department of Airports
International Airport Revenue 5.000% 5/15/35 4,000 4,419
158
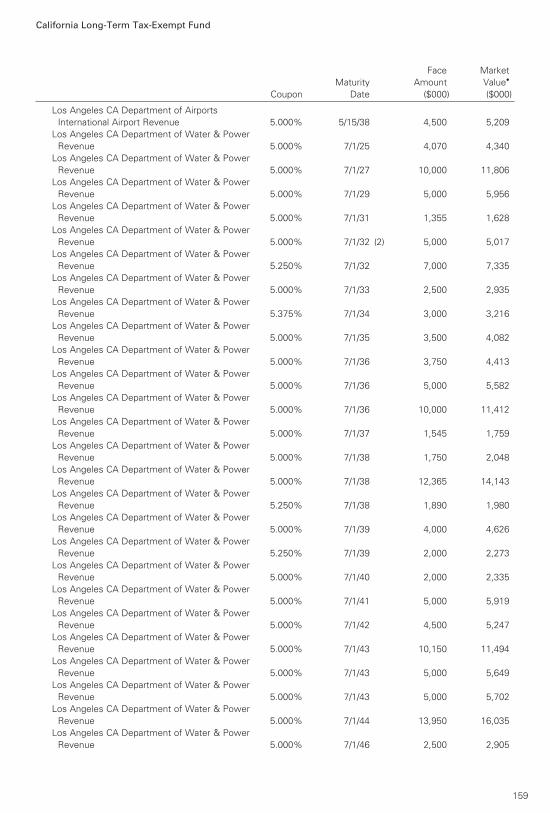
California Long-Term Tax-Exempt Fund
Face Market
Maturity Amount Value•
Coupon Date ($000) ($000)
Los Angeles CA Department of Airports
International Airport Revenue 5.000% 5/15/38 4,500 5,209
Los Angeles CA Department of Water & Power
Revenue 5.000% 7/1/25 4,070 4,340
Los Angeles CA Department of Water & Power
Revenue 5.000% 7/1/27 10,000 11,806
Los Angeles CA Department of Water & Power
Revenue 5.000% 7/1/29 5,000 5,956
Los Angeles CA Department of Water & Power
Revenue 5.000% 7/1/31 1,355 1,628
Los Angeles CA Department of Water & Power
Revenue 5.000% 7/1/32 (2) 5,000 5,017
Los Angeles CA Department of Water & Power
Revenue 5.250% 7/1/32 7,000 7,335
Los Angeles CA Department of Water & Power
Revenue 5.000% 7/1/33 2,500 2,935
Los Angeles CA Department of Water & Power
Revenue 5.375% 7/1/34 3,000 3,216
Los Angeles CA Department of Water & Power
Revenue 5.000% 7/1/35 3,500 4,082
Los Angeles CA Department of Water & Power
Revenue 5.000% 7/1/36 3,750 4,413
Los Angeles CA Department of Water & Power
Revenue 5.000% 7/1/36 5,000 5,582
Los Angeles CA Department of Water & Power
Revenue 5.000% 7/1/36 10,000 11,412
Los Angeles CA Department of Water & Power
Revenue 5.000% 7/1/37 1,545 1,759
Los Angeles CA Department of Water & Power
Revenue 5.000% 7/1/38 1,750 2,048
Los Angeles CA Department of Water & Power
Revenue 5.000% 7/1/38 12,365 14,143
Los Angeles CA Department of Water & Power
Revenue 5.250% 7/1/38 1,890 1,980
Los Angeles CA Department of Water & Power
Revenue 5.000% 7/1/39 4,000 4,626
Los Angeles CA Department of Water & Power
Revenue 5.250% 7/1/39 2,000 2,273
Los Angeles CA Department of Water & Power
Revenue 5.000% 7/1/40 2,000 2,335
Los Angeles CA Department of Water & Power
Revenue 5.000% 7/1/41 5,000 5,919
Los Angeles CA Department of Water & Power
Revenue 5.000% 7/1/42 4,500 5,247
Los Angeles CA Department of Water & Power
Revenue 5.000% 7/1/43 10,150 11,494
Los Angeles CA Department of Water & Power
Revenue 5.000% 7/1/43 5,000 5,649
Los Angeles CA Department of Water & Power
Revenue 5.000% 7/1/43 5,000 5,702
Los Angeles CA Department of Water & Power
Revenue 5.000% 7/1/44 13,950 16,035
Los Angeles CA Department of Water & Power
Revenue 5.000% 7/1/46 2,500 2,905
159
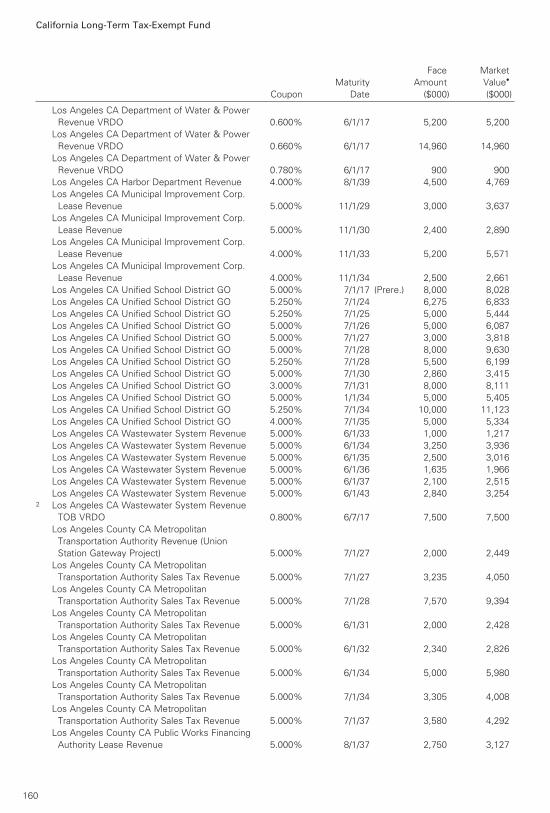
California Long-Term Tax-Exempt Fund
Face Market
Maturity Amount Value•
Coupon Date ($000) ($000)
Los Angeles CA Department of Water & Power
Revenue VRDO 0.600% 6/1/17 5,200 5,200
Los Angeles CA Department of Water & Power
Revenue VRDO 0.660% 6/1/17 14,960 14,960
Los Angeles CA Department of Water & Power
Revenue VRDO 0.780% 6/1/17 900 900
Los Angeles CA Harbor Department Revenue 4.000% 8/1/39 4,500 4,769
Los Angeles CA Municipal Improvement Corp.
Lease Revenue 5.000% 11/1/29 3,000 3,637
Los Angeles CA Municipal Improvement Corp.
Lease Revenue 5.000% 11/1/30 2,400 2,890
Los Angeles CA Municipal Improvement Corp.
Lease Revenue 4.000% 11/1/33 5,200 5,571
Los Angeles CA Municipal Improvement Corp.
Lease Revenue 4.000% 11/1/34 2,500 2,661
Los Angeles CA Unified School District GO 5.000% 7/1/17 (Prere.) 8,000 8,028
Los Angeles CA Unified School District GO 5.250% 7/1/24 6,275 6,833
Los Angeles CA Unified School District GO 5.250% 7/1/25 5,000 5,444
Los Angeles CA Unified School District GO 5.000% 7/1/26 5,000 6,087
Los Angeles CA Unified School District GO 5.000% 7/1/27 3,000 3,818
Los Angeles CA Unified School District GO 5.000% 7/1/28 8,000 9,630
Los Angeles CA Unified School District GO 5.250% 7/1/28 5,500 6,199
Los Angeles CA Unified School District GO 5.000% 7/1/30 2,860 3,415
Los Angeles CA Unified School District GO 3.000% 7/1/31 8,000 8,111
Los Angeles CA Unified School District GO 5.000% 1/1/34 5,000 5,405
Los Angeles CA Unified School District GO 5.250% 7/1/34 10,000 11,123
Los Angeles CA Unified School District GO 4.000% 7/1/35 5,000 5,334
Los Angeles CA Wastewater System Revenue 5.000% 6/1/33 1,000 1,217
Los Angeles CA Wastewater System Revenue 5.000% 6/1/34 3,250 3,936
Los Angeles CA Wastewater System Revenue 5.000% 6/1/35 2,500 3,016
Los Angeles CA Wastewater System Revenue 5.000% 6/1/36 1,635 1,966
Los Angeles CA Wastewater System Revenue 5.000% 6/1/37 2,100 2,515
Los Angeles CA Wastewater System Revenue 5.000% 6/1/43 2,840 3,2542 Los Angeles CA Wastewater System Revenue
TOB VRDO 0.800% 6/7/17 7,500 7,500
Los Angeles County CA Metropolitan
Transportation Authority Revenue (Union
Station Gateway Project) 5.000% 7/1/27 2,000 2,449
Los Angeles County CA Metropolitan
Transportation Authority Sales Tax Revenue 5.000% 7/1/27 3,235 4,050
Los Angeles County CA Metropolitan
Transportation Authority Sales Tax Revenue 5.000% 7/1/28 7,570 9,394
Los Angeles County CA Metropolitan
Transportation Authority Sales Tax Revenue 5.000% 6/1/31 2,000 2,428
Los Angeles County CA Metropolitan
Transportation Authority Sales Tax Revenue 5.000% 6/1/32 2,340 2,826
Los Angeles County CA Metropolitan
Transportation Authority Sales Tax Revenue 5.000% 6/1/34 5,000 5,980
Los Angeles County CA Metropolitan
Transportation Authority Sales Tax Revenue 5.000% 7/1/34 3,305 4,008
Los Angeles County CA Metropolitan
Transportation Authority Sales Tax Revenue 5.000% 7/1/37 3,580 4,292
Los Angeles County CA Public Works Financing
Authority Lease Revenue 5.000% 8/1/37 2,750 3,127
160
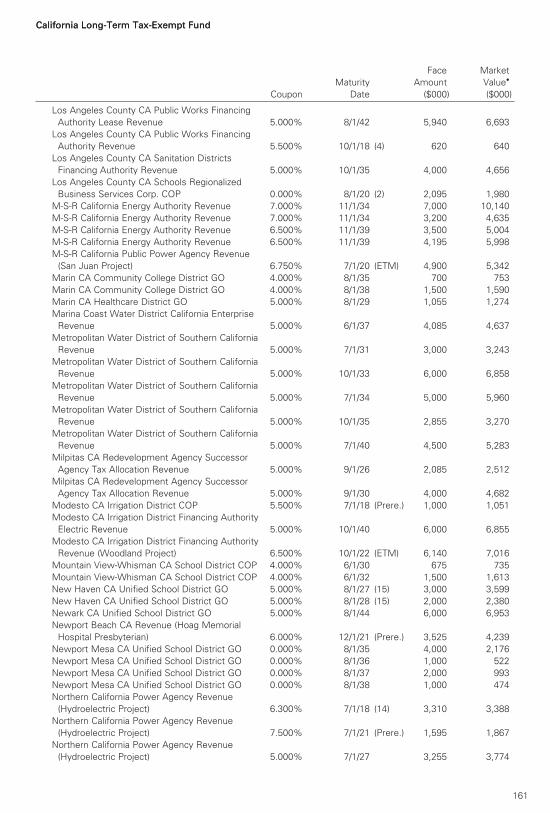
California Long-Term Tax-Exempt Fund
Face Market
Maturity Amount Value•
Coupon Date ($000) ($000)
California Long-Term Tax-Exempt Fund
Los Angeles County CA Public Works Financing
Authority Lease Revenue 5.000% 8/1/42 5,940 6,693
Los Angeles County CA Public Works Financing
Authority Revenue 5.500% 10/1/18 (4) 620 640
Los Angeles County CA Sanitation Districts
Financing Authority Revenue 5.000% 10/1/35 4,000 4,656
Los Angeles County CA Schools Regionalized
Business Services Corp. COP 0.000% 8/1/20 (2) 2,095 1,980
M-S-R California Energy Authority Revenue 7.000% 11/1/34 7,000 10,140
M-S-R California Energy Authority Revenue 7.000% 11/1/34 3,200 4,635
M-S-R California Energy Authority Revenue 6.500% 11/1/39 3,500 5,004
M-S-R California Energy Authority Revenue 6.500% 11/1/39 4,195 5,998
M-S-R California Public Power Agency Revenue
(San Juan Project) 6.750% 7/1/20 (ETM) 4,900 5,342
Marin CA Community College District GO 4.000% 8/1/35 700 753
Marin CA Community College District GO 4.000% 8/1/38 1,500 1,590
Marin CA Healthcare District GO 5.000% 8/1/29 1,055 1,274
Marina Coast Water District California Enterprise
Revenue 5.000% 6/1/37 4,085 4,637
Metropolitan Water District of Southern California
Revenue 5.000% 7/1/31 3,000 3,243
Metropolitan Water District of Southern California
Revenue 5.000% 10/1/33 6,000 6,858
Metropolitan Water District of Southern California
Revenue 5.000% 7/1/34 5,000 5,960
Metropolitan Water District of Southern California
Revenue 5.000% 10/1/35 2,855 3,270
Metropolitan Water District of Southern California
Revenue 5.000% 7/1/40 4,500 5,283
Milpitas CA Redevelopment Agency Successor
Agency Tax Allocation Revenue 5.000% 9/1/26 2,085 2,512
Milpitas CA Redevelopment Agency Successor
Agency Tax Allocation Revenue 5.000% 9/1/30 4,000 4,682
Modesto CA Irrigation District COP 5.500% 7/1/18 (Prere.) 1,000 1,051
Modesto CA Irrigation District Financing Authority
Electric Revenue 5.000% 10/1/40 6,000 6,855
Modesto CA Irrigation District Financing Authority
Revenue (Woodland Project) 6.500% 10/1/22 (ETM) 6,140 7,016
Mountain View-Whisman CA School District COP 4.000% 6/1/30 675 735
Mountain View-Whisman CA School District COP 4.000% 6/1/32 1,500 1,613
New Haven CA Unified School District GO 5.000% 8/1/27 (15) 3,000 3,599
New Haven CA Unified School District GO 5.000% 8/1/28 (15) 2,000 2,380
Newark CA Unified School District GO 5.000% 8/1/44 6,000 6,953
Newport Beach CA Revenue (Hoag Memorial
Hospital Presbyterian) 6.000% 12/1/21 (Prere.) 3,525 4,239
Newport Mesa CA Unified School District GO 0.000% 8/1/35 4,000 2,176
Newport Mesa CA Unified School District GO 0.000% 8/1/36 1,000 522
Newport Mesa CA Unified School District GO 0.000% 8/1/37 2,000 993
Newport Mesa CA Unified School District GO 0.000% 8/1/38 1,000 474
Northern California Power Agency Revenue
(Hydroelectric Project) 6.300% 7/1/18 (14) 3,310 3,388
Northern California Power Agency Revenue
(Hydroelectric Project) 7.500% 7/1/21 (Prere.) 1,595 1,867
Northern California Power Agency Revenue
(Hydroelectric Project) 5.000% 7/1/27 3,255 3,774
161
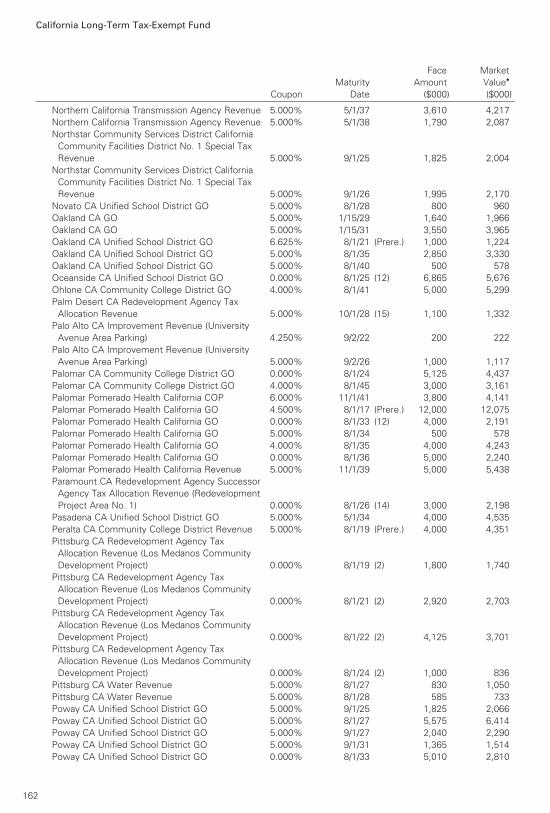
California Long-Term Tax-Exempt Fund
Face Market
Maturity Amount Value•
Coupon Date ($000) ($000)
Northern California Transmission Agency Revenue 5.000% 5/1/37 3,610 4,217
Northern California Transmission Agency Revenue 5.000% 5/1/38 1,790 2,087
Northstar Community Services District California
Community Facilities District No. 1 Special Tax
Revenue 5.000% 9/1/25 1,825 2,004
Northstar Community Services District California
Community Facilities District No. 1 Special Tax
Revenue 5.000% 9/1/26 1,995 2,170
Novato CA Unified School District GO 5.000% 8/1/28 800 960
Oakland CA GO 5.000% 1/15/29 1,640 1,966
Oakland CA GO 5.000% 1/15/31 3,550 3,965
Oakland CA Unified School District GO 6.625% 8/1/21 (Prere.) 1,000 1,224
Oakland CA Unified School District GO 5.000% 8/1/35 2,850 3,330
Oakland CA Unified School District GO 5.000% 8/1/40 500 578
Oceanside CA Unified School District GO 0.000% 8/1/25 (12) 6,865 5,676
Ohlone CA Community College District GO 4.000% 8/1/41 5,000 5,299
Palm Desert CA Redevelopment Agency Tax
Allocation Revenue 5.000% 10/1/28 (15) 1,100 1,332
Palo Alto CA Improvement Revenue (University
Avenue Area Parking) 4.250% 9/2/22 200 222
Palo Alto CA Improvement Revenue (University
Avenue Area Parking) 5.000% 9/2/26 1,000 1,117
Palomar CA Community College District GO 0.000% 8/1/24 5,125 4,437
Palomar CA Community College District GO 4.000% 8/1/45 3,000 3,161
Palomar Pomerado Health California COP 6.000% 11/1/41 3,800 4,141
Palomar Pomerado Health California GO 4.500% 8/1/17 (Prere.) 12,000 12,075
Palomar Pomerado Health California GO 0.000% 8/1/33 (12) 4,000 2,191
Palomar Pomerado Health California GO 5.000% 8/1/34 500 578
Palomar Pomerado Health California GO 4.000% 8/1/35 4,000 4,243
Palomar Pomerado Health California GO 0.000% 8/1/36 5,000 2,240
Palomar Pomerado Health California Revenue 5.000% 11/1/39 5,000 5,438
Paramount CA Redevelopment Agency Successor
Agency Tax Allocation Revenue (Redevelopment
Project Area No. 1) 0.000% 8/1/26 (14) 3,000 2,198
Pasadena CA Unified School District GO 5.000% 5/1/34 4,000 4,535
Peralta CA Community College District Revenue 5.000% 8/1/19 (Prere.) 4,000 4,351
Pittsburg CA Redevelopment Agency Tax
Allocation Revenue (Los Medanos Community
Development Project) 0.000% 8/1/19 (2) 1,800 1,740
Pittsburg CA Redevelopment Agency Tax
Allocation Revenue (Los Medanos Community
Development Project) 0.000% 8/1/21 (2) 2,920 2,703
Pittsburg CA Redevelopment Agency Tax
Allocation Revenue (Los Medanos Community
Development Project) 0.000% 8/1/22 (2) 4,125 3,701
Pittsburg CA Redevelopment Agency Tax
Allocation Revenue (Los Medanos Community
Development Project) 0.000% 8/1/24 (2) 1,000 836
Pittsburg CA Water Revenue 5.000% 8/1/27 830 1,050
Pittsburg CA Water Revenue 5.000% 8/1/28 585 733
Poway CA Unified School District GO 5.000% 9/1/25 1,825 2,066
Poway CA Unified School District GO 5.000% 8/1/27 5,575 6,414
Poway CA Unified School District GO 5.000% 9/1/27 2,040 2,290
Poway CA Unified School District GO 5.000% 9/1/31 1,365 1,514
Poway CA Unified School District GO 0.000% 8/1/33 5,010 2,810
162

California Long-Term Tax-Exempt Fund
Face Market
Maturity Amount Value•
Coupon Date ($000) ($000)
Poway CA Unified School District GO 5.000% 9/1/33 990 1,092
Poway CA Unified School District GO 0.000% 8/1/34 8,130 4,304
Poway CA Unified School District GO 5.000% 9/1/36 680 746
Poway CA Unified School District GO 0.000% 8/1/46 10,000 2,975
Poway CA Unified School District GO 0.000% 8/1/51 10,000 2,433
Poway CA Unified School District Public Financing
Authority Community Facilities District No. 11
Zones 2 & 3 Special Tax Revenue 5.000% 9/15/38 1,210 1,310
Poway CA Unified School District Public Financing
Authority Community Facilities District No. 11
Zones 2 & 3 Special Tax Revenue 5.000% 9/15/43 2,435 2,623
Poway CA Unified School District Public Financing
Authority Special Tax Revenue 5.000% 9/15/24 785 916
Poway CA Unified School District Public Financing
Authority Special Tax Revenue 5.000% 9/1/27 1,385 1,680
Poway CA Unified School District Public Financing
Authority Special Tax Revenue 5.000% 9/15/27 1,030 1,179
Poway CA Unified School District Public Financing
Authority Special Tax Revenue 5.000% 9/1/28 2,340 2,816
Poway CA Unified School District Public Financing
Authority Special Tax Revenue 5.000% 9/1/29 3,485 4,157
Poway CA Unified School District Public Financing
Authority Special Tax Revenue 5.000% 9/1/30 1,785 2,116
Poway CA Unified School District Public Financing
Authority Special Tax Revenue 5.000% 9/1/33 (15) 1,760 2,034
Rancho Cucamonga CA Redevelopment Agency
Successor Agency Tax Allocation Revenue
(Rancho Redevelopment Project) 5.000% 9/1/29 (4) 1,800 2,093
Redding CA Electric System Revenue 5.000% 6/1/30 1,665 2,023
Redding CA Joint Powers Financing Authority
Electric System Revenue 5.000% 6/1/29 1,000 1,184
Redding CA Joint Powers Financing Authority
Electric System Revenue 5.000% 6/1/31 600 702
Redwood City CA Redevelopment Agency
Redevelopment Project Area No. 2 Tax
Allocation Revenue 0.000% 7/15/26 (2) 3,445 2,587
Rio Hondo CA Community College District GO 5.000% 8/1/30 6,655 7,214
Rio Hondo CA Community College District GO 0.000% 8/1/36 16,650 8,200
Riverside CA COP VRDO 0.760% 6/7/17 LOC 6,160 6,1602 Riverside CA Electric Revenue TOB VRDO 0.800% 6/7/17 2,800 2,800
Riverside CA Unified School District Financing
Authority Revenue 5.000% 9/1/22 1,335 1,570
Riverside CA Unified School District Financing
Authority Revenue 5.000% 9/1/24 1,440 1,666
Riverside CA Unified School District Financing
Authority Revenue 5.000% 9/1/28 1,795 2,014
Riverside CA Unified School District Financing
Authority Revenue 5.000% 9/1/29 1,880 2,098
Riverside CA Unified School District Financing
Authority Revenue 5.000% 9/1/32 1,375 1,518
Riverside County CA Public Financing Authority
Lease Revenue 5.000% 11/1/33 5,000 5,779
Riverside County CA Public Financing Authority
Lease Revenue 5.250% 11/1/40 5,000 5,884
163

California Long-Term Tax-Exempt Fund
Face Market
Maturity Amount Value•
Coupon Date ($000) ($000)
Riverside County CA Public Financing Authority
Lease Revenue 5.250% 11/1/45 8,000 9,388
Riverside County CA Redevelopment Successor
Agency Tax Allocation Revenue 4.000% 10/1/37 (4) 1,500 1,578
Riverside County CA Transportation Commission
Toll Revenue 0.000% 6/1/41 6,710 2,162
Riverside County CA Transportation Commission
Toll Revenue 0.000% 6/1/42 2,975 901
Riverside County CA Transportation Commission
Toll Revenue 0.000% 6/1/43 7,500 2,111
Riverside County CA Transportation Commission
Toll Revenue 5.750% 6/1/48 2,000 2,267
Roseville CA Financing Authority Electric System
Revenue 5.000% 2/1/20 (Prere.) 4,500 4,972
Roseville CA Financing Authority Electric System
Revenue 4.000% 2/1/37 7,480 7,955
Roseville CA Natural Gas Financing Authority Gas
Revenue 5.000% 2/15/18 620 635
Roseville CA Natural Gas Financing Authority Gas
Revenue 5.000% 2/15/22 1,610 1,791
Roseville CA Natural Gas Financing Authority Gas
Revenue 5.000% 2/15/28 2,450 2,852
Roseville CA Special Tax Revenue 5.000% 9/1/37 1,250 1,367
Sacramento CA Area Flood Control Agency
Special Assessment Revenue (Natomas Basin
Local Assessment) 5.000% 10/1/39 (15) 1,900 2,165
Sacramento CA Area Flood Control Agency
Special Assessment Revenue (Natomas Basin
Local Assessment) 5.000% 10/1/44 (15) 2,000 2,267
Sacramento CA City Financing Authority Tax
Allocation Revenue 0.000% 12/1/30 (14) 3,000 1,871
Sacramento CA Financing Authority Lease
Revenue 5.400% 11/1/20 (2) 4,760 5,130
Sacramento CA Municipal Utility District
Financing Authority Revenue 5.000% 7/1/26 5,250 6,475
Sacramento CA Municipal Utility District
Financing Authority Revenue 5.000% 7/1/27 5,000 6,123
Sacramento CA Municipal Utility District Revenue 5.000% 8/15/28 2,000 2,366
Sacramento CA Municipal Utility District Revenue 5.000% 8/15/31 1,175 1,350
Sacramento CA Municipal Utility District Revenue 5.000% 8/15/32 1,195 1,373
Sacramento CA Municipal Utility District Revenue 5.000% 8/15/33 1,450 1,666
Sacramento CA Regional Transportation District
Farebox Revenue 5.000% 9/1/20 (Prere.) 1,875 2,110
Sacramento CA Regional Transportation District
Farebox Revenue 5.000% 9/1/20 (Prere.) 1,630 1,835
Sacramento CA Regional Transportation District
Farebox Revenue 5.000% 3/1/36 1,370 1,503
Sacramento CA Regional Transportation District
Farebox Revenue 5.000% 3/1/42 3,125 3,418
Sacramento County CA Airport Revenue 5.000% 7/1/41 7,500 8,563
Sacramento County CA Airport Revenue 5.000% 7/1/41 3,000 3,415
Sacramento County CA Sanitation Districts
Financing Authority Revenue 5.000% 8/1/32 1,000 1,183
Sacramento County CA Sanitation Districts
Financing Authority Revenue 5.000% 12/1/35 4,920 5,750
164

California Long-Term Tax-Exempt Fund
Face Market
Maturity Amount Value•
Coupon Date ($000) ($000)
San Bernardino CA City Unified School
District GO 5.000% 8/1/27 (4) 1,060 1,257
San Bernardino CA City Unified School
District GO 0.000% 8/1/35 (4) 5,900 2,961
San Bernardino CA City Unified School
District GO 0.000% 8/1/36 (4) 5,000 2,375
San Bernardino CA Community College
District GO 0.000% 8/1/44 15,000 4,722
San Bernardino CA Community College
District GO 5.000% 8/1/45 3,500 4,034
San Bernardino CA Community College
District GO 0.000% 8/1/48 17,770 4,939
San Bernardino County CA Medical Center COP 6.500% 8/1/17 (14) 3,090 3,119
San Bernardino County CA Transportation
Authority Revenue 5.000% 3/1/32 4,035 4,604
San Diego CA Community College District GO 5.250% 8/1/19 (Prere.) 2,500 2,732
San Diego CA Community College District GO 5.000% 8/1/21 (Prere.) 2,500 2,899
San Diego CA Community College District GO 5.000% 8/1/21 (Prere.) 3,000 3,479
San Diego CA Community College District GO 4.000% 8/1/32 3,200 3,533
San Diego CA Community College District GO 4.000% 8/1/32 5,300 5,852
San Diego CA Community College District GO 0.000% 8/1/36 8,000 4,091
San Diego CA Community College District GO 0.000% 8/1/38 3,510 1,615
San Diego CA Public Facilities Financing
Authority Sewer Revenue 5.250% 5/15/19 (Prere.) 7,000 7,591
San Diego CA Public Facilities Financing
Authority Sewer Revenue 5.250% 5/15/19 (Prere.) 6,000 6,506
San Diego CA Public Facilities Financing
Authority Water Revenue 5.500% 8/1/19 (Prere.) 5,000 5,489
San Diego CA Public Facilities Financing
Authority Water Revenue 5.750% 8/1/19 (Prere.) 2,500 2,758
San Diego CA Public Facilities Financing
Authority Water Revenue 5.000% 8/1/28 5,000 6,177
San Diego CA Public Facilities Financing
Authority Water Revenue 5.000% 8/1/35 5,000 5,955
San Diego CA Public Facilities Financing
Authority Water Revenue 5.000% 8/1/36 5,000 5,937
San Diego CA Unified School District GO 5.500% 7/1/24 (14) 5,000 6,343
San Diego CA Unified School District GO 5.000% 7/1/27 5,000 6,135
San Diego CA Unified School District GO 5.000% 7/1/28 7,000 8,514
San Diego CA Unified School District GO 0.000% 7/1/29 8,150 5,630
San Diego CA Unified School District GO 0.000% 7/1/30 1,500 991
San Diego CA Unified School District GO 0.000% 7/1/31 1,500 947
San Diego CA Unified School District GO 0.000% 7/1/32 1,085 649
San Diego CA Unified School District GO 4.000% 7/1/34 1,210 1,301
San Diego CA Unified School District GO 5.000% 7/1/35 5,000 5,790
San Diego CA Unified School District GO 0.000% 7/1/38 4,890 2,234
San Diego CA Unified School District GO 4.000% 7/1/45 8,000 8,342
San Diego CA Unified School District GO 0.000% 7/1/46 10,000 3,284
San Diego County CA COP 5.000% 10/15/28 1,445 1,753
San Diego County CA Regional Airport
Authority Revenue 5.000% 7/1/26 4,000 4,446
San Diego County CA Regional Airport
Authority Revenue 5.000% 7/1/28 3,200 3,547
San Diego County CA Regional Airport
Authority Revenue 5.000% 7/1/34 2,715 2,984
165

California Long-Term Tax-Exempt Fund
Face Market
Maturity Amount Value•
Coupon Date ($000) ($000)
California Long-Term Tax-Exempt Fund
San Diego County CA Regional Airport
Authority Revenue 5.000% 4/1/37 1,500 1,711
San Diego County CA Regional Airport
Authority Revenue 5.000% 4/1/38 2,000 2,281
San Diego County CA Regional Airport
Authority Revenue 5.000% 7/1/40 3,000 3,290
San Diego County CA Regional Airport
Authority Revenue 5.000% 7/1/43 3,540 3,966
San Diego County CA Water Authority Revenue 5.000% 5/1/30 5,000 6,099
San Diego County CA Water Authority Revenue 5.000% 5/1/36 8,350 9,9062 San Diego County CA Water Authority Revenue
COP TOB VRDO 0.800% 6/7/17 2,510 2,510
San Francisco CA Bay Area Rapid Transit
District GO 5.000% 8/1/31 7,000 8,458
San Francisco CA Bay Area Rapid Transit
District GO 5.000% 8/1/32 1,150 1,424
San Francisco CA Bay Area Rapid Transit
District Sales Tax Revenue 5.000% 7/1/30 1,550 1,873
San Francisco CA Bay Area Rapid Transit
District Sales Tax Revenue 5.000% 7/1/30 2,120 2,486
San Francisco CA City & County COP 4.000% 9/1/33 5,855 6,248
San Francisco CA City & County International
Airport Revenue 5.000% 5/3/21 (Prere.) 1,485 1,709
San Francisco CA City & County International
Airport Revenue 5.000% 5/1/29 2,250 2,733
San Francisco CA City & County International
Airport Revenue 5.000% 5/1/29 2,065 2,405
San Francisco CA City & County International
Airport Revenue 5.000% 5/1/30 980 1,179
San Francisco CA City & County International
Airport Revenue 5.000% 5/1/32 1,000 1,189
San Francisco CA City & County International
Airport Revenue 5.000% 5/1/43 8,000 8,912
San Francisco CA City & County International
Airport Revenue 5.000% 5/1/44 6,000 6,821
San Francisco CA City & County International
Airport Revenue 5.000% 5/1/46 15,930 18,352
San Francisco CA City & County Public Utilities
Commission Wastewater Revenue 5.000% 10/1/27 3,190 3,916
San Francisco CA City & County Public Utilities
Commission Wastewater Revenue 5.000% 10/1/34 2,675 3,155
San Francisco CA City & County Public Utilities
Commission Wastewater Revenue 5.000% 10/1/35 2,815 3,309
San Francisco CA City & County Public Utilities
Commission Wastewater Revenue 5.000% 10/1/36 2,960 3,470
San Francisco CA City & County Public Utilities
Commission Water Revenue 5.000% 10/1/29 12,680 14,805
San Francisco CA City & County Public Utilities
Commission Water Revenue 5.000% 11/1/29 5,000 5,801
San Francisco CA City & County Public Utilities
Commission Water Revenue 5.000% 11/1/29 5,000 6,162
San Francisco CA City & County Public Utilities
Commission Water Revenue 5.000% 11/1/31 1,100 1,262
San Francisco CA City & County Public Utilities
Commission Water Revenue 5.000% 11/1/31 1,205 1,383
166
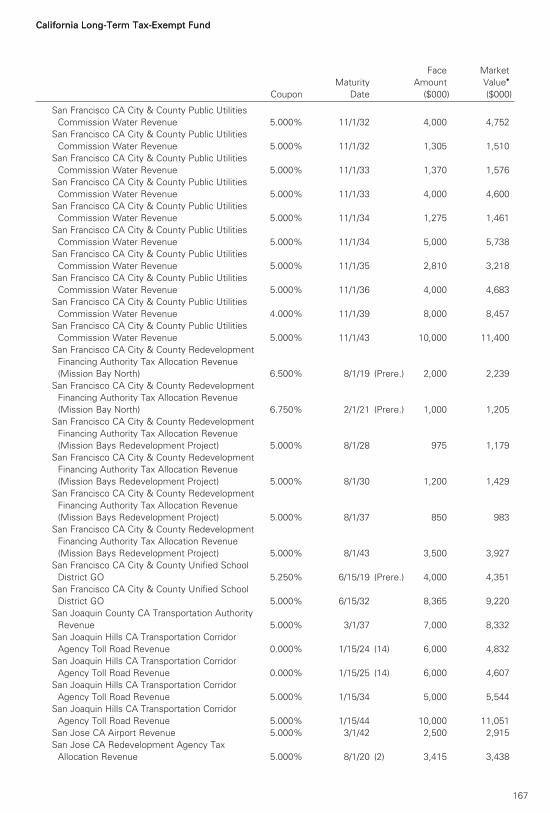
California Long-Term Tax-Exempt Fund
Face Market
Maturity Amount Value•
Coupon Date ($000) ($000)
California Long-Term Tax-Exempt Fund
San Francisco CA City & County Public Utilities
Commission Water Revenue 5.000% 11/1/32 4,000 4,752
San Francisco CA City & County Public Utilities
Commission Water Revenue 5.000% 11/1/32 1,305 1,510
San Francisco CA City & County Public Utilities
Commission Water Revenue 5.000% 11/1/33 1,370 1,576
San Francisco CA City & County Public Utilities
Commission Water Revenue 5.000% 11/1/33 4,000 4,600
San Francisco CA City & County Public Utilities
Commission Water Revenue 5.000% 11/1/34 1,275 1,461
San Francisco CA City & County Public Utilities
Commission Water Revenue 5.000% 11/1/34 5,000 5,738
San Francisco CA City & County Public Utilities
Commission Water Revenue 5.000% 11/1/35 2,810 3,218
San Francisco CA City & County Public Utilities
Commission Water Revenue 5.000% 11/1/36 4,000 4,683
San Francisco CA City & County Public Utilities
Commission Water Revenue 4.000% 11/1/39 8,000 8,457
San Francisco CA City & County Public Utilities
Commission Water Revenue 5.000% 11/1/43 10,000 11,400
San Francisco CA City & County Redevelopment
Financing Authority Tax Allocation Revenue
(Mission Bay North) 6.500% 8/1/19 (Prere.) 2,000 2,239
San Francisco CA City & County Redevelopment
Financing Authority Tax Allocation Revenue
(Mission Bay North) 6.750% 2/1/21 (Prere.) 1,000 1,205
San Francisco CA City & County Redevelopment
Financing Authority Tax Allocation Revenue
(Mission Bays Redevelopment Project) 5.000% 8/1/28 975 1,179
San Francisco CA City & County Redevelopment
Financing Authority Tax Allocation Revenue
(Mission Bays Redevelopment Project) 5.000% 8/1/30 1,200 1,429
San Francisco CA City & County Redevelopment
Financing Authority Tax Allocation Revenue
(Mission Bays Redevelopment Project) 5.000% 8/1/37 850 983
San Francisco CA City & County Redevelopment
Financing Authority Tax Allocation Revenue
(Mission Bays Redevelopment Project) 5.000% 8/1/43 3,500 3,927
San Francisco CA City & County Unified School
District GO 5.250% 6/15/19 (Prere.) 4,000 4,351
San Francisco CA City & County Unified School
District GO 5.000% 6/15/32 8,365 9,220
San Joaquin County CA Transportation Authority
Revenue 5.000% 3/1/37 7,000 8,332
San Joaquin Hills CA Transportation Corridor
Agency Toll Road Revenue 0.000% 1/15/24 (14) 6,000 4,832
San Joaquin Hills CA Transportation Corridor
Agency Toll Road Revenue 0.000% 1/15/25 (14) 6,000 4,607
San Joaquin Hills CA Transportation Corridor
Agency Toll Road Revenue 5.000% 1/15/34 5,000 5,544
San Joaquin Hills CA Transportation Corridor
Agency Toll Road Revenue 5.000% 1/15/44 10,000 11,051
San Jose CA Airport Revenue 5.000% 3/1/42 2,500 2,915
San Jose CA Redevelopment Agency Tax
Allocation Revenue 5.000% 8/1/20 (2) 3,415 3,438
167

California Long-Term Tax-Exempt Fund
Face Market
Maturity Amount Value•
Coupon Date ($000) ($000)
California Long-Term Tax-Exempt Fund
San Jose CA Redevelopment Agency Tax
Allocation Revenue 5.000% 8/1/21 (2) 2,300 2,316
San Jose CA Redevelopment Agency Tax
Allocation Revenue 5.000% 8/1/22 (2) 3,375 3,398
San Jose CA Redevelopment Agency Tax
Allocation Revenue 5.500% 8/1/30 850 937
San Jose CA Redevelopment Agency Tax
Allocation Revenue 5.500% 8/1/35 2,750 3,021
San Jose CA Special Hotel Tax Revenue
(Convention Center Expansion & Renovation
Project) 6.500% 5/1/42 5,000 5,837
San Jose CA Unified School District Santa
Clara County GO 5.000% 8/1/32 10,000 11,901
San Jose-Evergreen CA Community College
District GO 5.000% 9/1/40 3,850 4,479
San Juan CA Unified School District GO 0.000% 8/1/18 (4) 1,785 1,763
San Juan CA Unified School District GO 0.000% 8/1/20 (4) 4,930 4,726
San Juan CA Unified School District GO 0.000% 8/1/23 (4) 4,540 4,041
San Luis Obispo County CA Community College
District GO 5.000% 8/1/28 890 1,082
San Luis Obispo County CA Community College
District GO 5.000% 8/1/32 1,395 1,653
San Marcos CA Unified School District GO 0.000% 8/1/32 2,600 1,550
San Marcos CA Unified School District GO 5.000% 8/1/34 5,620 6,324
San Marcos CA Unified School District GO 5.000% 8/1/38 2,835 3,186
San Mateo CA Union High School District GO 0.000% 9/1/41 5,000 4,130
San Mateo County CA Joint Powers Financing
Authority Lease Revenue (Capital Project
Program) 5.000% 7/1/21 (14) 3,500 4,016
San Mateo County CA Joint Powers Financing
Authority Lease Revenue (Youth Services
Campus) 5.000% 7/15/31 2,290 2,790
San Mateo County CA Joint Powers Financing
Authority Lease Revenue (Youth Services
Campus) 4.000% 7/15/35 2,110 2,255
San Mateo County CA Mid-Peninsula Water
District COP 4.000% 12/1/46 2,000 2,075
San Mateo-Foster City CA School District GO 4.000% 8/1/44 3,250 3,431
San Mateo-Foster City CA School District GO 4.000% 8/1/45 5,000 5,249
San Pablo CA Redevelopment Agency Successor
Agency Tax Allocation Revenue 5.000% 6/15/29 (4) 1,780 2,074
San Ramon CA Public Financing Authority Tax
Allocation Revenue 0.000% 2/1/33 (2) 2,000 1,094
San Ramon Valley CA Unified School District GO 4.000% 8/1/34 3,445 3,693
Santa Ana CA Financing Authority Police
Administration & Holding Facility Lease Revenue 6.250% 7/1/17 (14) 1,000 1,004
Santa Ana CA Unified School District GO 0.000% 8/1/32 (14) 3,680 2,161
Santa Barbara CA Secondary/High School
District GO 0.000% 8/1/40 2,050 797
Santa Clara CA Electric Revenue 6.000% 7/1/31 3,000 3,553
Santa Clara CA Unified School District GO 5.000% 7/1/34 4,000 4,423
Santa Clara County CA Financing Authority
Revenue 5.000% 5/15/27 5,000 6,123
Santa Clara County CA GO 5.000% 8/1/28 9,000 10,555
168

California Long-Term Tax-Exempt Fund
Face Market
Maturity Amount Value•
Coupon Date ($000) ($000)
Santa Clara Valley CA Joint Powers Authority
Revenue 5.000% 8/1/28 625 776
Santa Clara Valley CA Joint Powers Authority
Revenue 5.000% 8/1/29 525 647
Santa Monica CA Community College District GO 4.000% 8/1/31 3,000 3,268
Santa Rosa CA Wastewater Revenue 4.000% 9/1/27 1,350 1,552
Santa Rosa CA Wastewater Revenue 5.000% 9/1/28 4,845 5,600
Santa Rosa CA Wastewater Revenue 5.000% 9/1/33 1,000 1,148
Silicon Valley CA Clean Water Wastewater
Revenue 5.000% 2/1/39 3,090 3,513
Silicon Valley CA Clean Water Wastewater
Revenue 5.000% 8/1/45 1,500 1,738
Simi Valley CA Unified School District GO 5.000% 8/1/27 1,500 1,913
Solana Beach CA School District Special Tax
Revenue 5.000% 9/1/32 1,000 1,104
Solana Beach CA School District Special Tax
Revenue 5.000% 9/1/35 2,500 2,742
Sonoma County CA Junior College District GO 5.000% 8/1/27 2,000 2,375
Sonoma-Marin Area Rail Transportation District
California Sales & Use Tax Revenue 5.000% 3/1/28 3,500 4,021
Southern California Public Power Authority
Revenue 5.000% 7/1/26 3,500 4,270
Southern California Public Power Authority
Revenue 5.000% 7/1/29 5,000 5,561
Southern California Public Power Authority
Revenue (Milford Wind Corridor Phase I Project) 5.000% 7/1/30 5,000 5,467
Southern California Public Power Authority
Revenue (Natural Gas Project) 5.000% 11/1/17 1,865 1,893
Southern California Public Power Authority
Revenue (Natural Gas Project) 5.000% 11/1/28 3,580 4,245
Southern California Public Power Authority
Revenue (Natural Gas Project) 5.000% 11/1/33 3,530 4,261
Southern California Public Power Authority
Revenue (Transmission Project) 5.750% 7/1/21 (14) 220 221
Southern California Water Replenishment
District Financing Authority Revenue 5.000% 8/1/28 1,000 1,218
Southern California Water Replenishment
District Financing Authority Revenue 5.000% 8/1/41 7,000 8,189
Southwestern California Community College
District GO 5.000% 8/1/44 7,045 8,125
State Center California Community College
District GO 5.000% 8/1/28 5,275 6,414
Stockton CA Public Financing Authority
Wastewater Revenue 5.000% 9/1/29 (15) 1,000 1,169
Stockton CA Public Financing Authority Water
Revenue (Delta Water Supply Project) 6.250% 10/1/38 2,150 2,625
Stockton CA Redevelopment Agency Successor
Agency Tax Allocation Revenue 5.000% 9/1/37 (4) 4,220 4,766
Stockton CA Unified School District GO 5.000% 8/1/38 (4) 2,500 2,832
Suisun City CA Redevelopment Agency
Successor Agency Tax Allocation Revenue 5.000% 10/1/31 (15) 1,225 1,419
Suisun City CA Redevelopment Agency
Successor Agency Tax Allocation Revenue 5.000% 10/1/32 (15) 1,250 1,443
Suisun City CA Redevelopment Agency
Successor Agency Tax Allocation Revenue 5.000% 10/1/33 (15) 1,280 1,471
169

California Long-Term Tax-Exempt Fund
Face Market
Maturity Amount Value•
Coupon Date ($000) ($000)
Sweetwater CA Unified School District GO 5.000% 8/1/29 (15) 4,200 4,945
Tahoe-Truckee CA Unified School District GO 5.000% 8/1/39 2,500 2,922
Temecula Valley CA Unified School District GO 0.000% 8/1/35 (15) 3,000 3,009
Temecula Valley CA Unified School District GO 0.000% 8/1/37 (15) 3,785 3,801
Torrance CA Hospital Revenue (Torrance
Memorial Medical Center) 5.000% 9/1/40 3,000 3,211
Tulare County CA Transportation Authority
Sales Tax Revenue 4.000% 2/1/34 1,540 1,619
Turlock CA Irrigation District Revenue 5.000% 1/1/20 (Prere.) 3,000 3,312
Turlock CA Irrigation District Revenue 5.000% 1/1/31 2,000 2,244
Turlock CA Irrigation District Revenue 5.500% 1/1/41 3,445 3,911
Tustin CA Community Facilities District Special
Tax Revenue 5.000% 9/1/37 1,000 1,125
Tustin CA Unified School District Special Tax
Revenue 5.000% 9/1/31 3,000 3,419
Ukiah CA Electric Revenue 6.250% 6/1/18 (14) 790 807
Ukiah CA Unified School District GO 0.000% 8/1/32 (10) 6,425 3,619
Union CA Elementary School District GO 0.000% 9/1/17 (14) 2,295 2,290
Union CA Elementary School District GO 0.000% 9/1/18 (14) 1,630 1,609
Union CA Elementary School District GO 0.000% 9/1/19 (14) 1,750 1,703
Union CA Elementary School District GO 0.000% 9/1/20 (14) 2,300 2,200
Union CA Elementary School District GO 0.000% 9/1/21 (14) 2,000 1,875
University of California Regents Medical Center
Pooled Revenue 5.000% 5/15/35 1,760 2,057
University of California Regents Medical Center
Pooled Revenue 5.000% 5/15/41 20,000 23,121
University of California Regents Medical Center
Pooled Revenue 4.000% 5/15/44 7,500 7,792
University of California Revenue 5.000% 5/15/27 4,245 5,174
University of California Revenue 5.000% 5/15/28 5,000 5,951
University of California Revenue 5.000% 5/15/29 2,000 2,446
University of California Revenue 5.000% 5/15/31 2,000 2,415
University of California Revenue 5.000% 5/15/32 1,000 1,201
University of California Revenue 5.000% 5/15/32 7,925 9,422
University of California Revenue 5.000% 5/15/33 5,000 5,838
University of California Revenue 4.000% 5/15/34 5,000 5,377
University of California Revenue 5.000% 5/15/34 5,205 5,844
University of California Revenue 5.000% 5/15/35 3,640 4,087
University of California Revenue 5.250% 5/15/37 3,500 4,168
University of California Revenue 5.000% 5/15/38 10,000 11,537
University of California Revenue 5.000% 5/15/40 50 51
University of California Revenue 5.000% 5/15/40 5,000 5,776
University of California Revenue 5.000% 5/15/41 2,400 2,807
University of California Revenue 5.000% 5/15/42 5,000 5,926
University of California Revenue PUT 5.000% 5/15/23 6,500 7,841
Vallecitos CA Water District Water & Wastewater
Enterprise Revenue 5.000% 7/1/33 1,110 1,308
Vallecitos CA Water District Water & Wastewater
Enterprise Revenue 5.000% 7/1/35 750 876
Vallejo CA Sanitation & Flood Control COP 5.000% 7/1/19 (14) 1,641 1,691
Vista CA Redevelopment Agency Successor
Agency Tax Allocation Revenue 5.000% 9/1/28 (4) 1,970 2,339
Vista CA Unified School District GO 0.000% 8/1/28 (14) 7,425 5,381
Walnut CA Energy Center Authority Revenue 5.000% 1/1/34 3,100 3,635
Walnut CA Energy Center Authority Revenue 5.000% 1/1/35 2,000 2,163
170

California Long-Term Tax-Exempt Fund
Face Market
Maturity Amount Value•
Coupon Date ($000) ($000)
California Long-Term Tax-Exempt Fund
Walnut CA Energy Center Authority Revenue 5.000% 1/1/40 5,000 5,394
Washington Township CA Health Care District GO 5.500% 8/1/40 5,000 5,978
Washington Township CA Health Care District
Revenue 5.000% 7/1/32 3,000 3,006
Washington Township CA Health Care District
Revenue 5.000% 7/1/33 1,080 1,223
Washington Township CA Health Care District
Revenue 5.000% 7/1/37 1,750 1,754
West Contra Costa CA Unified School District GO 0.000% 8/1/32 (14) 7,650 4,527
West Contra Costa CA Unified School District GO 5.250% 8/1/35 (4) 7,000 7,931
West Contra Costa CA Unified School District GO 5.000% 8/1/40 3,000 3,441
West Sacramento CA Area Flood Control Agency
Special Assessment Revenue 5.000% 9/1/40 (4) 2,050 2,340
West Sacramento CA Area Flood Control Agency
Special Assessment Revenue 5.000% 9/1/45 (4) 2,715 3,086
Western Placer CA Unified School District COP 4.000% 8/1/41 (4) 2,000 2,0793 Western Placer CA Unified School District GO 5.000% 8/1/42 6,350 7,422
Westminster CA Redevelopment Agency
(Westminster Redevelopment Project No. 1) 5.000% 11/1/28 (15) 675 820
Westminster CA Redevelopment Agency
(Westminster Redevelopment Project No. 1) 5.000% 11/1/29 (15) 1,000 1,204
Whittier CA Health Facilities Revenue
(Presbyterian Intercommunity Hospital
Obligated Group) 5.000% 6/1/44 4,500 4,972
Yuba City CA Unified School District GO 0.000% 9/1/17 (14) 2,060 2,055
Yuba City CA Unified School District GO 0.000% 9/1/19 (14) 2,270 2,207
Yucaipa Valley CA Water District Water
System Revenue 5.000% 9/1/27 1,000 1,199
3,760,563
Guam (0.2%)
Guam Government Business Privilege Tax
Revenue 5.000% 11/15/39 4,900 5,259
Guam Power Authority Revenue 5.000% 10/1/24 1,000 1,151
6,410
Total Tax-Exempt Municipal Bonds (Cost $3,555,767) 3,766,973
171
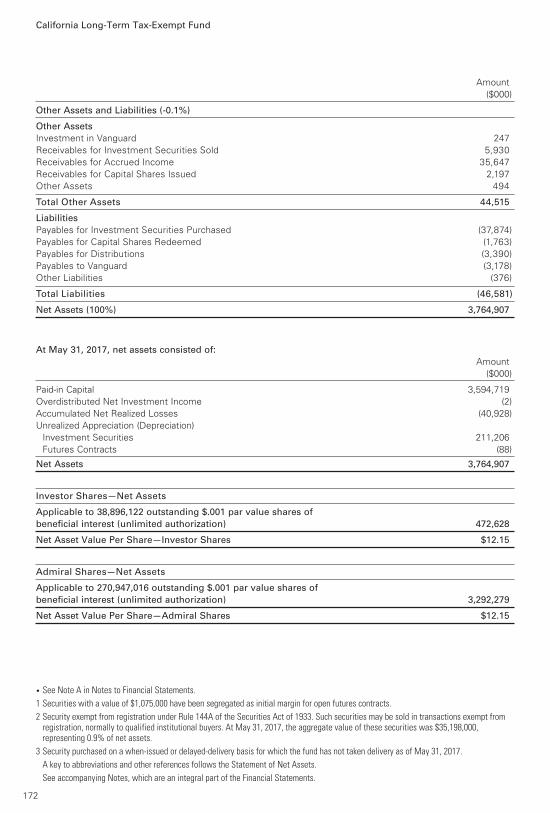
California Long-Term Tax-Exempt Fund
Amount
($000)
• See Note A in Notes to Financial Statements.
1 Securities with a value of $1,075,000 have been segregated as initial margin for open futures contracts.
2 Security exempt from registration under Rule 144A of the Securities Act of 1933. Such securities may be sold in transactions exempt from registration, normally to qualified institutional buyers. At May 31, 2017, the aggregate value of these securities was $35,198,000, representing 0.9% of net assets.
3 Security purchased on a when-issued or delayed-delivery basis for which the fund has not taken delivery as of May 31, 2017.
A key to abbreviations and other references follows the Statement of Net Assets.
See accompanying Notes, which are an integral part of the Financial Statements.
Other Assets and Liabilities (-0.1%)
Other Assets
Investment in Vanguard 247
Receivables for Investment Securities Sold 5,930
Receivables for Accrued Income 35,647
Receivables for Capital Shares Issued 2,197
Other Assets 494
Total Other Assets 44,515
Liabilities
Payables for Investment Securities Purchased (37,874)
Payables for Capital Shares Redeemed (1,763)
Payables for Distributions (3,390)
Payables to Vanguard (3,178)
Other Liabilities (376)
Total Liabilities (46,581)
Net Assets (100%) 3,764,907
At May 31, 2017, net assets consisted of:
Amount
($000)
Paid-in Capital 3,594,719
Overdistributed Net Investment Income (2)
Accumulated Net Realized Losses (40,928)
Unrealized Appreciation (Depreciation)
Investment Securities 211,206
Futures Contracts (88)
Net Assets 3,764,907
Investor Shares—Net Assets
Applicable to 38,896,122 outstanding $.001 par value shares of
beneficial interest (unlimited authorization) 472,628
Net Asset Value Per Share—Investor Shares $12.15
Admiral Shares—Net Assets
Applicable to 270,947,016 outstanding $.001 par value shares of
beneficial interest (unlimited authorization) 3,292,279
Net Asset Value Per Share—Admiral Shares $12.15
172

California Long-Term Tax-Exempt Fund
Key to Abbreviations
ARS—Auction Rate Security.
BAN—Bond Anticipation Note.
COP—Certificate of Participation.
CP—Commercial Paper.
FR—Floating Rate.
GAN—Grant Anticipation Note.
GO—General Obligation Bond.
PILOT—Payments in Lieu of Taxes.
PUT—Put Option Obligation.
RAN—Revenue Anticipation Note.
TAN—Tax Anticipation Note.
TOB—Tender Option Bond.
TRAN—Tax Revenue Anticipation Note.
VRDO—Variable Rate Demand Obligation.
VRDP—Variable Rate Demand Preferred.
(ETM)—Escrowed to Maturity.
(Prere.)—Prerefunded.
Scheduled principal and interest payments are guaranteed by:
(1) MBIA (Municipal Bond Investors Assurance).
(2) AMBAC (Ambac Assurance Corporation).
(3) FGIC (Financial Guaranty Insurance Company).
(4) AGM (Assured Guaranty Municipal Corporation).
(5) BIGI (Bond Investors Guaranty Insurance).
(6) Connie Lee Inc.
(7) FHA (Federal Housing Authority).
(8) CapMAC (Capital Markets Assurance Corporation).
(9) American Capital Access Financial Guaranty Corporation.
(10) XL Capital Assurance Inc.
(11) CIFG (CDC IXIS Financial Guaranty).
(12) AGC (Assured Guaranty Corporation).
(13) BHAC (Berkshire Hathaway Assurance Corporation).
(14) NPFG (National Public Finance Guarantee Corporation).
(15) BAM (Build America Mutual Assurance Company).
(16) MAC (Municipal Assurance Corporation).
(17) RAA (Radian Asset Assurance Inc.).
(18) SBLF (Michigan School Bond Loan Fund).
The insurance does not guarantee the market value of the municipal bonds.
LOC—Scheduled principal and interest payments are guaranteed by bank letter of credit.
173

Six Months Ended
May 31, 2017
($000)
Investment Income
Income
Interest 63,806
Total Income 63,806
Expenses
The Vanguard Group—Note B
Investment Advisory Services 252
Management and Administrative—Investor Shares 340
Management and Administrative—Admiral Shares 1,041
Marketing and Distribution—Investor Shares 50
Marketing and Distribution—Admiral Shares 125
Custodian Fees 18
Shareholders’ Reports—Investor Shares 14
Shareholders’ Reports—Admiral Shares 16
Trustees’ Fees and Expenses 1
Total Expenses 1,857
Net Investment Income 61,949
Realized Net Gain (Loss)
Investment Securities Sold 2,477
Futures Contracts (556)
Realized Net Gain (Loss) 1,921
Change in Unrealized Appreciation (Depreciation)
Investment Securities 147,258
Futures Contracts (127)
Change in Unrealized Appreciation (Depreciation) 147,131
Net Increase (Decrease) in Net Assets Resulting from Operations 211,001
Statement of Operations
California Long-Term Tax-Exempt Fund
See accompanying Notes, which are an integral part of the Financial Statements.
174

Statement of Changes in Net Assets
California Long-Term Tax-Exempt Fund
See accompanying Notes, which are an integral part of the Financial Statements.
Six Months Ended Year Ended
May 31, November 30,
2017 2016
($000) ($000)
Increase (Decrease) in Net Assets
Operations
Net Investment Income 61,949 123,444
Realized Net Gain (Loss) 1,921 15,647
Change in Unrealized Appreciation (Depreciation) 147,131 (166,809)
Net Increase (Decrease) in Net Assets Resulting from Operations 211,001 (27,718)
Distributions
Net Investment Income
Investor Shares (7,631) (15,747)
Admiral Shares (54,112) (107,648)
Realized Capital Gain
Investor Shares — —
Admiral Shares — —
Total Distributions (61,743) (123,395)
Capital Share Transactions
Investor Shares (1,354) 49,589
Admiral Shares 99,523 285,502
Net Increase (Decrease) from Capital Share Transactions 98,169 335,091
Total Increase (Decrease) 247,427 183,978
Net Assets
Beginning of Period 3,517,480 3,333,502
End of Period1 3,764,907 3,517,480
1 Net Assets—End of Period includes undistributed (overdistributed) net investment income of ($2,000) and $7,000.
175

Investor Shares
Six Months
Ended
For a Share Outstanding May 31, Year Ended November 30,
Throughout Each Period 2017 2016 2015 2014 2013 2012
Net Asset Value, Beginning of Period $11.66 $12.12 $12.07 $11.31 $12.24 $11.24
Investment Operations
Net Investment Income .198 .410 .428 .442 .450 .459
Net Realized and Unrealized Gain (Loss)
on Investments .489 (.460) .050 .760 (.930) 1.000
Total from Investment Operations .687 (.050) .478 1.202 (.480) 1.459
Distributions
Dividends from Net Investment Income (.197) (.410) (.428) (.442) (.450) (.459)
Distributions from Realized Capital Gains — — — — — —
Total Distributions (.197) (.410) (.428) (.442) (.450) (.459)
Net Asset Value, End of Period $12.15 $11.66 $12.12 $12.07 $11.31 $12.24
Total Return1 5.94% -0.55% 4.03% 10.79% -3.96% 13.20%
Ratios/Supplemental Data
Net Assets, End of Period (Millions) $473 $455 $425 $397 $390 $487
Ratio of Total Expenses to
Average Net Assets 0.19% 0.19% 0.20% 0.20% 0.20% 0.20%
Ratio of Net Investment Income to
Average Net Assets 3.34% 3.31% 3.55% 3.75% 3.86% 3.89%
Portfolio Turnover Rate 21% 18% 17% 14% 14% 16%
The expense ratio, net investment income ratio, and turnover rate for the current period have been annualized.
1 Total returns do not include account service fees that may have applied in the periods shown. Fund prospectuses provide information about any applicable account service fees.
Financial Highlights
See accompanying Notes, which are an integral part of the Financial Statements.
California Long-Term Tax-Exempt Fund
176

Admiral Shares
Six Months
Ended
For a Share Outstanding May 31, Year Ended November 30,
Throughout Each Period 2017 2016 2015 2014 2013 2012
Net Asset Value, Beginning of Period $11.66 $12.12 $12.07 $11.31 $12.24 $11.24
Investment Operations
Net Investment Income .204 .423 .438 .451 .459 .468
Net Realized and Unrealized Gain (Loss)
on Investments .489 (.460) .050 .760 (.930) 1.000
Total from Investment Operations .693 (.037) .488 1.211 (.471) 1.468
Distributions
Dividends from Net Investment Income (.203) (.423) (.438) (.451) (.459) (.468)
Distributions from Realized Capital Gains — — — — — —
Total Distributions (.203) (.423) (.438) (.451) (.459) (.468)
Net Asset Value, End of Period $12.15 $11.66 $12.12 $12.07 $11.31 $12.24
Total Return1 5.99% -0.45% 4.12% 10.87% -3.88% 13.29%
Ratios/Supplemental Data
Net Assets, End of Period (Millions) $3,292 $3,062 $2,909 $2,674 $2,314 $2,589
Ratio of Total Expenses to
Average Net Assets 0.09% 0.09% 0.12% 0.12% 0.12% 0.12%
Ratio of Net Investment Income to
Average Net Assets 3.44% 3.41% 3.63% 3.83% 3.94% 3.97%
Portfolio Turnover Rate 21% 18% 17% 14% 14% 16%
The expense ratio, net investment income ratio, and turnover rate for the current period have been annualized.
1 Total returns do not include account service fees that may have applied in the periods shown. Fund prospectuses provide information about any applicable account service fees.
Financial Highlights
See accompanying Notes, which are an integral part of the Financial Statements.
California Long-Term Tax-Exempt Fund
177

Notes to Financial Statements
California Long-Term Tax-Exempt Fund
Vanguard California Long-Term Tax-Exempt Fund is registered under the Investment Company Act of
1940 as an open-end investment company, or mutual fund. The fund invests in debt instruments of
municipal issuers whose ability to meet their obligations may be affected by economic and political
developments in the state. The fund offers two classes of shares: Investor Shares and Admiral
Shares. Investor Shares are available to any investor who meets the fund’s minimum purchase
requirements. Admiral Shares are designed for investors who meet certain administrative, service,
and account-size criteria.
A. The following significant accounting policies conform to generally accepted accounting principles
for U.S. investment companies. The fund consistently follows such policies in preparing its financial
statements.
1. Security Valuation: Securities are valued as of the close of trading on the New York Stock Exchange
(generally 4 p.m., Eastern time) on the valuation date. Bonds and temporary cash investments are
valued using the latest bid prices or using valuations based on a matrix system (which considers such
factors as security prices, yields, maturities, and ratings), both as furnished by independent pricing
services. Securities for which market quotations are not readily available, or whose values have been
affected by events occurring before the fund’s pricing time but after the close of the securities’
primary markets, are valued by methods deemed by the board of trustees to represent fair value.
2. Futures Contracts: The fund uses futures contracts to invest in fixed income asset classes with
greater efficiency and lower cost than is possible through direct investment, to add value when these
instruments are attractively priced, or to adjust sensitivity to changes in interest rates. The primary
risks associated with the use of futures contracts are imperfect correlation between changes in
market values of bonds held by the fund and the prices of futures contracts, and the possibility of an
illiquid market. Counterparty risk involving futures is mitigated because a regulated clearinghouse is
the counterparty instead of the clearing broker. To further mitigate counterparty risk, the fund trades
futures contracts on an exchange, monitors the financial strength of its clearing brokers and
clearinghouse, and has entered into clearing agreements with its clearing brokers. The clearinghouse
imposes initial margin requirements to secure the fund’s performance and requires daily settlement
of variation margin representing changes in the market value of each contract.
Futures contracts are valued at their quoted daily settlement prices. The aggregate settlement values
of the contracts are not recorded in the Statement of Net Assets. Fluctuations in the value of the
contracts are recorded in the Statement of Net Assets as an asset (liability) and in the Statement
of Operations as unrealized appreciation (depreciation) until the contracts are closed, when they
are recorded as realized futures gains (losses).
During the six months ended May 31, 2017, the fund’s average investments in long and short futures
contracts represented 3% and 1% of net assets, respectively, based on the average of aggregate
settlement values at each quarter-end during the period.
3. Federal Income Taxes: The fund intends to continue to qualify as a regulated investment company
and distribute all of its income. Management has analyzed the fund’s tax positions taken for all open
federal income tax years (November 30, 2013–2016), and for the period ended May 31, 2017, and has
concluded that no provision for federal income tax is required in the fund’s financial statements.
4. Distributions: Distributions from net investment income are declared daily and paid on the first
business day of the following month. Annual distributions from realized capital gains, if any, are
recorded on the ex-dividend date.
178

California Long-Term Tax-Exempt Fund
5. Credit Facility: The fund and certain other funds managed by The Vanguard Group (“Vanguard”)
participate in a $3.1 billion committed credit facility provided by a syndicate of lenders pursuant to a
credit agreement that may be renewed annually; each fund is individually liable for its borrowings, if
any, under the credit facility. Borrowings may be utilized for temporary and emergency purposes, and
are subject to the fund’s regulatory and contractual borrowing restrictions. The participating funds are
charged administrative fees and an annual commitment fee of 0.10% of the undrawn amount of the
facility; these fees are allocated to the funds based on a method approved by the fund’s board of
trustees and included in Management and Administrative expenses on the fund’s Statement of
Operations. Any borrowings under this facility bear interest at a rate based upon the higher of the
one-month London Interbank Offered Rate, federal funds effective rate, or overnight bank funding
rate plus an agreed-upon spread.
The fund had no borrowings outstanding at May 31, 2017, or at any time during the period
then ended.
6. Other: Interest income is accrued daily. Premiums and discounts on debt securities purchased are
amortized and accreted, respectively, to interest income over the lives of the respective securities.
Security transactions are accounted for on the date securities are bought or sold. Costs used to
determine realized gains (losses) on the sale of investment securities are those of the specific
securities sold.
Each class of shares has equal rights as to assets and earnings, except that each class separately
bears certain class-specific expenses related to maintenance of shareholder accounts (included in
Management and Administrative expenses) and shareholder reporting. Marketing and distribution
expenses are allocated to each class of shares based on a method approved by the board of trustees.
Income, other non-class-specific expenses, and gains and losses on investments are allocated to
each class of shares based on its relative net assets.
B. In accordance with the terms of a Funds’ Service Agreement (the “FSA”) between Vanguard and
the fund, Vanguard furnishes to the fund investment advisory, corporate management, administrative,
marketing, and distribution services at Vanguard’s cost of operations (as defined by the FSA). These
costs of operations are allocated to the fund based on methods and guidelines approved by the board
of trustees. Vanguard does not require reimbursement in the current period for certain costs of
operations (such as deferred compensation/benefits and risk/insurance costs); the fund’s liability
for these costs of operations is included in Payables to Vanguard on the Statement of Net Assets.
Upon the request of Vanguard, the fund may invest up to 0.40% of its net assets as capital in
Vanguard. At May 31, 2017, the fund had contributed to Vanguard capital in the amount of $247,000,
representing 0.01% of the fund’s net assets and 0.10% of Vanguard’s capitalization. The fund’s
trustees and officers are also directors and employees, respectively, of Vanguard.
C. Various inputs may be used to determine the value of the fund’s investments. These inputs are
summarized in three broad levels for financial statement purposes. The inputs or methodologies
used to value securities are not necessarily an indication of the risk associated with investing in
those securities.
Level 1—Quoted prices in active markets for identical securities.
Level 2—Other significant observable inputs (including quoted prices for similar securities, interest
rates, prepayment speeds, credit risk, etc.).
Level 3—Significant unobservable inputs (including the fund’s own assumptions used to determine
the fair value of investments).
179

California Long-Term Tax-Exempt Fund
The following table summarizes the market value of the fund’s investments as of May 31, 2017, based
on the inputs used to value them:
Level 1 Level 2 Level 3
Investments ($000) ($000) ($000)
Tax-Exempt Municipal Bonds — 3,766,973 —
Futures Contracts—Assets1 125 — —
Futures Contracts—Liabilities1 (233) — —
Total (108) 3,766,973 —
1 Represents variation margin on the last day of the reporting period.
D. At May 31, 2017, the aggregate settlement value of open futures contracts and the related
unrealized appreciation (depreciation) were:
($000)
Aggregate
Number of Settlement Unrealized
Long (Short) Value Appreciation
Futures Contracts Expiration Contracts Long (Short) (Depreciation)
5-Year U.S. Treasury Note September 2017 570 67,438 88
2-Year U.S. Treasury Note September 2017 257 55,636 49
Ultra 10-Year U.S. Treasury Note September 2017 (293) (39,770) (210)
10-Year U.S. Treasury Note September 2017 166 20,965 54
Ultra Long U.S. Treasury Bond September 2017 (30) (4,954) (47)
30-Year U.S. Treasury Bond September 2017 (21) (3,230) (22)
(88)
Unrealized appreciation (depreciation) on open futures contracts is required to be treated as realized
gain (loss) for tax purposes.
E. Capital gain distributions are determined on a tax basis and may differ from realized capital gains
for financial reporting purposes. Differences may be permanent or temporary. Permanent differences
are reclassified among capital accounts in the financial statements to reflect their tax character.
Temporary differences arise when gains or losses are recognized in different periods for financial
statement and tax purposes. These differences will reverse at some time in the future.
The fund’s tax-basis capital gains and losses are determined only at the end of each fiscal year.
For tax purposes, at November 30, 2016, the fund had available capital losses totaling $41,162,000
to offset future net capital gains of $11,654,000 through November 30, 2017, $12,571,000 through
November 30, 2018, and $16,937,000 through November 30, 2019.The fund will use these capital
losses to offset net taxable capital gains, if any, realized during the year ending November 30, 2017;
should the fund realize net capital losses for the year, the losses will be added to the loss
carryforward balance above.
At May 31, 2017, the cost of investment securities for tax purposes was $3,557,415,000. Net
unrealized appreciation of investment securities for tax purposes was $209,558,000, consisting
of unrealized gains of $219,751,000 on securities that had risen in value since their purchase and
$10,193,000 in unrealized losses on securities that had fallen in value since their purchase.
180

California Long-Term Tax-Exempt Fund
F. During the six months ended May 31, 2017, the fund purchased $436,109,000 of investment
securities and sold $357,971,000 of investment securities, other than temporary cash investments.
The fund purchased securities from and sold securities to other Vanguard funds or accounts managed
by Vanguard or its affiliates, in accordance with procedures adopted by the board of trustees in
compliance with Rule 17a-7 of the Investment Company Act of 1940. For the six months ended
May 31, 2017, such purchases and sales were $168,981,000 and $129,826,000, respectively;
these amounts are included in the purchases and sales of investment securities noted above.
G. Capital share transactions for each class of shares were:
Six Months Ended Year Ended
May 31, 2017 November 30, 2016
Amount Shares Amount Shares
($000) (000) ($000) (000)
Investor Shares
Issued 65,707 5,537 164,555 13,277
Issued in Lieu of Cash Distributions 6,641 557 13,625 1,103
Redeemed (73,702) (6,225) (128,591) (10,407)
Net Increase (Decrease)—Investor Shares (1,354) (131) 49,589 3,973
Admiral Shares
Issued 395,258 33,330 761,935 61,587
Issued in Lieu of Cash Distributions 35,447 2,972 70,089 5,674
Redeemed (331,182) (28,022) (546,522) (44,606)
Net Increase (Decrease)—Admiral Shares 99,523 8,280 285,502 22,655
H. Management has determined that no material events or transactions occurred subsequent to
May 31, 2017, that would require recognition or disclosure in these financial statements.
181

About Your Fund’s Expenses
As a shareholder of the fund, you incur ongoing costs, which include costs for portfolio management,
administrative services, and shareholder reports (like this one), among others. Operating expenses,
which are deducted from a fund’s gross income, directly reduce the investment return of the fund.
A fund’s expenses are expressed as a percentage of its average net assets. This figure is known as the
expense ratio. The following examples are intended to help you understand the ongoing costs (in
dollars) of investing in your fund and to compare these costs with those of other mutual funds. The
examples are based on an investment of $1,000 made at the beginning of the period shown and held
for the entire period.
The accompanying table illustrates your fund’s costs in two ways:
• Based on actual fund return. This section helps you to estimate the actual expenses that you paid
over the period. The ”Ending Account Value“ shown is derived from the fund‘s actual return, and the
third column shows the dollar amount that would have been paid by an investor who started with
$1,000 in the fund. You may use the information here, together with the amount you invested, to
estimate the expenses that you paid over the period.
To do so, simply divide your account value by $1,000 (for example, an $8,600 account value divided by
$1,000 = 8.6), then multiply the result by the number given for your fund under the heading ”Expenses
Paid During Period.“
• Based on hypothetical 5% yearly return. This section is intended to help you compare your fund‘s
costs with those of other mutual funds. It assumes that the fund had a yearly return of 5% before
expenses, but that the expense ratio is unchanged. In this case—because the return used is not the
fund’s actual return—the results do not apply to your investment. The example is useful in making
comparisons because the Securities and Exchange Commission requires all mutual funds to calculate
expenses based on a 5% return. You can assess your fund’s costs by comparing this hypothetical
example with the hypothetical examples that appear in shareholder reports of other funds.
Note that the expenses shown in the table are meant to highlight and help you compare ongoingcosts only and do not reflect transaction costs incurred by the fund for buying and selling securities.Further, the expenses do not include any purchase, redemption, or account service fees described inthe fund prospectus. If such fees were applied to your account, your costs would be higher. Yourfund does not carry a “sales load.”
The calculations assume no shares were bought or sold during the period. Your actual costs may
have been higher or lower, depending on the amount of your investment and the timing of any
purchases or redemptions.
You can find more information about the fund’s expenses, including annual expense ratios, in the
Financial Statements section of this report. For additional information on operating expenses and
other shareholder costs, please refer to your fund’s current prospectus.
182
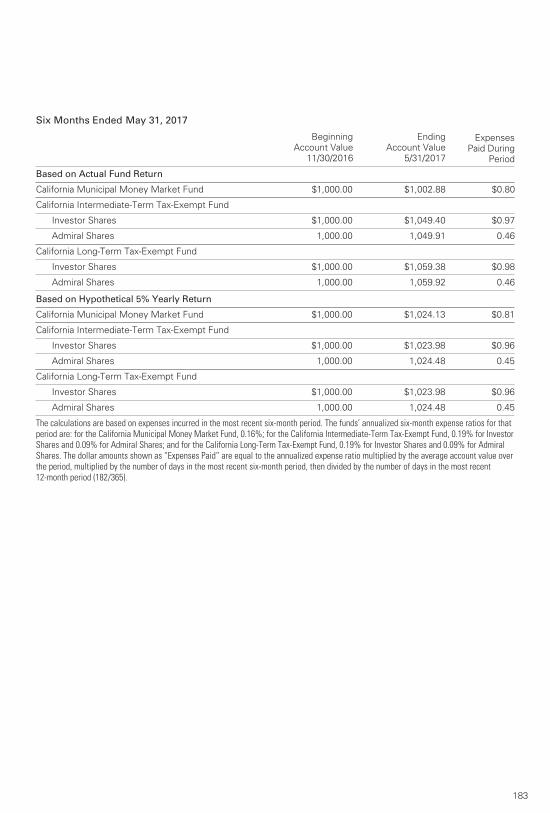
183
Six Months Ended May 31, 2017
Beginning
Account Value
11/30/2016
Ending
Account Value
5/31/2017
Expenses
Paid During
Period
Based on Actual Fund Return
California Municipal Money Market Fund $1,000.00 $1,002.88 $0.80
California Intermediate-Term Tax-Exempt Fund
Investor Shares $1,000.00 $1,049.40 $0.97
Admiral Shares 1,000.00 1,049.91 0.46
California Long-Term Tax-Exempt Fund
Investor Shares $1,000.00 $1,059.38 $0.98
Admiral Shares 1,000.00 1,059.92 0.46
Based on Hypothetical 5% Yearly Return
California Municipal Money Market Fund $1,000.00 $1,024.13 $0.81
California Intermediate-Term Tax-Exempt Fund
Investor Shares $1,000.00 $1,023.98 $0.96
Admiral Shares 1,000.00 1,024.48 0.45
California Long-Term Tax-Exempt Fund
Investor Shares $1,000.00 $1,023.98 $0.96
Admiral Shares 1,000.00 1,024.48 0.45
The calculations are based on expenses incurred in the most recent six-month period. The funds’ annualized six-month expense ratios for thatperiod are: for the California Municipal Money Market Fund, 0.16%; for the California Intermediate-Term Tax-Exempt Fund, 0.19% for InvestorShares and 0.09% for Admiral Shares; and for the California Long-Term Tax-Exempt Fund, 0.19% for Investor Shares and 0.09% for AdmiralShares. The dollar amounts shown as “Expenses Paid” are equal to the annualized expense ratio multiplied by the average account value overthe period, multiplied by the number of days in the most recent six-month period, then divided by the number of days in the most recent12-month period (182/365).

The board of trustees of Vanguard California Municipal Money Market Fund, Vanguard California
Intermediate-Term Tax-Exempt Fund, and Vanguard California Long-Term Tax-Exempt Fund has
renewed each fund’s investment advisory arrangement with The Vanguard Group, Inc. (Vanguard),
through its Fixed Income Group. The board determined that continuing the funds’ internalized
management structure was in the best interests of each fund and its shareholders.
The board based its decision upon an evaluation of the advisor’s investment staff, portfolio
management process, and performance. This evaluation included information provided to the board
by Vanguard’s Portfolio Review Department, which is responsible for fund and advisor oversight and
product management. The Portfolio Review Department met regularly with the advisor and made
monthly presentations to the board during the fiscal year that directed the board’s focus to relevant
information and topics.
The board, or an investment committee made up of board members, also received information
throughout the year during advisor presentations. For each advisor presentation, the board was
provided with letters and reports that included information about, among other things, the advisory
firm and the advisor’s assessment of the investment environment, portfolio performance, and
portfolio characteristics.
In addition, the board received monthly reports, which included a Market and Economic Report,
a Fund Dashboard Monthly Summary, and a Fund Performance Report.
Prior to their meeting, the trustees were provided with a memo and materials that summarized the
information they received over the course of the year. They also considered the factors discussed
below, among others. However, no single factor determined whether the board approved the
arrangements. Rather, it was the totality of the circumstances that drove the board’s decision.
Nature, extent, and quality of services
The board reviewed the quality of each fund’s investment management services over both the short
and long term and took into account the organizational depth and stability of the advisor. The board
considered that Vanguard has been managing investments for more than three decades. The Fixed
Income Group adheres to a sound, disciplined investment management process; the team has
considerable experience, stability, and depth.
The board concluded that Vanguard’s experience, stability, depth, and performance, among other
factors, warranted continuation of each advisory arrangement.
Investment performance
The board considered the short- and long-term performance of each fund, including any periods of
outperformance or underperformance compared with a benchmark index (as applicable) and peer
group. The board concluded that the performance was such that each advisory arrangement should
continue. Information about each fund’s most recent performance can be found in the Performance
Summary sections of this report.
Cost
The board concluded that the California Intermediate-Term Tax-Exempt and California Long-Term
Tax-Exempt Funds’ expense ratios were well below the average expense ratio charged by funds
in their peer groups and that each fund’s advisory expenses were also well below its peer-group
average. The board also concluded that the California Municipal Money Market Fund’s expense ratio
was reasonable compared with the average expense ratio charged by funds in its peer group and that
Trustees Approve Advisory Arrangements
184

the fund’s advisory expenses were well below its peer-group average. Information about the funds’
expenses appears in the About Your Fund’s Expenses section of this report as well as in the Financial
Statements sections.
The board does not conduct a profitability analysis of Vanguard because of Vanguard’s unique “at-cost”
structure. Unlike most other mutual fund management companies, Vanguard is owned by the funds it
oversees and produces “profits” only in the form of reduced expenses for fund shareholders.
The benefit of economies of scale
The board concluded that each fund’s at-cost arrangement with Vanguard ensures that the funds
will realize economies of scale as they grow, with the cost to shareholders declining as fund
assets increase.
The board will consider whether to renew the advisory arrangements again after a one-year period.
185

Glossary
186
7-Day SEC Yield and 30-Day SEC Yield. A money market fund’s 7-day SEC yield is calculated by
annualizing its income distributions for the previous seven days, as required by the U.S. Securities
and Exchange Commission. For other funds, 30-day SEC yield is derived using a formula specified
by the commission. Under the formula, data related to the fund’s security holdings in the previous
30 days are used to calculate the fund’s hypothetical net income for that period, which is then
annualized and divided by the fund’s estimated average net assets over the calculation period. For
the purposes of this calculation, a security’s income is based on its current market yield to maturity
(for bonds), its actual income (for asset-backed securities), or its projected dividend yield (for stocks).
Because the SEC yield represents hypothetical annualized income, it will differ—at times
significantly—from the fund’s actual experience. As a result, the fund’s income distributions may be
higher or lower than implied by the SEC yield.
Average Coupon. The average interest rate paid on the fixed income securities held by a fund. It is
expressed as a percentage of face value.
Average Duration. An estimate of how much the value of the bonds held by a fund will fluctuate in
response to a change in interest rates. To see how the value could change, multiply the average
duration by the change in rates. If interest rates rise by 1 percentage point, the value of the bonds in
a fund with an average duration of five years would decline by about 5%. If rates decrease by a
percentage point, the value would rise by 5%.
Average Stated Maturity. The average length of time until fixed income securities held by a fund
reach maturity and are repaid using the maturity date of the security. The figure reflects the
proportion of fund assets represented by each security; it also reflects any futures contracts held. In
general, the longer the average stated maturity, the more a fund’s share price will fluctuate in
response to changes in market interest rates.
Average Weighted Maturity. The average length of time until fixed income securities held by a
fund reach maturity and are repaid. The figure reflects the proportion of fund assets represented by
each security.
Beta. A measure of the magnitude of a fund’s past share-price fluctuations in relation to the ups and
downs of a given market index. The index is assigned a beta of 1.00. Compared with a given index,
a fund with a beta of 1.20 typically would have seen its share price rise or fall by 12% when the
index rose or fell by 10%. For this report, beta is based on returns over the past 36 months for both
the fund and the index. Note that a fund’s beta should be reviewed in conjunction with its R-squared
(see definition). The lower the R-squared, the less correlation there is between the fund and the
index, and the less reliable beta is as an indicator of volatility.
Credit Quality. Credit-quality ratings are measured on a scale that generally ranges from AAA
(highest) to D (lowest). Credit-quality ratings are obtained from Moody’s and S&P, and the higher
rating for each issue is used. ”Not Rated” is used to classify securities for which a rating is not
available. Not rated securities include a fund’s investment in Vanguard Market Liquidity Fund or
Vanguard Municipal Cash Management Fund, each of which invests in high-quality money market
instruments and may serve as a cash management vehicle for the Vanguard funds, trusts, and
accounts.
187
Expense Ratio. A fund’s total annual operating expenses expressed as a percentage of the fund’s
average net assets. The expense ratio includes management and administrative expenses, but does
not include the transaction costs of buying and selling portfolio securities.
Inception Date. The date on which the assets of a fund (or one of its share classes) are first
invested in accordance with the fund’s investment objective. For funds with a subscription period,
the inception date is the day after that period ends. Investment performance is measured from the
inception date.
R-Squared. A measure of how much of a fund’s past returns can be explained by the returns from
the market in general, as measured by a given index. If a fund’s total returns were precisely
synchronized with an index’s returns, its R-squared would be 1.00. If the fund’s returns bore no
relationship to the index’s returns, its R-squared would be 0. For this report, R-squared is based on
returns over the past 36 months for both the fund and the index.
Short-Term Reserves. The percentage of a fund invested in highly liquid, short-term securities that
can be readily converted to cash.
Yield to Maturity. The rate of return an investor would receive if the fixed income securities held by
a fund were held to their maturity dates.

The Vanguard Municipal Bond Funds are not sponsored, endorsed, issued, sold, or promoted by Barclays Risk Analytics and
Index Solutions Limited or any of its affiliates (“Barclays”). Barclays makes no representation or warranty, express or implied,
to the owners or purchasers of the Vanguard Municipal Bond Funds or any member of the public regarding the advisability of
investing in securities generally or in the Vanguard Municipal Bond Funds particularly or the ability of the Bloomberg Barclays
Indices to track general bond market performance. Barclays has not passed on the legality or suitability of the Vanguard
Municipal Bond Funds with respect to any person or entity. Barclays’ only relationship to Vanguard and the Vanguard Municipal
Bond Funds is the licensing of the Bloomberg Barclays Indices, which are determined, composed, and calculated by Barclays
without regard to Vanguard or the Vanguard Municipal Bond Funds or any owners or purchasers of the Vanguard Municipal
Bond Funds. Barclays has no obligation to take the needs of Vanguard, the Vanguard Municipal Bond Funds, or the owners
of the Vanguard Municipal Bond Funds into consideration in determining, composing, or calculating the Bloomberg Barclays
Indices. Barclays is not responsible for and has not participated in the determination of the timing of, prices at, or quantities of
the Vanguard Municipal Bond Funds to be issued. Barclays has no obligation or liability in connection with the administration,
marketing, or trading of the Vanguard Municipal Bond Funds.
BARCLAYS SHALL HAVE NO LIABILITY TO THIRD PARTIES FOR THE QUALITY, ACCURACY AND/OR COMPLETENESS OF THE
INDEX OR ANY DATA INCLUDED THEREIN OR FOR INTERRUPTIONS IN THE DELIVERY OF THE INDEX. BARCLAYS MAKES
NO WARRANTY, EXPRESS OR IMPLIED, AS TO RESULTS TO BE OBTAINED BY OWNERS OF THE VANGUARD MUNICIPAL
BOND FUNDS OR ANY OTHER PERSON OR ENTITY FROM THE USE OF THE INDEX OR ANY DATA INCLUDED THEREIN IN
CONNECTION WITH THE RIGHTS LICENSED HEREUNDER OR FOR ANY OTHER USE. BARCLAYS RESERVES THE RIGHT
TO CHANGE THE METHODS OF CALCULATION OR PUBLICATION, OR TO CEASE THE CALCULATION OR PUBLICATION OF
THE BLOOMBERG BARCLAYS INDICES, AND BARCLAYS SHALL NOT BE LIABLE FOR ANY MISCALCULATION OF OR ANY
INCORRECT, DELAYED OR INTERRUPTED PUBLICATION WITH RESPECT TO ANY OF THE BLOOMBERG BARCLAYS INDICES.
BARCLAYS MAKES NO EXPRESS OR IMPLIED WARRANTIES, AND HEREBY EXPRESSLY DISCLAIMS ALL WARRANTIES
OF MERCHANTABILITY OR FITNESS FOR A PARTICULAR PURPOSE OR USE WITH RESPECT TO THE INDEX OR ANY DATA
INCLUDED THEREIN. BARCLAYS SHALL NOT BE LIABLE FOR ANY DAMAGES, INCLUDING, WITHOUT LIMITATION, ANY
INDIRECT OR CONSEQUENTIAL DAMAGES RESULTING FROM THE USE OF THE INDEX OR ANY DATA INCLUDED THEREIN.
© 2017 Barclays. Used with Permission.
Source: Barclays Global Family of Indices. Copyright 2017, Barclays. All rights reserved.
188

The People Who Govern Your Fund
The trustees of your mutual fund are there to see that the fund is operated and managed in your best
interests since, as a shareholder, you are a part owner of the fund. Your fund’s trustees also serve on
the board of directors of The Vanguard Group, Inc., which is owned by the Vanguard funds and
provides services to them on an at-cost basis.
A majority of Vanguard’s board members are independent, meaning that they have no affiliation with
Vanguard or the funds they oversee, apart from the sizable personal investments they have made as
private individuals. The independent board members have distinguished backgrounds in business,
academia, and public service. Each of the trustees and executive officers oversees 197 Vanguard funds.
The following table provides information for each trustee and executive officer of the fund. The mailing
address of the trustees and officers is P.O. Box 876, Valley Forge, PA 19482. More information about
the trustees is in the Statement of Additional Information, which can be obtained, without charge, by
contacting Vanguard at 800-662-7447, or online at vanguard.com.
Interested Trustee1
F. William McNabb III
Born 1957. Trustee Since July 2009. Chairman of
the Board. Principal Occupation(s) During the Past
Five Years and Other Experience: Chairman of the
Board of The Vanguard Group, Inc., and of each of the
investment companies served by The Vanguard Group,
since January 2010; Director of The Vanguard Group
since 2008; Chief Executive Officer and President of
The Vanguard Group, and of each of the investment
companies served by The Vanguard Group, since 2008;
Director of Vanguard Marketing Corporation; Managing
Director of The Vanguard Group (1995–2008).
Independent Trustees
Emerson U. Fullwood
Born 1948. Trustee Since January 2008. Principal
Occupation(s) During the Past Five Years and Other
Experience: Executive Chief Staff and Marketing
Officer for North America and Corporate Vice President
(retired 2008) of Xerox Corporation (document manage-
ment products and services); Executive in Residence
and 2009–2010 Distinguished Minett Professor at
the Rochester Institute of Technology; Lead Director
of SPX FLOW, Inc. (multi-industry manufacturing);
Director of the United Way of Rochester, the University
of Rochester Medical Center, Monroe Community
College Foundation, North Carolina A&T University,
and Roberts Wesleyan College; Trustee of the
University of Rochester.
Rajiv L. Gupta
Born 1945. Trustee Since December 2001.2 Principal
Occupation(s) During the Past Five Years and Other
Experience: Chairman and Chief Executive Officer
(retired 2009) and President (2006–2008) of Rohm
and Haas Co. (chemicals); Director of Arconic Inc.
(diversified manufacturer), HP Inc. (printer and
personal computer manufacturing), and Delphi
Automotive plc (automotive components); Senior
Advisor at New Mountain Capital.
Amy Gutmann
Born 1949. Trustee Since June 2006. Principal
Occupation(s) During the Past Five Years and Other
Experience: President of the University of Pennsylvania;
Christopher H. Browne Distinguished Professor of
Political Science, School of Arts and Sciences, and
Professor of Communication, Annenberg School for
Communication, with secondary faculty appointments
in the Department of Philosophy, School of Arts and
Sciences, and at the Graduate School of Education,
University of Pennsylvania; Trustee of the National
Constitution Center.
JoAnn Heffernan Heisen
Born 1950. Trustee Since July 1998. Principal
Occupation(s) During the Past Five Years and Other
Experience: Corporate Vice President and Member of
the Executive Committee (1997–2008), Chief Global
Diversity Officer (retired 2008), Vice President and
Chief Information Officer (1997–2006), Controller
(1995–1997), Treasurer (1991–1995), and Assistant
Treasurer (1989–1991) of Johnson & Johnson
(pharmaceuticals/medical devices/consumer products);
Director of Skytop Lodge Corporation (hotels) and the
Robert Wood Johnson Foundation; Member of the
Advisory Board of the Institute for Women’s Leadership
at Rutgers University.
F. Joseph Loughrey
Born 1949. Trustee Since October 2009. Principal
Occupation(s) During the Past Five Years and Other
Experience: President and Chief Operating Officer
(retired 2009) of Cummins Inc. (industrial machinery);
Chairman of the Board of Hillenbrand, Inc. (specialized
consumer services), Oxfam America, and the Lumina
Foundation for Education; Director of SKF AB
(industrial machinery), Hyster-Yale Materials Handling,
Inc. (forklift trucks), and the V Foundation for Cancer

Research; Member of the Advisory Council for the
College of Arts and Letters and Chair of the Advisory
Board to the Kellogg Institute for International Studies,
both at the University of Notre Dame.
Mark Loughridge
Born 1953. Trustee Since March 2012. Principal
Occupation(s) During the Past Five Years and Other
Experience: Senior Vice President and Chief Financial
Officer (retired 2013) at IBM (information technology
services); Fiduciary Member of IBM’s Retirement Plan
Committee (2004–2013); Director of the Dow Chemical
Company; Member of the Council on Chicago Booth.
Scott C. Malpass
Born 1962. Trustee Since March 2012. Principal
Occupation(s) During the Past Five Years and Other
Experience: Chief Investment Officer and Vice
President at the University of Notre Dame; Assistant
Professor of Finance at the Mendoza College of
Business at Notre Dame; Member of the Notre Dame
403(b) Investment Committee, the Board of Advisors
for Spruceview Capital Partners, and the Investment
Advisory Committee of Major League Baseball; Board
Member of TIFF Advisory Services, Inc., and Catholic
Investment Services, Inc. (investment advisors);
Member of the Board of Superintendence of the
Institute for the Works of Religion.
André F. Perold
Born 1952. Trustee Since December 2004.
Principal Occupation(s) During the Past Five Years
and Other Experience: George Gund Professor
of Finance and Banking, Emeritus at the Harvard
Business School (retired 2011); Chief Investment
Officer and Co-Managing Partner of HighVista
Strategies LLC (private investment firm);
Overseer of the Museum of Fine Arts Boston.
Peter F. Volanakis
Born 1955. Trustee Since July 2009. Principal
Occupation(s) During the Past Five Years and Other
Experience: President and Chief Operating Officer
(retired 2010) of Corning Incorporated (communications
equipment); Chairman of the Board of Trustees of
Colby-Sawyer College; Member of the Board of
Hypertherm, Inc. (industrial cutting systems,
software, and consumables).
Executive Officers
Glenn Booraem
Born 1967. Investment Stewardship Officer Since
February 2017. Principal Occupation(s) During the
Past Five Years and Other Experience: Principal of
The Vanguard Group, Inc.; Treasurer (2015–2017),
Controller (2010–2015), and Assistant Controller
(2001–2010) of each of the investment companies
served by The Vanguard Group.
Thomas J. Higgins
Born 1957. Chief Financial Officer Since September
2008. Principal Occupation(s) During the Past Five
Years and Other Experience: Principal of The Vanguard
Group, Inc.; Chief Financial Officer of each of the
investment companies served by The Vanguard Group;
Treasurer of each of the investment companies served
by The Vanguard Group (1998–2008).
Peter Mahoney
Born 1974. Controller Since May 2015. Principal
Occupation(s) During the Past Five Years and Other
Experience: Principal of The Vanguard Group, Inc.;
Controller of each of the investment companies served
by The Vanguard Group; Head of International Fund
Services at The Vanguard Group (2008–2014).
Anne E. Robinson
Born 1970. Secretary Since September 2016. Principal
Occupation(s) During the Past Five Years and Other
Experience: Managing Director of The Vanguard Group,
Inc.; General Counsel of The Vanguard Group; Secretary
of The Vanguard Group and of each of the investment
companies served by The Vanguard Group; Director
and Senior Vice President of Vanguard Marketing
Corporation; Managing Director and General Counsel
of Global Cards and Consumer Services at Citigroup
(2014–2016); Counsel at American Express
(2003–2014).
Michael Rollings
Born 1963. Treasurer Since February 2017. Principal
Occupation(s) During the Past Five Years and Other
Experience: Managing Director of The Vanguard Group,
Inc.; Treasurer of each of the investment companies
served by The Vanguard Group; Executive Vice
President and Chief Financial Officer of MassMutual
Financial Group (2006–2016).
Vanguard Senior Management Team
Mortimer J. Buckley James M. Norris
John James Thomas M. Rampulla
Martha G. King Glenn W. Reed
John T. Marcante Karin A. Risi
Chris D. McIsaac
Chairman Emeritus and Senior Advisor
John J. Brennan
Chairman, 1996–2009
Chief Executive Officer and President, 1996–2008
Founder
John C. Bogle
Chairman and Chief Executive Officer, 1974–1996
1 Mr. McNabb is considered an “interested person,” as defined in the Investment Company Act of 1940, because he is an officer of the Vanguard funds.
2 December 2002 for Vanguard Equity Income Fund, the Vanguard Municipal Bond Funds, and the Vanguard State Tax-Exempt Funds.

P.O. Box 2600
Valley Forge, PA 19482-2600
Connect with Vanguard® > vanguard.com
Fund Information > 800-662-7447
Direct Investor Account Services > 800-662-2739
Institutional Investor Services > 800-523-1036
Text Telephone for PeopleWho Are Deaf or Hard of Hearing > 800-749-7273
This material may be used in conjunctionwith the offering of shares of any Vanguardfund only if preceded or accompanied bythe fund’s current prospectus.
All comparative mutual fund data are from Lipper, aThomson Reuters Company, or Morningstar, Inc., unlessotherwise noted.
You can obtain a free copy of Vanguard’s proxy votingguidelines by visiting vanguard.com/proxyreporting or bycalling Vanguard at 800-662-2739. The guidelines arealso available from the SEC’s website, sec.gov. Inaddition, you may obtain a free report on how your fundvoted the proxies for securities it owned during the 12months ended June 30. To get the report, visit eithervanguard.com/proxyreporting or sec.gov.
You can review and copy information about your fund atthe SEC’s Public Reference Room in Washington, D.C. Tofind out more about this public service, call the SEC at202-551-8090. Information about your fund is alsoavailable on the SEC’s website, and you can receivecopies of this information, for a fee, by sending arequest in either of two ways: via email addressed [email protected] or via regular mail addressed to thePublic Reference Section, Securities and ExchangeCommission, Washington, DC 20549-1520.
CFA® is a registered trademark owned by CFA Institute.
© 2017 The Vanguard Group, Inc.All rights reserved.Vanguard Marketing Corporation, Distributor.
Q752 072017