Van vuuren d_20150708_1500_upmc_jussieu_-_room_105
33
The world in 2050 – the contribution of model-based scenarios Detlef van Vuuren, Keywan Riahi and Elmar Kriegler
-
Upload
ingrid-le-ru -
Category
Science
-
view
172 -
download
0
Transcript of Van vuuren d_20150708_1500_upmc_jussieu_-_room_105

The world in 2050 – the contribution of model-based scenarios Detlef van Vuuren, Keywan Riahi and Elmar Kriegler
Rio+20, 15 mei 2012
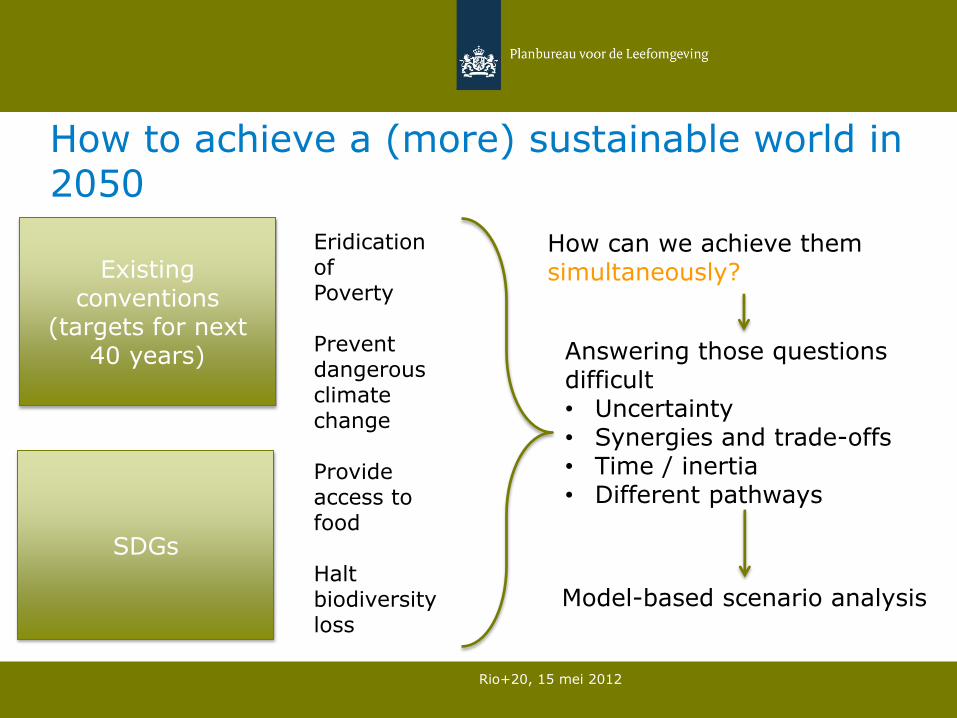
Existing conventions
(targets for next 40 years)
SDGs
How can we achieve them? How can we achieve them simultaneously?
Eridication of Poverty Prevent dangerous climate change Provide access to food Halt biodiversity loss
Answering those questions difficult • Uncertainty • Synergies and trade-offs • Time / inertia • Different pathways
Model-based scenario analysis
How to achieve a (more) sustainable world in 2050
Integrated Assessment Models (IAMs)
• Interaction of human system and environmental system
• Integration across different issues
• Focused on decisions processes (assessment)
• Originally developed to evaluate climate policy –
• more and more used to look into linkages between environmental issues development topics
• Important examples: IMAGE (PBL), REMIND (PIK), MESSAGE (IIASA)
Human system
Earth system
Economy Population Technology
Agriculture
Land use
Energy use
Emissions
Ecosystem dynamics
Climate change
Pollution
Biogeochemical cycles
Env. impacts
Driv
ers
Reso
urce
use
In
teracti
on
Earth
syste
m

How did we analyse this?
Rio+20, 30 mei 2012
Sustainable
history
goals
Expected trend
Challenge
Trans- formative action
Short-term implications
time
• Focused on internationally agreed upon objectives
• Model analysis (integrated assessment); three alternative paths
• Combined with focus on governance
• Integrated scenarios for land, biodiversity, energy, land, water and nutrients

Earlier studies looking into wide range of sustainable development issues
Rio+20, 30mei 2012
Some examples:
Shared socio-economic scenarios (cooperation PIK, IIASA, PBL, PNNL, FEEM, AIM and others)
Global Energy Outlook projections (IIASA, PBL)
Roads from Rio+20 study (PBL)
UNEP’s Global Environmental Outlook
02-11-2011 | Jasper van Vliet
6
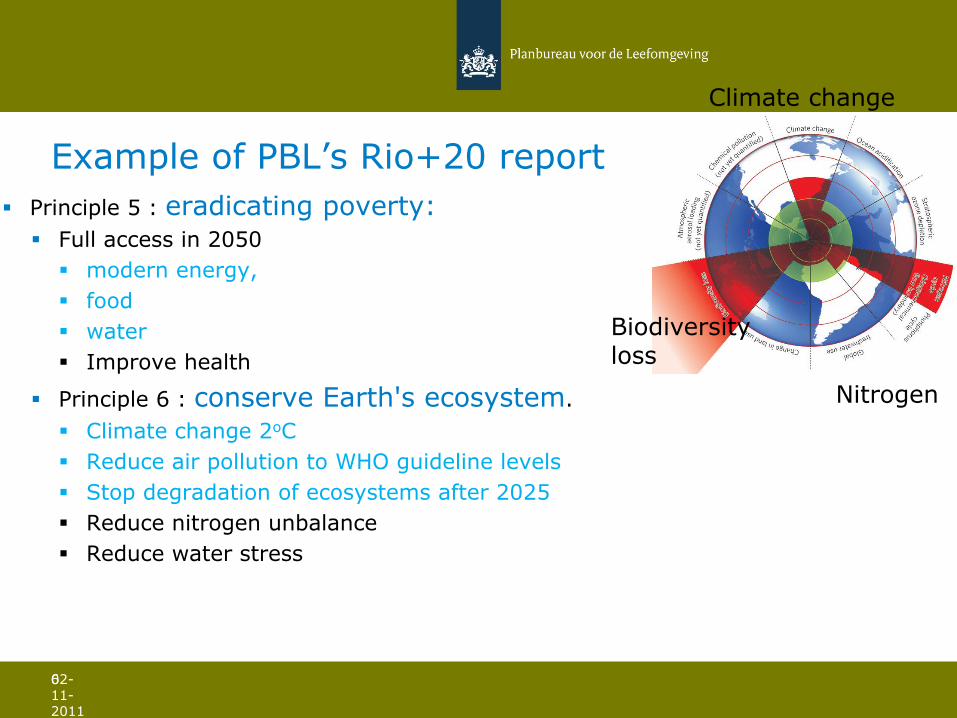
Example of PBL’s Rio+20 report
Principle 5 : eradicating poverty: Full access in 2050
modern energy,
food
water
Improve health
Principle 6 : conserve Earth's ecosystem.
Climate change 2oC
Reduce air pollution to WHO guideline levels
Stop degradation of ecosystems after 2025
Reduce nitrogen unbalance
Reduce water stress
Climate change
Biodiversity loss
Nitrogen

Rio+20, 15 mei 2012
With continuation of current policies, no breakthrough expected
Protect Ecosystems
Prevent dangerous climate change
Eridicate hunger
Little progress in achieving sustainable development goals

Characterisation of three pathways
Rio+20, 15 mei 2012
Pathway Main assumptions
Global Technology Large-scale, technologically optimal solutions; intesive agriculture, international coordination
Decentralised Solutions
Local energy production, multi-functional agriculture, local policies
Consumption change Dietary change, less energy-intensive lifestyle, further pressure released through technology

TFDO Rio+20, 19 januari 2012
The land challenge
Ensuring access to food for all – while preventing biodiversity loss below the 2025 level

Rio+20, 15 mei 2012
Technical potential exists…. Food and biodiversity
Different pathways can be chosen
Key elements:
Increase agr. Prod. significantly
Mitigate climate change
Manage negative impacts of infrastructure
Protect ecological hotspots
Control consumption

Global nitrogen surplus
Rio+20, 15 mei 2012
Our best scenarios keep nitrogen surplus at 2000 level, despite dietary changes and additional n-specific measures.

TFDO Rio+20, 19 januari 2012
The energy challenge
Ensuring access to energy for all – while staying within the 2 deg C emissions budget, restricting bio-energy use under sustainabiliy criteria and staying within WHO guidelines for air pollution.

Rio+20, 15 mei 2012
Technical potential exists… energy and climate
Reaching 2oC target and achieving other energy targets is possible; additional costs ~1-2% of GDP
Key elements:
Energy savings
Non-CO2
Carbon-free electricity
Energy access
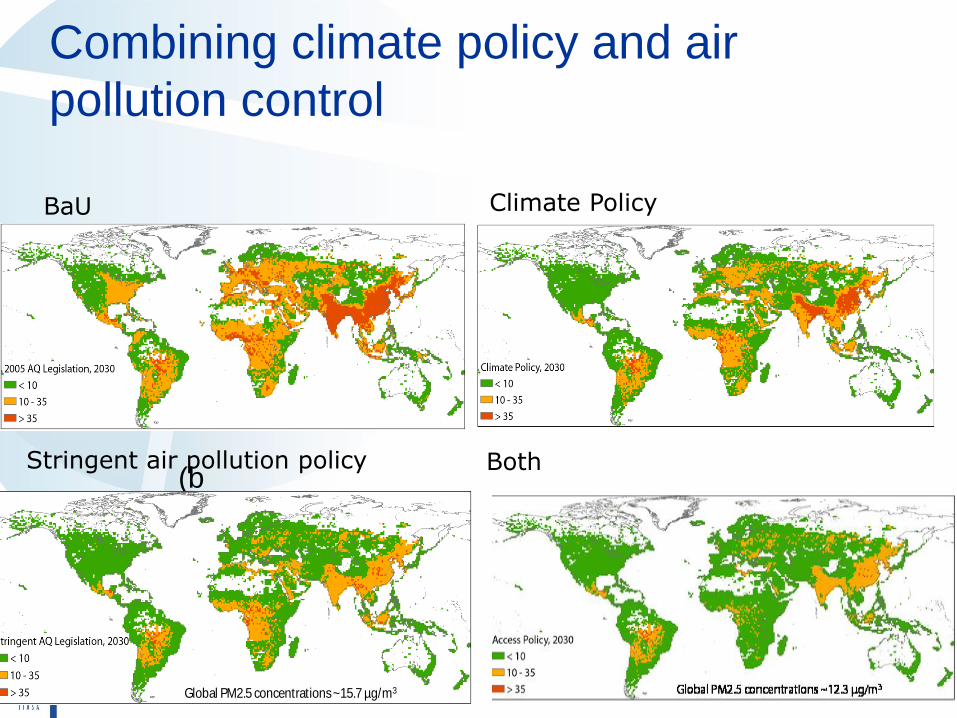
Combining climate policy and air
pollution control
3
3
(b
)
Global PM2.5 concentrations ~30.4 µg/m3 Global PM2.5 concentrations ~50.3 µg/m3
(a)
Global PM2.5 concentrations ~34.0 µg/m3
(b)
Global PM2.5 concentrations ~26.0 µg/m3
(c)
Global PM2.5 concentrations ~15.7 µg/m3
(d)
Global PM2.5 concentrations ~12.3 µg/m3
(e)
BaU Climate Policy
Stringent air pollution policy Both

TFDO Rio+20, 19 januari 2012
Bringing it all together

Transformative action needed!!
Rio+20, 30 mei 2012
Improvement of Carbon intensity
Improvement of Agriculture efficiency

0.0%
0.2%
0.4%
0.6%
0.8%
1.0%
1.2%
Only Energy Security Only Air Pollution and Health Only Climate Change All Three Objectives
Tota
l G
lob
al
Po
licy
Co
sts
(2
01
0-2
03
0)
Energy
Security Air pollution Climate
Policy Costs and Synergistic Effects
Inte
gra
ted
So
lutio
ns
McC
ollu
m e
t al, 2
012 (
Natu
re C
limate
Chang
e)
To
tal g
lob
al p
olicy c
osts
(p
erc
en
t o
f G
DP
)
20
10
-20
30

Rio+20, 15 mei 2012
Implications for water stress

19
Interactions!
Synergy
Mixed
Trade-off
Eridicate hunger
Access to water
Access to energy
Clean energy
Climate mitigation
Halting Biodiversity Loss
19
Access to water
Access to energy
Clean energy
Conserve biodiversity
Climate mitigation
Eridicate hunger

Rio+20, 15 mei 2012
TWI2050 project
Quantitative analysis oriented at SDGs and Planetary Boundaries
Key impact : – Involve different institutions and their models and
couple them – Relate analysis to key products of institutes – Interaction with key stakeholders
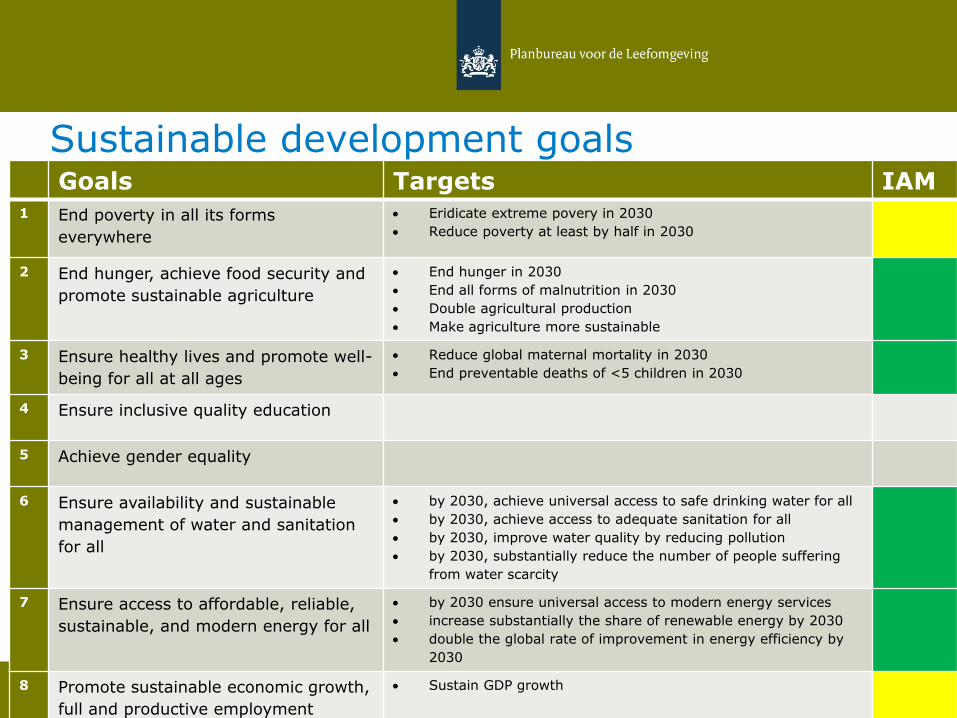
Goals Targets IAM 1 End poverty in all its forms
everywhere
Eridicate extreme povery in 2030
Reduce poverty at least by half in 2030
2 End hunger, achieve food security and
promote sustainable agriculture
End hunger in 2030
End all forms of malnutrition in 2030
Double agricultural production
Make agriculture more sustainable
3 Ensure healthy lives and promote well-
being for all at all ages
Reduce global maternal mortality in 2030
End preventable deaths of <5 children in 2030
4 Ensure inclusive quality education
5 Achieve gender equality
6 Ensure availability and sustainable
management of water and sanitation
for all
by 2030, achieve universal access to safe drinking water for all
by 2030, achieve access to adequate sanitation for all
by 2030, improve water quality by reducing pollution
by 2030, substantially reduce the number of people suffering
from water scarcity
7 Ensure access to affordable, reliable,
sustainable, and modern energy for all
by 2030 ensure universal access to modern energy services
increase substantially the share of renewable energy by 2030
double the global rate of improvement in energy efficiency by
2030
8 Promote sustainable economic growth,
full and productive employment
Sustain GDP growth
Sustainable development goals

Rio+20, 15 mei 2012
Goals Targets IAM 9 Build resilient infrastructure, foster
innovation
10 Reduce inequality within and among
countries
Higher economic growth for bottom 40%
11 Make cities and settlements inclusive,
safe, resilient and sustainable
12 Ensure sustainable consumption and
production patterns
13 Take urgent action to combat climate
change and its impacts *
14 Conserve and sustainably use the
oceans, seas and marine resources
15 Protect, and promote sustainable use
of terrestrial ecosystems,
Halt deforestation, increase afforestation and reforestation
16 Promote peaceful and inclusive
societies, access to justice for all
17 Strengthen the means of
implementation a
Sustainable development goals

New scenarios for climate research – SSP/RCP
Two dimensions determining our future -
Clim
ate
ch
an
ge
RCP8.5
RCP2.6
Level of climate change Socio-economic development

Rio+20, 15 mei 2012

Some conclusions
• We can use model-based scenarios to map out pathways towards a sustainable 2050.
• These will show important synergies / trade-offs; technical and governance challenges timing.
• In the next period, important challenge in mapping out clear plan how to link models of different institutes to add to the overall analysis

Thank you for your attention!
Products:
• Rio+20: Report and interactive website (app) (http://www.pbl.nl/en/node/55488)
(http://roadsfromrio.pbl.nl/)
• SSPs
Rio+20, 15 mei 2012
25 augustus 2015
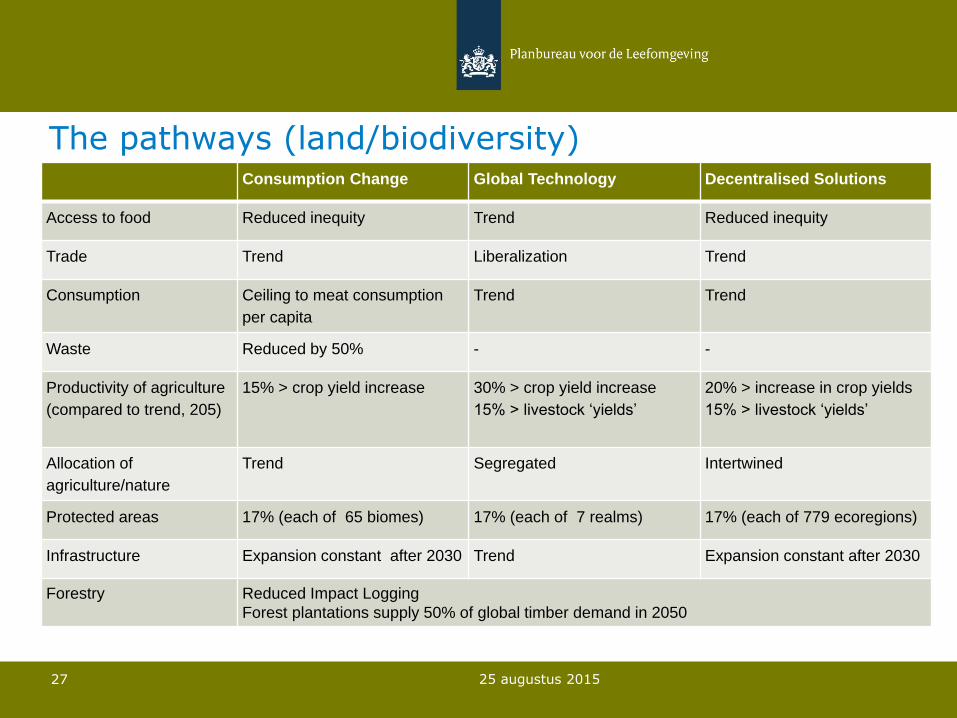
The pathways (land/biodiversity)
27
Consumption Change Global Technology Decentralised Solutions
Access to food Reduced inequity Trend Reduced inequity
Trade Trend Liberalization Trend
Consumption Ceiling to meat consumption
per capita
Trend Trend
Waste Reduced by 50% - -
Productivity of agriculture
(compared to trend, 205)
15% > crop yield increase 30% > crop yield increase
15% > livestock ‘yields’
20% > increase in crop yields
15% > livestock ‘yields’
Allocation of
agriculture/nature
Trend Segregated Intertwined
Protected areas 17% (each of 65 biomes) 17% (each of 7 realms) 17% (each of 779 ecoregions)
Infrastructure Expansion constant after 2030 Trend Expansion constant after 2030
Forestry Reduced Impact Logging
Forest plantations supply 50% of global timber demand in 2050

Change in agriculture consumption
Rio+20, 15 mei 2012
Considerable increase in demand, driven by population and income.
Eridicating hunger could be done with very little impact on overall consumption levels

Rio+20, 15 mei 2012

Fo
rcin
g l
evel
(W
/m
2)
8.5
6.0
4.5
2.6
SSP1 SSP2 SSP3
Shared Socio-economic Pathways
SSP4 SSP5 RCPs
Climate SSPs
The Scenario Matrix Architecture

SSP1 SSP2 SSP3
Shared Socio-economic Pathways
SSP4 SSP5
Challenge to adaptation
Challenge t
o m
itig
ation

Rio+20, 15 mei 2012 Van Vuuren, D.P. et al 2012. . A proposal for a new scenario framework to support research and
assessment in different climate research communities . Global Environmental Change
Rio+20, 15 mei 2012
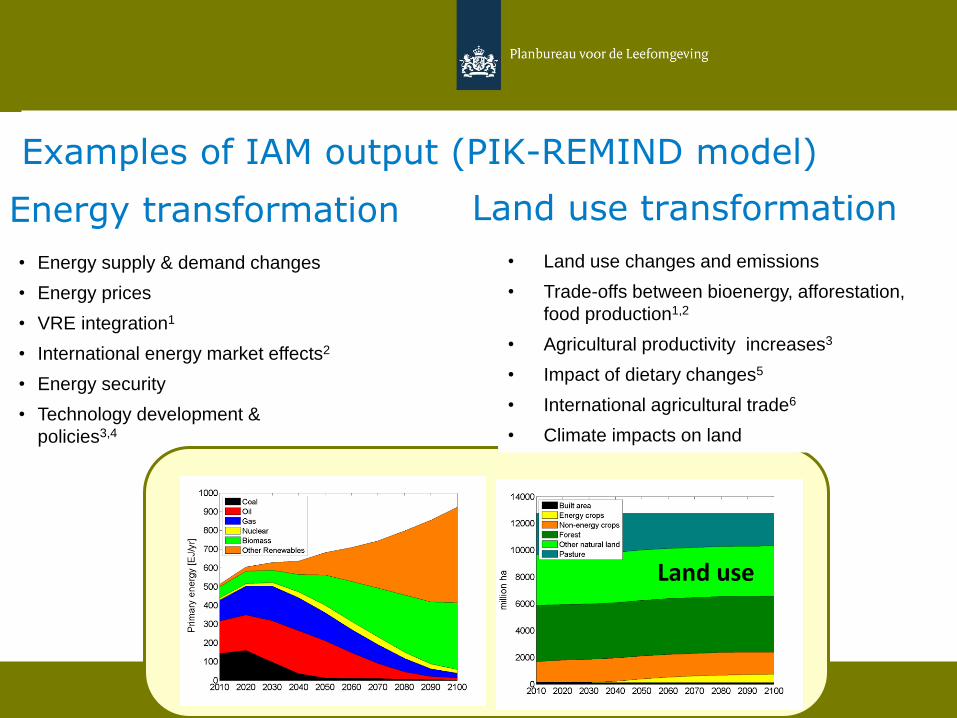
Land use transformation
Land use
• Land use changes and emissions
• Trade-offs between bioenergy, afforestation,
food production1,2
• Agricultural productivity increases3
• Impact of dietary changes5
• International agricultural trade6
• Climate impacts on land
• Energy supply & demand changes
• Energy prices
• VRE integration1
• International energy market effects2
• Energy security
• Technology development &
policies3,4
Energy transformation
Examples of IAM output (PIK-REMIND model)