van Loon, J., Dehghan, A., Weihong, T., Trompet, S ... · 4 Introduction Von Willebrand factor...
28
van Loon, J., Dehghan, A., Weihong, T., Trompet, S., McArdle, W. L., Asselbergs, F. F. W., ... O'Donnell, C. (2016). Genome-wide association studies identify genetic loci for low von Willebrand factor levels. European Journal of Human Genetics, 24(7), 1035-1040. https://doi.org/10.1038/ejhg.2015.222 Peer reviewed version Link to published version (if available): 10.1038/ejhg.2015.222 Link to publication record in Explore Bristol Research PDF-document This is the author accepted manuscript (AAM). The final published version (version of record) is available online via Nature at http://www.nature.com/ejhg/journal/v24/n7/full/ejhg2015222a.html. Please refer to any applicable terms of use of the publisher. University of Bristol - Explore Bristol Research General rights This document is made available in accordance with publisher policies. Please cite only the published version using the reference above. Full terms of use are available: http://www.bristol.ac.uk/pure/about/ebr-terms
Transcript of van Loon, J., Dehghan, A., Weihong, T., Trompet, S ... · 4 Introduction Von Willebrand factor...

van Loon, J., Dehghan, A., Weihong, T., Trompet, S., McArdle, W. L.,Asselbergs, F. F. W., ... O'Donnell, C. (2016). Genome-wide associationstudies identify genetic loci for low von Willebrand factor levels. EuropeanJournal of Human Genetics, 24(7), 1035-1040.https://doi.org/10.1038/ejhg.2015.222
Peer reviewed version
Link to published version (if available):10.1038/ejhg.2015.222
Link to publication record in Explore Bristol ResearchPDF-document
This is the author accepted manuscript (AAM). The final published version (version of record) is available onlinevia Nature at http://www.nature.com/ejhg/journal/v24/n7/full/ejhg2015222a.html. Please refer to any applicableterms of use of the publisher.
University of Bristol - Explore Bristol ResearchGeneral rights
This document is made available in accordance with publisher policies. Please cite only the publishedversion using the reference above. Full terms of use are available:http://www.bristol.ac.uk/pure/about/ebr-terms
1
Genome-wide association studies identify genetic loci for low Von Willebrand
factor levels
Janine van Loon, MD, PhD, Abbas Dehghan, MD, PhD, Tang Weihong MD, PhD,
Stella Trompet, PhD, Wendy L. McArdle, PhD, Folkert F.W. Asselbergs, MD, PhD,
Ming-Huei Chen, PhD, Lorna M. Lopez, PhD, Jennifer E. Huffman, PhD, Frank W.G.
Leebeek, MD, PhD, Saonli Basu, PhD, David J. Stott, MD, PhD, Ann Rumley, PhD,
Ron T. Gansevoort, MD, PhD, Gail Davies, PhD, James J.F. Wilson, PhD, Jacqueline
C.M. Witteman, PhD, Xiting Cao, MS, PhD, Anton J.M. de Craen, PhD, Stephan J.L.
Bakker, MD, PhD, Bruce M. Psaty, MD, PhD, John M. Starr, MD, Albert Hofman, MD,
PhD, J. Wouter Jukema, MD, PhD, Ian J. Deary, PhD, Caroline Hayward, PhD, Pim
van der Harst, M,D PhD, Gordon D.O. Lowe, MD, PhD, Aaron R. Folsom, MD, MPH ,
David P. Strachan, MD, Nicolas Smith, PhD, Moniek P.M. de Maat, PhD, Christopher
O'Donnell, MD, MPH.
Running title: genetic loci for low von willebrand factor levels
Keywords: Von Willebrand factor, Genome wide association study; Von Willebrand
disease
Affiliations
Departments of Hematology (JL, FWL, MPM) and Epidemiology (AD, JCW, AH),
Erasmus University Medical Centre, , Rotterdam, The Netherlands; Divisions of
Epidemiology and Community Health (TW, SB, ARF) and Biostatistics (XC)
University of Minnesota, Minneapolis, MN, USA; Departments of Cardiology (ST,
JWJ) and Gerontology and Geriatrics (AJC), Leiden University Medical Center, Leiden,

2
the Netherlands; Institute of Cardiovascular and Medical Sciences (DJS, GDL), Faculty
of Medicin, University of Glasgow, UK; School of Social and Community Medicine
(WLM), University of Bristol, UK;, Division of Cardiovascular and Medical Sciences,
University of Glasgow, Royal Infirmary, Glasgow, UK (AR, DPS); Department of
Cardiology, Heart Long Institute, University Medical Centre Utrecht, Utrecht, The
Netherlands and Durrer Center for Cardiogenetic Research, ICIN-Netherlands Heart
Institute, Utrecht, The Netherlands (FWA); Department of Internal Medicine (RG, SJB,
PH), University Medical Center Groningen, The Netherlands; Cardiovascular Health
Research Unit, Dept. Of Medicine, Epidemiology & Health Services (MHC, CO)
University of Washington, Seattle, WA, USA; Centre for Cognitive Ageing and
Cognitive Epidemiology, The University of Edinburgh, Edinburgh, UK (LML, GD,
JMS, IJD); Department of Psychology, The University of Edinburgh, Edinburgh, UK
(JMS, LML); Geriatric Medicine unit, The University of Edinburgh, Royal Victoria
Building, Western General Hospital, Edinburgh, UK (GD, IJD); MRC IGMM,
University of Edinburgh, Edinburgh EH4 2XU, United Kingdom (JEH, JFW, CH);
Cardiovascular Health Research Unit, Dept. Of Medicine, Epidemiology & Health
Services, University of Washington, Seatle, WA, USA (BMP); Department of
Epidemiology, University of Washington, Seattle WA, USA; Seattle Epidemiologic
Research and Information; Center, Department of Veterans Affairs Office of Research
& Development, Seattle WA, USA; Group Health Research Institute, Group Health
Cooperative, Seattle WA, USA (NS)
Address for correspondence:
Moniek P.M. de Maat, PhD, Erasmus University Medical Centre, Department of
Hematology – room Nb845a, P.O. Box 2040, 3000 CA Rotterdam, The Netherlands,

3
Phone: +31.(0)10.7033442/ Fax: +31.(0)10.7035814, E-mail: [email protected]
Abstract
Low VWF levels are associated with bleeding symptoms and are a diagnostic criterion
for von Willebrand disease; the most common inherited bleeding disorder. To date, it is
unclear which genetic loci are associated with reduced VWF levels. Therefore, we
conducted a meta-analysis of genome-wide association studies to identify genetic loci
associated with low VWF levels. For this meta-analysis we included 31,149 participants
of European ancestry from eleven community-based studies. From all participants VWF
antigen (VWF:Ag) measurements and genome-wide single nucleotide polymorphisms
(SNPs) scans were available. Each study conducted analyses using logistic regression of
SNPs on dichotomized VWF:Ag measures (lowest 5% for blood group O and non-O)
with an additive genetic model adjusted for age and sex. An inverse-variance weighted
meta-analysis was performed for VWF:Ag levels. A total of 97 SNPs exceeded the
genome-wide significance threshold of 5×10⁻⁸ and comprised five loci on four different
chromosomes: 6q24 (smallest p-value 5.8×10⁻¹⁰), 9q34 (2.4×10-64), 12p13 (5.3×10⁻²²),
12q23 (1.2×10⁻⁸), 13q13 (2.6×10⁻⁸). All loci were within or close to genes, including
STXBP5 (6q24), STAB5 (12q23), ABO (9q34), VWF (12p13), and UFM1 (13q13). Of
these, UFM1 has not been previously associated with VWF:Ag levels. Four genes that
were previously associated with VWF levels (VWF, ABO, STXBP5 and STAB2) were
also associated with low VWF levels, and in addition we identified a new gene, UFM1,
that is associated with low VWF levels. These findings point to novel mechanisms for
the occurrence of low VWF levels.
4
Introduction
Von Willebrand factor (VWF) is a multifunctional glycoprotein, which is secreted by
endothelial cells and released upon endothelial cell activation. VWF initiates the
adherence of platelets to the injured vessel wall, and the subsequent platelet aggregation
facilitates adequate haemostasis1,2.
Plasma levels of VWF antigen (VWF:Ag) are characterized by a large inter-individual
variation and range from 0.60 to 1.40 IU/mL in healthy individuals3. Various
environmental and lifestyle factors affect VWF:Ag levels, but approximately 60% of the
variability in VWF:Ag levels can be explained by genetic factors4.
The necessity of maintaining normal VWF levels in the circulation is illustrated by two
clinical manifestations that may occur when VWF exceeds its normal range. High
VWF:Ag levels are associated with an increased risk of venous thrombosis and arterial
thrombosis 5-8. Conversely, low VWF:Ag levels are associated with an increased
bleeding tendency and are a characteristic of von Willebrand disease (VWD). VWD is
the most common inherited bleeding disorder in humans and is caused by a quantitative
deficiency of VWF (type 1 and 3 VWD) and/or a qualitative defect of VWF molecules
(type 2 VWD) 9.
Most severe forms of type 1 VWD are caused by dominant-negative family-based
variations in the VWF gene (VWF) 10,11. However, in individuals with moderately
decreased VWF:Ag levels VWF variations are often not found and linkage with the
VWF locus is rarely seen 10,11. Hence, it is difficult to differentiate between subjects
with physiologically low VWF:Ag levels and subjects with low VWF:Ag levels because
of VWD12,13. However, since VWF:Ag levels are strongly genetically determined, it is
expected that more common genetic variations in other genes than VWF are likely to be
involved in the occurrence of low VWF:Ag levels and therefore in the etiology of type 1

5
VWD. We have previously shown that several loci outside the VWF gene are indeed
associated with VWF:Ag levels and that the VWF decreasing alleles are more
frequently observed in individuals diagnosed with VWD 13. To identify common genetic
loci that are associated with low VWF:Ag levels, related to an increased bleeding
tendency, we performed a meta-analysis of genome-wide association studies (GWAS)
in eleven large population-based cohort studies.
Methods
Study populations
This meta-analysis was conducted in the CHARGE Consortium14, which includes data
from several population-based cohort studies. VWF:Ag measurements were available in
four of these; the Rotterdam Study (RS) I and II , the Framingham Heart Study (FHS),
and the Atherosclerotic Risk in Communities (ARIC) study. In addition, we included
data from seven other studies that had VWF:Ag measurements and genome-wide data
available: the British 1958 Birth cohort (B58C) study, the PROspective Study of
Pravastatin in the Elderly at Risk (PROSPER), the Prevention of Renal and Vascular
Endstage Disease (PREVEND) study, Lothian Birth Cohort 1921 and 1936 (LBC1921,
LBC1936), Vis Croatia Study (CROATIA-Vis) and ORKNEY complex Disease Study
(ORCADES). The designs of the studies have been described previously15-25.
Genome-wide scans and VWF:Ag measurements were available for analysis in 31,149
individuals. Eligible participants were not using a coumarin-based anticoagulant at the
time of VWF:Ag measurement and were of European ancestry by self-report. All
studies were approved by their respective institutional review committee. In addition,
written informed consent was obtained from all participants, as well as permission to
use their DNA for research purposes.

6
Baseline measurements and von Willebrand factor measures
Baseline measures of clinical and demographic characteristics were obtained at the time
of cohort entry for ARIC, CROATIA-Vis, ORCADES, PROSPER, PREVEND and RS,
and at the time of phenotype measurements for B58C, LBC1921, LBC1936, and FHS.
Measures were obtained using standardized methods as specified by each study and
included measures of height and weight, as well as self-reported treatment of diabetes
and hypertension, current alcohol consumption, and prevalent cardiovascular disease
(history of myocardial infarction, angina, coronary revascularisation, stroke, or transient
ischemic attack). Blood group antigen phenotypes (O and non-O) were reconstructed
using genotype data of rs687289:C>T, which is a marker for the O allele26.
VWF:Ag was measured in all cohorts using enzyme-linked immunosorbent assays
(ELISA) (supplementary table 3).
Genotyping
For the genotyping, DNA was collected from phlebotomy from all studies except B58C,
which used cell lines. Genome-wide assays of SNPs were conducted independently in
each cohort using various Affymetrix and Illumina panels (Supplementary table 3).
Each study conducted genotype quality control and data cleaning, including assessment
of Hardy-Weinberg equilibrium and variant call rates. Details on genotyping assays
have been described in detail previously and are provided in supplementary table 314.
For this analysis we investigated genetic variation in the 22 autosomal chromosomes27.
Genotypes were coded as 0, 1, and 2 to represent the number of copies of the coded
alleles for all chromosomes27. Each study independently imputed its genotype data to
the ≈ 2.6 million SNPs identified in the HapMap Caucasian (CEU) sample from the

7
Centre d’Etude du Polymorphisme Humain28-30. Imputation software, including MACH,
BIMBAM, or IMPUTE, were used to impute unmeasured genotypes with SNPs that
passed quality-control criteria based on phased haplotypes observed in HapMap.
Imputation results were summarized as an “allele dosage”, which was defined as the
expected number of copies of the minor allele of that SNP (a continuous value between
0 and 2) for each genotype. Each cohort calculated the ratio of observed to expected
variance of the dosage statistics for each SNP. This value, which generally ranges from
0 to 1 (i.e. poor to excellent), reflects imputation quality.
Public Repository: Our data are available on the European Genome-phenome Archive
(https://ega.crg.eu, accession number EGAS00001001341).
Statistical analysis
Genotype-phenotype data were analysed independently by each study. VWF:Ag
measurements were used as dichotomous variable (low versus normal) with low VWF
defined as the lowest 5% within blood groups, i.e. blood group O and non-O. All studies
used logistic regression with an additive genetic model adjusted for age and sex to
conduct analyses of all directly genotyped and imputed SNPs and their association with
dichotomous VWF:Ag measures. FHS used generalized estimation equations to account
for familial correlation. ARIC and PROSPER adjusted for field site, additionally. B58C
adjusted for sex, date and time of sample collection, postal delay, and the nurse who
performed the inclusion, which also adjusts for the region of residence. Age adjustment
was not necessary in B58C, since all cohort members were born in one week.
An inverse-variance weighted meta-analysis was performed using METAL software
(http://www.sph.umich.edu/csg/abecasis/Metal/index.html) with genomic control

8
correction being applied at the cohort level31.
The a priori threshold of genome-wide significance was set at a p-value of 5.0 x 10⁻⁸.
When more than one SNP clustered at a locus, the SNP with the smallest p-value was
selected to represent the locus.
Results
For this meta-analysis 31,149 participants of European ancestry were included. The
sample size and participant characteristics from each cohort are displayed in
supplementary table 1. The mean age ranged from 45 years in B58C to 87 years in
LBC1921 and on average 48% of the participants was female.
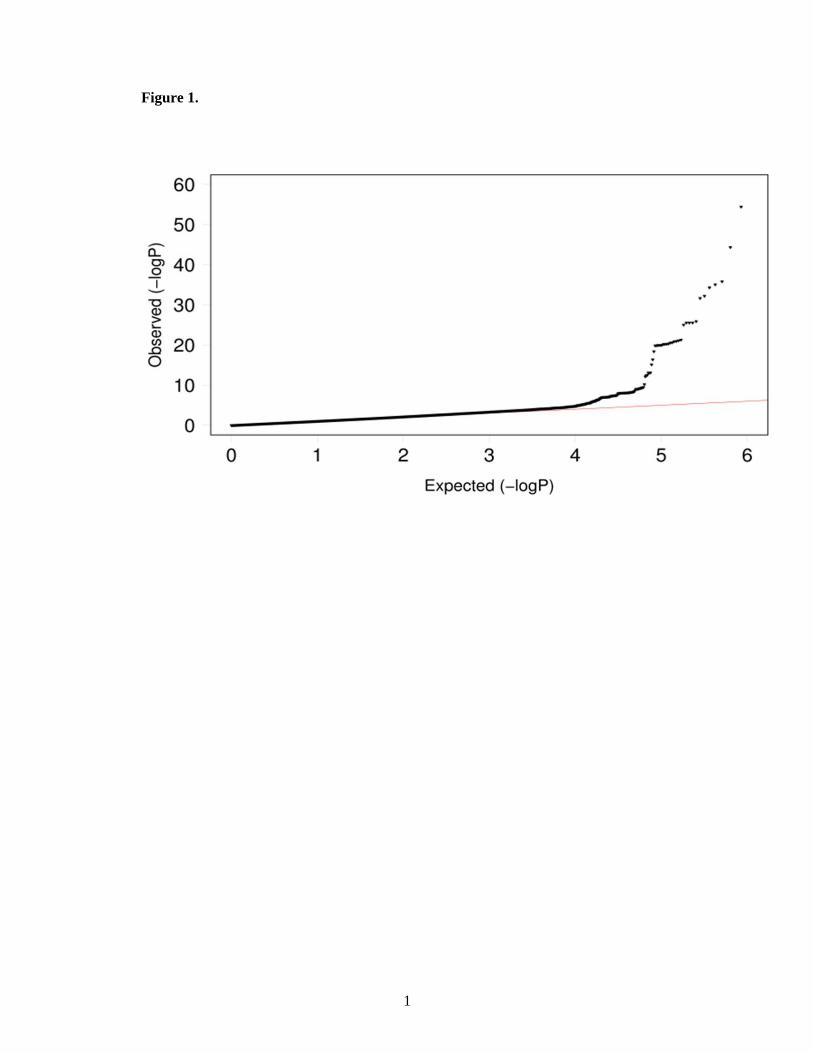
A quantile-quantile plot of the observed p-value from meta-analysis against expected p-
value distribution is shown in figure 1. Figure 2 illustrates the primary findings from the
meta-analysis and presents p-values for each of the interrogated SNPs across the 22
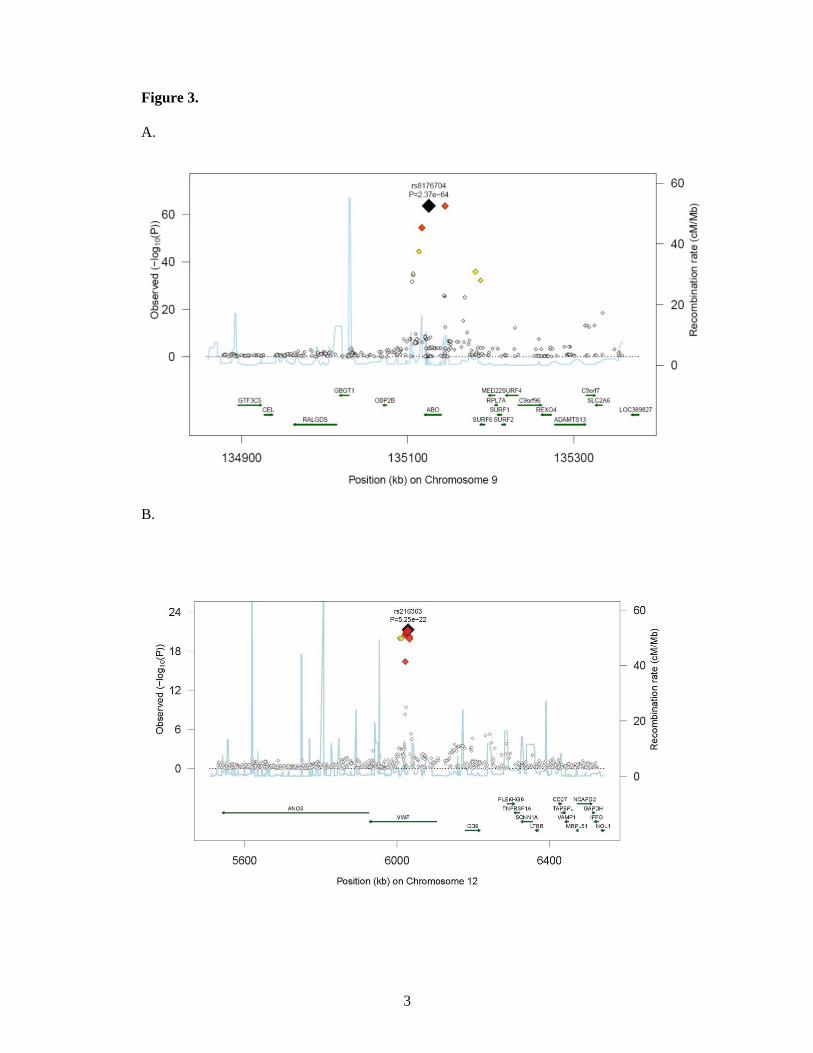
autosomal chromosomes. A total of 97 SNPs exceeded the genome-wide significance
threshold of 5 × 10⁻⁸ and clustered around five genetic loci on four different
chromosomes (figure 3). The SNP with the strongest signal was rs8176704:A>G, which
is located at 9q34 (intron) in the ABO blood group gene (P = 2.4 × 10-64). The odds
ratio (OR) for having VWF levels in the lowest 5% was 2.83 [95% CI 2.52;3.18]. In
addition, we performed a conditional analysis. Based on this analysis we found three
independent signals at 9q34. The analysis shows that rs579459 and rs8176747 are
independently significant after taking into account the LD structure and their correlation
with rs817704. The second most significant locus was marked by rs216303:T>C, which
is located at 12p13 (intron) in the VWF gene (OR 0.57 [95% CI 0.51;0.64], P = 5.3 ×
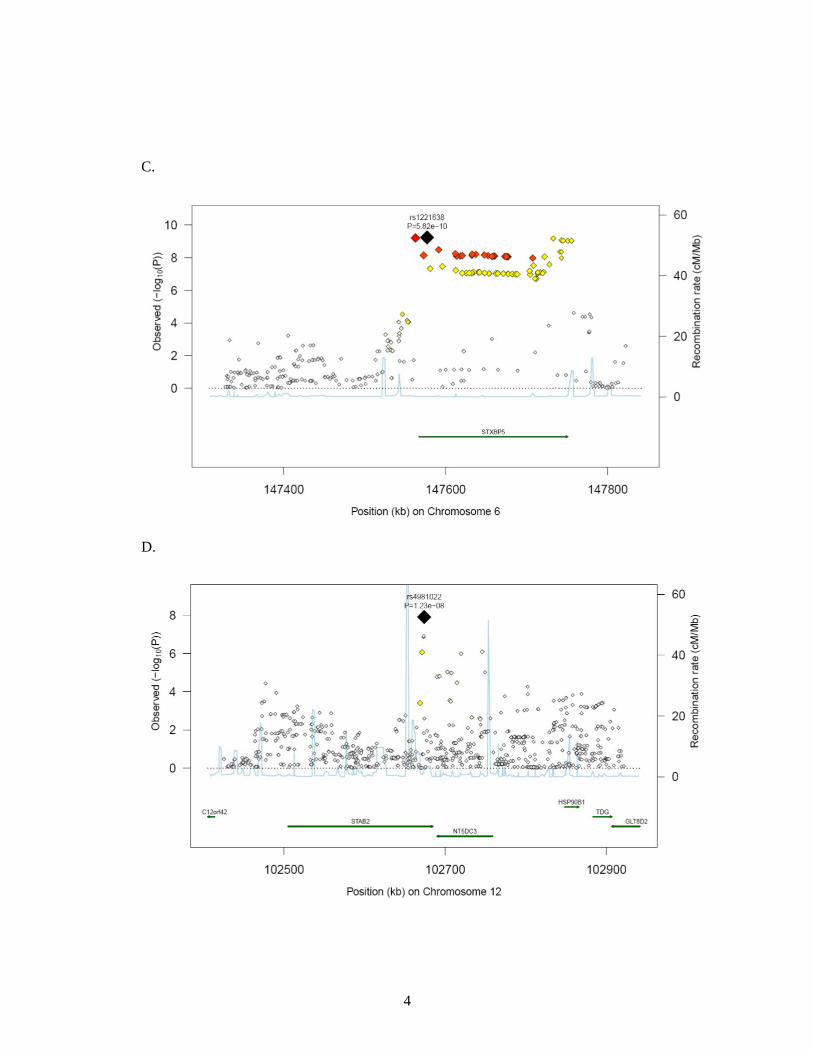
10-22). The third genome-wide significant signal at chromosomal position 6q24 (intron)
was within STXBP5 (Syntaxin Binding Protein 5). Rs1221638:A>G was associated with
9
the smallest p-value (5.8 × 10⁻¹⁰) in this region (OR 1.28 [95% CI 1.19;1.39]). The
fourth statistical significant signal was marked by rs4981022A>G, which is located at
12q23 (intron) in STAB2 (stabilin-2) (OR 0.79 [95% CI 0.73;0.85], P = 1.2 × 10⁻⁸). The
final genome-wide significant locus was marked by rs17057285:A>C (OR 0.41 [95%
CI 0.30;0.56], P = 2.6 × 10⁻⁸), which is 200kb upstream from UFM1 (ubiquitin-fold
modifier 1). There are two SNPs close to rs17057285. The first one is rs17057209
which is 52 kb far from rs17057285 and is in complete LD with rs17057285 (R2 = 1).
Both of these SNPs are missing in five studies (VIS, ORKNEY, Prevend, LBC1921,
LBC1936) out of 11 studies who contributed to the study. The third SNP is rs7323793
which is 67 kb far and is partly in LD with rs17057285 (R2 = 0.496). Rs7323793 is
missing only in Prevend Study.
In addition to our five genome-wide significant loci, five other loci demonstrated
multiple-SNP hits with p-values below 1.0 × 10⁻⁶: rs10848820:A>G (P = 1.2 × 10⁻⁷)
within TSPAN9 (tetraspanin 9), rs4276643:T>C (P = 3.4 × 10⁻⁷) within SCARA5
(scavenger receptor class A, member 5), rs17398299:A>C (P = 4.1 × 10⁻⁷) close to 1
gene, LPHN2 (latrophilin 2), rs5995441:T>C (P = 8.3 × 10⁻⁷) within CARD10 (caspase
recruitment domain family, member 10), and rs3750450:T>G (P = 9.6 × 10⁻⁷) within
EPB41L4B (erythrocyte membrane protein band 4.1 like 4B).
Discussion
In this meta-analysis of GWA data from eleven population-based cohorts comprising
31,149 individuals of European ancestry, we identified five genetic loci that are
associated with low VWF levels: ABO, VWF, STXBP5, STAB2, and UFM1.
The most significant signal in our study came from a well-known determinant of
VWF:Ag levels, the ABO locus. The presence of blood group A and B antigens on

10
VWF molecules leads to a decreased clearance of VWF molecules. Consequently,
individuals with blood group O have 25% lower VWF plasma concentrations than
individuals with blood group non-O32. Although we used a different cut-off point for
low VWF levels for blood group O and non-O separately to minimize the effect of
blood group, the ABO locus still reached a very high level of statistical significance.
This implies that blood group O versus non-O explains not the total ABO locus effect,
and that A or B antigens also determine VWF levels. Indeed, carriers of the B antigen
have higher VWF levels than carriers of the A antigen and carriers of both antigens
have the highest VWF levels33,34.
The second locus is within the VWF gene. It has been well established that common
genetic polymorphisms in the VWF gene contribute to the variability in VWF:Ag
levels35-37. The most significant SNP that marked the VWF locus was rs216303:T>C,
which is located within an intronic region. Until recently, intronic polymorphisms were
often considered less relevant for disease development and regulating protein levels in
plasma. However, there is now an increasing recognition that intronic variants can
contribute by for example influencing the form and efficacy of gene splicing and
mRNA stability37. Another possibility is that SNPs in the intronic regions are in high
LD with functional SNPs in adjacent regions.
The third locus is within the STXBP5 gene, which encodes the syntaxin binding protein
5. STXBP5 can bind to Soluble N-ethylmaleimide-sensitive factor (NSF) Attachment
protein Receptor (SNARE) proteins, among which syntaxin-2 and syntaxin-4. Syntaxin-
4 has been shown to be involved in Weibel Palade Body exocytosis38, the well known
mechanism for the secretion of VWF molecules from endothelial cells. We have
previously shown in a well defined cohort of young patients with a first event of arterial
thrombosis that genetic variation in STXBP5 is associated with VWF:Ag levels13,39. The
11
LD between rs1221638:A>G and the SNP that had the highest significance in the
previous meta-analysis is D’ = 0.90 and R2 = 0.67.
The fourth locus was marked by rs4981022:A>G, which is located in STAB2. Stabilin−2
is a transmembrane receptor protein and is primarily expressed in liver and spleen
sinusoidal endothelial cells. Stabilin-2 can bind various ligands, such heparin, LDL,
bacteria, and advanced glycosylation products, and subjects them to endocytosis40.
STAB2 variation might be important in the regulation of VWF levels via the clearance
of VWF molecules.
The final genome-wide significant locus was marked by rs17057285:A>C, which is
upstream from UFM1. UFM1 encodes the ubiquitin-fold modifier 1, which has been
recently identified as a novel protein conjugating system41. Although the precise
function has not been elucidated yet, the UFM1 cascade seems to be involved in cellular
homeostasis, influencing cell division, growth and endoplasmatic reticulum function42.
UFM1 is highly expressed in the pancreatic islets of Langerhans and has a role in the
development of type-2 diabetes. Another study showed possible involvement in the
development of ischemic heart disease. In this study chronic inflammation in mice led
to a strong up regulation of UFM1 in cardiomyocytes43. Since VWF:Ag levels also have
been associated with an increased risk of ischemic heart disease, this is an interesting
finding. However, UFM1 has not yet been linked to VWF directly yet and is a novel
association needing replication.
Four of the identified loci for low VWF:Ag levels (i.e. ABO, VWF, STXBP5, and
STAB2) have previously shown to be involved in the regulation of VWF:Ag levels in
general44. The other identified new genetic loci for continuous VWF:Ag levels (i.e.
SCARA5, STX2, TC2N, and CLEC4M) were not associated with low VWF levels.
UFM1 is a novel genetic locus associated with low VWF levels that was not associated
12
with the continuous VWF:Ag levels. Rs17057285:A>C, the SNP with the highest P-
value that marks this locus, has a very small minor allele frequency of about 0.5%.
Therefore this finding should be interpreted with care.
In today’s clinical practice it is hard to distinguish between physiologically low VWF
levels and VWF:Ag levels due to VWD, because both VWF levels and bleeding
symptoms are highly variable and occur frequently in the general population45. Until
recently, it was believed that low VWF:Ag levels and VWD are caused by variations in
the VWF gene only. However, now it has been shown that 35% of type 1 (partial
quantitative deficiency of VWF) VWD patients have no apparent VWF variations10,11.
This suggests that genetic variations in genes other than VWF may lead to low VWF:Ag
levels, also in patients diagnosed as having VWD 13. Indeed, our current findings
confirm this hypothesis that next to ABO blood group and VWF, other genetic loci are
involved in the occurrence of low VWF levels.
In the current study we have not included a replication cohort. Generally, it has been
recommended to include all cohorts in the discovery panel to maximize statistical
power, rather than use some of the cohorts for replication. In addition, the identified
genetic loci comprise extremely small p-values and were previously discovered in the
meta-analysis using VWF:Ag as a continuous measure. For these reasons it is very
unlikely that our findings are false-positive or came out by chance.
In conclusion, we identified five genetic loci that are associated with low VWF levels:
ABO, VWF, STXBP5, STAB2, and UFM1. Our findings confirm the hypothesis that
genes other than VWF lead to low VWF:Ag levels. Further research is warranted in
order to elucidate whether these genetic loci also contribute to the incidence of bleeding
symptoms and VWD.

13
Funding sources
The Atherosclerosis Risk in Communities Study is carried out as a collaborative study
supported by National Heart, Lung, and Blood Institute contracts
(HHSN268201100005C, HHSN268201100006C, HHSN268201100007C,
HHSN268201100008C, HHSN268201100009C, HHSN268201100010C,
HHSN268201100011C, and HHSN268201100012C), R01HL087641, R01HL59367
and R01HL086694; National Human Genome Research Institute contract
U01HG004402; and National Institutes of Health contract HHSN268200625226C.
Infrastructure was partly supported by Grant Number UL1RR025005, a component of
the National Institutes of Health and NIH Roadmap for Medical Research.
We acknowledge use of phenotype and genotype data from the B58C DNA collection,
funded by Medical Research Council grant G0000934 and the Wellcome Trust grant
068545/Z/02 (http://www.b58cgene.sgul.ac.uk/).
Genotyping of the Lothian Birth Cohorts 1921 and 1936 were supported by the UK’s
Biotechnology and Biological Sciences Research Council (BBSRC). Phenotype
collection in the Lothian Birth Cohort 1921 was supported by The Chief Scientist Office
of the Scottish Government (ETM/55). Phenotype collection in the Lothian Birth
Cohort 1936 was supported by Research Into Ageing (continues as part of Age UK’s
The Disconnected Mind project). The work was undertaken in The University of
Edinburgh Centre for Cognitive Ageing and Cognitive Epidemiology, part of the cross
council Lifelong Health and Wellbeing Initiative (G0700704/84698). Funding from the
UK’s BBSRC, EPSRC, ESRC and MRC is gratefully acknowledged.
PROSPER is supported by the Scottish Executive Chief Scientist Office, Health
Services Research Committee grant number CZG/4/306 an the Netherlands Genomics
Initiative/ Netherlands Organisation for Scientific Research (NGI/NOW 911-03-016).
14
The Rotterdam Study is supported by the Erasmus Medical Center and Erasmus
University Rotterdam; the Netherlands Organization for Scientific Research; the
Netherlands Organization for Health Research and Development (ZonMw); the
Research Institute for Diseases in the Elderly; the Netherlands Heart Foundation (DHF-
2007B159); the Ministry of Education, Culture and Science; the Ministry of Health
Welfare and Sports; the European Commission; and the Municipality of Rotterdam.
Support for genotyping was provided by the Netherlands Organization for Scientific
Research (NWO; 175.010.2005.011, 911.03.012) and Research Institute for Diseases in
the Elderly (RIDE). This study was further supported by the Netherlands Genomics
Initiative (NGI)/NWO project No. 050-060-810 and NWO/ZonMw grant No. 918-76-
619 and NWO/ZonMw grant No. 918-76-619. Dr Dehghan is supported by NWO grant
(veni, 916.12.154) and the EUR Fellowship
PREVEND genetics is supported by the Dutch Kidney Foundation (Grant E033), the
EU project grant GENECURE (FP-6 LSHM CT 2006 037697), the National Institutes
of Health (grant 2R01LM010098), The Netherlands organization for health research and
development (NWO-Groot grant 175.010.2007.006, NWO VENI grant 916.761.70,
ZonMw grant 90.700.441), and the Dutch Inter University Cardiology Institute
Netherlands (ICIN).
The VIS study in the Croatian island of Vis was supported through grants from the
Medical Research Council UK and Ministry of Science, Education and Sport of the
Republic of Croatia (No. 108-1080315-0302) and the European Union framework
program 6 EUROSPAN project (contract No. LSHG-CT-2006-018947). ORCADES
was supported by the Chief Scientist Office of the Scottish Government, the Royal
Society, and the European Union framework program 6 EUROSPAN project (contract
No. LSHG-CT-2006-018947). DNA extractions were performed at the Wellcome Trust

15
Clinical Research Facility in Edinburgh.
Disclosures
Dr Psaty serves on a DSMB for a clinical trial of a device funded by Zoll LifeCor. The
other authors report no conflicts.
References
1. Ruggeri ZM: Old concepts and new developments in the study of platelet
aggregation. The Journal of clinical investigation 2000; 105: 699-701.
2. Ruggeri ZM, Ware J: von Willebrand factor. Faseb J 1993; 7: 308-316.
3. Nichols WL, Hultin MB, James AH et al: von Willebrand disease (VWD):
evidence-based diagnosis and management guidelines, the National Heart, Lung,
and Blood Institute (NHLBI) Expert Panel report (USA). Haemophilia 2008; 14:
171-232.
4. Bladbjerg EM, de Maat MP, Christensen K, Bathum L, Jespersen J, Hjelmborg
J: Genetic influence on thrombotic risk markers in the elderly--a Danish twin
study. J Thromb Haemost 2006; 4: 599-607.
5. Martinelli I: von Willebrand factor and factor VIII as risk factors for arterial and
venous thrombosis. Semin Hematol 2005; 42: 49-55.
6. Koster T, Blann AD, Briet E, Vandenbroucke JP, Rosendaal FR: Role of
clotting factor VIII in effect of von Willebrand factor on occurrence of deep-
vein thrombosis. Lancet 1995; 345: 152-155.
7. Spiel AO, Gilbert JC, Jilma B: von Willebrand factor in cardiovascular disease:
focus on acute coronary syndromes. Circulation 2008; 117: 1449-1459.

16
8. Smith A, Patterson C, Yarnell J, Rumley A, Ben-Shlomo Y, Lowe G: Which
hemostatic markers add to the predictive value of conventional risk factors for
coronary heart disease and ischemic stroke? The Caerphilly Study. Circulation
2005; 112: 3080-3087.
9. Sadler JE, Budde U, Eikenboom JC et al: Update on the pathophysiology and
classification of von Willebrand disease: a report of the Subcommittee on von
Willebrand Factor. J Thromb Haemost 2006; 4: 2103-2114.
10. Goodeve A, Eikenboom J, Castaman G et al: Phenotype and genotype of a
cohort of families historically diagnosed with type 1 von Willebrand disease in
the European study, Molecular and Clinical Markers for the Diagnosis and
Management of Type 1 von Willebrand Disease (MCMDM-1VWD). Blood
2007; 109: 112-121.
11. James PD, Notley C, Hegadorn C et al: The mutational spectrum of type 1 von
Willebrand disease: Results from a Canadian cohort study. Blood 2007; 109:
145-154.
12. Sadler JE: Low von Willebrand factor: sometimes a risk factor and sometimes a
disease. Hematology Am Soc Hematol Educ Program 2009: 106-112.
13. Sanders YV, Van der Bom JG, Cnossen MH et al: Genetic variations determine
von Willebrand factor levels in patients with von Willebrand disease - from the
WiN study. J Thromb Haemost 2003; 11 Suppl. 2: Abstract OC 13.11.
14. Psaty BM, O'Donnell CJ, Gudnason V et al: Cohorts for Heart and Aging
Research in Genomic Epidemiology (CHARGE) Consortium: Design of
prospective meta-analyses of genome-wide association studies from 5 cohorts.
Circ Cardiovasc Genet 2009; 2: 73-80.
17
15. Hofman A, Breteler MM, van Duijn CM et al: The Rotterdam Study: objectives
and design update. Eur J Epidemiol 2007; 22: 819-829.
16. The Atherosclerosis Risk in Communities (ARIC) Study: design and objectives.
The ARIC investigators. Am J Epidemiol 1989; 129: 687-702.
17. Dawber TR, Meadors GF, Moore FE, Jr.: Epidemiological approaches to heart
disease: the Framingham Study. Am J Public Health Nations Health 1951; 41:
279-281.
18. Strachan DP, Rudnicka AR, Power C et al: Lifecourse influences on health
among British adults: effects of region of residence in childhood and adulthood.
Int J Epidemiol 2007; 36: 522-531.
19. McQuillan R, Leutenegger AL, Abdel-Rahman R et al: Runs of homozygosity
in European populations. American journal of human genetics 2008; 83: 359-
372.
20. Yang Q, Kathiresan S, Lin JP, Tofler GH, O'Donnell CJ: Genome-wide
association and linkage analyses of hemostatic factors and hematological
phenotypes in the Framingham Heart Study. BMC Med Genet 2007; 8 Suppl 1:
S12.
21. Houlihan LM, Davies G, Tenesa A et al: Common variants of large effect in
F12, KNG1, and HRG are associated with activated partial thromboplastin time.
American journal of human genetics 2010; 86: 626-631.
22. Rudan I, Campbell H, Rudan P: Genetic epidemiological studies of eastern
Adriatic Island isolates, Croatia: objective and strategies. Coll Antropol 1999;
23: 531-546.

18
23. Hillege HL, Fidler V, Diercks GF et al: Urinary albumin excretion predicts
cardiovascular and noncardiovascular mortality in general population.
Circulation 2002; 106: 1777-1782.
24. Trompet S, de Craen AJ, Postmus I et al: Replication of LDL GWAs hits in
PROSPER/PHASE as validation for future (pharmaco)genetic analyses. BMC
Med Genet 2011; 12: 131.
25. Shepherd J, Blauw GJ, Murphy MB et al: Pravastatin in elderly individuals at
risk of vascular disease (PROSPER): a randomised controlled trial. Lancet 2002;
360: 1623-1630.
26. Pare G, Chasman DI, Kellogg M et al: Novel association of ABO histo-blood
group antigen with soluble ICAM-1: results of a genome-wide association study
of 6,578 women. PLoS genetics 2008; 4: e1000118.
27. Clayton D: Testing for association on the X chromosome. Biostatistics 2008; 9:
593-600.
28. Marchini J, Howie B, Myers S, McVean G, Donnelly P: A new multipoint
method for genome-wide association studies by imputation of genotypes. Nature
genetics 2007; 39: 906-913.
29. Servin B, Stephens M: Imputation-based analysis of association studies:
candidate regions and quantitative traits. PLoS genetics 2007; 3: e114.
30. Li Y, Abecasis GR: Mack 1.0: rapid haplotype reconstruction and missng
genotype inference. . American journal of human genetics 2006: 2290.
31. Devlin B, Roeder K, Wasserman L: Genomic control, a new approach to
genetic-based association studies. Theor Popul Biol 2001; 60: 155-166.
19
32. Gallinaro L, Cattini MG, Sztukowska M et al: A shorter von Willebrand factor
survival in O blood group subjects explains how ABO determinants influence
plasma von Willebrand factor. Blood 2008; 111: 3540-3545.
33. Van Schie MC, Wieberdink RG, Koudstaal PJ et al: Genetic determinants of
von Willebrand factor plasma levels and the risk of stroke: the Rotterdam Study.
J Thromb Haemost 2012; 10: 550-556.
34. Desch KC, Ozel AB, Siemieniak D et al: Linkage analysis identifies a locus for
plasma von Willebrand factor undetected by genome-wide association.
Proceedings of the National Academy of Sciences of the United States of
America 2013; 110: 588-593.
35. van Schie MC, de Maat MP, Isaacs A et al: Variation in the von Willebrand
factor gene is associated with von Willebrand factor levels and with the risk for
cardiovascular disease. Blood 2011; 117: 1393-1399.
36. van Schie MC, van Loon JE, de Maat MP, Leebeek FW: Genetic determinants
of von Willebrand factor levels and activity in relation to the risk of
cardiovascular disease: a review. J Thromb Haemost 2011; 9: 899-908.
37. Campos M, Sun W, Yu F et al: Genetic determinants of plasma von Willebrand
factor antigen levels: a target gene SNP and haplotype analysis of ARIC cohort.
Blood 2011; 117: 5224-5230.
38. Lowenstein CJ, Morrell CN, Yamakuchi M: Regulation of Weibel-Palade body
exocytosis. Trends Cardiovasc Med 2005; 15: 302-308.
39. van Loon JE, Leebeek FW, Deckers JW et al: Effect of Genetic Variations in
Syntaxin-Binding Protein-5 and Syntaxin-2 on von Willebrand Factor
Concentration and Cardiovascular Risk. Circ Cardiovasc Genet 2010; 3: 507-
512.

20
40. Harris EN, Weigel PH: The ligand-binding profile of HARE: hyaluronan and
chondroitin sulfates A, C, and D bind to overlapping sites distinct from the sites
for heparin, acetylated low-density lipoprotein, dermatan sulfate, and CS-E.
Glycobiology 2008; 18: 638-648.
41. Komatsu M, Chiba T, Tatsumi K et al: A novel protein-conjugating system for
Ufm1, a ubiquitin-fold modifier. EMBO J 2004; 23: 1977-1986.
42. Daniel J, Liebau E: The ufm1 cascade. Cells 2014; 3: 627-638.
43. Azfer A, Niu J, Rogers LM, Adamski FM, Kolattukudy PE: Activation of
endoplasmic reticulum stress response during the development of ischemic heart
disease. American journal of physiology Heart and circulatory physiology 2006;
291: H1411-1420.
44. Smith NL, Chen MH, Dehghan A et al: Novel associations of multiple genetic
loci with plasma levels of factor VII, factor VIII, and von Willebrand factor: The
CHARGE (Cohorts for Heart and Aging Research in Genome Epidemiology)
Consortium. Circulation 2010; 121: 1382-1392.
45. van Loon JE, Sanders YV, de Wee EM, Kruip MJ, de Maat MP, Leebeek FW:
Effect of genetic variation in STXBP5 and STX2 on von Willebrand factor and
bleeding phenotype in type 1 von Willebrand disease patients. PLoS One 2012;
7: e40624.

Table 1. Genome-wide Significant Association of 5 Loci with low VWF levels
SNP
Most significant Region MAF P OR [95% CI]† Het I2 Het p-value Gene
rs8176704 hg18:g.13512373A>G 9q34 0.07 2.4 × 10-64 2.83 [2.52;3.18] 46.4 0.01 ABO (intronic)
rs216303 hg18:g.6029306T>C 12p13 0.09 5.3 × 10⁻²² 0.57 [0.51;0.64] -12.6 0.39 VWF (intronic)
rs1221638 hg18:g.147576998A>G 6q24 0.43 5.8 × 10⁻¹⁰ 1.28 [1.19;1.39] 0 0.85 STXBP5 (intronic)
rs4981022 hg18:g.102674004A>G 12q23 0.32 1.2 × 10-08 0.79 [0.73;0.85] -0.5 0.29 STAB2 (intronic)
rs17057285 hg18:g.37635821A>C 13q13 0.005 2.6 × 10-08 0.42 [0.30;0.56] 23.2 0.10 200 kb from UFM1
Abbreviations used in this table are: SNP for single nucleotide polymorphism, MAF for minor allele frequency, P for statistical significance
level, OR for odds ratio, and Het for heterogeneity. Reference sequence Hg 18 (NCBI build 36)
†Odds Ratio (OR) represents the risk of having VWF:Ag levels in the lowest 5% relative to the upper 95%.
1
Figure 1.

2
Figure 2.
STXBP5
ABO
VWF
STAB2
UFM1
3
Figure 3.
A.
B.
4
C.
D.

5
E.

1
Figure legends
Figure 1. Quantile-quantile plot of the observed and expected distribution of P values for all
~2.6 million SNPs and their association with low VWF levels based on meta-analyzed data.
Figure 2. −Log10 P values for each of the ~2.6 million tests performed as part of the GWA
analysis of low VWF levels. The grey dashed horizontal line marks the 5 × 10⁻⁸ P value
threshold of genome-wide significance.
Figure 3. Regional plots of top marker loci associated with low VWF levels. A through E:
The association P values (−log10 transformed, indicated by the left y axis) for SNPs in a 60-
kb region of each of the five loci (ABO, VWF, STXBP5, STX2, UFM1) are plotted against
their chromosome positions (NCBI build 3) on x axis. The top SNPs are presented as a large
diamond in red font and neighbouring variants are presented in different colors based on
linkage disequilibrium based on HapMap Caucasian data: red: 1 ≤ r2 > 0.8; orange: 0.8 ≥ r2 >
0.6; yellow: 0.6 ≥ r2 > 0.3; green: 0.3 ≥ r2 > 0.1; blue: 0.1 ≥ r2 > 0.05; light blue: 0.05 ≥ r2 >
0.0. The left y-axis is the p-value on the -log10 p-value scale and the gray line marks the
threshold of genome-wide significance (P = 5 ×10⁻⁸). Shown in light blue are the estimated
recombination rates in HapMap with values indicated by the right y axis. Regional genes and
their direction of transcription are depicted with green arrows