Sproul Hall Cooling Load Reduction for Radiant Ceiling Retrofit
Upload
roderick-baldric-allenCategory
view
217download
0
Valuing Load Reduction in Restructured Markets
Supply Cost Curve RegressionsMarket Price vs. Value of Load ReductionPhotovoltaic Case Study
William B. MarcusJBS Energy, Inc.311 D Street - West Sacramento, CA 95605 - (916) 372-0534

JBS Energy, Inc.
Research on California and Mid-Atlantic States (PJM Market)
Results presented at three conferences– Pace University Law School energy conference
11/10/00– Natl. Assn. of State Utility Consumer Advocates
(NASUCA) 11/15/00– Natl. Assn. of Energy Service Companies (NAESCO)
11/16/00 Sponsorship
– NAESCO and Pace Energy Project sponsored PJM research
– The Utility Reform Network (TURN – a California consumer group) sponsored California research

JBS Energy, Inc.
Competitive Market (In Theory)
In a Perfect Market: The commodity can be stored. There is perfect information on price. There are no transaction costs. There are competitive options.
JBS Energy, Inc.
The Market Reality
Electricity storage is very limited. Small customers receive no real price
signals.– Load profiles– Do not know price until after electricity is used.
Significant transaction costs, particularly for small customers, in seeking out competitive options.
Developing oligopoly creates market power through strategic bidding.

JBS Energy, Inc.
“Electricity is just another commodity,
like oxygen is just
another gas.”

JBS Energy, Inc.
Reducing Demand Empowers Customers
Two different ways to reduce demand Real-time customer response, based on
prices– Ultimately computer automated
Investments in:– Efficiency– Load Shifting– Distributed Generation behind the meter.

JBS Energy, Inc.
Load Reduction Reduces Prices for Everyone
When consumption is reduced the market price is reduced for everyone.
The Value of Load Reduction is greater than market price, once the price reduction is factored in.
It can be analyzed using a quantitative framework.

JBS Energy, Inc.
Old World versus New World
Price for last unit only set by last bid.
Marginal Cost incurred for last most expensive unit only.
Value of Load Reduction equal to last unit’s marginal cost.
Price for all units set by last bid in “Poolco” structure.
Value of Load Reduction is equal to bid price for last unit plus increase in bid price for all other units (except last unit).

JBS Energy, Inc.
Methodology
Create Cost Curves relating market price to load.
Calculate market price and value of load reduction as they vary by load level.
Further analysis based on time-of-use periods or time pattern of savings from specific conservation or distributed generation options– Photovoltaic case study analyzed here

JBS Energy, Inc.
Methodology – Cost Curve
Collect hourly market price and load data Create supply (cost) curve using
regression analysis. Multiple equations may be needed to fit
different portions of the curve. May obtain “family” of curves that vary
by month, day of week, time of day. Ancillary services can be analyzed in
same way (but only 2-8% of energy cost).

JBS Energy, Inc.
Mid-Atlantic States Supply Curves
0
50
100
150
200
250
300
350
15,000 20,000 25,000 30,000 35,000 40,000 45,000 50,000
System Load (MW)
Co
st (
$/M
Wh
)
Comparison of Supply Curves
0
10
20
30
40
50
60
70
80
90
100
Weekday, w inter and summer ($2.50 Gas)
Weekend w inter and summer ($2.50 Gas)
Weekday, March
Weekday April-May
Weekday Oct-Nov
Detail less than 45,000 MW
See Detail

JBS Energy, Inc.
California Supply Curve
Supply Curve PX Day Ahead + NP 15 Weekday Daytime Ancillary Services (Cost in cents/kWh of Total Load)
0
10
20
30
40
50
60
70
80
90
15000 20000 25000 30000 35000 40000 45000
ISO Day-Ahead Forecast Load (MW)
(cen
ts/k
Wh
)
Restructuring Base Case ($2.50 Gas)
High Base Case ($5 Gas)
2000 Summer Shift ($5 Gas)
2000 Summer Shift with Price Cap

JBS Energy, Inc.
Methodology – Value of Load Reduction
Price Supply
Demand
Reduced Demand
load (MW)
Reduced Prices are Value to Non-Participant Ratepayers
Reduced usage is Value to Participants

JBS Energy, Inc.
Methodology – Value of Load Reduction – In Words
Greater than Market Price– [(Market price at existing load X existing
load) – MINUS– (Market price at reduced load X reduced
load )]– DIVIDED BY– (existing load – reduced load)
Adjust for hedging

JBS Energy, Inc.
The Impact of Hedging on the Value of Load Reduction
Physical versus Contractual Hedging– Each has different Impacts on the Value of
Load Reduction – Physical hedging is based on generation sold
on a cost basis– Contractual Hedging is based on an
expectation of future market prices

JBS Energy, Inc.
The Impact of Hedging – continued
The difference between the Value of Load Reduction on Market Price is attenuated in the longer term.– Impacts the construction of new generation.– Impacts utility system operations through
unit commitments. Assume a portion of supply is not
exposed to pool price to consider these factors.

JBS Energy, Inc.
California Supply Curves – Value of Load Reduction
0
20
40
60
80
100
120
15000 20000 25000 30000 35000 40000 45000ISO Day-Ahead Forecast Load (MW)
Va
lue
of
Re
duct
ion
(ce
nts/
kWh)Value of 5% Load
Reduction
Market Price
PX Day-Ahead + NP 15 Weekday Daytime Ancillary Services, Market Price vs. Value of Demand Reduction , 40% physical hedge, 2000 Summer Shift Case, Capped
JBS Energy, Inc.
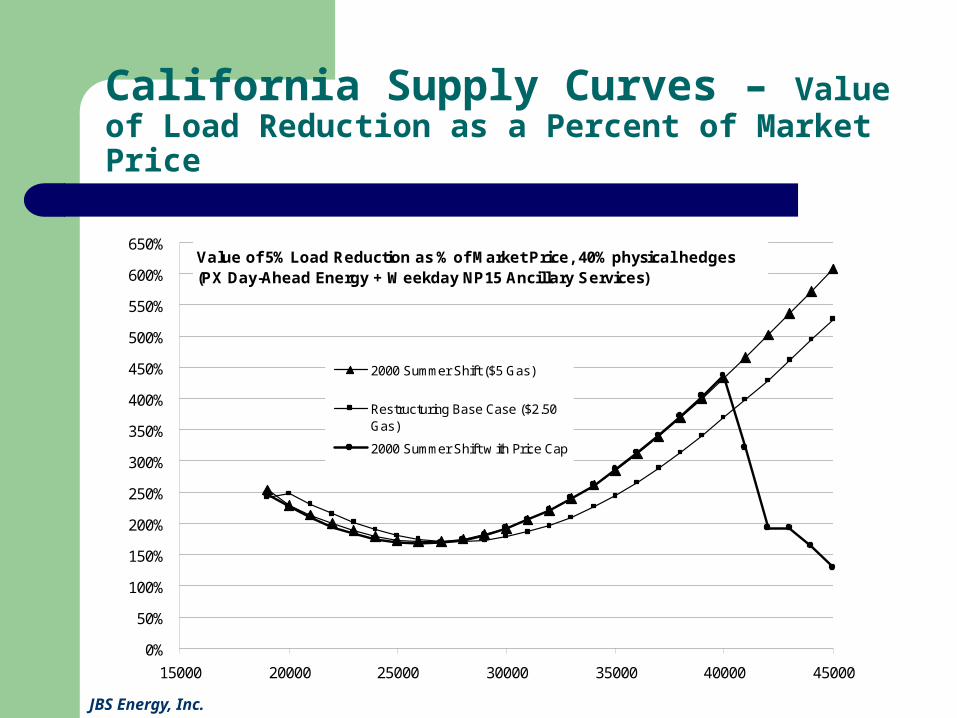
California Supply Curves – Value of Load Reduction as a Percent of Market Price
0%
50%
100%
150%
200%
250%
300%
350%
400%
450%
500%
550%
600%
650%
15000 20000 25000 30000 35000 40000 45000
2000 Summer Shift ($5 Gas)
Restructuring Base Case ($2.50Gas)
2000 Summer Shift w ith Price Cap
Value of 5% Load Reduction as % of Market Price, 40% physical hedges (PX Day-Ahead Energy + Weekday NP15 Ancillary Services)

JBS Energy, Inc.
PJM Value of Load Reduction – Hedged versus Unhedged
0
1000
2000
3000
4000
5000
6000
15,000 20,000 25,000 30,000 35,000 40,000 45,000 50,000
System Load (MW)
Co
st (
$/M
Wh
)
Value of Load Reduction: No Hedging versus 50% Hedged Weekday, Winter and Summer
0
50
100
150
200
250
300
350
400
450
500
No Hedge
50% Hedge
Market Price
Detail less than 45,000 MW
See Detail

JBS Energy, Inc.
PJM Relative Value of Load Reduction
0%
200%
400%
600%
800%
1000%
1200%
1400%
1600%
1800%
15,000 20,000 25,000 30,000 35,000 40,000 45,000 50,000
System Load (MW)
No Hedge
50% Hedge
Value of Load Reduction as Percentage of Market Price

JBS Energy, Inc.
Valuing Photovoltaics
Photovoltaic production data collected for two UPVG sites in Pennsylvania and California.
Hourly market price and value of load reduction applied to photovoltaic generation.
Weighted average of hourly generation calculated to value PV.

JBS Energy, Inc.
PV Characteristics Sacramento Airport, California 134 kW
PV Generation On-Peak Mid-Peak Off-Peak TotalSummer 42% 26% 32% 100%Winter 70% 30% 100%Annual 29% 40% 31% 100%
PV HoursSummer 17% 20% 62% 100%Winter 0% 38% 62% 100%Annual 10% 28% 62% 100%
PV Load Factor On-Peak Mid-Peak Off-Peak TotalSummer 55% 30% 12% 23%Winter 27% 7% 15%Annual 55% 28% 10% 19%

JBS Energy, Inc.
PV Characteristics – Plymouth Meeting, Pennsylvania Site
PV Generation On-Peak Mid-peak Off-Peak TotalSummer 35% 49% 16% 100%Winter 83% 17% 100%Annual 17% 67% 16% 100%
PV Load Factor On-Peak Mid-peak Off-Peak TotalSummer 38% 24% 7% 19%Winter 17% 4% 11%Annual 38% 19% 5% 14%

JBS Energy, Inc.
Value of Photovoltaics Annual - Sacramento Airport, California
$-
$50.00
$100.00
$150.00
$200.00
$250.00
$300.00
$350.00
$400.00
Average ofBaseload Market
Price ($/MWh)
Baseload ValueOf Load Reduction
Hedged ($/MWh)
PV MarketPrice
($/MWh)
PV Value of LoadReduction Hedged
($/MWh)
Off-Peak
Mid-peak
On-Peak
Grand Total
Market Price / Value of Load Reduction Comparison

JBS Energy, Inc.
Value of Load Reduction vs. Market Price Sacramento Airport Project
PV Market Price is 8.7 cents/kWh PV Value of Load Reduction is 20.2 cents/kWh
Data Off-Peak Mid-Peak On-Peak Grand Total
Average of Calculated Market Price ($/MWh) 52.28$ 76.76$ 124.17$ 66.39$
Value of Load Reduction Hedged ($/MWh) 99.03$ 151.21$ 350.60$ 139.07$
PV Revenue Calculated MP ($/MWh) 65.42$ 76.28$ 124.88$ 86.75$
PV Value of Load Reduction Hedged ($/MWh) 127.86$ 152.75$ 355.96$ 202.91$
Off-Peak Mid-Peak On-Peak Grand Total
Value of Load Reduction / Market Price 189% 197% 282% 209%
PV Value of Load Reduction / PV Revenue CMP 195% 200% 285% 234%
JBS Energy, Inc.
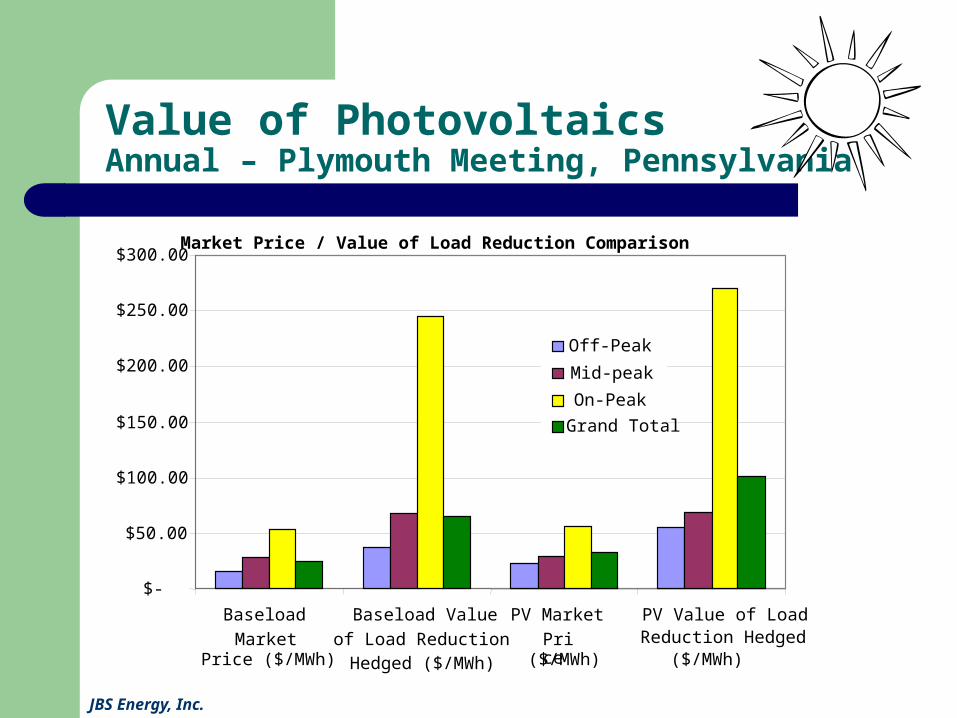
Value of Photovoltaics Annual – Plymouth Meeting, Pennsylvania
$-
$50.00
$100.00
$150.00
$200.00
$250.00
$300.00
Baseload
MarketPrice ($/MWh)
Baseload Value
of Load ReductionHedged ($/MWh)
PV Market
Price($/MWh)
PV Value of LoadReduction Hedged
($/MWh)
Off-Peak
Mid-peak
On-Peak
Grand Total
Market Price / Value of Load Reduction Comparison

JBS Energy, Inc.
Value of Load Reduction vs. Market Price Pennsylvania Project
Data Off-Peak Mid-peak On-Peak Grand Total
Average of Calculated Market Price ($/MWh) 15.93$ 28.22$ 52.76$ 24.28$
Value of Load Reduction Hedged ($/MWh) 36.81$ 68.15$ 245.12$ 65.11$
PV Revenue Calculated MP ($/MWh) 22.91$ 29.17$ 56.43$ 32.69$
PV Value of Load Reduction Hedged ($/MWh) 54.63$ 69.03$ 270.71$ 100.23$
Off-Peak Mid-peak On-Peak Grand Total
Value of Load Reduction / Market Price 231% 242% 465% 268%
PV Value of Load Reduction / PV Revenue CMP 238% 237% 480% 307%
• Market Price for PV Oct. ’99 to Sept ‘00 is 3.3 cents/kWh• PV Value of Load Reduction is 10 cents/kWh• Prices and Value of Load Reduction were much higher in 1999

JBS Energy, Inc.
Findings
Load Reduction Has Greater Value than Market Price– Twice (off-peak) to Five Times (peak)– Evident in both California and PJM
California Price Cap reduces differential
– This result is structural because of the upwardly sloping supply curve.

JBS Energy, Inc.
Conclusions
Don’t Be Afraid to Invest in Energy Efficiency, Load Shifting and Distributed Generation
Rate Increases from DSM Will Be Mitigated or Reversed by Reductions in Market Price
Peak Reduction Has Highest Value– Air conditioner programs and photovoltaics
High Fixed Charges in Rates Are Counter-Productive– Encourage Consumption and Raise Rates for Everyone
Net Metering for Photovoltaics Is Justified by Higher Value of Load Reduction