Valuing Ecosystem Services Trade-Offs in Sandy-Related ... · Valuing Ecosystem Services Trade-Offs...
21
Valuing Ecosystem Services Trade-Offs in Sandy-Related Restoration Work: Salt Marsh Restoration at Forsythe NWR Lou Nadeau, ERG (presenter) Co-authors: Pete Wiley (NOAA), Craig Landry (UGA), Mauricio Rodríguez-Gómez (UGA) Social Coast 2016 February 10, 2016
Transcript of Valuing Ecosystem Services Trade-Offs in Sandy-Related ... · Valuing Ecosystem Services Trade-Offs...

Valuing Ecosystem Services Trade-Offs in Sandy-Related Restoration Work:
Salt Marsh Restoration at Forsythe NWR
Lou Nadeau, ERG (presenter) Co-authors: Pete Wiley (NOAA), Craig Landry (UGA), Mauricio
Rodríguez-Gómez (UGA) Social Coast 2016 February 10, 2016
Overview of presentation
Overview of the overall project
Forsythe NWR
Method for valuing trade-offs
Results
Implications 2

Project scope
Estimate values of ecosystem services that can be used in guiding post-Sandy restoration decisions – Look at trade-offs between ecosystem services in
restoration decisions – But, funds need to go into restoration ASAP
Focus on New York and New Jersey area Take into account transferability Result: 4 project components that focused on
methods/results that could be applied to future restoration decisions
3
Study questions
What’s the value of salt marsh ecosystem services?
What are the trade-offs between the different ecosystem services in terms of value?
How is this useful for policy?
4

Forsythe National Wildlife Refuge
Managed by US FWS 50 miles along the NJ
coast Major stop-over for
migratory birds More then 37K acres
– 78% is a salt marsh Significant damage
from Sandy
5
Forsythe NWR

Forsythe Restoration
Forsythe NWR restoring 3,000 acres of salt marsh – Thin layer placement – Tidal flow restoration – More than just repairing damage from Sandy
Looking at four ecosystem services
– Protection from surge – Protection from non-surge flooding – Habitat – Recreation
6

Method: Stated Preference
Contingent valuation – Describe a project/scenario and ask people whether
they are willing to pay a certain amount or not – Vary the cost, but not the project/scenario parameters
Choice experiment
– Let’s make this more complicated! – Vary the cost AND vary the project parameters – Assess trade-offs
7

Choice experiment survey
Respondents are asked to choose between two options and a status quo (choice set) – Each option has attributes (ecosystem services +
number of acres being restored) – Each option has a “level” for each attribute and a cost
Combinations of levels are selected using fractional factorial design – Used 27 total choice sets
Each respondent was asked three valuation questions
8
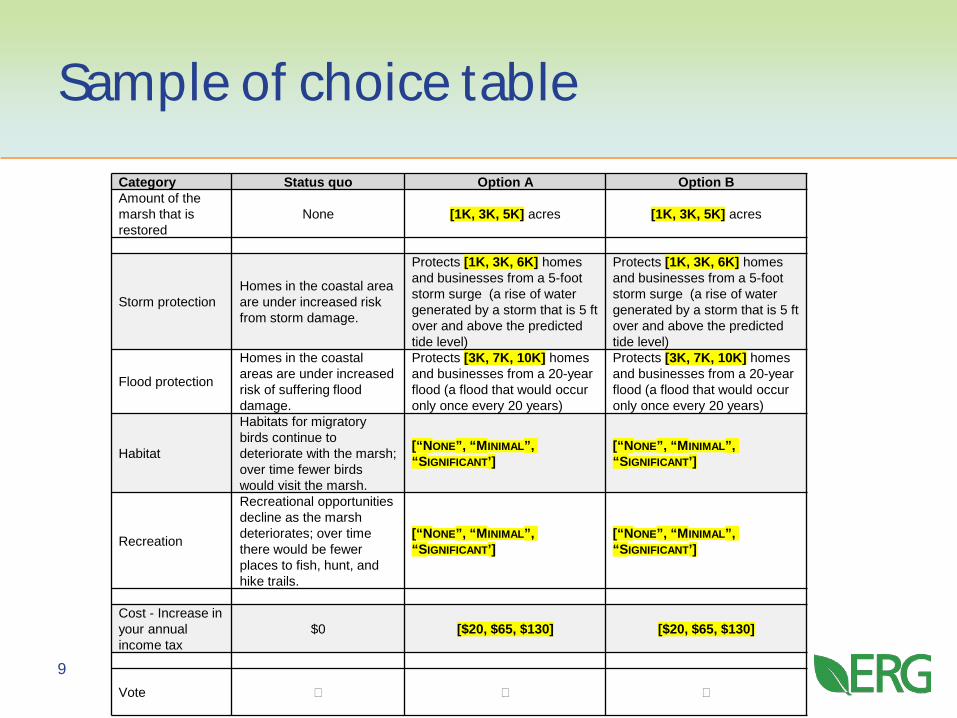
Sample of choice table
9
Category Status quo Option A Option B Amount of the marsh that is restored
None [1K, 3K, 5K] acres [1K, 3K, 5K] acres
Storm protection Homes in the coastal area are under increased risk from storm damage.
Protects [1K, 3K, 6K] homes and businesses from a 5-foot storm surge (a rise of water generated by a storm that is 5 ft over and above the predicted tide level)
Protects [1K, 3K, 6K] homes and businesses from a 5-foot storm surge (a rise of water generated by a storm that is 5 ft over and above the predicted tide level)
Flood protection
Homes in the coastal areas are under increased risk of suffering flood damage.
Protects [3K, 7K, 10K] homes and businesses from a 20-year flood (a flood that would occur only once every 20 years)
Protects [3K, 7K, 10K] homes and businesses from a 20-year flood (a flood that would occur only once every 20 years)
Habitat
Habitats for migratory birds continue to deteriorate with the marsh; over time fewer birds would visit the marsh.
[“NONE”, “MINIMAL”, “SIGNIFICANT’]
[“NONE”, “MINIMAL”, “SIGNIFICANT’]
Recreation
Recreational opportunities decline as the marsh deteriorates; over time there would be fewer places to fish, hunt, and hike trails.
[“NONE”, “MINIMAL”, “SIGNIFICANT’]
[“NONE”, “MINIMAL”, “SIGNIFICANT’]
Cost - Increase in your annual income tax
$0 [$20, $65, $130] [$20, $65, $130]
Vote � � �

Habitat descriptions
None: “Provides no improvement - Habitats for migratory birds continue to deteriorate with the marsh; over time fewer birds would visit the marsh.”
Minimal: “Provides minimal improvements in habitat for migratory birds – marsh restoration leads to a small increase in the number of birds that visit the marsh each year.”
Significant: “Provides significant improvements in habitat for migratory birds – marsh restoration leads to a large and noticeable increase in the number and variety of birds that visit the marsh each year.”
10
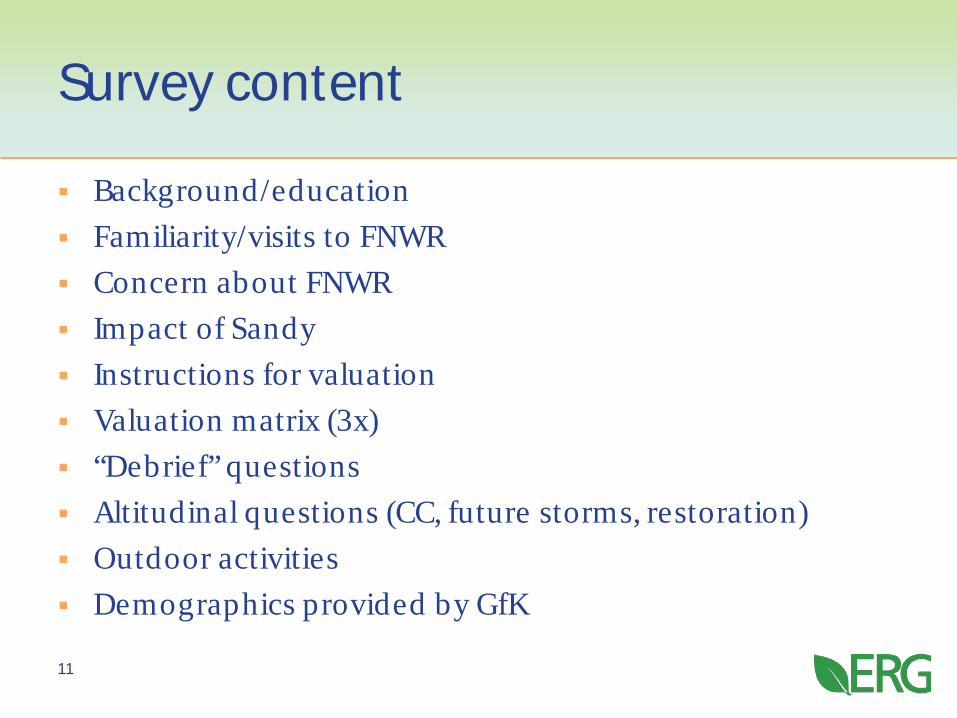
Survey content
Background/education Familiarity/visits to FNWR Concern about FNWR Impact of Sandy Instructions for valuation Valuation matrix (3x) “Debrief” questions Altitudinal questions (CC, future storms, restoration) Outdoor activities Demographics provided by GfK
11

Implementation: GfK Knowledge Network Panel
GfK recruits people to take online surveys – Recruited from non-
online sources Representative set of
households for the US population – Based on demographics
12

Forsythe survey implementation
Pre-tested in late winter/early Spring by ERG and then again by GfK
Full implementation: mid-August 2015 – 541 total responses
Sample was
– Older, better educated, and less representative of minority populations
– Matched well on gender, income, and employment
13

14
Importance of Salt Marsh Ecosystem Services to Respondents
2.41
1.80
2.93
2.80
2.93
2.79
2.80

Concern about Forsythe Salt Marshes
15

Selection on Valuation Questions
16

Willingness to pay (WTP)
Ecosystem service Incremental change Est imated WTP
Habitat provision None to minimal improvements $62.23 None to significant improvements $100.20 Minimal to significant $37.98
Recreation None to minimal improvements $38.40 None to significant improvements $52.21 Minimal to significant #13.81
Protecting homes from surge 5,000 homes $14.30
Protecting homes from flooding 5,000 home $14.30
17

Trade-offs (examples)
Households (HHs) value a significant improvement in habitat twice as much as a significant improvement in recreation – $100.20 vs. $52.21
Minimal improvements in habitat are more valuable to HHs than significant improvements in recreation – $62.23 vs. $52.21
A significant improvement in recreation is the “equivalent” to protecting 18,255 homes – ($52.21/$14.03) x 5,000
Protecting a home from surge has equal value to protecting the home from flooding.
18
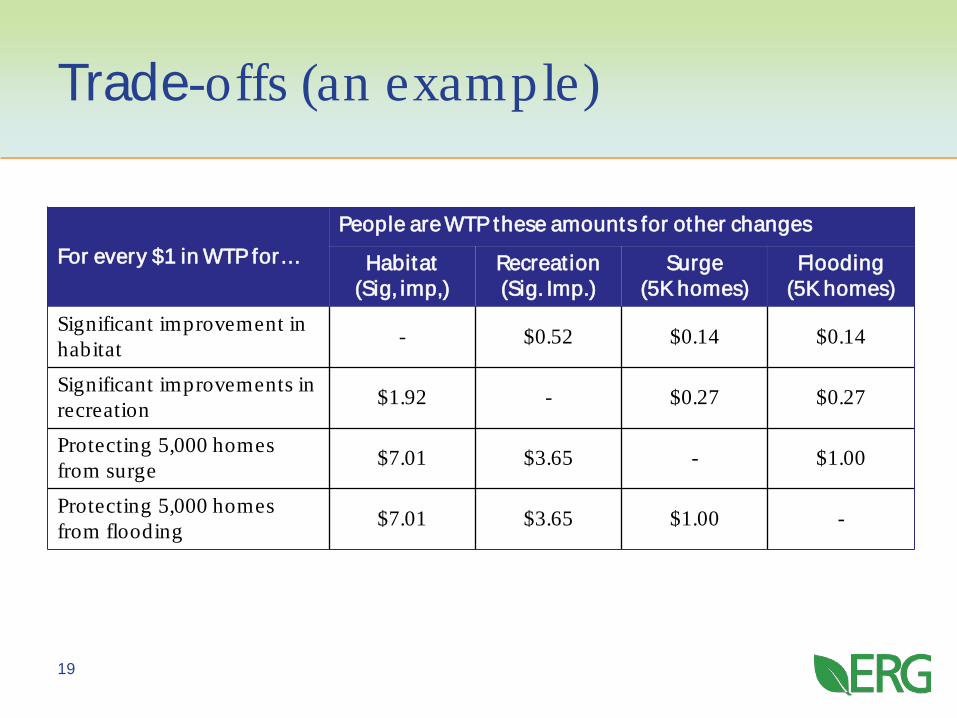
Trade-offs (an example)
19
For every $1 in WTP for… People are WTP these amounts for other changes
Habitat (Sig, imp,)
Recreat ion (Sig. Imp.)
Surge (5K homes)
Flooding (5K homes)
Significant improvement in habitat - $0.52 $0.14 $0.14
Significant improvements in recreation $1.92 - $0.27 $0.27
Protecting 5,000 homes from surge $7.01 $3.65 - $1.00
Protecting 5,000 homes from flooding $7.01 $3.65 $1.00 -

Summary
Choice experiments offers a wealth of information for decision-makers – Can be used to assist decision-makers in valuing trade-
offs No difference between surge and non-surge
flooding – Respondents value each type of protection the same
Recreation’s low value could be related to the study site/sample
20

Contact information
Lou Nadeau, Eastern Research Group, Inc. (ERG), [email protected]; 781-674-7316 Pete Wiley, NOAA Office for Coastal Management, [email protected]; 301-563-1141
21