Naod mekonnen : Agriculture and rural transport in Ethiopia panel study (2)

Value of Water Research Report Series No. 56
Value of Water
A.E. Ercin
M.M. Mekonnen
A.Y. Hoekstra
March 2012
The water footprint
of France

THE WATER FOOTPRINT OF FRANCE
A.E. ERCIN1
M.M. MEKONNEN1
A.Y. HOEKSTRA1
MARCH 2012
VALUE OF WATER RESEARCH REPORT SERIES NO. 56
1 Twente Water Centre, University of Twente, Enschede, the Netherlands;
corresponding author: Arjen Hoekstra, e-mail [email protected]
© 2012 A.E. Ercin, M.M. Mekonnen and A.Y. Hoekstra
Published by:
UNESCO-IHE Institute for Water Education
P.O. Box 3015
2601 DA Delft
The Netherlands
The Value of Water Research Report Series is published by UNESCO-IHE Institute for Water Education, in
collaboration with University of Twente, Enschede, and Delft University of Technology, Delft.
All rights reserved. No part of this publication may be reproduced, stored in a retrieval system, or transmitted, in
any form or by any means, electronic, mechanical, photocopying, recording or otherwise, without the prior
permission of the authors. Printing the electronic version for personal use is allowed.
Please cite this publication as follows:
Ercin, A.E., Mekonnen, M.M and Hoekstra, A.Y. (2012) The water footprint of France, Value of Water
Research Report Series No. 56, UNESCO-IHE, Delft, the Netherlands.
Acknowledgements
This research has been commissioned and funded by WWF-France. We like to thank Thierry Thouvenot and
Cyrille Deshayes from WWF-France for their collaboration and critical comments on a draft of this report.

Contents
Summary................................................................................................................................................................. 5
1. Introduction ........................................................................................................................................................ 7
2. Method and data ................................................................................................................................................. 9
2.1 Water footprint accounting .......................................................................................................................... 9
2.2 Identifying priority basins and products .................................................................................................... 10
3. Results .............................................................................................................................................................. 13
3.1 Water footprint of production .................................................................................................................... 13
3.2 Virtual water flows .................................................................................................................................... 20
3.3 Water footprint of consumption ................................................................................................................. 24
4. Priority basins and products .............................................................................................................................. 31
4.1 Water footprint of production .................................................................................................................... 31
4.2 Water footprint of consumption ................................................................................................................. 33
5. Discussion and conclusion ................................................................................................................................ 39
References ............................................................................................................................................................ 41
Appendix I: Water footprint related to agricultural and industrial production and domestic water supply at sub-
national level (Mm3/year) ............................................................................................................................... 45
Appendix II: Water footprint of crop production in France (Mm3/year) .............................................................. 46
Appendix III: Water footprint of French consumption per agricultural product (Mm3/year) ............................... 48
Appendix IV: Water footprint of French consumers in major river basins experiencing moderate to severe water
scarcity during part of the year........................................................................................................................ 49

Summary
In recent years, it has become increasingly evident that local water depletion and pollution are often closely tied
to the structure of the global economy. It has been estimated that twenty per cent of the water consumption and
pollution in the world relates to the production of export goods. International trade in commodities implies long-
distance transfers of water in virtual form, where virtual water is understood as the volume of water that has
been used to produce a commodity and that is thus virtually embedded in it. Knowledge about the virtual-water
flows entering and leaving a country can cast a new light on the meaning of water scarcity for a country. For
developing a wise national water policy, it is relevant to consider the linkages between consumed goods in a
country and impacts on freshwater systems where the goods are produced.
The objective of this study is to carry out a water footprint assessment for France from both a production and
consumption perspective. The aim of the assessment from the production perspective is to identify and analyse
how French water resources are allocated over various purposes, and to examine where the water footprint of
French production violates local environmental flow requirements and ambient water quality standards.
Additionally, the aim is to understand how the water resources of France are allocated for making products for
export. The assessment from the consumption perspective focuses on the external water footprint of French
consumption, so that we obtain a complete picture of how national consumption translates to water use, not only
in France, but also abroad, and understand the water dependency of French consumption and the sustainability
of imports. We use monthly blue water scarcity values on river basin level for the identification of river basins
where the contribution of the water footprint of France can be critical. Per water-scarce river basin, we identify
how different commodities contribute to the blue water scarcity in the basin.
The total water footprint of production in France is 90 billion m3/year in the period 1996-2005. Crops have the
largest share (82%) in this footprint, followed by industrial activities (8%), grazing (6%), domestic water supply
(3%) and livestock production (1%). The blue water footprint of production in France is dominated by maize
production. Other crops with a significant share in the blue water footprint are fodder crops (6%), potato (4%),
soybean (3%), rice (3%), and apples (2%). The basins of the Loire, Seine, Garonne, and Escaut have been
identified as priority basins regarding the blue water footprint of French production. Maize and industrial
production are the dominant factors for the blue water scarcity in these river basins.
The total water footprint of consumption of France is 106 billion m3/year, which is 1786 m3/year per citizen. Per
capita, the water footprint of French consumption is about 30% more than the world average. The consumption
of agricultural products gives by far the largest contribution (87%) to the total consumer water footprint.
Consumption of industrial products and domestic water use contribute 10% and 3% respectively. With a
contribution of 34%, meat consumption is the largest contributor to the total water footprint. The internal water
footprint of France constitutes 53% of its total water footprint and is mainly because of consumption of
agricultural products (46%), followed by industrial products (4%) and domestic water supply (3%).
About 47% of the water footprint of French consumption is external, that is outside France, mostly related to
imported agricultural products for domestic consumption (41%) and for a smaller fraction related to imported
industrial products (6%). Cotton, sugar cane and rice are the three major crops with the largest share in France’s
external blue water footprint of consumption and identified as critical products in a number of severely water-
scarce river basins. The basins of the Aral Sea and the Indus, Ganges, Guadalquivir, Guadiana, Tigris &
Euphrates, Ebro, Mississippi and Murray rivers are some of the basins that have been identified as priority
basins regarding the external blue water footprint of French consumption.
The study shows that analysis of the external water footprint of a nation is necessary to get a complete picture of
the relation between national consumption and the use of water resources. It provides understanding of how
national consumption impacts on water resources elsewhere in the world.

1. Introduction
Water plays a key role in life on our planet. It is essential not only for direct uses such as for the provision of
drinking water, growing food and the production of energy and other products, but also for ensuring the integrity
of ecosystems and the goods and services they provide to humans. Freshwater is a renewable resource; however,
its annual availability is limited. Annual freshwater use in many places exceeds the limit of the water available,
which has resulted in river flows that are below environmental flow requirements, declining groundwater levels
and pollution of water bodies.
In recent years, it has become increasingly evident that local water depletion and pollution are often closely tied
to the structure of the global economy (Hoekstra and Chapagain, 2007). It has been estimated that about twenty
per cent of the water consumption and pollution in the world relates to the production of export goods (Hoekstra
and Mekonnen, 2012). International trade in commodities implies long-distance transfers of water in virtual
form, where virtual water is understood as the volume of water that has been used to produce a commodity and
that is thus virtually embedded in it (Chapagain and Hoekstra, 2008). Knowledge about the virtual-water flows
entering and leaving a country can cast a new light on the actual water scarcity of a country. For developing a
wise national water policy, it is also relevant to consider the linkages between consumed goods in a country and
impacts on freshwater systems where the goods are produced.
The water footprint is an indicator of freshwater use that looks not only at direct water use of a consumer or
producer, but also at the indirect water use. The water footprint can be regarded as a comprehensive indicator of
freshwater resources appropriation, next to the traditional and restricted measure of water withdrawal. It is a
multi-dimensional indicator, showing water consumption volumes by source and polluted volumes by type of
pollution; all components of a total water footprint are specified geographically and temporally (Hoekstra et al.,
2011).
The objective of this study is to carry out a water footprint assessment for France from both a production and
consumption perspective. The aim of the assessment from the production perspective is to identify and analyse
how French water resources are allocated over various purposes, and examine where the water footprint of
production within France violates local environmental flow requirements and ambient water quality standards.
Additionally, the aim is to quantify which volumes of French water resources are allocated for making products
for export and to assess the impact related to this water footprint for export. The assessment from the
consumption perspective focuses on the analysis of the external water footprint of French consumption, to get a
complete picture of how national consumption translates to water use, not only in France, but also abroad, and to
assess French dependency on external water resources and the sustainability of imports.
The study starts with a quantification and mapping of the water footprint of the agricultural and industrial
sectors and of domestic water supply within France. Next, virtual water imports into France and virtual water
exports leaving France are quantified, by traded commodity. Subsequently, the internal and external water
footprint of French consumption is analysed. Finally, it has been analysed which components of the French blue
8 / The water footprint of France
water footprints of production and consumption contribute to blue water scarcity in specific river basins and
which products are responsible herein.
There are several similar water footprint studies in the literature with a focus on a specific country. Studies have
been carried out, for example, for Belgium (Vincent et al., 2011), China (Hubacek et al., 2009; Ma et al., 2006;
Zhao et al., 2009), Germany (Sonnenberg et al., 2009), India (Kampman et al., 2008), Indonesia (Bulsink et al.,
2010), the Netherlands (Van Oel et al., 2009), Spain (Garrido et al., 2010); and the UK (Chapagain and Orr,
2008). These studies mainly focussed on the quantification of the water footprints, were not based on a high-
resolution spatial analysis and excluded an assessment of the sustainability of the water footprint. Impacts of
water footprints on a national scale are partially addressed in Van Oel et al. (2009) for the Netherlands,
Kampman et al. (2008) for India and Chapagain and Orr (2009) for Spanish tomatoes. However, these studies
lack spatial detail as will employed in the current study, which will incorporate data on monthly blue water
scarcity at the level of river basins to assess how blue water footprints of production and consumption contribute
to water scarcity at river basin level.
From a methodological point of view, this study improves upon the previous country-specific water footprint
studies in three ways, following the global study by Mekonnen and Hoekstra (2011b). First, the water footprints
of production and consumption are mapped at a high level of spatial detail. Second, the analysis explicitly
includes green, blue and grey water footprints. Finally, we make a substantial step beyond quantifying and
mapping the country’s water footprint of production and consumption by analysing how different components in
the water footprint may contribute to blue water scarcity in different river basins and identifying which products
are behind those contributions.
2. Method and data
2.1 Water footprint accounting
This study follows the methodology and terminology of water footprint assessment as described in the Water
Footprint Assessment Manual (Hoekstra et al., 2011). The water footprint is an indicator of water use that looks
at both direct and indirect water use of a consumer or producer. The water footprint of an individual or
community is defined as the total volume of freshwater that is used to produce the goods and services consumed
by the individual or community. Water use is measured in terms of water volumes consumed (evaporated or
incorporated into the product) and polluted per unit of time. A water footprint has three components: green, blue
and grey. The blue water footprint refers to consumption of blue water resources (surface and ground water).
The green water footprint is the volume of green water (rainwater) consumed, which is particularly relevant in
crop production. The grey water footprint is an indicator of the degree of freshwater pollution and is defined as
the volume of freshwater that is required to assimilate the load of pollutants based on existing ambient water
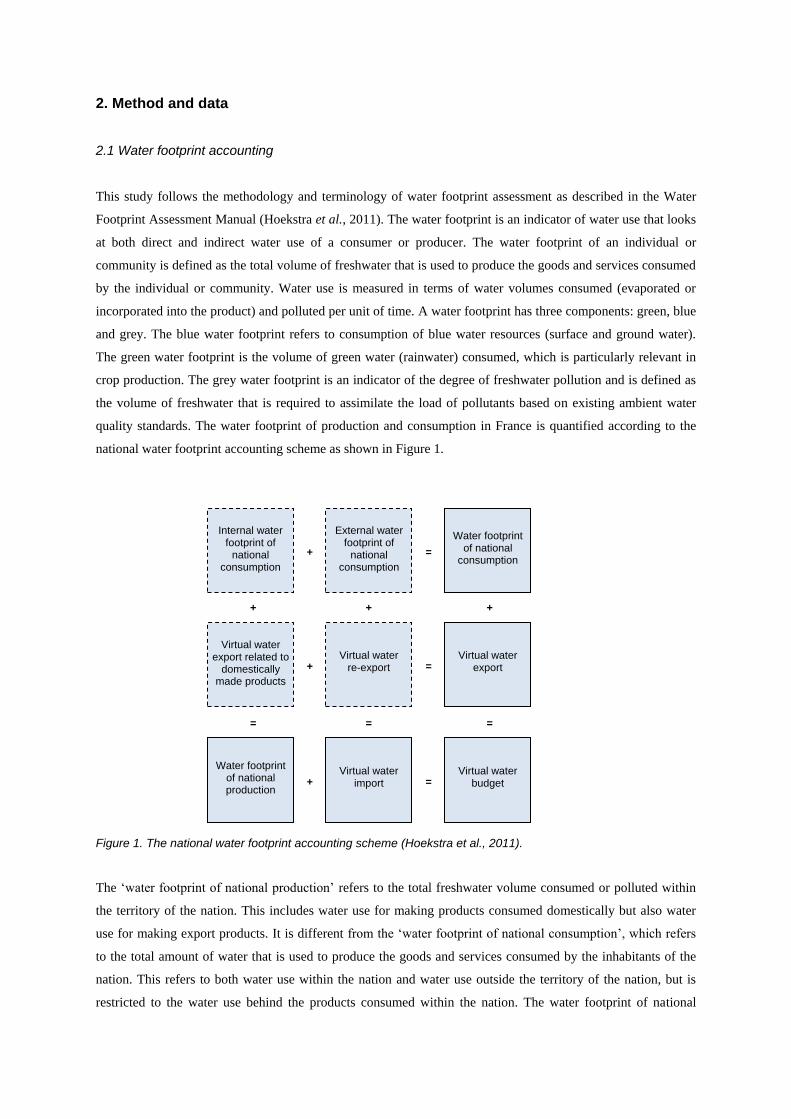
quality standards. The water footprint of production and consumption in France is quantified according to the
national water footprint accounting scheme as shown in Figure 1.
Figure 1. The national water footprint accounting scheme (Hoekstra et al., 2011).
The ‘water footprint of national production’ refers to the total freshwater volume consumed or polluted within
the territory of the nation. This includes water use for making products consumed domestically but also water
use for making export products. It is different from the ‘water footprint of national consumption’, which refers
to the total amount of water that is used to produce the goods and services consumed by the inhabitants of the
nation. This refers to both water use within the nation and water use outside the territory of the nation, but is
restricted to the water use behind the products consumed within the nation. The water footprint of national
Internal water footprint of
national consumption
External water footprint of
national consumption
+
Water footprint of national
consumption =
Virtual water export related to
domestically made products
Virtual water re-export +
Virtual water export =
+ + +
Water footprint of national production
Virtual water import +
Virtual water budget =
= = =
10 / The water footprint of France
consumption thus includes an internal and external component. The internal water footprint of national
consumption is defined as the use of domestic water resources to produce goods and services consumed by the
national population. It is the sum of the water footprint within the nation minus the volume of virtual-water
export to other nations insofar as related to the export of products produced with domestic water resources. The
external water footprint of national consumption is defined as the volume of water resources used in other
nations to produce goods and services consumed by the population in the nation considered. It is equal to the
virtual-water import into the nation minus the volume of virtual-water export to other nations because of re-
export of imported products.
The water footprint of crops and derived crop products produced in France or elsewhere were obtained from
Mekonnen and Hoekstra (2010a, 2011a), who estimated the global water footprint of crop production with a
crop water use model at a 5 by 5 arc minute spatial resolution. The water footprint of animal products that are
produced in France were taken from Mekonnen and Hoekstra (2010b, 2012). The data related to the water
footprint of production and consumption in France and the virtual water flows to and from France were taken
from Mekonnen and Hoekstra (2011b). In all cases, data refer to the period 1996-2005.
2.2 Identifying priority basins and products
For the blue water footprint of French production and consumption, some additional analysis was carried out in
order to identify river basins of concern. After we quantified and mapped the blue water footprints of French
production and consumption, we estimated which parts of both water footprints are situated in river basins with
moderate to severe water scarcity during part of the year. Monthly blue water scarcity values for the major river
basins around the world were taken from a recent global water scarcity study (Hoekstra and Mekonnen, 2011;
Hoekstra et al., 2012). The blue water scarcity values in that study were calculated by taking the aggregated blue
water footprint per basin and per month over the blue water availability in that basin and month. The latter was
taken as natural runoff in the basin minus a presumptive standard for the environmental flow requirement in the
basin. They classified blue water scarcity values into four levels:
low blue water scarcity (<100%): the blue water footprint is lower than 20% of natural runoff and does not
exceed blue water availability; river runoff is unmodified or slightly modified; environmental flow
requirements are not violated.
moderate blue water scarcity (100-150%): the blue water footprint is between 20 and 30% of natural runoff;
runoff is moderately modified; environmental flow requirements are not met.
significant blue water scarcity (150-200%): the blue water footprint is between 30 and 40% of natural
runoff; runoff is significantly modified; environmental flow requirements are not met.
severe water scarcity (>200%): the monthly blue water footprint exceeds 40% of natural runoff, so runoff is
seriously modified; environmental flow requirements are not met.
The following three criteria have been used to identify priority basins regarding the various components of the
blue water footprint of French production or consumption: level of water scarcity over the year in the basin
The water footprint of France / 11
where the water footprint component is located, the size of the blue water footprint of French production or
consumption located in the basin (agricultural and industrial products separately), and the significance of the
contribution of a specific product to the total blue water footprint in the basin in the scarce month.
A specific river basin is identified as a ‘priority basin’ related to France's water footprint of production or
consumption of agricultural products if three conditions are fulfilled: (a) the river basin experiences moderate,
significant or severe water scarcity in any specified period of the year; (b) the French blue water footprint of
production or consumption of agricultural products located in that basin is at least 1% of total blue water
footprint of production or consumption of agricultural products; and (c) the contribution of any specific
agricultural commodity to the total blue water footprint in that specific basin in the period of scarcity is
significant (more than 5%). In addition, a river basin is also identified as a priority basin if the following two
conditions are met: (a) the water scarcity in the river basin is severe during part of the year; and (b) the
contribution of any specific agricultural commodity produced or consumed in France to the total blue water
footprint in that specific basin in the period of scarcity is very significant (more than 20%).
A river basin is identified as a priority basin related to France's water footprint of production or consumption of
industrial products if three conditions are fulfilled: (a) the river basin experiences moderate, significant or
severe water scarcity in any specified period of the year; (b) the French blue water footprint of production or
consumption of industrial products located in that specific basin is at least 1% of the total water footprint of
production or consumption of industrial products; and (c) the contribution of industrial activities to the total blue
water footprint in that specific basin in the period of scarcity is significant (more than 5%). In addition, a river
basin is also identified as a priority basin if the following two conditions are met: (a) the water scarcity in the
river basin is severe during part of the year; and (b) the contribution of industrial activities to the total blue water
footprint in that specific basin in the period of scarcity is very significant (more than 20%).
In addition to the quantitative analysis to identify priority basins and products regarding the blue water footprint
of French production and consumption, we assessed the impacts of the grey water footprint of French
production and consumption on a qualitative basis.

3. Results
3.1 Water footprint of production
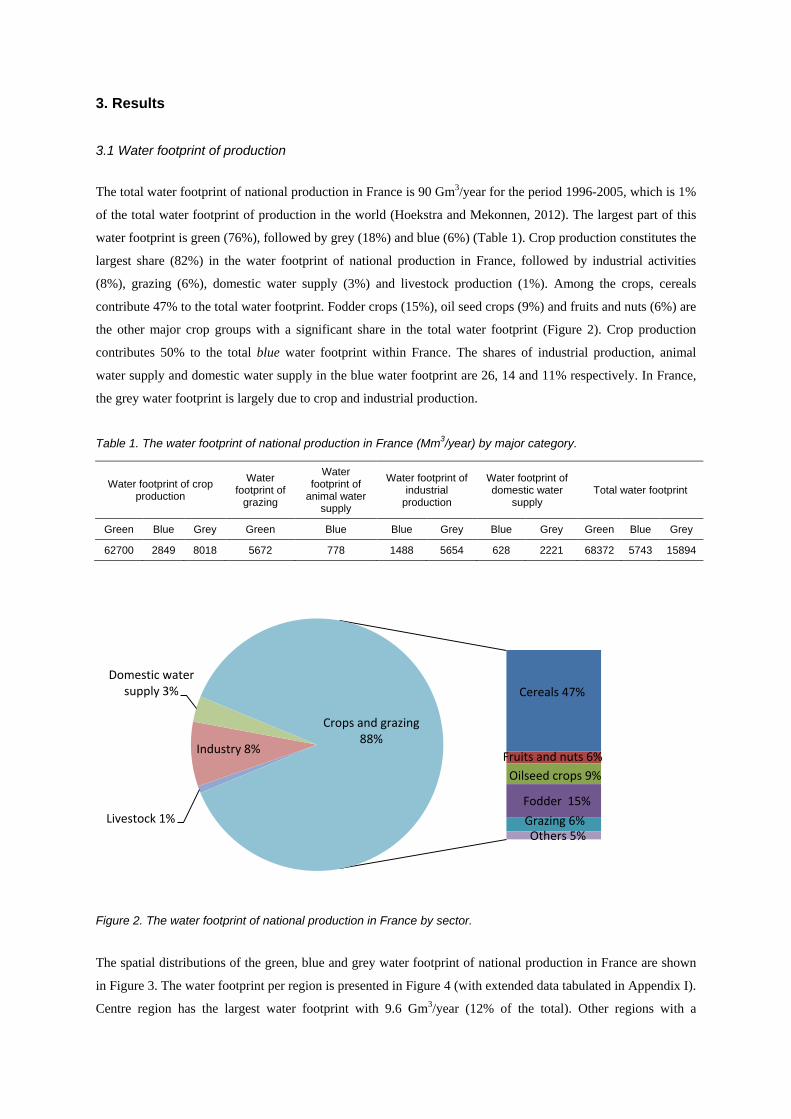
The total water footprint of national production in France is 90 Gm3/year for the period 1996-2005, which is 1%
of the total water footprint of production in the world (Hoekstra and Mekonnen, 2012). The largest part of this
water footprint is green (76%), followed by grey (18%) and blue (6%) (Table 1). Crop production constitutes the
largest share (82%) in the water footprint of national production in France, followed by industrial activities
(8%), grazing (6%), domestic water supply (3%) and livestock production (1%). Among the crops, cereals
contribute 47% to the total water footprint. Fodder crops (15%), oil seed crops (9%) and fruits and nuts (6%) are
the other major crop groups with a significant share in the total water footprint (Figure 2). Crop production
contributes 50% to the total blue water footprint within France. The shares of industrial production, animal
water supply and domestic water supply in the blue water footprint are 26, 14 and 11% respectively. In France,
the grey water footprint is largely due to crop and industrial production.
Table 1. The water footprint of national production in France (Mm3/year) by major category.
Water footprint of crop production
Water footprint of
grazing
Water footprint of
animal water supply
Water footprint of industrial
production
Water footprint of domestic water
supply Total water footprint
Green Blue Grey Green Blue Blue Grey Blue Grey Green Blue Grey
62700 2849 8018 5672 778 1488 5654 628 2221 68372 5743 15894
Figure 2. The water footprint of national production in France by sector.
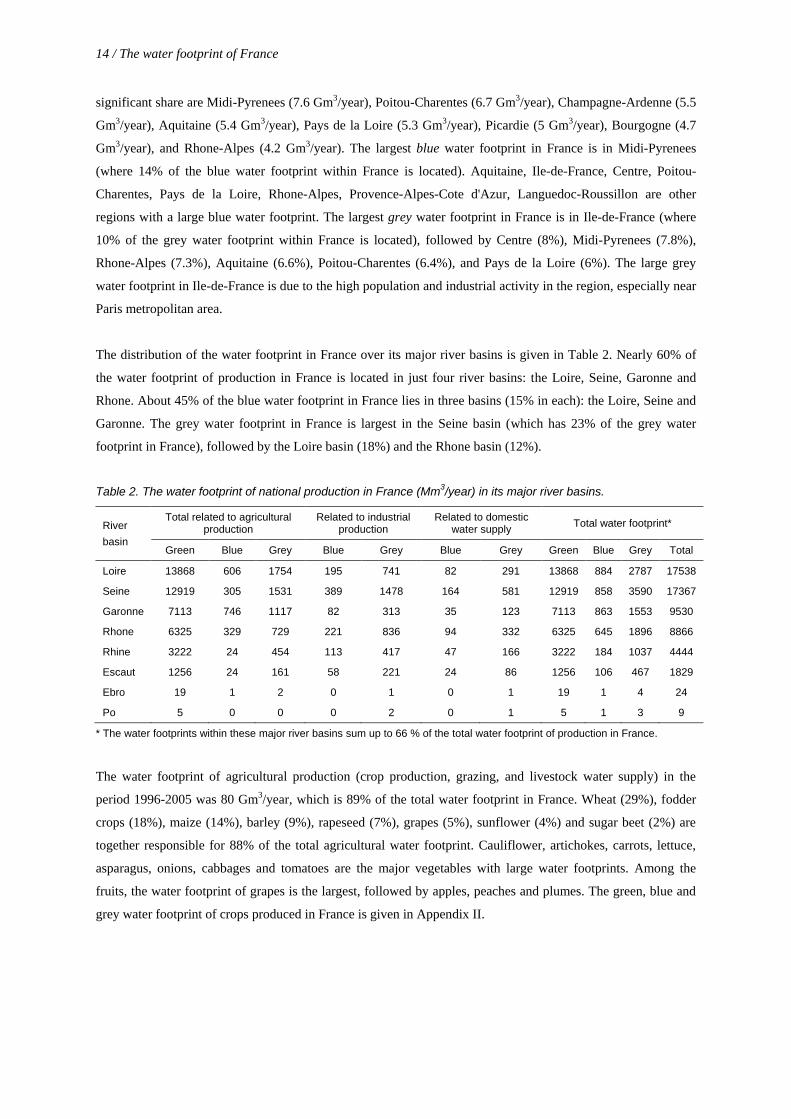
The spatial distributions of the green, blue and grey water footprint of national production in France are shown
in Figure 3. The water footprint per region is presented in Figure 4 (with extended data tabulated in Appendix I).
Centre region has the largest water footprint with 9.6 Gm3/year (12% of the total). Other regions with a
Cereals 47%
Fruits and nuts 6%
Oilseed crops 9%
Fodder 15%
Grazing 6% Livestock 1%
Industry 8%
Domestic water supply 3%
Others 5%
Crops and grazing 88%
14 / The water footprint of France
significant share are Midi-Pyrenees (7.6 Gm3/year), Poitou-Charentes (6.7 Gm3/year), Champagne-Ardenne (5.5
Gm3/year), Aquitaine (5.4 Gm3/year), Pays de la Loire (5.3 Gm3/year), Picardie (5 Gm3/year), Bourgogne (4.7
Gm3/year), and Rhone-Alpes (4.2 Gm3/year). The largest blue water footprint in France is in Midi-Pyrenees
(where 14% of the blue water footprint within France is located). Aquitaine, Ile-de-France, Centre, Poitou-
Charentes, Pays de la Loire, Rhone-Alpes, Provence-Alpes-Cote d'Azur, Languedoc-Roussillon are other
regions with a large blue water footprint. The largest grey water footprint in France is in Ile-de-France (where
10% of the grey water footprint within France is located), followed by Centre (8%), Midi-Pyrenees (7.8%),
Rhone-Alpes (7.3%), Aquitaine (6.6%), Poitou-Charentes (6.4%), and Pays de la Loire (6%). The large grey
water footprint in Ile-de-France is due to the high population and industrial activity in the region, especially near
Paris metropolitan area.
The distribution of the water footprint in France over its major river basins is given in Table 2. Nearly 60% of
the water footprint of production in France is located in just four river basins: the Loire, Seine, Garonne and
Rhone. About 45% of the blue water footprint in France lies in three basins (15% in each): the Loire, Seine and
Garonne. The grey water footprint in France is largest in the Seine basin (which has 23% of the grey water
footprint in France), followed by the Loire basin (18%) and the Rhone basin (12%).
Table 2. The water footprint of national production in France (Mm3/year) in its major river basins.
River
basin
Total related to agricultural production
Related to industrial production
Related to domestic water supply
Total water footprint*
Green Blue Grey Blue Grey Blue Grey Green Blue Grey Total
Loire 13868 606 1754 195 741 82 291 13868 884 2787 17538
Seine 12919 305 1531 389 1478 164 581 12919 858 3590 17367
Garonne 7113 746 1117 82 313 35 123 7113 863 1553 9530
Rhone 6325 329 729 221 836 94 332 6325 645 1896 8866
Rhine 3222 24 454 113 417 47 166 3222 184 1037 4444
Escaut 1256 24 161 58 221 24 86 1256 106 467 1829
Ebro 19 1 2 0 1 0 1 19 1 4 24
Po 5 0 0 0 2 0 1 5 1 3 9
* The water footprints within these major river basins sum up to 66 % of the total water footprint of production in France.
The water footprint of agricultural production (crop production, grazing, and livestock water supply) in the
period 1996-2005 was 80 Gm3/year, which is 89% of the total water footprint in France. Wheat (29%), fodder
crops (18%), maize (14%), barley (9%), rapeseed (7%), grapes (5%), sunflower (4%) and sugar beet (2%) are
together responsible for 88% of the total agricultural water footprint. Cauliflower, artichokes, carrots, lettuce,
asparagus, onions, cabbages and tomatoes are the major vegetables with large water footprints. Among the
fruits, the water footprint of grapes is the largest, followed by apples, peaches and plumes. The green, blue and
grey water footprint of crops produced in France is given in Appendix II.
The water footprint of France / 15
Figure 3. Spatial distribution of the green, blue and grey water footprint of production in France.
16 / The water footprint of France
0
1000
2000
3000
4000
5000
6000
7000
8000
9000
10000
Cen
tre
Mid
i-P
yren
ees
Po
ito
u-C
har
ente
s
Ch
amp
agn
e-A
rden
ne
Aq
uit
ain
e
Pay
s d
e la
Lo
ire
Pic
ard
ie
Bo
urg
ogn
e
Rh
on
e-A
lpes
Bre
tagn
e
Ile-d
e-Fr
ance
Lan
gued
oc-
Ro
uss
illo
n
No
rd-P
as-d
e-C
alai
s
Lorr
ain
e
Pro
ven
ce-A
lpes
-Co
te d
'Azu
r
Hau
te-N
orm
and
ie
Au
verg
ne
Bas
se-N
orm
and
ie
Als
ace
Fran
che-
Co
mte
Lim
ou
sin
Co
rse
Grey
Blue
Green
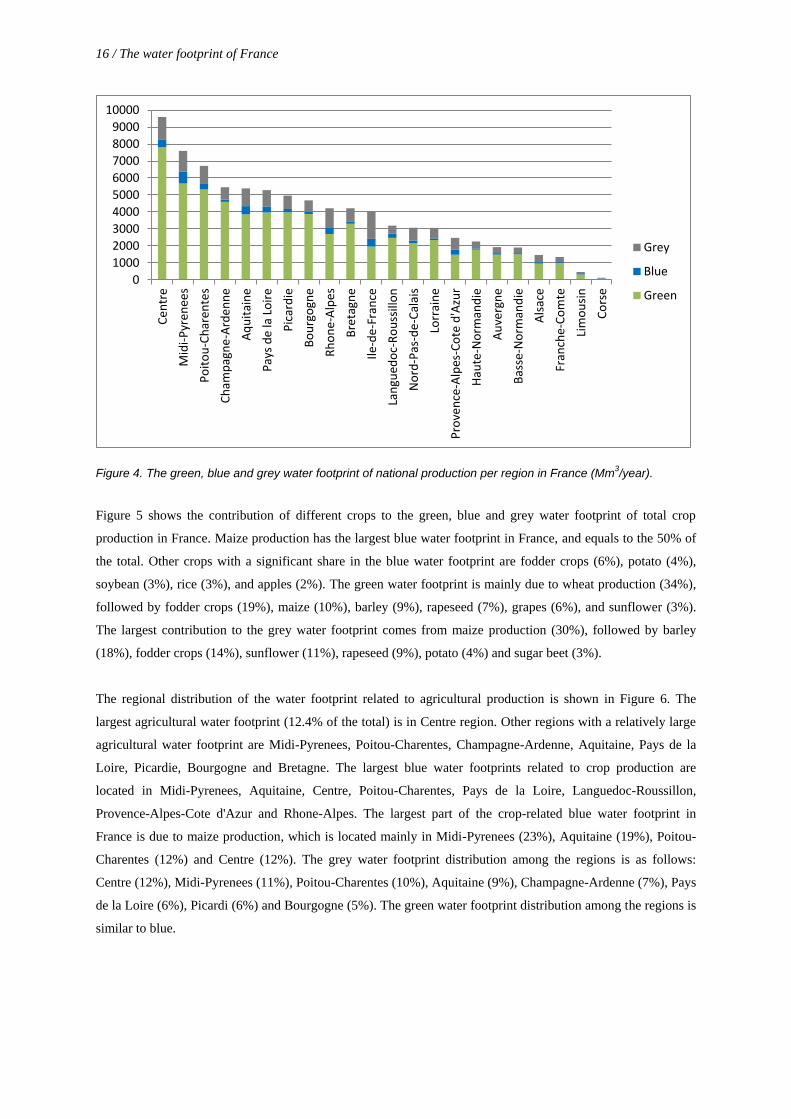
Figure 4. The green, blue and grey water footprint of national production per region in France (Mm3/year).
Figure 5 shows the contribution of different crops to the green, blue and grey water footprint of total crop
production in France. Maize production has the largest blue water footprint in France, and equals to the 50% of
the total. Other crops with a significant share in the blue water footprint are fodder crops (6%), potato (4%),
soybean (3%), rice (3%), and apples (2%). The green water footprint is mainly due to wheat production (34%),
followed by fodder crops (19%), maize (10%), barley (9%), rapeseed (7%), grapes (6%), and sunflower (3%).
The largest contribution to the grey water footprint comes from maize production (30%), followed by barley
(18%), fodder crops (14%), sunflower (11%), rapeseed (9%), potato (4%) and sugar beet (3%).
The regional distribution of the water footprint related to agricultural production is shown in Figure 6. The
largest agricultural water footprint (12.4% of the total) is in Centre region. Other regions with a relatively large
agricultural water footprint are Midi-Pyrenees, Poitou-Charentes, Champagne-Ardenne, Aquitaine, Pays de la
Loire, Picardie, Bourgogne and Bretagne. The largest blue water footprints related to crop production are
located in Midi-Pyrenees, Aquitaine, Centre, Poitou-Charentes, Pays de la Loire, Languedoc-Roussillon,
Provence-Alpes-Cote d'Azur and Rhone-Alpes. The largest part of the crop-related blue water footprint in
France is due to maize production, which is located mainly in Midi-Pyrenees (23%), Aquitaine (19%), Poitou-
Charentes (12%) and Centre (12%). The grey water footprint distribution among the regions is as follows:
Centre (12%), Midi-Pyrenees (11%), Poitou-Charentes (10%), Aquitaine (9%), Champagne-Ardenne (7%), Pays
de la Loire (6%), Picardi (6%) and Bourgogne (5%). The green water footprint distribution among the regions is
similar to blue.

The water footprint of France / 17
Figure 5. The contribution of different crops to the green, blue and grey water footprint of total crop production in
France.
18 / The water footprint of France
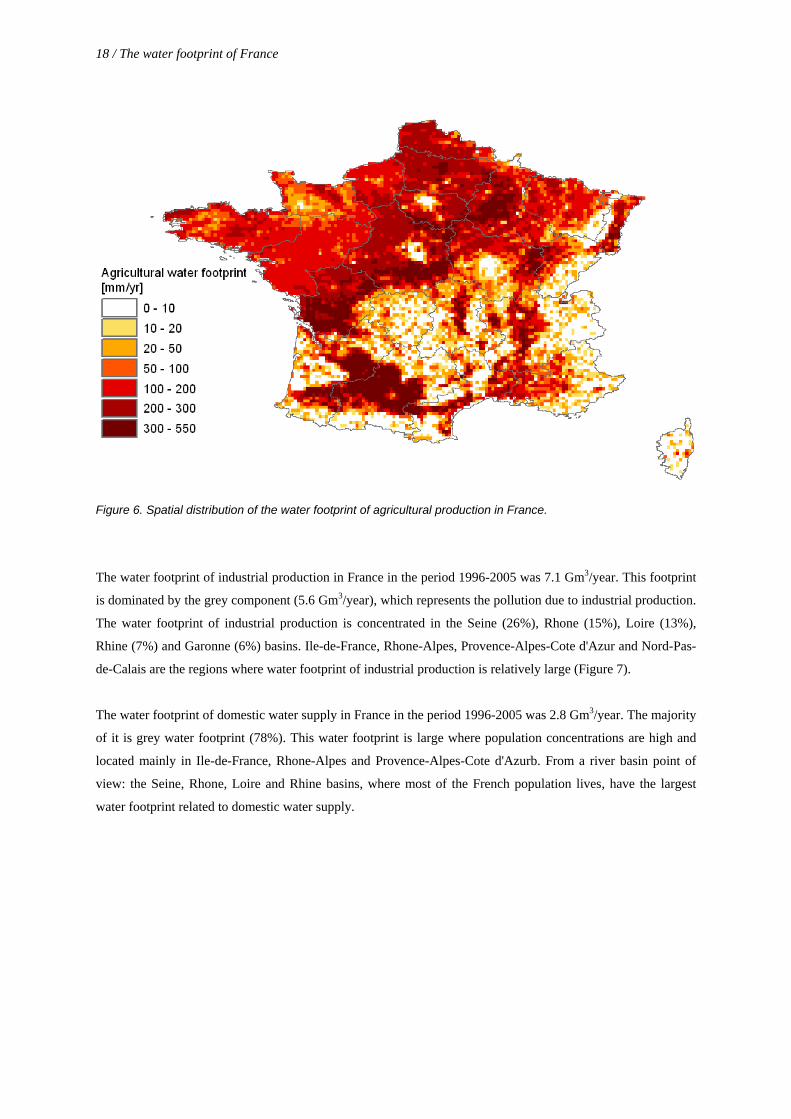
Figure 6. Spatial distribution of the water footprint of agricultural production in France.
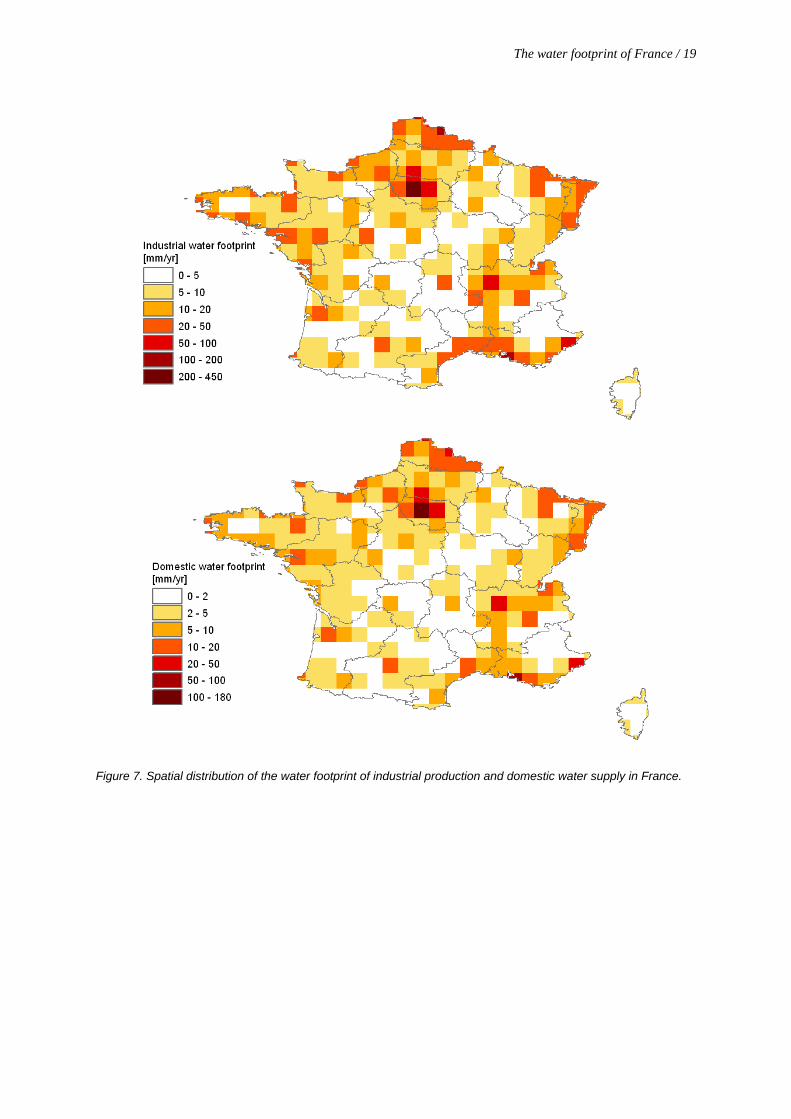
The water footprint of industrial production in France in the period 1996-2005 was 7.1 Gm3/year. This footprint
is dominated by the grey component (5.6 Gm3/year), which represents the pollution due to industrial production.
The water footprint of industrial production is concentrated in the Seine (26%), Rhone (15%), Loire (13%),
Rhine (7%) and Garonne (6%) basins. Ile-de-France, Rhone-Alpes, Provence-Alpes-Cote d'Azur and Nord-Pas-
de-Calais are the regions where water footprint of industrial production is relatively large (Figure 7).
The water footprint of domestic water supply in France in the period 1996-2005 was 2.8 Gm3/year. The majority
of it is grey water footprint (78%). This water footprint is large where population concentrations are high and
located mainly in Ile-de-France, Rhone-Alpes and Provence-Alpes-Cote d'Azurb. From a river basin point of
view: the Seine, Rhone, Loire and Rhine basins, where most of the French population lives, have the largest
water footprint related to domestic water supply.
The water footprint of France / 19
Figure 7. Spatial distribution of the water footprint of industrial production and domestic water supply in France.
20 / The water footprint of France
3.2 Virtual water flows
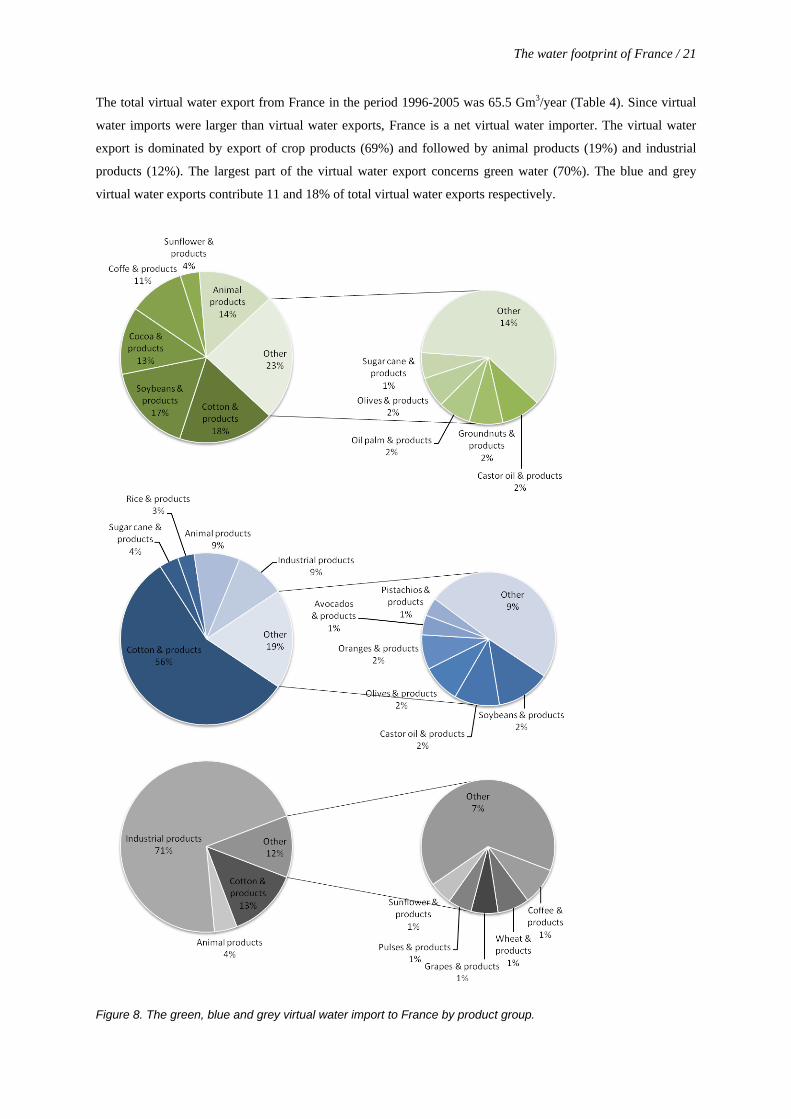
The total virtual water import to France in the period 1996-2005 was 78.3 Gm3/year. About 73% of the virtual
water imports relates to imported crops and crop products, 15% to imported industrial products and 12% to
imported animal products (Table 3). The largest share (22%) of the total virtual water import relates to the
import of cotton and its derived products. Figure 8 shows the contribution of different products to the virtual
water import, distinguishing between green, blue and grey virtual water imports.
The green water footprint of imported products is 52.7 Gm3/year and is 67% of total virtual water import.
Cotton products have the largest green water footprint among the imported products, accountable for 18% of the
total green virtual water import. Soybean products (17%), animal products (14%), cocoa products (13%) and
coffee products (11%) are other products with a significant share in the green virtual water import. The blue
water footprint of imported products in France is 10.5 Gm3/year. Approximately 56% of this footprint is due to
cotton products. Animal and industrial products also have significant shares in blue virtual water imports (9%
each). The grey water footprint of imported products is 15.1 Gm3/year. Industrial products give the largest
contribution to this grey water footprint (71%), followed by cotton products (13%) and animal products (4%).
The majority of the virtual water imports to France originate from Brazil (10%), Belgium (9%), Spain (7%),
Germany (7%), Italy (6%) and India (5%). Spain, Belgium, Morocco, Italy, India, Uzbekistan, and Turkey are
the largest blue virtual water exporters to France, accounting for 55% of the blue virtual water import. The grey
component of virtual water import is mainly from China (10%), Germany (10%), Russia (10%), Italy (7%),
Belgium (7%), the USA (7%), Spain (5%) and India (4%). The green, blue and grey water footprints of virtual
water imports to France are shown in Figure 9.
The blue water footprint related to the total of imported cotton products is mainly located in Uzbekistan, Turkey,
India, Tajikistan, Turkmenistan and China. The blue water footprint related to imported animal products mainly
lies in Spain, Belgium, the Netherlands, Germany and Italy. For industrial products, this ranking is: Germany
(15%), the USA (11%), China (9%), Italy (8%) and Russia (8%). Most of the grey water footprint related to the
import of industrial products lies in Russia (14%), China (11%), Germany (10%) and the USA (7%).
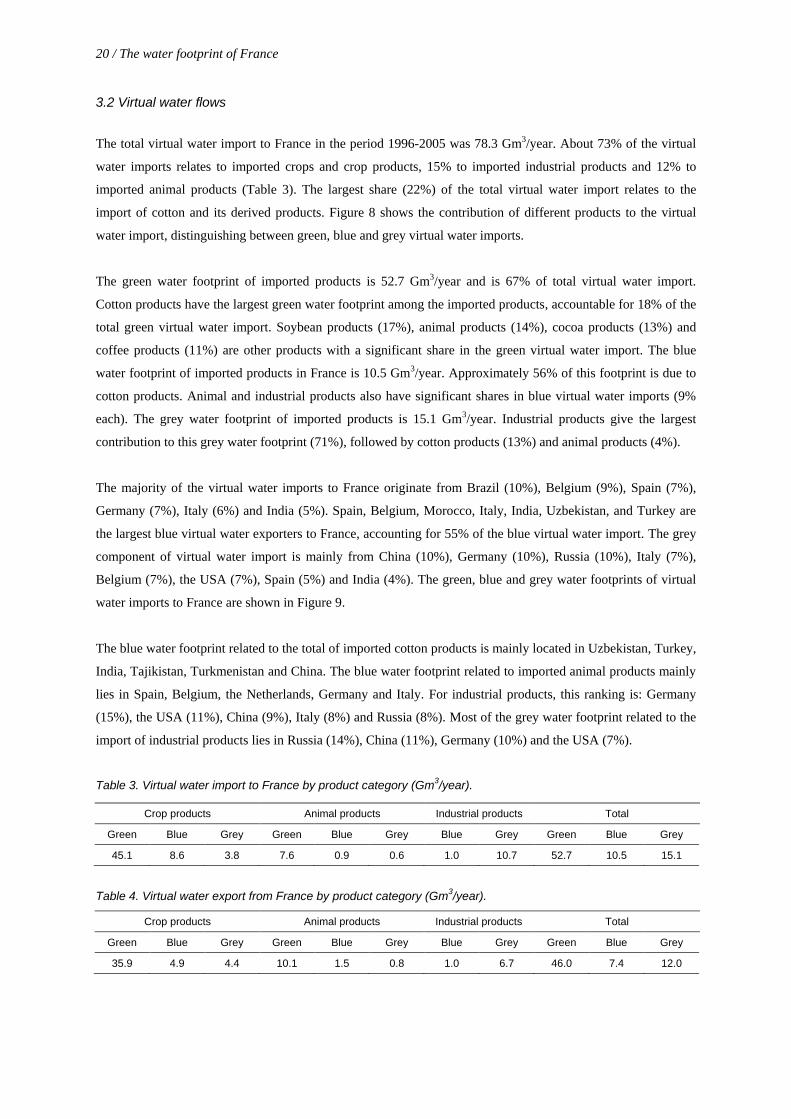
Table 3. Virtual water import to France by product category (Gm3/year).
Crop products Animal products Industrial products Total
Green Blue Grey Green Blue Grey Blue Grey Green Blue Grey
45.1 8.6 3.8 7.6 0.9 0.6 1.0 10.7 52.7 10.5 15.1
Table 4. Virtual water export from France by product category (Gm3/year).
Crop products Animal products Industrial products Total
Green Blue Grey Green Blue Grey Blue Grey Green Blue Grey
35.9 4.9 4.4 10.1 1.5 0.8 1.0 6.7 46.0 7.4 12.0
The water footprint of France / 21
The total virtual water export from France in the period 1996-2005 was 65.5 Gm3/year (Table 4). Since virtual
water imports were larger than virtual water exports, France is a net virtual water importer. The virtual water
export is dominated by export of crop products (69%) and followed by animal products (19%) and industrial
products (12%). The largest part of the virtual water export concerns green water (70%). The blue and grey
virtual water exports contribute 11 and 18% of total virtual water exports respectively.
Figure 8. The green, blue and grey virtual water import to France by product group.
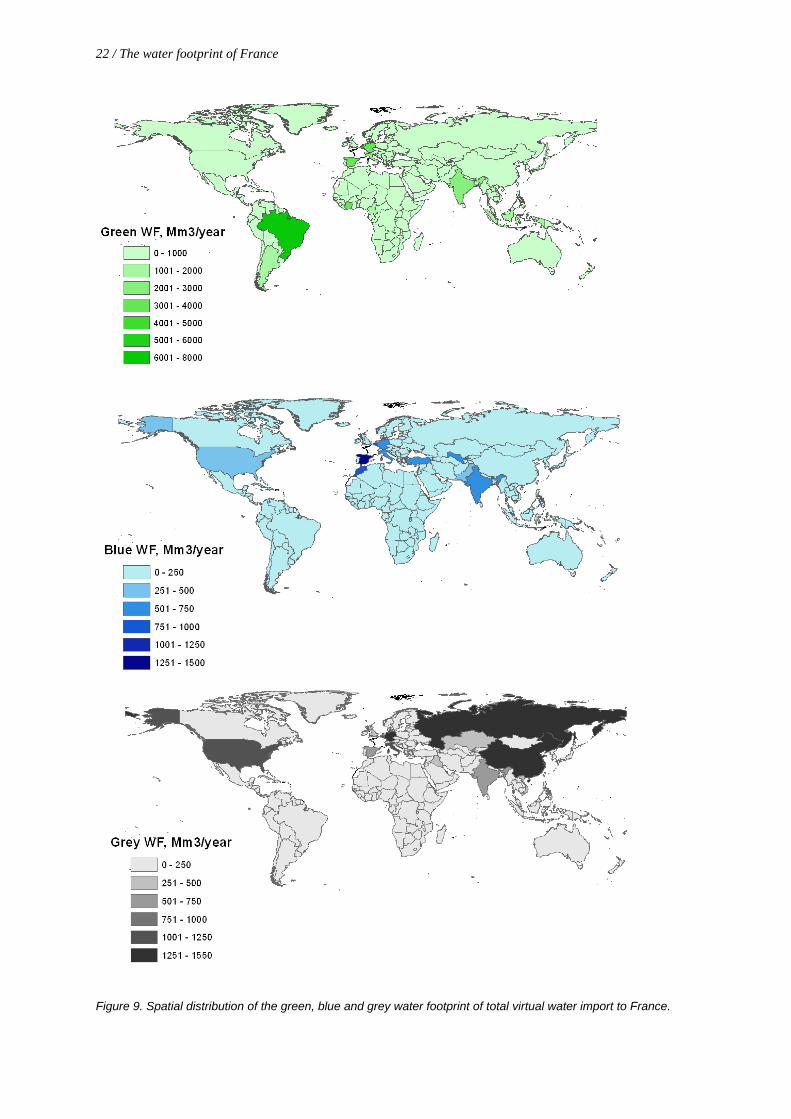
22 / The water footprint of France
Figure 9. Spatial distribution of the green, blue and grey water footprint of total virtual water import to France.

The water footprint of France / 23
The largest virtual water flows leaving France go to Belgium (16%), Italy (13%), Germany (11%), Spain (8%),
the United Kingdom (7%), the Netherlands (7%), Algeria (3%) and Libya (3%). Figure 10 shows the virtual
water exports by product category. This figure only shows virtual water exports related to domestically made
products. Animal and wheat products together are responsible for 54% of the green virtual water flows from
France. Barley, maize, rapeseed, sunflower and grape products are other major commodities with a large share
in green virtual water exports. Blue virtual water exports from France are mainly due to the export of animal
products (39%), industrial products (26%) and maize products (17%). The largest grey virtual water export is
due to the export of industrial products (61% of the total) and is followed by maize, animal and barley products.
Figure 10. Green, blue and grey virtual water export from France by product group.

24 / The water footprint of France
3.3 Water footprint of consumption
The total water footprint of consumption in France is 106 Gm3/year over the period 1996-2005. The green
component is the largest and is equal to 76% of total water footprint of consumption. Blue and grey water
footprints of national consumption are 8 and 17% of the total. About 53% of the water footprint of French
national consumption is internal and 47% is external (Table 5). This means that nearly half of the water
resources consumed or polluted to make all products consumed by French citizens are water resources outside
the country.
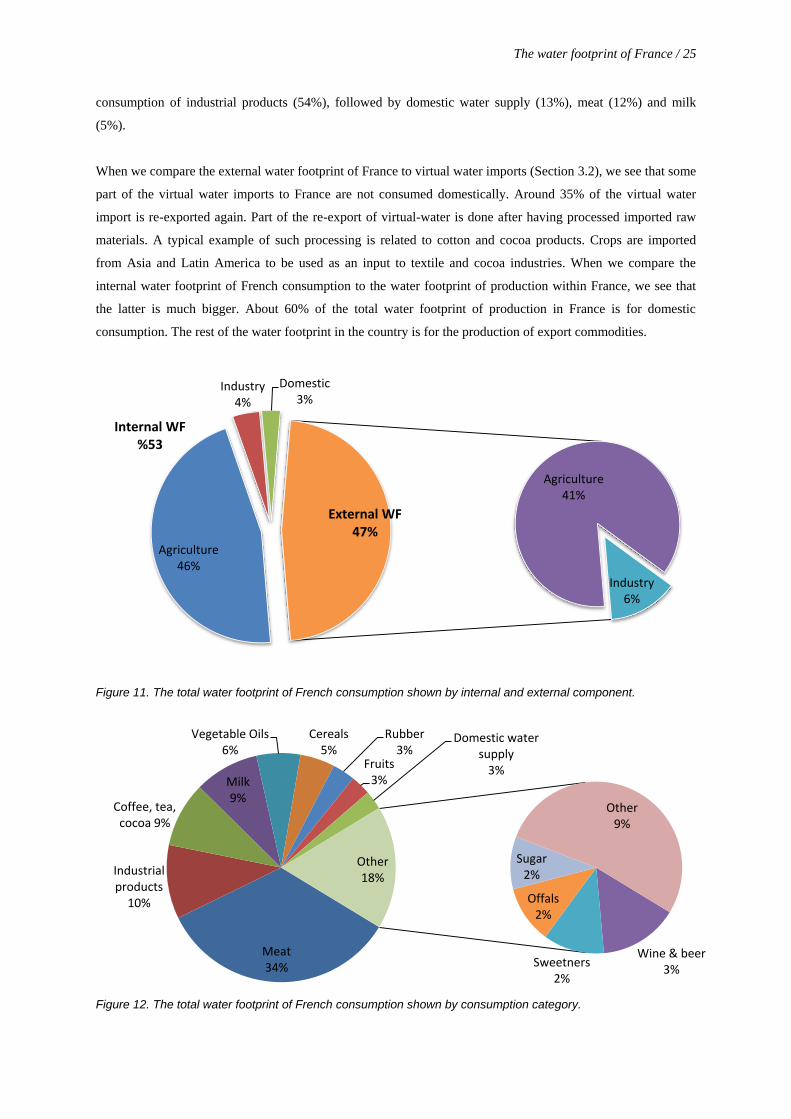
The largest fraction (87%) in the total water footprint of French consumers relates to the consumption of
agricultural products. Consumption of industrial products and domestic water supply contribute 10% and 3% to
the total water footprint of consumption, respectively (Table 6). The internal water footprint of French
consumption is mainly because of the consumption of agricultural products, followed by industrial products and
domestic water supply (Figure 11). The external water footprint is largely due to the import of agricultural
products for domestic consumption, and for a smaller part due to the import of industrial products. The ratio of
external to total water footprint of consumption is higher for industrial products (62%) than for agricultural
products (47%). Furthermore, the ratio of external to total water footprint is significantly higher for the blue
water footprint (64%) than for the green water footprint (46%) or the grey water footprint (47%). For
agricultural products, even 77% of the total blue water footprint of consumption is external.
Table 5. The internal and external water footprint of French consumption (Mm3/year).
Internal water footprint External water footprint Total water footprint Ratio of external
to total water footprint (%) Green Blue Grey Green Blue Grey Green Blue Grey
43704 2879 9295 36739 5156 8355 80443 8036 17649 47
Table 6. The water footprint of French consumption per major consumption category (Mm
3/year).
Water footprint of consumption of agricultural products
Water footprint of consumption of industrial products Water footprint of domestic
water supply Internal External Internal External
Green Blue Grey Green Blue Grey Blue Grey Blue Grey Blue Grey
43704 1375 3753 36739 4577 2078 876 3320 579 6277 628 2221
With a contribution of 34%, meat consumption is the largest contributor to the total water footprint of French
consumption (Figure 12). Industrial products (10%), coffee, tea and cocoa (9%), and milk (9%) are other large
contributors. The consumption of cereals and sugar contribute 5% and 4% to the total water footprint of
consumption, respectively. Rubber, fruits, wine & beer, and domestic water supply each have a 3% share in the
total water footprint of consumption. The precise water footprint of consumption per agricultural product is
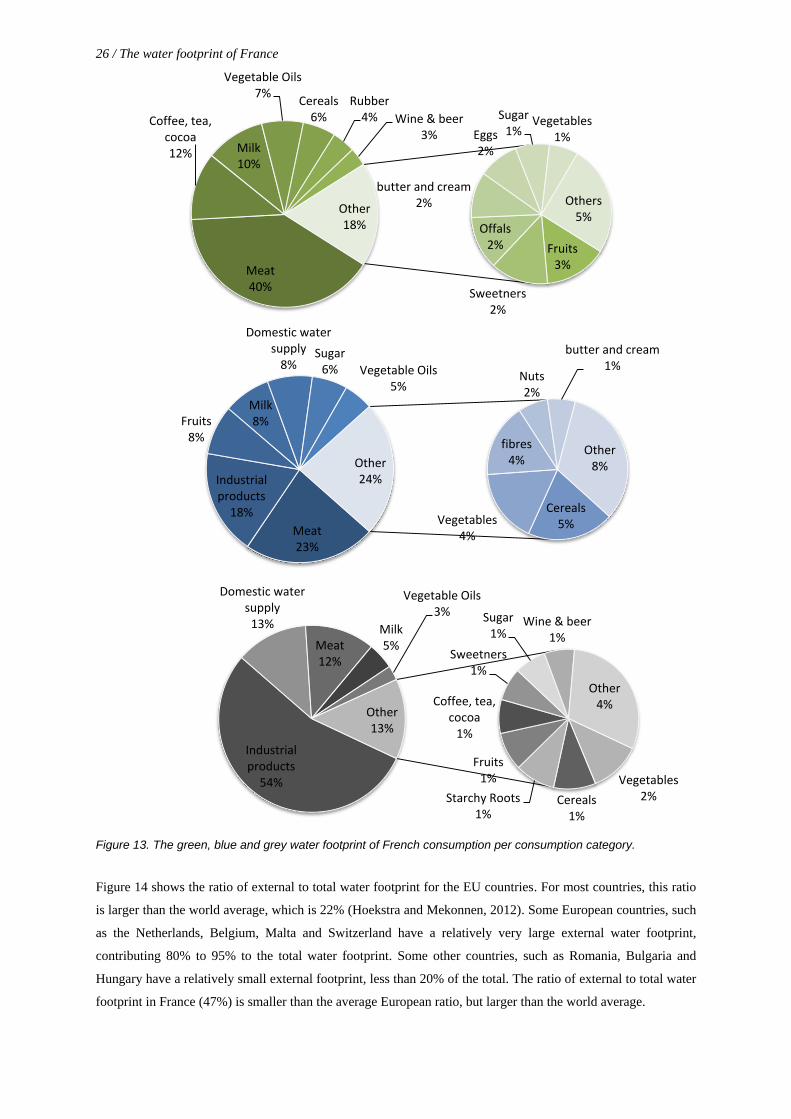
presented in Appendix III. As can be seen from Figure 13, meat, coffee-tea-cocoa, milk, vegetable oils and
cereals have the largest shares in the total green water footprint of French national consumption (40, 12, 10, 7
and 6% respectively). The blue water footprint is also dominated by meat consumption (23%). Consumption of
industrial products (18%), fruits (8%), milk (8%) and domestic water supply (8%) are other sectors with a large
share in the total blue water footprint. The grey water footprint of consumption is mainly due to the
The water footprint of France / 25
Meat 34%
Industrial products
10%
Coffee, tea, cocoa 9%
Milk 9%
Vegetable Oils 6%
Cereals 5%
Rubber 3%
Fruits 3%
Domestic water supply
3%
Wine & beer 3%
Sweetners 2%
Offals 2%
Sugar 2%
Other 9%
Other 18%
consumption of industrial products (54%), followed by domestic water supply (13%), meat (12%) and milk
(5%).
When we compare the external water footprint of France to virtual water imports (Section 3.2), we see that some
part of the virtual water imports to France are not consumed domestically. Around 35% of the virtual water
import is re-exported again. Part of the re-export of virtual-water is done after having processed imported raw
materials. A typical example of such processing is related to cotton and cocoa products. Crops are imported
from Asia and Latin America to be used as an input to textile and cocoa industries. When we compare the
internal water footprint of French consumption to the water footprint of production within France, we see that
the latter is much bigger. About 60% of the total water footprint of production in France is for domestic
consumption. The rest of the water footprint in the country is for the production of export commodities.
Figure 11. The total water footprint of French consumption shown by internal and external component.
Figure 12. The total water footprint of French consumption shown by consumption category.
Agriculture 46%
Industry 4%
Domestic 3%
Agriculture 41%
Industry 6%
External WF 47%
Internal WF %53
26 / The water footprint of France
Meat 40%
Coffee, tea, cocoa 12% Milk
10%
Vegetable Oils 7%
Cereals 6%
Rubber 4% Wine & beer
3%
Fruits 3%
Sweetners 2%
Offals 2%
butter and cream 2%
Eggs 2%
Sugar 1%
Vegetables 1%
Others 5%
Other 18%
Meat 23%
Industrial products
18%
Fruits 8%
Milk 8%
Domestic water supply
8% Sugar
6% Vegetable Oils 5%
Cereals 5% Vegetables
4%
fibres 4%
Nuts 2%
butter and cream 1%
Other 8% Other
24%
Industrial products
54%
Domestic water supply
13%
Meat 12%
Milk 5%
Vegetable Oils 3%
Vegetables 2% Cereals
1%
Starchy Roots 1%
Fruits 1%
Coffee, tea, cocoa
1%
Sweetners 1%
Sugar 1%
Wine & beer 1%
Other 4%
Other 13%
Figure 13. The green, blue and grey water footprint of French consumption per consumption category.
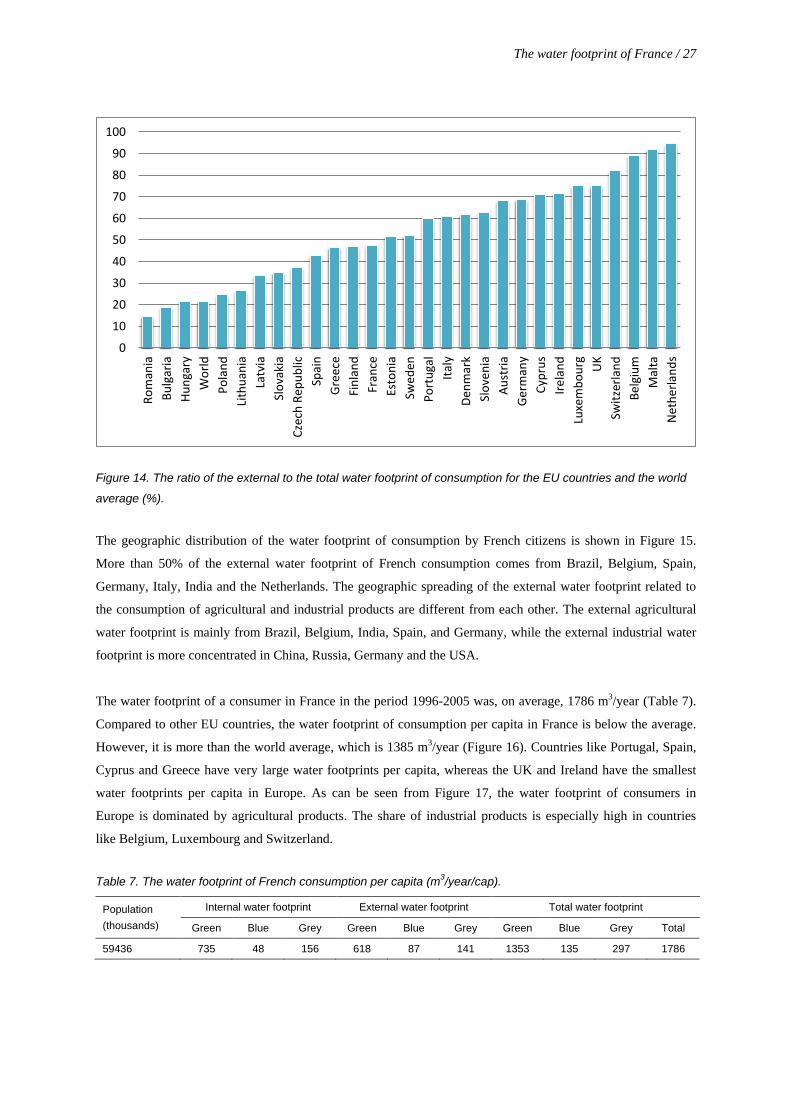
Figure 14 shows the ratio of external to total water footprint for the EU countries. For most countries, this ratio
is larger than the world average, which is 22% (Hoekstra and Mekonnen, 2012). Some European countries, such
as the Netherlands, Belgium, Malta and Switzerland have a relatively very large external water footprint,
contributing 80% to 95% to the total water footprint. Some other countries, such as Romania, Bulgaria and
Hungary have a relatively small external footprint, less than 20% of the total. The ratio of external to total water
footprint in France (47%) is smaller than the average European ratio, but larger than the world average.
The water footprint of France / 27
0
10
20
30
40
50
60
70
80
90
100R
om
ania
Bu
lgar
ia
Hu
nga
ry
Wo
rld
Po
lan
d
Lith
uan
ia
Latv
ia
Slo
vaki
a
Cze
ch R
epu
blic
Spai
n
Gre
ece
Fin
lan
d
Fran
ce
Esto
nia
Swed
en
Po
rtu
gal
Ital
y
Den
mar
k
Slo
ven
ia
Au
stri
a
Ger
man
y
Cyp
rus
Irel
and
Luxe
mb
ou
rg UK
Swit
zerl
and
Bel
giu
m
Mal
ta
Net
her
lan
ds
Figure 14. The ratio of the external to the total water footprint of consumption for the EU countries and the world
average (%).
The geographic distribution of the water footprint of consumption by French citizens is shown in Figure 15.
More than 50% of the external water footprint of French consumption comes from Brazil, Belgium, Spain,
Germany, Italy, India and the Netherlands. The geographic spreading of the external water footprint related to
the consumption of agricultural and industrial products are different from each other. The external agricultural
water footprint is mainly from Brazil, Belgium, India, Spain, and Germany, while the external industrial water
footprint is more concentrated in China, Russia, Germany and the USA.
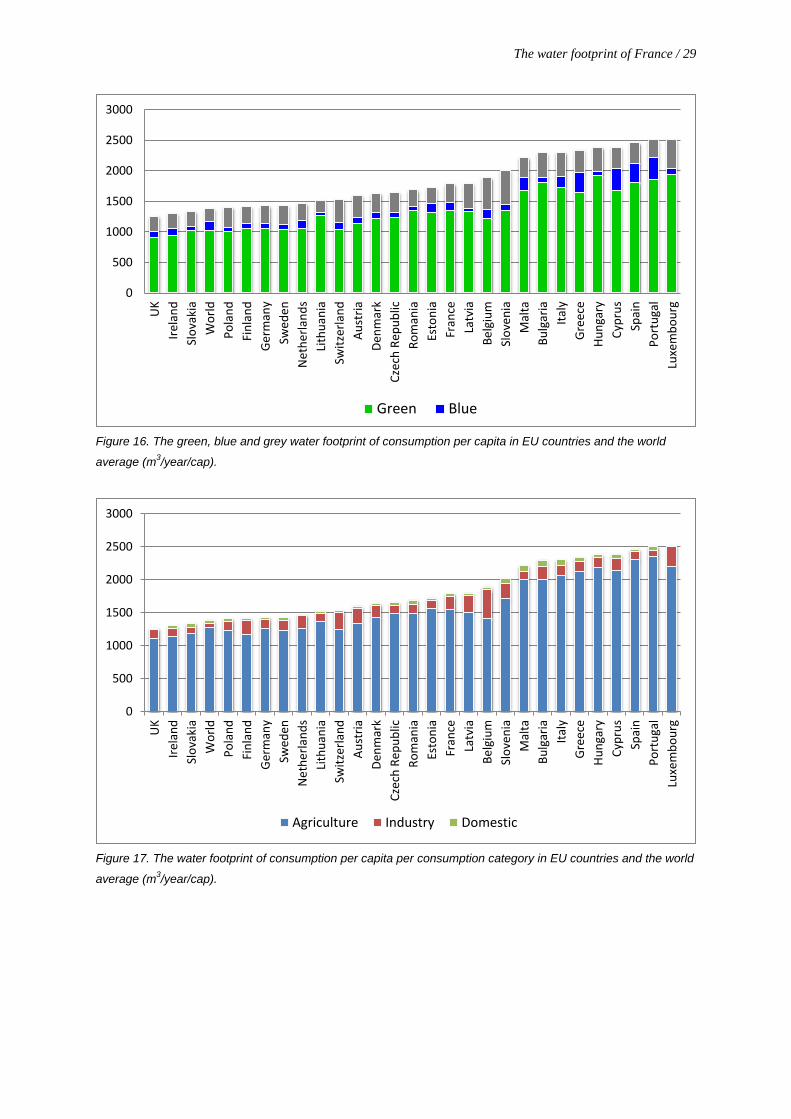
The water footprint of a consumer in France in the period 1996-2005 was, on average, 1786 m3/year (Table 7).
Compared to other EU countries, the water footprint of consumption per capita in France is below the average.
However, it is more than the world average, which is 1385 m3/year (Figure 16). Countries like Portugal, Spain,
Cyprus and Greece have very large water footprints per capita, whereas the UK and Ireland have the smallest
water footprints per capita in Europe. As can be seen from Figure 17, the water footprint of consumers in
Europe is dominated by agricultural products. The share of industrial products is especially high in countries
like Belgium, Luxembourg and Switzerland.
Table 7. The water footprint of French consumption per capita (m3/year/cap).
Population
(thousands)
Internal water footprint External water footprint Total water footprint
Green Blue Grey Green Blue Grey Green Blue Grey Total
59436 735 48 156 618 87 141 1353 135 297 1786

28 / The water footprint of France
Figure 15. The global water footprint of consumption by the inhabitants of France (period 1996-2005).
The water footprint of France / 29
Figure 16. The green, blue and grey water footprint of consumption per capita in EU countries and the world
average (m3/year/cap).
Figure 17. The water footprint of consumption per capita per consumption category in EU countries and the world
average (m3/year/cap).
0
500
1000
1500
2000
2500
3000
UK
Irel
and
Slo
vaki
a
Wo
rld
Po
lan
d
Fin
lan
d
Ger
man
y
Swed
en
Net
her
lan
ds
Lith
uan
ia
Swit
zerl
and
Au
stri
a
Den
mar
k
Cze
ch R
epu
blic
Ro
man
ia
Esto
nia
Fran
ce
Latv
ia
Bel
giu
m
Slo
ven
ia
Mal
ta
Bu
lgar
ia
Ital
y
Gre
ece
Hu
nga
ry
Cyp
rus
Spai
n
Po
rtu
gal
Luxe
mb
ou
rg
Green Blue
0
500
1000
1500
2000
2500
3000
UK
Irel
and
Slo
vaki
a
Wo
rld
Po
lan
d
Fin
lan
d
Ger
man
y
Swed
en
Net
her
lan
ds
Lith
uan
ia
Swit
zerl
and
Au
stri
a
Den
mar
k
Cze
ch R
epu
blic
Ro
man
ia
Esto
nia
Fran
ce
Latv
ia
Bel
giu
m
Slo
ven
ia
Mal
ta
Bu
lgar
ia
Ital
y
Gre
ece
Hu
nga
ry
Cyp
rus
Spai
n
Po
rtu
gal
Luxe
mb
ou
rg
Agriculture Industry Domestic


4. Priority basins and products
4.1 Water footprint of production
As described in Section 3.1, the blue water footprint of France is dominated by crop production and followed by
industry and domestic water supply. The blue water footprint is mainly located in the Loire, Seine, Garonne,
Rhone, Rhine and Escaut river basins (Table 2). Four of these basins – the Loire, Seine, Garonne and Escaut –
experience moderate to severe water scarcity at least one month a year. Table 8 shows, for each of these four
basins, the months in which the moderate to severe water scarcity occurs and the products that dominate the
water footprint in these months. The Loire, Seine and Garonne basins have the largest shares in the blue water
footprint of production in France, 15% each. The blue water footprint in the Escaut basin is much smaller, but
the area of this basin is also much smaller than for the other three basins (Figure 18).
The Loire river basin experiences significant water scarcity in August and September. The main activities
contributing to the blue water footprint in this basin are maize and industrial production. The Loire basin is
considered an important farming area, producing two thirds of the livestock and half of the cereal produced in
France. The banks of the river offer a habitat for a rich biodiversity. The river is a refuge for European beavers,
otters, and crested newts, and a migration route for fish such as Atlantic salmon. The decrease in water levels in
the river during the summer period has a negative effect on the biodiversity located in the banks of the river
(UNEP, 2004).
The Seine and Escaut river basins experience water scarcity from July to October. The blue water footprint
during this period in these basins is mainly because of industrial production, domestic water supply, and maize
and potato production. The Seine river passes through Paris; the high level of urbanization and industrialization
has a major impact on the water quality in the basin. Pollution is due to industrial and domestic wastewater, but
also intensive agriculture. Agricultural production has a big impact on water quality because it favours intensive
farming techniques and spring crops, which leave the soil bare for long periods of the year and increase the
chemical load in the rivers by leaching and draining. This has a harmful effect on both the environment and
other water uses. Improving water quality is still the major concern of the basin, where non-point source
pollution from farming and urban areas is still a major problem, as nitrate, pesticide and heavy metal
concentrations continue to increase (UNEP, 2004).
The Garonne faces moderate to severe water scarcity in the period from July to September. The production of
maize is the dominant factor behind the blue water scarcity in this basin. Soybean and fodder are two other
products that contribute significantly to the blue water footprint in the basin. The Garonne is the most important
river of south-western France and main water source for five major cities, including Bordeaux. The Bordeaux
region is known for its industrial activities and is well known for the quality of its vineyards. The region
especially experiences water shortages during summertime (UNESCO, 2006; AEAG, 2011). The Garonne is an
important breeding area for sturgeon and for the migration of Atlantic salmon. Its estuary, in particular, is a very
important site for fish and bird migrations. The water quality is worsening with wastewater from the city of

32 / The water footprint of France
Bordeaux, causing high levels of nitrogen and phosphorous concentrations downstream of Bordeaux. One
tributary of the Garonne, the Dropt, is particularly sensitive to eutrophication (Devault et al., 2007; UNEP,
2004). The pollution of a few heavy metals is observed in the Garonne due to industrial activities, especially
mining in the basin. This contamination is considered as critical because of the sensitivity of the marine
ecosystems located at the downstream (Grousset et al., 1999) .
Table 8. Priority basins regarding the blue water footprint of production in France.
River basin Month Level of scarcity Products with significant contribution to the blue water footprint in the basin (% of contribution)
Loire August Significant Maize (58%), industrial production (6%)
September Significant Maize (45%), industrial production (10%)
Seine
July Moderate Industrial production (28%), maize (18%), domestic water supply (12%), potato (11%)
August Severe Maize (38%), industrial production (21%), domestic water supply (9%), potato (%7), sugar beet (%6)
September Severe Industrial production (28%), maize (27%), domestic water supply (12%)
October Moderate Industrial production (5 %), domestic (24%)
Garonne
July Moderate Maize (54%), soybean (1 %), fodder (5%)
August Significant Maize (59%), soybean (7%)
September Severe Maize (69%), soybean (8%)
Escaut
July Significant Industrial production (61%), domestic water supply (17%), potato (10%)
August Severe Industrial production (57%), domestic water supply (16%), maize (10%), potato (8%)
September Severe Industrial production (70%), domestic water supply (20%)
October Severe Industrial production (77%), domestic water supply (22%)
Figure 18. Priority basins and products regarding the blue water footprint of production in France.

The water footprint of France / 33
A significant portion of the blue water footprint of production in France is for production of export
commodities. Around 60% of the agricultural blue water footprint and 40% of the industrial blue water footprint
of production are not for producing commodities for internal consumption but for production of export goods.
Therefore, some of the impacts of the water footprint of production in French river basins are due to
consumption happening elsewhere in the world but not in France.
4.2 Water footprint of consumption
The blue water footprint of French consumption is partly within France and partly outside. In many of the basins
where part of the water footprint of French consumption is located, water scarcity is beyond hundred per cent
during part of the year. All those basins are shown in Appendix IV, which also shows, per basin, the size of the
water footprint of French consumers in the basin and the number of months that the basin experiences different
levels of water scarcity.
Agricultural products. We will focus first on the water footprint of French consumption of agricultural products.
Table 9 presents the river basins across the globe where there is a significant blue water footprint related to
French consumption of agricultural products and where there is moderate, significant or severe water scarcity
during part of the year. A ‘significant’ blue water footprint in a basin means here that at least 1% of the blue
water footprint of French consumption of agricultural products is located in this basin. The table also shows a
list of river basins where less than 1% of the blue water footprint of French consumption of agricultural products
is located. In these basins, water scarcity is severe during part of the year (or even the full year) and the
contribution of one or more specific agricultural commodities to the total blue water footprint in the basin in the
period of severe scarcity is very significant (more than 20%). Although France imports this or these products in
relative small amounts (less than 1% of the blue water footprint of French consumption of agricultural products
is located in those basins), these products are obviously contributing to very unsustainable conditions. Table 9
shows, per basin, the number of months per year that the basin faces moderate, significant or severe water
scarcity, and priority products per basin. These priority products are the products that contribute significantly to
the basin’s blue water scarcity and are imported by France. The basins listed in Table 9 are shown on the world
map in Figure 19.
The Aral Sea basin is identified as one of the most important priority basins, since 6% of the blue water
footprint of French consumption of agricultural products is located there. The basin experiences one month of
moderate water scarcity (June) and four months of severe water scarcity (July to October). Cotton production is
the dominant factor in the blue water scarcity of the basin (more than 50%). Next in line of the priority basins
are the four French river basins that were already identified in the previous section as well: the Garonne, Loire,
Escaut and Seine basins. The blue water footprints within those basins lead to moderate to severe water scarcity
during parts of the year. For an important part, the blue water footprints of production in these basins relate to
producing for the domestic market. A sixth priority basin is the Indus basin, in which 4% of the blue water
footprint of French consumption of agricultural products is located. The basin faces severe water scarcity during
eight months of the year. The blue water footprint in the Indus basin is mainly due to wheat, cotton, rice and
34 / The water footprint of France
sugar cane production. However, wheat is not one of the products that France imports from Pakistan, thus it is
not a product of major concern for French consumers.
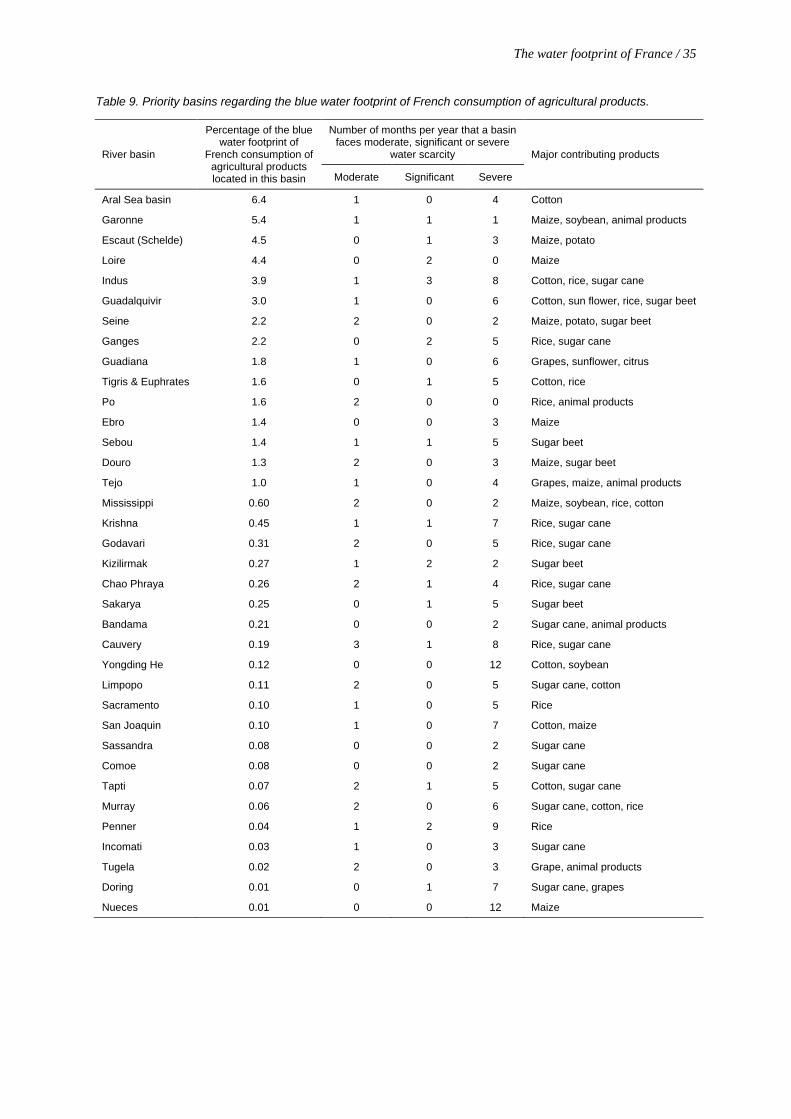
The Ganges, Krishna, Godavari, Cauvery, Tapti and Penner basins are river basins in India that are identified as
priority basins. All these basins experience severe water scarcity during most of the year. Rice and sugar cane
production are the major reasons of blue water scarcity in these basins. The Guadalquivir, Guadiana, Douro and
Tejo are Spanish-Portuguese river basins in which the blue water footprint of French consumption is significant.
Sugar beet, maize, grapes, citrus and sunflower are the products that are imported by France and contribute
largely to the blue water footprint in these basins.
As can be seen from Table 9, mainly eight agricultural products of concern are identified in 36 different priority
basins: cotton, rice, sugar cane, sugar beet, soybean, maize and grape. Among them, cotton, sugar cane and rice
are the three major crops. They have the largest share in the external blue water footprint of French consumption
and are identified as products of concern in most of the priority basins. Therefore, we examined impacts of these
three products in some of the identified priority basins in detail.
Cotton. Cotton is probably the most important product if it comes to the contribution of French consumers to
blue water scarcity. French cotton consumption relates to blue water scarcity in a number of basins throughout
the world: the Aral Sea basin (Uzbekistan), the Indus (Pakistan), the Guadalquivir (Spain and Portugal), the
Tigris & Euphrates (originating in Turkey and ending in Iraq), the Mississippi (USA), the Yongding He (China),
the Limpopo (South Africa), the San Joaquin (USA), the Tapti (India), and the Murray (Australia). The Aral Sea
ecosystem has been experiencing sudden and severe ecosystem damage due to excessive water abstractions
from the inflowing rivers to irrigate cotton fields and other export crops. This unsustainable use of water has
environmental consequences, including fisheries loss, water and soil contamination, and dangerous levels of
polluted airborne sediments. The impacts of extensive irrigation in the Aral Sea basin has extended far beyond
the decline of the sea water level: millions of people lost access to the lake’s water, fish, reed beds, and transport
functions. Additionally, environmental and ecological problems associated with extensive water use for
irrigation negatively affected human health and economic development in the region (Cai et al., 2003; Glantz,
1999; Micklin, 1988). Another well-documented case is the Murray basin in Australia, where water levels have
declined significantly, particularly due to water abstractions for irrigation. Much of its aquatic life, including
native fish, are now declining, rare or endangered (Chartres and Williams, 2006).
The water footprint of France / 35
Table 9. Priority basins regarding the blue water footprint of French consumption of agricultural products.
River basin
Percentage of the blue water footprint of
French consumption of agricultural products located in this basin
Number of months per year that a basin faces moderate, significant or severe
water scarcity Major contributing products
Moderate Significant Severe
Aral Sea basin 6.4 1 0 4 Cotton
Garonne 5.4 1 1 1 Maize, soybean, animal products
Escaut (Schelde) 4.5 0 1 3 Maize, potato
Loire 4.4 0 2 0 Maize
Indus 3.9 1 3 8 Cotton, rice, sugar cane
Guadalquivir 3.0 1 0 6 Cotton, sun flower, rice, sugar beet
Seine 2.2 2 0 2 Maize, potato, sugar beet
Ganges 2.2 0 2 5 Rice, sugar cane
Guadiana 1.8 1 0 6 Grapes, sunflower, citrus
Tigris & Euphrates 1.6 0 1 5 Cotton, rice
Po 1.6 2 0 0 Rice, animal products
Ebro 1.4 0 0 3 Maize
Sebou 1.4 1 1 5 Sugar beet
Douro 1.3 2 0 3 Maize, sugar beet
Tejo 1.0 1 0 4 Grapes, maize, animal products
Mississippi 0.60 2 0 2 Maize, soybean, rice, cotton
Krishna 0.45 1 1 7 Rice, sugar cane
Godavari 0.31 2 0 5 Rice, sugar cane
Kizilirmak 0.27 1 2 2 Sugar beet
Chao Phraya 0.26 2 1 4 Rice, sugar cane
Sakarya 0.25 0 1 5 Sugar beet
Bandama 0.21 0 0 2 Sugar cane, animal products
Cauvery 0.19 3 1 8 Rice, sugar cane
Yongding He 0.12 0 0 12 Cotton, soybean
Limpopo 0.11 2 0 5 Sugar cane, cotton
Sacramento 0.10 1 0 5 Rice
San Joaquin 0.10 1 0 7 Cotton, maize
Sassandra 0.08 0 0 2 Sugar cane
Comoe 0.08 0 0 2 Sugar cane
Tapti 0.07 2 1 5 Cotton, sugar cane
Murray 0.06 2 0 6 Sugar cane, cotton, rice
Penner 0.04 1 2 9 Rice
Incomati 0.03 1 0 3 Sugar cane
Tugela 0.02 2 0 3 Grape, animal products
Doring 0.01 0 1 7 Sugar cane, grapes
Nueces 0.01 0 0 12 Maize

36 / The water footprint of France
Figure 19. The river basins in the world in which the production of agricultural products for French consumption
contributes to moderate, significant or severe blue water scarcity.
Sugar cane. Sugar cane is the second product if it comes to the contribution of French consumers to blue water
scarcity in the world. Sugar cane consumed in France contributes to water scarcity in the following priority
basins: the Indus (Pakistan), the Ganges (India), the Krishna (India), the Godavari (India), the Chao Phraya
(Thailand), the Bandama (Côte d'Ivoire), the Cauvery (India), the Limpopo (South Africa), the Sassandra (Côte
d'Ivoire), the Comoe (Côte d'Ivoire), the Tapti (India), the Murray (Australia), the Incomati (South Africa) and
the Doring (South Africa). The freshwater reaching to Indus delta has significantly decreased (90%) as a result
of over-usage of water sources in the Indus basin. Sugar cane is one of the main water consuming agricultural
products in the basin. The decrease in freshwater flow to the Indus delta has negative impacts on the ecosystems
and biodiversity of the delta (such as decrease of mangrove forestlands and danger of extinction of the Blind
River Dolphin). Additionally, excessive water usage in sugar cane cultivation areas has led to salinity problems
(WWF, 2004). Moreover, untreated wastewater discharge from sugar mills causes depletion of available oxygen
in water sources, which threatens fish and other aquatic life (Akbar and Khwaja, 2006). India is also facing
environmental problems due to sugar cane cultivation. In the Indian state of Maharashtra, sugar cane irrigation
is 60% of the total irrigation supply, which causes substantial groundwater withdrawals (WWF, 2004). India’s
largest river, the Ganges, experiences severe water scarcity. Sugar cane is one of the major crops cultivated in
the area and deteriorates the water scarcity. Another problem resulting from sugar cane cultivation and sugar
processing activity in India is the pollution of surface and groundwater resources (grey water footprint)
(Solomon, 2005).
The water footprint of France / 37
Rice. Rice has the third largest share in the external blue water footprint of French consumption. In the
following priority basins, rice is identified as one of the major products contributing to blue water scarcity: the
basins of the Indus (Pakistan), Guadalquivir (Spain), Ganges (India), Tigris & Euphrates (Turkey to Iraq),
Mississippi (USA), Krishna (India), Godavari (India), Chao Phraya (Thailand), Cauvery (India), Sacramento
(USA) and Murray (Australia). The Guadalquivir is Spain’s second longest river. Its natural environment is one
of the most varied in Europe. Its middle reaches flow through a populous fertile region where its water is used
extensively for irrigation. The lower course of the Guadalquivir is used for rice cultivation. In recent years, mass
tourism and intensive irrigated agriculture in the region are causing over-exploitation of regional aquifers, which
damages the ecosystem of the region (UNEP, 2004). The Guadalquivir marshes are negatively affected due to
agricultural activities. The Guadalquivir is classified as one of the rivers in Europe mostly polluted due to non-
point source emissions from agricultural activities (nitrate and phosphate) (Albiac and Dinar, 2008).
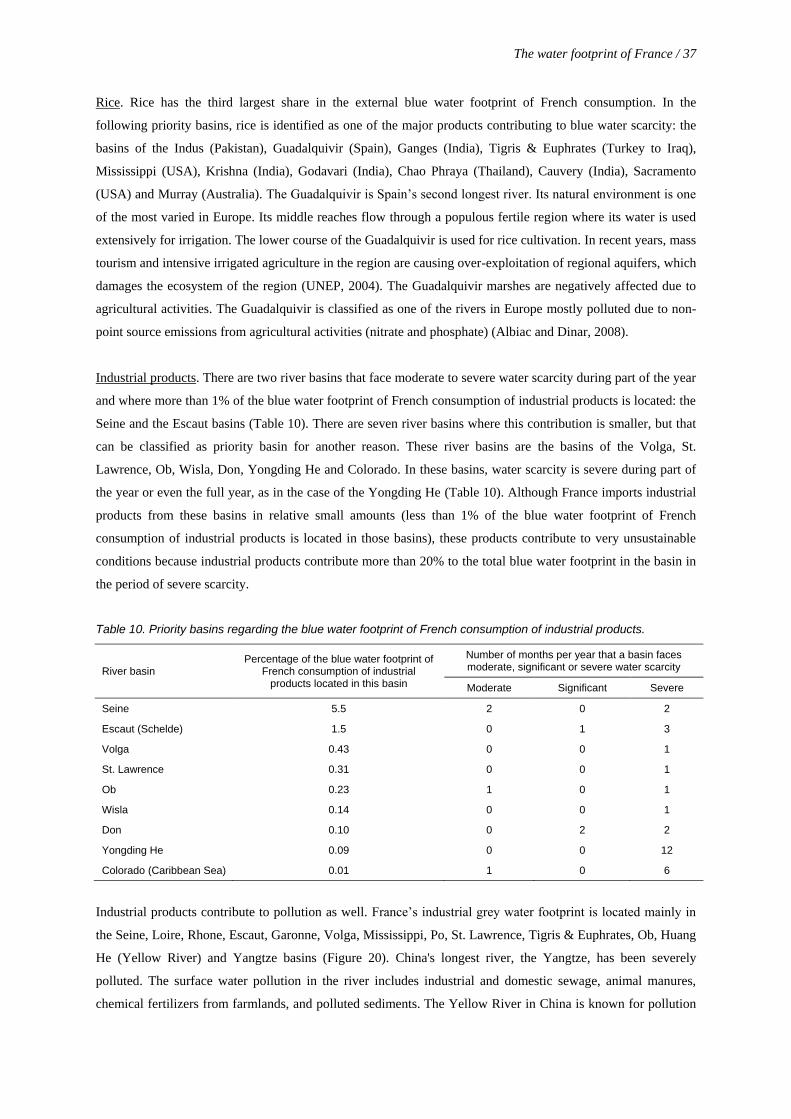
Industrial products. There are two river basins that face moderate to severe water scarcity during part of the year
and where more than 1% of the blue water footprint of French consumption of industrial products is located: the
Seine and the Escaut basins (Table 10). There are seven river basins where this contribution is smaller, but that
can be classified as priority basin for another reason. These river basins are the basins of the Volga, St.
Lawrence, Ob, Wisla, Don, Yongding He and Colorado. In these basins, water scarcity is severe during part of
the year or even the full year, as in the case of the Yongding He (Table 10). Although France imports industrial
products from these basins in relative small amounts (less than 1% of the blue water footprint of French
consumption of industrial products is located in those basins), these products contribute to very unsustainable
conditions because industrial products contribute more than 20% to the total blue water footprint in the basin in
the period of severe scarcity.
Table 10. Priority basins regarding the blue water footprint of French consumption of industrial products.
River basin Percentage of the blue water footprint of
French consumption of industrial products located in this basin
Number of months per year that a basin faces moderate, significant or severe water scarcity
Moderate Significant Severe
Seine 5.5 2 0 2
Escaut (Schelde) 1.5 0 1 3
Volga 0.43 0 0 1
St. Lawrence 0.31 0 0 1
Ob 0.23 1 0 1
Wisla 0.14 0 0 1
Don 0.10 0 2 2
Yongding He 0.09 0 0 12
Colorado (Caribbean Sea) 0.01 1 0 6
Industrial products contribute to pollution as well. France’s industrial grey water footprint is located mainly in
the Seine, Loire, Rhone, Escaut, Garonne, Volga, Mississippi, Po, St. Lawrence, Tigris & Euphrates, Ob, Huang
He (Yellow River) and Yangtze basins (Figure 20). China's longest river, the Yangtze, has been severely
polluted. The surface water pollution in the river includes industrial and domestic sewage, animal manures,
chemical fertilizers from farmlands, and polluted sediments. The Yellow River in China is known for pollution

38 / The water footprint of France
problems as well. According to Chinese government estimates, around two-thirds of the Yellow River's water is
too polluted to drink. Around 30% of fish species in the river are believed to have become extinct and the river's
fish catch has declined by 40% (Fu et al., 2004).
Figure 20. The river basins in the world in which the production of industrial products for French consumption
contributes to moderate, significant or severe blue water scarcity (above) or significant water pollution (below).
5. Discussion and conclusion
This study of the water footprint of national production and consumption for France is more detailed than
previous national water footprint studies (that were carried out for other countries). It builds on the high-
resolution global water footprint study by Hoekstra and Mekonnen (2012) by zooming in on one particular
country. The availability of the global study enabled us to map in a relatively precise way the external water
footprint of French consumption. The study could make use of another recent study on global blue water
scarcity (Hoekstra et al., 2012) to identify which parts of the French external water footprint are located in river
basins that experience moderate to severe blue water scarcity during part of the year. The data that are thus
generated can play a role in revisiting French national water policy. Linking specific consumer products in a
country to water problems elsewhere is still uncommon in governmental thinking about water policy. Making
this link visible can help in setting priorities in either national or international context with respect to the most
effective measures to reduce water footprints in the basins where most needed. The study addresses questions
like: where and when water footprints are largest, where and when they contribute most to local water scarcity
and which specific products contribute most to water footprints and water scarcity? By making the links
between specific consumer products and water problems visible, the study suggests that consumer product
policy can be part of a water policy. The extent to which French government is willing to promote water
footprint reductions in water-scarce basins and periods of the year through product-oriented policies is
obviously a political question. This study shows how a political debate on this topic could be informed by
relevant knowledge on how different products contribute to water scarcity.
Even though the study applies higher spatial and temporal resolutions than previous national water footprint
studies, there are still limitations regarding the spatial and temporal detail, which primarily relate to lacking crop
and irrigation data on even higher resolutions and to the problem of tracing supply chains and trade flows. One
limitation in the study is that the origin of virtual water imports and the external water footprint of consumption
have not been traced further than the first tier trade partners. If a product is imported from a country, we assume
that the product has been produced in that country and we take the water footprint of the imported product
accordingly. Another limitation related to trade data is that the origins of imported commodities are available on
country level and not specified as per river basin or in even more geographic detail. In this study, we assumed
that an imported product originates from the various river basins within the country proportionally to the
production of that product in the various basins.
Another limitation in the study pertains to the problem of distinguishing between different industrial products.
Different crop and animal products have been considered separately, but industrial commodities are treated as
one product group. In future studies it would be worth trying to analyse different industrial sectors and
commodities separately; currently, the major challenge still is the lack of water consumption and pollution data
per industrial sector and the complexity of supply chains for many industrial commodities.
In this study, identification of priority river basins and priority products from the perspective of water resource
use has been done primarily on the basis of data on the levels of blue water scarcity through the year on a river

40 / The water footprint of France
basin level. More precise results would be obtained if we could use water scarcity data on a finer spatial
resolution level, for example at the level of sub-catchments. Especially for identifying hotspots within large
river basins, this would be very helpful. Furthermore, by looking at ‘blue water scarcity’ from an environmental
point of view, we may have neglected social issues of water conflict. For obtaining a more complete overview
of potential critical basins and products, it would be helpful to look at other indicators than environmental water
scarcity alone. It should further be noted that the blue water scarcity estimates used in this study (from Hoekstra
and Mekonnen, 2011; Hoekstra et al., 2012) excluded the evaporation from storage reservoirs and the effect of
inter-basin water transfers. This may result in an underestimation of blue water scarcity in basins with
significant evaporation from large reservoirs and export of water to another basin and an overestimation of
water scarcity in basins that receive significant volumes of water from another basin. The water scarcity
estimates also exclude storage effects of large dams, which means that water scarcity may have been
underestimated in periods of the year in which water is being stored and overestimated in periods of the year in
which the water is being released. Finally, we used a number of criteria to identify priority basins, with certain
thresholds (like the threshold of ‘at least 1% of the total blue water footprint should be located in the basin’) that
can be considered as subjective choices. Obviously, changing thresholds will lead to longer or shorter lists of
‘priority basins’.
Despite the limitations of the study, it has been proven that it is possible to make a rough sketch of where
different economic sectors contribute to scarcity within the country and of which consumer goods contribute to
water scarcity in specific river basins outside the country. The study shows that analysis of the external water
footprint of a nation is necessary to get a picture of how national consumption depends on foreign water
resources.

References
AEAG (ed.) (2011) Suivi de l'étiage sur le bassin Adour-Garonne, Adour-Garonne Water Agency, Toulouse,
France.
Akbar, N. M., and M. A. Khwaja (2006) Study on effluents from selected sugar mills in Pakistan: Potential
environmental, health, and economic consequences of an excessive pollution load, Sustainable
Development Policy Institute, Islamabad, Pakistan.
Albiac, J., and A. Dinar (2008) The management of water quality and irrigation technologies, Earthscan, UK.
Bulsink, F., A. Y. Hoekstra, and M. J. Booij (2010) The water footprint of Indonesian provinces related to the
consumption of crop products, Hydrology and Earth System Sciences, 14(1): 119-128.
Cai, X., D. C. McKinney, and M. W. Rosegrant (2003) Sustainability analysis for irrigation water management
in the Aral Sea region, Agricultural Systems, 76(3): 1043-1066.
Chapagain, A.K. and Hoekstra, A.Y. (2008) The global component of freshwater demand and supply: An
assessment of virtual water flows between nations as a result of trade in agricultural and industrial
products, Water International, 33(1): 19-32.
Chapagain, A. K., and S. Orr (2008) UK water footprint: The impact of the UK's food and fibre consumption on
global water resources, WWF-UK, Godalming, UK.
Chapagain, A. K., and S. Orr (2009) An improved water footprint methodology linking global consumption to
local water resources: A case of Spanish tomatoes, Journal of Environmental Management, 90(2): 1219-
1228.
Chartres, C., and J. Williams (2006) Can Australia Overcome its Water Scarcity Problems?, Journal of
Developments in Sustainable Agriculture, 1(1): 17-24.
Devault, D. A., G. Merlina, P. Lim, J.-L. Probst, and E. Pinelli (2007) Multi-residues analysis of pre-emergence
herbicides in fluvial sediments: application to the mid-Garonne River, Journal of Environmental
Monitoring, 9(9): 1009-1017.
Fu, G., S. Chen, and C. Liu (2004) Water crisis in the Huang Ho (Yellow) River: Facts, reasons, impacts, and
countermeasures, 7th International River symposium, Brisbane, Australia.
Garrido, A., M. R. Llamas, C. Varela-Ortega, P. Novo, R. Rodríguez-Casado, and M. M. Aldaya (2010) Water
footprint and virtual water trade in Spain, Springer, New York, USA.
Glantz, M. H. (1999) Creeping environmental problems and sustainable development in the Aral Sea Basin,
Cambridge University Press., Cambridge, UK.
Grousset, F. E., J. M. Jouanneau, P. Castaing, G. Lavaux, and C. Latouche (1999) A 70 year Record of
Contamination from Industrial Activity Along the Garonne River and its Tributaries (SW France),
Estuarine, Coastal and Shelf Science, 48(3): 401-414.
Hoekstra, A.Y. and A.K. Chapagain (2007) Water footprints of nations: Water use by people as a function of
their consumption pattern, Water Resources Management, 21(1): 35-48.
Hoekstra, A.Y., A.K. Chapagain, M.M. Aldaya, and M.M. Mekonnen (2011) The water footprint assessment
manual: Setting the global standard, Earthscan, London, UK.
42 / The water footprint of France
Hoekstra, A.Y. and M.M. Mekonnen (2011) Global water scarcity: monthly blue water footprint compared to
blue water availability for the world’s major river basins, Value of Water Research Report Series No.53,
UNESCO-IHE, Delft, the Netherlands.
Hoekstra, A.Y. and Mekonnen, M.M. (2012) The water footprint of humanity, Proceedings of the National
Academy of Sciences, doi/10.1073/pnas.1109936109.
Hoekstra, A.Y., Mekonnen, M.M., Chapagain, A.K., Mathews, R.E. and Richter, B.D. (2012) Global monthly
water scarcity: Blue water footprints versus blue water availability, PLoS ONE 7(2): e32688.
Hubacek, K., D. B. Guan, J. Barrett, and T. Wiedmann (2009) Environmental implications of urbanization and
lifestyle change in China: Ecological and water footprints, Journal of Cleaner Production, 17(14): 1241-
1248.
Kampman, D. A., A. Y. Hoekstra, and M. S. Krol (2008) The water footprint of India, Value of Water Research
Report Series No.32, UNESCO-IHE, Delft, the Netherlands.
Ma, J., A. Y. Hoekstra, H. Wang, A. K. Chapagain, and D. Wang (2006) Virtual versus real water transfers
within China, Philosophical Transactions of the Royal Society B: Biological Sciences, 361(1469): 835-
842.
Mekonnen, M. M., and A. Y. Hoekstra (2010a) The green, blue and grey water footprint of crops and derived
crop products, Value of Water Research Report Series No.47, UNESCO-IHE, Delft, the Netherlands.
Mekonnen, M. M., and A. Y. Hoekstra (2010b) The green, blue and grey water footprint of farm animals and
animal products, Value of Water Research Report Series No.48, UNESCO-IHE, Delft, the Netherlands.
Mekonnen, M.M. and Hoekstra, A.Y. (2011a) The green, blue and grey water footprint of crops and derived
crop products, Hydrology and Earth System Sciences, 15(5): 1577-1600.
Mekonnen, M. M., and A. Y. Hoekstra (2011b) National water footprint accounts: the green, blue and grey
water footprint of production and consumption, Value of Water Research Report Series No.50,
UNESCO-IHE, Delft, the Netherlands.
Mekonnen, M.M. and Hoekstra, A.Y. (2012) A global assessment of the water footprint of farm animal
products, Ecosystems, doi: 10.1007/s10021-011-9517-8.
Micklin, P. P. (1988) Desiccation of the Aral Sea: A Water Management Disaster in the Soviet Union, Science,
241(4870): 1170-1176.
Solomon, S. (2005) Environmental pollution and its management in sugar industry in India: An appraisal, Sugar
Tech, 7(1): 77-81.
Sonnenberg, A., A. Chapagain, M. Geiger, and D. August (2009) Der Wasser-Fußabdruck Deutschlands: Woher
stammt das Wasser, das in unseren Lebensmitteln steckt?, WWF Deutschland, Frankfurt.
UNEP (2004) Freshwater in Europe, United Nations Environment Programme DEWA/GRID Europe, Geneva,
Switzerland.
UNESCO (2006) Water, a shared responsibility: The United Nations world water development report 2, United
Nations Educational, Scientific, and Cultural Organization, Paris, France.
Van Oel, P. R., M. M. Mekonnen, and A. Y. Hoekstra (2009) The external water footprint of the Netherlands:
Geographically-explicit quantification and impact assessment, Ecological Economics, 69(1): 82-92.
Vincent, D., A. K. De Caritat, S. Stijn Bruers, A. Chapagain, P. Weiler, and A. Laurent (2011) Belgium and its
water footprint, WWF-Belgium, Brussels, Belgium.
The water footprint of France / 43
WWF (2004) Sugar and the environment: Encouraging better management practices in sugar production, WWF
Global Freshwater Programme, WWF, Zeist, The Netherlands.
Zhao, X., B. Chen, and Z. F. Yang (2009) National water footprint in an input-output framework - A case study
of China 2002, Ecological Modelling, 220(2): 245-253.

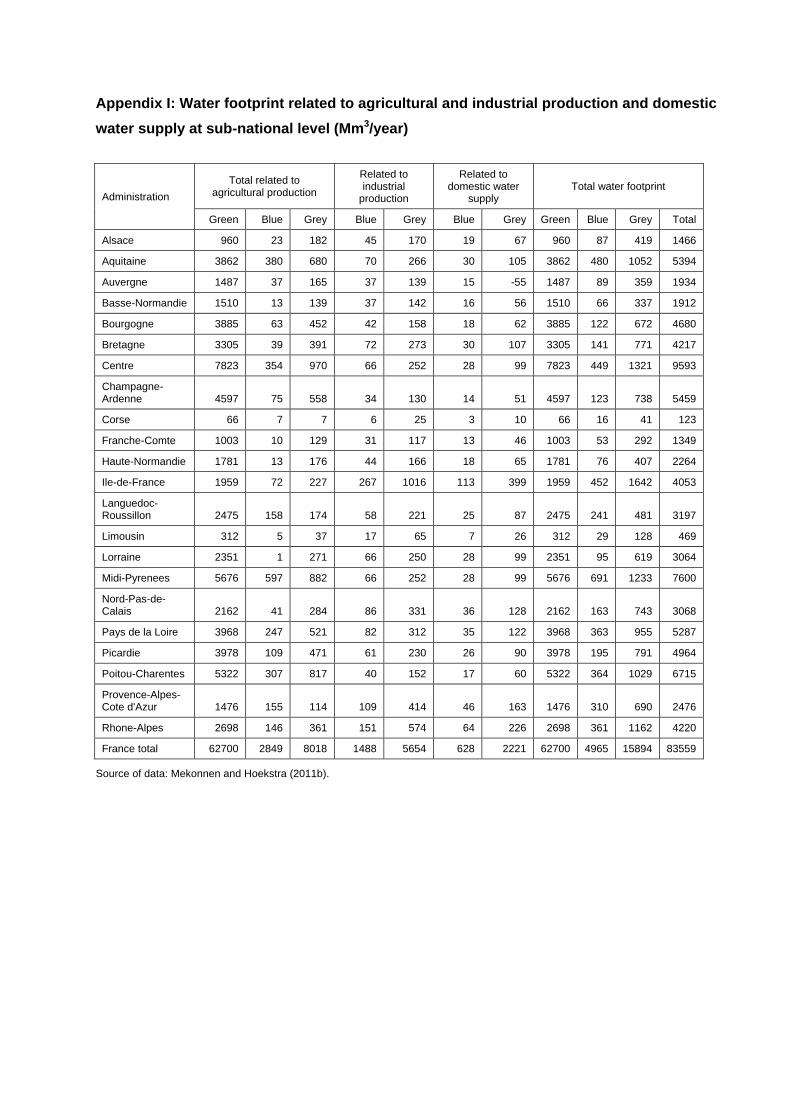
Appendix I: Water footprint related to agricultural and industrial production and domestic
water supply at sub-national level (Mm3/year)
Administration
Total related to agricultural production
Related to industrial
production
Related to domestic water
supply Total water footprint
Green Blue Grey Blue Grey Blue Grey Green Blue Grey Total
Alsace 960 23 182 45 170 19 67 960 87 419 1466
Aquitaine 3862 380 680 70 266 30 105 3862 480 1052 5394
Auvergne 1487 37 165 37 139 15 -55 1487 89 359 1934
Basse-Normandie 1510 13 139 37 142 16 56 1510 66 337 1912
Bourgogne 3885 63 452 42 158 18 62 3885 122 672 4680
Bretagne 3305 39 391 72 273 30 107 3305 141 771 4217
Centre 7823 354 970 66 252 28 99 7823 449 1321 9593
Champagne-Ardenne 4597 75 558 34 130 14 51 4597 123 738 5459
Corse 66 7 7 6 25 3 10 66 16 41 123
Franche-Comte 1003 10 129 31 117 13 46 1003 53 292 1349
Haute-Normandie 1781 13 176 44 166 18 65 1781 76 407 2264
Ile-de-France 1959 72 227 267 1016 113 399 1959 452 1642 4053
Languedoc-Roussillon 2475 158 174 58 221 25 87 2475 241 481 3197
Limousin 312 5 37 17 65 7 26 312 29 128 469
Lorraine 2351 1 271 66 250 28 99 2351 95 619 3064
Midi-Pyrenees 5676 597 882 66 252 28 99 5676 691 1233 7600
Nord-Pas-de-Calais 2162 41 284 86 331 36 128 2162 163 743 3068
Pays de la Loire 3968 247 521 82 312 35 122 3968 363 955 5287
Picardie 3978 109 471 61 230 26 90 3978 195 791 4964
Poitou-Charentes 5322 307 817 40 152 17 60 5322 364 1029 6715
Provence-Alpes-Cote d'Azur 1476 155 114 109 414 46 163 1476 310 690 2476
Rhone-Alpes 2698 146 361 151 574 64 226 2698 361 1162 4220
France total 62700 2849 8018 1488 5654 628 2221 62700 4965 15894 83559
Source of data: Mekonnen and Hoekstra (2011b).
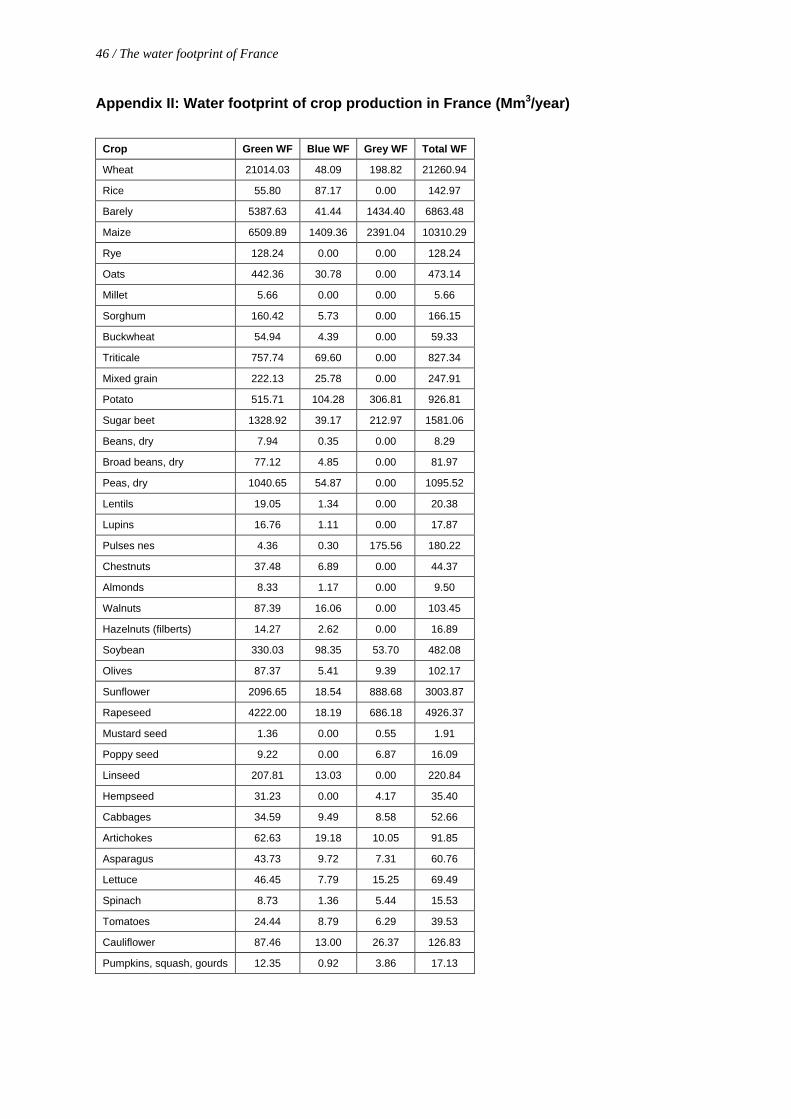
46 / The water footprint of France
Appendix II: Water footprint of crop production in France (Mm3/year)
Crop Green WF Blue WF Grey WF Total WF
Wheat 21014.03 48.09 198.82 21260.94
Rice 55.80 87.17 0.00 142.97
Barely 5387.63 41.44 1434.40 6863.48
Maize 6509.89 1409.36 2391.04 10310.29
Rye 128.24 0.00 0.00 128.24
Oats 442.36 30.78 0.00 473.14
Millet 5.66 0.00 0.00 5.66
Sorghum 160.42 5.73 0.00 166.15
Buckwheat 54.94 4.39 0.00 59.33
Triticale 757.74 69.60 0.00 827.34
Mixed grain 222.13 25.78 0.00 247.91
Potato 515.71 104.28 306.81 926.81
Sugar beet 1328.92 39.17 212.97 1581.06
Beans, dry 7.94 0.35 0.00 8.29
Broad beans, dry 77.12 4.85 0.00 81.97
Peas, dry 1040.65 54.87 0.00 1095.52
Lentils 19.05 1.34 0.00 20.38
Lupins 16.76 1.11 0.00 17.87
Pulses nes 4.36 0.30 175.56 180.22
Chestnuts 37.48 6.89 0.00 44.37
Almonds 8.33 1.17 0.00 9.50
Walnuts 87.39 16.06 0.00 103.45
Hazelnuts (filberts) 14.27 2.62 0.00 16.89
Soybean 330.03 98.35 53.70 482.08
Olives 87.37 5.41 9.39 102.17
Sunflower 2096.65 18.54 888.68 3003.87
Rapeseed 4222.00 18.19 686.18 4926.37
Mustard seed 1.36 0.00 0.55 1.91
Poppy seed 9.22 0.00 6.87 16.09
Linseed 207.81 13.03 0.00 220.84
Hempseed 31.23 0.00 4.17 35.40
Cabbages 34.59 9.49 8.58 52.66
Artichokes 62.63 19.18 10.05 91.85
Asparagus 43.73 9.72 7.31 60.76
Lettuce 46.45 7.79 15.25 69.49
Spinach 8.73 1.36 5.44 15.53
Tomatoes 24.44 8.79 6.29 39.53
Cauliflower 87.46 13.00 26.37 126.83
Pumpkins, squash, gourds 12.35 0.92 3.86 17.13

The water footprint of France / 47
Appendix II - continued
Source of data: Mekonnen and Hoekstra (2010a).
Crop Green WF Blue WF Grey WF Total WF
Cucumbers and gherkins 3.33 0.69 0.91 4.93
Eggplants 1.74 0.54 0.49 2.77
Chillies and peppers, green 2.22 0.72 0.65 3.59
Onions + shallots, green 3.48 0.57 2.02 6.07
Onions 34.81 14.30 8.05 57.16
Garlic 9.45 0.32 3.84 13.61
Beans, green 18.24 2.28 8.10 28.62
Peas, green 78.92 11.49 28.28 118.68
String beans 79.91 8.96 29.47 118.33
Carrots 49.06 15.70 13.56 78.32
Green maize (corn) 80.02 29.81 22.61 132.44
Vegetables fresh nes 550.83 225.51 178.48 954.82
Oranges 0.25 0.02 0.01 0.27
Tangerine, mandarin, clement, satsma 9.21 0.82 0.22 10.24
Lemons and limes 0.19 0.02 0.00 0.21
Grapefruit and pomelos 1.62 0.14 0.04 1.80
Apples 361.94 61.78 7.28 430.99
Pears 66.59 11.37 1.34 79.29
Apricots 82.76 12.01 1.71 96.48
Cherries 68.88 11.76 1.38 82.03
Peaches and nectarines 118.84 17.24 2.45 138.53
Plums 109.64 18.71 2.20 130.56
Strawberries 11.68 4.23 0.47 16.39
Raspberries 2.31 0.69 0.15 3.15
Currants 5.86 1.19 0.28 7.34
Grapes 3576.66 22.02 95.03 3693.72
Watermelons 0.76 0.17 0.03 0.95
Cantaloupes and other melons 43.60 2.78 1.83 48.21
Figs 2.14 0.19 0.05 2.39
Avocados 0.10 0.02 0.00 0.12
Kiwi fruit 20.03 6.89 0.46 27.38
Hops 2.46 0.25 0.00 2.71
Flax fibre and tow 248.05 23.88 0.00 271.93
Hemp fibre and tow (hemp tow waste) 3.04 0.00 0.00 3.04
Tobacco 25.72 0.00 0.00 25.72
Fodder crops 11822.99 162.87 1154.74 13140.60
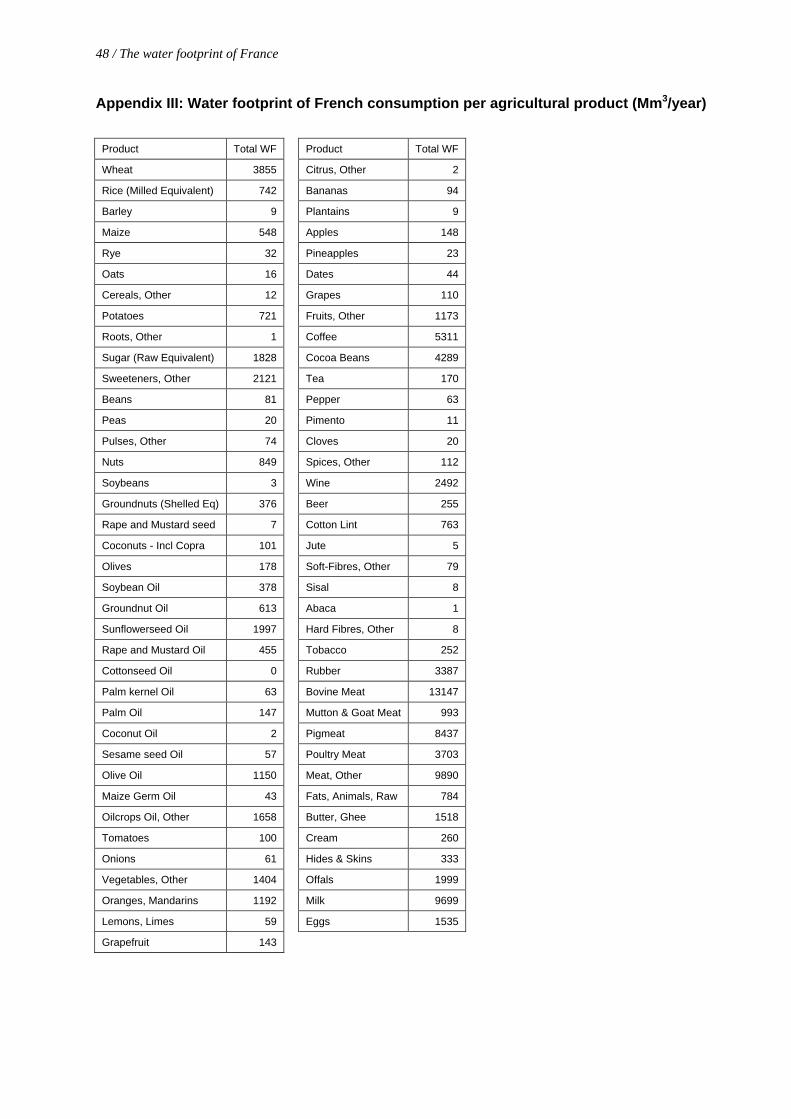
48 / The water footprint of France
Appendix III: Water footprint of French consumption per agricultural product (Mm3/year)
Product Total WF Product Total WF
Wheat 3855 Citrus, Other 2
Rice (Milled Equivalent) 742 Bananas 94
Barley 9 Plantains 9
Maize 548 Apples 148
Rye 32 Pineapples 23
Oats 16 Dates 44
Cereals, Other 12 Grapes 110
Potatoes 721 Fruits, Other 1173
Roots, Other 1 Coffee 5311
Sugar (Raw Equivalent) 1828 Cocoa Beans 4289
Sweeteners, Other 2121 Tea 170
Beans 81 Pepper 63
Peas 20 Pimento 11
Pulses, Other 74 Cloves 20
Nuts 849 Spices, Other 112
Soybeans 3 Wine 2492
Groundnuts (Shelled Eq) 376 Beer 255
Rape and Mustard seed 7 Cotton Lint 763
Coconuts - Incl Copra 101 Jute 5
Olives 178 Soft-Fibres, Other 79
Soybean Oil 378 Sisal 8
Groundnut Oil 613 Abaca 1
Sunflowerseed Oil 1997 Hard Fibres, Other 8
Rape and Mustard Oil 455 Tobacco 252
Cottonseed Oil 0 Rubber 3387
Palm kernel Oil 63 Bovine Meat 13147
Palm Oil 147 Mutton & Goat Meat 993
Coconut Oil 2 Pigmeat 8437
Sesame seed Oil 57 Poultry Meat 3703
Olive Oil 1150 Meat, Other 9890
Maize Germ Oil 43 Fats, Animals, Raw 784
Oilcrops Oil, Other 1658 Butter, Ghee 1518
Tomatoes 100 Cream 260
Onions 61 Hides & Skins 333
Vegetables, Other 1404 Offals 1999
Oranges, Mandarins 1192 Milk 9699
Lemons, Limes 59 Eggs 1535
Grapefruit 143

Appendix IV: Water footprint of French consumers in major river basins experiencing moderate to severe water scarcity during part of the year
River basin Countries partly or fully laying with the basin
Water footprint related to consumption of agricultural products (m
3/year)
Water footprint related to consumption of industrial
products (m3/year)
Water footprint related to domestic water supply
(m3/year)
Total water footprint (m3/year)
Number of months per year that the basin faces low, moderate, significant
or severe blue water scarcity
Green Blue Grey Blue Grey Blue Grey Green Blue Grey Total Low Moderate Significant Severe
Loire France 8559040000 263409000 836010000 115075000 115075000 82492400 291783000 8559040000 460976400 1242868000 10262884400 10 0 2 0
Seine France; Belgium 7989540000 132653000 730690000 229302000 229302000 164233000 580905000 7989540000 526188000 1540897000 10056625000 8 2 0 2
Garonne France; Spain; Andorra 4389030000 323881000 532352000 48532800 48527000 34776800 123009000 4389030000 407190600 703888000 5500108600 9 1 1 1
Escaut (Schelde) Netherlands; France; Belgium 4158710000 265554000 300067000 60719800 60719800 24962800 88295500 4158710000 351236600 449082300 4959028900 8 0 1 3
Ganges China; Nepal; India; Bangladesh 702169000 130319000 78960200 3193040 3193040 0 0 702169000 133512040 82153240 917834280 5 0 2 5
Bandama Mali; Côte d'Ivoire 778226000 12331500 1736200 11460 11460 0 0 778226000 12342960 1747660 792316621 10 0 0 2
Douro Spain; Portugal 485383000 76840400 52581500 2022670 528516 0 0 485383000 78863070 53110016 617356086 7 2 0 3
Guadalquivir Spain 399577000 177397000 21335900 2468560 0 0 0 399577000 179865560 21335900 600778460 5 1 0 6
Po France; Switzerland; Italy 423319000 94587900 43856000 14541500 14541500 222123 785668 423319000 109351523 59183168 591853691 10 2 0 0
Indus China; Afghanistan; Pakistan; Nepal; India 259373000 229318000 71196900 1685980 1685980 0 0 259373000 231003980 72882880 563259860 0 1 3 8
Ebro France; Spain; Andorra 427588000 82987100 39667600 2000360 187891 134691 476413 427588000 85122151 40331904 553042055 9 0 0 3
Mississippi USA; Canada 413629000 35466700 63379100 15737500 15737500 0 0 413629000 51204200 79116600 543949800 8 2 0 2
Niger Algeria; Mauritania; Mali; Niger; Chad; Burkina Faso; Nigeria; Guinea; Côte d'Ivoire; Sierra Leone; , Benin; Cameroon
496501000 3805570 1195930 694960 694960 0 0 496501000 4500530 1890890 502892420 10 0 0 2
Sassandra Guinea; Côte d'Ivoire 490897000 4618890 881639 9634 9634 0 0 490897000 4628524 891273 496416796 10 0 0 2
Guadiana Spain; Portugal 345241000 106266000 32798000 943656 95070 0 0 345241000 107209656 32893070 485343726 5 1 0 6
Volta Mali; Burkina Faso; Togo; Côte d'Ivoire; Benin; Ghana
472681000 1021280 865438 35693 35693 0 0 472681000 1056973 901131 474639104 11 0 0 1
Aral Sea basin Kazakhstan; Uzbekistan; Kyrgyzstan; Turkmenistan; Tajikistan; China; Afghanistan; Pakistan
63022300 379939000 749906 1700440 1700440 0 0 63022300 381639440 2450346 447112086 7 1 0 4
Tejo Spain; Portugal 249307000 60763300 25394900 4146590 278174 0 0 249307000 64909890 25673074 339889964 7 1 0 4
Salado Argentina 325531000 336892 3136130 7156 7156 0 0 325531000 344048 3143286 329018334 11 0 0 1
Nile Egypt; Sudan; Eritrea; Ethiopia; Central African Republic; Congo, Dem Republic of; Kenya; Uganda; Tanzania; Rwanda; Burundi
237133000 45426100 8254080 628913 628913 0 0 237133000 46055013 8882993 292071006 10 0 0 2
Mekong China; Myanmar; Viet Nam; Laos; Thailand; Cambodia
247914000 6133570 30184800 2949750 2949750 0 0 247914000 9083320 33134550 290131870 8 1 0 3
Sanaga Nigeria; Central African Republic; Cameroon 288027000 71242 459781 55035 55035 0 0 288027000 126277 514816 288668093 11 0 0 1
Comoe Mali; Burkina Faso; Côte d'Ivoire; Ghana 280960000 4616420 721360 6142 6142 0 0 280960000 4622562 727502 286310063 10 0 0 2
Krishna India 227511000 26774100 12254200 602074 602074 0 0 227511000 27376174 12856274 267743448 3 1 1 7
continued on next page
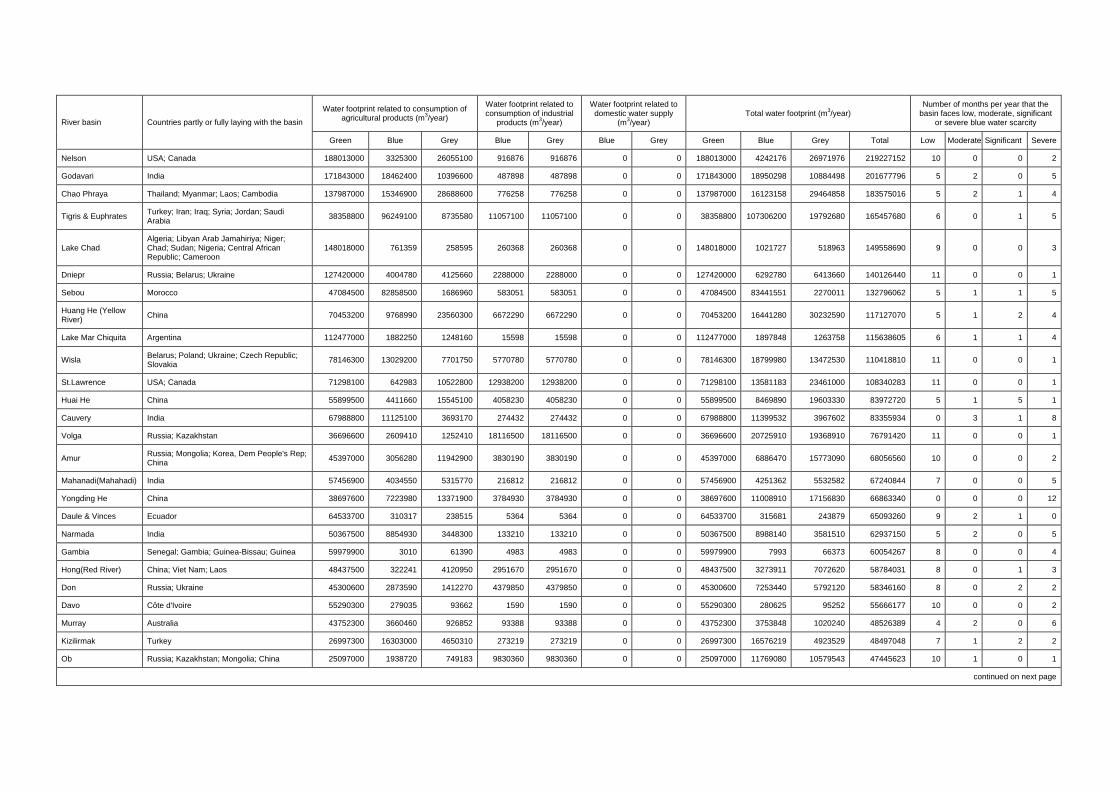
River basin Countries partly or fully laying with the basin
Water footprint related to consumption of agricultural products (m
3/year)
Water footprint related to consumption of industrial
products (m3/year)
Water footprint related to domestic water supply
(m3/year)
Total water footprint (m3/year)
Number of months per year that the basin faces low, moderate, significant
or severe blue water scarcity
Green Blue Grey Blue Grey Blue Grey Green Blue Grey Total Low Moderate Significant Severe
Nelson USA; Canada 188013000 3325300 26055100 916876 916876 0 0 188013000 4242176 26971976 219227152 10 0 0 2
Godavari India 171843000 18462400 10396600 487898 487898 0 0 171843000 18950298 10884498 201677796 5 2 0 5
Chao Phraya Thailand; Myanmar; Laos; Cambodia 137987000 15346900 28688600 776258 776258 0 0 137987000 16123158 29464858 183575016 5 2 1 4
Tigris & Euphrates Turkey; Iran; Iraq; Syria; Jordan; Saudi Arabia
38358800 96249100 8735580 11057100 11057100 0 0 38358800 107306200 19792680 165457680 6 0 1 5
Lake Chad Algeria; Libyan Arab Jamahiriya; Niger; Chad; Sudan; Nigeria; Central African Republic; Cameroon
148018000 761359 258595 260368 260368 0 0 148018000 1021727 518963 149558690 9 0 0 3
Dniepr Russia; Belarus; Ukraine 127420000 4004780 4125660 2288000 2288000 0 0 127420000 6292780 6413660 140126440 11 0 0 1
Sebou Morocco 47084500 82858500 1686960 583051 583051 0 0 47084500 83441551 2270011 132796062 5 1 1 5
Huang He (Yellow River)
China 70453200 9768990 23560300 6672290 6672290 0 0 70453200 16441280 30232590 117127070 5 1 2 4
Lake Mar Chiquita Argentina 112477000 1882250 1248160 15598 15598 0 0 112477000 1897848 1263758 115638605 6 1 1 4
Wisla Belarus; Poland; Ukraine; Czech Republic; Slovakia
78146300 13029200 7701750 5770780 5770780 0 0 78146300 18799980 13472530 110418810 11 0 0 1
St.Lawrence USA; Canada 71298100 642983 10522800 12938200 12938200 0 0 71298100 13581183 23461000 108340283 11 0 0 1
Huai He China 55899500 4411660 15545100 4058230 4058230 0 0 55899500 8469890 19603330 83972720 5 1 5 1
Cauvery India 67988800 11125100 3693170 274432 274432 0 0 67988800 11399532 3967602 83355934 0 3 1 8
Volga Russia; Kazakhstan 36696600 2609410 1252410 18116500 18116500 0 0 36696600 20725910 19368910 76791420 11 0 0 1
Amur Russia; Mongolia; Korea, Dem People's Rep; China
45397000 3056280 11942900 3830190 3830190 0 0 45397000 6886470 15773090 68056560 10 0 0 2
Mahanadi(Mahahadi) India 57456900 4034550 5315770 216812 216812 0 0 57456900 4251362 5532582 67240844 7 0 0 5
Yongding He China 38697600 7223980 13371900 3784930 3784930 0 0 38697600 11008910 17156830 66863340 0 0 0 12
Daule & Vinces Ecuador 64533700 310317 238515 5364 5364 0 0 64533700 315681 243879 65093260 9 2 1 0
Narmada India 50367500 8854930 3448300 133210 133210 0 0 50367500 8988140 3581510 62937150 5 2 0 5
Gambia Senegal; Gambia; Guinea-Bissau; Guinea 59979900 3010 61390 4983 4983 0 0 59979900 7993 66373 60054267 8 0 0 4
Hong(Red River) China; Viet Nam; Laos 48437500 322241 4120950 2951670 2951670 0 0 48437500 3273911 7072620 58784031 8 0 1 3
Don Russia; Ukraine 45300600 2873590 1412270 4379850 4379850 0 0 45300600 7253440 5792120 58346160 8 0 2 2
Davo Côte d'Ivoire 55290300 279035 93662 1590 1590 0 0 55290300 280625 95252 55666177 10 0 0 2
Murray Australia 43752300 3660460 926852 93388 93388 0 0 43752300 3753848 1020240 48526389 4 2 0 6
Kizilirmak Turkey 26997300 16303000 4650310 273219 273219 0 0 26997300 16576219 4923529 48497048 7 1 2 2
Ob Russia; Kazakhstan; Mongolia; China 25097000 1938720 749183 9830360 9830360 0 0 25097000 11769080 10579543 47445623 10 1 0 1
continued on next page
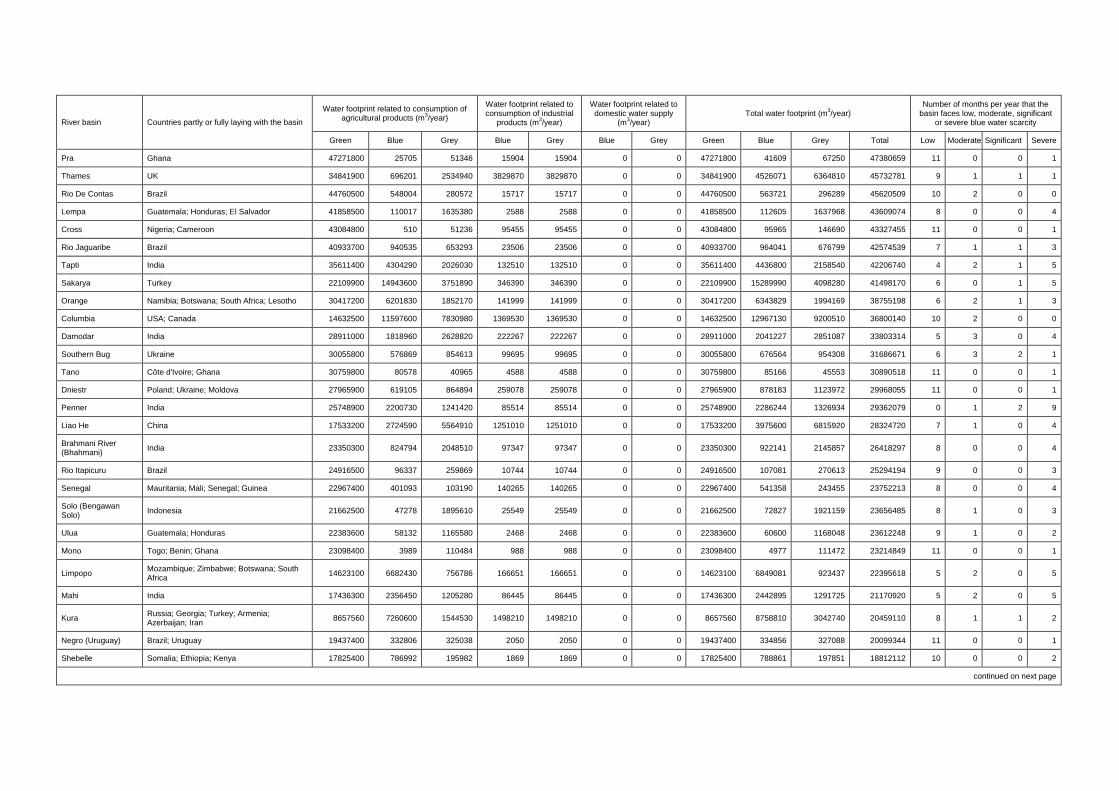
River basin Countries partly or fully laying with the basin
Water footprint related to consumption of agricultural products (m
3/year)
Water footprint related to consumption of industrial
products (m3/year)
Water footprint related to domestic water supply
(m3/year)
Total water footprint (m3/year)
Number of months per year that the basin faces low, moderate, significant
or severe blue water scarcity
Green Blue Grey Blue Grey Blue Grey Green Blue Grey Total Low Moderate Significant Severe
Pra Ghana 47271800 25705 51346 15904 15904 0 0 47271800 41609 67250 47380659 11 0 0 1
Thames UK 34841900 696201 2534940 3829870 3829870 0 0 34841900 4526071 6364810 45732781 9 1 1 1
Rio De Contas Brazil 44760500 548004 280572 15717 15717 0 0 44760500 563721 296289 45620509 10 2 0 0
Lempa Guatemala; Honduras; El Salvador 41858500 110017 1635380 2588 2588 0 0 41858500 112605 1637968 43609074 8 0 0 4
Cross Nigeria; Cameroon 43084800 510 51236 95455 95455 0 0 43084800 95965 146690 43327455 11 0 0 1
Rio Jaguaribe Brazil 40933700 940535 653293 23506 23506 0 0 40933700 964041 676799 42574539 7 1 1 3
Tapti India 35611400 4304290 2026030 132510 132510 0 0 35611400 4436800 2158540 42206740 4 2 1 5
Sakarya Turkey 22109900 14943600 3751890 346390 346390 0 0 22109900 15289990 4098280 41498170 6 0 1 5
Orange Namibia; Botswana; South Africa; Lesotho 30417200 6201830 1852170 141999 141999 0 0 30417200 6343829 1994169 38755198 6 2 1 3
Columbia USA; Canada 14632500 11597600 7830980 1369530 1369530 0 0 14632500 12967130 9200510 36800140 10 2 0 0
Damodar India 28911000 1818960 2628820 222267 222267 0 0 28911000 2041227 2851087 33803314 5 3 0 4
Southern Bug Ukraine 30055800 576869 854613 99695 99695 0 0 30055800 676564 954308 31686671 6 3 2 1
Tano Côte d'Ivoire; Ghana 30759800 80578 40965 4588 4588 0 0 30759800 85166 45553 30890518 11 0 0 1
Dniestr Poland; Ukraine; Moldova 27965900 619105 864894 259078 259078 0 0 27965900 878183 1123972 29968055 11 0 0 1
Penner India 25748900 2200730 1241420 85514 85514 0 0 25748900 2286244 1326934 29362079 0 1 2 9
Liao He China 17533200 2724590 5564910 1251010 1251010 0 0 17533200 3975600 6815920 28324720 7 1 0 4
Brahmani River (Bhahmani)
India 23350300 824794 2048510 97347 97347 0 0 23350300 922141 2145857 26418297 8 0 0 4
Rio Itapicuru Brazil 24916500 96337 259869 10744 10744 0 0 24916500 107081 270613 25294194 9 0 0 3
Senegal Mauritania; Mali; Senegal; Guinea 22967400 401093 103190 140265 140265 0 0 22967400 541358 243455 23752213 8 0 0 4
Solo (Bengawan Solo)
Indonesia 21662500 47278 1895610 25549 25549 0 0 21662500 72827 1921159 23656485 8 1 0 3
Ulua Guatemala; Honduras 22383600 58132 1165580 2468 2468 0 0 22383600 60600 1168048 23612248 9 1 0 2
Mono Togo; Benin; Ghana 23098400 3989 110484 988 988 0 0 23098400 4977 111472 23214849 11 0 0 1
Limpopo Mozambique; Zimbabwe; Botswana; South Africa
14623100 6682430 756786 166651 166651 0 0 14623100 6849081 923437 22395618 5 2 0 5
Mahi India 17436300 2356450 1205280 86445 86445 0 0 17436300 2442895 1291725 21170920 5 2 0 5
Kura Russia; Georgia; Turkey; Armenia; Azerbaijan; Iran
8657560 7260600 1544530 1498210 1498210 0 0 8657560 8758810 3042740 20459110 8 1 1 2
Negro (Uruguay) Brazil; Uruguay 19437400 332806 325038 2050 2050 0 0 19437400 334856 327088 20099344 11 0 0 1
Shebelle Somalia; Ethiopia; Kenya 17825400 786992 195982 1869 1869 0 0 17825400 788861 197851 18812112 10 0 0 2
continued on next page
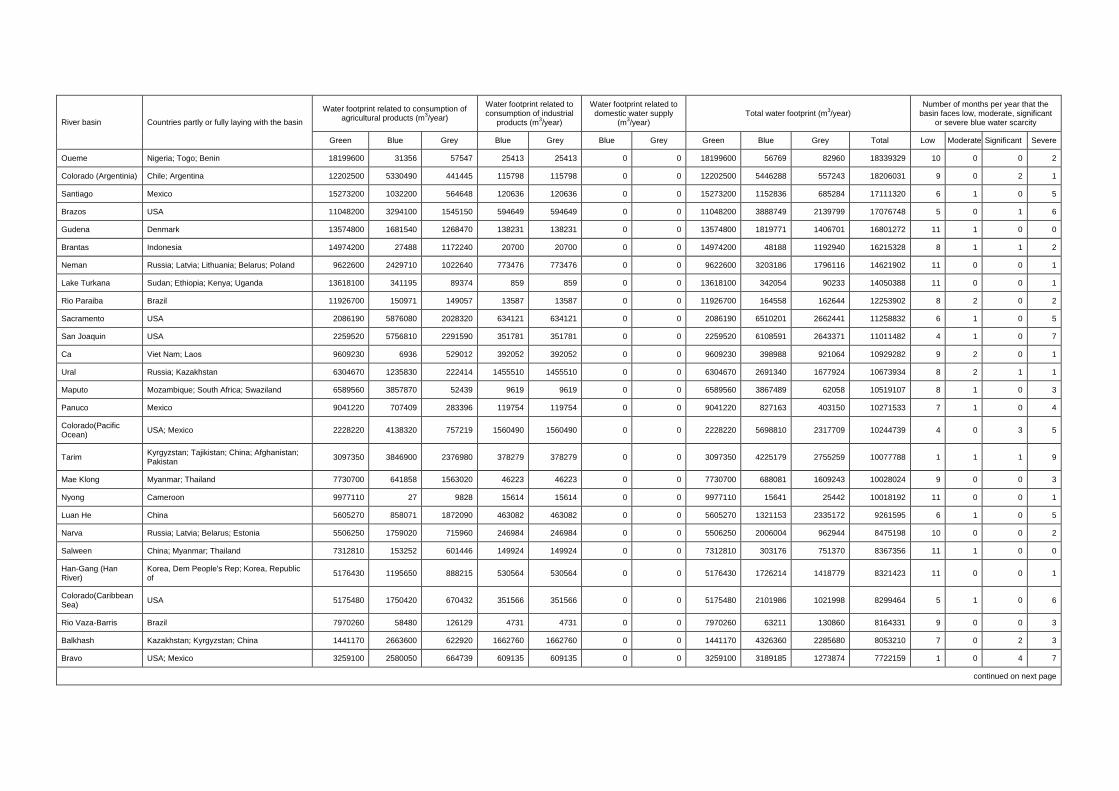
River basin Countries partly or fully laying with the basin
Water footprint related to consumption of agricultural products (m
3/year)
Water footprint related to consumption of industrial
products (m3/year)
Water footprint related to domestic water supply
(m3/year)
Total water footprint (m3/year)
Number of months per year that the basin faces low, moderate, significant
or severe blue water scarcity
Green Blue Grey Blue Grey Blue Grey Green Blue Grey Total Low Moderate Significant Severe
Oueme Nigeria; Togo; Benin 18199600 31356 57547 25413 25413 0 0 18199600 56769 82960 18339329 10 0 0 2
Colorado (Argentinia) Chile; Argentina 12202500 5330490 441445 115798 115798 0 0 12202500 5446288 557243 18206031 9 0 2 1
Santiago Mexico 15273200 1032200 564648 120636 120636 0 0 15273200 1152836 685284 17111320 6 1 0 5
Brazos USA 11048200 3294100 1545150 594649 594649 0 0 11048200 3888749 2139799 17076748 5 0 1 6
Gudena Denmark 13574800 1681540 1268470 138231 138231 0 0 13574800 1819771 1406701 16801272 11 1 0 0
Brantas Indonesia 14974200 27488 1172240 20700 20700 0 0 14974200 48188 1192940 16215328 8 1 1 2
Neman Russia; Latvia; Lithuania; Belarus; Poland 9622600 2429710 1022640 773476 773476 0 0 9622600 3203186 1796116 14621902 11 0 0 1
Lake Turkana Sudan; Ethiopia; Kenya; Uganda 13618100 341195 89374 859 859 0 0 13618100 342054 90233 14050388 11 0 0 1
Rio Paraiba Brazil 11926700 150971 149057 13587 13587 0 0 11926700 164558 162644 12253902 8 2 0 2
Sacramento USA 2086190 5876080 2028320 634121 634121 0 0 2086190 6510201 2662441 11258832 6 1 0 5
San Joaquin USA 2259520 5756810 2291590 351781 351781 0 0 2259520 6108591 2643371 11011482 4 1 0 7
Ca Viet Nam; Laos 9609230 6936 529012 392052 392052 0 0 9609230 398988 921064 10929282 9 2 0 1
Ural Russia; Kazakhstan 6304670 1235830 222414 1455510 1455510 0 0 6304670 2691340 1677924 10673934 8 2 1 1
Maputo Mozambique; South Africa; Swaziland 6589560 3857870 52439 9619 9619 0 0 6589560 3867489 62058 10519107 8 1 0 3
Panuco Mexico 9041220 707409 283396 119754 119754 0 0 9041220 827163 403150 10271533 7 1 0 4
Colorado(Pacific Ocean)
USA; Mexico 2228220 4138320 757219 1560490 1560490 0 0 2228220 5698810 2317709 10244739 4 0 3 5
Tarim Kyrgyzstan; Tajikistan; China; Afghanistan; Pakistan
3097350 3846900 2376980 378279 378279 0 0 3097350 4225179 2755259 10077788 1 1 1 9
Mae Klong Myanmar; Thailand 7730700 641858 1563020 46223 46223 0 0 7730700 688081 1609243 10028024 9 0 0 3
Nyong Cameroon 9977110 27 9828 15614 15614 0 0 9977110 15641 25442 10018192 11 0 0 1
Luan He China 5605270 858071 1872090 463082 463082 0 0 5605270 1321153 2335172 9261595 6 1 0 5
Narva Russia; Latvia; Belarus; Estonia 5506250 1759020 715960 246984 246984 0 0 5506250 2006004 962944 8475198 10 0 0 2
Salween China; Myanmar; Thailand 7312810 153252 601446 149924 149924 0 0 7312810 303176 751370 8367356 11 1 0 0
Han-Gang (Han River)
Korea, Dem People's Rep; Korea, Republic of
5176430 1195650 888215 530564 530564 0 0 5176430 1726214 1418779 8321423 11 0 0 1
Colorado(Caribbean Sea)
USA 5175480 1750420 670432 351566 351566 0 0 5175480 2101986 1021998 8299464 5 1 0 6
Rio Vaza-Barris Brazil 7970260 58480 126129 4731 4731 0 0 7970260 63211 130860 8164331 9 0 0 3
Balkhash Kazakhstan; Kyrgyzstan; China 1441170 2663600 622920 1662760 1662760 0 0 1441170 4326360 2285680 8053210 7 0 2 3
Bravo USA; Mexico 3259100 2580050 664739 609135 609135 0 0 3259100 3189185 1273874 7722159 1 0 4 7
continued on next page
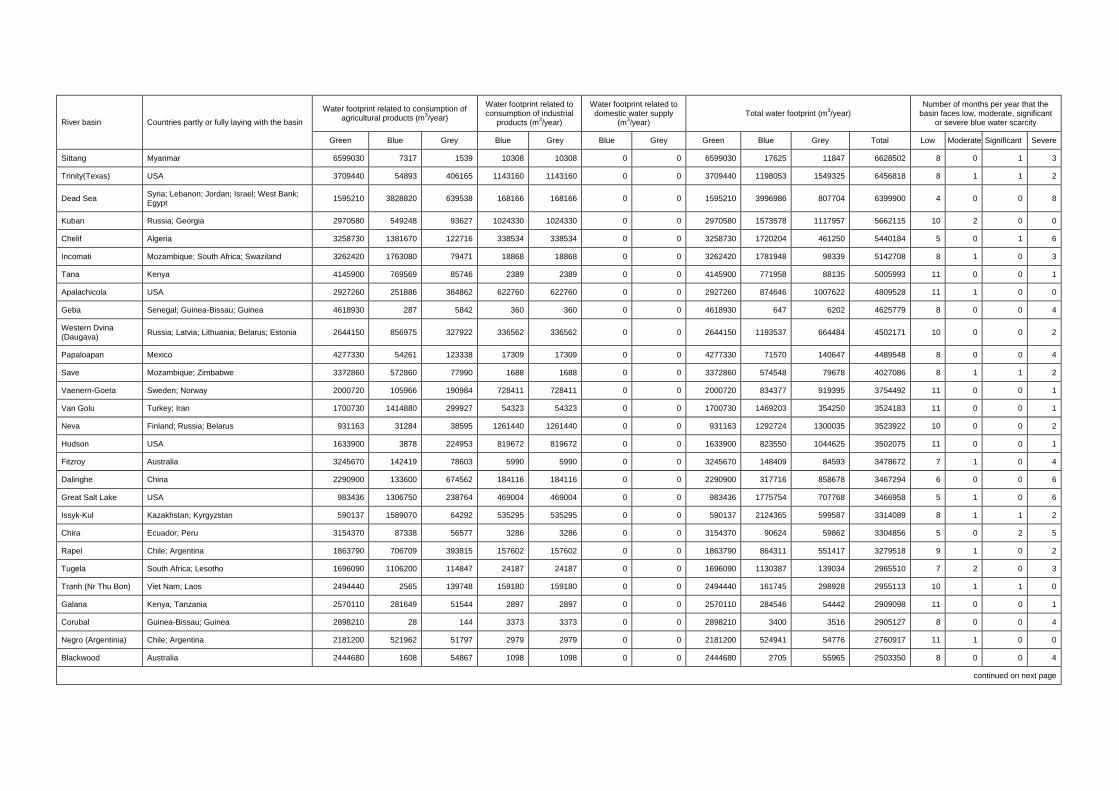
River basin Countries partly or fully laying with the basin
Water footprint related to consumption of agricultural products (m
3/year)
Water footprint related to consumption of industrial
products (m3/year)
Water footprint related to domestic water supply
(m3/year)
Total water footprint (m3/year)
Number of months per year that the basin faces low, moderate, significant
or severe blue water scarcity
Green Blue Grey Blue Grey Blue Grey Green Blue Grey Total Low Moderate Significant Severe
Sittang Myanmar 6599030 7317 1539 10308 10308 0 0 6599030 17625 11847 6628502 8 0 1 3
Trinity(Texas) USA 3709440 54893 406165 1143160 1143160 0 0 3709440 1198053 1549325 6456818 8 1 1 2
Dead Sea Syria; Lebanon; Jordan; Israel; West Bank; Egypt
1595210 3828820 639538 168166 168166 0 0 1595210 3996986 807704 6399900 4 0 0 8
Kuban Russia; Georgia 2970580 549248 93627 1024330 1024330 0 0 2970580 1573578 1117957 5662115 10 2 0 0
Chelif Algeria 3258730 1381670 122716 338534 338534 0 0 3258730 1720204 461250 5440184 5 0 1 6
Incomati Mozambique; South Africa; Swaziland 3262420 1763080 79471 18868 18868 0 0 3262420 1781948 98339 5142708 8 1 0 3
Tana Kenya 4145900 769569 85746 2389 2389 0 0 4145900 771958 88135 5005993 11 0 0 1
Apalachicola USA 2927260 251886 384862 622760 622760 0 0 2927260 874646 1007622 4809528 11 1 0 0
Geba Senegal; Guinea-Bissau; Guinea 4618930 287 5842 360 360 0 0 4618930 647 6202 4625779 8 0 0 4
Western Dvina (Daugava)
Russia; Latvia; Lithuania; Belarus; Estonia 2644150 856975 327922 336562 336562 0 0 2644150 1193537 664484 4502171 10 0 0 2
Papaloapan Mexico 4277330 54261 123338 17309 17309 0 0 4277330 71570 140647 4489548 8 0 0 4
Save Mozambique; Zimbabwe 3372860 572860 77990 1688 1688 0 0 3372860 574548 79678 4027086 8 1 1 2
Vaenern-Goeta Sweden; Norway 2000720 105966 190984 728411 728411 0 0 2000720 834377 919395 3754492 11 0 0 1
Van Golu Turkey; Iran 1700730 1414880 299927 54323 54323 0 0 1700730 1469203 354250 3524183 11 0 0 1
Neva Finland; Russia; Belarus 931163 31284 38595 1261440 1261440 0 0 931163 1292724 1300035 3523922 10 0 0 2
Hudson USA 1633900 3878 224953 819672 819672 0 0 1633900 823550 1044625 3502075 11 0 0 1
Fitzroy Australia 3245670 142419 78603 5990 5990 0 0 3245670 148409 84593 3478672 7 1 0 4
Dalinghe China 2290900 133600 674562 184116 184116 0 0 2290900 317716 858678 3467294 6 0 0 6
Great Salt Lake USA 983436 1306750 238764 469004 469004 0 0 983436 1775754 707768 3466958 5 1 0 6
Issyk-Kul Kazakhstan; Kyrgyzstan 590137 1589070 64292 535295 535295 0 0 590137 2124365 599587 3314089 8 1 1 2
Chira Ecuador; Peru 3154370 87338 56577 3286 3286 0 0 3154370 90624 59862 3304856 5 0 2 5
Rapel Chile; Argentina 1863790 706709 393815 157602 157602 0 0 1863790 864311 551417 3279518 9 1 0 2
Tugela South Africa; Lesotho 1696090 1106200 114847 24187 24187 0 0 1696090 1130387 139034 2965510 7 2 0 3
Tranh (Nr Thu Bon) Viet Nam; Laos 2494440 2565 139748 159180 159180 0 0 2494440 161745 298928 2955113 10 1 1 0
Galana Kenya; Tanzania 2570110 281649 51544 2897 2897 0 0 2570110 284546 54442 2909098 11 0 0 1
Corubal Guinea-Bissau; Guinea 2898210 28 144 3373 3373 0 0 2898210 3400 3516 2905127 8 0 0 4
Negro (Argentinia) Chile; Argentina 2181200 521962 51797 2979 2979 0 0 2181200 524941 54776 2760917 11 1 0 0
Blackwood Australia 2444680 1608 54867 1098 1098 0 0 2444680 2705 55965 2503350 8 0 0 4
continued on next page

River basin Countries partly or fully laying with the basin
Water footprint related to consumption of agricultural products (m
3/year)
Water footprint related to consumption of industrial
products (m3/year)
Water footprint related to domestic water supply
(m3/year)
Total water footprint (m3/year)
Number of months per year that the basin faces low, moderate, significant
or severe blue water scarcity
Green Blue Grey Blue Grey Blue Grey Green Blue Grey Total Low Moderate Significant Severe
Lake Vattern Sweden 1734390 88928 216996 191491 191491 0 0 1734390 280419 408487 2423296 11 0 0 1
Kokemaenjoki Finland 978324 242556 72477 514860 514860 0 0 978324 757416 587337 2323077 10 0 0 2
Gloma Sweden; Norway 382751 54326 27933 922295 922295 0 0 382751 976621 950228 2309600 11 0 0 1
Pangani Kenya; Tanzania 2021810 61536 40320 224 224 0 0 2021810 61760 40544 2124114 3 3 0 6
Vuoksi Finland; Russia 844322 126925 62080 490237 490237 0 0 844322 617162 552317 2013801 10 0 0 2
Biobio Chile; Argentina 1334110 147146 223812 140288 140288 0 0 1334110 287434 364100 1985644 11 0 0 1
Nueces USA 1131460 322670 232080 129442 129442 0 0 1131460 452112 361522 1945094 0 0 0 12
St.Johns USA 506197 45609 143650 612503 612503 0 0 506197 658112 756153 1920462 10 1 1 0
Santa Peru 1547630 94510 85347 3005 3005 0 0 1547630 97515 88352 1733497 10 0 1 1
Saint John USA; Canada 1223870 3511 289130 69274 69274 0 0 1223870 72786 358404 1655060 10 0 0 2
Groot-Vis South Africa 664002 915882 53567 4094 4094 0 0 664002 919976 57662 1641640 0 0 0 12
Doring South Africa 680064 772479 70969 2289 2289 0 0 680064 774768 73258 1528090 4 0 1 7
Daryacheh-Ye Orumieh
Turkey; Iran; Iraq 531191 681387 141377 73144 73144 0 0 531191 754531 214521 1500242 8 0 1 3
Connecticut USA; Canada 506699 4437 83814 435704 435704 0 0 506699 440141 519518 1466357 11 0 0 1
Armeria Mexico 1241160 106340 42916 3534 3534 0 0 1241160 109874 46450 1397484 5 1 0 6
San Pedro Mexico 1276350 49000 47985 4392 4392 0 0 1276350 53392 52376 1382118 7 0 0 5
Kymijoki Finland 377436 92745 27726 387025 387025 0 0 377436 479770 414751 1271957 10 0 0 2
Klamath USA 424827 600811 172300 28922 28922 0 0 424827 629733 201222 1255781 9 1 2 0
Verde Mexico 1101890 23720 35603 5782 5782 0 0 1101890 29502 41386 1172778 7 1 0 4
San Antonio USA 597821 90236 83795 192974 192974 0 0 597821 283210 276769 1157799 0 0 1 11
Merrimack USA 167181 919 21636 473654 473654 0 0 167181 474573 495290 1137044 11 0 0 1
Yaqui USA; Mexico 664641 283219 63986 9030 9030 0 0 664641 292249 73016 1029906 0 0 0 12
Burdekin Australia 918256 54140 39555 2772 2772 0 0 918256 56912 42327 1017495 10 2 0 0
Gamka South Africa 507000 423381 41425 3818 3818 0 0 507000 427199 45242 979441 7 2 1 2
Salinas USA 271838 275003 265491 64934 64934 0 0 271838 339937 330425 942200 3 1 0 8
Groot- Kei South Africa 510179 243013 27265 11926 11926 0 0 510179 254939 39191 804309 0 0 1 11
Saguenay (Riviere) Canada 636335 603 67224 49347 49347 0 0 636335 49950 116571 802856 10 0 0 2
Dramselv Norway 75671 7495 5234 343205 343205 0 0 75671 350700 348439 774810 11 0 0 1
Fuerte Mexico 493727 158586 25466 2991 2991 0 0 493727 161577 28457 683762 7 2 0 3
continued on next page
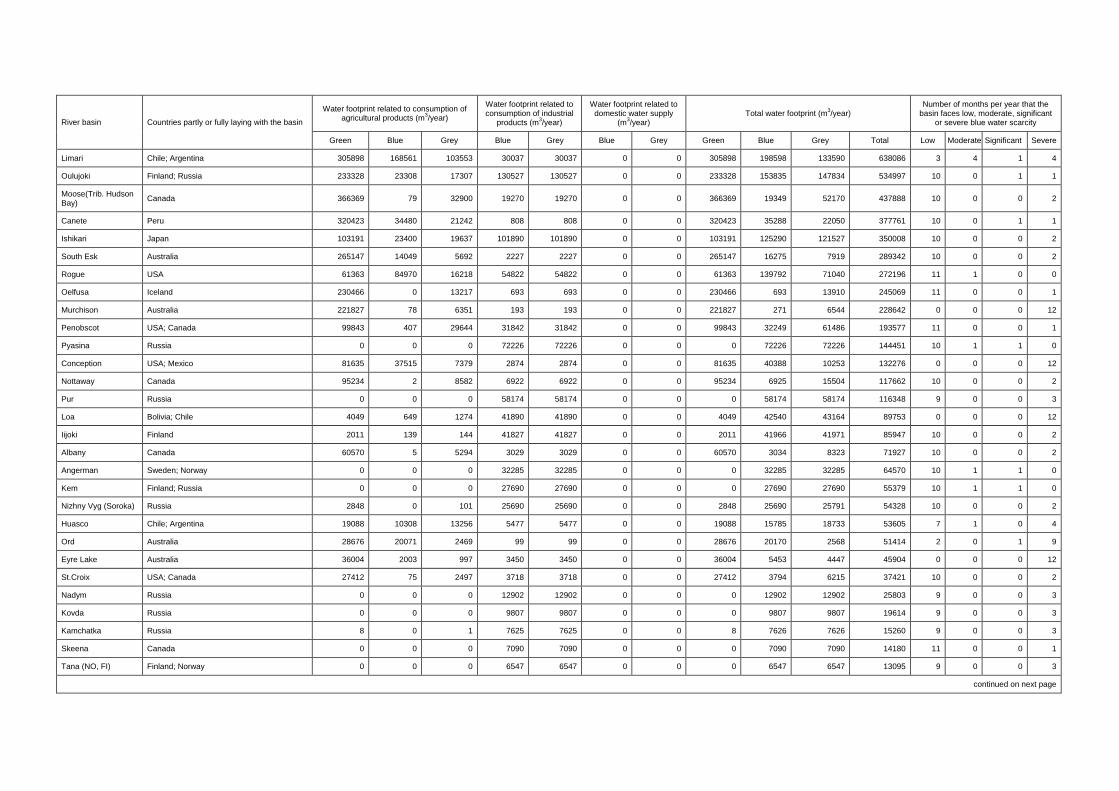
River basin Countries partly or fully laying with the basin
Water footprint related to consumption of agricultural products (m
3/year)
Water footprint related to consumption of industrial
products (m3/year)
Water footprint related to domestic water supply
(m3/year)
Total water footprint (m3/year)
Number of months per year that the basin faces low, moderate, significant
or severe blue water scarcity
Green Blue Grey Blue Grey Blue Grey Green Blue Grey Total Low Moderate Significant Severe
Limari Chile; Argentina 305898 168561 103553 30037 30037 0 0 305898 198598 133590 638086 3 4 1 4
Oulujoki Finland; Russia 233328 23308 17307 130527 130527 0 0 233328 153835 147834 534997 10 0 1 1
Moose(Trib. Hudson Bay)
Canada 366369 79 32900 19270 19270 0 0 366369 19349 52170 437888 10 0 0 2
Canete Peru 320423 34480 21242 808 808 0 0 320423 35288 22050 377761 10 0 1 1
Ishikari Japan 103191 23400 19637 101890 101890 0 0 103191 125290 121527 350008 10 0 0 2
South Esk Australia 265147 14049 5692 2227 2227 0 0 265147 16275 7919 289342 10 0 0 2
Rogue USA 61363 84970 16218 54822 54822 0 0 61363 139792 71040 272196 11 1 0 0
Oelfusa Iceland 230466 0 13217 693 693 0 0 230466 693 13910 245069 11 0 0 1
Murchison Australia 221827 78 6351 193 193 0 0 221827 271 6544 228642 0 0 0 12
Penobscot USA; Canada 99843 407 29644 31842 31842 0 0 99843 32249 61486 193577 11 0 0 1
Pyasina Russia 0 0 0 72226 72226 0 0 0 72226 72226 144451 10 1 1 0
Conception USA; Mexico 81635 37515 7379 2874 2874 0 0 81635 40388 10253 132276 0 0 0 12
Nottaway Canada 95234 2 8582 6922 6922 0 0 95234 6925 15504 117662 10 0 0 2
Pur Russia 0 0 0 58174 58174 0 0 0 58174 58174 116348 9 0 0 3
Loa Bolivia; Chile 4049 649 1274 41890 41890 0 0 4049 42540 43164 89753 0 0 0 12
Iijoki Finland 2011 139 144 41827 41827 0 0 2011 41966 41971 85947 10 0 0 2
Albany Canada 60570 5 5294 3029 3029 0 0 60570 3034 8323 71927 10 0 0 2
Angerman Sweden; Norway 0 0 0 32285 32285 0 0 0 32285 32285 64570 10 1 1 0
Kem Finland; Russia 0 0 0 27690 27690 0 0 0 27690 27690 55379 10 1 1 0
Nizhny Vyg (Soroka) Russia 2848 0 101 25690 25690 0 0 2848 25690 25791 54328 10 0 0 2
Huasco Chile; Argentina 19088 10308 13256 5477 5477 0 0 19088 15785 18733 53605 7 1 0 4
Ord Australia 28676 20071 2469 99 99 0 0 28676 20170 2568 51414 2 0 1 9
Eyre Lake Australia 36004 2003 997 3450 3450 0 0 36004 5453 4447 45904 0 0 0 12
St.Croix USA; Canada 27412 75 2497 3718 3718 0 0 27412 3794 6215 37421 10 0 0 2
Nadym Russia 0 0 0 12902 12902 0 0 0 12902 12902 25803 9 0 0 3
Kovda Russia 0 0 0 9807 9807 0 0 0 9807 9807 19614 9 0 0 3
Kamchatka Russia 8 0 1 7625 7625 0 0 8 7626 7626 15260 9 0 0 3
Skeena Canada 0 0 0 7090 7090 0 0 0 7090 7090 14180 11 0 0 1
Tana (NO, FI) Finland; Norway 0 0 0 6547 6547 0 0 0 6547 6547 13095 9 0 0 3
continued on next page
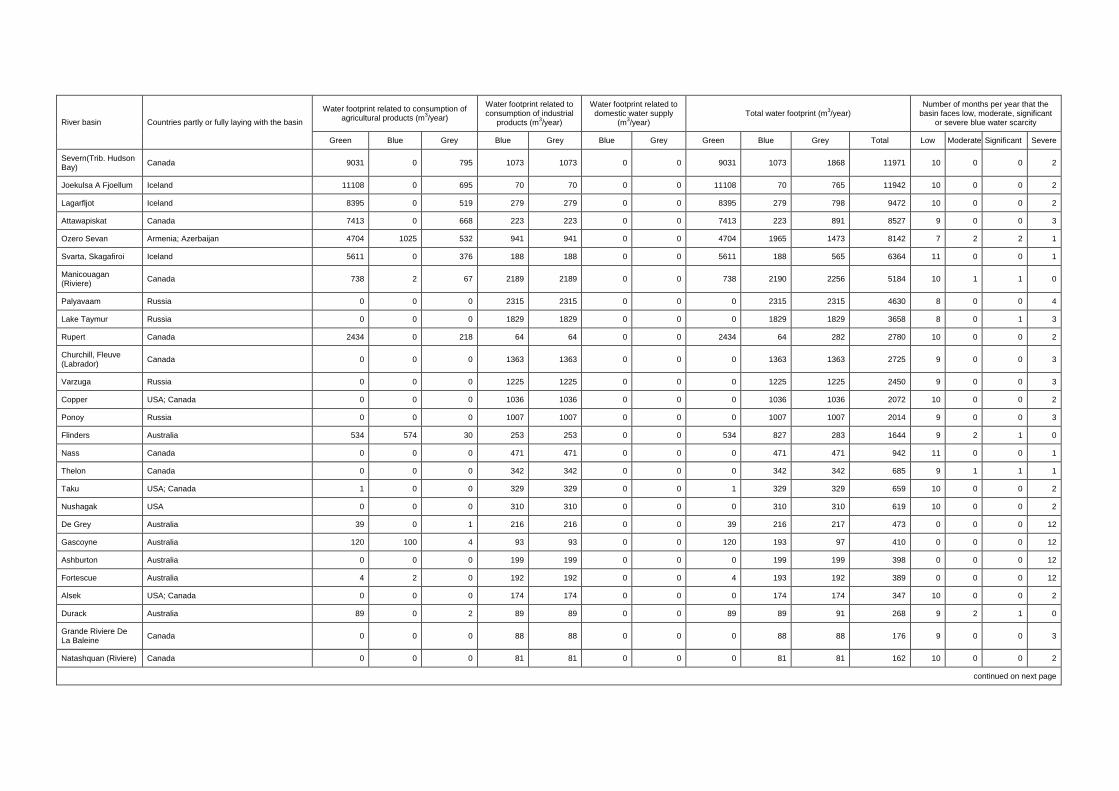
River basin Countries partly or fully laying with the basin
Water footprint related to consumption of agricultural products (m
3/year)
Water footprint related to consumption of industrial
products (m3/year)
Water footprint related to domestic water supply
(m3/year)
Total water footprint (m3/year)
Number of months per year that the basin faces low, moderate, significant
or severe blue water scarcity
Green Blue Grey Blue Grey Blue Grey Green Blue Grey Total Low Moderate Significant Severe
Severn(Trib. Hudson Bay)
Canada 9031 0 795 1073 1073 0 0 9031 1073 1868 11971 10 0 0 2
Joekulsa A Fjoellum Iceland 11108 0 695 70 70 0 0 11108 70 765 11942 10 0 0 2
Lagarfljot Iceland 8395 0 519 279 279 0 0 8395 279 798 9472 10 0 0 2
Attawapiskat Canada 7413 0 668 223 223 0 0 7413 223 891 8527 9 0 0 3
Ozero Sevan Armenia; Azerbaijan 4704 1025 532 941 941 0 0 4704 1965 1473 8142 7 2 2 1
Svarta, Skagafiroi Iceland 5611 0 376 188 188 0 0 5611 188 565 6364 11 0 0 1
Manicouagan (Riviere)
Canada 738 2 67 2189 2189 0 0 738 2190 2256 5184 10 1 1 0
Palyavaam Russia 0 0 0 2315 2315 0 0 0 2315 2315 4630 8 0 0 4
Lake Taymur Russia 0 0 0 1829 1829 0 0 0 1829 1829 3658 8 0 1 3
Rupert Canada 2434 0 218 64 64 0 0 2434 64 282 2780 10 0 0 2
Churchill, Fleuve (Labrador)
Canada 0 0 0 1363 1363 0 0 0 1363 1363 2725 9 0 0 3
Varzuga Russia 0 0 0 1225 1225 0 0 0 1225 1225 2450 9 0 0 3
Copper USA; Canada 0 0 0 1036 1036 0 0 0 1036 1036 2072 10 0 0 2
Ponoy Russia 0 0 0 1007 1007 0 0 0 1007 1007 2014 9 0 0 3
Flinders Australia 534 574 30 253 253 0 0 534 827 283 1644 9 2 1 0
Nass Canada 0 0 0 471 471 0 0 0 471 471 942 11 0 0 1
Thelon Canada 0 0 0 342 342 0 0 0 342 342 685 9 1 1 1
Taku USA; Canada 1 0 0 329 329 0 0 1 329 329 659 10 0 0 2
Nushagak USA 0 0 0 310 310 0 0 0 310 310 619 10 0 0 2
De Grey Australia 39 0 1 216 216 0 0 39 216 217 473 0 0 0 12
Gascoyne Australia 120 100 4 93 93 0 0 120 193 97 410 0 0 0 12
Ashburton Australia 0 0 0 199 199 0 0 0 199 199 398 0 0 0 12
Fortescue Australia 4 2 0 192 192 0 0 4 193 192 389 0 0 0 12
Alsek USA; Canada 0 0 0 174 174 0 0 0 174 174 347 10 0 0 2
Durack Australia 89 0 2 89 89 0 0 89 89 91 268 9 2 1 0
Grande Riviere De La Baleine
Canada 0 0 0 88 88 0 0 0 88 88 176 9 0 0 3
Natashquan (Riviere) Canada 0 0 0 81 81 0 0 0 81 81 162 10 0 0 2
continued on next page

River basin Countries partly or fully laying with the basin
Water footprint related to consumption of agricultural products (m
3/year)
Water footprint related to consumption of industrial
products (m3/year)
Water footprint related to domestic water supply
(m3/year)
Total water footprint (m3/year)
Number of months per year that the basin faces low, moderate, significant
or severe blue water scarcity
Green Blue Grey Blue Grey Blue Grey Green Blue Grey Total Low Moderate Significant Severe
Eastmain Canada 0 0 0 70 70 0 0 0 70 70 139 10 0 0 2
Little Mecatina Canada 0 0 0 23 23 0 0 0 23 23 47 9 0 0 3
Hornaday Canada 0 0 0 9 9 0 0 0 9 9 17 11 1 0 0
George Canada 0 0 0 5 5 0 0 0 5 5 10 9 0 0 3
Back Canada 0 0 0 2 2 0 0 0 2 2 4 9 0 0 3
Ferguson Canada 0 0 0 1 1 0 0 0 1 1 2 8 0 0 4

Value of Water Research Report Series
Editorial board: A.Y. Hoekstra, University of Twente; H.H.G. Savenije, Delft University of Technology; P. van der Zaag, UNESCO-IHE.
1. Exploring methods to assess the value of water: A case study on the Zambezi basin
A.K. Chapagain February 2000
2. Water value flows: A case study on the Zambezi basin.
A.Y. Hoekstra, H.H.G. Savenije and A.K. Chapagain March 2000
3. The water value-flow concept
I.M. Seyam and A.Y. Hoekstra December 2000
4. The value of irrigation water in Nyanyadzi smallholder irrigation scheme, Zimbabwe
G.T. Pazvakawambwa and P. van der Zaag – January 2001
5. The economic valuation of water: Principles and methods
J.I. Agudelo – August 2001
6. The economic valuation of water for agriculture: A simple method applied to the eight Zambezi basin countries
J.I. Agudelo and A.Y. Hoekstra – August 2001
7. The value of freshwater wetlands in the Zambezi basin
I.M. Seyam, A.Y. Hoekstra, G.S. Ngabirano and H.H.G. Savenije – August 2001
8. ‘Demand management’ and ‘Water as an economic good’: Paradigms with pitfalls
H.H.G. Savenije and P. van der Zaag – October 2001
9. Why water is not an ordinary economic good
H.H.G. Savenije – October 2001
10. Calculation methods to assess the value of upstream water flows and storage as a function of downstream benefits
I.M. Seyam, A.Y. Hoekstra and H.H.G. Savenije – October 2001
11. Virtual water trade: A quantification of virtual water flows between nations in relation to international crop trade
A.Y. Hoekstra and P.Q. Hung – September 2002
12. Virtual water trade: Proceedings of the international expert meeting on virtual water trade
A.Y. Hoekstra (ed.) – February 2003
13. Virtual water flows between nations in relation to trade in livestock and livestock products
A.K. Chapagain and A.Y. Hoekstra – July 2003
14. The water needed to have the Dutch drink coffee
A.K. Chapagain and A.Y. Hoekstra – August 2003
15. The water needed to have the Dutch drink tea
A.K. Chapagain and A.Y. Hoekstra – August 2003
16. Water footprints of nations, Volume 1: Main Report, Volume 2: Appendices
A.K. Chapagain and A.Y. Hoekstra – November 2004
17. Saving water through global trade
A.K. Chapagain, A.Y. Hoekstra and H.H.G. Savenije – September 2005
18. The water footprint of cotton consumption
A.K. Chapagain, A.Y. Hoekstra, H.H.G. Savenije and R. Gautam – September 2005
19. Water as an economic good: the value of pricing and the failure of markets
P. van der Zaag and H.H.G. Savenije – July 2006
20. The global dimension of water governance: Nine reasons for global arrangements in order to cope with local water problems
A.Y. Hoekstra – July 2006
21. The water footprints of Morocco and the Netherlands
A.Y. Hoekstra and A.K. Chapagain – July 2006
22. Water’s vulnerable value in Africa
P. van der Zaag – July 2006
23. Human appropriation of natural capital: Comparing ecological footprint and water footprint analysis
A.Y. Hoekstra – July 2007
24. A river basin as a common-pool resource: A case study for the Jaguaribe basin in Brazil
P.R. van Oel, M.S. Krol and A.Y. Hoekstra – July 2007
25. Strategic importance of green water in international crop trade
M.M. Aldaya, A.Y. Hoekstra and J.A. Allan – March 2008
26. Global water governance: Conceptual design of global institutional arrangements
M.P. Verkerk, A.Y. Hoekstra and P.W. Gerbens-Leenes – March 2008
27. Business water footprint accounting: A tool to assess how production of goods and services impact on freshwater resources worldwide
P.W. Gerbens-Leenes and A.Y. Hoekstra – March 2008
28. Water neutral: reducing and offsetting the impacts of water footprints
A.Y. Hoekstra – March 2008
29. Water footprint of bio-energy and other primary energy carriers
P.W. Gerbens-Leenes, A.Y. Hoekstra and Th.H. van der Meer – March 2008
30. Food consumption patterns and their effect on water requirement in China
J. Liu and H.H.G. Savenije – March 2008
31. Going against the flow: A critical analysis of virtual water trade in the context of India’s National River Linking Programme
S. Verma, D.A. Kampman, P. van der Zaag and A.Y. Hoekstra – March 2008
32. The water footprint of India
D.A. Kampman, A.Y. Hoekstra and M.S. Krol – May 2008

33. The external water footprint of the Netherlands: Quantification and impact assessment
P.R. van Oel, M.M. Mekonnen and A.Y. Hoekstra – May 2008
34. The water footprint of bio-energy: Global water use for bio-ethanol, bio-diesel, heat and electricity
P.W. Gerbens-Leenes, A.Y. Hoekstra and Th.H. van der Meer – August 2008
35. Water footprint analysis for the Guadiana river basin
M.M. Aldaya and M.R. Llamas – November 2008
36. The water needed to have Italians eat pasta and pizza
M.M. Aldaya and A.Y. Hoekstra – May 2009
37. The water footprint of Indonesian provinces related to the consumption of crop products
F. Bulsink, A.Y. Hoekstra and M.J. Booij – May 2009
38. The water footprint of sweeteners and bio-ethanol from sugar cane, sugar beet and maize
P.W. Gerbens-Leenes and A.Y. Hoekstra – November 2009
39. A pilot in corporate water footprint accounting and impact assessment: The water footprint of a sugar-containing carbonated beverage
A.E. Ercin, M.M. Aldaya and A.Y. Hoekstra – November 2009
40. The blue, green and grey water footprint of rice from both a production and consumption perspective
A.K. Chapagain and A.Y. Hoekstra – March 2010
41. Water footprint of cotton, wheat and rice production in Central Asia
M.M. Aldaya, G. Muñoz and A.Y. Hoekstra – March 2010
42. A global and high-resolution assessment of the green, blue and grey water footprint of wheat
M.M. Mekonnen and A.Y. Hoekstra – April 2010
43. Biofuel scenarios in a water perspective: The global blue and green water footprint of road transport in 2030
A.R. van Lienden, P.W. Gerbens-Leenes, A.Y. Hoekstra and Th.H. van der Meer – April 2010
44. Burning water: The water footprint of biofuel-based transport
P.W. Gerbens-Leenes and A.Y. Hoekstra – June 2010
45. Mitigating the water footprint of export cut flowers from the Lake Naivasha Basin, Kenya
M.M. Mekonnen and A.Y. Hoekstra – June 2010
46. The green and blue water footprint of paper products: methodological considerations and quantification
P.R. van Oel and A.Y. Hoekstra – July 2010
47. The green, blue and grey water footprint of crops and derived crop products
M.M. Mekonnen and A.Y. Hoekstra – December 2010
48. The green, blue and grey water footprint of animals and derived animal products
M.M. Mekonnen and A.Y. Hoekstra – December 2010
49. The water footprint of soy milk and soy burger and equivalent animal products
A.E. Ercin, M.M. Aldaya and A.Y. Hoekstra – February 2011
50. National water footprint accounts: The green, blue and grey water footprint of production and consumption
M.M. Mekonnen and A.Y. Hoekstra – May 2011
51. The water footprint of electricity from hydropower
M.M. Mekonnen and A.Y. Hoekstra – June 2011
52. The relation between national water management and international trade: a case study from Kenya
M.M. Mekonnen and A.Y. Hoekstra – June 2011
53. Global water scarcity: The monthly blue water footprint compared to blue water availability for the world’s major river basins
A.Y. Hoekstra and M.M. Mekonnen – September 2011
54. Proceedings of the ESF Strategic Workshop on accounting for water scarcity and pollution in the rules of international trade
A.Y. Hoekstra, M.M. Aldaya and B. Avril (eds.) – October 2011
55. A comparative study on the water footprint of poultry, pork and beef in different countries and production systems
P.W. Gerbens-Leenes, M.M. Mekonnen and A.Y. Hoekstra – December 2011
56. The water footprint of France
A.E. Ercin, M.M. Mekonnen and A.Y. Hoekstra – March 2012
57. The water footprint of Switzerland
A.E. Ercin, M.M. Mekonnen and A.Y. Hoekstra – March 2012
Reports can be downloaded from:
www.waterfootprint.org
www.unesco-ihe.org/value-of-water-research-report-series

UNESCO-IHEP.O. Box 30152601 DA DelftThe Netherlands
Website www.unesco-ihe.orgPhone +31 15 2151715
University of Twente
Delft University of Technology


![Water footprint a tool for water policy analysislibrary.tee.gr/digital/m2583/m2583_hoekstra.pdf · [Mekonnen & Hoekstra, 2011] about 97% of the water footprint is ‘invisible’,](https://static.fdocuments.net/doc/165x107/5ecd95233c8eb35c1249ce79/water-footprint-a-tool-for-water-policy-mekonnen-hoekstra-2011-about-97.jpg)