Value Network Mapping
10
© Shahrukh A. Irani Value Network Mapping Shahrukh A. Irani Lean & Flexible, llc 4102 Pensacola Oaks Lane Sugar Land, TX 77479 Email: [email protected] Phone: (832) 475-4447 Website: www.LeanandFlexible.com “Complex problems do not have simple solutions” “When all you have is a hammer, everything looks like a nail” “Don’t try to hammer a nail with a monkey wrench” “Don’t use a screwdriver to pound nails. It takes forever and wrecks the screwdriver” “It is important to find the right tool for the job” Introduction I read the Bible on Value Stream Mapping (VSM) – Rother, M. & Shook, J. 2009. Learning to see: Value Stream Mapping to create value and eliminate muda. Brookline, MA: The Lean Enterprise Institute – when I was still on the faculty of the Department of Integrated Systems Engineering at The Ohio State University. I taught VSM in three IE (Industrial Engineering) undergraduate courses (Methods Analysis, Facilities Planning and Production Control). VSM enriches and enhances classical manual IE tools like Process Maps, Flow Process Charts and Flow Diagrams. A Current State Map is a clear visual guide to which specific departments (or processes) in a company ought to be improved using Lean best practices, such as Setup Reduction, Total Productive Maintenance, Work Cells, etc. VSM is easy to learn and implement using an 11X17 sheet of paper or Post It notes plastered on a wall! High-Mix Low-Volume Manufacturers are Different from Toyota Unlike an OEM like Toyota, there are numerous high-mix low-volume (HMLV) manufacturers such as: • Any job shop that does fabrication, machining, forging, molding, tool and die, casting, maintenance/repair/overhaul, etc. • Any production shop that serves a diverse mix of aerospace and defense customers • Any vertically integrated Make-To-Order facility that makes customized versions of a large and complex fabricated product such as a crane or heat exchanger for different customers • Any shipyard that builds an aircraft carrier • Any MRO (Maintenance, Repair and Overhaul) facility • Any collision repair shop • etc.
Transcript of Value Network Mapping
© Shahrukh A. Irani
Value Network Mapping
Shahrukh A. Irani Lean & Flexible, llc
4102 Pensacola Oaks Lane Sugar Land, TX 77479
Email: [email protected] Phone: (832) 475-4447
Website: www.LeanandFlexible.com
“Complex problems do not have simple solutions”
“When all you have is a hammer, everything looks like a nail”
“Don’t try to hammer a nail with a monkey wrench”
“Don’t use a screwdriver to pound nails. It takes forever and wrecks the screwdriver”
“It is important to find the right tool for the job”
Introduction I read the Bible on Value Stream Mapping (VSM) – Rother, M. & Shook, J. 2009. Learning to see: Value Stream Mapping to create value and eliminate muda. Brookline, MA: The Lean Enterprise Institute – when I was still on the faculty of the Department of Integrated Systems Engineering at The Ohio State University. I taught VSM in three IE (Industrial Engineering) undergraduate courses (Methods Analysis, Facilities Planning and Production Control). VSM enriches and enhances classical manual IE tools like Process Maps, Flow Process Charts and Flow Diagrams. A Current State Map is a clear visual guide to which specific departments (or processes) in a company ought to be improved using Lean best practices, such as Setup Reduction, Total Productive Maintenance, Work Cells, etc. VSM is easy to learn and implement using an 11X17 sheet of paper or Post It notes plastered on a wall! High-Mix Low-Volume Manufacturers are Different from Toyota Unlike an OEM like Toyota, there are numerous high-mix low-volume (HMLV) manufacturers such as: • Any job shop that does fabrication, machining, forging, molding, tool and die,
casting, maintenance/repair/overhaul, etc. • Any production shop that serves a diverse mix of aerospace and defense customers • Any vertically integrated Make-To-Order facility that makes customized versions of a
large and complex fabricated product such as a crane or heat exchanger for different customers
• Any shipyard that builds an aircraft carrier • Any MRO (Maintenance, Repair and Overhaul) facility • Any collision repair shop • etc.
© Shahrukh A. Irani
The fundamental difference between any HMLV manufacturing facility and any Toyota facility is that a high-mix low-volume (HMLV) manufacturing facility, such as a forge shop, fabrication shop or machine shop, produces a large number of different components. In many cases, these components are used to build sub-assemblies that comprise a large and complex fabricated product. In either case, VSM is incapable of simultaneously displaying the large number of Value Streams that are processed in any HMLV facility on a single day, let alone any week, month or year! Value Stream Mapping is Ill-Suited for HMLV Manufacturers Based on my past career in academia and current industry experience as an IE consultant, I find that Value Stream Mapping is ill-suited for guiding the implementation of Lean in any high-mix low-volume (HMLV) manufacturing facility. VSM is at best a macro-level tool that helps management to gain a high-level visualization of their operations. A VSM is unable to represent anything more complex than a repetitive high-volume production system, such as an assembly line (or cell). Every Value Stream Map on record usually represents a single product, or a family of similar products with little, if any, significant differences in their routings. An IE (Industrial Engineer) working in any manufacturing or service facility has to perform functions such as Facility Layout, Production Planning, Operations Scheduling, Materials Handling, Inventory Control, Warehouse Management, etc. All of these functions are embedded in a rudimentary form in any Value Stream Map. A VSM consists of three layers: (1) The top layer deals with production planning and scheduling, (2) The middle layer deals with material flow, and (3) The bottom layer deals with performance measurement using the VAR (Value Added Ratio) metric to measure the efficiency of order completion. From an IE viewpoint, some major shortcomings of VSM are: • VSM cannot handle variety. It cannot map a large number of dissimilar
manufacturing routings involving dozens of different work centers. Nor can it map the complete BOM (Bill Of Material) of any complex product. This is supported by what Rother and Shook state in their book “… (when) any value streams have multiple flows that merge….draw such flows over one another…but do not try to draw every branch if there are too many. Choose the few components first, and get the others later if you need to….just draw the flow for one or two main materials”.
• VSM cannot handle variation. It provides a single day’s snapshot of a dynamic system; thereby, it fails to capture time-dependent variability in performance of the system. This is supported by what Martin and Osterling state in their book1 “… The current state value stream map represents how the value stream is performing on the day the map is created. Because the current state map represents a snapshot in time, the observations the team makes and the metrics it collects reflect value stream performance on that specific day. For value streams with high variation, it may be helpful to revisit the value stream on a different day to explore how it operates in different conditions”.
1 The new Bible on VSM is – Martin, K. & Osterling, M. 2014. Value Stream Mapping: How to visualize work and align leadership for organizational transformation. New York, NY: McGraw-Hill.
© Shahrukh A. Irani
• VSM lacks the analytics to show how the performance of the Value Stream could be impacted by changing transfer batch sizes, changing scheduling priorities, changing OEE (Overall Equipment Effectiveness) at different work centers, etc. A VSM simply cannot evaluate multiple “what if” options for improving any system!
• VSM misleads a Lean implementer to consider only those practices that work in high-volume low-mix (HVLM) assembly facilities, such as kanban-based inventory replenishment, FIFO (First In First Out) scheduling and single-piece flow cells.
• VSM is slow, cumbersome and error-prone when used to map and visualize a collection of Value Streams.
Theoretical Foundations of Value Network Mapping A research paper2 published in 1978 showed how to implement Value Network Mapping using IE methods such as Group Technology, Material Requirements Planning and Flowshop Scheduling. The authors proposed an integrated methodology for production control of any HMLV production system that assembles a variety of products using a large variety of components. The sequence of steps that they followed is described below: 1. Use Group Technology to segregate the large variety of components being produced
in the facility into a relatively small number of part families. A part family is a group of parts that pass through identical/similar process flow sequences (aka routings).3
2. Use the routings of the parts in each family to identify a “machine group” (aka cell). Each cell is dedicated to the production of a part family.
3. Use Material Requirement Planning (MRP) to determine the week-by-week production of all the parts needed to assemble different products per the delivery dates for those products that were quoted to their customers.
4. For each week, load the batch for each component that has been scheduled for production on the cell which has all the equipment specified in its routing.
5. For each week, schedule production of all the components that have been loaded on each cell using a Flowshop (or Jobshop) Scheduling heuristic. The choice of heuristic will depend on whether the routings are identical (Flowshop) or the routings do not use the same combination and sequence of machines in the cell (Jobshop).
Comparison of Value Stream Mapping and Value Network Mapping How does an HMLV manufacturer map and analyze a large number of value streams on a single map to determine what improvements to make in their production system? The table below outlines how a Value Network Map is developed using IE methods to implement the same steps taken to develop a Value Stream Map as follows:
Step in Value Stream Mapping How the Same Step is Implemented in Value Network Mapping
Identify value: Specify value from the standpoint of the end customer by product family.
• The same metrics (Quality, Cost and Delivery) that drive a manufacturer like Toyota also drive an HMLV manufacturer. However, unlike high-volume repetitive
2 Sato, N., Ignizio, J.P. & Ham, I. (1978). Group Technology and Material Requirements Planning: An integrated methodology for production control. Annals of the CIRP, Volume 27, Number 1, 471-473. 3 A part family corresponds to a multi-product Value Stream!
© Shahrukh A. Irani
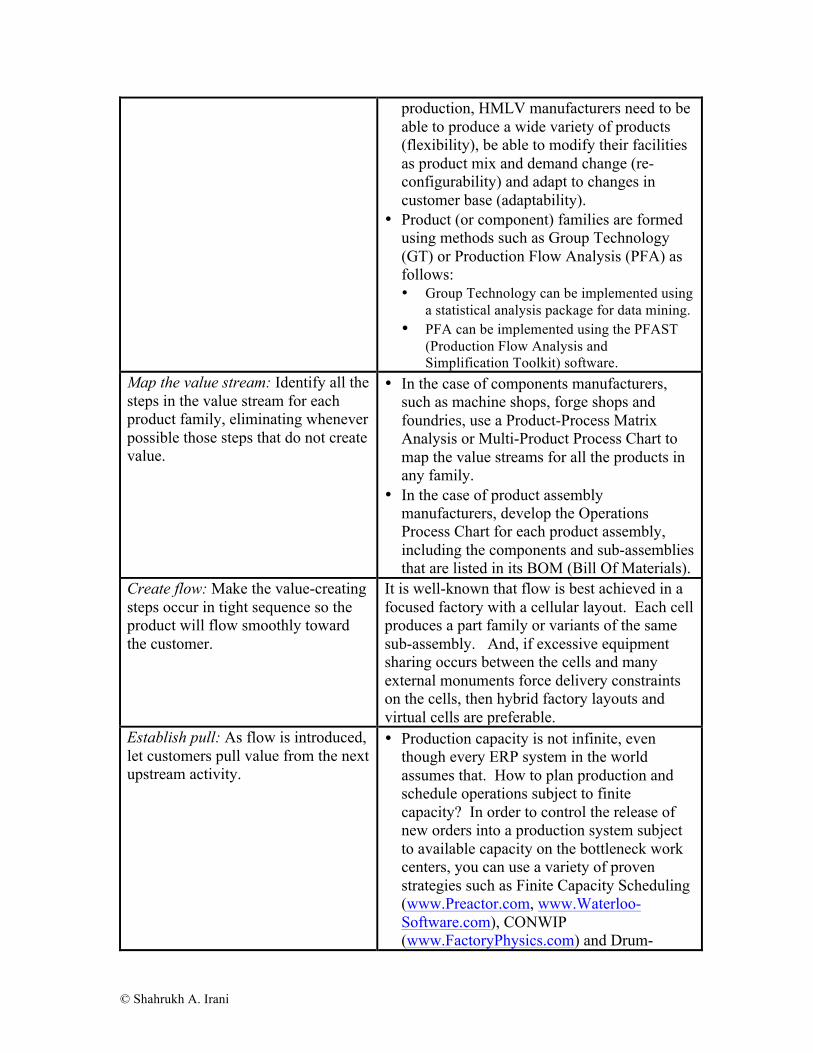
production, HMLV manufacturers need to be able to produce a wide variety of products (flexibility), be able to modify their facilities as product mix and demand change (re-configurability) and adapt to changes in customer base (adaptability).
• Product (or component) families are formed using methods such as Group Technology (GT) or Production Flow Analysis (PFA) as follows: • Group Technology can be implemented using
a statistical analysis package for data mining. • PFA can be implemented using the PFAST
(Production Flow Analysis and Simplification Toolkit) software.
Map the value stream: Identify all the steps in the value stream for each product family, eliminating whenever possible those steps that do not create value.
• In the case of components manufacturers, such as machine shops, forge shops and foundries, use a Product-Process Matrix Analysis or Multi-Product Process Chart to map the value streams for all the products in any family.
• In the case of product assembly manufacturers, develop the Operations Process Chart for each product assembly, including the components and sub-assemblies that are listed in its BOM (Bill Of Materials).
Create flow: Make the value-creating steps occur in tight sequence so the product will flow smoothly toward the customer.
It is well-known that flow is best achieved in a focused factory with a cellular layout. Each cell produces a part family or variants of the same sub-assembly. And, if excessive equipment sharing occurs between the cells and many external monuments force delivery constraints on the cells, then hybrid factory layouts and virtual cells are preferable.
Establish pull: As flow is introduced, let customers pull value from the next upstream activity.
• Production capacity is not infinite, even though every ERP system in the world assumes that. How to plan production and schedule operations subject to finite capacity? In order to control the release of new orders into a production system subject to available capacity on the bottleneck work centers, you can use a variety of proven strategies such as Finite Capacity Scheduling (www.Preactor.com, www.Waterloo-Software.com), CONWIP (www.FactoryPhysics.com) and Drum-
© Shahrukh A. Irani
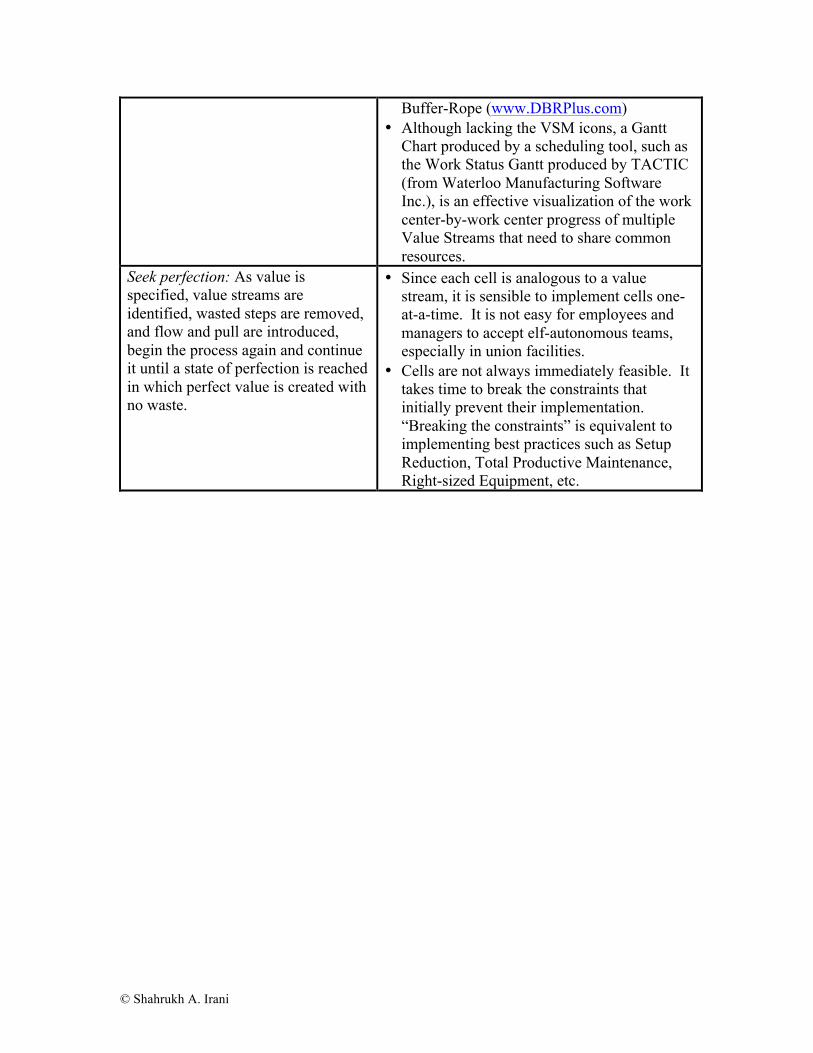
Buffer-Rope (www.DBRPlus.com) • Although lacking the VSM icons, a Gantt
Chart produced by a scheduling tool, such as the Work Status Gantt produced by TACTIC (from Waterloo Manufacturing Software Inc.), is an effective visualization of the work center-by-work center progress of multiple Value Streams that need to share common resources.
Seek perfection: As value is specified, value streams are identified, wasted steps are removed, and flow and pull are introduced, begin the process again and continue it until a state of perfection is reached in which perfect value is created with no waste.
• Since each cell is analogous to a value stream, it is sensible to implement cells one-at-a-time. It is not easy for employees and managers to accept elf-autonomous teams, especially in union facilities.
• Cells are not always immediately feasible. It takes time to break the constraints that initially prevent their implementation. “Breaking the constraints” is equivalent to implementing best practices such as Setup Reduction, Total Productive Maintenance, Right-sized Equipment, etc.
© Shahrukh A. Irani
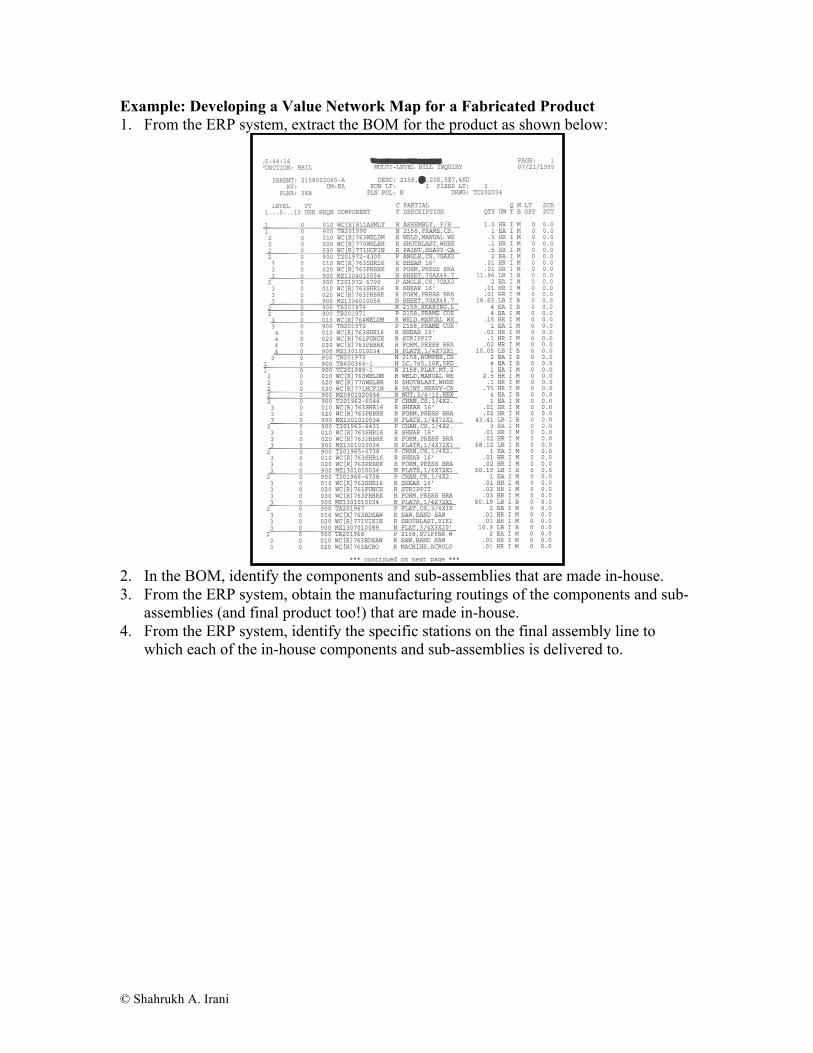
Example: Developing a Value Network Map for a Fabricated Product 1. From the ERP system, extract the BOM for the product as shown below:
2. In the BOM, identify the components and sub-assemblies that are made in-house. 3. From the ERP system, obtain the manufacturing routings of the components and sub-
assemblies (and final product too!) that are made in-house. 4. From the ERP system, identify the specific stations on the final assembly line to
which each of the in-house components and sub-assemblies is delivered to.
© Shahrukh A. Irani
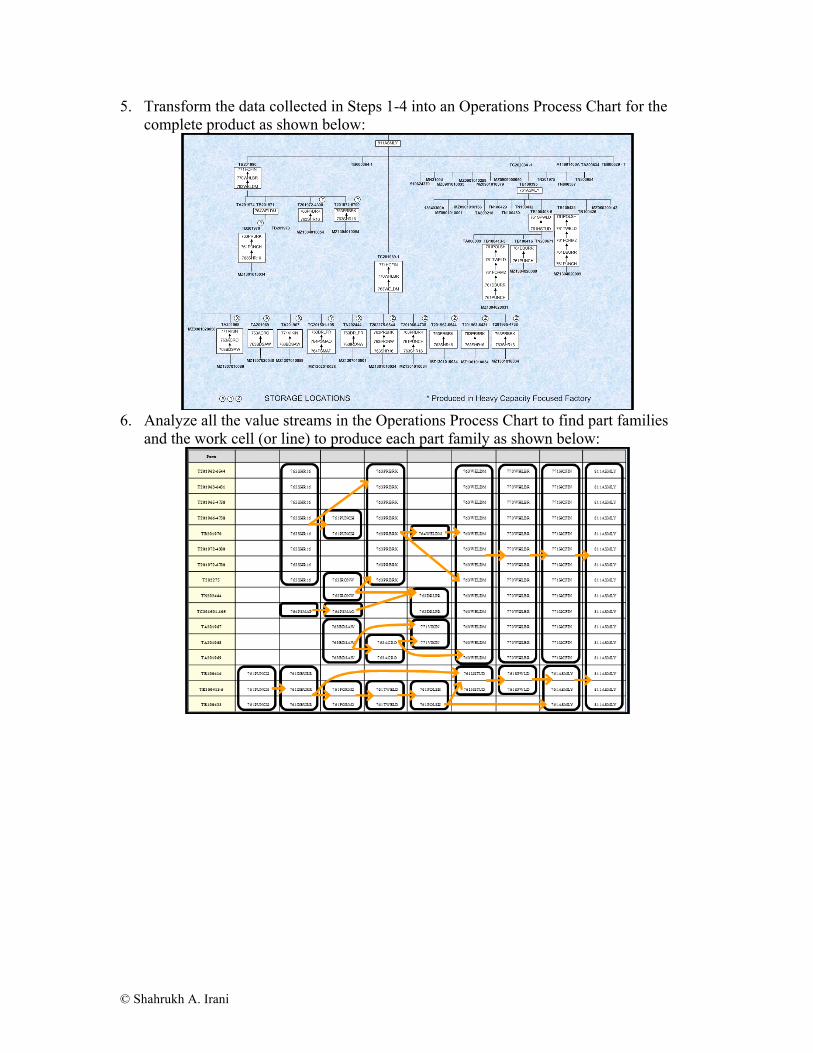
5. Transform the data collected in Steps 1-4 into an Operations Process Chart for the complete product as shown below:
6. Analyze all the value streams in the Operations Process Chart to find part families
and the work cell (or line) to produce each part family as shown below:
© Shahrukh A. Irani
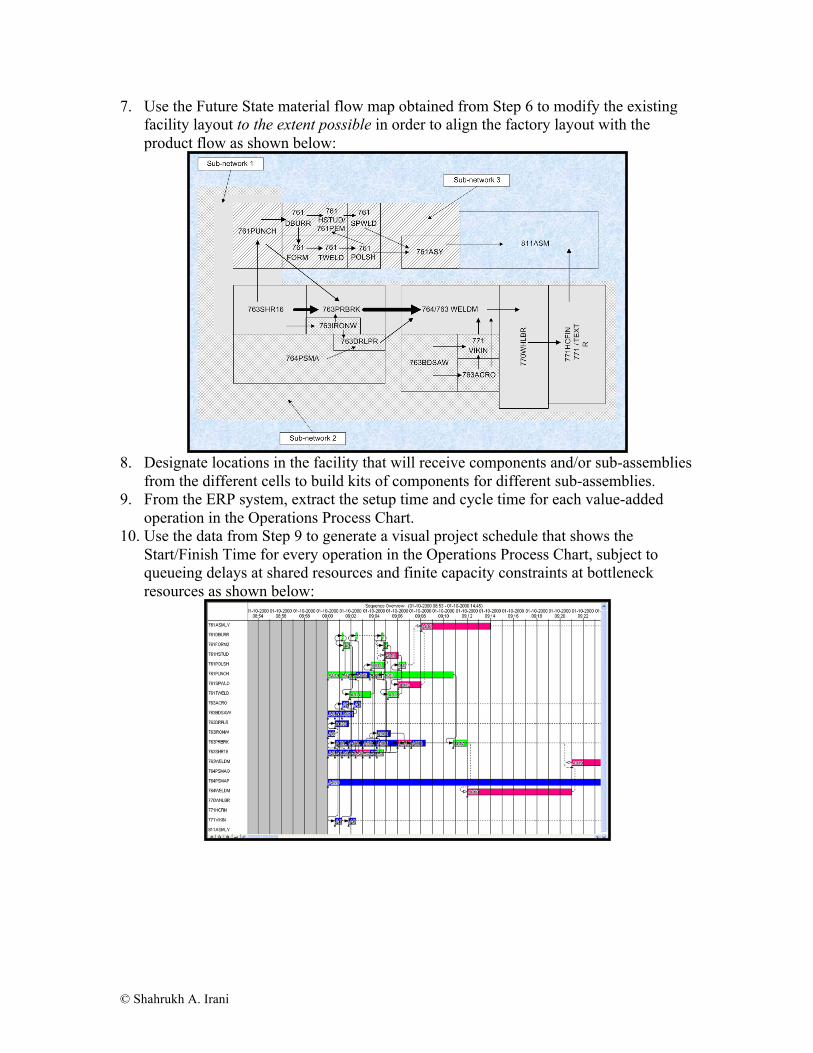
7. Use the Future State material flow map obtained from Step 6 to modify the existing facility layout to the extent possible in order to align the factory layout with the product flow as shown below:
8. Designate locations in the facility that will receive components and/or sub-assemblies
from the different cells to build kits of components for different sub-assemblies. 9. From the ERP system, extract the setup time and cycle time for each value-added
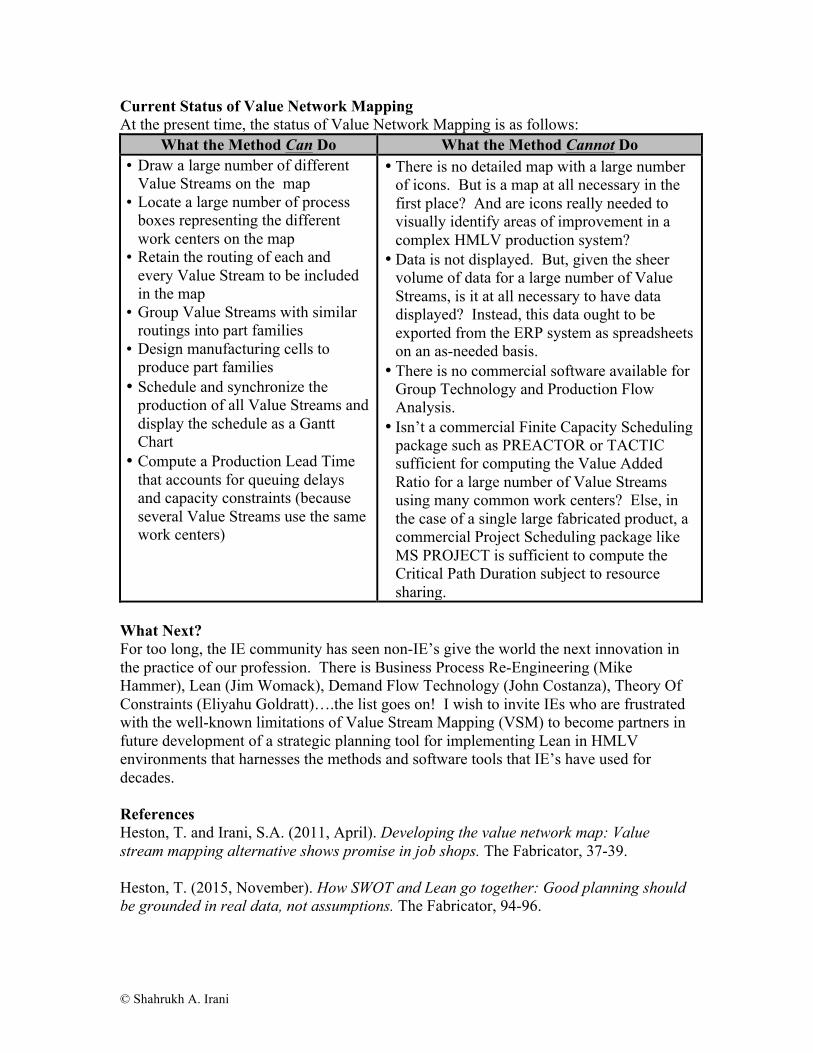
operation in the Operations Process Chart. 10. Use the data from Step 9 to generate a visual project schedule that shows the
Start/Finish Time for every operation in the Operations Process Chart, subject to queueing delays at shared resources and finite capacity constraints at bottleneck resources as shown below:
© Shahrukh A. Irani
Current Status of Value Network Mapping At the present time, the status of Value Network Mapping is as follows:
What the Method Can Do What the Method Cannot Do • Draw a large number of different
Value Streams on the map • Locate a large number of process
boxes representing the different work centers on the map
• Retain the routing of each and every Value Stream to be included in the map
• Group Value Streams with similar routings into part families
• Design manufacturing cells to produce part families
• Schedule and synchronize the production of all Value Streams and display the schedule as a Gantt Chart
• Compute a Production Lead Time that accounts for queuing delays and capacity constraints (because several Value Streams use the same work centers)
• There is no detailed map with a large number of icons. But is a map at all necessary in the first place? And are icons really needed to visually identify areas of improvement in a complex HMLV production system?
• Data is not displayed. But, given the sheer volume of data for a large number of Value Streams, is it at all necessary to have data displayed? Instead, this data ought to be exported from the ERP system as spreadsheets on an as-needed basis.
• There is no commercial software available for Group Technology and Production Flow Analysis.
• Isn’t a commercial Finite Capacity Scheduling package such as PREACTOR or TACTIC sufficient for computing the Value Added Ratio for a large number of Value Streams using many common work centers? Else, in the case of a single large fabricated product, a commercial Project Scheduling package like MS PROJECT is sufficient to compute the Critical Path Duration subject to resource sharing.
What Next? For too long, the IE community has seen non-IE’s give the world the next innovation in the practice of our profession. There is Business Process Re-Engineering (Mike Hammer), Lean (Jim Womack), Demand Flow Technology (John Costanza), Theory Of Constraints (Eliyahu Goldratt)….the list goes on! I wish to invite IEs who are frustrated with the well-known limitations of Value Stream Mapping (VSM) to become partners in future development of a strategic planning tool for implementing Lean in HMLV environments that harnesses the methods and software tools that IE’s have used for decades. References Heston, T. and Irani, S.A. (2011, April). Developing the value network map: Value stream mapping alternative shows promise in job shops. The Fabricator, 37-39. Heston, T. (2015, November). How SWOT and Lean go together: Good planning should be grounded in real data, not assumptions. The Fabricator, 94-96.
© Shahrukh A. Irani
Irani, S. A. (2015, November). Value Network Mapping: Extending Value Stream Mapping to Enable Lean Manufacturing in Jobshop-type Custom Manufacturing Facilities. Lean & Flexible, llc, Sugar Land, TX. Khaswala, Z. & Irani, S.A. (2001, September 10-11). Value network mapping: Visualization and analysis of multiple flows in value stream maps. Proceedings of the Lean Management Solutions Conference. Sponsored by Institute of Industrial Engineers and University of Missouri-Rolla, St. Louis, MO. Lechleitner, D. & Irani, S. A. (2015, November 9-12). Improving flow through practical lean technologies and tools. Proceedings of the FABTECH 2105 Conference held on November 9-12 at the McCormick Place in Chicago, IL. Sponsored by Society of Manufacturing Engineers (SME) & Fabricators and Manufacturers Association (FMA).