
Value Equity Fund - LSV Asset Managementlsvasset.com/pdf/fund-docs/LSVEX_AR_2017.pdf · 1...
28
THE ADVISORS’ INNER CIRCLE FUND ANNUAL REPORT TO SHAREHOLDERS October 31, 2017 Value Equity Fund This information must be preceded or accompanied by a current prospectus. Investors should read the prospectus carefully before investing.
Transcript of Value Equity Fund - LSV Asset Managementlsvasset.com/pdf/fund-docs/LSVEX_AR_2017.pdf · 1...
THE ADVISORS’ INNER CIRCLE FUND
ANNUAL REPORT TO SHAREHOLDERS
October 31, 2017
Value Equity Fund
This information must be preceded or accompanied by a current prospectus. Investors should read the prospectus
carefully before investing.

1
MANAGER’S DISCUSSION AND ANALYSIS OF FUND PERFORMANCE(Unaudited)
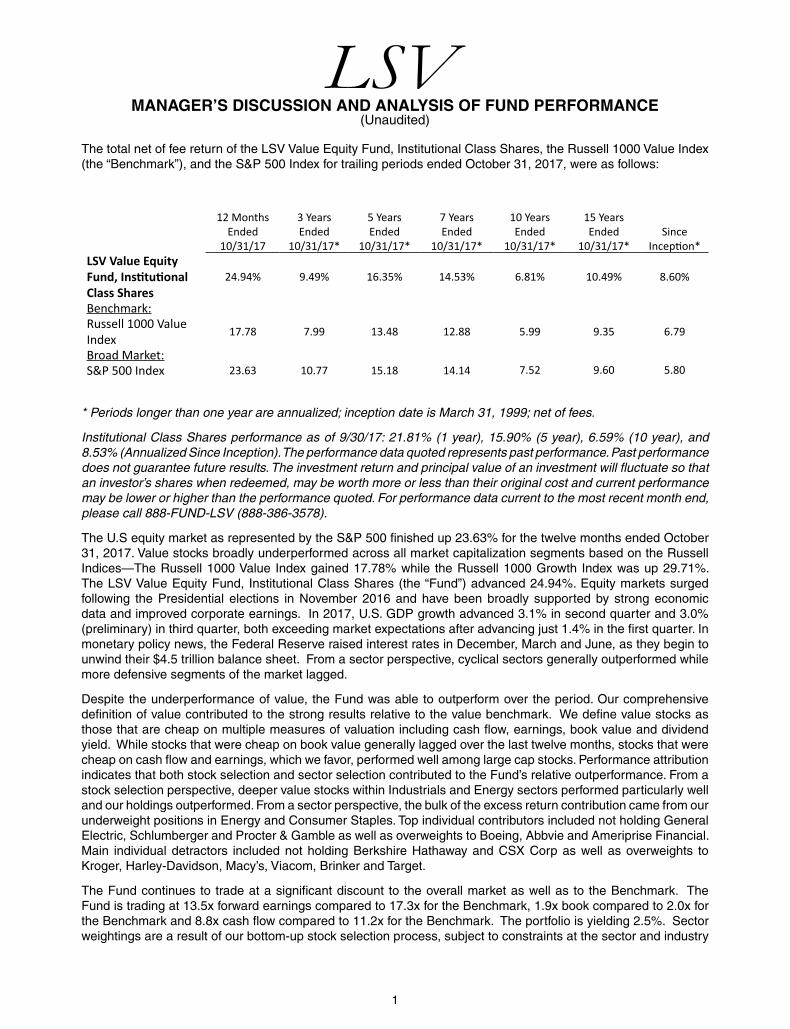
The total net of fee return of the LSV Value Equity Fund, Institutional Class Shares, the Russell 1000 Value Index (the “Benchmark”), and the S&P 500 Index for trailing periods ended October 31, 2017, were as follows:
12 Months Ended
10/31/17
3 Years Ended
10/31/17*
5 Years Ended
10/31/17*
7 Years Ended
10/31/17*
10 Years Ended
10/31/17*
15 Years Ended
10/31/17*Since
Inception*LSV Value Equity Fund, Institutional Class Shares
24.94% 9.49% 16.35% 14.53% 6.81% 10.49% 8.60%
Benchmark:Russell 1000 Value Index
17.78 7.99 13.48 12.88 5.99 9.35 6.79
Broad Market:S&P 500 Index 23.63 10.77 15.18 14.14 7.52 9.60 5.80
* Periods longer than one year are annualized; inception date is March 31, 1999; net of fees.
Institutional Class Shares performance as of 9/30/17: 21.81% (1 year), 15.90% (5 year), 6.59% (10 year), and 8.53% (Annualized Since Inception). The performance data quoted represents past performance. Past performance does not guarantee future results. The investment return and principal value of an investment will fluctuate so that an investor’s shares when redeemed, may be worth more or less than their original cost and current performance may be lower or higher than the performance quoted. For performance data current to the most recent month end, please call 888-FUND-LSV (888-386-3578).
The U.S equity market as represented by the S&P 500 finished up 23.63% for the twelve months ended October 31, 2017. Value stocks broadly underperformed across all market capitalization segments based on the Russell Indices—The Russell 1000 Value Index gained 17.78% while the Russell 1000 Growth Index was up 29.71%. The LSV Value Equity Fund, Institutional Class Shares (the “Fund”) advanced 24.94%. Equity markets surged following the Presidential elections in November 2016 and have been broadly supported by strong economic data and improved corporate earnings. In 2017, U.S. GDP growth advanced 3.1% in second quarter and 3.0% (preliminary) in third quarter, both exceeding market expectations after advancing just 1.4% in the first quarter. In monetary policy news, the Federal Reserve raised interest rates in December, March and June, as they begin to unwind their $4.5 trillion balance sheet. From a sector perspective, cyclical sectors generally outperformed while more defensive segments of the market lagged.
Despite the underperformance of value, the Fund was able to outperform over the period. Our comprehensive definition of value contributed to the strong results relative to the value benchmark. We define value stocks as those that are cheap on multiple measures of valuation including cash flow, earnings, book value and dividend yield. While stocks that were cheap on book value generally lagged over the last twelve months, stocks that were cheap on cash flow and earnings, which we favor, performed well among large cap stocks. Performance attribution indicates that both stock selection and sector selection contributed to the Fund’s relative outperformance. From a stock selection perspective, deeper value stocks within Industrials and Energy sectors performed particularly well and our holdings outperformed. From a sector perspective, the bulk of the excess return contribution came from our underweight positions in Energy and Consumer Staples. Top individual contributors included not holding General Electric, Schlumberger and Procter & Gamble as well as overweights to Boeing, Abbvie and Ameriprise Financial. Main individual detractors included not holding Berkshire Hathaway and CSX Corp as well as overweights to Kroger, Harley-Davidson, Macy’s, Viacom, Brinker and Target.
The Fund continues to trade at a significant discount to the overall market as well as to the Benchmark. The Fund is trading at 13.5x forward earnings compared to 17.3x for the Benchmark, 1.9x book compared to 2.0x for the Benchmark and 8.8x cash flow compared to 11.2x for the Benchmark. The portfolio is yielding 2.5%. Sector weightings are a result of our bottom-up stock selection process, subject to constraints at the sector and industry
2
MANAGER’S DISCUSSION AND ANALYSIS OF FUND PERFORMANCE(Unaudited)
levels. The Fund is currently overweight the Information Technology and Materials sectors while underweight Energy and Consumer Staples.
Our organization remains stable and our research team continues to pursue an active research agenda in which we are looking for better ways to measure value and identify signs of positive change. As always, we are focused on delivering the long-term results that our investors have come to expect from LSV and that we have delivered for clients since 1994.
The material represents the manager’s assessment of the portfolio and market environment at a specific point in time and should be relied upon by the reader as research or investment advice. Investing involves risk including loss of principal. The information provided herein represents the opinion of the manager and is not intended to be a forecast of future events, a guarantee of future results or investment advice.
Forward earnings is not a forecast of the Fund’s future performance. Investing involves risk, including possible loss of principal.
The Russell 1000 Value Index is a widely-recognized, capitalization-weighted (companies with larger market capitalizations have more influence than those with smaller market capitalization) index of U.S. companies with lower forecasted growth rates and price-to-book ratios.
The S&P 500 Index consists of 500 stocks chosen for market size, liquidity, and industry group representation. It is a market-value weighted index (stock price times number of shares outstanding) , with each stock’s weight in the Index proportionate to its market value. The S&P 500 Index is one of the most widely used benchmarks of U.S. equity performance.
Index Returns are for illustrative purposes only and do not represent actual fund performance. Index performance returns do not reflect any manage fees, transaction costs or expenses. Indexes are unmanaged and one cannot invest directly in an index. Past performance does not guarantee future results.
3
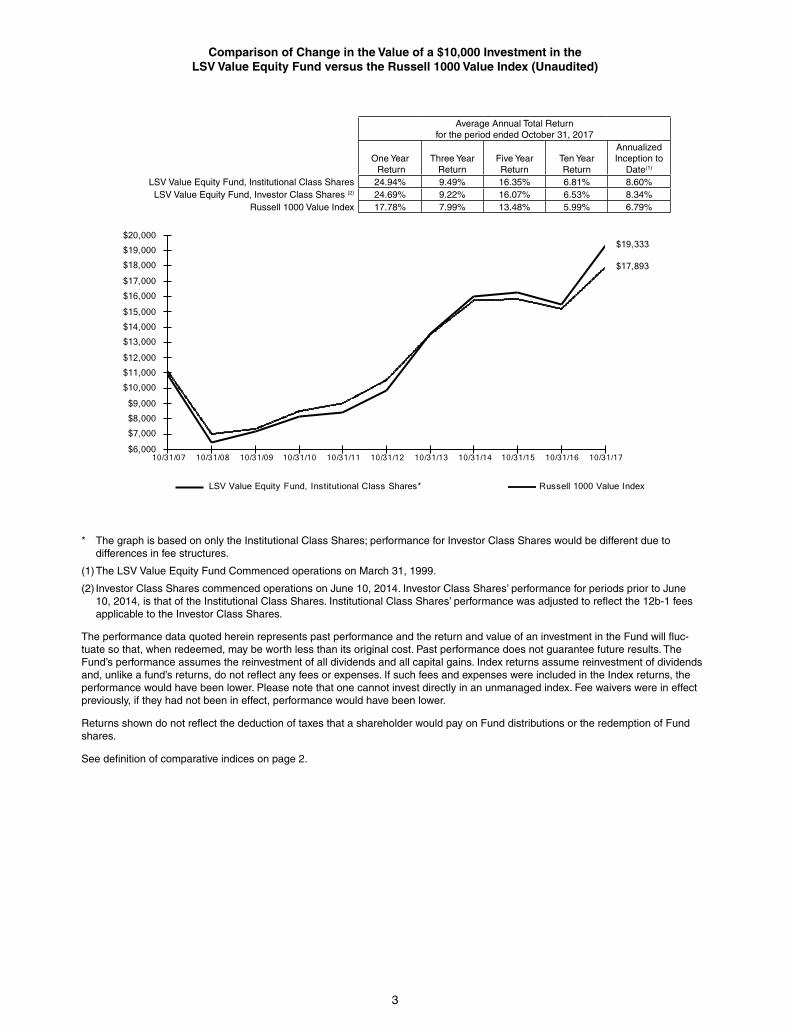
Comparison of Change in the Value of a $10,000 Investment in the LSV Value Equity Fund versus the Russell 1000 Value Index (Unaudited)
Average Annual Total Return for the period ended October 31, 2017
One Year Return
Three Year Return
Five Year Return
Ten Year Return
Annualized Inception to
Date(1)
LSV Value Equity Fund, Institutional Class Shares 24.94% 9.49% 16.35% 6.81% 8.60%LSV Value Equity Fund, Investor Class Shares (2) 24.69% 9.22% 16.07% 6.53% 8.34%
Russell 1000 Value Index 17.78% 7.99% 13.48% 5.99% 6.79%
$6,000
$7,000
$8,000
$9,000
$10,000
$11,000
$12,000
$13,000
$14,000
$15,000
$16,000
$17,000
$18,000
$19,000
$20,000
10/31/07 10/31/08 10/31/09 10/31/10 10/31/11 10/31/12 10/31/13 10/31/14 10/31/15 10/31/16 10/31/17
LSV Value Equity Fund, Institutional Class Shares* Russell 1000 Value Index
$19,333
$17,893
* The graph is based on only the Institutional Class Shares; performance for Investor Class Shares would be different due to differences in fee structures.
(1) The LSV Value Equity Fund Commenced operations on March 31, 1999.
(2) Investor Class Shares commenced operations on June 10, 2014. Investor Class Shares’ performance for periods prior to June 10, 2014, is that of the Institutional Class Shares. Institutional Class Shares’ performance was adjusted to reflect the 12b-1 fees applicable to the Investor Class Shares.
The performance data quoted herein represents past performance and the return and value of an investment in the Fund will fluc-tuate so that, when redeemed, may be worth less than its original cost. Past performance does not guarantee future results. The Fund’s performance assumes the reinvestment of all dividends and all capital gains. Index returns assume reinvestment of dividends and, unlike a fund’s returns, do not reflect any fees or expenses. If such fees and expenses were included in the Index returns, the performance would have been lower. Please note that one cannot invest directly in an unmanaged index. Fee waivers were in effect previously, if they had not been in effect, performance would have been lower.
Returns shown do not reflect the deduction of taxes that a shareholder would pay on Fund distributions or the redemption of Fund shares.
See definition of comparative indices on page 2.
4
October 31, 2017
The accompanying notes are an integral part of the financial statements
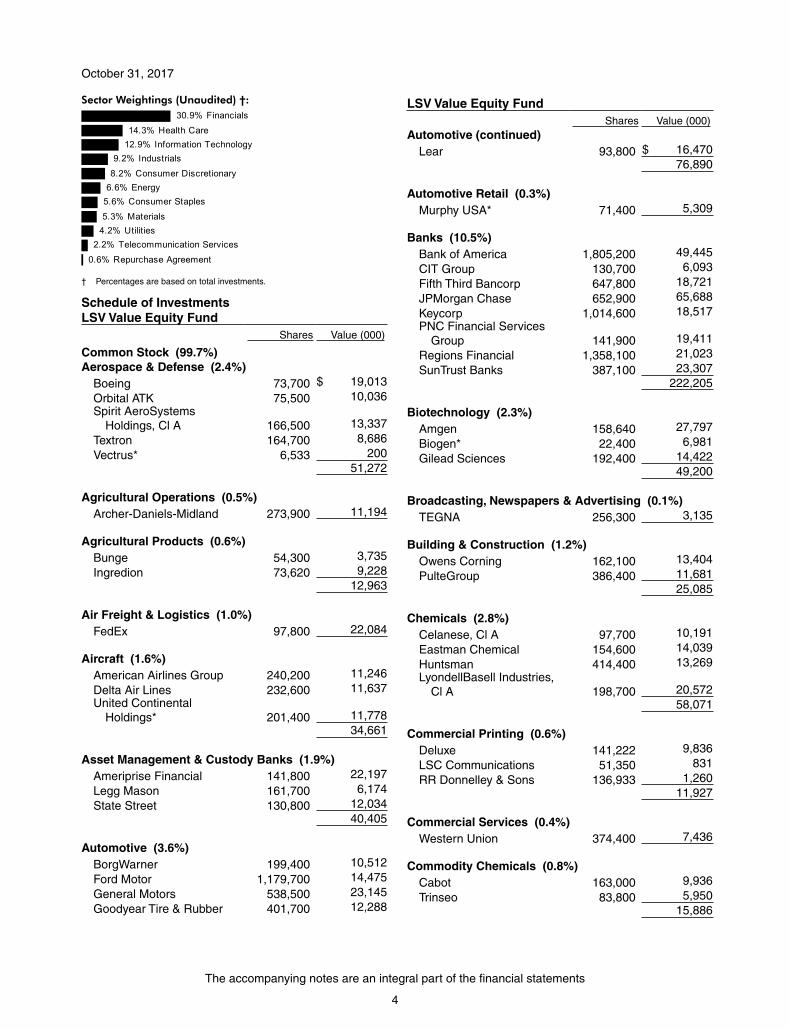
Sector Weightings (Unaudited) †:
0.6% Repurchase Agreement2.2% Telecommunication Services
4.2% Utilities5.3% Materials5.6% Consumer Staples6.6% Energy8.2% Consumer Discretionary9.2% Industrials
12.9% Information Technology14.3% Health Care
30.9% Financials
† Percentages are based on total investments.
Schedule of InvestmentsLSV Value Equity Fund
Shares Value (000)
Common Stock (99.7%)Aerospace & Defense (2.4%)
Boeing 73,700 $ 19,013Orbital ATK 75,500 10,036Spirit AeroSystems
Holdings, Cl A 166,500 13,337Textron 164,700 8,686Vectrus* 6,533 200
51,272
Agricultural Operations (0.5%)Archer-Daniels-Midland 273,900 11,194
Agricultural Products (0.6%)Bunge 54,300 3,735Ingredion 73,620 9,228
12,963
Air Freight & Logistics (1.0%)FedEx 97,800 22,084
Aircraft (1.6%)American Airlines Group 240,200 11,246Delta Air Lines 232,600 11,637United Continental
Holdings* 201,400 11,778 34,661
Asset Management & Custody Banks (1.9%)Ameriprise Financial 141,800 22,197Legg Mason 161,700 6,174State Street 130,800 12,034
40,405
Automotive (3.6%)BorgWarner 199,400 10,512Ford Motor 1,179,700 14,475General Motors 538,500 23,145Goodyear Tire & Rubber 401,700 12,288
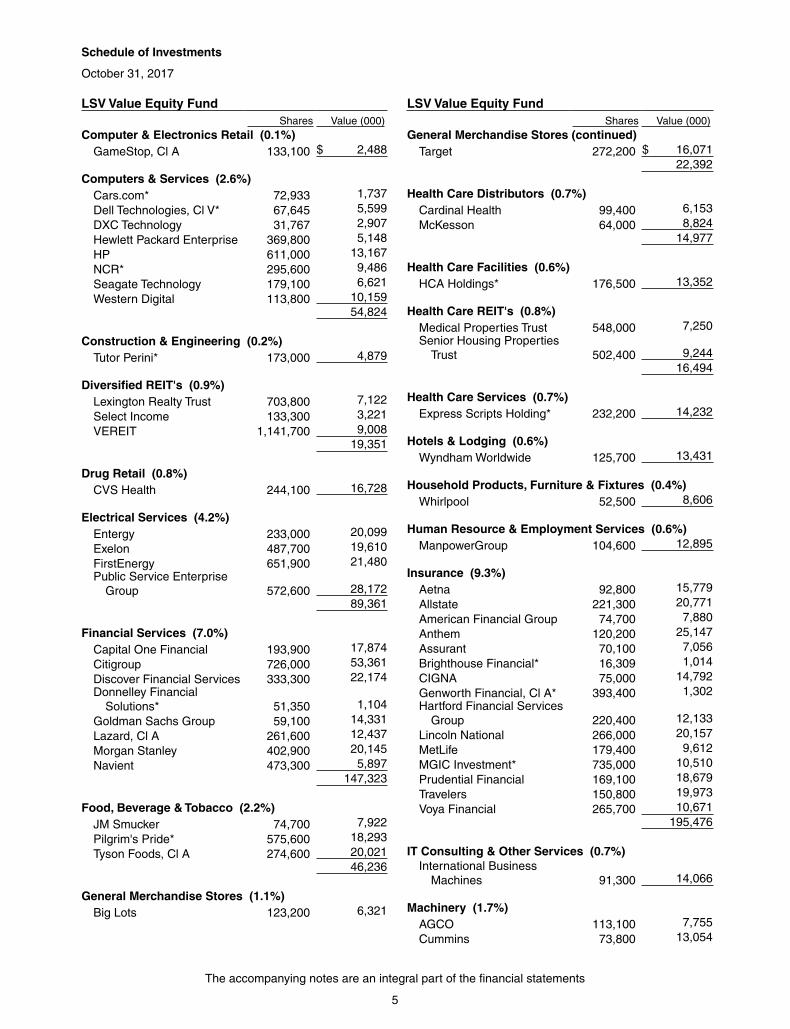
LSV Value Equity Fund Shares Value (000)Automotive (continued)
Lear 93,800 $ 16,470 76,890
Automotive Retail (0.3%)Murphy USA* 71,400 5,309
Banks (10.5%)Bank of America 1,805,200 49,445CIT Group 130,700 6,093Fifth Third Bancorp 647,800 18,721JPMorgan Chase 652,900 65,688Keycorp 1,014,600 18,517PNC Financial Services
Group 141,900 19,411Regions Financial 1,358,100 21,023SunTrust Banks 387,100 23,307
222,205
Biotechnology (2.3%)Amgen 158,640 27,797Biogen* 22,400 6,981Gilead Sciences 192,400 14,422
49,200
Broadcasting, Newspapers & Advertising (0.1%)TEGNA 256,300 3,135
Building & Construction (1.2%)Owens Corning 162,100 13,404PulteGroup 386,400 11,681
25,085
Chemicals (2.8%)Celanese, Cl A 97,700 10,191Eastman Chemical 154,600 14,039Huntsman 414,400 13,269LyondellBasell Industries,
Cl A 198,700 20,572 58,071
Commercial Printing (0.6%)Deluxe 141,222 9,836LSC Communications 51,350 831RR Donnelley & Sons 136,933 1,260
11,927
Commercial Services (0.4%)Western Union 374,400 7,436
Commodity Chemicals (0.8%)Cabot 163,000 9,936Trinseo 83,800 5,950
15,886
Schedule of Investments
5
October 31, 2017
The accompanying notes are an integral part of the financial statements
LSV Value Equity Fund Shares Value (000)Computer & Electronics Retail (0.1%)
GameStop, Cl A 133,100 $ 2,488
Computers & Services (2.6%)Cars.com* 72,933 1,737Dell Technologies, Cl V* 67,645 5,599DXC Technology 31,767 2,907Hewlett Packard Enterprise 369,800 5,148HP 611,000 13,167NCR* 295,600 9,486Seagate Technology 179,100 6,621Western Digital 113,800 10,159
54,824
Construction & Engineering (0.2%)Tutor Perini* 173,000 4,879
Diversified REIT's (0.9%)Lexington Realty Trust 703,800 7,122Select Income 133,300 3,221VEREIT 1,141,700 9,008
19,351
Drug Retail (0.8%)CVS Health 244,100 16,728
Electrical Services (4.2%)Entergy 233,000 20,099Exelon 487,700 19,610FirstEnergy 651,900 21,480Public Service Enterprise
Group 572,600 28,172 89,361
Financial Services (7.0%)Capital One Financial 193,900 17,874Citigroup 726,000 53,361Discover Financial Services 333,300 22,174Donnelley Financial
Solutions* 51,350 1,104Goldman Sachs Group 59,100 14,331Lazard, Cl A 261,600 12,437Morgan Stanley 402,900 20,145Navient 473,300 5,897
147,323
Food, Beverage & Tobacco (2.2%)JM Smucker 74,700 7,922Pilgrim's Pride* 575,600 18,293Tyson Foods, Cl A 274,600 20,021
46,236
General Merchandise Stores (1.1%)Big Lots 123,200 6,321
LSV Value Equity Fund Shares Value (000)General Merchandise Stores (continued)
Target 272,200 $ 16,071 22,392
Health Care Distributors (0.7%)Cardinal Health 99,400 6,153McKesson 64,000 8,824
14,977
Health Care Facilities (0.6%)HCA Holdings* 176,500 13,352
Health Care REIT's (0.8%)Medical Properties Trust 548,000 7,250Senior Housing Properties
Trust 502,400 9,244 16,494
Health Care Services (0.7%)Express Scripts Holding* 232,200 14,232
Hotels & Lodging (0.6%)Wyndham Worldwide 125,700 13,431
Household Products, Furniture & Fixtures (0.4%)Whirlpool 52,500 8,606
Human Resource & Employment Services (0.6%)ManpowerGroup 104,600 12,895
Insurance (9.3%)Aetna 92,800 15,779Allstate 221,300 20,771American Financial Group 74,700 7,880Anthem 120,200 25,147Assurant 70,100 7,056Brighthouse Financial* 16,309 1,014CIGNA 75,000 14,792Genworth Financial, Cl A* 393,400 1,302Hartford Financial Services
Group 220,400 12,133Lincoln National 266,000 20,157MetLife 179,400 9,612MGIC Investment* 735,000 10,510Prudential Financial 169,100 18,679Travelers 150,800 19,973Voya Financial 265,700 10,671
195,476
IT Consulting & Other Services (0.7%)International Business
Machines 91,300 14,066
Machinery (1.7%)AGCO 113,100 7,755Cummins 73,800 13,054
Schedule of Investments
6
October 31, 2017
The accompanying notes are an integral part of the financial statements
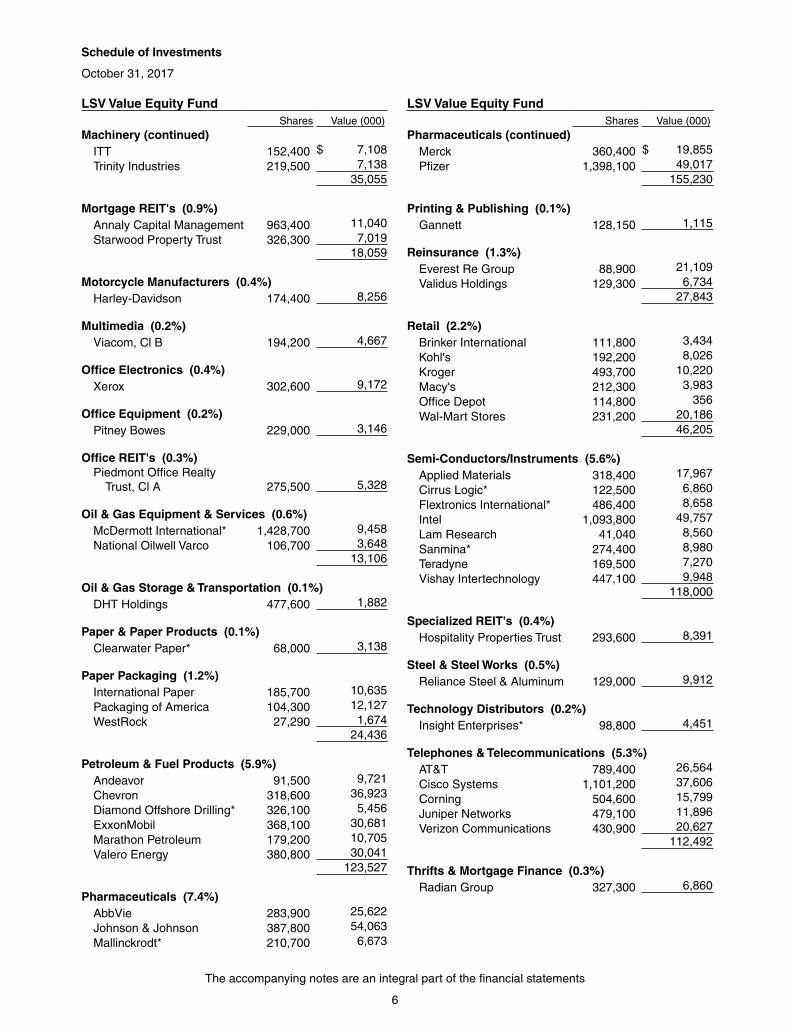
LSV Value Equity Fund Shares Value (000)Machinery (continued)
ITT 152,400 $ 7,108Trinity Industries 219,500 7,138
35,055
Mortgage REIT's (0.9%)Annaly Capital Management 963,400 11,040Starwood Property Trust 326,300 7,019
18,059
Motorcycle Manufacturers (0.4%)Harley-Davidson 174,400 8,256
Multimedia (0.2%)Viacom, Cl B 194,200 4,667
Office Electronics (0.4%)Xerox 302,600 9,172
Office Equipment (0.2%)Pitney Bowes 229,000 3,146
Office REIT's (0.3%)Piedmont Office Realty
Trust, Cl A 275,500 5,328
Oil & Gas Equipment & Services (0.6%)McDermott International* 1,428,700 9,458National Oilwell Varco 106,700 3,648
13,106
Oil & Gas Storage & Transportation (0.1%)DHT Holdings 477,600 1,882
Paper & Paper Products (0.1%)Clearwater Paper* 68,000 3,138
Paper Packaging (1.2%)International Paper 185,700 10,635Packaging of America 104,300 12,127WestRock 27,290 1,674
24,436
Petroleum & Fuel Products (5.9%)Andeavor 91,500 9,721Chevron 318,600 36,923Diamond Offshore Drilling* 326,100 5,456ExxonMobil 368,100 30,681Marathon Petroleum 179,200 10,705Valero Energy 380,800 30,041
123,527
Pharmaceuticals (7.4%)AbbVie 283,900 25,622Johnson & Johnson 387,800 54,063Mallinckrodt* 210,700 6,673
LSV Value Equity Fund Shares Value (000)Pharmaceuticals (continued)
Merck 360,400 $ 19,855Pfizer 1,398,100 49,017
155,230
Printing & Publishing (0.1%)Gannett 128,150 1,115
Reinsurance (1.3%)Everest Re Group 88,900 21,109Validus Holdings 129,300 6,734
27,843
Retail (2.2%)Brinker International 111,800 3,434Kohl's 192,200 8,026Kroger 493,700 10,220Macy's 212,300 3,983Office Depot 114,800 356Wal-Mart Stores 231,200 20,186
46,205
Semi-Conductors/Instruments (5.6%)Applied Materials 318,400 17,967Cirrus Logic* 122,500 6,860Flextronics International* 486,400 8,658Intel 1,093,800 49,757Lam Research 41,040 8,560Sanmina* 274,400 8,980Teradyne 169,500 7,270Vishay Intertechnology 447,100 9,948
118,000
Specialized REIT's (0.4%)Hospitality Properties Trust 293,600 8,391
Steel & Steel Works (0.5%)Reliance Steel & Aluminum 129,000 9,912
Technology Distributors (0.2%)Insight Enterprises* 98,800 4,451
Telephones & Telecommunications (5.3%)AT&T 789,400 26,564Cisco Systems 1,101,200 37,606Corning 504,600 15,799Juniper Networks 479,100 11,896Verizon Communications 430,900 20,627
112,492
Thrifts & Mortgage Finance (0.3%)Radian Group 327,300 6,860
Schedule of Investments
7
October 31, 2017
The accompanying notes are an integral part of the financial statements
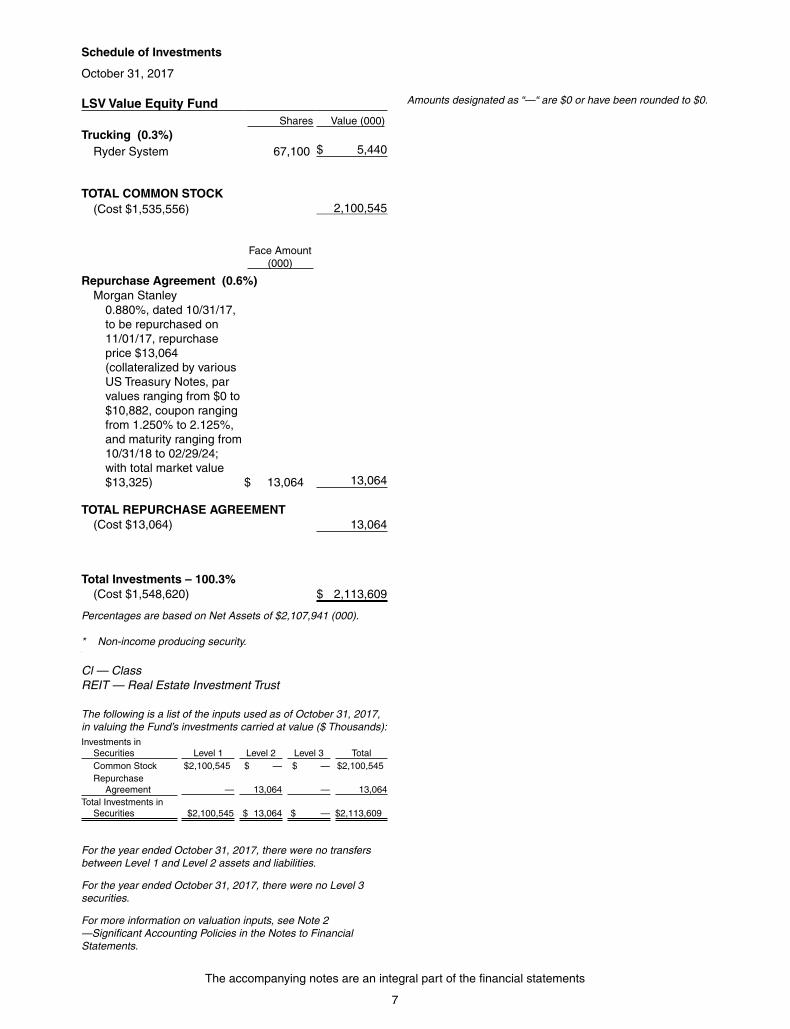
LSV Value Equity Fund Shares Value (000)Trucking (0.3%)
Ryder System 67,100 $ 5,440
TOTAL COMMON STOCK(Cost $1,535,556) 2,100,545
Face Amount (000)
Repurchase Agreement (0.6%)Morgan Stanley
0.880%, dated 10/31/17, to be repurchased on 11/01/17, repurchase price $13,064 (collateralized by various US Treasury Notes, par values ranging from $0 to $10,882, coupon ranging from 1.250% to 2.125%, and maturity ranging from 10/31/18 to 02/29/24; with total market value $13,325) $ 13,064 13,064
TOTAL REPURCHASE AGREEMENT(Cost $13,064) 13,064
Total Investments – 100.3%(Cost $1,548,620) $ 2,113,609
Percentages are based on Net Assets of $2,107,941 (000).
* Non-income producing security.Y
Cl — ClassREIT — Real Estate Investment Trust
The following is a list of the inputs used as of October 31, 2017, in valuing the Fund’s investments carried at value ($ Thousands):Investments in
Securities Level 1 Level 2 Level 3 TotalCommon Stock $2,100,545 $ — $ — $2,100,545Repurchase
Agreement — 13,064 — 13,064Total Investments in
Securities $ 2,100,545 $ 13,064 $ — $2,113,609
For the year ended October 31, 2017, there were no transfers between Level 1 and Level 2 assets and liabilities.
For the year ended October 31, 2017, there were no Level 3 securities.
For more information on valuation inputs, see Note 2 —Significant Accounting Policies in the Notes to Financial Statements.
Amounts designated as “—“ are $0 or have been rounded to $0.
8
The accompanying notes are an integral part of the financial statements
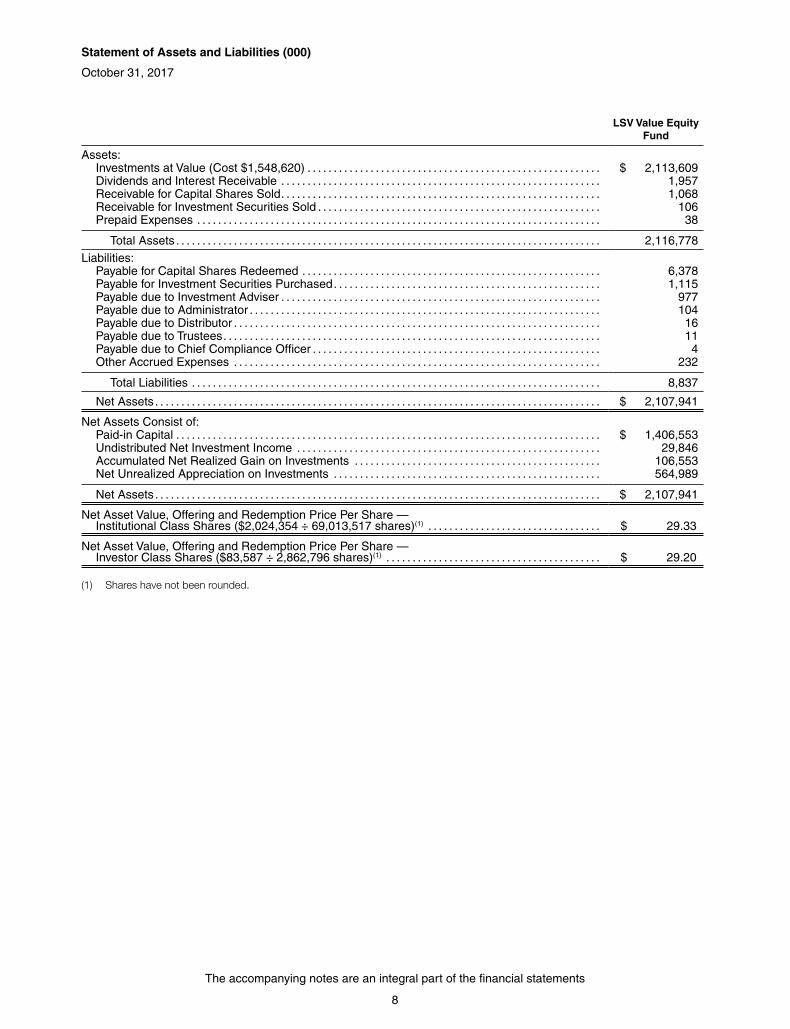
Statement of Assets and Liabilities (000)
October 31, 2017
LSV Value Equity Fund
Assets:Investments at Value (Cost $1,548,620) . . . . . . . . . . . . . . . . . . . . . . . . . . . . . . . . . . . . . . . . . . . . . . . . . . . . . . . . $ 2,113,609Dividends and Interest Receivable . . . . . . . . . . . . . . . . . . . . . . . . . . . . . . . . . . . . . . . . . . . . . . . . . . . . . . . . . . . . . 1,957Receivable for Capital Shares Sold . . . . . . . . . . . . . . . . . . . . . . . . . . . . . . . . . . . . . . . . . . . . . . . . . . . . . . . . . . . . . 1,068Receivable for Investment Securities Sold . . . . . . . . . . . . . . . . . . . . . . . . . . . . . . . . . . . . . . . . . . . . . . . . . . . . . . 106Prepaid Expenses . . . . . . . . . . . . . . . . . . . . . . . . . . . . . . . . . . . . . . . . . . . . . . . . . . . . . . . . . . . . . . . . . . . . . . . . . . . . . 38
Total Assets . . . . . . . . . . . . . . . . . . . . . . . . . . . . . . . . . . . . . . . . . . . . . . . . . . . . . . . . . . . . . . . . . . . . . . . . . . . . . . . . . 2,116,778
Liabilities:Payable for Capital Shares Redeemed . . . . . . . . . . . . . . . . . . . . . . . . . . . . . . . . . . . . . . . . . . . . . . . . . . . . . . . . . 6,378Payable for Investment Securities Purchased . . . . . . . . . . . . . . . . . . . . . . . . . . . . . . . . . . . . . . . . . . . . . . . . . . . 1,115Payable due to Investment Adviser . . . . . . . . . . . . . . . . . . . . . . . . . . . . . . . . . . . . . . . . . . . . . . . . . . . . . . . . . . . . . 977Payable due to Administrator . . . . . . . . . . . . . . . . . . . . . . . . . . . . . . . . . . . . . . . . . . . . . . . . . . . . . . . . . . . . . . . . . . . 104Payable due to Distributor . . . . . . . . . . . . . . . . . . . . . . . . . . . . . . . . . . . . . . . . . . . . . . . . . . . . . . . . . . . . . . . . . . . . . . 16Payable due to Trustees . . . . . . . . . . . . . . . . . . . . . . . . . . . . . . . . . . . . . . . . . . . . . . . . . . . . . . . . . . . . . . . . . . . . . . . . 11Payable due to Chief Compliance Officer . . . . . . . . . . . . . . . . . . . . . . . . . . . . . . . . . . . . . . . . . . . . . . . . . . . . . . . 4Other Accrued Expenses . . . . . . . . . . . . . . . . . . . . . . . . . . . . . . . . . . . . . . . . . . . . . . . . . . . . . . . . . . . . . . . . . . . . . . 232
Total Liabilities . . . . . . . . . . . . . . . . . . . . . . . . . . . . . . . . . . . . . . . . . . . . . . . . . . . . . . . . . . . . . . . . . . . . . . . . . . . . . . 8,837
Net Assets . . . . . . . . . . . . . . . . . . . . . . . . . . . . . . . . . . . . . . . . . . . . . . . . . . . . . . . . . . . . . . . . . . . . . . . . . . . . . . . . . . . . . $ 2,107,941
Net Assets Consist of:Paid-in Capital . . . . . . . . . . . . . . . . . . . . . . . . . . . . . . . . . . . . . . . . . . . . . . . . . . . . . . . . . . . . . . . . . . . . . . . . . . . . . . . . . $ 1,406,553Undistributed Net Investment Income . . . . . . . . . . . . . . . . . . . . . . . . . . . . . . . . . . . . . . . . . . . . . . . . . . . . . . . . . . 29,846Accumulated Net Realized Gain on Investments . . . . . . . . . . . . . . . . . . . . . . . . . . . . . . . . . . . . . . . . . . . . . . . 106,553Net Unrealized Appreciation on Investments . . . . . . . . . . . . . . . . . . . . . . . . . . . . . . . . . . . . . . . . . . . . . . . . . . . 564,989
Net Assets . . . . . . . . . . . . . . . . . . . . . . . . . . . . . . . . . . . . . . . . . . . . . . . . . . . . . . . . . . . . . . . . . . . . . . . . . . . . . . . . . . . . . $ 2,107,941
Net Asset Value, Offering and Redemption Price Per Share —Institutional Class Shares ($2,024,354 ÷ 69,013,517 shares)(1) . . . . . . . . . . . . . . . . . . . . . . . . . . . . . . . . . $ 29.33
Net Asset Value, Offering and Redemption Price Per Share —Investor Class Shares ($83,587 ÷ 2,862,796 shares)(1) . . . . . . . . . . . . . . . . . . . . . . . . . . . . . . . . . . . . . . . . . $ 29.20
(1) Shares have not been rounded.
9
The accompanying notes are an integral part of the financial statements
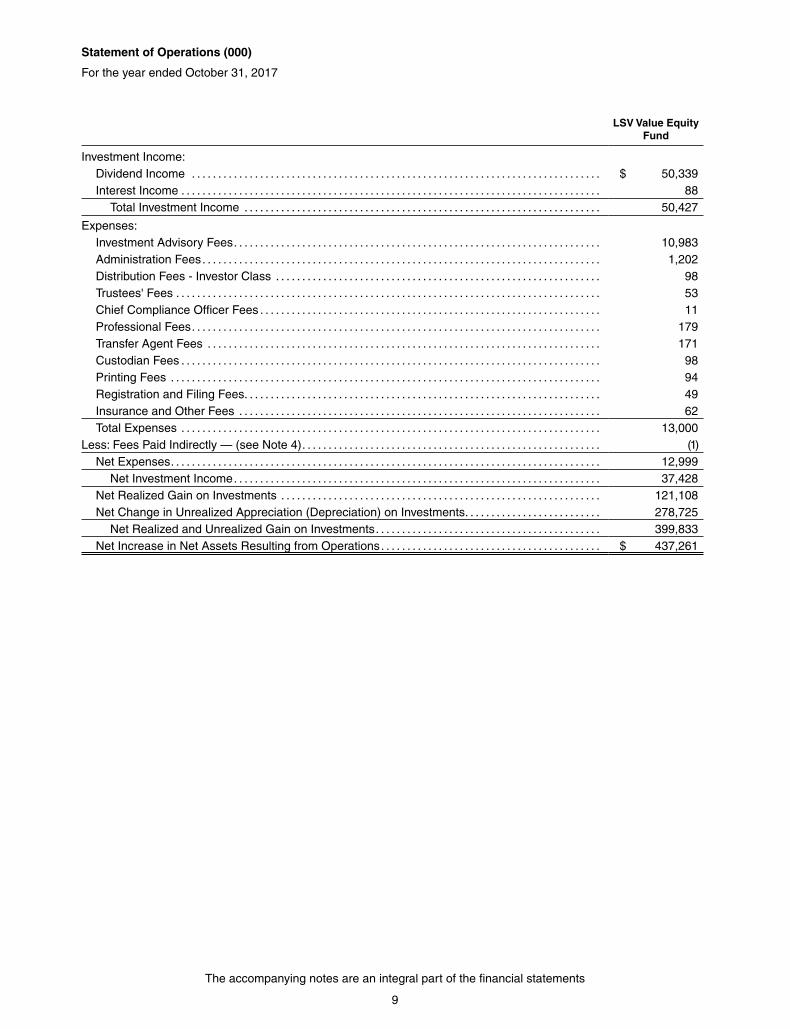
Statement of Operations (000)
For the year ended October 31, 2017
LSV Value Equity Fund
Investment Income:Dividend Income . . . . . . . . . . . . . . . . . . . . . . . . . . . . . . . . . . . . . . . . . . . . . . . . . . . . . . . . . . . . . . . . . . . . . . . . . . . . . . $ 50,339Interest Income . . . . . . . . . . . . . . . . . . . . . . . . . . . . . . . . . . . . . . . . . . . . . . . . . . . . . . . . . . . . . . . . . . . . . . . . . . . . . . . . 88
Total Investment Income . . . . . . . . . . . . . . . . . . . . . . . . . . . . . . . . . . . . . . . . . . . . . . . . . . . . . . . . . . . . . . . . . . . . 50,427
Expenses:Investment Advisory Fees . . . . . . . . . . . . . . . . . . . . . . . . . . . . . . . . . . . . . . . . . . . . . . . . . . . . . . . . . . . . . . . . . . . . . . 10,983Administration Fees . . . . . . . . . . . . . . . . . . . . . . . . . . . . . . . . . . . . . . . . . . . . . . . . . . . . . . . . . . . . . . . . . . . . . . . . . . . . 1,202Distribution Fees - Investor Class . . . . . . . . . . . . . . . . . . . . . . . . . . . . . . . . . . . . . . . . . . . . . . . . . . . . . . . . . . . . . . 98Trustees' Fees . . . . . . . . . . . . . . . . . . . . . . . . . . . . . . . . . . . . . . . . . . . . . . . . . . . . . . . . . . . . . . . . . . . . . . . . . . . . . . . . . 53Chief Compliance Officer Fees . . . . . . . . . . . . . . . . . . . . . . . . . . . . . . . . . . . . . . . . . . . . . . . . . . . . . . . . . . . . . . . . . 11Professional Fees . . . . . . . . . . . . . . . . . . . . . . . . . . . . . . . . . . . . . . . . . . . . . . . . . . . . . . . . . . . . . . . . . . . . . . . . . . . . . . 179Transfer Agent Fees . . . . . . . . . . . . . . . . . . . . . . . . . . . . . . . . . . . . . . . . . . . . . . . . . . . . . . . . . . . . . . . . . . . . . . . . . . . 171Custodian Fees . . . . . . . . . . . . . . . . . . . . . . . . . . . . . . . . . . . . . . . . . . . . . . . . . . . . . . . . . . . . . . . . . . . . . . . . . . . . . . . . 98Printing Fees . . . . . . . . . . . . . . . . . . . . . . . . . . . . . . . . . . . . . . . . . . . . . . . . . . . . . . . . . . . . . . . . . . . . . . . . . . . . . . . . . . 94Registration and Filing Fees . . . . . . . . . . . . . . . . . . . . . . . . . . . . . . . . . . . . . . . . . . . . . . . . . . . . . . . . . . . . . . . . . . . . 49Insurance and Other Fees . . . . . . . . . . . . . . . . . . . . . . . . . . . . . . . . . . . . . . . . . . . . . . . . . . . . . . . . . . . . . . . . . . . . . 62Total Expenses . . . . . . . . . . . . . . . . . . . . . . . . . . . . . . . . . . . . . . . . . . . . . . . . . . . . . . . . . . . . . . . . . . . . . . . . . . . . . . . . 13,000
Less: Fees Paid Indirectly — (see Note 4) . . . . . . . . . . . . . . . . . . . . . . . . . . . . . . . . . . . . . . . . . . . . . . . . . . . . . . . . . (1)Net Expenses . . . . . . . . . . . . . . . . . . . . . . . . . . . . . . . . . . . . . . . . . . . . . . . . . . . . . . . . . . . . . . . . . . . . . . . . . . . . . . . . . . 12,999
Net Investment Income . . . . . . . . . . . . . . . . . . . . . . . . . . . . . . . . . . . . . . . . . . . . . . . . . . . . . . . . . . . . . . . . . . . . . . 37,428Net Realized Gain on Investments . . . . . . . . . . . . . . . . . . . . . . . . . . . . . . . . . . . . . . . . . . . . . . . . . . . . . . . . . . . . . 121,108Net Change in Unrealized Appreciation (Depreciation) on Investments . . . . . . . . . . . . . . . . . . . . . . . . . . 278,725
Net Realized and Unrealized Gain on Investments . . . . . . . . . . . . . . . . . . . . . . . . . . . . . . . . . . . . . . . . . . . 399,833Net Increase in Net Assets Resulting from Operations . . . . . . . . . . . . . . . . . . . . . . . . . . . . . . . . . . . . . . . . . . $ 437,261
10
The accompanying notes are an integral part of the financial statements
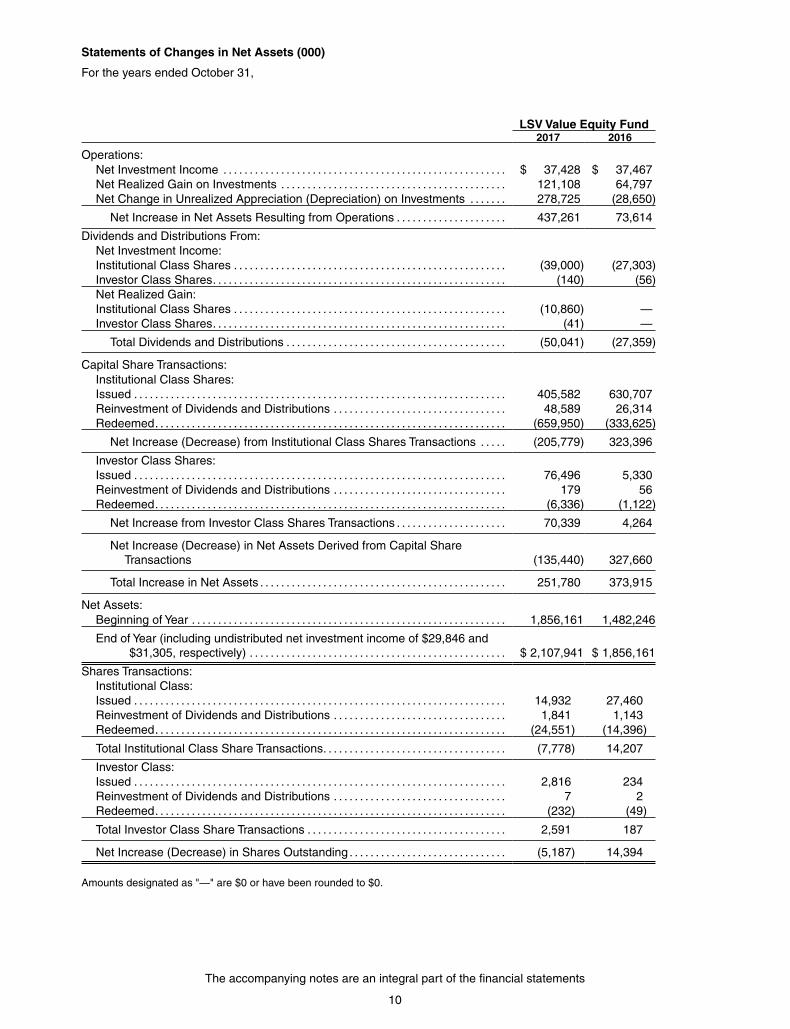
Statements of Changes in Net Assets (000)
For the years ended October 31,
LSV Value Equity Fund2017 2016
Operations:Net Investment Income . . . . . . . . . . . . . . . . . . . . . . . . . . . . . . . . . . . . . . . . . . . . . . . . . . . . . . $ 37,428 $ 37,467Net Realized Gain on Investments . . . . . . . . . . . . . . . . . . . . . . . . . . . . . . . . . . . . . . . . . . . 121,108 64,797Net Change in Unrealized Appreciation (Depreciation) on Investments . . . . . . . 278,725 (28,650)
Net Increase in Net Assets Resulting from Operations . . . . . . . . . . . . . . . . . . . . . 437,261 73,614
Dividends and Distributions From:Net Investment Income:Institutional Class Shares . . . . . . . . . . . . . . . . . . . . . . . . . . . . . . . . . . . . . . . . . . . . . . . . . . . . (39,000) (27,303)Investor Class Shares . . . . . . . . . . . . . . . . . . . . . . . . . . . . . . . . . . . . . . . . . . . . . . . . . . . . . . . . (140) (56)Net Realized Gain:Institutional Class Shares . . . . . . . . . . . . . . . . . . . . . . . . . . . . . . . . . . . . . . . . . . . . . . . . . . . . (10,860) —Investor Class Shares . . . . . . . . . . . . . . . . . . . . . . . . . . . . . . . . . . . . . . . . . . . . . . . . . . . . . . . . (41) —
Total Dividends and Distributions . . . . . . . . . . . . . . . . . . . . . . . . . . . . . . . . . . . . . . . . . . (50,041) (27,359)
Capital Share Transactions:Institutional Class Shares:Issued . . . . . . . . . . . . . . . . . . . . . . . . . . . . . . . . . . . . . . . . . . . . . . . . . . . . . . . . . . . . . . . . . . . . . . . 405,582 630,707Reinvestment of Dividends and Distributions . . . . . . . . . . . . . . . . . . . . . . . . . . . . . . . . . 48,589 26,314Redeemed . . . . . . . . . . . . . . . . . . . . . . . . . . . . . . . . . . . . . . . . . . . . . . . . . . . . . . . . . . . . . . . . . . . (659,950) (333,625)
Net Increase (Decrease) from Institutional Class Shares Transactions . . . . . (205,779) 323,396
Investor Class Shares:Issued . . . . . . . . . . . . . . . . . . . . . . . . . . . . . . . . . . . . . . . . . . . . . . . . . . . . . . . . . . . . . . . . . . . . . . . 76,496 5,330Reinvestment of Dividends and Distributions . . . . . . . . . . . . . . . . . . . . . . . . . . . . . . . . . 179 56Redeemed . . . . . . . . . . . . . . . . . . . . . . . . . . . . . . . . . . . . . . . . . . . . . . . . . . . . . . . . . . . . . . . . . . . (6,336) (1,122)
Net Increase from Investor Class Shares Transactions . . . . . . . . . . . . . . . . . . . . . 70,339 4,264
Net Increase (Decrease) in Net Assets Derived from Capital Share Transactions (135,440) 327,660
Total Increase in Net Assets . . . . . . . . . . . . . . . . . . . . . . . . . . . . . . . . . . . . . . . . . . . . . . . 251,780 373,915
Net Assets:Beginning of Year . . . . . . . . . . . . . . . . . . . . . . . . . . . . . . . . . . . . . . . . . . . . . . . . . . . . . . . . . . . . 1,856,161 1,482,246
End of Year (including undistributed net investment income of $29,846 and $31,305, respectively) . . . . . . . . . . . . . . . . . . . . . . . . . . . . . . . . . . . . . . . . . . . . . . . . . $ 2,107,941 $ 1,856,161
Shares Transactions:Institutional Class:Issued . . . . . . . . . . . . . . . . . . . . . . . . . . . . . . . . . . . . . . . . . . . . . . . . . . . . . . . . . . . . . . . . . . . . . . . 14,932 27,460Reinvestment of Dividends and Distributions . . . . . . . . . . . . . . . . . . . . . . . . . . . . . . . . . 1,841 1,143Redeemed . . . . . . . . . . . . . . . . . . . . . . . . . . . . . . . . . . . . . . . . . . . . . . . . . . . . . . . . . . . . . . . . . . . (24,551) (14,396)
Total Institutional Class Share Transactions . . . . . . . . . . . . . . . . . . . . . . . . . . . . . . . . . . . (7,778) 14,207
Investor Class:Issued . . . . . . . . . . . . . . . . . . . . . . . . . . . . . . . . . . . . . . . . . . . . . . . . . . . . . . . . . . . . . . . . . . . . . . . 2,816 234Reinvestment of Dividends and Distributions . . . . . . . . . . . . . . . . . . . . . . . . . . . . . . . . . 7 2Redeemed . . . . . . . . . . . . . . . . . . . . . . . . . . . . . . . . . . . . . . . . . . . . . . . . . . . . . . . . . . . . . . . . . . . (232) (49)
Total Investor Class Share Transactions . . . . . . . . . . . . . . . . . . . . . . . . . . . . . . . . . . . . . . 2,591 187
Net Increase (Decrease) in Shares Outstanding . . . . . . . . . . . . . . . . . . . . . . . . . . . . . . (5,187) 14,394
Amounts designated as "—" are $0 or have been rounded to $0.
11
The accompanying notes are an integral part of the financial statements
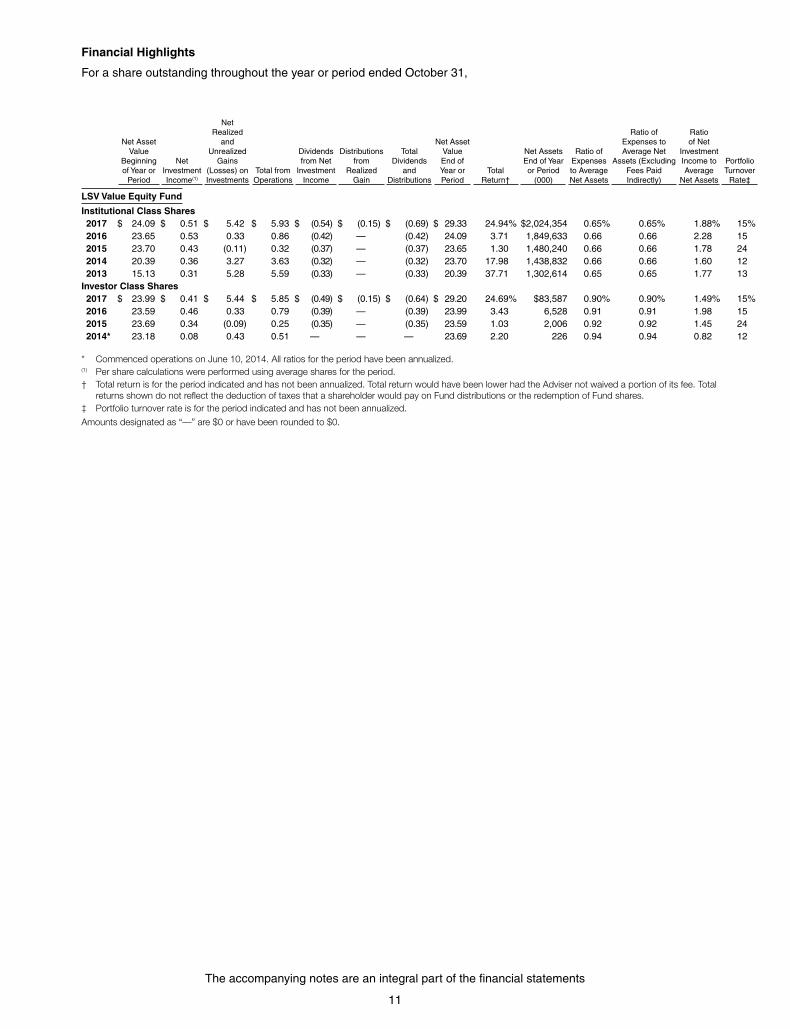
Financial Highlights
For a share outstanding throughout the year or period ended October 31,
Net Asset Value
Beginning of Year or
Period
Net Investment Income(1)
Net Realized
and Unrealized
Gains (Losses) on Investments
Total from Operations
Dividends from Net
Investment Income
Distributions from
Realized Gain
Total Dividends
and Distributions
Net Asset Value End of Year or Period
Total Return†
Net Assets End of Year or Period
(000)
Ratio of Expenses to Average Net Assets
Ratio of Expenses to Average Net
Assets (Excluding Fees Paid Indirectly)
Ratio of Net
Investment Income to Average
Net Assets
Portfolio Turnover
Rate‡
LSV Value Equity Fund
Institutional Class Shares2017 $ 24.09 $ 0.51 $ 5.42 $ 5.93 $ (0.54) $ (0.15) $ (0.69) $ 29.33 24.94% $2,024,354 0.65% 0.65% 1.88% 15%2016 23.65 0.53 0.33 0.86 (0.42) — (0.42) 24.09 3.71 1,849,633 0.66 0.66 2.28 152015 23.70 0.43 (0.11) 0.32 (0.37) — (0.37) 23.65 1.30 1,480,240 0.66 0.66 1.78 242014 20.39 0.36 3.27 3.63 (0.32) — (0.32) 23.70 17.98 1,438,832 0.66 0.66 1.60 122013 15.13 0.31 5.28 5.59 (0.33) — (0.33) 20.39 37.71 1,302,614 0.65 0.65 1.77 13
Investor Class Shares2017 $ 23.99 $ 0.41 $ 5.44 $ 5.85 $ (0.49) $ (0.15) $ (0.64) $ 29.20 24.69% $83,587 0.90% 0.90% 1.49% 15%2016 23.59 0.46 0.33 0.79 (0.39) — (0.39) 23.99 3.43 6,528 0.91 0.91 1.98 152015 23.69 0.34 (0.09) 0.25 (0.35) — (0.35) 23.59 1.03 2,006 0.92 0.92 1.45 242014* 23.18 0.08 0.43 0.51 — — — 23.69 2.20 226 0.94 0.94 0.82 12
* Commenced operations on June 10, 2014. All ratios for the period have been annualized.(1) Per share calculations were performed using average shares for the period.† Total return is for the period indicated and has not been annualized. Total return would have been lower had the Adviser not waived a portion of its fee. Total
returns shown do not reflect the deduction of taxes that a shareholder would pay on Fund distributions or the redemption of Fund shares.‡ Portfolio turnover rate is for the period indicated and has not been annualized.
Amounts designated as “—” are $0 or have been rounded to $0.
Notes to Financial Statements
12
October 31, 2017
1. Organization:
The Advisors’ Inner Circle Fund (the “Trust”) is organized as a Massachusetts business trust under an Amended and Restated Agreement and Declaration of Trust dated February 18, 1997. The Trust is registered under the Investment Company Act of 1940, as amended, as an open-end management investment company with 53 funds. The financial statements herein are those of the LSV Value Equity Fund, a diversified Fund (the “Fund”). The Fund seeks long-term growth of capital by investing in undervalued stocks which are out of favor in the market. The financial statements of the remaining funds of the Trust are not presented herein, but are presented separately. The assets of each fund are segregated, and a shareholder’s interest is limited to the fund in which shares are held.
2. Significant Accounting Policies:
The following is a summary of the significant accounting policies followed by the Fund. The Fund is an investment company in conformity with U.S. generally accepted accounting principles (“U.S. GAAP”). Therefore, the Fund follows the accounting and reporting guidelines for investment companies.
Use of Estimates — The preparation of financial statements, in conformity with U.S. GAAP requires management to make estimates and assumptions that affect the fair value of assets and liabilities and disclosure of contingent assets and liabilities at the date of the financial statements and the reported amounts of increases and decreases in net assets from operations during the reporting period. Actual results could differ from those estimates and such differences could be material.
Security Valuation — Securities listed on a securities exchange, market or automated quotation system for which quotations are readily available (except for securities traded on NASDAQ), including securities traded over the counter, are valued at the last quoted sale price on an exchange or market (foreign or domestic) on which they are traded on the valuation date (or at approximately 4:00 pm ET if a security’s primary exchange is normally open at that time), or, if there is no such reported sale on the valuation date, at the most recent quoted bid price. For securities traded on NASDAQ, the NASDAQ Official Closing Price will be used. The prices for foreign securities are reported in local currency and converted to U.S. dollars using currency exchange rates.
Securities for which market prices are not “readily available” are valued in accordance with Fair Value Procedures established by the Fund’s Board of
Trustees (the “Board”). The Fund’s Fair Value Proce-dures are implemented through a Fair Value Com-mittee (the “Committee”) designated by the Board. Some of the more common reasons that may ne-cessitate that a security be valued using Fair Value Procedures include: the security’s trading has been halted or suspended; the security has been de-listed from a national exchange; the security’s primary trading market is temporarily closed at a time when under normal conditions it would be open; the secu-rity has not been traded for an extended period of time; the security’s primary pricing source is not able or willing to provide a price; or trading of the security is subject to local government-imposed restrictions. When a security is valued in accordance with the Fair Value Procedures, the Committee will determine the value after taking into consideration relevant in-formation reasonably available to the Committee. As of October 31, 2017, there were no securities valued in accordance with Fair Value procedures.
In accordance with the authoritative guidance on fair value measurements and disclosure under U.S. GAAP, the Fund discloses fair value of its invest-ments in a hierarchy that prioritizes the inputs to valuation techniques used to measure the fair value. The objective of a fair value measurement is to determine the price that would be received to sell an asset or paid to transfer a liability in an orderly trans-action between market participants at the measure-ment date (an exit price). Accordingly, the fair value hierarchy gives the highest priority to quoted prices unadjusted in active markets for priority to unob-servable inputs (Level 3). The three levels of the fair value hierarchy are described below:
Level 1 — Unadjusted quoted prices in active markets for identical, unrestricted assets or liabil-ities that the Fund has the ability to access at the measurement date;
Level 2 — Other significant observable inputs (in-cludes quoted prices for similar securities, interest rates, prepayment speeds, credit risk, referenced indices, quoted prices in in active markets, adjusted quoted prices in active markets, etc.); and
Level 3 — Prices, inputs or proprietary modeling techniques which are both significant to the fair value measurement and unobservable (supported by little or no market activity).
Investments are classified within the level of the low-est significant input considered in determining fair value. Investments classified within Level 3 whose fair value measurement considers several inputs may include Level 1 or Level 2 inputs as compo-nents of the overall fair value measurement.
Notes to Financial Statements
13
October 31, 2017
For the year ended October 31, 2017, there have been no significant changes to the Fund’s fair valua-tion methodologies.
Federal Income Taxes — It is the Fund’s intention to continue to qualify as a regulated investment company for Federal income tax purposes by complying with the appropriate provisions of Subchapter M of the Internal Revenue Code of 1986, as amended and to distribute substantially all of its income to shareholders. Accordingly, no provision for Federal income taxes has been made in the financial statements.
The Fund evaluates tax positions taken or expected to be taken in the course of preparing the Fund’s tax returns to determine whether it is “more-likely-than-not” (i.e., greater than 50-percent) that each tax position will be sustained upon examination by a taxing authority based on the technical merits of the position. Tax positions not deemed to meet the more-likely-than-not threshold are recorded as a tax benefit or expense in the current year. The Fund did not record any tax provision in the current period. However, management’s conclusions regarding tax positions taken may be subject to review and adjustment at a later date based on factors includ-ing, but not limited to, examination by tax authori-ties on open tax years (i.e. the last three open tax year ends, as applicable), on-going analysis of and changes to tax laws, regulations and interpretations thereof.
As of and during the year ended October 31, 2017, the Fund did not have a liability for any unrecog-nized tax benefits. The Fund recognizes interest and penalties, if any, related to unrecognized tax benefits as income tax expense in the Statement of Opera-tions. During the year ended October 31, 2017, the Fund did not incur any interest or penalties.
Security Transactions and Investment Income — Security transactions are accounted for on trade date for financial reporting purposes. Costs used in determining realized gains or losses on the sale of investment securities are based on the specific identification method. Dividend income is recorded on the ex-dividend date. Interest income is recognized on the accrual basis from settlement date.
Investments in Real Estate Investment Trusts (REITs) — With respect to the Fund, dividend income is recorded based on the income included in distributions received from the REIT investments using published REIT reclassifications including some management estimates when actual amounts are not available. Distributions received
in excess of this estimated amount are recorded as a reduction of the cost of investments or reclassified to capital gains. The actual amounts of income, return of capital, and capital gains are only determined by each REIT after its fiscal year-end, and may differ from the estimated amounts.
Repurchase Agreements — In connection with transactions involving repurchase agreements, a third party custodian bank takes possession of the underlying securities (“collateral”), the value of which exceeds the principal amount of the repurchase transaction, including accrued interest. Such collateral will be cash, debt securities issued or guaranteed by the U.S. Government, securities that at the time the repurchase agreement is entered into are rated in the highest category by a nationally recognized statistical rating organization (“NRSRO”) or unrated category by an NRSRO, as determined by the Adviser. In the event of default on the obligation to repurchase, the Fund has the right to liquidate the collateral and apply the proceeds in satisfaction of the obligation. In the event of default or bankruptcy by the counterparty to the agreement, realization and/or retention of the collateral or proceeds may be subject to legal proceedings.
Repurchase agreements are entered into by the Fund under Master Repurchase Agreements (“MRA”) which permit the Fund, under certain circumstances including an event of default (such as bankruptcy or insolvency), to offset payables and/or receivables under the MRA with collateral held and/ or posted to the counterparty and create one single net payment due to or from the Fund.
At October 31, 2017, the open repurchase agree-ments by counterparty which are subject to a MRA on a net payment basis are as follows (000):
CounterpartyRepurchase Agreement
Fair Value of
Non-Cash Collateral
Received(1)
Cash Collateral
Received(1) Net Amount(2)
Morgan Stanley $ 13,064 $ 13,064 $ — $ —
(1) The amount of collateral reflected in the table does not include any over-collateralization received by the Fund.(2) Net amount represents the net amount receivable due from the counterparty in the event of default.
Expenses— Expenses that are directly related to the Fund are charged to the Fund. Other operating expenses of the Trust are prorated to the Fund based on the number of funds and/or relative daily net assets
Classes— Class specific expenses are borne by that class of shares. Income, realized and
Notes to Financial Statements
14
October 31, 2017
unrealized gains and losses and non-class specific expenses are allocated to the respective class on the basis of relative daily net assets.
Dividends and Distributions to Shareholders— Dividends from net investment income, if any, are declared and paid to shareholders annually. Any net realized capital gains are distributed to shareholders at least annually.
3. Transactions with Affiliates:
Certain officers of the Trust are also employees of SEI Investments Global Funds Services (the “Administrator”), a wholly owned subsidiary of SEI Investments Company and/or SEI Investments Distribution Co. (the “Distributor”). Such officers are paid no fees by the Trust for serving as officers of the Trust other than the Chief Compliance Officer (“CCO”) as described below.
A portion of the services provided by the CCO and his staff, whom are employees of the Administrator, are paid for by the Trust as incurred. The services include regulatory oversight of the Trust’s Advisors and service providers as required by SEC regulations. The CCO’s services have been approved by and reviewed by the Board.
4. Administration, Distribution, Transfer Agency and Custodian Agreements:
The Fund, along with other series of the Trust advised by LSV Asset Management (the “Adviser”), and the Administrator are parties to an Administration Agreement, under which the Administrator provides administrative services to the Fund. For these services, the Administrator is paid an asset based fee, subject to certain minimums, which will vary depending on the number of share classes and the average daily net assets of the Fund. For the year ended October 31, 2017, the Fund paid $1,202,383 for these services.
The Trust and Distributor are parties to a Distribution Agreement dated November 14, 1991, as Amended and Restated November 14, 2005. The Distributor receives no fees for its distribution services under this agreement.
The Fund has adopted a distribution plan under the Rule 12b-1 under the 1940 Act for Investor Class Shares that allows the Fund to pay distribution and service fees for the sale and distribution of its shares, and for services provided to shareholders. The maximum annual distribution fee for Investor Class Shares of the Fund is 0.25% annually of the average daily net assets. For the year ended October 31, 2017, the Fund incurred $98,157 of distribution fees.
DST Systems, Inc. serves as the transfer agent and dividend disbursing agent for the Fund under a transfer
agency agreement with the Trust. During the year ended October 31, 2017, the Fund earned $1,390 in cash management credits which were used to offset transfer agent expenses. This amount is labeled as “Fees Paid Indirectly” on the Statement of Operations.
U.S. Bank, N.A. acts as custodian (the “Custodian”) for the Fund. The Custodian plays no role in determining the investment policies of the Fund or which securities are to be purchased and sold by the Fund.
5. Investment Advisory Agreement:
The Trust and the Adviser are parties to an Investment Advisory Agreement, under which the Adviser receives an annual fee equal to 0.55% of the Fund’s average daily net assets.
6. Investment Transactions:
The cost of security purchases and the proceeds from security sales, other than short-term investments, for the year ended October 31, 2017, were as follows (000):
PurchasesOther . . . . . . . . . . . . . . . . . . . . . . . $ 290,195
SalesOther . . . . . . . . . . . . . . . . . . . . . . . $ 439,769
7. Federal Tax Information:
The amount and character of income and capital gain distributions to be paid, if any, are determined in accordance with Federal income tax regulations, which may differ from U.S. GAAP. As a result, net investment income (loss) and net realized gain (loss) on investment transactions for a reporting period may differ significantly from distributions during such period. These book/tax differences may be temporary or permanent. To the extent these differences are permanent in nature, they are charged or credited to undistributed net investment income (loss), accumulated net realized gain (loss) or to paid-in-capital, as appropriate, in the period that the differences arise.
Accordingly, the following permanent differences, primarily attributable to investments in REITs and partnerships have been reclassified to (from) the following accounts (000):
Undistributed Net Investment Income (Loss)
Accumulated Realized Gain
(Loss) Paid in Capital
$ 253 $ (370) $ 117 These reclassifications have no impact on net assets or net asset value per share.
Notes to Financial Statements
15
October 31, 2017
The tax character of dividends and distributions paid during the years ended October 31, 2017 and 2016 was as follows (000):
Ordinary Income
Long Term Capital Gain Total
2017 $ 39,140 $ 10,901 $ 50,0412016 27,359 — 27,359
As of October 31, 2017, the components of distributable earnings on a tax basis were as follows (000):
Undistributed Ordinary Income $ 39,600Undistributed Long-Term Capital Gain 96,691Unrealized Appreciation 565,097Total Distributable Earnings $ 701,388
Under the Regulated Investment Company Modernization Act of 2010, the Fund is permitted to carry forward capital losses incurred in taxable years beginning after December 22, 2010 for an unlimited period. Additionally, post-enactment capital losses that are carried forward will retain their character as either short-term or long-term capital losses rather than being considered all short-term as under previous law.
During the year ended October 31, 2017, no capital loss carryforwards were utilized to offset capital gains.
The total cost of securities for Federal income tax purposes and the aggregate gross unrealized appreciation and depreciation on investments held by the Fund at October 31, 2017, were as follows (000):
Federal Tax Cost
Aggregated Gross
Unrealized Appreciation
Aggregated Gross
Unrealized Depreciation
Net Unrealized
Appreciation $ 1,548,512 $ 645,440 $ (80,343) $ 565,097
8. Other:
At October 31, 2017, 46% of total shares outstanding for the Institutional Class Shares were held by two record shareholders each owning 10% or greater of the aggregate total shares outstanding. At October 31, 2017, 96% of total shares outstanding for the Investor Class Shares were held by one record shareholder owning 10% or greater of the aggregate total shares outstanding. These shareholders were comprised of omnibus accounts that were held on behalf of various individual shareholders.
In the normal course of business, the Fund enters into contracts that provide general indemnifications. The Fund’s maximum exposure under these arrangements is dependent on future claims that may be made against the Fund and, therefore, cannot be estimated; however, based on experience, the risk of loss from such claims is considered remote.
9. Regulatory Matters:
In October 2016, the U.S. Securities and Exchange Commission adopted new rules and amended existing rules (together, final rules) intended to modernize the reporting and disclosure of information by registered investment companies. In part, the final rules amended Regulation S-X and require standardized, enhanced disclosures about derivatives in investment company financial statements, as well as other amendments. As of August 1, 2017, management has implemented the amendments to Regulation S-X, which did not have a material impact on the Fund’s financial statements and related disclosures or impact the Fund’s net assets or results of operations.
10. Subsequent Events:
The Fund has evaluated the need for additional disclosures and/or adjustments resulting from subsequent events through the date the financial statements were issued. Based on this evaluation, no additional disclosures or adjustments were required to the financial statements.
16
Report of Independent Registered Public Accounting Firm
To the Board of Trustees of The Advisors’ Inner Circle Fund and Shareholders of LSV Value Equity Fund
We have audited the accompanying statement of assets and liabilities, including the schedule of investments, of LSV Value Equity Fund (one of the series constituting The Advisors’ Inner Circle Fund (the “Trust”)) as of October 31, 2017, and the related statement of operations for the year then ended, the statements of changes in net assets for each of the two years in the period then ended, and the financial highlights for each of the years or periods indicated therein. These financial statements and financial highlights are the responsibility of the Trust’s management. Our responsibility is to express an opinion on these financial statements and financial highlights based on our audits.
We conducted our audits in accordance with the standards of the Public Company Accounting Oversight Board (Unit-ed States). Those standards require that we plan and perform the audit to obtain reasonable assurance about whether the financial statements and financial highlights are free of material misstatement. We were not engaged to perform an audit of the Trust’s internal control over financial reporting. Our audits included consideration of internal control over financial reporting as a basis for designing audit procedures that are appropriate in the circumstances, but not for the purpose of expressing an opinion on the effectiveness of the Trust’s internal control over financial reporting. Accord-ingly, we express no such opinion. An audit also includes examining, on a test basis, evidence supporting the amounts and disclosures in the financial statements and financial highlights, assessing the accounting principles used and sig-nificant estimates made by management, and evaluating the overall financial statement presentation. Our procedures included confirmation of securities owned as of October 31, 2017, by correspondence with the custodian and brokers or by other appropriate auditing procedures where replies from brokers were not received. We believe that our audits provide a reasonable basis for our opinion.
In our opinion, the financial statements and financial highlights referred to above present fairly, in all material respects, the financial position of LSV Value Equity Fund (one of the series constituting The Advisors’ Inner Circle Fund) at October 31, 2017, the results of its operations for the year then ended, the changes in its net assets for each of the two years in the period then ended, and its financial highlights for each of the years or periods indicated therein, in conformity with U.S. generally accepted accounting principles.
Philadelphia, Pennsylvania December 26, 2017

17
Disclosure of Fund Expenses (Unaudited)
All mutual funds have operating expenses. As a shareholder of a mutual fund, your investment is affected by these ongoing costs, which include (among others) costs for portfolio management, administrative services, and shareholder reports like this one. It is important for you to understand the impact of these costs on your investment returns.
Operating expenses such as these are deducted from the mutual fund’s gross income and directly reduce your final investment return. These expenses are expressed as a percentage of the mutual fund’s average net assets; this per-centage is known as the mutual fund’s expense ratio.
The following examples use the expense ratio and are intended to help you understand the ongoing costs (in dollars) of investing in your Fund and to compare these costs with those of other mutual funds. The examples are based on an investment of $1,000 made at the beginning of the period and held for the entire period from May 1, 2017 to October 31, 2017.
The table below illustrates your Fund’s costs in two ways:
• Actual fund return. This section helps you to estimate the actual expenses after fee waivers that your Fund in-curred over the period. The “Expenses Paid During Period” column shows the actual dollar expense cost incurred by a $1,000 investment in the Fund, and the “Ending Account Value” number is derived from deducting that expense cost from the Fund’s gross investment return.
You can use this information, together with the actual amount you invested in the Fund, to estimate the expenses you paid over that period. Simply divide your account value by $1,000 to arrive at a ratio (for example, an $8,600 account value divided by $1,000 = $8.6), then multiply that ratio by the number shown for your Fund under “Expenses Paid During Period.”
• Hypothetical 5% return. This section helps you compare your Fund’s costs with those of other mutual funds. It as-sumes that the Fund had an annual 5% return before expenses during the period, but that the expense ratio (Column 3) is unchanged. This example is useful in making comparisons because the Securities and Exchange Commission requires all mutual funds to make this 5% calculation. You can assess your Fund’s comparative cost by comparing the hypothetical result for your Fund in the “Expense Paid During Period” column with those that appear in the same charts in the shareholder reports for other mutual funds.
NOTE: Because the hypothetical return is set at 5% for comparison purposes — NOT your Fund’s actual return —the account values shown do not apply to your specific investment.
Beginning Account
Value 05/01/17
Ending Account
Value 10/31/17
Annualized Expense Ratios
Expenses Paid
During Period*
LSV Value Equity Fund
Actual Fund ReturnInstitutional Class Shares $1,000.00 $1,091.60 0.65% $3.40Investor Class Shares 1,000.00 1,090.40 0.90 4.72
Hypothetical 5% ReturnInstitutional Class Shares $1,000.00 $1,021.96 0.65% $3.28Investor Class Shares 1,000.00 1,020.69 0.90 4.56
* Expenses are equal to the Fund’s annualized expense ratio multiplied by the average account value over the period, multiplied by 184/365 (to reflect the one-half year period).
18
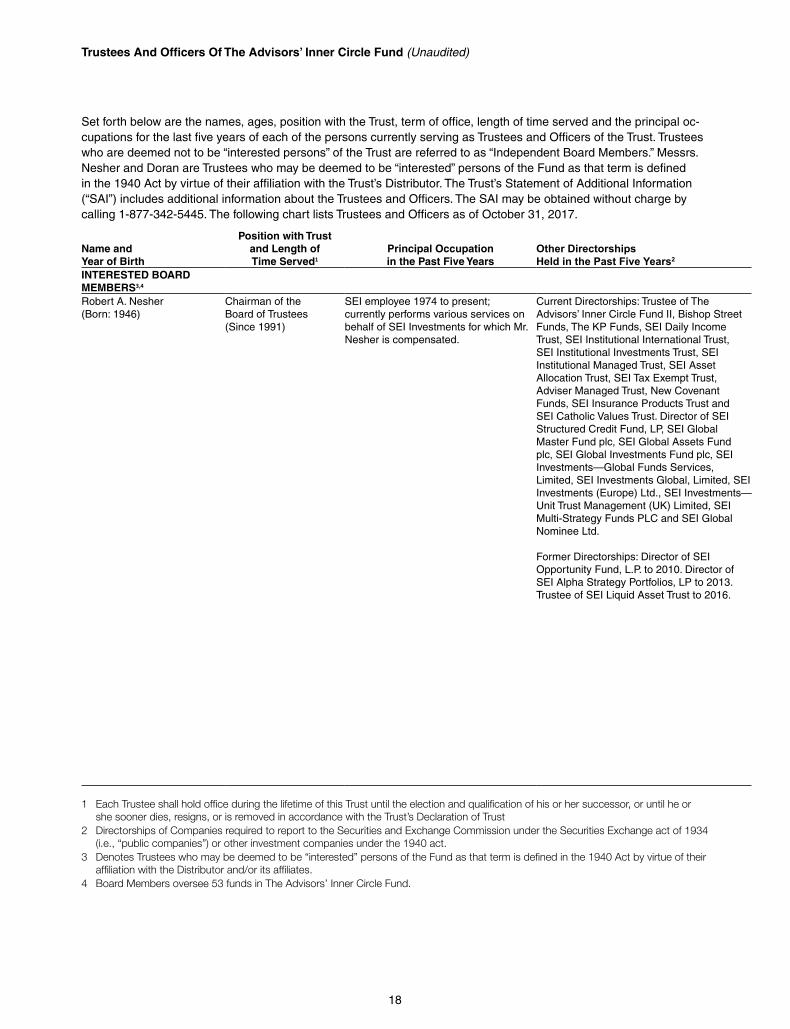
Trustees And Officers Of The Advisors’ Inner Circle Fund (Unaudited)
Set forth below are the names, ages, position with the Trust, term of office, length of time served and the principal oc-cupations for the last five years of each of the persons currently serving as Trustees and Officers of the Trust. Trustees who are deemed not to be “interested persons” of the Trust are referred to as “Independent Board Members.” Messrs. Nesher and Doran are Trustees who may be deemed to be “interested” persons of the Fund as that term is defined in the 1940 Act by virtue of their affiliation with the Trust’s Distributor. The Trust’s Statement of Additional Information (“SAI”) includes additional information about the Trustees and Officers. The SAI may be obtained without charge by calling 1-877-342-5445. The following chart lists Trustees and Officers as of October 31, 2017.
Name and Year of Birth
Position with Trust and Length of Time Served1
Principal Occupation in the Past Five Years
Other Directorships Held in the Past Five Years2
INTERESTED BOARD MEMBERS3,4
Robert A. Nesher (Born: 1946)
Chairman of the Board of Trustees (Since 1991)
SEI employee 1974 to present; currently performs various services on behalf of SEI Investments for which Mr. Nesher is compensated.
Current Directorships: Trustee of The Advisors’ Inner Circle Fund II, Bishop Street Funds, The KP Funds, SEI Daily Income Trust, SEI Institutional International Trust, SEI Institutional Investments Trust, SEI Institutional Managed Trust, SEI Asset Allocation Trust, SEI Tax Exempt Trust, Adviser Managed Trust, New Covenant Funds, SEI Insurance Products Trust and SEI Catholic Values Trust. Director of SEI Structured Credit Fund, LP, SEI Global Master Fund plc, SEI Global Assets Fund plc, SEI Global Investments Fund plc, SEI Investments—Global Funds Services, Limited, SEI Investments Global, Limited, SEI Investments (Europe) Ltd., SEI Investments—Unit Trust Management (UK) Limited, SEI Multi-Strategy Funds PLC and SEI Global Nominee Ltd.
Former Directorships: Director of SEI Opportunity Fund, L.P. to 2010. Director of SEI Alpha Strategy Portfolios, LP to 2013. Trustee of SEI Liquid Asset Trust to 2016.
1 Each Trustee shall hold office during the lifetime of this Trust until the election and qualification of his or her successor, or until he or she sooner dies, resigns, or is removed in accordance with the Trust’s Declaration of Trust
2 Directorships of Companies required to report to the Securities and Exchange Commission under the Securities Exchange act of 1934 (i.e., “public companies”) or other investment companies under the 1940 act.
3 Denotes Trustees who may be deemed to be “interested” persons of the Fund as that term is defined in the 1940 Act by virtue of their affiliation with the Distributor and/or its affiliates.
4 Board Members oversee 53 funds in The Advisors’ Inner Circle Fund.
19
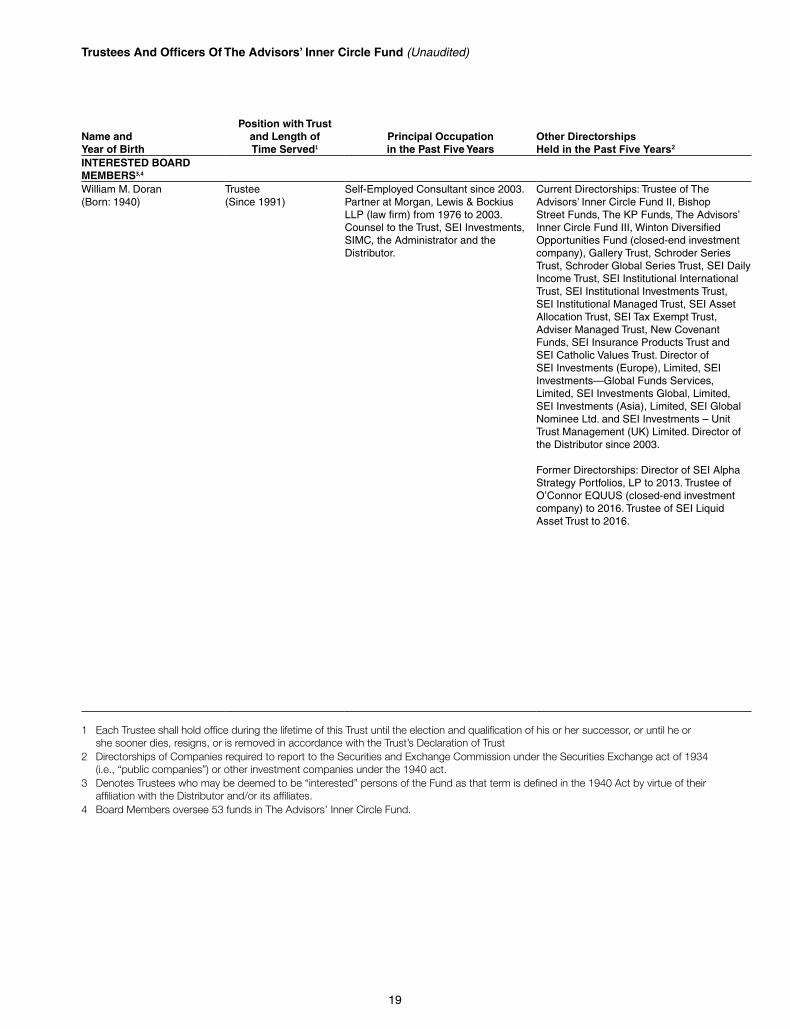
Trustees And Officers Of The Advisors’ Inner Circle Fund (Unaudited)
Name and Year of Birth
Position with Trust and Length of Time Served1
Principal Occupation in the Past Five Years
Other Directorships Held in the Past Five Years2
INTERESTED BOARD MEMBERS3,4
William M. Doran (Born: 1940)
Trustee (Since 1991)
Self-Employed Consultant since 2003. Partner at Morgan, Lewis & Bockius LLP (law firm) from 1976 to 2003. Counsel to the Trust, SEI Investments, SIMC, the Administrator and the Distributor.
Current Directorships: Trustee of The Advisors’ Inner Circle Fund II, Bishop Street Funds, The KP Funds, The Advisors’ Inner Circle Fund III, Winton Diversified Opportunities Fund (closed-end investment company), Gallery Trust, Schroder Series Trust, Schroder Global Series Trust, SEI Daily Income Trust, SEI Institutional International Trust, SEI Institutional Investments Trust, SEI Institutional Managed Trust, SEI Asset Allocation Trust, SEI Tax Exempt Trust, Adviser Managed Trust, New Covenant Funds, SEI Insurance Products Trust and SEI Catholic Values Trust. Director of SEI Investments (Europe), Limited, SEI Investments—Global Funds Services, Limited, SEI Investments Global, Limited, SEI Investments (Asia), Limited, SEI Global Nominee Ltd. and SEI Investments – Unit Trust Management (UK) Limited. Director of the Distributor since 2003.
Former Directorships: Director of SEI Alpha Strategy Portfolios, LP to 2013. Trustee of O’Connor EQUUS (closed-end investment company) to 2016. Trustee of SEI Liquid Asset Trust to 2016.
1 Each Trustee shall hold office during the lifetime of this Trust until the election and qualification of his or her successor, or until he or she sooner dies, resigns, or is removed in accordance with the Trust’s Declaration of Trust
2 Directorships of Companies required to report to the Securities and Exchange Commission under the Securities Exchange act of 1934 (i.e., “public companies”) or other investment companies under the 1940 act.
3 Denotes Trustees who may be deemed to be “interested” persons of the Fund as that term is defined in the 1940 Act by virtue of their affiliation with the Distributor and/or its affiliates.
4 Board Members oversee 53 funds in The Advisors’ Inner Circle Fund.
20
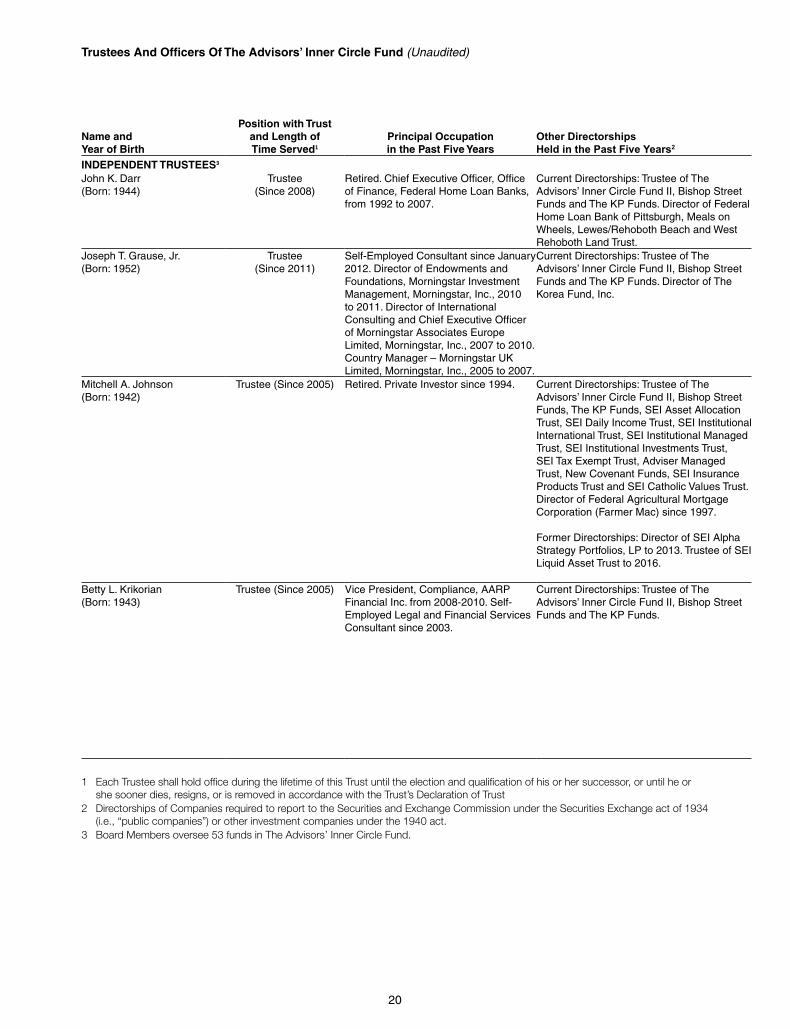
Trustees And Officers Of The Advisors’ Inner Circle Fund (Unaudited)
Name and Year of Birth
Position with Trust and Length of Time Served1
Principal Occupation in the Past Five Years
Other Directorships Held in the Past Five Years2
INDEPENDENT TRUSTEES3
John K. Darr (Born: 1944)
Trustee (Since 2008)
Retired. Chief Executive Officer, Office of Finance, Federal Home Loan Banks, from 1992 to 2007.
Current Directorships: Trustee of The Advisors’ Inner Circle Fund II, Bishop Street Funds and The KP Funds. Director of Federal Home Loan Bank of Pittsburgh, Meals on Wheels, Lewes/Rehoboth Beach and West Rehoboth Land Trust.
Joseph T. Grause, Jr. (Born: 1952)
Trustee (Since 2011)
Self-Employed Consultant since January 2012. Director of Endowments and Foundations, Morningstar Investment Management, Morningstar, Inc., 2010 to 2011. Director of International Consulting and Chief Executive Officer of Morningstar Associates Europe Limited, Morningstar, Inc., 2007 to 2010. Country Manager – Morningstar UK Limited, Morningstar, Inc., 2005 to 2007.
Current Directorships: Trustee of The Advisors’ Inner Circle Fund II, Bishop Street Funds and The KP Funds. Director of The Korea Fund, Inc.
Mitchell A. Johnson (Born: 1942)
Trustee (Since 2005) Retired. Private Investor since 1994. Current Directorships: Trustee of The Advisors’ Inner Circle Fund II, Bishop Street Funds, The KP Funds, SEI Asset Allocation Trust, SEI Daily Income Trust, SEI Institutional International Trust, SEI Institutional Managed Trust, SEI Institutional Investments Trust, SEI Tax Exempt Trust, Adviser Managed Trust, New Covenant Funds, SEI Insurance Products Trust and SEI Catholic Values Trust. Director of Federal Agricultural Mortgage Corporation (Farmer Mac) since 1997. Former Directorships: Director of SEI Alpha Strategy Portfolios, LP to 2013. Trustee of SEI Liquid Asset Trust to 2016.
Betty L. Krikorian (Born: 1943)
Trustee (Since 2005) Vice President, Compliance, AARP Financial Inc. from 2008-2010. Self-Employed Legal and Financial Services Consultant since 2003.
Current Directorships: Trustee of The Advisors’ Inner Circle Fund II, Bishop Street Funds and The KP Funds.
1 Each Trustee shall hold office during the lifetime of this Trust until the election and qualification of his or her successor, or until he or she sooner dies, resigns, or is removed in accordance with the Trust’s Declaration of Trust
2 Directorships of Companies required to report to the Securities and Exchange Commission under the Securities Exchange act of 1934 (i.e., “public companies”) or other investment companies under the 1940 act.
3 Board Members oversee 53 funds in The Advisors’ Inner Circle Fund.
21
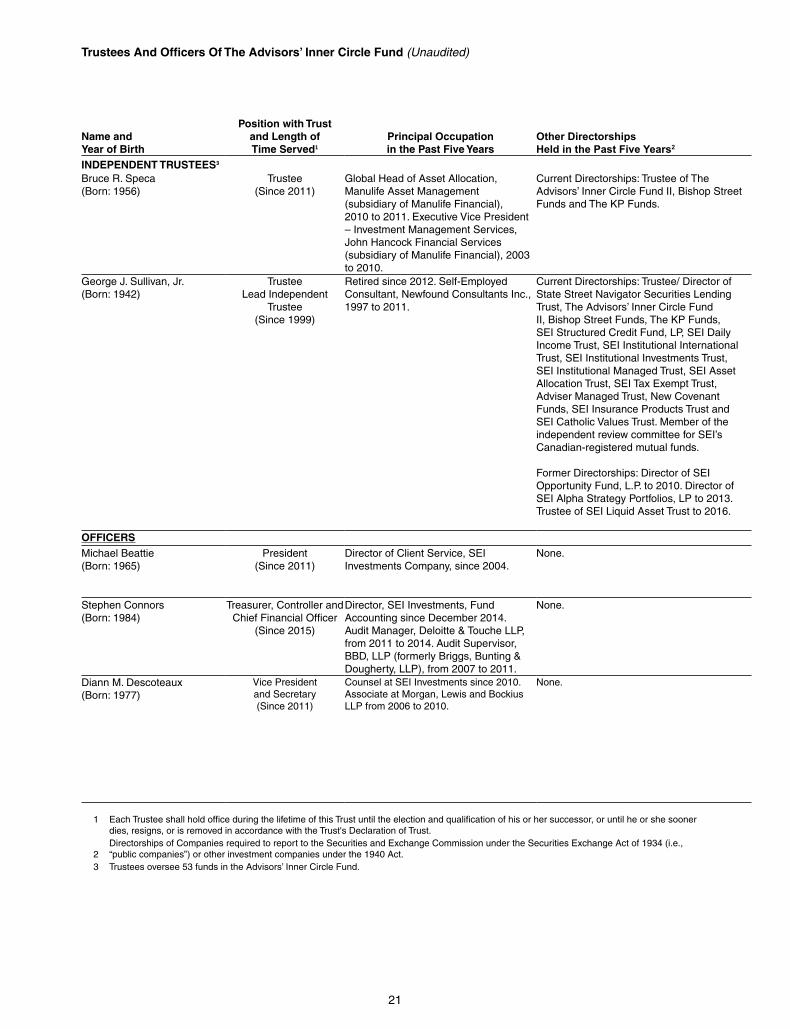
Trustees And Officers Of The Advisors’ Inner Circle Fund (Unaudited)
Name and Year of Birth
Position with Trust and Length of Time Served1
Principal Occupation in the Past Five Years
Other Directorships Held in the Past Five Years2
INDEPENDENT TRUSTEES3
Bruce R. Speca (Born: 1956)
Trustee (Since 2011)
Global Head of Asset Allocation, Manulife Asset Management (subsidiary of Manulife Financial), 2010 to 2011. Executive Vice President – Investment Management Services, John Hancock Financial Services (subsidiary of Manulife Financial), 2003 to 2010.
Current Directorships: Trustee of The Advisors’ Inner Circle Fund II, Bishop Street Funds and The KP Funds.
George J. Sullivan, Jr. (Born: 1942)
Trustee Lead Independent
Trustee (Since 1999)
Retired since 2012. Self-Employed Consultant, Newfound Consultants Inc., 1997 to 2011.
Current Directorships: Trustee/ Director of State Street Navigator Securities Lending Trust, The Advisors’ Inner Circle Fund II, Bishop Street Funds, The KP Funds, SEI Structured Credit Fund, LP, SEI Daily Income Trust, SEI Institutional International Trust, SEI Institutional Investments Trust, SEI Institutional Managed Trust, SEI Asset Allocation Trust, SEI Tax Exempt Trust, Adviser Managed Trust, New Covenant Funds, SEI Insurance Products Trust and SEI Catholic Values Trust. Member of the independent review committee for SEI’s Canadian-registered mutual funds. Former Directorships: Director of SEI Opportunity Fund, L.P. to 2010. Director of SEI Alpha Strategy Portfolios, LP to 2013. Trustee of SEI Liquid Asset Trust to 2016.
OFFICERSMichael Beattie (Born: 1965)
President (Since 2011)
Director of Client Service, SEI Investments Company, since 2004.
None.
Stephen Connors (Born: 1984)
Treasurer, Controller and Chief Financial Officer
(Since 2015)
Director, SEI Investments, Fund Accounting since December 2014. Audit Manager, Deloitte & Touche LLP, from 2011 to 2014. Audit Supervisor, BBD, LLP (formerly Briggs, Bunting & Dougherty, LLP), from 2007 to 2011.
None.
Diann M. Descoteaux (Born: 1977)
Vice President and Secretary (Since 2011)
Counsel at SEI Investments since 2010. Associate at Morgan, Lewis and Bockius LLP from 2006 to 2010.
None.
1 Each Trustee shall hold office during the lifetime of this Trust until the election and qualification of his or her successor, or until he or she sooner dies, resigns, or is removed in accordance with the Trust's Declaration of Trust.
2Directorships of Companies required to report to the Securities and Exchange Commission under the Securities Exchange Act of 1934 (i.e., “public companies”) or other investment companies under the 1940 Act.
3 Trustees oversee 53 funds in the Advisors’ Inner Circle Fund.
22
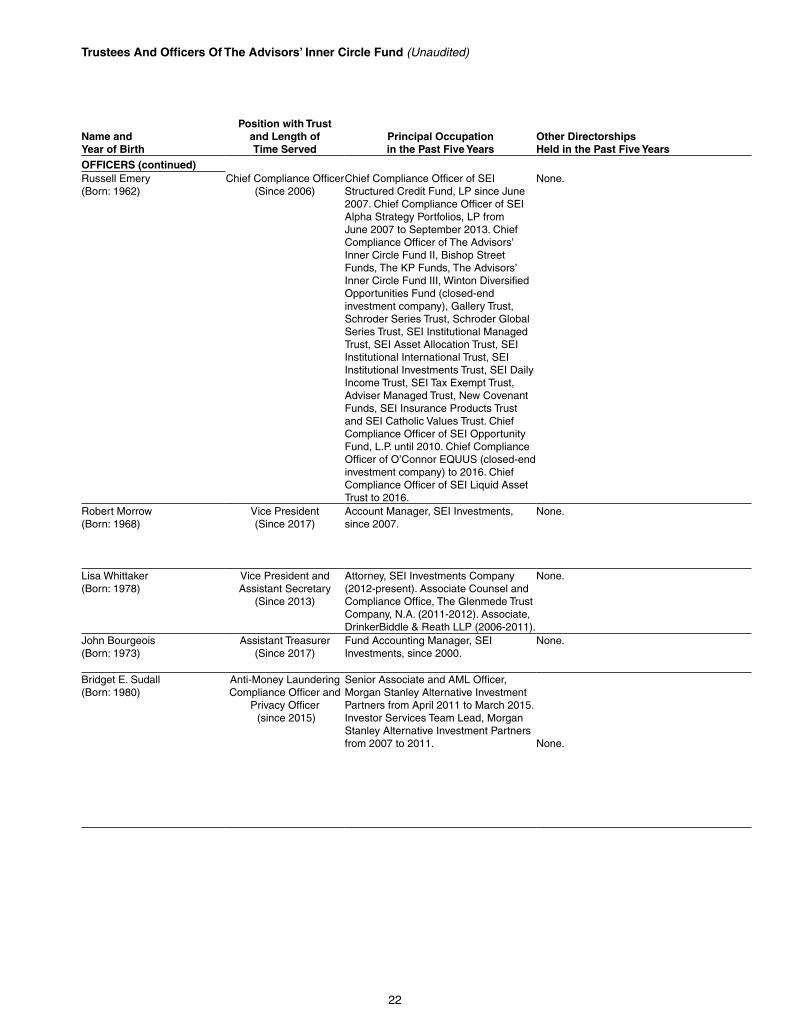
Trustees And Officers Of The Advisors’ Inner Circle Fund (Unaudited)
Name and Year of Birth
Position with Trust and Length of Time Served
Principal Occupation in the Past Five Years
Other Directorships Held in the Past Five Years
OFFICERS (continued)Russell Emery (Born: 1962)
Chief Compliance Officer (Since 2006)
Chief Compliance Officer of SEI Structured Credit Fund, LP since June 2007. Chief Compliance Officer of SEI Alpha Strategy Portfolios, LP from June 2007 to September 2013. Chief Compliance Officer of The Advisors’ Inner Circle Fund II, Bishop Street Funds, The KP Funds, The Advisors’ Inner Circle Fund III, Winton Diversified Opportunities Fund (closed-end investment company), Gallery Trust, Schroder Series Trust, Schroder Global Series Trust, SEI Institutional Managed Trust, SEI Asset Allocation Trust, SEI Institutional International Trust, SEI Institutional Investments Trust, SEI Daily Income Trust, SEI Tax Exempt Trust, Adviser Managed Trust, New Covenant Funds, SEI Insurance Products Trust and SEI Catholic Values Trust. Chief Compliance Officer of SEI Opportunity Fund, L.P. until 2010. Chief Compliance Officer of O’Connor EQUUS (closed-end investment company) to 2016. Chief Compliance Officer of SEI Liquid Asset Trust to 2016.
None.
Robert Morrow (Born: 1968)
Vice President (Since 2017)
Account Manager, SEI Investments, since 2007.
None.
Lisa Whittaker (Born: 1978)
Vice President and Assistant Secretary
(Since 2013)
Attorney, SEI Investments Company (2012-present). Associate Counsel and Compliance Office, The Glenmede Trust Company, N.A. (2011-2012). Associate, DrinkerBiddle & Reath LLP (2006-2011).
None.
John Bourgeois (Born: 1973)
Assistant Treasurer(Since 2017)
Fund Accounting Manager, SEI Investments, since 2000.
None.
Bridget E. Sudall (Born: 1980)
Anti-Money Laundering Compliance Officer and
Privacy Officer (since 2015)
Senior Associate and AML Officer, Morgan Stanley Alternative Investment Partners from April 2011 to March 2015. Investor Services Team Lead, Morgan Stanley Alternative Investment Partners from 2007 to 2011. None.

23
NOTICE TO SHAREHOLDERSOF
LSV VALUE EQUITY FUND(Unaudited)
For shareholders that do not have an October 31, 2017 tax year end, this notice is for informational purposes only. For shareholders with an October 31, 2017 tax year end, please consult your tax advisor as to the pertinence of this no-tice. For the fiscal year ended October 31, 2017, the Fund is designating the following items with regard to distributions paid during the year.
Long-Term Capital Gain Distribution
Ordinary Income
DistributionsTotal
Distributions
Qualifying For
Corporate Dividends Receivable
Deduction (1)
Qualifying Dividend Income (2)
U.S. Government
Interest (3)
Interest Related
Dividends(4)
Short-Term Capital Gain Dividends (5)
21.78% 78.22% 100% 99.26% 99.56% 0.00% 0.00% 0.00%
(1) Qualifying dividends represent dividends which qualify for the corporate dividends received deduction and is reflected as a per-centage of ordinary income distributions (the total of short-term capital gain and net investment income distributions).
(2) The percentage in this column represents the amount of “Qualifying Dividend Income” as created by the Jobs and Growth Tax Relief Reconciliation Act of 2003 and is reflected as a percentage of ordinary income distributions (the total of short-term capital gain and net investment income distributions). It is the intention of the aforementioned Fund to designate the maximum amount permitted by the law.
(3) "U.S. Government Interest" represents the amount of interest that was derived from direct U.S. Government obligations and distributed during the fiscal year. This amount is reflected as a percentage of ordinary income distributions. Generally, interest from direct U.S. Government obligations is exempt from state income tax. However, for shareholders of the Advisors' Inner Circle Fund-LSV Value Equity Fund who are residents of California, Connecticut and New York, the statutory threshold requirements were not satisfied to permit exemption of these amounts from state income.
(4) The percentage in this column represents the amount of “Interest Related Dividend” is reflected as a percentage of ordinary income distribution. Interest related dividends is exempted from U.S. withholding tax when paid to foreign investors.
(5) The percentage in this column represents the amount of “Short-Term Capital Gain Dividends” is reflected as a percentage of short-term capital gain distribution that is exempted from U.S. withholding tax when paid to foreign investors.
The information reported herein may differ from the information and distributions taxable to the shareholders for the calendar year ending December 31, 2017. Complete information will be computed and reported in conjunction with your 2017 Form 1099-DIV.

Notes


Trust:The Advisors’ Inner Circle Fund
Fund:LSV Value Equity Fund
Adviser:LSV Asset Management
Distributor:SEI Investments Distribution Co.
Administrator:SEI Investments Global Fund Services
Legal Counsel:Morgan, Lewis & Bockius LLP
LSV-AR-004-1900
The Fund files its complete schedule of Portfolio holdings with the Securities and Exchange Commission “SEC” for
the first and third quarters of each fiscal year on Form N-Q within sixty days after the end of the period. The Fund’s
Forms N-Q are available on the Commission’s website at http://www.sec.gov, and may be reviewed and copied at
the Commission’s Public Reference Room in Washington, DC. Information on the operation of the Public Reference
Room may be obtained by calling 1-800-SEC-0330.
A description of the policies and procedures that The Advisors’ Inner Circle Fund uses to determine how to vote
proxies if any relating to portfolio securities, as well as information relating to how a Fund voted proxies relating to
portfolio securities during the most recent 12-month period ended June 30, is available without charge i upon request,
by calling 888-Fund-LSV and ii on the Commission’s website at http://www.sec.gov.