Value chain analysis of the Egyptian aquaculture feed...
44
Value chain analysis of the Egyptian aquaculture feed industry
Transcript of Value chain analysis of the Egyptian aquaculture feed...
Value chain analysis of the Egyptian aquaculture feed industry
2
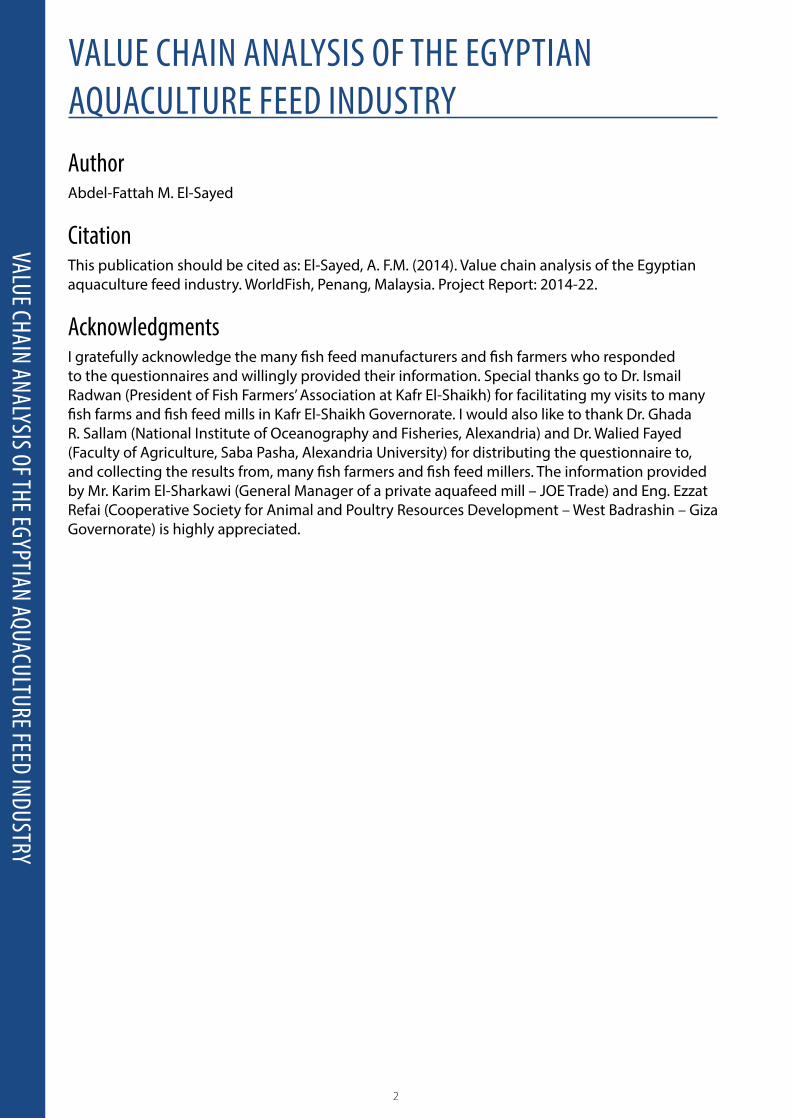
AuthorAbdel-Fattah M. El-Sayed
CitationThis publication should be cited as: El-Sayed, A. F.M. (2014). Value chain analysis of the Egyptian aquaculture feed industry. WorldFish, Penang, Malaysia. Project Report: 2014-22.
Acknowledgments I gratefully acknowledge the many fish feed manufacturers and fish farmers who responded to the questionnaires and willingly provided their information. Special thanks go to Dr. Ismail Radwan (President of Fish Farmers’ Association at Kafr El-Shaikh) for facilitating my visits to many fish farms and fish feed mills in Kafr El-Shaikh Governorate. I would also like to thank Dr. Ghada R. Sallam (National Institute of Oceanography and Fisheries, Alexandria) and Dr. Walied Fayed (Faculty of Agriculture, Saba Pasha, Alexandria University) for distributing the questionnaire to, and collecting the results from, many fish farmers and fish feed millers. The information provided by Mr. Karim El-Sharkawi (General Manager of a private aquafeed mill – JOE Trade) and Eng. Ezzat Refai (Cooperative Society for Animal and Poultry Resources Development – West Badrashin – Giza Governorate) is highly appreciated.
VAlue ChAin AnAlysis of the egyptiAn AquACulture feed industry
VAlue ChAin AnAlysis of the egyptiAn AquACulture feed industry
3
list of AbbreViAtion
BMP best management practice CAPMAS Central Agency for Public Mobilization and Statistics CPGAF code of practice for good animal feeding EHCFI Egyptian Holding Company for Food IndustriesFFFA Fayoum Fish Farmers AssociationFCR feed conversion ratioFAO Food and Agriculture Organization of the United NationsFM fish mealFTE full-time equivalent (jobs)GAFRD General Authority for Fisheries Resource DevelopmentGUAR General Union for Aquatic ResourcesHACCP hazard analysis and critical control points ha hectareMALR Ministry of Agriculture and Land ReclamationNGO non-governmental organizationSBM soybean mealt ton(s)USDA United States Department of Agriculture
Conversion factorsUS$ = EGP 6.96 (Feb 2014)1 ha = 2.381 feddan
list of AbbreViAtions
4
tAble 0f Contents
tAble 0f Contents List of abbreviations 3Executive summary 4Introduction and background 6Methods 7
Data collection 7Data validation 8
Results 10Value chain mapping 10
Stakeholders 10Operational data 12Benchmarking 12Legal, policy and institutional environment 12
Fish feed raw materials 13Locally produced raw materials 13Imported raw materials 14Feed additives 15
Fish feed production 15Government/public sector mills 16Private mills 16Investment in fish feed manufacturing 18Employment 19
Feed traders, handling and marketing 19Market share 19Feed packaging 20Transportation 21Storage 22
Fish farmers 22Services 23
Quality control inspection 23Financial services 25Extension services and capacity building 25Role of producer organizations 25
Critical factors and suggested actions 26Critical factors 26Suggested actions 26
Bibliography 30Appendix I Feed manufacturers’ questionnaire 32Appendix II Fish farmers’ questionnaire 38
5
exeCutiVe summ
AryexeCutiVe summAry The commercial aquaculture feed industry in Egypt is growing at a rapid rate. As a result, the number of fish feed mills has increased from just 5 mills producing about 20,000 t per year in 1999, to over 60 mills with a current production estimate of 800,000–1,000,000 t/year.
The performance of the aquafeed industry in Egypt is not well understood, as the value chain structure has not yet been mapped. This study aims to assess the status of the fish feed sector in Egypt, with an emphasis on: mapping and understanding fish feed value chains, describing the main actors and stakeholders within the chain, assessing value chain performance, identifying major strengths and weakness of the sector, and suggesting appropriate actions, management and development strategies.
Two structured questionnaires in English and in Arabic were drafted. They were distributed to fish feed mills and fish farmers. Information was collected from the farmers and feed mills by interview, phone call, email or fax. Twenty-five fish feed mills were interviewed, 17 from the private sector and 8 from the state-owned/public sector. A total of 34 fish farmers, representing a range of production systems and aquaculture areas, were also interviewed.
The results of the study indicate that the value-chain of the fish feed sector in Egypt is relatively simple. It includes four main stakeholder groups/actors: feed ingredients/additives and raw material suppliers; feed producers; feed marketers and traders; and fish farmers. 1. The main constraint facing the fish feed industry and fish farmers is rapidly increasing prices.
A large proportion of feed ingredients used in Egyptian animal and aquaculture feeds are imported. In 2011, imports accounted for 99% of soybean cake, 97% of soybean seeds and 50% of maize used or consumed in Egypt. Importation is carried out by a number of private sector importers. Meanwhile, international market prices for key raw materials have risen rapidly in recent years. These factors have contributed to increased prices for fish feed ingredients and fish feeds.
2. An estimated 90% of Egyptian fish feeds are produced by 50 private sector fish feed mills, producing both conventionally pelleted feeds (80–85%) and extruded feeds (15–20%), most of which (85%) are formulated to contain 25% crude protein (CP).
3. The public sector owns 9 mills, producing an estimated 10% of total commercial fish feed production. None are equipped to produce extruded feeds so they only produce conventionally pelleted feeds, usually formulated to contain 25% crude protein (CP).
4. Employment in private sector feed mills was estimated at 29.2 full-time equivalent (FTE) jobs per mill, with an average of 3.9 jobs per 1000 t of feed produced. Employment levels in public sector feed mills were higher (average 90.3 FTE per mill) while productivity was lower (13.3 FTE per 1000 t of feed produced). Based on these calculations, the total full-time number of jobs in fish feed manufacturing is estimated at about 4000–5000 jobs. Males represent 90% of the employees in the public sector and 96.6% in the private sector.
5. An estimated 80% of fish feeds produced by public sector feed mills is sold through traders or retailers, compared to only 15–20% of fish feeds from private sector mills. Fish feed traders and retailers add around 3–6% to the price of fish feeds. Some traders sell feed on credit, with an additional price increase of around 2–4%.
6. Fish farmers stated that feed costs represent around 80% (70–95%) of the total operating costs of their farms. If they purchase feed on credit, they pay 3–6% more and are likely to receive poor quality feed. However, they are forced to do this because they lack access to other sources of credit and financial support. Farmers said they lack basic knowledge about feed and feed management as they do not receive training or quality control inspections.
6
exeCutiVe summ
Ary
The study summarized the major constraints facing the fish feed industry in Egypt and proposed the following recommendations for better management and development of the sector:
• reducedependencyonexpensivefeedingredients• improvecapacityforproductionofhighqualityfeeds• increaseemploymentopportunitiesintheaquaculturefeedsector• improveaccesstocredit• improveaccesstotraining• strengthenthelegalandpolicyenvironmentforfeedproduction,qualitycontrol,handling,
storage and trading.
7
introduCtion And bACkground
The Egyptian aquaculture sector has witnessed rapid expansion over the past two decades. As a result, farmed fish production increased from 139,389 tons (t) in 1998, representing 25.5% of total Egyptian fish production, to 1,017,738 t in 2012 when aquaculture production comprised 74% of total fish production (FAO 2013; GAFRD 2013). The area being farmed increased from 42,000 hectares (ha) in 1999 (El-Sayed 1999) to 120,000 ha in 2012 (GAFRD 2013).
Aquaculture expansion in Egypt has been accompanied by a gradual shift from extensive and semi-intensive low-input culture systems to more intensive, feed-dependent systems. This approach has resulted in an increase in demand for commercial fish feeds.
However, the aquaculture feed value chain has not yet been mapped, the key players have not been clearly identified or characterized and the value chain performance is not well understood. This study was designed to address these knowledge gaps with the following objectives:1. mapping and understanding the fish feed value-chain in Egypt, clearly describing the main
actors and stakeholders within the chain, and the roles and interactions amongst them2. determining value chain performance, in terms of value addition, employment and profitability 3. identifying and synthesizing the strengths and weaknesses of each link of the value-chain 4. suggesting appropriate upgrading, management and development strategies.
introduCtion And bACkground
8
methods
Table 1: Ownership and geographical location of feed mills interviewed
Methods
data collectionTwo structured questionnaires, one for fish feed producers and one for fish farmers, were drafted by the study team in both English and in Arabic. The draft questionnaires were discussed by the study team, and any necessary modifications made.
In order to avoid a poor response rate, selected stakeholders were first approached by phone, by email, or through trusted intermediaries. They were briefed about the study questionnaire and asked if they were willing to participate in the study. If they agreed, the appropriate questionnaire was administered and completed by project staff or through the trusted intermediaries.
Sampling was designed to reflect all the value chain links and cover factors that might affect value chain performance. For aquaculture feed producers, sampling was designed to:1. cover most of the geographical areas where
aquaculture feed producers are located2. include a range of small, medium and large
producers (from less than 5,000 t/year to more than 30,000 t/year)
3. include private sector and state-owned/public sector feed mills.
For fish producers, sampling was designed to:• coversmall-andlarge-scalefishfarmers,
particularly in the major production governorates
• includearangeofproductionsystems:semi-intensive pond farms; intensive farms (tanks, ponds, cages and recirculating systems;) and integrated agriculture/aquaculture farms
• interviewfarmersofdifferentages,educational backgrounds and marital status.
Secondary information was collected from various sources, including the General Authority for Fisheries Resources Development (GAFRD), the Food and Agriculture Organization of the United Nations (FAO), the Central Agency for Public Mobilization and Statistics (CAPMAS), aquaculture and aquaculture feed consultants and decision-makers.
Twenty-five fish feed producers were interviewed, 17 from the private sector and 8 from the state-owned sector (Tables 1 and 2; Figure 1). The 34 fish farmers who responded to the questionnaire represented a range of production systems and aquaculture areas (Table 3; Figure 2). The information obtained from the surveys was collated, tabulated and sorted into different categories according to ownership, production capacity and the type of feed produced.
Governorate Public Private TotalKafr El Sheikh – 6 6Beheira 3 1 4Dakahlia 2 3 5Sharkia 1 1 2Giza – 2 2Domiat 1 1 2Gharbia 1 – 1Alexandria – 1 1Cairo – 1 1Ismalia – 1 1Total 8 17 25
9
methods
Fish farms included semi-intensive, intensive tank, intensive pond and intensive cage culture systems (Table 3). The species cultured included mixed-sex tilapia, mono-sex tilapia and polyculture of tilapia and mullet. The owners were mainly from the private sector.
All data were coded and entered into a Microsoft Excel spreadsheet for statistical analysis, primarily comprising simple descriptive statistics. Tables 1–3 provide information on the number of questionnaires completed by feed millers and fish farmers.
data validationDue to significant variability in the data collected for the different variables between state-owned/public feed mills and private mills, the data of these two sub-sectors were analyzed separately. Differences observed between individual responses and between overall financial performance within each sub-sector were minimal. Therefore, data cleaning was not necessary; this means that the quality of data collected was high. This was presumably due to:
Table 2: Number of feed mills interviewed according to ownership and production capacity
Figure 1: Fish feed manufacturers being interviewed. Courtesy: A.-F.M El-Sayed
Ownership Production range (t/ mill/year) Total<5000 5,000–
10,00010,000–15,000
15,000–20,000
>20,000
Public sector 3 2 1 – 2 8Private sector 3 4 4 3 3 17Total 6 6 5 3 5 25
• thelargesizesofthesamplescollected,which provided a good representation of the true situation of the aquaculture feed industry (25 feed mills and 34 fish farms);
• thewell-designedandsimplequestionnaires that helped the research team collect all the necessary data and assisted the interviewees in answering all the questions;
• previousexperienceoftheresearchteamin conducting such surveys, and ability to re-question the interviewee when they felt that the respondent’s answer might not reflect the reality;
• thefactthattheresearchteamwas already known to many of the interviewers, indicating a sufficient level of trust;
• ameditator,knowntotheinterviewedstakeholder, who accompanied the research team during the interview to help build trust in certain cases;
• somemembersoftheresearchteamhad worked, or were working, as fish feed technicians or fish farm managers/technicians in the private sector.
10
methods
Table 3: Number of fish farmers interviewed according to production systems and governorate
Figure 2: Pond farmer (left) and cage farmer (right) being interviewed. Courtesy: A.-F.M El-Sayed
Governorate Semi-intensive Intensive TotalPonds Tanks Cages
Kafr El-Sheikh 11 1 2 14Beheira 6 1 3 10Sharkia – 1 1Dakahlia 2 2Alexandria 2 2 4Domiat 1 1 2Port Said 1 1Total 23 1 2 8 34
11
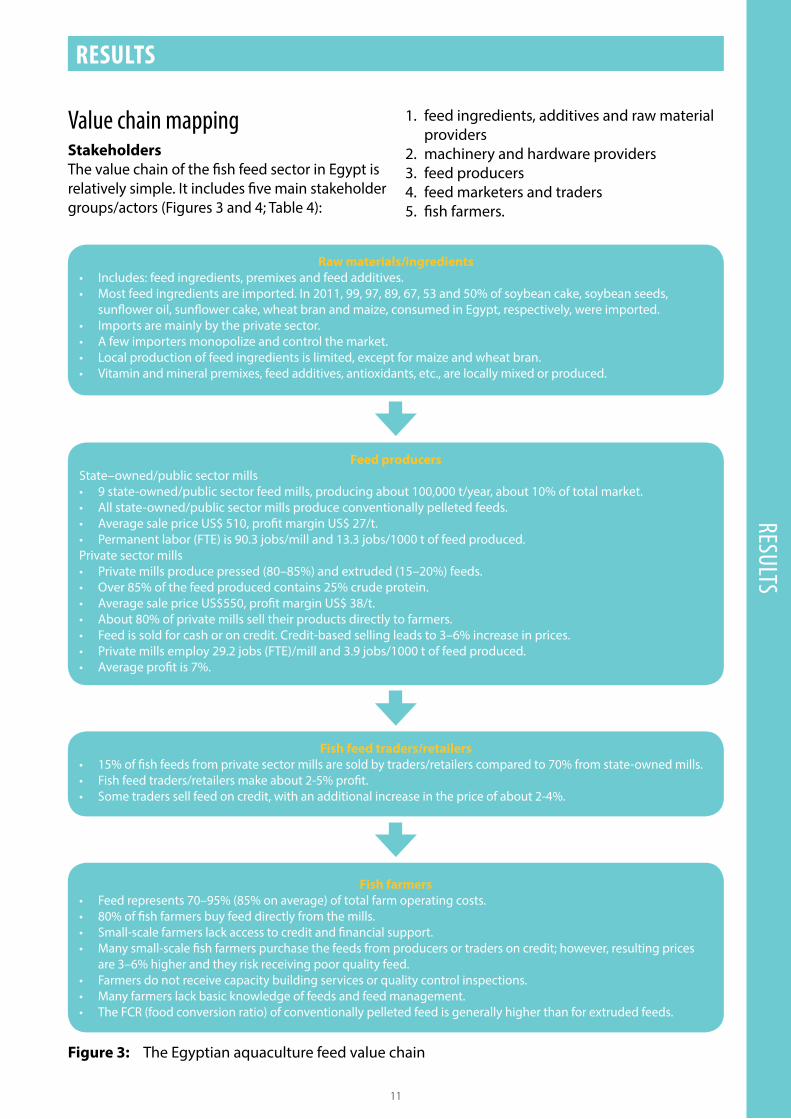
results
Value chain mappingStakeholdersThe value chain of the fish feed sector in Egypt is relatively simple. It includes five main stakeholder groups/actors (Figures 3 and 4; Table 4):
Results
1. feed ingredients, additives and raw material providers
2. machinery and hardware providers3. feed producers4. feed marketers and traders5. fish farmers.
Figure 3: The Egyptian aquaculture feed value chain
Raw materials/ingredients• Includes:feedingredients,premixesandfeedadditives.• Mostfeedingredientsareimported.In2011,99,97,89,67,53and50%ofsoybeancake,soybeanseeds,
sunflower oil, sunflower cake, wheat bran and maize, consumed in Egypt, respectively, were imported.• Importsaremainlybytheprivatesector.• Afewimportersmonopolizeandcontrolthemarket.• Localproductionoffeedingredientsislimited,exceptformaizeandwheatbran.• Vitaminandmineralpremixes,feedadditives,antioxidants,etc.,arelocallymixedorproduced.
Fish feed traders/retailers• 15%offishfeedsfromprivatesectormillsaresoldbytraders/retailerscomparedto70%fromstate-ownedmills.• Fishfeedtraders/retailersmakeabout2-5%profit.• Sometraderssellfeedoncredit,withanadditionalincreaseinthepriceofabout2-4%.
Fish farmers• Feedrepresents70–95%(85%onaverage)oftotalfarmoperatingcosts.• 80%offishfarmersbuyfeeddirectlyfromthemills.• Small-scalefarmerslackaccesstocreditandfinancialsupport.• Manysmall-scalefishfarmerspurchasethefeedsfromproducersortradersoncredit;however,resultingprices
are 3–6% higher and they risk receiving poor quality feed.• Farmersdonotreceivecapacitybuildingservicesorqualitycontrolinspections.• Manyfarmerslackbasicknowledgeoffeedsandfeedmanagement.• TheFCR(foodconversionratio)ofconventionallypelletedfeedisgenerallyhigherthanforextrudedfeeds.
Feed producersState–owned/public sector mills• 9state-owned/publicsectorfeedmills,producingabout100,000t/year,about10%oftotalmarket.• Allstate-owned/publicsectormillsproduceconventionallypelletedfeeds.• AveragesalepriceUS$510,profitmarginUS$27/t.• Permanentlabor(FTE)is90.3jobs/milland13.3jobs/1000toffeedproduced.Private sector mills• Privatemillsproducepressed(80–85%)andextruded(15–20%)feeds.• Over85%ofthefeedproducedcontains25%crudeprotein.• AveragesalepriceUS$550,profitmarginUS$38/t.• About80%ofprivatemillsselltheirproductsdirectlytofarmers.• Feedissoldforcashoroncredit.Credit-basedsellingleadsto3–6%increaseinprices.• Privatemillsemploy29.2jobs(FTE)/milland3.9jobs/1000toffeedproduced.• Averageprofitis7%.
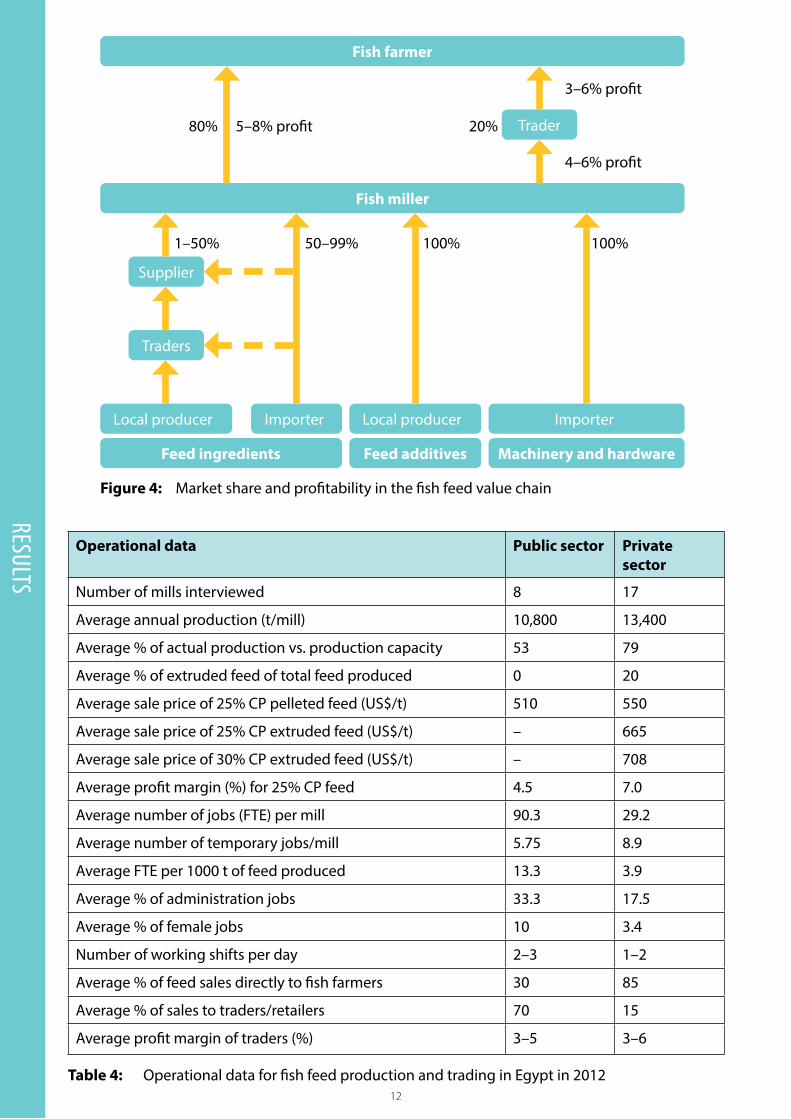
12
results
Figure 4: Market share and profitability in the fish feed value chain
5–8% profit
1–50% 50–99%
80% 20%
4–6% profit
3–6% profit
Fish farmer
Trader
Feed ingredients
Local producer Importer
Supplier
Traders
100%
Feed additives
Local producer
100%
Machinery and hardware
Importer
Fish miller
Table 4: Operational data for fish feed production and trading in Egypt in 2012
Operational data Public sector Private sector
Number of mills interviewed 8 17
Average annual production (t/mill) 10,800 13,400
Average % of actual production vs. production capacity 53 79
Average % of extruded feed of total feed produced 0 20
Average sale price of 25% CP pelleted feed (US$/t) 510 550
Average sale price of 25% CP extruded feed (US$/t) – 665
Average sale price of 30% CP extruded feed (US$/t) – 708
Average profit margin (%) for 25% CP feed 4.5 7.0
Average number of jobs (FTE) per mill 90.3 29.2
Average number of temporary jobs/mill 5.75 8.9
Average FTE per 1000 t of feed produced 13.3 3.9
Average % of administration jobs 33.3 17.5
Average % of female jobs 10 3.4
Number of working shifts per day 2–3 1–2
Average % of feed sales directly to fish farmers 30 85
Average % of sales to traders/retailers 70 15
Average profit margin of traders (%) 3–5 3–6
13
resultsMachinery and hardware providers were excluded from the mapping exercise because information is difficult to collect as the equipment is imported from a wide range of sources at different times. However, the feed millers’ questionnaire contained questions about machinery importation, installation, maintenance and hardware availability. The responses suggest that while capital costs are important, maintenance costs for equipment play a relatively insignificant role in overall operating costs.
Operational dataOperational data collected from field interviews for fish feed production and trading in Egypt in 2012 are summarized in Table 4.
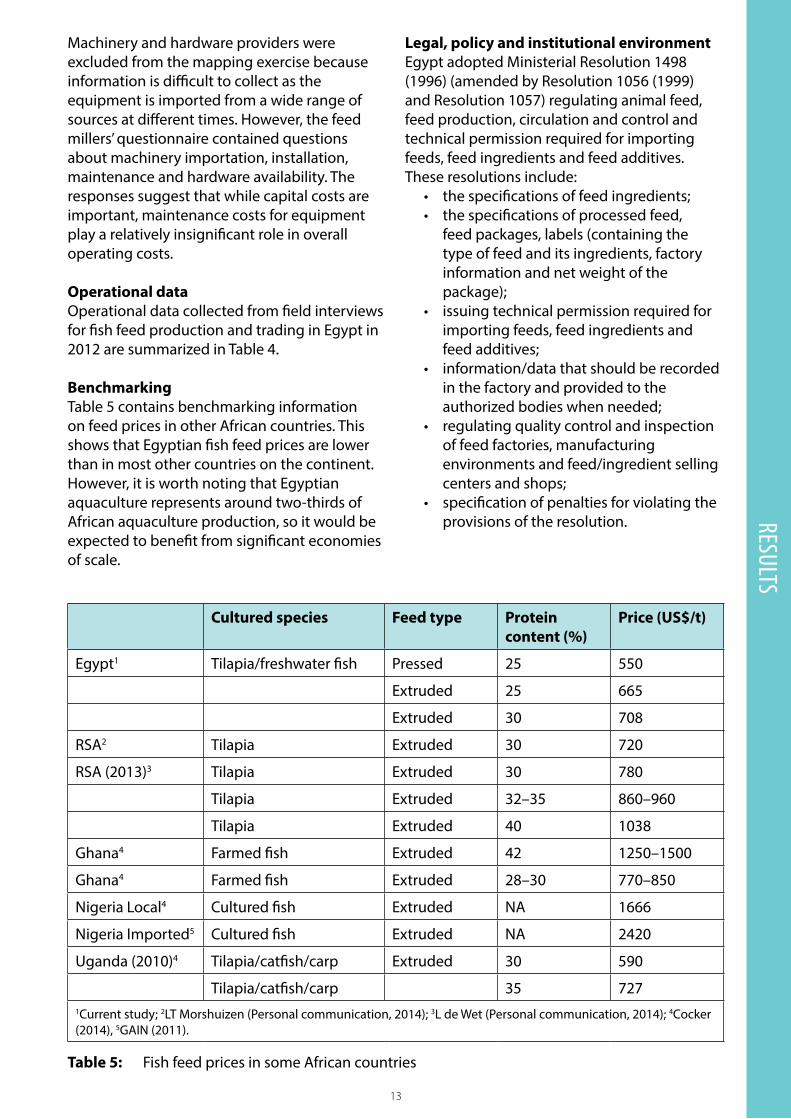
BenchmarkingTable 5 contains benchmarking information on feed prices in other African countries. This shows that Egyptian fish feed prices are lower than in most other countries on the continent. However, it is worth noting that Egyptian aquaculture represents around two-thirds of African aquaculture production, so it would be expected to benefit from significant economies of scale.
Table 5: Fish feed prices in some African countries
Cultured species Feed type Protein content (%)
Price (US$/t)
Egypt1 Tilapia/freshwater fish Pressed 25 550
Extruded 25 665
Extruded 30 708
RSA2 Tilapia Extruded 30 720
RSA (2013)3 Tilapia Extruded 30 780
Tilapia Extruded 32–35 860–960
Tilapia Extruded 40 1038
Ghana4 Farmed fish Extruded 42 1250–1500
Ghana4 Farmed fish Extruded 28–30 770–850
Nigeria Local4 Cultured fish Extruded NA 1666
Nigeria Imported5 Cultured fish Extruded NA 2420
Uganda (2010)4 Tilapia/catfish/carp Extruded 30 590
Tilapia/catfish/carp 35 7271Current study; 2LT Morshuizen (Personal communication, 2014); 3L de Wet (Personal communication, 2014); 4Cocker (2014), 5GAIN (2011).
Legal, policy and institutional environmentEgypt adopted Ministerial Resolution 1498 (1996) (amended by Resolution 1056 (1999) and Resolution 1057) regulating animal feed, feed production, circulation and control and technical permission required for importing feeds, feed ingredients and feed additives. These resolutions include:
• thespecificationsoffeedingredients;• thespecificationsofprocessedfeed,
feed packages, labels (containing the type of feed and its ingredients, factory information and net weight of the package);
• issuingtechnicalpermissionrequiredforimporting feeds, feed ingredients and feed additives;
• information/datathatshouldberecordedin the factory and provided to the authorized bodies when needed;
• regulatingqualitycontrolandinspectionof feed factories, manufacturing environments and feed/ingredient selling centers and shops;
• specificationofpenaltiesforviolatingtheprovisions of the resolution.
14
results
However, there is no specific legislation or provisions on fish feed manufacturing in Egypt. Until appropriate legislation is issued, Resolutions 1498 (1996), 1056 and 1057 (1999) should be adopted. These resolutions contain sufficient provisions and articles that can be applied for regulation and quality control inspection of aquaculture feeds.
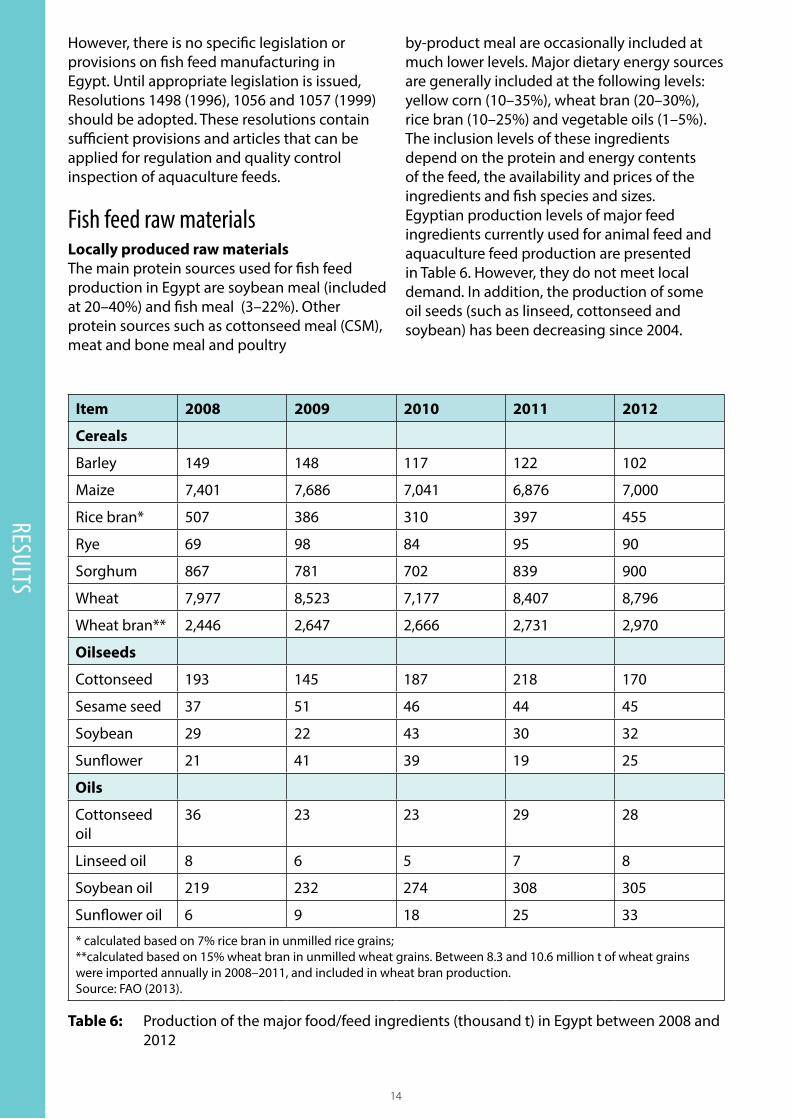
fish feed raw materialsLocally produced raw materialsThe main protein sources used for fish feed production in Egypt are soybean meal (included at 20–40%) and fish meal (3–22%). Other protein sources such as cottonseed meal (CSM), meat and bone meal and poultry
Table 6: Production of the major food/feed ingredients (thousand t) in Egypt between 2008 and 2012
Item 2008 2009 2010 2011 2012
Cereals
Barley 149 148 117 122 102
Maize 7,401 7,686 7,041 6,876 7,000
Rice bran* 507 386 310 397 455
Rye 69 98 84 95 90
Sorghum 867 781 702 839 900
Wheat 7,977 8,523 7,177 8,407 8,796
Wheat bran** 2,446 2,647 2,666 2,731 2,970
Oilseeds
Cottonseed 193 145 187 218 170
Sesame seed 37 51 46 44 45
Soybean 29 22 43 30 32
Sunflower 21 41 39 19 25
Oils
Cottonseed oil
36 23 23 29 28
Linseed oil 8 6 5 7 8
Soybean oil 219 232 274 308 305
Sunflower oil 6 9 18 25 33
* calculated based on 7% rice bran in unmilled rice grains; **calculated based on 15% wheat bran in unmilled wheat grains. Between 8.3 and 10.6 million t of wheat grains were imported annually in 2008–2011, and included in wheat bran production.Source: FAO (2013).
by-product meal are occasionally included at much lower levels. Major dietary energy sources are generally included at the following levels: yellow corn (10–35%), wheat bran (20–30%), rice bran (10–25%) and vegetable oils (1–5%). The inclusion levels of these ingredients depend on the protein and energy contents of the feed, the availability and prices of the ingredients and fish species and sizes. Egyptian production levels of major feed ingredients currently used for animal feed and aquaculture feed production are presented in Table 6. However, they do not meet local demand. In addition, the production of some oil seeds (such as linseed, cottonseed and soybean) has been decreasing since 2004.
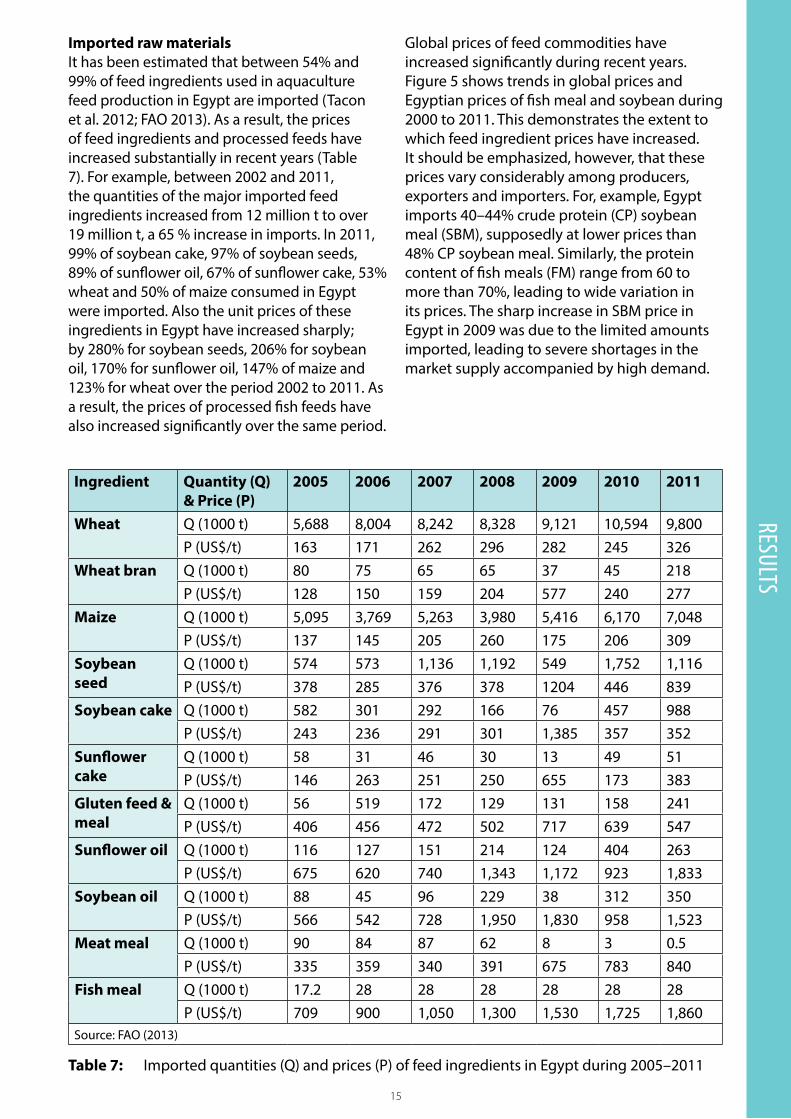
15
resultsGlobal prices of feed commodities have increased significantly during recent years. Figure 5 shows trends in global prices and Egyptian prices of fish meal and soybean during 2000 to 2011. This demonstrates the extent to which feed ingredient prices have increased. It should be emphasized, however, that these prices vary considerably among producers, exporters and importers. For, example, Egypt imports 40–44% crude protein (CP) soybean meal (SBM), supposedly at lower prices than 48% CP soybean meal. Similarly, the protein content of fish meals (FM) range from 60 to more than 70%, leading to wide variation in its prices. The sharp increase in SBM price in Egypt in 2009 was due to the limited amounts imported, leading to severe shortages in the market supply accompanied by high demand.
Table 7: Imported quantities (Q) and prices (P) of feed ingredients in Egypt during 2005–2011
Ingredient Quantity (Q) & Price (P)
2005 2006 2007 2008 2009 2010 2011
Wheat Q (1000 t) 5,688 8,004 8,242 8,328 9,121 10,594 9,800P (US$/t) 163 171 262 296 282 245 326
Wheat bran Q (1000 t) 80 75 65 65 37 45 218P (US$/t) 128 150 159 204 577 240 277
Maize Q (1000 t) 5,095 3,769 5,263 3,980 5,416 6,170 7,048P (US$/t) 137 145 205 260 175 206 309
Soybean seed
Q (1000 t) 574 573 1,136 1,192 549 1,752 1,116P (US$/t) 378 285 376 378 1204 446 839
Soybean cake Q (1000 t) 582 301 292 166 76 457 988P (US$/t) 243 236 291 301 1,385 357 352
Sunflower cake
Q (1000 t) 58 31 46 30 13 49 51P (US$/t) 146 263 251 250 655 173 383
Gluten feed & meal
Q (1000 t) 56 519 172 129 131 158 241P (US$/t) 406 456 472 502 717 639 547
Sunflower oil Q (1000 t) 116 127 151 214 124 404 263P (US$/t) 675 620 740 1,343 1,172 923 1,833
Soybean oil Q (1000 t) 88 45 96 229 38 312 350P (US$/t) 566 542 728 1,950 1,830 958 1,523
Meat meal Q (1000 t) 90 84 87 62 8 3 0.5P (US$/t) 335 359 340 391 675 783 840
Fish meal Q (1000 t) 17.2 28 28 28 28 28 28P (US$/t) 709 900 1,050 1,300 1,530 1,725 1,860
Source: FAO (2013)
Imported raw materialsIt has been estimated that between 54% and 99% of feed ingredients used in aquaculture feed production in Egypt are imported (Tacon et al. 2012; FAO 2013). As a result, the prices of feed ingredients and processed feeds have increased substantially in recent years (Table 7). For example, between 2002 and 2011, the quantities of the major imported feed ingredients increased from 12 million t to over 19 million t, a 65 % increase in imports. In 2011, 99% of soybean cake, 97% of soybean seeds, 89% of sunflower oil, 67% of sunflower cake, 53% wheat and 50% of maize consumed in Egypt were imported. Also the unit prices of these ingredients in Egypt have increased sharply; by 280% for soybean seeds, 206% for soybean oil, 170% for sunflower oil, 147% of maize and 123% for wheat over the period 2002 to 2011. As a result, the prices of processed fish feeds have also increased significantly over the same period.
16
results
Feed raw material imports are carried out mainly by the private sector, with a few large importers monopolizing the market by controlling the supply and prices. All fish feed millers interviewed, particularly large-scale producers, buy their ingredients directly from those importers. Various local suppliers and traders also deliver ingredients to small feed producers. However, the research team failed to get sufficient information on the amounts of fish feed ingredients sold by local traders/suppliers, because they all sell feed ingredients to fish feed millers and other animal feed producers (i.e. poultry and livestock feeds). They claimed that they do not have separate records of the amounts sold for fish feed production.
Feed additivesFeed additives, vitamins and mineral premixes are locally produced, mainly by pharmaceutical companies and feed additives companies. Fish feed millers buy their feed additives either directly from these two sources or from additives suppliers/retailers. Just 27% of the private sector millers who were interviewed reported that they had premixes/additives production lines in their mills. They generally buy the ingredients separately (in bulk) from local suppliers and formulate their own additives. The prices of feed additives vary significantly depending on the ingredients contained in the additive.
In the public sector, the feed millers interviewed purchase additives from local suppliers through holding companies. Two millers informed the research team that they incorporate additives only upon farmers’ request. This generally leads to higher feed prices.
fish feed productionFish feeds in Egypt are produced by public-sector or state-owned holding companies and by the private sector. There is no official data source on current fish feed production and the number of feed mills. However, the number of fish feed mills was estimated at 31 in 2009, 11 from the government/public sector and 20 owned by the private sector, with a production capacity of about 420,000 t/year (El-Sayed 2013). Based on current research, this was an underestimate as the number of feed mills and their annual production capacity are much higher.
Figure 5: Prices of fish meal (FM) and soybean (SBM) in Egypt during 2000-2011 compared with global prices
Source: FAO (2013); Nordahl (2011); USDA/FAS (2012).
2000
2000 2002 2004 2006 2008 20102001 2003 2005 2007 2009 2011
1400
800
200
1800
1200
600
0
1600
1000
400
US$
/mt
SBN - Global
SBN - Egypt
FM - Global
FM - Egypt
Year
17
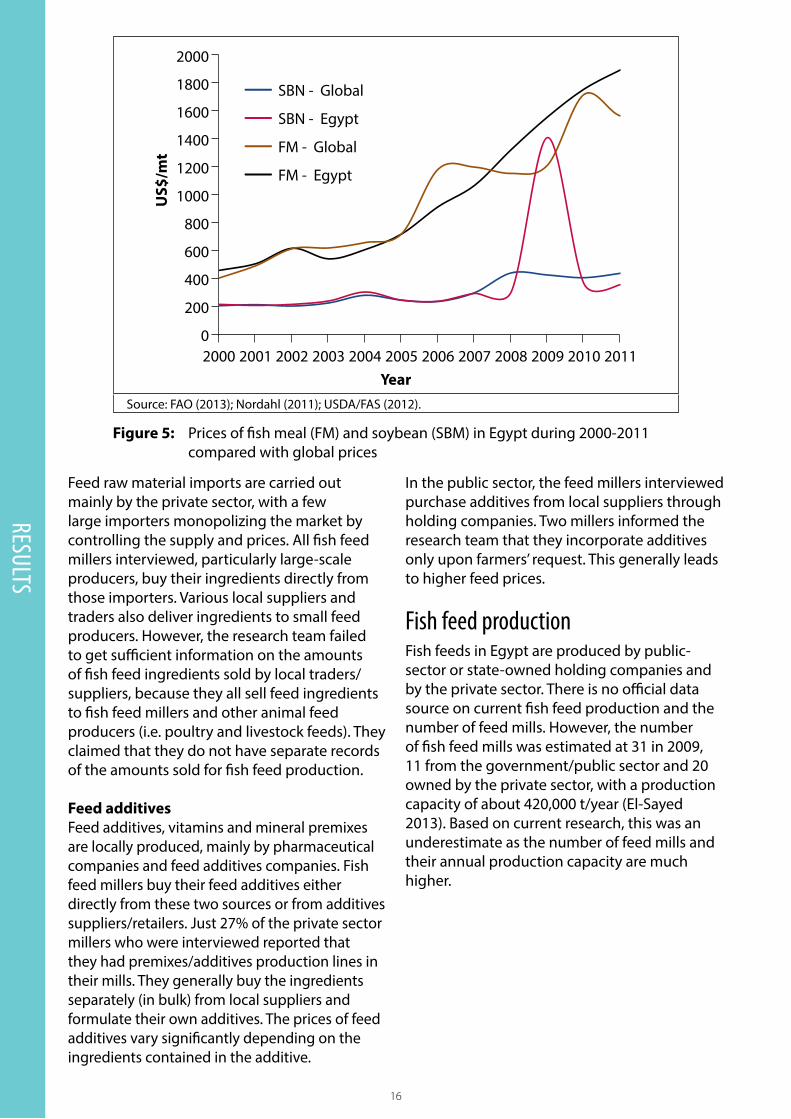
Government/public sector millsThere are currently nine government/public sector mills producing fish feeds in Egypt. Two mills are owned by the GAFRD (Figure 6), a division of the Ministry of Agriculture and Land Reclamation (MALR) and seven are owned by the Egyptian Holding Company for Food Industries (EHCFI). Three of the EHCFI mills are owned by the Oils and Soaps Company and four mills are owned by the Rice Milling Company. Although only eight mills (out of nine) were interviewed, the total production of all the mills was recorded. According to the present study, the nine mills operated by state-owned holding companies produced about 100,000 t in 2012. All the feed produced was in the form of conventionally pelleted (sinking) feeds. Most was formulated to contain 25% crude protein (CP). Around 3–5% of this amount contained 17–18% CP, produced upon farmer’s request. Most of governmental/public sector mills work
2 to 3 shifts per day, depending on market demand. Yet, the average production of these mills in 2012 represented only 53% of their total annual production capacity.
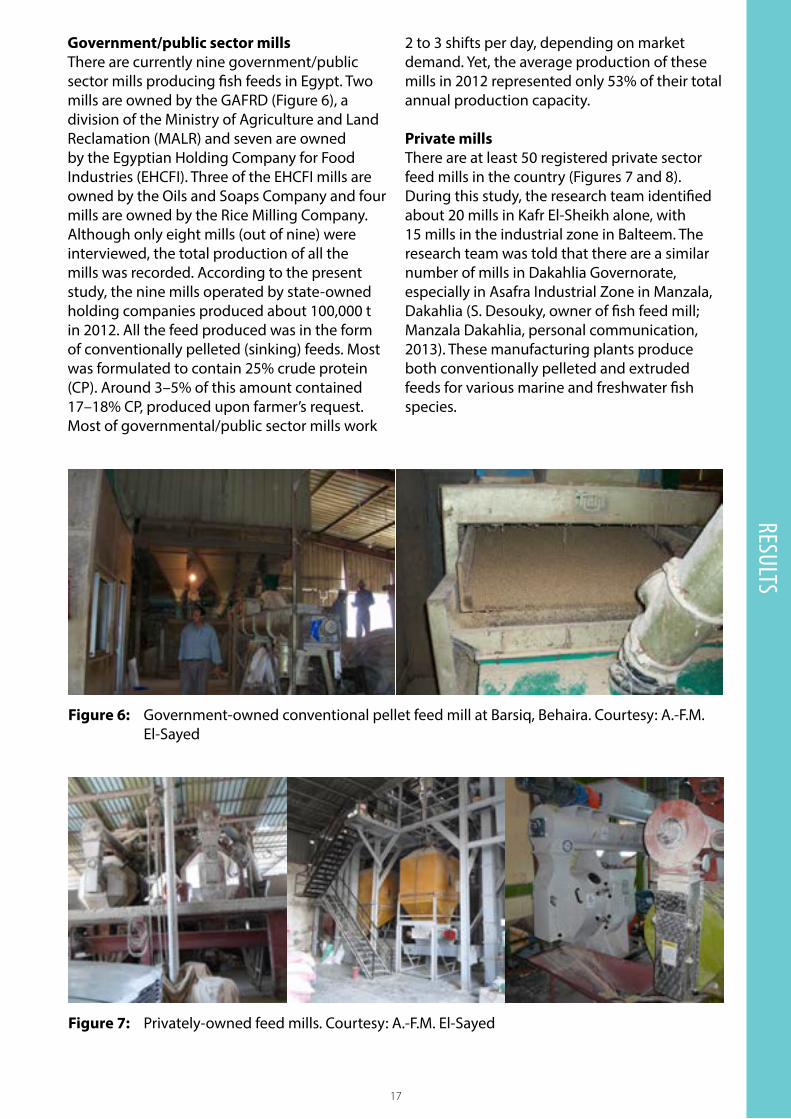
Private millsThere are at least 50 registered private sector feed mills in the country (Figures 7 and 8). During this study, the research team identified about 20 mills in Kafr El-Sheikh alone, with 15 mills in the industrial zone in Balteem. The research team was told that there are a similar number of mills in Dakahlia Governorate, especially in Asafra Industrial Zone in Manzala, Dakahlia (S. Desouky, owner of fish feed mill; Manzala Dakahlia, personal communication, 2013). These manufacturing plants produce both conventionally pelleted and extruded feeds for various marine and freshwater fish species.
Figure 6: Government-owned conventional pellet feed mill at Barsiq, Behaira. Courtesy: A.-F.M. El-Sayed
Figure 7: Privately-owned feed mills. Courtesy: A.-F.M. El-Sayed
results
18
results
It has also been reported that there are about 50 small-scale pelletizing units, each with an annual production capacity of 3000 to 4000 t of fish feed, representing total annual production of 120,000 to 240,000 t (El-Naggar et al. 2011; cited in Macfadyen et al. 2011). The majority of these pelletizing units are not registered and their production is generally not recorded. However, current estimates suggest that the number of non-registered fish feed mills has increased dramatically during the past few years, to over 200 units. These milling units are generally locally made, use simple technologies and are usually not equipped with air driers. They also offer a service of pelletizing farmers’ feed ingredients at a cost of about EGP 100–150 per t (El-Naggar et al. 2011).
In addition, many farmers currently buy their own ingredients, prepare their feed formulae and rent the feed mill to manufacture the feed (A.-F.M. El-Sayed, Alexandria; H. Eshra, fish feed miller and fish farmer, Edku, Behaira 2013). Those farmers generally do not report the amounts of feed they produce. It should be emphasized, however, that many of those rented feed mills do not have specific lines for fish feed production. Instead, they use the same production lines that are used for producing poultry and rabbit feeds. This approach leads to substantial reduction in feed costs for farmers.
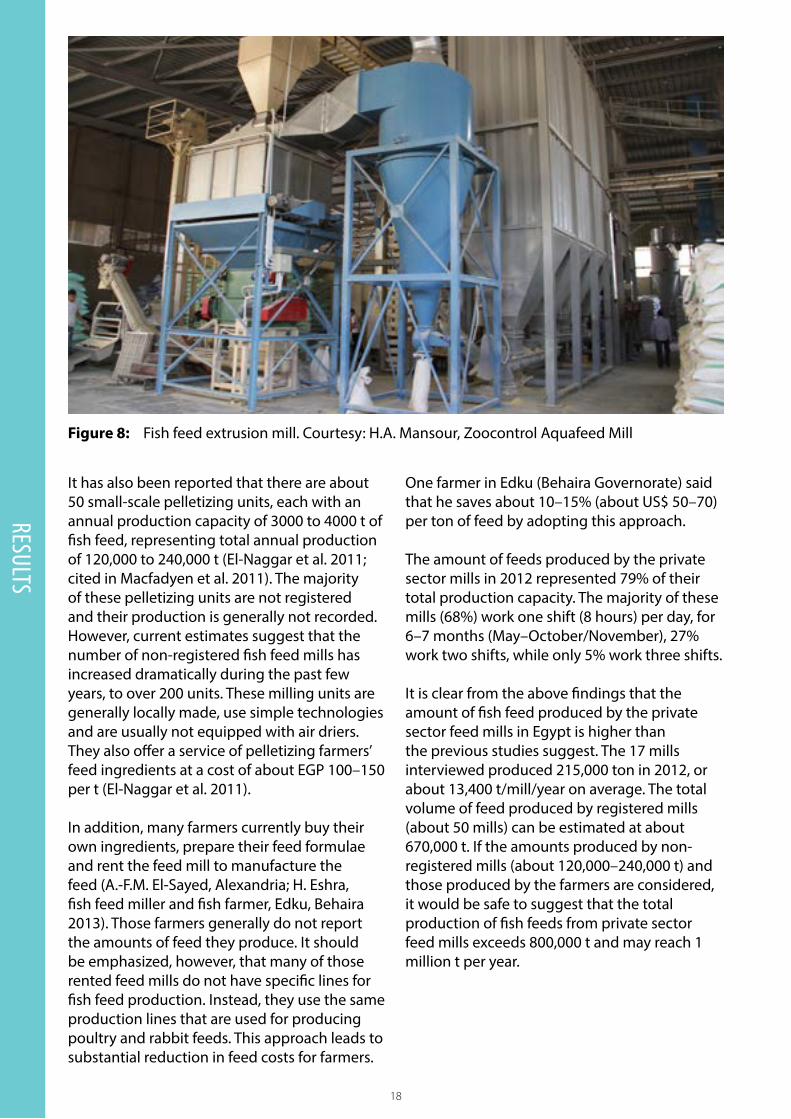
Figure 8: Fish feed extrusion mill. Courtesy: H.A. Mansour, Zoocontrol Aquafeed Mill
One farmer in Edku (Behaira Governorate) said that he saves about 10–15% (about US$ 50–70) per ton of feed by adopting this approach.
The amount of feeds produced by the private sector mills in 2012 represented 79% of their total production capacity. The majority of these mills (68%) work one shift (8 hours) per day, for 6–7 months (May–October/November), 27% work two shifts, while only 5% work three shifts.
It is clear from the above findings that the amount of fish feed produced by the private sector feed mills in Egypt is higher than the previous studies suggest. The 17 mills interviewed produced 215,000 ton in 2012, or about 13,400 t/mill/year on average. The total volume of feed produced by registered mills (about 50 mills) can be estimated at about 670,000 t. If the amounts produced by non-registered mills (about 120,000–240,000 t) and those produced by the farmers are considered, it would be safe to suggest that the total production of fish feeds from private sector feed mills exceeds 800,000 t and may reach 1 million t per year.
19
About 80–85% of this production was in the form of conventionally pelleted feed while the remaining 15–20% was extruded (floating) feeds. Only a few feed mills (5 to 10 mills) produce extruded feeds as this requires specialized production lines. The proportion of extruded feed produced by individual companies varied between 20% and 80% of their 2012 production.
Over 95% of the feeds produced by the private sector were formulated to contain 25% crude protein (CP), while the remaining 5% contained either 30, 32 or 35% CP, and are generally produced at the farmer’s request. In addition, a few tons of feed containing >40% CP are also produced at farmers’ request and used for larval feeding or marine fish feeding. Most (over 90%) of the feed producers said they do not produce larval feeds because it is such a small market, as very small amounts of feed are required during early growth stages. Processed grow-out feeds are commonly ground into powder-like meals and used for feeding fish larvae.
Investment in fish feed manufacturingEstablishing a commercial fish feed mill is costly and complicated. It requires large amounts of capital for initial infrastructure and machinery setup and subsequent running costs for operating the mill. Skilled labor and professional management are necessary to establish and run commercial fish feed enterprises.
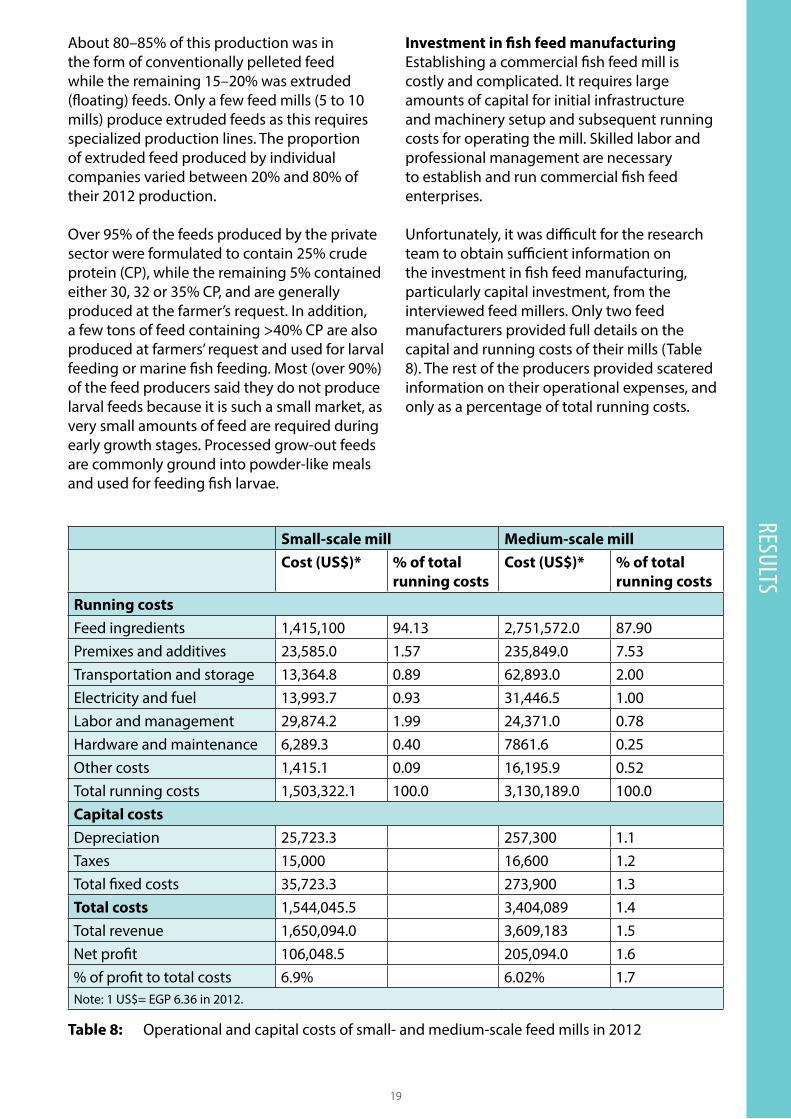
Unfortunately, it was difficult for the research team to obtain sufficient information on the investment in fish feed manufacturing, particularly capital investment, from the interviewed feed millers. Only two feed manufacturers provided full details on the capital and running costs of their mills (Table 8). The rest of the producers provided scatered information on their operational expenses, and only as a percentage of total running costs.
Table 8: Operational and capital costs of small- and medium-scale feed mills in 2012
Small-scale mill Medium-scale millCost (US$)* % of total
running costsCost (US$)* % of total
running costsRunning costsFeed ingredients 1,415,100 94.13 2,751,572.0 87.90Premixes and additives 23,585.0 1.57 235,849.0 7.53Transportation and storage 13,364.8 0.89 62,893.0 2.00Electricity and fuel 13,993.7 0.93 31,446.5 1.00Labor and management 29,874.2 1.99 24,371.0 0.78Hardware and maintenance 6,289.3 0.40 7861.6 0.25Other costs 1,415.1 0.09 16,195.9 0.52Total running costs 1,503,322.1 100.0 3,130,189.0 100.0Capital costsDepreciation 25,723.3 257,300 1.1Taxes 15,000 16,600 1.2Total fixed costs 35,723.3 273,900 1.3Total costs 1,544,045.5 3,404,089 1.4Total revenue 1,650,094.0 3,609,183 1.5Net profit 106,048.5 205,094.0 1.6% of profit to total costs 6.9% 6.02% 1.7Note: 1 US$= EGP 6.36 in 2012.
results
20
results
EmploymentGovernment/public sector feed millsThe employment rate in fish feed production varies significantly between public and private sector mills. In the governmental/public sector mills, the number of permanent jobs ranges from 36 to 106 people per mill, with an average of 90.3 jobs/mill. Female jobs represent 10% of total permanent employment. In 2012, the average number of temporary jobs was 5.75 jobs/mill. Gharbia Rice Milling Company at Shabsheer El-Hessa, which produced 30,000 t in 2012, is an exception; it employs 3,700 temporary workers during the production season (May–October).
The ratio of administrative jobs to production-related jobs is very high in the public sector, ranging from 13 to 60% with an average of 33.3% of total permanent jobs. Most interviewees acknowledged that employment in administrative and technical divisions is higher than needed. Direct employment in public sector mills in 2012 was 13.3 FTE for every 1000 t of feed produced.
The workers get their salaries paid throughout the whole year, although the production season extends for only 6–8 months of the year to match production from fish farms during the growing season (April–October). As a result, the profit margins of public sector feed mills are relatively low (US$26/t).
Private sector feed millsThe employment rate in the private sector fish feed mills is much lower than in the public sector. The number ranges from 3 to 110 persons mill, with an average of 29.2 jobs/mill. Female jobs represent 3.4% of total permanent employment. In fact, in the 17 private mills interviewed, only 3 mills acknowledged that they have permanent female jobs (one mill has 10 women, one has 3 and one has only 1 woman).
In 2012, the average number of temporary jobs was 8.9 jobs/mill. The proportion of administrative jobs in the private sector in 2012 ranged from 1.5% to 33% with an average of 17.5% of total permanent jobs, almost half of the proportion of administrative jobs in public sector mills. Direct employment in private sector feed mills is only 3.9 FTE for every 1000 t
of fish feeds produced and much lower than the equivalent figure of 13.3 FTE/1000 t in public sector mills. However, profit margins in private sector feed mills (average US$ 38/t) tend to be higher than those in public sector mills (average US$ 26/t).
feed traders, handling and marketingMarket shareAbout 85% of fish feed producers in the private sector sell their products directly to farmers, and only 15% sell to traders or retailers. Traders are sometimes also fish farmers, but they sell feed as an additional source of income. Traders and retailers sell the feeds to farmers with a price increase of about 2–5% (average 3.7%).In many cases, small-scale fish farmers purchase feed from producers on credit, or pay 50% of the price in cash and pay the rest on credit. In such cases, the cost of the feed can be paid after fish harvesting and selling. However, the prices increase by 3–6%. Under these conditions, the farmers risk receiving poor quality feed, but they have little bargaining power and don’t complain or object. Feed suppliers sometimes require payment for the feed as soon as possible, regardless of when it is the best time to market fish - which means farmers are forced to harvest and sell their fish during the peak fish sales time at the end of the year, when market prices are lowest.
The situation is different in state-owned/public sector feed mills where about 70% of produced feeds are sold to traders, and only 30% are sold to the farmers directly. This is because a credit-based system is very difficult to apply in the public sector. The mills generally ask for specific guarantees such as fixed assets, movable assets or savings certificates, but most small-scale farmers (under 10 ha of pond area) cannot provide these guarantees, making feed marketing one of the most serious problems facing public-sector fish feed mills.
21
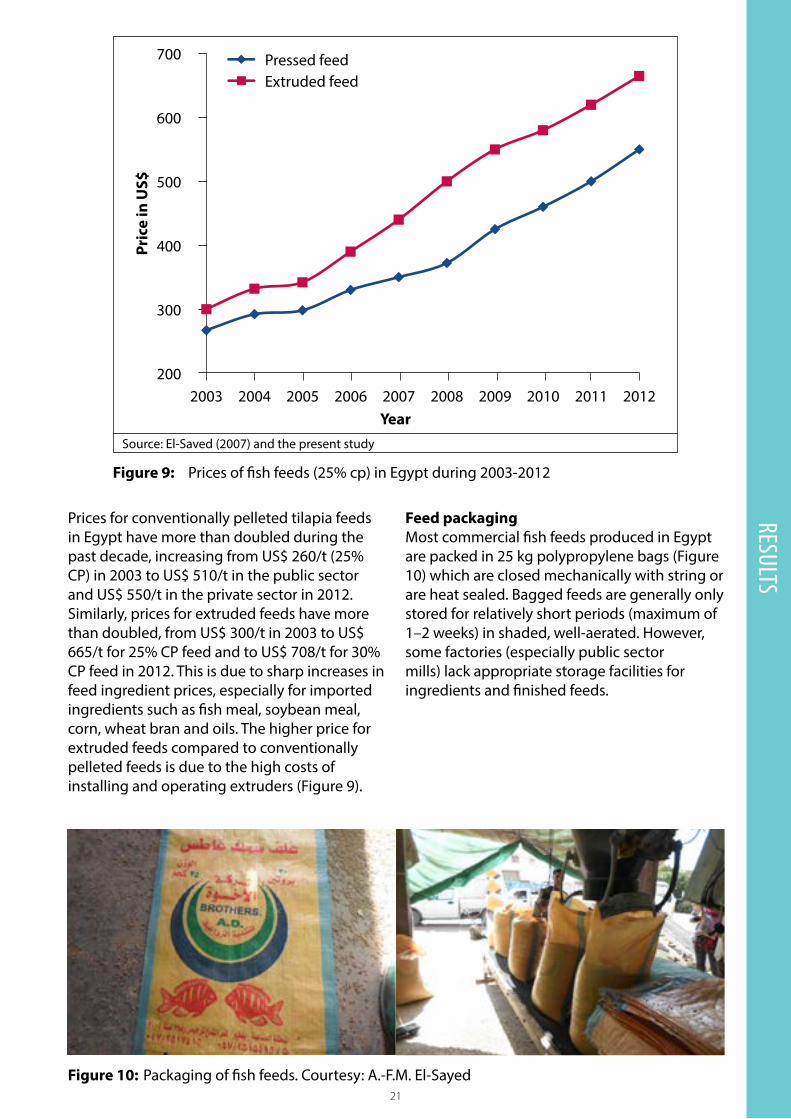
Prices for conventionally pelleted tilapia feeds in Egypt have more than doubled during the past decade, increasing from US$ 260/t (25% CP) in 2003 to US$ 510/t in the public sector and US$ 550/t in the private sector in 2012. Similarly, prices for extruded feeds have more than doubled, from US$ 300/t in 2003 to US$ 665/t for 25% CP feed and to US$ 708/t for 30% CP feed in 2012. This is due to sharp increases in feed ingredient prices, especially for imported ingredients such as fish meal, soybean meal, corn, wheat bran and oils. The higher price for extruded feeds compared to conventionally pelleted feeds is due to the high costs of installing and operating extruders (Figure 9).
results
Feed packagingMost commercial fish feeds produced in Egypt are packed in 25 kg polypropylene bags (Figure 10) which are closed mechanically with string or are heat sealed. Bagged feeds are generally only stored for relatively short periods (maximum of 1–2 weeks) in shaded, well-aerated. However, some factories (especially public sector mills) lack appropriate storage facilities for ingredients and finished feeds.
Figure 10: Packaging of fish feeds. Courtesy: A.-F.M. El-Sayed
Source: El-Saved (2007) and the present study
Figure 9: Prices of fish feeds (25% cp) in Egypt during 2003-2012
2004 2006 20082003 2005 2007 2009 2010 2011 2012
700
600
400
300
Pric
e in
US$ 500
200
Pressed feedExtruded feed
Year
22
results
Figure 11: Automatic loading of fish feeds on a large truck. Courtesy: A.-F.M El-Sayed
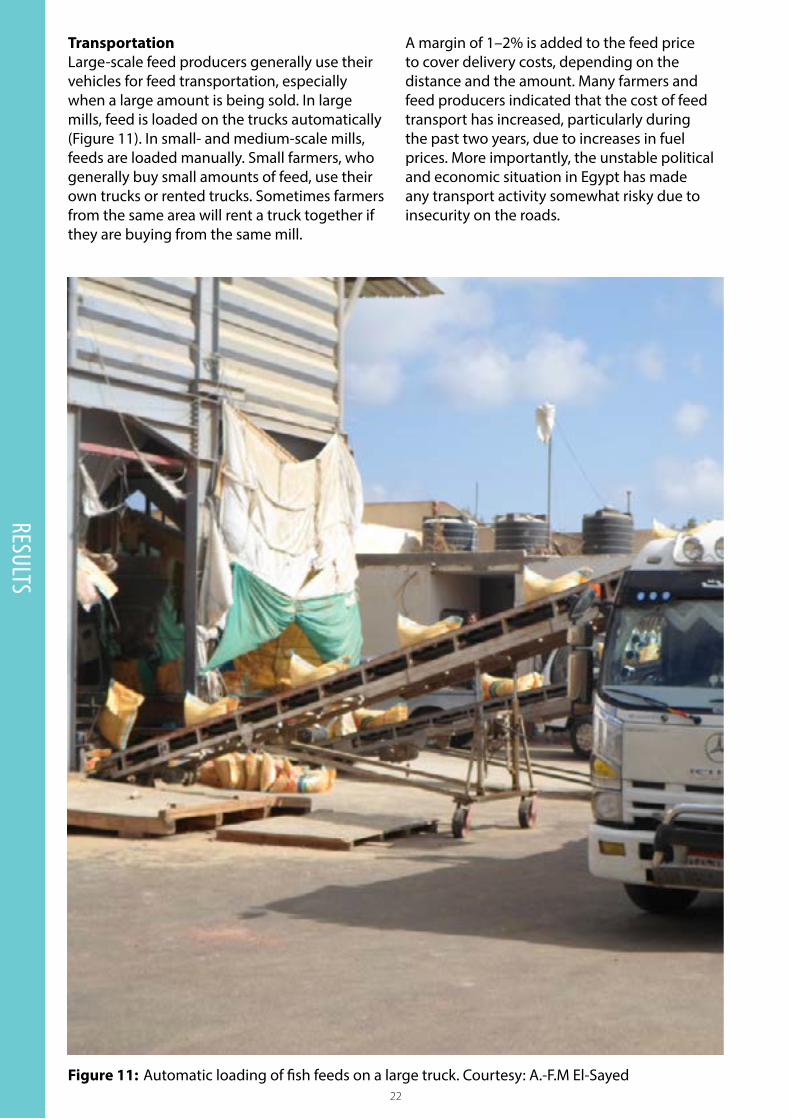
TransportationLarge-scale feed producers generally use their vehicles for feed transportation, especially when a large amount is being sold. In large mills, feed is loaded on the trucks automatically (Figure 11). In small- and medium-scale mills, feeds are loaded manually. Small farmers, who generally buy small amounts of feed, use their own trucks or rented trucks. Sometimes farmers from the same area will rent a truck together if they are buying from the same mill.
A margin of 1–2% is added to the feed price to cover delivery costs, depending on the distance and the amount. Many farmers and feed producers indicated that the cost of feed transport has increased, particularly during the past two years, due to increases in fuel prices. More importantly, the unstable political and economic situation in Egypt has made any transport activity somewhat risky due to insecurity on the roads.

23
StorageOne of the most serious challenges facing public sector feed mills and small-scale privately owned mills in Egypt is poor handling and storage of ingredients and processed feeds. They are often stored outdoors, on the ground, with poor shade or protection from the elements, leading to deterioration in the quality of both raw materials and feeds (Figure 12). In contrast, many larger-scale private feed mills have excellent handling, storage and transportation facilities, and comply with the Code of Practice for Good Animal Feeding (FAO 1998). Although the feed prices from these mills may be higher than those from the government-run mills, many fish farmers prefer to buy from them.
fish farmersMost of the fish farmers interviewed acknowledged that fish feed is the most important component of their farming practices, comprising 75–95% of total operating costs. This makes escalating feed prices a serious problem, especially for small-scale farmers.
Lack of access to credit has been a major constraint facing Egyptian fish farmers for many years (Zwirn 2002; El-Gayar 2003; El-Naggar et al. 2008). Both state-owned banks and private banks are reluctant to finance aquaculture enterprises, especially small-scale businesses. No insurance system is currently available to fish farmers in Egypt. Therefore, only large-scale aquaculture enterprises can obtain credit from the formal financial sector.
resultsAs a result, many small-scale fish farmers purchase processed feeds, feed ingredients, feed additives, etc., from the producers or traders on credit. Only 31% of interviewed farmers paid for their feed in cash, whereas 44% said they purchased on credit. A further 25% said they use a partial payment system, where they pay about 50% of the price in cash and the rest after harvesting and selling their fish crop. Many of the interviewed farmers reported that they sometimes receive poor quality feed (i.e. high dust or moisture levels and low pellet durability). This has been supported by the proximate analyses of random samples of different fish feed used by different farmers in different geographical areas (Section 4.1). However, 79% of farmers do not run any chemical analysis of the feed they purchase, mainly due to the high cost of analysis, and rely instead on the information provided by the manufacturer.
About 60% of semi-intensive fish farmers said they use pond fertilization in addition to supplementary feeding. Both organic fertilizers (poultry manure) and inorganic fertilizers, (urea, superphosphate (SP) and triple superphosphate (TSP)), are widely used. The farmers reported this as leading to significant decreases in running costs and improved feed utilization efficiency due to the contribution of natural food to pond production. The normal practice is to fertilize ponds before and just after stocking with fish. As the fish grow, water exchange increases, making pond fertilization less important.
Figure 12: Storage and handling of fish feeds. Left: Poor storage (Courtesy A.-F.M. El-Sayed); Right: Excellent storage Courtesy: H.A. Mansour, Zoocontrol Aquafeed Mill
24
serViCes
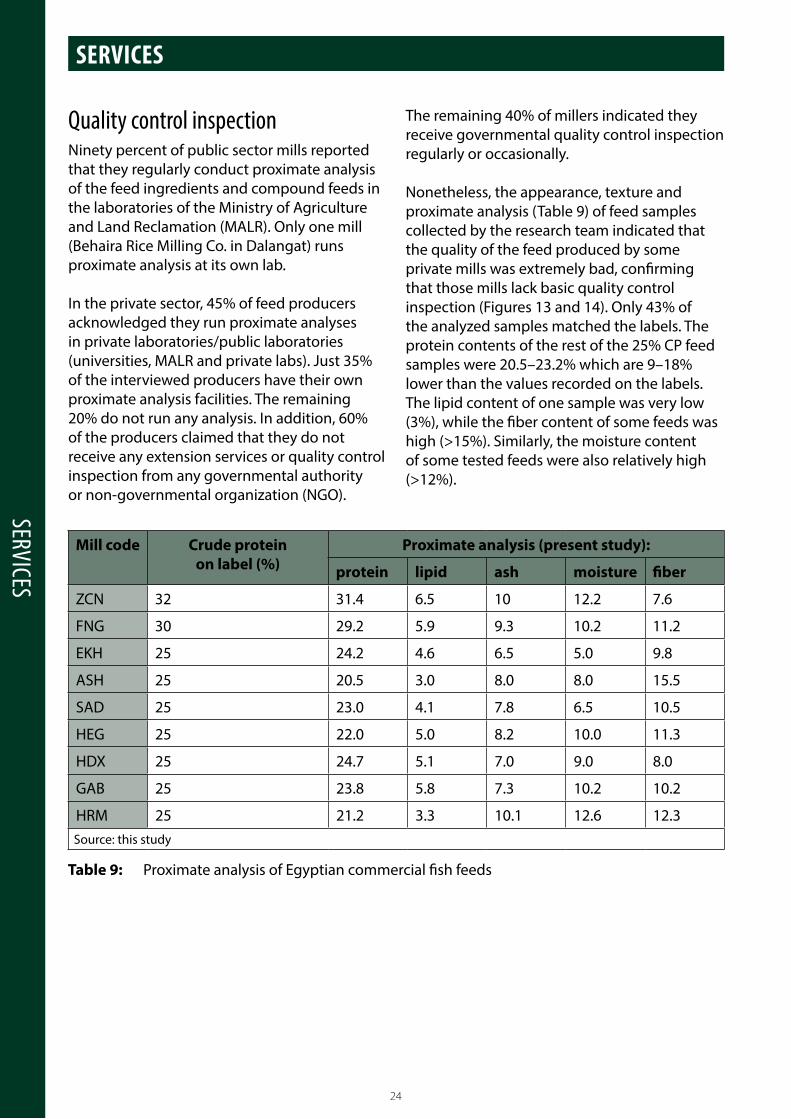
quality control inspectionNinety percent of public sector mills reported that they regularly conduct proximate analysis of the feed ingredients and compound feeds in the laboratories of the Ministry of Agriculture and Land Reclamation (MALR). Only one mill (Behaira Rice Milling Co. in Dalangat) runs proximate analysis at its own lab.
In the private sector, 45% of feed producers acknowledged they run proximate analyses in private laboratories/public laboratories (universities, MALR and private labs). Just 35% of the interviewed producers have their own proximate analysis facilities. The remaining 20% do not run any analysis. In addition, 60% of the producers claimed that they do not receive any extension services or quality control inspection from any governmental authority or non-governmental organization (NGO).
seRvices
Table 9: Proximate analysis of Egyptian commercial fish feeds
Mill code Crude protein on label (%)
Proximate analysis (present study):
protein lipid ash moisture fiber
ZCN 32 31.4 6.5 10 12.2 7.6
FNG 30 29.2 5.9 9.3 10.2 11.2
EKH 25 24.2 4.6 6.5 5.0 9.8
ASH 25 20.5 3.0 8.0 8.0 15.5
SAD 25 23.0 4.1 7.8 6.5 10.5
HEG 25 22.0 5.0 8.2 10.0 11.3
HDX 25 24.7 5.1 7.0 9.0 8.0
GAB 25 23.8 5.8 7.3 10.2 10.2
HRM 25 21.2 3.3 10.1 12.6 12.3Source: this study
The remaining 40% of millers indicated they receive governmental quality control inspection regularly or occasionally.
Nonetheless, the appearance, texture and proximate analysis (Table 9) of feed samples collected by the research team indicated that the quality of the feed produced by some private mills was extremely bad, confirming that those mills lack basic quality control inspection (Figures 13 and 14). Only 43% of the analyzed samples matched the labels. The protein contents of the rest of the 25% CP feed samples were 20.5–23.2% which are 9–18% lower than the values recorded on the labels. The lipid content of one sample was very low (3%), while the fiber content of some feeds was high (>15%). Similarly, the moisture content of some tested feeds were also relatively high (>12%).
25
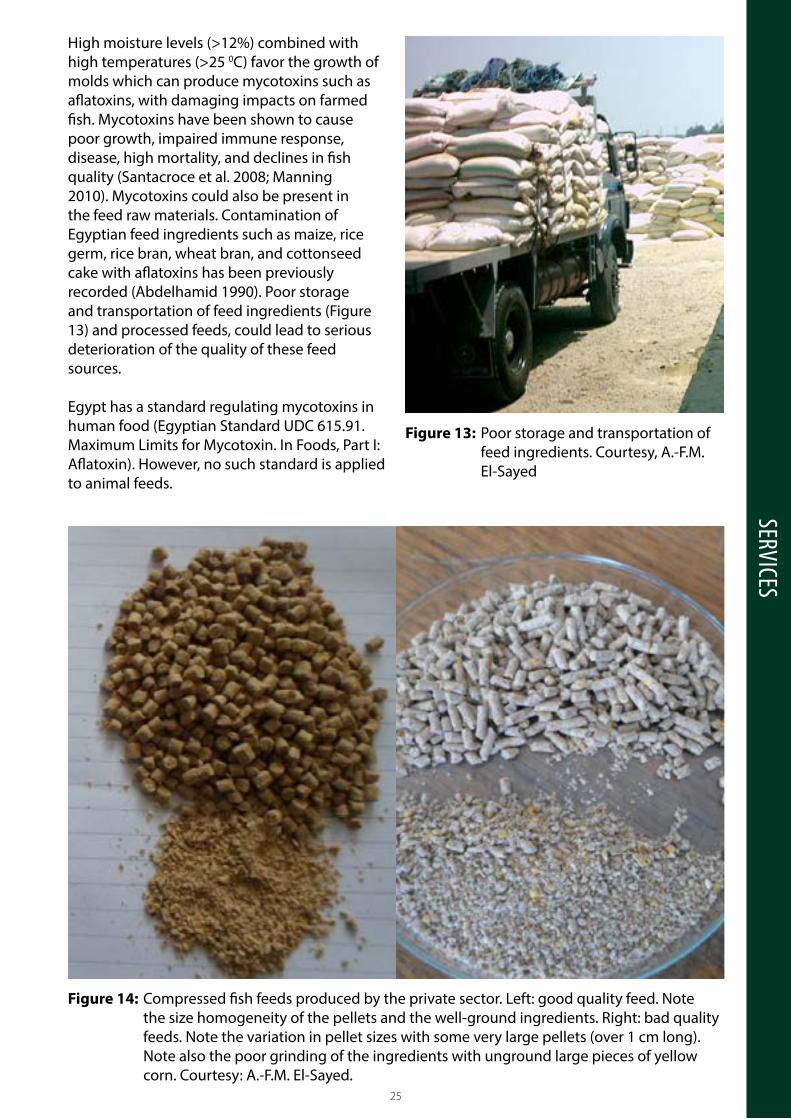
High moisture levels (>12%) combined with high temperatures (>25 0C) favor the growth of molds which can produce mycotoxins such as aflatoxins, with damaging impacts on farmed fish. Mycotoxins have been shown to cause poor growth, impaired immune response, disease, high mortality, and declines in fish quality (Santacroce et al. 2008; Manning 2010). Mycotoxins could also be present in the feed raw materials. Contamination of Egyptian feed ingredients such as maize, rice germ, rice bran, wheat bran, and cottonseed cake with aflatoxins has been previously recorded (Abdelhamid 1990). Poor storage and transportation of feed ingredients (Figure 13) and processed feeds, could lead to serious deterioration of the quality of these feed sources.
Egypt has a standard regulating mycotoxins in human food (Egyptian Standard UDC 615.91. Maximum Limits for Mycotoxin. In Foods, Part I: Aflatoxin). However, no such standard is applied to animal feeds.
Figure 13: Poor storage and transportation of feed ingredients. Courtesy, A.-F.M. El-Sayed
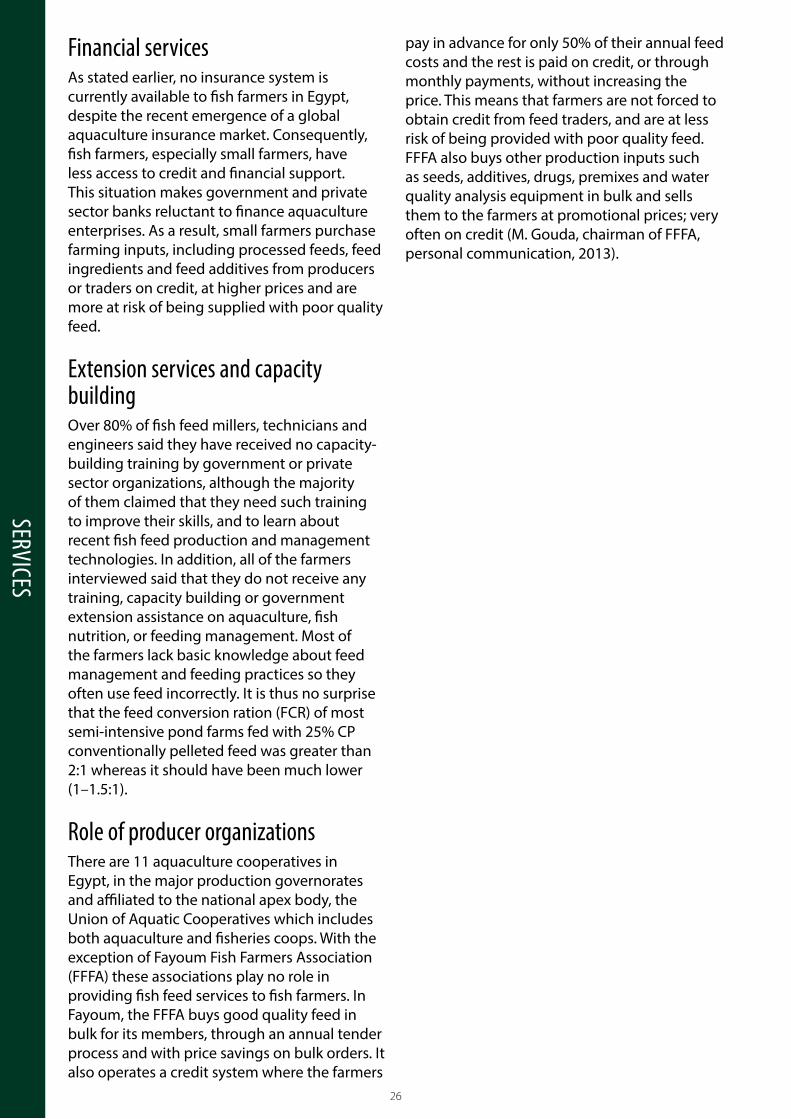
Figure 14: Compressed fish feeds produced by the private sector. Left: good quality feed. Note the size homogeneity of the pellets and the well-ground ingredients. Right: bad quality feeds. Note the variation in pellet sizes with some very large pellets (over 1 cm long). Note also the poor grinding of the ingredients with unground large pieces of yellow corn. Courtesy: A.-F.M. El-Sayed.
serViCes
26
serViCes
financial servicesAs stated earlier, no insurance system is currently available to fish farmers in Egypt, despite the recent emergence of a global aquaculture insurance market. Consequently, fish farmers, especially small farmers, have less access to credit and financial support. This situation makes government and private sector banks reluctant to finance aquaculture enterprises. As a result, small farmers purchase farming inputs, including processed feeds, feed ingredients and feed additives from producers or traders on credit, at higher prices and are more at risk of being supplied with poor quality feed.
extension services and capacity buildingOver 80% of fish feed millers, technicians and engineers said they have received no capacity-building training by government or private sector organizations, although the majority of them claimed that they need such training to improve their skills, and to learn about recent fish feed production and management technologies. In addition, all of the farmers interviewed said that they do not receive any training, capacity building or government extension assistance on aquaculture, fish nutrition, or feeding management. Most of the farmers lack basic knowledge about feed management and feeding practices so they often use feed incorrectly. It is thus no surprise that the feed conversion ration (FCR) of most semi-intensive pond farms fed with 25% CP conventionally pelleted feed was greater than 2:1 whereas it should have been much lower (1–1.5:1).
role of producer organizationsThere are 11 aquaculture cooperatives in Egypt, in the major production governorates and affiliated to the national apex body, the Union of Aquatic Cooperatives which includes both aquaculture and fisheries coops. With the exception of Fayoum Fish Farmers Association (FFFA) these associations play no role in providing fish feed services to fish farmers. In Fayoum, the FFFA buys good quality feed in bulk for its members, through an annual tender process and with price savings on bulk orders. It also operates a credit system where the farmers
pay in advance for only 50% of their annual feed costs and the rest is paid on credit, or through monthly payments, without increasing the price. This means that farmers are not forced to obtain credit from feed traders, and are at less risk of being provided with poor quality feed. FFFA also buys other production inputs such as seeds, additives, drugs, premixes and water quality analysis equipment in bulk and sells them to the farmers at promotional prices; very often on credit (M. Gouda, chairman of FFFA, personal communication, 2013).
27
Critical factorsThe following issues were identified as critical factors affecting the performance of the Egyptian aquaculture feed sector:
1. Dependence on imported feed ingredients. The prices of feed ingredients have been increasing in global, and consequently in domestic markets, leading to escalating prices for fish feeds, and this trend is set to continue. Furthermore the business is monopolized by a few large importers, who control the supply and price. Many feed producers complained that there are continuous fluctuations in the availability and quality of the ingredients they receive from the importers.
2. Limited capacity for production of high quality feeds. Many private and public mills are producing poor quality feeds, mainly due to the use of old technology and/or lack of quality control. Over 80% of Egyptian aquaculture feed is conventionally pelleted. If poorly formulated, processed and applied, the use of these feeds can lead to low feed efficiency and substantial waste. This study found that the average FCR for farmers using these feeds was 2:1, compared to FCRs of 1–1.5:1 for extruded feeds. In addition, feed ingredients and finished feeds are often badly handled and stored at feed mills, especially in state-owned mills and small privately-owned mills, while there is insufficient quality control inspection by government authorities, especially in private feed mills.
3. Seasonal production cycle. All feed mills work for only 6 to 7 months per year because demand from farms is seasonal, while permanent employees are paid for the whole year. This reduces the profit margins of mill owners and results in a preference for temporary rather than permanent employment.
4. Limited opportunities to increase employment. There appears to be little room to increase job opportunities in
cRitical factoRs and suggested actionsCritiCAl fACtors And suggested ACtions
the fish feed sector. About 4000–5000 employees and workers are engaged in the industry, most of whom only work for 6 to 7 months per year. Even if demand for feeds continues to increase, there is unused capacity to fill the gap. The situation is worst in public-sector mills where there have been unnecessary increases in administrative employment.
5. Limited access to credit. Public fish feed mills find it difficult to market their feeds and sell most of their production to traders/retailers, rather than directly to farmers. This is because a credit-based system is very difficult to apply in the public sector, because most small-scale farmers cannot provide the required guarantees. Most fish farmers also lack access to independent credit or financial support. As a result, they purchase the feeds from producers or traders on credit at higher prices, and are at risk of receiving poor quality feed.
6. Limited access to training. Most feed mills and fish farmers do not receive capacity building or other extension services. Without basic training, feed mills cannot make high quality feeds and farmers will use feed inappropriately, leading to feed wastage and poor feed efficiency.
suggested actions1. Reduce dependence on expensive feed
ingredients Many feed millers suggested that the
government should intervene by applying strict regulations for imports and price controls to break up, or at least reduce, the monopoly that the private sector operators have over the importation of feed ingredients. Some also suggested that the government should import feed ingredients to ensure that the private sector does not control the market. Reduced import tariffs would also be a way of reducing feed ingredient prices. However, it seems unlikely that these actions could be implemented, as they would need to apply across the entire animal feed industry. It may be more realistic
28
CritiCAl fACtors And suggested ACtions
for the authorities to introduce measures to encourage opportunities for local production of feed ingredients. This approach was used successfully in Bangladesh with chicken feeds in the Katalyst project. However, restrictions on land and water availability may limit or constrain the viability of this approach in Egypt.
Alternative feed raw materials could make a useful contribution towards reducing costs but will require further research. Potential candidates include: algal meals, single cell protein, insect protein, animal and fish by-products, food processing by-products, and nutrient-rich forages. However, the large scale of the Egyptian aquaculture industry means that very significant quantities would be required in order to make an impact (10,000 t = 1% of total aquaculture feed raw material requirements).
2. Improve capacity for production of high quality feeds
Quality control and inspection procedures should be put in place to improve feed quality. Inspection should include regular testing of feed ingredients and finished feeds, including proximate analysis and testing for contaminants such as mycotoxins. More feed mills should operate their own analytical labs so they can screen ingredients and verify that finished feeds meet expected specifications.
Inspection of feed producers, suppliers and ingredient importers is necessary to ensure that they comply with the international quality control standards, such as Hazard Analysis and Critical Control Points (HACCP) and the Code of Practice for Good Animal Feeding (FAO, 1998).
While extruded feeds are preferred by many fish farmers because they are considered to be more efficient than conventionally pelleted feeds (in feed conversion terms), they are significantly more expensive, as the capital costs of an extrusion processing line is more expensive and has higher operating costs (power requirements and maintenance costs). Feed management is easier with floating pellets than with sinking feeds and this is why extruded feeds are preferred by some fish farmers. Pelleting
entails buying high quality ingredients, following best practices in handling and storage of raw materials, grinding the raw materials into small particle sizes, accurate weighing out of ingredients, effective mixing of ingredients and so on. The problem with many conventional pellet mills in Egypt is that they are using old, poorly maintained equipment and not observing best practices throughout their handling, processing and storage lines. The result is poor quality feeds that will have clear impacts on fish growth and the profitability of fish farms.
Many of these deficiencies could be solved through training, whereas others will require investment in new equipment.
3. Increase employment opportunities in the aquaculture feed sector
The seasonal nature of aquaculture production systems in Egypt means that there is much higher demand for feeds in summer and autumn than in winter and spring. Although feed mills are operating at full capacity for half of the year, they stand idle at other times, but this does not mean that there is spare capacity. As fish farm production continues to grow, the peak feed requirement and employment opportunities will also grow, for both full-time and seasonal staff.
While it is assumed that many jobs are for youth, the current survey did not generate separate data for this group. However, it did confirm that employment levels of women in this industry are low, probably because of the tough physical environment in feed mills.
There are potential strategies to smooth out feed production through the year, thereby increasing the ratio of permanent to seasonal workers. One option would be to produce more feeds in the off-season, and store finished feeds in temperature controlled stores for sale in the peak season. However, prolonged feed storage is undesirable and is likely to be more expensive than increasing peak capacity of existing feed mills. There may be opportunities to improve the efficiency of feed mills, particularly in inefficient public sector mills, through training and rationalization. There may also be opportunities to extend the feed processing season by supplying export markets. Egyptian
29
feeds appear to be competitive in terms of international feed prices. As aquaculture is set to grow in other parts of Africa, Egyptian feed mills could target new markets.
A more realistic option for increasing employment in the fish feed sector would be to focus efforts on local raw material production. This would create significant levels of employment at the base of the supply chain. However, this would have to be weighed against the increased demand for irrigation water that would be needed for production of feed raw materials such as soybean. In a water deficient country such as Egypt, it may be more efficient to continue to import raw materials.
4. Improve access to credit Most Egyptian aquaculture businesses have
a seasonal production pattern, requiring significant investments in feeds over a six to eight month growing period before fish can be sold at the end of the year. The majority of fish farms are operated in leased ponds (which cannot be used as collateral) and many (perhaps 60%) are also unlicensed, making it difficult for them to borrow money from formal sources such as banks to fund feed purchases. This forces them to depend on credit from feed mills, feed traders (in the case of farmers buying from government-owned mills) and sometimes wholesalers who will buy their fish at harvest.
This is far from ideal, but it is these informal credit relationships that have allowed Egypt’s aquaculture industry to thrive and introduction of a more formal credit system would be difficult. Fish farms need to be licensed, they need better tenure over their land (most only have 3-year leases) and/or water and they need to have bankable collateral beyond the stock of fish in their ponds. Commercial banks need to learn about how aquaculture works (e.g. they cannot expect fish farmers to start making loan repayments immediately because of the seasonal nature of the business) and there will be little progress on any of these issues unless fish farmers can organize themselves more effectively to fight their case.
Nevertheless, Fayoum Fish Farmers Association offers an example of a group of fish farmers who have organized themselves and through bulk purchasing, have negotiated a better credit arrangement with feed suppliers.
5. Improve access to training Egypt’s aquaculture feed sector has
expanded rapidly over the last few decades to meet growing demand from aquaculture producers. As this study has shown, there are many new feed mills, with a wide range of quality standards, from internationally recognized feed brands to farm-made feeds. While experienced operators and larger mills usually have in-house support for capacity building, smaller mills will not. Training will be required in: sourcing quality materials, feed formulation, feed processing, equipment maintenance, marketing and business management, in order to produce the high quality feeds expected by the customers. Meanwhile producers need training in feed storage, feeding systems and feed management in order to improve the efficiency of feed use.
6. Strengthen the legal and policy environment
While there are Ministerial Resolutions governing animal feeds, there are significant weaknesses in the legal framework and its enforcement in the aquaculture feed sector. This should include registration and regular inspections of business in the feed production sector as well as setting and enforcing quality standards. This could involve a partnership approach between a quality-focused feed industry organization and the regulatory authorities.
CritiCAl fACtors And suggested ACtions
30
bibliogrAphy
Abdelhamid, AM. 1990. Occurrence of some mycotoxins (aflatoxin, ochratoxin A, citrinin, zearalenone and vomitoxin) in various Egyptian feeds. Arch. Tierernahr. 40:647–64.
Cocker, LM. 2014. Partnership for African Fisheries (PAF) Aquaculture Working Group: Strategic Review on African Aquaculture Feeds, 85 pp.
El-Gayar, O. 2003. Aquaculture in Egypt and issues for sustainable development. Aquaculture Economics and Management, 7(1/2):137–154.
El-Naggar, G, Nasr-Alla, A and Kareem, RO. 2008. Economic analysis of fish farming in Behaira governorate of Egypt. In Elghobashy, H, Fitzsimmons, K and Diab, AS. eds.. 8th International Symposium on Tilapia in Aquaculture. Cairo, Egypt. pp. 693–707.
El-Naggar, G, Nasr-Alla, A and Al-Kenawy, DA. 2011. Egyptian aquaculture. Unpublished paper.
El-Sayed, A-FM. 1999. Aquaculture Feed and Fertilizer Resource Atlas of Egypt. FAO, Regional Office for the Near East, Cairo, Egypt, 105 pp.
El-Sayed, A-FM. 2013. On-farm feed management practices for Nile tilapia (Oreochromis niloticus) in Egypt. In Hasan MR and New MB., eds. On-farm feeding and feed management in aquaculture. FAO Fisheries and Aquaculture Technical Paper No. 583. Rome, FAO. pp. 101–129.
FAO. 1998. Animal feed and food safety. Food and Nutrition Paper No 69. Rome, FAO. 48 ppFAO. 2013. FAOSTAT (http://faostat.fao.org/site/339/default.aspx).
GAFRD (General Authority for Fisheries Resources Development) 2013. Fisheries Statistics Year Book 2012. Cairo, GAFRD.
GAIN (Global Agricultural Information Network) 2011. Exporter Guide for Nigeria 2011. USDA, Foreign Agricultural Service, 24/6/2011.
Macfadyen, G, Nasr-Allah, A, Kenawy, DA, Ahmed, MFM, Hebicha, H, Diab, AS, Hussein, SM, Abouzied, RM and El Naggar, GO. 2011. Value-chain analysis of Egyptian aquaculture. Project Report 2011–54. The WorldFish Center. Penang, Malaysia. 84 pp.
Manning, BB. 2010. Mycotoxins in aquaculture feeds. Southern Regional Aquaculture Center (SRAC). Publication No. 5002, 4 pp.
Nordahl, PG, 2011. Is the aquaculture industry caught in a fishmeal trap? An examination of the fishmeal-soybean meal relationship and research initiatives aimed at reducing the fishmeal inclusion level in fish feeds. [MSc Thesis] Norwegian School of Economics and Business Administration: Bergen.
Santacroce, MP, Conversano, MC, Casalino, E, Lai, O, Zizzadoro, C, Centoducati, G and Crescenzo, G. 2008. Aflatoxins in aquatic species: Metabolism, toxicity and perspectives. Reviews in Fish Biology and Fisheries 18:99–130.
bibliogrAphy
31
Tacon, AGJ, Hasan, MR, Allan, G, El-Sayed, A-F, Jackson, A, Kaushik, SJ, Ng, W-K, Suresh, V and Viana, MT. 2012. Aquaculture feeds: Addressing the long-term sustainability of the sector. In Subasinghe, RP, Arthur JR, Bartley, DM, De Silva, SS, Halwart, M, Hishamunda, N, Mohan CV and Sorgeloos P. eds. Farming the waters for people and food. Proceedings of the Global Conference on Aquaculture 2010, Phuket, Thailand, 22–25 September 2010. pp. 193–231. FAO, Rome and NACA, Bangkok.
USDA/FAS (United States Department of Agriculture/ Foreign Agriculture Service) 2012. World Market and Trade Reports. http://www.fas.usda.gov/data.
Zwirn, M. 2002. Aquaculture in Egypt: Improving food security and resolving resource allocation conflicts. Journal of Environment and Development 11(2):129–148.
bibliogrAphy
32
Appendix 1 feed mAnufACturers’ questionnAire
General information:
1. Location (Governorate-district-county):
_____________________________________________________________________________
_____________________________________________________________________________
_____________________________________________________________________________
2. Ownership (public-private)
_____________________________________________________________________________
_____________________________________________________________________________
_____________________________________________________________________________
3. Are you the owner of the mill-the manager- both:
_____________________________________________________________________________
_____________________________________________________________________________
_____________________________________________________________________________
4. When did you start business?
_____________________________________________________________________________
_____________________________________________________________________________
_____________________________________________________________________________
5. Do you produce other animal feeds)?
_____________________________________________________________________________
_____________________________________________________________________________
_____________________________________________________________________________
6. If yes; what type of animal feeds do you produce?
_____________________________________________________________________________
_____________________________________________________________________________
_____________________________________________________________________________
7. What is the % of fish feed of total annual feed production?
_____________________________________________________________________________
_____________________________________________________________________________
_____________________________________________________________________________
8. What type of fish feed do you produce (pelleted, extruded, both):
_____________________________________________________________________________
_____________________________________________________________________________
_____________________________________________________________________________
Appendix 1. feed manufacturers’ questionnaire
33
Appendix 1 feed mAnufACturers’ questionnAire
9. In case of producing ‘both types’, what is the % of each type?
_____________________________________________________________________________
_____________________________________________________________________________
10. Do you have other sources of income in addition to feed manufacturing?
_____________________________________________________________________________
_____________________________________________________________________________
Description of the value chain 11. Production
Production capacity in 2012 (t/yr)
Real production in 2012 (t/yr)
Feed produced according to fish growth stage: % of total production
Pellet size (mm)
% CP % lipid
1. Larval feeds
2. Fingerling/juvenile feeds
3. Fattening feeds
4. Others
For what fish species do you produce the feed The % of feed produced for each species (group)
Tilapia
Mullets (which species?)
Carps (which species?)
Catfish
Marine fishes (which species)
Others (e.g. shrimps, export): Describe
Number of shifts per day One shift ( ) Two shifts ( ) Three shifts ( )
Other comments
12. Feed additives and premixesDo have a production line for feed premixes/additives in your production facility? If yes:
• Whatadditivesdoyouproduce(Vitaminandmineralmixes,enzymes,probiotics,etc.), _____________________________________________________________________________
• Whatisthe%ofadditives/premixesproducedforfishfeedcomparedtothatproducedforother animal feeds?
_____________________________________________________________________________• Whatistheaveragepricein2012?
_____________________________________________________________________________
If no, • Wheredoyougetyouradditives/premixesfrom?(mentionthesourceifpossible): _____________________________________________________________________________• Whatisthechangeinthepricesoffeedadditivesin2012comparedtopreviousyears?
(Increased- decreased- stable). ____________________________________________________________________________
34
Appendix 1 feed mAnufACturers’ questionnAire
13. Employment
Type of people employed
Total employment
Number of employees from same governorate/ county
Number of employees from other governorates/ counties
Estimated total days ofemployment per year (i.e. number x working days per year
Men-seasonal
Women-full time
Women-part-time all year
Women-seasonal
Others (Consultants)
14. What is the % of the following employment:a. Administrative jobs _____________%b. Technical jobs (Technicians, engineers, etc) _____________%c. Laborers _____________%d. Others (mention) _____________%
15. What proportion of your total yearly earnings/sales revenue come from aquafeed production, and what proportion from other business activities you may have?_____________% from aquafeed production_____________% from animal feed production_____________% from other business activities
16. Which link in the value chain is most important in setting prices for feed? Arrange according to the importance:
(Feed sources- traders/wholesalers- machinery- fish farmers- other factors)
_____________________________________________________________________________
_____________________________________________________________________________
17. How much feed did you produce and sell in 2012 in terms of volume and value, and for what average price?
Type of feed Production volume (t) in 2012 Average annual price (US$/t) in 2012Extruded:25% CP30% CP35% CP40% CP othersPressed:25% CP30% CP35% CP40% CPothers
35
Appendix 1 feed mAnufACturers’ questionnAire
18. From where do you buy your feed ingredients? - ( ) Direct importation - ( ) From local market - ( ) Others (mention)
19. From where do you buy your machinery and spare parts? - ( ) Direct importation - ( ) From local market - ( ) Others (mention)
20. How have fish feed volumes, sales revenue and prices changed compared to previous years?Type of feed Annual production volume in t
(up, down, stable) Average annual price in US$/t (up, down, stable)
Extruded:25% CP30% CP35% CP40% CPothersPressed:25% CP30% CP35% CP40% CPothers
21. What % of the total volume of your sales do you sell to:- Fish farmers directly _____________%- Fish feed traders/wholesalers _____________%- Fish feed retailers _____________%- Fish farmers’ cooperatives _____________%- Other (mention)_____________%
22. What are the main sources of finance used in your fish feed business (tick and obtain % if possible)( ) self-finance _____________( ) Cooperatives _____________( ) Investors (local/regional/international) _____________( ) Formal bank sources _____________( ) Other sources (describe): _____________
23. What are the operating costs?Cost item % of total operating
costs in 2012 Change in the cost over the years (up, down, stable)
Feed inputs (ingredients and raw materials) Premixes and additives Power, fuel, electricity, waterMaintenance and spare partsLabor and management (technical and administrative)Storage and transportSales commissionFeed analyses, quality inspection and monitoringTraining and capacity buildingOther (specify)
36
Appendix 1 feed mAnufACturers’ questionnAire
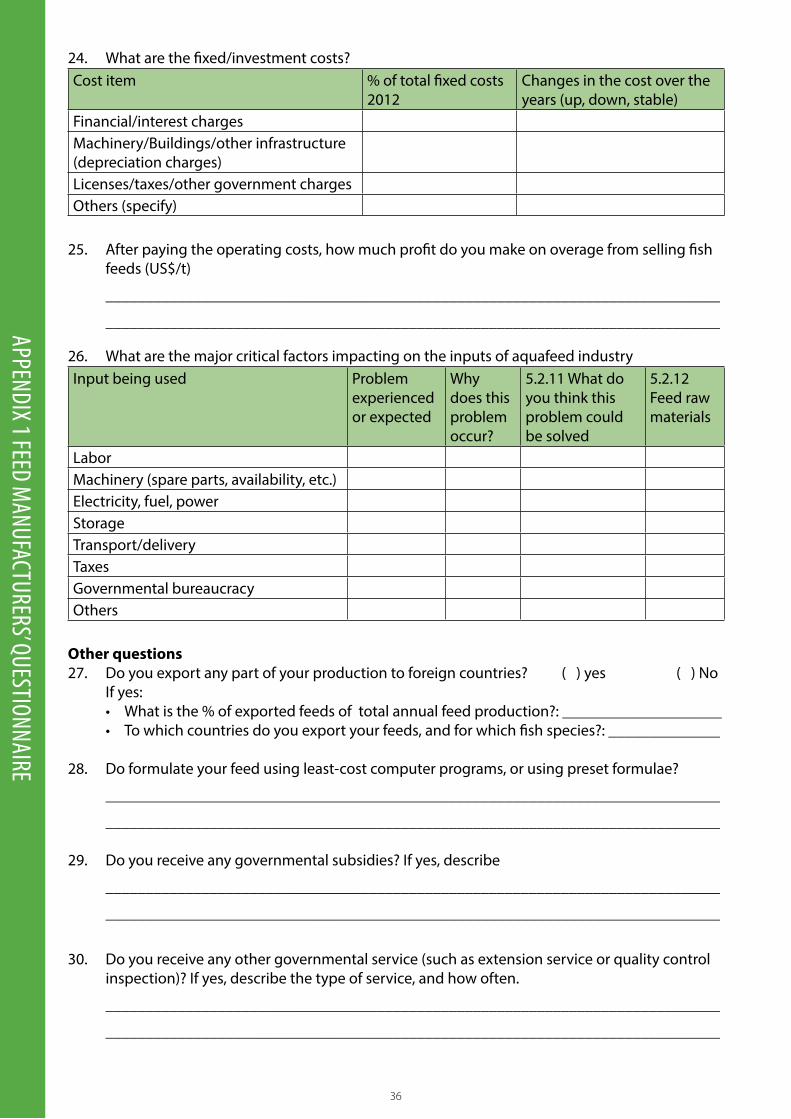
24. What are the fixed/investment costs?Cost item % of total fixed costs
2012Changes in the cost over the years (up, down, stable)
Financial/interest chargesMachinery/Buildings/other infrastructure (depreciation charges)Licenses/taxes/other government chargesOthers (specify)
25. After paying the operating costs, how much profit do you make on overage from selling fish feeds (US$/t)
_____________________________________________________________________________
_____________________________________________________________________________
26. What are the major critical factors impacting on the inputs of aquafeed industryInput being used Problem
experienced or expected
Why does this problem occur?
5.2.11 What do you think this problem could be solved
5.2.12 Feed raw materials
Labor Machinery (spare parts, availability, etc.)Electricity, fuel, powerStorageTransport/deliveryTaxesGovernmental bureaucracyOthers
Other questions27. Do you export any part of your production to foreign countries? ( ) yes ( ) No If yes:
• Whatisthe%ofexportedfeedsoftotalannualfeedproduction?:____________________• Towhichcountriesdoyouexportyourfeeds,andforwhichfishspecies?:______________
28. Do formulate your feed using least-cost computer programs, or using preset formulae?
_____________________________________________________________________________
_____________________________________________________________________________
29. Do you receive any governmental subsidies? If yes, describe
_____________________________________________________________________________
_____________________________________________________________________________
30. Do you receive any other governmental service (such as extension service or quality control inspection)? If yes, describe the type of service, and how often.
_____________________________________________________________________________
_____________________________________________________________________________
37
Appendix 1 feed mAnufACturers’ questionnAire
31. Is there any specific union, cooperative, NGO represent, or speak for, fish feed manufacturers? If yes, please describe
_____________________________________________________________________________
_____________________________________________________________________________ 32. Do you have any training and capacity building programs for your workers? If yeas, describe
these programs _______________________________________________________________
_____________________________________________________________________________
33. Do you need any specific capacity building programs? Specify.
_____________________________________________________________________________
_____________________________________________________________________________
34. Do you perform regular proximate analyses of your ingredients and processed feeds? If yes, how often? Do you have your own lab or use external labs?
_____________________________________________________________________________
_____________________________________________________________________________
35. What is the maximum shelf life of the feed inside the factory (i.e. how fast is the feed sold after produced?).
_____________________________________________________________________________
_____________________________________________________________________________
36. Do you use your vehicles to transport the feed to farmers/wholesalers?
_____________________________________________________________________________
_____________________________________________________________________________
37. What storage facilities do you have (both for raw materials and processed feeds)?
_____________________________________________________________________________
_____________________________________________________________________________
38. What type of problems do you have in the storage of feed ingredients and produced feed?
_____________________________________________________________________________
_____________________________________________________________________________
39. Is there any current or future expansion, innovation, development in your mill for improving production capacity and quality? If yes, describe
_____________________________________________________________________________
_____________________________________________________________________________
40. Do you have any other comments regarding the value chain of aquafeed industry in Egypt?
_____________________________________________________________________________
_____________________________________________________________________________
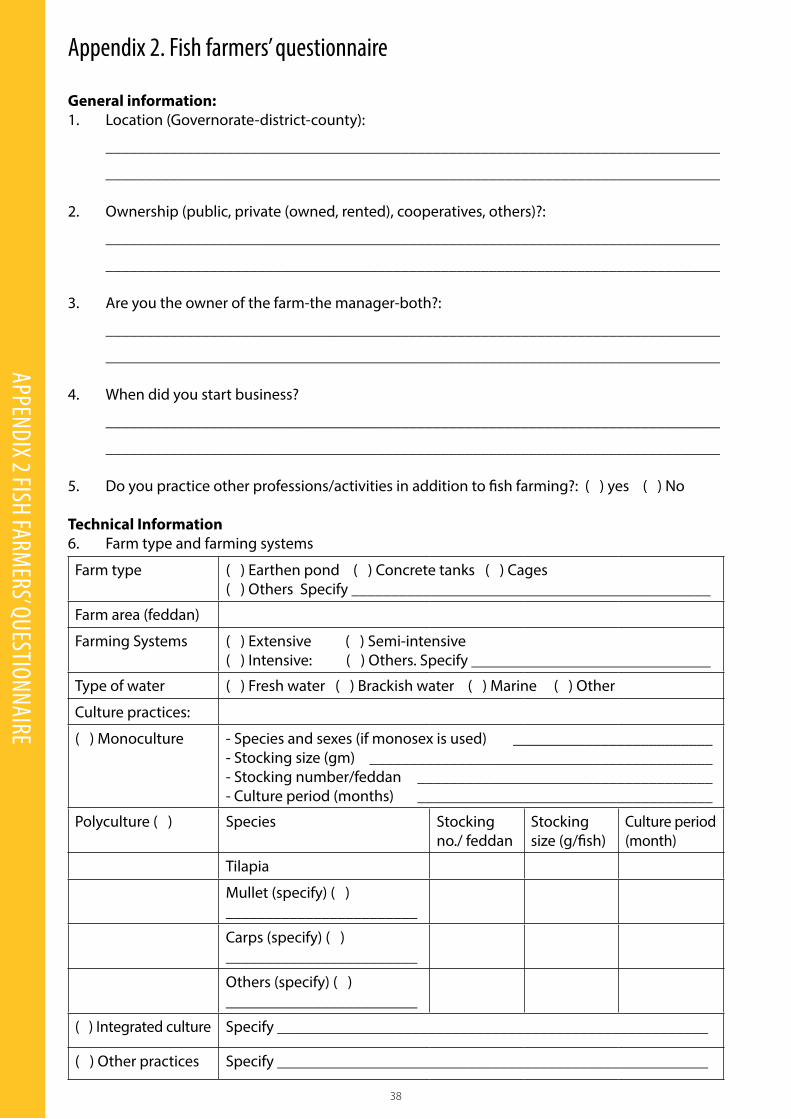
38
Appendix 2 fish fArmers’ questionnAire
Appendix 2. fish farmers’ questionnaire
General information:1. Location (Governorate-district-county):
_____________________________________________________________________________
_____________________________________________________________________________
2. Ownership (public, private (owned, rented), cooperatives, others)?:
_____________________________________________________________________________
_____________________________________________________________________________
3. Are you the owner of the farm-the manager-both?:
_____________________________________________________________________________
_____________________________________________________________________________
4. When did you start business?
_____________________________________________________________________________
_____________________________________________________________________________
5. Do you practice other professions/activities in addition to fish farming?: ( ) yes ( ) No
Technical Information6. Farm type and farming systems
Farm type ( ) Earthen pond ( ) Concrete tanks ( ) Cages ( ) Others Specify _____________________________________________
Farm area (feddan)
Farming Systems ( ) Extensive ( ) Semi-intensive ( ) Intensive: ( ) Others. Specify ______________________________
Type of water ( ) Fresh water ( ) Brackish water ( ) Marine ( ) Other
Culture practices:
( ) Monoculture - Species and sexes (if monosex is used) _________________________- Stocking size (gm) ___________________________________________- Stocking number/feddan _____________________________________- Culture period (months) _____________________________________
Polyculture ( ) Species Stocking no./ feddan
Stocking size (g/fish)
Culture period (month)
Tilapia
Mullet (specify) ( )________________________
Carps (specify) ( ) ________________________
Others (specify) ( ) ________________________
( ) Integrated culture Specify ______________________________________________________
( ) Other practices Specify ______________________________________________________
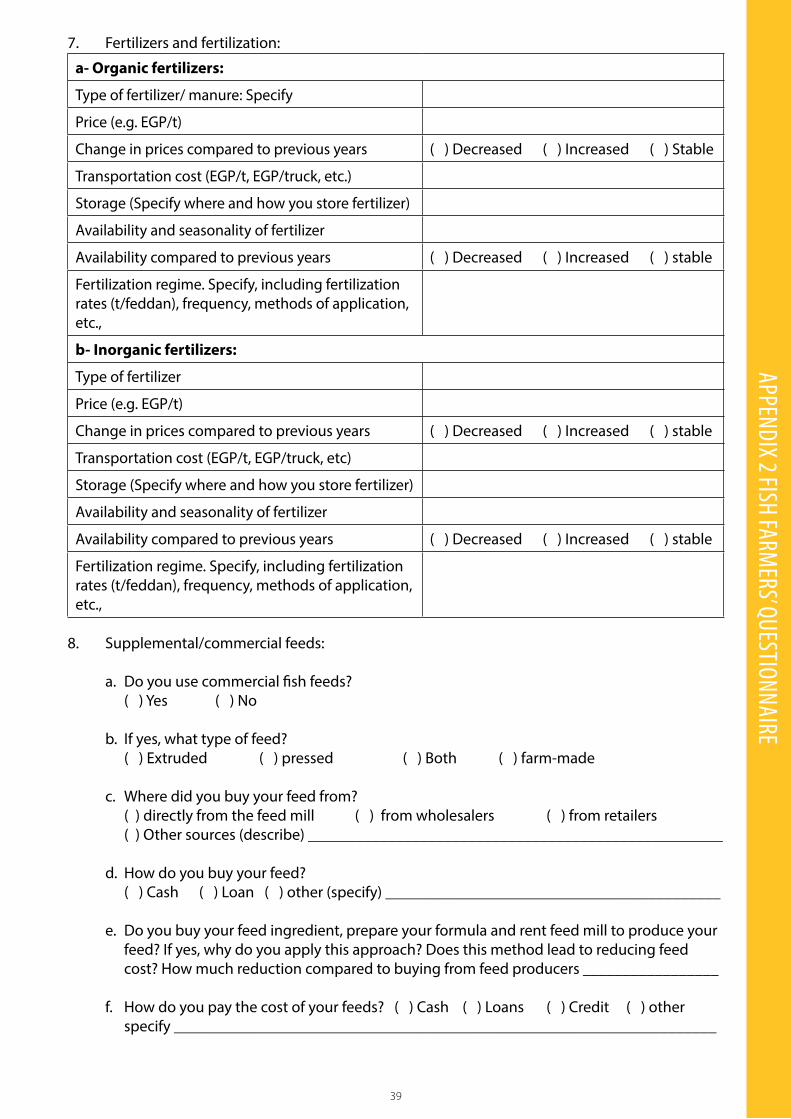
39
7. Fertilizers and fertilization:
a- Organic fertilizers:
Type of fertilizer/ manure: Specify
Price (e.g. EGP/t)
Change in prices compared to previous years ( ) Decreased ( ) Increased ( ) Stable
Transportation cost (EGP/t, EGP/truck, etc.)
Storage (Specify where and how you store fertilizer)
Availability and seasonality of fertilizer
Availability compared to previous years ( ) Decreased ( ) Increased ( ) stable
Fertilization regime. Specify, including fertilization rates (t/feddan), frequency, methods of application, etc.,
b- Inorganic fertilizers:
Type of fertilizer
Price (e.g. EGP/t)
Change in prices compared to previous years ( ) Decreased ( ) Increased ( ) stable
Transportation cost (EGP/t, EGP/truck, etc)
Storage (Specify where and how you store fertilizer)
Availability and seasonality of fertilizer
Availability compared to previous years ( ) Decreased ( ) Increased ( ) stable
Fertilization regime. Specify, including fertilization rates (t/feddan), frequency, methods of application, etc.,
8. Supplemental/commercial feeds:
a. Do you use commercial fish feeds?( ) Yes ( ) No
b. If yes, what type of feed?( ) Extruded ( ) pressed ( ) Both ( ) farm-made
c. Where did you buy your feed from?( ) directly from the feed mill ( ) from wholesalers ( ) from retailers( ) Other sources (describe) ____________________________________________________
d. How do you buy your feed?( ) Cash ( ) Loan ( ) other (specify) __________________________________________
e. Do you buy your feed ingredient, prepare your formula and rent feed mill to produce your feed? If yes, why do you apply this approach? Does this method lead to reducing feed cost? How much reduction compared to buying from feed producers _________________
f. How do you pay the cost of your feeds? ( ) Cash ( ) Loans ( ) Credit ( ) other specify ____________________________________________________________________
Appendix 2 fish fArmers’ questionnAire
40
Appendix 2 fish fArmers’ questionnAire
Type of feed
Extruded feed consumed in 2012 pressed feed consumed in 2012
Amount consumed (t) Price (EGP/t) Amount consumed (t) Price (EGP/t)
25% CP
30% CP
35% CP
40% CP
others
Total
Feed price compared to previous years ( ) Increased ( ) Decreased ( ) Stable
Feed availability and seasonality:
Specify whether the feed is available continuously or if it faces seasonal fluctuation?
Transportation cost (EGP/t)
Transportation problems
Storage: Specify where and how you store the feed
% of feed cost to total operating costs
Do you produce fish feed on-farm? ( ) Yes ( ) No
If yes, How do you make the feed? Specify what ingredients you use, processing (drying, grinding, cooking, etc.)
Do you use any additives? ( ) Yes ( ) No
If yes, which additives?
What was the prices of additives in 2012 in EGP/kg
What is the price of farm-made feed (EGP/t)
% of farm-made feed cost to total operating costs
g. How much feed did you use in 2012? and what are the average prices of the feed? (fill the table)
H. Changes in feed prices and availability?
9. Farm-made feed in 2012:

41
Feed type 25% CP 30% CP 35% CP 40% CP >40 CP Total average
Extruded feed:
Larval feeds
Fingerling/juvenile feeds
Fattening feeds
Pressed feeds:
Larval feeds
Fingerling/juvenile feeds
Fattening feeds
Farm-made feed:
Larval feeds
Fingerling/juvenile feeds
Fattening feeds
Input being used Problem experienced/ expected
Why does this problem occur?
What do you think this problem could be solved
Feed prices
Feed quality
Feed availability
Feed storage
Feed transport and delivery
Others (specify) _______________________
10. Feed conversion ratio (FCR)
Other questions12. Do you experience fish health problems/diseases related to feed?, if yes, what problems, how
often and what is the scale or impact on farm income? ________________________________
13. What is the feeding method do you apply? ( ) Manual ( ) Demand feeder ( ) Others
14. How do you get your seeds? ( ) Own hatchery ( ) Buy from producers.
15. In case of buying fish seeds, what are the major problems you face in terms of price, quality and availability?
16. How do you transport feeds from feed mills/traders to your farm? ( ) mill’s vehicle ( ) my own vehicle ( ) rented vehicle ( ) Other (specify____________)
17. Do you receive any governmental subsidies? If yes, describe
_____________________________________________________________________________
_____________________________________________________________________________
11. What are the major critical factors impacting on the inputs of fish feed and feed management?
Appendix 2 fish fArmers’ questionnAire
42
Appendix 2 fish fArmers’ questionnAire
18. What is the average harvest size and price (EGP/kg) in 2012?
_____________________________________________________________________________
_____________________________________________________________________________
_____________________________________________________________________________
19. Do you receive any governmental extension support regarding feed and feeding practices? And capacity-building? If yes, describe the type of service, and how often
_____________________________________________________________________________
_____________________________________________________________________________
_____________________________________________________________________________ 20. Do you receive any support from non-governmental organizations (e.g. fish farmers
associations), regarding training on aquafeed production, fish nutrition and feeding, and on-farm feed production/management? If yes, please describe
_____________________________________________________________________________
_____________________________________________________________________________
_____________________________________________________________________________
21. Do you need any specific training and capacity building programs? If yes, describe
_____________________________________________________________________________
_____________________________________________________________________________
_____________________________________________________________________________
22. Do you perform regular proximate analyses (or other analyses) of the feeds and feed ingredients you buy? If yes, how often?
_____________________________________________________________________________
_____________________________________________________________________________
_____________________________________________________________________________
23. What is the maximum shelf life of the feed in your farm?
_____________________________________________________________________________
_____________________________________________________________________________
_____________________________________________________________________________
24. Do you have any other comments on fish feed and feeding management?
_____________________________________________________________________________
_____________________________________________________________________________
_____________________________________________________________________________

43
This publication should be cited as: El-Sayed, A. F.M. (2014). Value chain analysis of the Egyptian aquaculture feed industry. WorldFish, Penang, Malaysia. Project Report: 2014-22.
© 2014. WorldFish. All rights reserved. This publication may be reproduced without the permission of, but with acknowledgement to, WorldFish.
Paper made fro mrecycled material
100% RECYCLED
Contact Details:WorldFish, PO Box 500 GPO,10670 Penang, MALAYSIAwww.worldfishcenter.org
Photo credits: Front cover & Back cover, Abdel-Fattah M. El-Sayed/Alexandria University