
value chain analysis of fisheries sector for rodrigues
85
VALUE CHAIN ANALYSIS OF FISHERIES SECTOR FOR RODRIGUES June 2012 REPORT/RAPPORT : SF/2012/18 European Union Funded by
Transcript of value chain analysis of fisheries sector for rodrigues

VALUE CHAIN ANALYSIS OFFISHERIES SECTOR FOR RODRIGUES
June 2012
REPORT/RAPPORT : SF/2012/18
EuropeanUnion
Funded by

Implementation of a Regional Fisheries Stategy For The Eastern-Southern Africa And Indian Ocean Region
10th European Development FundAgreement No: RSO/FED/2009/021-330
“This publication has been produced with the assistance of the European Union. The contents of this publication are the sole responsibility of the author and can in no way be taken to the views of the European Union.”

Implementation of a Regional Fisheries StrategyFor The Eastern-Southern Africa and India Ocean Region
Programme pour la mise en oeuvre d'une stratégie de pêche pour laregion Afrique orientale-australe et Océan indien
Value Chain Analysisof Fisheries Sector
For RodriguesSF/2012/18
Soobaschand Sweenarain
EuropeanUnion
Funded by
Implementation of a Regional Fisheries Stategy For The Eastern-Southern Africa And Indian Ocean Region
10th European Development FundAgreement No: RSO/FED/2009/021-330
“This publication has been produced with the assistance of the European Union. The contents of this publication are the sole responsibility of the author and can in no way be taken to the views of the European Union.”

Table of content Preface.......................................................................................................................... 5
Acronyms...................................................................................................................... 6
Acknowledgement.............................................................................................................. 8
Summary...................................................................................................................... 10
1. INTRODUCTION............................................................................................................ 24 1.1. Value Chain Assessment............................................................................................. 24
1.2. Rodrigue Island.......................................................................................................... 25
1.3. Methodology.............................................................................................................. 26
2. OVERVIEW OF FISHERIES SECTOR OF RODRIGUES.......................................28
2.1. Fisheries Policies......................................................................................................... 28
2.2. Fisheries Administration............................................................................................. 28
2.3. Recent Studies on the Fisheries Sector........................................................................30
2.4. Fisheries Infrastructure...............................................................................................30
2.4. Supporting Organisationd..........................................................................................30
3. SUPPLY CHAIN ANALYSIS............................................................................ 35
3.1. Key Determinants.......................................................................................................35
3.2. Large Net Fishery........................................................................................................36
3.3. Off-lagoon Hand Line (HL) fishery.............................................................................. 40
3.4. Non Motorised BT and HL fishery............................................................................... 42
3.5. Octopus Fishery.......................................................................................................... 45
3.6. Extended off-lagoon HL (chilled) fishery..................................................................... 48
3.7. FAD Fishery................................................................................................................. 51
4. MARKET STRUCTURES AND MARKETING FUNCTIONS........................................52
4.2. Market Price of Fresh Fish...........................................................................................53
5. VALUE CHAINS..................................................................................................56
5.1. Value Chains of LN fishery......................................................................................... 56
5.2. Value chains of Off-lagoon Hand line fishery............................................................. 57
5.3. Value chains of octopus fishery................................................................................. 58
5.4. Value chains of off lagoon (chilled fishery)............................................................... 59
6. SPORT FISHERY.................................................................................................. 61

7. CONCLUSIONS.................................................................................................. 62
7.1. Production functions.................................................................................................. 62
7.2. Marketing functions............................................................. ..................................... 62
7.3. Processing and value added activities.........................................................................63
8. RECOMMANDATION........................................................................................65
8.1. Policy advocacy...........................................................................................................65
8.2. Development of new extended artisanal (chilled) fisheries......................................... 65
8.3. Promote investment in infrastructure and equipment................................................ 65
8.4. Strengthen financial supports.....................................................................................65
8.5. Strengthen existing value chains.................................................................................65
APPENDX 1................................................................................................................................ 66
APPENDX 2................................................................................................................................ 68
APPENDX 3................................................................................................................................ 69
APPENDX 4................................................................................................................................ 71
APPENDX 5................................................................................................................................ 77
APPENDX 6................................................................................................................................ 79
APPENDX 7................................................................................................................................ 80

Programme SmartFish Rapport SF/2012/18 7
PREFACE
This Value Chain Analysis for the artisanal fisheries on the island of in Rodrigues complements a report of similar focus, prepared for Mauritius. Within the broader framework of the IOC SmartFish Programme (Implementation of a Regional Fisheries Strategy for ESA-IO programme), under the Regional Trade component, this report has been prepared to assist with a better understanding of the situation in the artisanal fishery from an economic and value perspective. This will allow for objective planning for potential interventions to assist in the move towards a more market driven and sustainable fishery that will enhance and contribute to the growing demand for fish in the country as well as investigate and enhance the ability to export beyond Rodrigues to markets in the region, specifically Mauritius, and Réunion are identified specifically.
This report looks closely at the different types of fishing methods within the artisanal sub-sector, such as the hand-line (motorized and non-motorized) fishery, the basket trap fishery, the large net fishery as well as the on-foot fishery. It provides a detailed analysis of performance in terms of typical business models for each unit and makes assessments of performance with respect to catch potential and capacity /over-capacity vs. stocks. Ultimately the impact on the local fishing communities, as well as the broader issue of increasing demand in the region is addressed and how to re-model and empower the artisanal fishery to better serve the economy, as well as the local population. Recommendations for short-term interventions are made to inform the many stakeholders of what works and what doesn’t work so well and a view to the future for everyone’s benefit.
Regionally, small island artisanal fisheries, as well as regional coastal artisanal fisheries are all dealing with issues of over-capacity and depleted stocks in coastal lagoons, as well as deciding how to ensure future productivity of the sector where local fishers derive a significant part of their livelihoods from fishing. This report will contribute to the regional knowledge in this regard and inform other initiatives to be planned regionally under the SmartFish programme.

Programme SmartFish Rapport SF/2012/188
ACRONYMS
BT Basket TrapBWA Bad Weather AllowanceC A Competent AuthorityCOP Cost of ProductionCPFD Catch Per Fisherman DayCPUE Catch Per Unit EffortCSA Close Season AllowanceCSO Central Statistics OfficeCSP Consumer Sale PriceDBM Development Bank of MauritiusEEZ Exclusive Economic ZoneEPMU Economic Planning and Monitoring Unit ESA – IO East-Southern Africa - Indian OceanEU European UnionFAD Fish Aggregating DeviceFFC Federation of Fishermen CooperativesFLS Fish Landing StationFPS Fisheries Protection ServiceFRTU Fisheries Research and Training UnitHACCP Hazard Analysis and Critical Control PointsHL Hand LineHN Harpoon NetHP Horse PowerICT Information and Communication TechnologyIFAD International Fund for Agricultural DevelopmentIFRS Implementation of Fisheries Regional StrategiesIOC Indian Ocean CommissionKg KilogrammeLFC Local Fisher CommunityLN Large NetMARS Marine and Agricultural Resources SupportMC Marketing CostMCS Monitoring, Control and SurveillanceMID Maurice Ile DurableMM Marketing MarginMOFR Ministry of Fisheries and RodriguesMP Marketing ProfitMRC Mauritius Research CouncilMSY Maximum Sustainable YieldNGO Non-Governmental OrganisationsPM Profit MarginPSP Producer Sale PriceRGF Rodrigues General Fishing Co. Ltd.RRA Rodrigues Regional AssemblyRs Mauritian RupeeSEMPA South East Marine Parks AuthoritySIDPR Sustainable and Integrated Development Plan for RodriguesSME Small & Medium Sized EnterprisesSN Shrimp NetSTE Short Term Expertise
Programme SmartFish Rapport SF/2012/18 9
Mt Metric TonneTC Total CostVAT Value Added TaxVCA Value Chain AnalysisWSP Wholesale Price

Programme SmartFish Rapport SF/2012/1810
ACKNOWLEDGEMENTS
Special thanks to:
• Mr. M. Jeetoo, Officer-in-Charge of the Economic Planning and Monitoring Unit (EPMU) and his staff for their valuable guidance and logistic supports.
• Mr. Sylvio Perrine, Scientific Officer, Fisheries Research and Training Unit (FRTU) and his team of enumerators for
their cooperation during the field works.
• Mr. Edouard J Darkson, Manager and the Members of Board of Rodrigues General Fishing Co. Ltd for providing operational and financial information on their activities
• Mr. Raffaut Renolph, Education Officer, Shoal Rodrigues for his assistance in documentary research on Large Net and octopus fisheries
• All those stakeholders of the fisheries sector who have voluntarily shared information of a private and confidential nature to enable this study to be realized.

Programme SmartFish Rapport SF/2012/18 11
LAYMAN’S SUMMARY
The Value Chain Assessment (VCA) of the fisheries sector for Rodrigues aims at examining the existing value chains and analysing the opportunities and constraints for its future development. Value chains help to maximise revenue flow in the fisheries sector through judicious utilization of scarce resources, processing, value addition, efficient marketing and distribution. In Rodrigues fishing has evolved over time from subsistence to commercial fisheries in an opportunist way in the absence of the basic infrastructural, extension and marketing facilities. Consequently the existing value chains of the local and regional (Mauritian) markets are either marginal or exhausted. Intensive fishing and overcapitalisation in the lagoon has led to the depletion of the sedentary fish stocks and damages to marine ecosystems. Open access, or the inexistence of a management framework, has contributed to impoverishment of local fisher folks. Paradoxically there are significant untapped fish stocks in the off-lagoon and deep-sea areas around the island that can lift up the fisheries sector as a major cluster of the regional economy. It is recommended to chart out an integrated action plan to marshal the development of extended artisanal and small scale fisheries with due emphasis on export oriented value chains.
RÉSUMÉ DES NON-INITIÉS
L’analyse des chaînes de valeur du secteur de la pêche de Rodrigues vise à examiner les chaînes de valeur existantes et d’évaluer les perspectives ainsi que les contraintes pour son développement futur. Les chaînes de valeur aident à optimiser les flux de revenus des produits de la mer grâce à une meilleure utilisation des ressources rares, la valorisation, et de commercialisation. A Rodrigues, le secteur de la pêche a évolué au fil du temps de façon opportuniste, en absence des infrastructures de base et des structures de marché. Par conséquent, les chaînes de valeur existantes tant sur les marchés locaux qu’à l’export (mauricien) sont aléatoires ou épuisées. La pêche intensive et des surinvestissements dans la petite pêche ont conduit à l’épuisement des stocks de poissons sédentaires dans le lagon et des dégâts importants aux écosystèmes marins. Le libre accès ou l’inexistence du cadre de gestion a contribué à l’appauvrissement des communautés des pêcheurs. Cependant, il existe des stocks de poissons encore sous-exploité au large du lagon et en haute mer autour de l’île ce qui peut hausser le secteur de la pêche comme un pilier de l’économie régionale. Il est recommandé d’élaborer un plan d’action intégré pour agencer le développement d’une pêcherie intermédiaire orientée vers les chaînes de valeur à l’export.
EXECUTIVE SUMMARY
The Value Chain Assessment (VCA) of the fisheries sector for Rodrigues Island is sponsored by the Implementation of a Regional Fisheries Strategies for the Eastern South Africa and Indian Ocean SmartFish Programme (IRFS ESA-OI) under the aegis of the Indian Ocean Commission (IOC) and funded by the European Fund. It is a step forward in the fine-tuning and implementation of the Sustainable and Integrated Development Plan for Rodrigues (SIDPR), 2009 by the Fisheries Commission of the Rodrigues Regional Assembly (RRA), which is within the framework of the new Fisheries Master Plan and the Mauritius Ile Durable (MID) project of the Central Government. A VCA of the small scale or artisanal fisheries requires a business oriented approach whereby the various components of the value chain - fishing, processing and marketing are viewed as enterprises or cost centres. Although in-bound and out-bound logistics are external factors of a value chain, they are of critical importance for the efficiency of the core activities.

Programme SmartFish Rapport SF/2012/1812
Production
Formally the fisheries sector of Rodrigues comprises 1,410 registered fishers and 1,821 fishing boats while the total fish production is approximately 1,600 Mt. The gross annual revenue generated by the various types of fishing activities (excluding the sport fishery) is estimated at Rs 174 Million on the basis of a mean producer sale price of Rs 109/ kg. It represents an annual income of Rs 123,688 per registered fisher (Rs 10,307 per month). The tendency to err on the side of short term economic needs of fishers instead of long term conservation or sustainability has led to further overexploitation and depletion of the coastal fishery resources. There must be no compromise whatsoever on doing away with open access/common property rights and laissez faire in coastal marine fisheries.
Chart 1: Total Catch 1997 - 2010 in metric tonnes
Given that a fishing boat carries 3 to 4 fishing crew, there are potentially 5,823 active fishers (including 330 on-foot fishers mostly fisherwomen) in the sector. Therefore the net annual income of a fisher operating in the lagoon can fall as low as Rs 29,950, meaning that approximately Rs 132 million (75 %) of the gross income does not benefit the registered fishers.
An additional production of approximately 3,200 Mt of fresh fish would be necessary to accommodate 5,823 fishers with a mean annual income of Rs 90,000 on the basis of a minimum household income of Rs 7,500 per month. Fisheries expansion is plausible off-lagoon and high seas around Rodrigues. It is indicated that 70% of highs seas fish resources in the Western Indian Ocean are unknown or unexplored. The FAD fishery can potentially yield 1000 Mt of tuna and large pelagics annually on the basis of 60 Mt per FAD (Lojac H’meur, 1989 and C. Roullot, 1991). It is proposed to chart out a performance based fisheries development plan with a targeted increase in marine fish production of 5,000 Mt in the short and medium terms. Development initiatives of RGF off-lagoon HL fishing fleet and the IFAD-MARS extended artisanal fishing fleet have to be supported by an enabling environment at all levels.
Fisheries statistics are not reliable due to an out-dated sampling, data collection and processing system in addition to a shortage of human and technical resources at the FRTU. Apparently the actual production is much higher, since the 2005 Annual Fisheries Bulletin has not been published. Administrative records maintained by the FPS on registered fishers, fishing boats and fishmongers have to be consolidated into a computerised data-base that can be useful for fisheries management purposes.

Programme SmartFish Rapport SF/2012/18 13
Marketing
In marketing, raw fish is considered as a non-branded fast moving consumer product. Traditional fishing enterprises just sell their catch and do not “market” them. They must be trained in marketing to increase their revenue and to obtain a fair share of the value added in the supply chain.
The flow of market information is essential to promote a fair and transparent market mechanism. An increase in supply of raw fish may depress prices on the local markets due to the limited purchasing power of consumers. To enhance value chains of fresh/chilled fish it is important to develop export markets. Effective demand for high quality chilled fish in Mauritius arises from local markets for direct consumption and from the seafood hub’s processing for re-export. Two major hurdles have to be removed in order to link local chilled fish value chains in Rodrigue to the Mauritian seafood hub, namely cost effective transportation (sea and air) logistics and compliance to international sanitary and health standards and HACCP alignment. Reunion Island can also be targeted as a prospective market for raw fish and fish products.
Marketing infrastructure is virtually non-existent on the island. Raw fish is sold on the beach (at fish landing stations (FLS)) or on the roadside. There are no sheltered FLS that can be used for handling, sorting and grading of fish prior to sale. Simply by improving the landing facilities (better sorting and grading of raw fish by commercial category) can increase the revenue of a fishing enterprise by 5 to 10%.
Market Price by Product Segment - Year 2011 ( Rs/Kg) which chart2

Programme SmartFish Rapport SF/2012/1814
Existing FLS have to be renovated and operationalized at the earliest in close collaboration with the Local Fisher Communities (LFC). More FLS have to be set up in major fishing villages.
The supply chain of fresh fish is short and geographically limited because the product is highly perishable. To extend the shelf life of the product it is crucial to enforce adequate handling and preservation practices along the supply chain. The use of isotherm boxes, flexible containers and ice flakes is necessary to enhance the value chain of high value fish species on local and export markets. The implementation of world class food safety, quality and traceability standards in the seafood sector is a pre-condition for export oriented market development.
Chilled fish value chains are economically more attractive for artisanal and semi-industrial fisheries of insular states as compared to frozen raw fish. For instance the difference between consumer prices of chilled and frozen fish is approximately 2:1. Efficient downstream logistics have to be developed. A refrigerated supply chain is more appropriate for industrial or large scale fisheries due to its high initial investments. In the artisanal fisheries, refrigeration is rather a means of preservation of last recourse for unsold fish. A local practice of using domestic refrigerators or cold rooms to store fresh fish is hazardous to public health. An extension of the Competent Authority in Rodrigues will be necessary for capacity building in world class food safety, quality standards and HACCP alignment in the local seafood sector.
Marketing Channel Flow Chart
1st Grade Fish
Other Grades Fish
(LN, BT/HL)
Octopus Collectors Process/Exporters
Cottage Processors
Fish Traders
Fish Hawkers
Fish Markets
Hotels & Restaurants
End Consumers
Export to Mauritius

Programme SmartFish Rapport SF/2012/18 15
Processing and Value added activities.
Value chains in processing and value added operations in the fisheries sector are minimized for the following reasons:
i) Scarce supply of raw fish; ii) Inadequate technical and financial support; iii) Absence of handling and preservation practices for raw fish; iv) Non-compliance with international sanitary and health standards and to HACCP;v) Restricted markets: local consumers and visitors; vi) Lack of fisheries infrastructure such as FLS, ice-flake plants, etc.; vii) Absence of out-bound logistics for export of chilled products;viii) Lack of entrepreneurial and management skills.
A few examples of value added (chilled) fish products are given below:
• Value added (vacuum packed) fish fillet / loin, cubes, slices, whole and gutted;• • Semi processed fish ball, burgers, sausages and paste;• • Ready-to-cook marinated, smoked, pre-cooked (traditional recipes), pickles.
Value Chain of Chilled FishActual
Fishing Units(6 fishing boats)
Fishing Units(6 fishing boats)
Fish TerminalSorting /grading
Cleaning / packaging
Ice flakes &Containers
Processing UnitValue added
Products(HACCP aligned)
Ice FlakeUnit [500kg/day]
Processing[Cleaning, Gutting,
Slicing, packing]
Cold Storage[Blast Freezer,
Cold & Chill Room]
MarketingFishmongers
End Consumers
Exports to MRU
Local Markets
Export MarketsMauritius / Reunion
(Re-exports)
Octopus Collector – cum –Exporter

Programme SmartFish Rapport SF/2012/1816
From the above, it can be concluded that the fisheries sector can be improved as the driving force of the local economy such as in the small island states of Seychelles, Maldives, Hawaii or Finland. There should be an ambitious and performance oriented development and management plan to resolve the problem of conservation of the lagoon ecosystems, marshal a concerted action plan to develop export-oriented small scale and extended chilled fisheries in the off-lagoon and high-seas around the island.
The existing extension services must be upgraded to provide adequate support to stakeholders in product development, fish handling and preservation of fish, up-grading of existing fishing boats, demonstration of new fishing techniques, exploration of new off-lagoon fisheries, entrepreneurial skills in fishing, processing, marketing, business management skills, project facilitation and mentoring.
Local leadership and community based management capabilities have to be developed in LFCs to ascertain their active participation in voluntary compliance to Monitoring, Control and Surveillance (MCS) of coastal fisheries, fish handling and preservation practices, shared management of fisheries infrastructure.
There is a strong political determination to create an enabling business environment in Rodrigues. These efforts have to be seen in the fisheries sector through the development of crucial infrastructure facilities such as FLS, an integrated fishing terminal, export logistics for chilled fish and fish products, promotion of export market development, private local and foreign investments, joint venture, strategic alliances and domestication of foreign fishing and processing companies.

Programme SmartFish Rapport SF/2012/18 17
Recommendation
1. Policy advocacy:
i) To establish coastal fisheries management to encompass effective monitoring, control and surveillance (MCS) measures.
ii) To enforce food safety and quality practices for fish and fish products sold on the local markets and for exports.
iii) To regulate and monitor the activities of amateur, leisure and game fishers (including on-foot fishers) in the coastal fishing zones.
2. Development of extended artisanal (chilled) fisheries: FAD and open-sea tuna, tuna-like and large pelagic fisheries and Deep-sea demersal fishery
i) Direct Investment, transfer of technology, technical assistance
ii) Motorization of traditional crafts, use of more efficient fishing techniques, fish prediction data, application of GIS and remote sensing etc.
iii) Extension and facilitation services: training, re-skilling and mentoring
iv) Transfer of technology and capacity building in quality assurance
v) Fisheries exploration and testing of more efficient fishing technologies.
3. Promote Investment in Infrastructure and Equipment
i) Air-freight logistics to enable export of chilled fish products
ii) Fishing Landing Station (FLS) and fish markets in major regional fishing centres
iii) Integrated fishing port, ice flake machinery, isotherm/cool room
4. Strengthen Financial Supports
i) Suitable loan for asset and working capital finance for fisher folk, artisanal processors and traders;
ii) Promote banking and saving culture
iii) Provide financial literacy, entrepreneurial skills (pricing and costing) and business management.
5. Strengthen existing value chains
i) (Strategic alliance / partnership) Partial processing of local catch and final processing in other markets
ii) Second and third cycle of processing activities (ready-to-cook and ready to eat products)
iii) Product Research and Development
iv) Opening of export markets
v) Marketing Intelligence to obtain real time market information.

Programme SmartFish Rapport SF/2012/1818
RÉSUMÉ EXECUTIF
Cette étude des filières du secteur de la pêche de Rodrigues est mise en oeuvre par le programme « Implementation de Stratégies des Pêches pour les pays sud-est Africains et l’océan Indien », communément appelé « SmartFish » sous les auspices de la Commission de l’océan Indien et financé par l’Union Européenne. Elle est un pas en avant vers l’adaptation du secteur de pêche au Plan de Développment Soutenu et Intégré de Rodrigues, 2009 par la Commission des pêches et l’Assembée Régionale de Rodrigues aussi bien qu’elle s’insère au Plan Directeur des pêches et le projet Maurice – Ile Durable (MID) du governement central.
L’analyse des filières dans le secteur de la pêche implique une approche d’entreprenariat comprenant des différentes composantes de la filière de l’amont en aval – pêche, transformation/valorisation, et la commercialisation comme des activités économiques à part entière. Bien que les logistiques - en amont et en aval - sont considérés comme des facteurs externes de la chaîne de valeurs, ils jouent un rôle important dans la compétitivité des activités primaires.
Production
Officiellement le secteur des pêches de Rodrigues comprend 1410 pêcheurs professionnels et 1821 pirogues de pêche alors que les captures annuelles sont estimées à 1600 tonnes. Le revenu global généré par les différentes activités de pêche (excluant la pêche sportive) s’élève à 174 million de roupies moyennant un prix de 109 roupies le kilo à la première vente. Ceci représente un revenu moyen de 123, 688 roupies par an par pêcheur professionnel soit 10,307 roupies par mois. Le choix de focaliser sur les gains à court terme au lieu d’une exploitation à long terme et durable a mené à l’épuisement des ressources halieutiques et à la dégradation de l’écosystème marin. Il ne devrait pas avoir un compromis pour se défaire l’approche de libre accès or une politique de laissez-faire dans le secteur de la pêche locale.
Tableau 1: Captures totale - 1997 - 2010 en tonnes

Programme SmartFish Rapport SF/2012/18 19
Sachant qu’une embarcation de pêche emploie de 3 à 4 pêcheurs, Il aurait potentiellement environ 5,823 pêcheurs actifs (incluant 330 pêcheurs à pieds qui sont principalement des femmes pêcheurs) dans le secteur. De ce fait, le revenu annuel par pêcheur en activité dans la pêcherie peut baisser jusqu’à 29,950 roupies, c›est-à-dire que plus de 132 million de roupies, soit 75 % du revenu du secteur de la pêche ne profite pas directement les pêcheurs professionnels.
Autrement, il faudrait une production additionnelle d’environ 3,200 tonnes pour assurer un revenu décent aux 5,823 pêcheurs actifs sur la base d’un revenu moyen de 90,000 roupies par an soit 7,500 roupies par mois. L’expansion des pêcheries hors-lagon et en haute mer autour de Rodrigues est plausible. Plus de 70% des ressources en haute mer dans l’océan Indien occidental est encore méconnu et sous-exploité. Le réseau de DCP déployé au tour de Rodrigues peut produire 1000 tonnes de gros pélagique par an soit 60 tonnes par DCP (Lojac’Hmeur , 1989 et Roulet 1991). Donc, il est proposé d’élaborer un plan de développement de la hauturière pour augmenter la production de poisson de 5,000 tonnes à court et moyen termes. Les initiatives de société étatique « Rodrigues General Fishing Co. Ltd » et le projet IFAD -MARS pour le développement d’une pêcherie intermédiaires se cadrent bien dans cette nouvelle vision et doivent être soutenues par un environnement macroéconomique adéquat.
Les statistiques de pêche ne sont pas fiables et le système d’échantillonnage, de collecte et de traitement est dépassé ainsi les ressources humaines et techniques de la FRTU sont inadéquates. Il est certain que les captures réelles sont nettement supérieures que préconisent les statistiques de pêche. Les statistiques de pêche ne sont pas publiées depuis 2005. Aussi les données administratives recueillies par le Service de Protection sur les pêcheurs professionnels, les embarcations de pêche, les vendeurs de poisson doivent être consolidées en une base de données aux fins de gestion de la pêcherie.
La commercialisation
Le poisson frais est un produit « basic » qui se vend bien. Les pêcheurs traditionnels ne se préoccupent pas pour la vente de leurs captures et ne font aucun effort de marketing. Ils doivent être sensibilisés et formés pour mieux valoriser et commercialiser des produits de la pêche en vue d’accroître leurs revenus tout en assurant une distribution équitable des valeurs entre les différents acteurs de la filière. La diffusion des informations commerciales sur les produits de la pêche est essentielle pour assurer des transactions justes et transparentes. Une hausse de production de poisson peut faire chutée le prix sur les dans le secteur du «Seafood Hub». Deux obstacles majeurs devront être surmontés pour connecter la filière de pêche rodriguaise au secteur du «Seafood Hub» de Maurice notamment, efficience du fret (maritime et aérien) et le respect des normes sanitaires et d’hygiène. La Réunion marchés locaux à cause du pouvoir d’achat limité des consommateurs. Il est impératif de développer des exportations si on tient à valoriser les produits de la pêche. Il existe une demande croissante des poissons de qualité pour la consommation directe sur les mauriciens mais aussi pour la transformation peut aussi bien s’intéressée les produits de la pêche de Rodrigues. Les infrastructures à terre sont quasiment inexistantes. Le poisson est vendu aux débarcadères ou au bord de la route. Il n’y a pas des endroits abrités pour travailler – le tri par espèce et par taille, le lavage - avant la commercialisation vente. Simplement en améliorant le traitement à terre, il est possible d’augmenter le revenu à la première vente de 5 à 10 %.

Programme SmartFish Rapport SF/2012/1820
Tableau 2 : Prix par catégorie commerciale de poisson - 2011 ( Rs / kilo)
Les débarcadères existants doivent être rénovés et mis en opération en collaboration avec les organisations des pêcheurs les plus vite. D’autres débarcadères devront être aménagés dans les principaux centres de pêche. Le circuit commercial des produits de la pêche est court et limité géographiquement parce que ce dernier est hautement périssable. Pour mieux préserver ces produits on devra utiliser des caisses isothermes et des paillettes de glace pour tout le long de la chaîne de distribution. Ceci est également un impératif pour la valorisation des produits de la pêche. Le respect des normes sanitaires et de qualité et traçabilité internationales est la basse pour le développement des marchés à l’export.
Le développement des filières « fraîches » dans les pêcheries artisanales et intermédiaires est économiquement plus attrayant pour les petits états insulaires par rapports aux filières «surgelées». Par exemple le prix à la consommation du poisson frais est presque le double que le surgelé. Cependant, il est important de développer des logistiques appropriés au long de la chaîne de distribution. La filière surgelée est plus approprié à la pêche industrielle qui manipule des volumes relativement plus conséquents. L’usage de congélation dans la pêcherie artisanale est principalement un moyen de préservation du dernier recours pour les invendus. Pour des raisons sanitaires et la protection de la santé publique, il est interdit de commercialiser du poisson préservé dans des congélateurs domestiques comme du poisson frais. Il serait bien de créer une antenne de l’Autorité Compétente à Rodrigues afin de développer des capacités locales dans mise en œuvre des normes sanitaires et de qualité internationales dans le secteur de la pêche.

Programme SmartFish Rapport SF/2012/18 21
Filières commerciales des produits de la pêche locale
Transformation et la valorisation des produits de la pêche
La valorisation des produits de la pêche à Rodrigues est marginalisée pour les raisons suivantes: i) Pénurie de poisson (carence de l’offre); ii) Manque de moyens techniques et financiers; iii) Absence de la bonne pratique des normes sanitaires et d’hygiènes ;iv) Inexistence des normes sanitaires et de qualité internationales ;v) Marchés locaux restreints (limités aux consommateurs locaux et visiteurs étrangers) ;vi) Manque d’infrastructures macroéconomiques et des débarcadères aménagés ; vii) Manque de logistique approprié pour l’export des produits frais ;viii) Manque d’initiative des opérateurs économiques.
Quelques exemples des produits frais de pêche à valeur ajoutée
• Emballage sous vide du poisson avec ou sans tête éviscéré, des filets, des tranches, des cubes ;
• Produits prêt à cuire : boulette de poisson, burgers, saucisses, patte de poisson ;
• Filets et/ou tranches marinés aux épices locaux ; poisson fumé, des recettes traditionnelles.
Poisson de Grade 1
Poissons DiversCasiers, Sennes..
Ourites Collecteurs ExportateursTraitement
Cottage Processors
Intermédiaires
VendeursAmbulants
Poissonneries
Hôtels & Restaurants
Consammateurs
Exports/Maurice

Programme SmartFish Rapport SF/2012/1822
La filière locale de poisson frais (sous glace)
Actuel
Potentiels
De ce qui précède, on peut conclure que le secteur de la pêche peut contribuer davantage au développement socio-économique de Rodrigues comme dans le case des autres petits états insulaires à l’instar des Seychelles, Maldives, Hawaii ou la Finlande. Pour ce faire il faudra mettre en place un plan d’action ambitieux axé sur le développement durable des pêcheries intermédiaires hauturières en mettant en exergue la valorisation et l’exportation des produits de la pêche de qualité.
Les services d’appuis au secteur de la pêche devront s’adapter aux besoins réels des acteurs de la filière dans les domaines suivant: le traitement et la préservation post capture, l’amélioration des pratiques de pêche, l’exploration des nouvelles pêcheries hors-lagon, la formation en gestion d’entreprise de pêche, la transformation des produits de la pêche. Désormais ils devront agir comme des facilitateurs aux opérateurs économiques du secteur.
Il est important de promouvoir le sens de leadership et la responsabilisation des communautés des pêcheurs afin qu’elles puissent participer activement dans le contrôle, la gestion et la surveillance de leurs zones de pêche et la gestion des infrastructures de pêche à terre en accord avec les autorités locales.
Il existe une volonté politique pour créer un environnement macroéconomique adéquat pour dynamiser l’économie locale. Dans le secteur de la pêche, ces efforts devront être perçus dans la mise en place dans le développement des infrastructures de pêche appropriées dans les principaux centres de production ; un complexe de pêche au port pour entreprendre la transformation, le conditionnement et le stockage des produits de pêche destinés à l’export; attirer des investissements locaux et étrangers ; proposer des joint-ventures aux entreprises de pêche, de transbordement, et de transformation étrangères pour s’implanter à Rodrigues.
Production[6 bat. de pêche]
Production[6 bat de pêches]
+Autres bateaux
Maison des PêcheursPointe Monier
TraitementprimaireTri/ gradage/ lavage
Machine à glaceConteneur réfrigéré
TransformationValeur ajoutéeBonne pratique
d’Hygiène)
March à glace[500 Kg/jr]
Transformation[Evisceration
Lavage, Emballage)
StockageChambre Froide
Blast Freezer Cold & Chill
VentePoisonneries Détaillants
Consommateurs
Exports to MRU
Marches locaux
ExportsMauritius / Réunion
(Re-exports)
Collecteur / Exportateurs - Ourites

Programme SmartFish Rapport SF/2012/18 23
7.4. Recommandations
1. Encadrement institutionel
iv) Pour la mise en œuvre d’un programme de suivi, de contrôle et de gestion de la pêche côtière. ii) Pour l’application des normes sanitaires et les bonnes pratiques d’hygiène pour le traitement, le stockage et la commercialisation des produit frais de la pêche.
iii) la réglementation des activités de la pêche plaisancière (amateurs / non-professionnels) et sportives dans les zones côtières
2. Promouvoir le développement d’une pêcherie intermédiaire axée sur les gros pélagiques au tour des DCP et les poissons de fond sur le bancs au large.
vi) Attirer des investissements, le transfert de technologies et l’assistance technique ;
vii) La motorisation des embarcations de pêche et la vulgarisation des techniques de pêches appropriées, l’usage des technologies de pointe dans la recherche des bancs de poissons;
iii) La formation et/ou le redéploiement des pêcheurs professionnels
iv) Transfert de technologies en matière de traitement, la valorisation les respects des normes sanitaires et de qualité ; v) L’exploration des nouvelles pêcheries et l’essai de nouvelles techniques de pêche
3. Renforcement des infrastructures et des logistiques
i) Le fret aérien pour l’exportation des produits de la pêche vers Maurice.
ii) Des complexes de pêche dans les principaux centres de production de l’ile.
iii) Un port de pêche équipé en vue de consolider le développement de l’industrie de la pêche et le concept de Seafood Hub à l’instar de Maurice.
4. Financement adapté
iv) Des prêts / crédits adaptés pour le financement des équipements et le fond de roulement des activités de pêche hors-lagon, de transformation et de commercialisation.
v) Développer une culture bancaire et d’épargne parmi les acteurs de la pêche pour les rendre plus accessible aux sources de financement formel.
vi) Formation dans la gestion financière d’une entreprise – le plan de financement, la trésorerie, le revenu, les frais fixes et variable etc…

Programme SmartFish Rapport SF/2012/1824
5. Renforcement des filières existantes
i) Exportation des produits partiellement transformés pour subir la transformation finale sur place. (Par exemple, un accord commercial un transformateur dans le Seafood Hub à Maurice)
ii) Fabriquer les produits transformés (prêt-à-cuisiner et prêt-à-manger ) pour le marchés spécifiques ( niches : hôtels/ restaurants/ traiteurs) ?
iii) Recherche et Développement des produits et des marchés à travers les institutions nationales telles que le FiTEC, Entreprise Mauritius, les Fédération des Cooperatives …
iv) Ouverture vers de nouveaux marchés – exhibition dans les foires internationales et régionales, partenariat stratégiques avec des gros importateurs / distributeurs.
v) Création d’un système d’information sur les marchés ciblés des produits de pêche . (Intelligence en marketing)

25Programme SmartFish Rapport SF/2012/18
1.0 Introduction1.1 Value Chain Assessment
The Value Chain Assessment (VCA) of the fisheries sector for Rodrigues Island is sponsored by the Implementation of Regional Fisheries Strategies for the Eastern South Africa and Indian Ocean SmartFish Programme (IRFS ESA-IO) under the aegis of the Indian Ocean Commission (IOC) and funded by the European Fund (EU). It is a step forward in the fine-tuning and implementation of the Sustainable and Integrated Development Plan for Rodrigues (SIDPR), 2009 by the Fisheries Commission of the Rodrigues Regional Assembly (RRA), which is within the framework of the new Fisheries Master Plan and the Mauritius Ile Durable (MID) project of the Central Government.
This study1 has been highlighted in the Budget Speech 2012 - “Take-Off towards Sustainable Modernisation of Rodrigues” 2 of the Regional Government. It looks into the operating value chains of the fisheries sector and explores new opportunities and constraints in the dynamic environment of fish trade with a national and global perspective as an implicit strategy to enhance socio-economic benefits from judicious utilization of scarce fish stocks. A synopsis of the fundamentals of Sustainability is illustrated in the diagram below.
Chart 1: Sustainability Diagram
The world is a globalised market. International trade of seafood constitutes many new opportunities and challenges for all countries particularly the insular states of the Western Indian Ocean. Protectionism is giving way to free trade and yet, non-tariff standards, certifications and voluntary labelings are imposed on imported fish and fish products by developed countries (Ponte 2006). The seafood sector of developing countries is also vulnerable to cheap imports from other develping and emerging economies. Therefore the national stakeholders are bound to review their strategies to boost up their competitive edge4 on the local markets and to capture new market shares in industrialised and emerging
1 The Terms of Reference is given in Appendix 12 Under the heading ‘Revitalising the fishing Industry page 13-153 Sustainability is the capacity to endure. For humans, sustainability is the long-term maintenance of well being, which has environmental, economic, and social dimensions, and encompasses the concept of stewardship, the responsible management of resource use.4 In 2009 the FAO and NORAD have initiated a comprehensive value-chain analysis of international fish trade with particular emphasis on small scale sector in developing countries to follow up the study on the impact of international fish trade on local food security as FAO Fisheries Technical Paper 456, 2004.
Economic
Social Ecological
Affordability Feasibility
Acceptability
SUSTAINABILITY

Introduction
26 Programme SmartFish Rapport SF/2012/18
economies. Modern Information and Communication Technology (ICT) makes real time market information accessible worldwide. Market forces do not lead de-facto to sustainable exploitation and conservation of biological resources unless consumer behaviours are motivated by the principles of sustainability through effective awareness building at all levels – local, regional and global.
Globalization has also streamlined the normal business of states whereby the public sector emerges as regulator and facilitator to fast track a business friendly environment, equal opportunities for all and social justice. The private sector is empowered as the growth engine. Innovative financial concepts such as Public-Private Partnerships have become instrumental in the procurement of economic infrastructure and efficient logistics to connect local industries to international trade. This policy framework is also relevant for the development of the fisheries sector of an insular economy.
From a marketing perspective, fish is an end product and/or an intermediate input in the supply chain to produce value added fish and fish products for end consumers. No enterprise irrespective of type or scale is immuned or isolated from international trade. Self employed actors in the fisheries sector are in fact household or micro enterprises that have to be empowered by all means to build a resilient business enterprise at the grass-roots level of the national economy.
Fish stocks are part of the biogical wealth of a nation and their economic rent5 is a function of their respective value chain or maximisation of value added. Common property rights or open access is the main cause for depletion of fish stocks and degradation of the marine ecosystem in coastal fisheries. It negates value chains and degenerates into a vicious circle of poverty and the paradox of miseries in the midst of plenty among the fisher communities. Actually coastal fisheries feed everyone – the traders, processors, exporters and consumers – except the fishers.
The methodology of VCA6 was initially devised as an analytical tool to examine efficiency at each sequence of the value chain of an industrial or marketing function. This method is currently applied to assess the value added or profitability of seafood industries and to study the economic viability of specific projects. In small scale fisheries, VCA can be instrumental in promoting judicious utilization of scarce fish stocks through appropriate product and market development. The main objectives of this study for the fisheries sector of Rodrigues include:
• Appraisal of the different value chains operating in the fisheries sector and their enabling environment using a systemic approach.
• An analysis of the supply chains– production , processing, marketing - to assess the revenue flow and economic efficiencies.
• Evaluation of future value chain opportunities and constraints of the fisheries sector within the perspectives of future fisheries development and management policies.
• Recommendations to ascertain sustainable development of the fisheries sector as a driving force for socio-economic benefits of the regional economy.
1.2 Rodrigues Island
Rodrigues Island forms an integral part of the Republic of Mauritius. In 2002 it achieved an autonomous status for administrative and political powers with the setting up of the Rodrigues Regional Assembly (RRA). The local executive exercises the same powers as a Regional Government presided by a Chief Commissioner, who is the direct interlocutor of the Central Government regarding Rodriguan affairs.
5 David Ricardo argued that economic rent accrues on the basis of unequal ownership/access or control over an existing scarce resource. This is contrary to open access and common property rights over natural resources.
6 The value chain concept was introduced 25 years ago by Michael Porter in his 1985 best-seller, Competitive Advantage: Creating and Sustaining Superior Performance. A value chain is defined as a chain of activities whereby products pass through all activities of the chain in sequence and at each activity the product gains some value. The chain of activities gives the products more added value than the sum of added values of all activities.

27Programme SmartFish Rapport SF/2012/18
Located at the heart of the Indian Ocean some 650 km North East of Mauritius, Rodrigues Island has a total land surface area of 108 km² (18 km long and 8 km wide) and a coast line of 80 km. It is completed encircled with coral barriers nestled with shallow beds extending out up to 10 km at some places. The surface area of the lagoon is approximately 240 km². It enjoys a tropical climate with temperatures varying between 28°C and 35°C during summer, which coincides with the cyclone season (November - April) and between 18°C and 27°C in winter. In 2008 the population was at 37,700 with a growth rate of 1.19 % per annum. It accommodates about 40,000 Mauritian and foreign visitors, mainly from Réunion Island every year (CSO, 2010). Regular sea-links between Mauritius and Rodrigues is ensured by two mixed cargo-cum-passenger vessels (MV Mauritius Pride and MV Mauritius Trochetia) on a weekly basis. The trip lasts between 24 to 36 hours depending on sea conditions. Also, Air Mauritius provides 2 to 5 daily services.
The fisheries sector is a major productive sector of the Rodriguan economy. As at November 2011, it employed 1,410 registered fishers including 330 fisherwomen, who are involved mainly in the octopus fishery. Approximately 2,000 non-registered full time and subsistence fishers 7 3 are also engaged in fishing on a full or part-time basis. Over the past 5 years, 400 registered fishers have relinquished their fishing cards in exchange for some financial compensation. It is most likely that they have gone back to fishing as non-registered fishers. There are 1,821 registered fishing boats out of which 70% are traditional canoes using oars and sail. Their activities are limited to the lagoon. Most registered fishers are not owners of fishing assets; they are in fact fishing workers.
In 2010, the annual catch was estimated at 1,609 Mt and consisted of 1,225 Mt from the lagoon fisheries including 273 Mt of octopus and 384 Mt from the off-lagoon. Fish and fish products are the main source of protein diet for Rodriguans and the per-capita fish consumption is about at 20 Kg per year. The fisheries statistics do not include the portion of daily catch held for household consumption commonly called “carri”.
The fisheries sector is also a major source of export earnings with an annual export of approximately 145 Mt of frozen octopus to Mauritius. Harvest of octopus has declined drastically over the past decade due to over fishing and degradation of the marine ecosystem. In spite of intensive efforts of the regional Government, the development of off-lagoon and FAD fisheries has not achieved expected results. There is an apparent political will on the part of RRA to marshal a rational management and development plan for the fisheries sector.
1.3 Methodology
1.3.1 Business analysis of the fisheries sectorA VCA of small scale or artisanal fisheries requires a business oriented approach whereby the various components of the value chain - fishing, processing and marketing are viewed as enterprises or cost centres. Although in-bound and out-bound logistics are external factors of a value chain, they are of critical importance for the efficiency of core activities.
The main objective of an enterprise in the fisheries sector is to earn normal profits84
or a surplus of income over operating costs. Net income is the source of livelihood for the economic actor and for maintenance of capital assets employed in the trade. It is important to differentiate between a fishing enterprise (owner of fishing capital) and a fishing worker or labour. The majority of registered fishers cannot be considered as fishing enterprises because they do not own the fishing capital – fishing boats whether motorized or not. Normally the harvested fish belongs to the boat owner and the fishing workers are remunerated by pre-agreed amount per kg or a share of the net income. However an on-foot fisher is assumed to be an individual enterprise because the latter is solely responsible of her/his fishing operations. The administrative registries held by the FPS do not permit to identify ownership of fishing boats by:
7 Hardman et al , 2007
8 Profit is the surplus of revenue over the total operating cost including non-cash items such as depreciation of the capital assets. It is the best known measure of success in an enterprise

Introduction
28 Programme SmartFish Rapport SF/2012/18
• Registered active fishers • Non-registered professional • Registered fishmongers • Subsistence/amateur / leisure fisheries.
1.3.2. Components of the Rodriguan Fisheries SectorThe fisheries sector comprises predominantly marine coastal fisheries95. Semi-industrial and industrial fisheries do not exist. The main types of fishing activities are as follows:
• Large Net fishery (LN)• Off-lagoon Hand line fishery (HL)• Non-motorized Basket Trap (BT) and Hand line (HL) fishery • Octopus fishery • Off-lagoon Hand line (chilled) fishery• Shrimp Net (SN) fishery
1.3.3. Fish preservation and value added activities The value chains are limited to:
• Frozen octopus • Dried octopus • Packed of dried and grilled octopus • Packed octopus pickles • Dried salted fish
Frozen octopus is the main export product of the fisheries sector. The use of refrigeration is a primary mean of preservation of raw octopus rather than value added process. The production of dried octopus and dried-salted fish has declined significantly mainly because of scant supply. Value added products made from dried octopus are promising value chains for the cottage /micro enterprises.
1.3.4. Marketing Structures and ChannelsThere are 3 private companies engaged in export of frozen octopus. Generally fresh fish is sold to end consumers and/or fishmongers at landing stations. There are approximately 40 regular and full-time fishmongers in addition to some 35 seasonal vendors who are active mainly during large net (LN) fishery. Some non-licensed fishmongers were also identified during field works.
1.3.5. Data collectionThe VCA requires detailed financial/economic data of enterprises involved at the different sequences of the value chain. These data were scant and had to be collected by a primary survey of stakeholders. Fisheries Statistics and time-series data of fish market prices for the year 2010 (unpublished) were obtained from the FRTU. They were verified / cross-checked through direct interviews and discussion with reliable operators. Site visits were effected to all fish landing stations (FLS), processing and storage units of the island. Group discussions were organized with fishers, indigenous fish processors, fishmongers, logistic providers and NGO involved in the fisheries sector.
1.3.6. Data processing and analysisBasic cost accounting methods were used to process and analyze the collected data. They were then applied in a business model devised for each trade to assess economic performance in terms of revenue flow, cost of production, net income of fishing enterprise and fishing workers. A minimum income criterion of Rs 7,500 per month was used to perform break-even analysis on individual and small scale enterprises.
9 Small scale fishing activities performed within 12 nautical miles from the coast.

Overview of the Fisheries Sector of Rodrigues
29Programme SmartFish Rapport SF/2012/18
2.0 OVERVIEW OF THE FISHERIES SECTOR OF RODRIGUES2.1. Fisheries Policies
Most coastal fisheries in the Western Indian Ocean are overexploited and fish stocks on the high seas are harnessed by distant waters fleet from EU and South East Asian countries10.6The Central and Regional Governments are both committed to achieve sustainable management and development of their marine fish resources as a prerequisite to enhance economic growth and social welfare of the population.
The existing social welfare policies in favour of the fisher communities are unique and reputedly over generous. They have contributed undeniably to overfishing and degradation of the coastal marine ecosystem. There is an emergency to provide appropriate supports and incentives to shift the fishing efforts from the lagoon to off-lagoon and high-sea fisheries. Value chain development in the fisheries sector aims at enhancing revenue flow and employment through judicious utilization of scarce fish resources, product and market development and seamless integration to the macro-economic environment.
The Fisheries and Marine Resources Act 2007, promulgated in May 2008 provides a policy framework for fisheries conservation and management. At time of writing, a new Fisheries Master Plan for Mauritius and Rodrigues is awaiting approval of the Cabinet. The Sustainable and Integrated Development Plan for Rodrigues 2009, which has been approved by the RRA constitutes a blueprint for the sustainable development of the fisheries sector of Rodrigues. The 2012 Budget of RRA acknowledges the essential role of the fisheries sector and makes adequate provisions to streamline the sector towards sustainable growth. Implementation of the IFAD-MARS Programme for the development of extended artisanal fisheries is an ambitious project that is expected to create a spin-off effect.
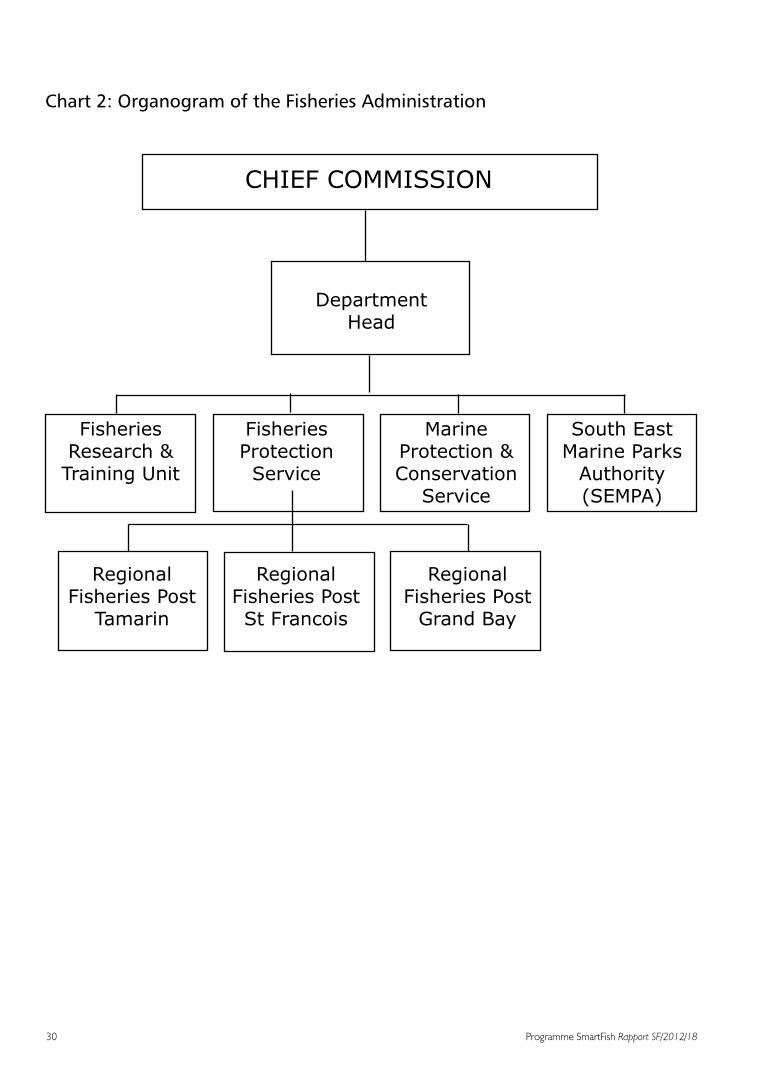
2.2. Fisheries Administration
The fisheries sector of Rodrigues is under the responsibility of the Fisheries Commission and is chaired by the Chief Commissioner.
10 FAO Fishery Technical paper 495 – The State of World highly migratory, straddling and other high seas fishery resources and associated species.
30 Programme SmartFish Rapport SF/2012/18
Chart 2: Organogram of the Fisheries Administration
CHIEF COMMISSION
DepartmentHead
Fisheries Research &
Training Unit
Fisheries ProtectionService
Marine Protection & Conservation
Service
South East Marine Parks
Authority (SEMPA)
RegionalFisheries Post
Tamarin
RegionalFisheries Post St Francois
RegionalFisheries Post
Grand Bay

Overview of the Fisheries Sector of Rodrigues
31Programme SmartFish Rapport SF/2012/18
2.3. Recent Studies on the Fisheries Sector
Recent studies in the fisheries sector (non-exhaustive) that have provided valuable resources to this mission are listed below:
• Assessment of Current data for the Octopus Resource in Rodrigues – African Journal of Marine science presented by J Anderson, S. Perrine et al , 2010.
• Sustainable and Integrated Development Plan for Rodrigues, KPMG / UNDP , 2009• Study of Fish Handling and Preservation in Mauritius and Rodrigues, HBL Appavoo & Associates, 2007• Socio-economic Study of the Fishing Community – Case Study of Rodrigues , University of Mauritius, 2007• Large Net Fishery Assessment, Shoal Rodrigues 2006
2.4. Fisheries Infrastructure
There are only 4 Fish Landing Stations (FLS) located at Pointe Aigle, Tamarind, St. Francois and Grand Bay but they are not in use. FLS are in reality unsheltered/traditional fish landing sites in main fishing villages that have been designated for local fisheries administration and data collection.
The FAD programme dates back to 1994 and presently there are 16 FADs in the northern regions of the island. These FADs have not been visited / maintained by the research and training vessel, MV Rodriguez for the past six months due vessel mechanical problems.
There are two institutional fish markets on the island, one at Mont Lubin and the other one is at Bazar de Port Mathurin. A third one is operated by Rodrigues General Fishing Co. Ltd (RGF)111 at Pointe Monier.
The main processors / exporters of frozen octopus are equipped with isotherm vans, blast freezers and cold rooms. RGF has an ice flake production unit of 500 Kg per day that supplies its own fleet of 6 off-lagoon hand-line fishing boats. There is no standard practice for handling and preservation of fresh, chilled, frozen fish and fish products.
2.5. Supporting Organisations
2.5.1. Extension services
Since 2000, the FRTU has imparted ad hoc training in navigation, fishing technology, sanitary and health on board, first aid, basic meteorology and cooperative organisation to some 800 registered fishers. The IFAD-MARS Programme has provided training to 50 registered fishers in entrepreneurial skills including book keeping and business management. The 2012 budget has made provision to train an additional 200 registered fishers in off-lagoon fisheries by next year.
In spite of the various training programmes in the fisheries sector the development goals have not been achieved. It is important to assess the effectiveness of those training programmes and to plan for capacity building in an integrated and performance based approach.
2.5.2. Financial support
Finance is the life blood of an enterprise. Financial resources have been made available to the fisheries sector through the Development Bank of Mauritius (DBM), the Empowerment Funds, the SME Partnership and commercial banks to fisheries sector. However, the development of the fisheries sector has been retarded due to inherent mismatch 11 RGF is a fully RRA owned private limited company that has been set up to operationalize the fisheries terminal commonly known as “Maison des Pêcheurs “ at Pointe Monier and a fleet of six 9.5 m long fibreglass fishing boats engaged in off-lagoon hand line (chilled) fishery.

32 Programme SmartFish Rapport SF/2012/18
between financial requirements of fishing entrepreneurs and pre-requisites of the lenders. For instance, the loan ceiling provided by DBM to registered fishers to purchase fishing equipment (boat and engine) is Rs 200,000. This amount of loan is insufficient to invest on an adequate fishing unit to operate off-lagoon. In fact the DBM financial scheme led to overcapitalization in the lagoon fisheries and depletion of the fish stocks. Most borrowers were unable to pay back their loans due to a decline of their revenue. Other obstacles to the access of finance in this sector are informal transactions, low financial literacy and the absence of a savings culture. Therefore, there is an urgent need for suitable financial facilities embedded with adequate extension and facilitation supports to ensure the launching of the off-lagoon fisheries.
2.5.3. Technical Expertise of MRC
The Mauritius Research Council (MRC) has set up a regional office at the RRA to assist in the experimental phase of seaweed culture in Rodrigues. This institution can assist the fisheries sector by undertaking various socio-economic audits and creating/re-activating LFCs to partner in future fisheries management plan.
2.5.4. Regional and International Cooperation
The IFAD/MARS programme is a break-through in the development of an extended artisanal chilled fishery in Rodrigues. A fleet of five 15 metre long fishing boats are to be delivered to the RRA soon.
The SmartFish programme of the IOC / EU can be sought for technical expertise in fish trade and fisheries management, as well as other small support for the fishery. 2.5.5. Empowerment and Capacity building
The mission of the Federation of Fishermen Cooperatives (FFC) of Rodrigues is to unite the fisher folks into cooperative societies as a prerequisite to work collectively towards their socio-economic empowerment. The FFC has modernized its management style to invigorate dormant fisher cooperatives and to propel new ones. The task is not made easier as most fishers are averted to any form of cooperative or association in their economic life. It is playing a crucial role in providing an organisational framework to 6 fisher cooperatives that have been designated to operationalize the newly built IFAD/MARS fishing boats. The FCC is also keen in developing local and regional fish marketing and distribution networks.
Shoal Rodrigues is doing a commendable work in marine conservation, awareness building and follow up of the LN and octopus fisheries. It has been instrumental in the establishment of the South East Marine Parks Authority (SEMPA) as a pilot project.
2.5.6. Fish Resources
Western Indian Ocean, Zone 51 of the FAO accounted for 5.2 % of global landing in 2005. 24 % of fish stocks have no room for expansion, 2% have some room for further expansion while the status of 73% of fish stocks are still unknown or unexplored. Most coastal fish stocks of the region are considered to be fully exploited. While the coastal fisheries within 12 nautical miles are harvested by the coastal states, the most lucrative oceanic fisheries are harvested mostly by distant waters fleets from EU and South Eastern Asian countries12.2.
The total annual catch of the fisheries sector topped 2,000 Mt in 1999 and declined ever since reaching its lowest point of 1,000 Mt in 2005/06, then picking up again with the development of off-lagoon fisheries, to revolve around 1,600 Mt today (as shown in Chart 1). Since the 1990s the production of octopus has declined by nearly 50% to stagnate below 300 Mt per year over the past 6 years. This is mainly due to overfishing and serious damage caused to the marine habitats. Octopus is a ready cash product and the decrease in productivity has a direct impact on the livelihood of the fisher communities, particularly the “piqueuse d’ourites”.
12 Regional assessment of World fisheries, Oceana, May 2008.

Overview of the Fisheries Sector of Rodrigues
33Programme SmartFish Rapport SF/2012/18
The experiment of FAD fisheries since 1994 has failed to spin-off into an alternate fishery to relieve the lagoon ecosystem. Actually there is a network of 16 FADs in the northern areas of the island. They are mostly exploited by game fishers that indirectly confirm the presence of fish on these FAD13.3 An evaluation of past development initiatives is necessary to understand their lacunae and to chart out a rational action plan.
Chart 3: Total Catch 1997 - 2010 in metric tonnes (Mt)
Over the past 3 years (2008 - 2010) a new trend is observed in the sector whereby the total catch from the lagoon is declining and is compensated by a gradual increase in production of the off-lagoon fisheries. This trend has to be enhanced further. There is no sign of recovery in the octopus fishery. The FAD is yet to be adopted by the off-lagoon fishers. Data on the sport fishery is not collected.
2.5.7. Fishers
Besides 1,410 registered active fishers (FPS – Nov 2011) including 330 fisherwomen, there is a large number of unregistered full-time, seasonal and amateur fishers. As shown in the charts below, nearly 60 % of registered fishers operate in the lagoon in spite of the declining catch rate. They are not equipped to fish off-lagoon. Most fishers involved in off-lagoon fishing are located in the northern region because the channels are safe and the fishing areas are sheltered. The shrimp net (SN) fishery accounts for 13 licence holders who operate mainly around the islets, namely Coco Island. They are also multi-geared like other fishers.
13 Catch per fisherman day on the FAD was estimated at 60kg by Lojac H’meur (Fishieries Expert), 1994
34 Programme SmartFish Rapport SF/2012/18
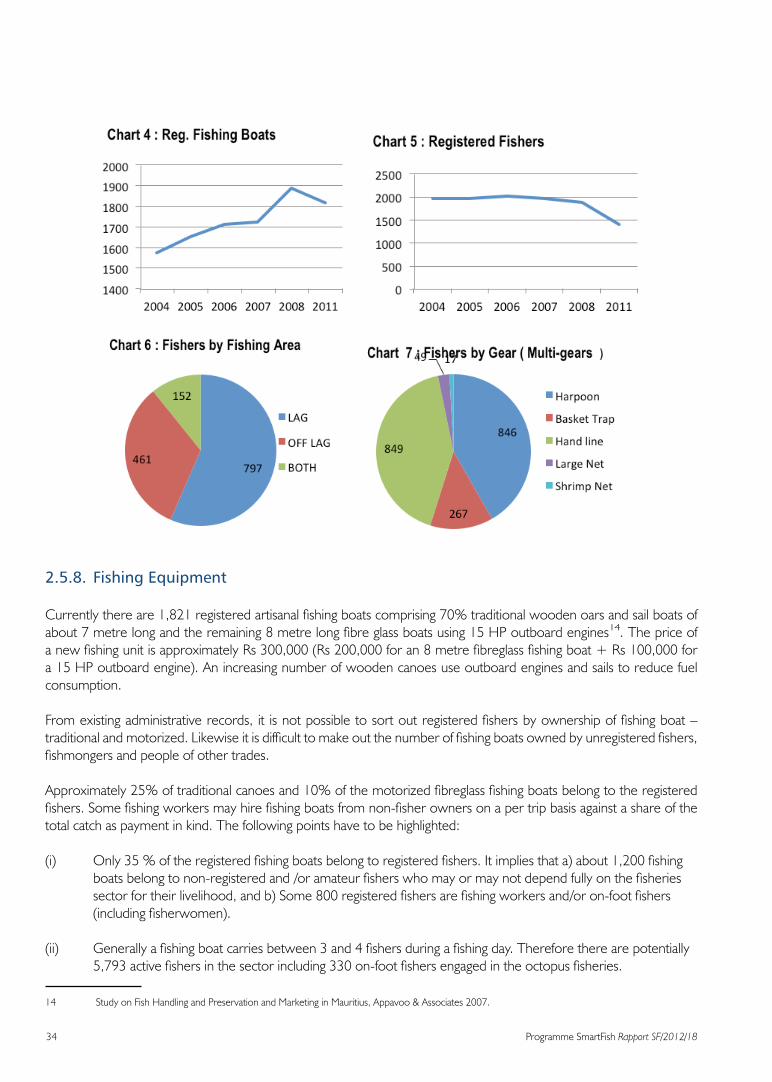
2.5.8. Fishing Equipment
Currently there are 1,821 registered artisanal fishing boats comprising 70% traditional wooden oars and sail boats of about 7 metre long and the remaining 8 metre long fibre glass boats using 15 HP outboard engines14.1The price of a new fishing unit is approximately Rs 300,000 (Rs 200,000 for an 8 metre fibreglass fishing boat + Rs 100,000 for a 15 HP outboard engine). An increasing number of wooden canoes use outboard engines and sails to reduce fuel consumption.
From existing administrative records, it is not possible to sort out registered fishers by ownership of fishing boat – traditional and motorized. Likewise it is difficult to make out the number of fishing boats owned by unregistered fishers, fishmongers and people of other trades.
Approximately 25% of traditional canoes and 10% of the motorized fibreglass fishing boats belong to the registered fishers. Some fishing workers may hire fishing boats from non-fisher owners on a per trip basis against a share of the total catch as payment in kind. The following points have to be highlighted:
(i) Only 35 % of the registered fishing boats belong to registered fishers. It implies that a) about 1,200 fishing boats belong to non-registered and /or amateur fishers who may or may not depend fully on the fisheries sector for their livelihood, and b) Some 800 registered fishers are fishing workers and/or on-foot fishers (including fisherwomen).
(ii) Generally a fishing boat carries between 3 and 4 fishers during a fishing day. Therefore there are potentially 5,793 active fishers in the sector including 330 on-foot fishers engaged in the octopus fisheries.
14 Study on Fish Handling and Preservation and Marketing in Mauritius, Appavoo & Associates 2007.

Overview of the Fisheries Sector of Rodrigues
35Programme SmartFish Rapport SF/2012/18
vii) Technically there are 1,821 fishing boats for 1,410 registered fishers with an annual production of 1,600 t. There is a surplus of approximately 1,351 fishing boats, mostly fishing in the lagoon. It is crucial to determine the number of boats that can be modified and adapted to off-lagoon fisheries.
2.5.9. Fishing Gears The main fishing gears used in the fisheries sector are briefly described below.
• Harpoon (HN): It is a long spear-like instrument used by on-foot fishers to catch octopus during low tides in Rodrigues. The fishing technique is not more destructive to marine ecosystem as compared to other gears used in the artisanal fisheries. The absence of strict management regulations is the main cause for the depletion of the stock of octopus and degradation of the marine ecosystem.
• Large Net (LN): It is consisted of a net of up to 500 m long and 5 m wide with regulated mesh size used to encircle reef fish in the lagoon. The fishery is restricted to licence holders and a close season of 5 months every year – from the first day of October to the last day of February is enforced. Since 1996 the Government has introduced a buy-back scheme to reduce the number of large nets due to its destructive effects on the coral reefs.
• Basket Trap (BT): It is a baited passive and close-end basket made of galvanized steel mesh or bamboo anchored in the inner lagoon to trap reef fish. A basket trap can potentially hold up to 100 kg of fish. It is a popular fishing method among the artisanal fishers. The fish caught by basket traps is mainly Licorne and Cordonier
• Hand line (HL): It is a single nylon line held in the hands with up to 3 baited hooks used to catch demersal/bottom fish such as Red Snappers, Vacoas, Sacrechien and Capitaine. It is a selective fishing method that harvests high market value fish. It is practiced in the lagoon and off-lagoon.
• Shrimp Net (SN): The fishing gear consists of a net basket fixed to a stick used to catch shrimps in shallow waters around the islets namely Coco Island. The fishery is restricted licence holders only. Actually there are 11 active SN fishers in Rodrigues.
Most fishers are polyvalent as most fishers use HL and BT regularly. The following examples show the complexity of fishing activities in Rodrigues:
(i) During low tides, about 12 - 16 days per month around the year, most fishers catch octopus in the early morning before setting out for their regular trade (HL and BT).
(ii) During LN fishing (March to September) a large number of HL and BT fishers migrate to LN fishery seasonally and during close season the LN fishers will also perform other fishing activities.
(iii) A trait of specialisation is observed in the off-lagoon HL fishery as the fishers focus on a single fishing method.

36 Programme SmartFish Rapport SF/2012/18
3.0 SUPPLY CHAIN ANALYSIS
In this section the operating cost and revenue flows of the fishing activities is studied. It is useful is determining the cost of production, value added, wages of fishing crew and net income of fishing enterprises.
3.1 Key determinants and assumptions
The transactions are predominantly small-scale and informal. Accounting records and economic data are not available. Business models were created from data collected through a primary survey.
3.1.1 Product and Market Segments
Fish is composed of a wide range of value products ranging from low value to high value, depending on the species, quality, size and so on. Fish species are clustered into commercial categories according to marketing practices15. 1 Market price of each commercial category was collected at various levels of the marketing channels namely, Producer Sale Price (PSP), Whole Sale Price (WSP) and Consumer Sale Price (CSP).
Table 1: Price Survey of fish (Rs / Kg) – November 2011
Products / Markets PSP WSP CSPProduct Segment 1Product Segment 2Product Segment 3Miscellaneous fish
140 100 80 60
150 110 90 70
18013011090
3.1.2 Effective fishing days
Fishing activities depend on sea and weather conditions. They are more intense and productive during summer (7 months) than winter (5 months). Generally fishers are willing to go out for fishing everyday if weather conditions allow. A fishing trip last for 8 to 10 hours and sometimes more than one trip is performed in a single day. Night fishing is also frequent. To determine a realistic number of effective fishing days per year, bad weather day records16 of the FPS were cross-checked by a primary survey in the 3 main fishing regions of the island. The mean fishing day per year for the island is held at 200 (North: 266, South: 168 and South East: 168). The sea conditions in the southern regions are more severe than the northern part.
3.1.3 Catch Per Unit Effort (Productivity)
The Catch Per Unit effort (CPUE) data of the FRTU was cross-checked and complemented by primary surveying. Formal catch data does not include fish kept by fishers for household consumption commonly called “carri”. This “carri” varies between 1.5 kg (winter) and 2.5 kg (summer) per fishing day. In the LN fishery fish is also used as payment in kind to fishing workers and it is approximately 5 kg per fishing day. The impact of the above indigenous practices on the revenue flow is also examined.
15 A list of main fish species harvested by the local fisheries and their classification according product and market segmentation is given in Appendix 2 16 Bad weather days are recorded by the Fisheries Protection Service for the purpose of computation of Bad Weather Allowance payable to registered fishers.

Supply Chain Analysis
37Programme SmartFish Rapport SF/2012/18
3.1.4 Other pertinent assumptions
• A monthly income of Rs 7,500 is assumed as an income threshold of the fisher household or the opportunity cost of fishing labour. It is treated as a fixed cost while performing break even analysis.
• The fishing units / enterprises are considered as on-going businesses and the value of the fishing capital is estimated at actual cost.
• Various allowances such as BWA and CSA provided by the Government to registered fishers are not included in the business models.
• Fishing is mainly a cash business that falls outside the formal or banking network. Payment in kind is converted into
money terms and included in the business model.
• A registered fisher does not require a fishmonger licence to sell his/her catch direct to end consumers.
• There is no Value Added Tax (VAT) on fish and fish products.
• The net income estimates of the fishing enterprise are after provision for depreciation and other non-cash items unless otherwise stated.
• The cost of apparent damages cause by fishing practices to marine habitats is not included in the costing (an in-depth economic assessment.
3.2 Large Net Fishery
In Rodrigues there are 6 cooperative societies and one individual large net licence holders. Customarily a large net fishing enterprise consists of up to 5 fishing boats with a least one motorized boat to haul the net and 20 fishers. Other key determinants and assumptions are discussed below:
(i) There is several net income sharing practices in the fishery. However for the purpose of this case study the distribution of net income between cooperative fishers and casual fishers is assumed at a 2:1 ratio.
(ii) The 2010 total catch for the LN fishery was at 186.7 Mt (FRTU). The mean catch per fishing unit is assumed at 26.7 Mt, which is equal to a mean catch per fishing unit per fishing day of 266 Kg.
(iii) A fishing unit comprises 1 motorized + 4 non-motorized fishing boats and 20 fishers including 10 cooperative and 10 casual /non registered fishers
(iv) Number of effective fishing days is assumed at 100 during the season;
(v) Fish kept for “carri” varies between 1.5 kg and 2.5 kg per fisher per fishing day (are not included in the official fisheries statistics).
(vi) The length of net varies between 300 and 500 m long. Approximate 10 – 12 nets are replaced during a fishing season. The cost per unit is Rs 5,500.
(vii) The business model is prepared for one fishing enterprise / cooperative and is then extrapolated for the fishery.
(viii) The catch composition is presented in Chart 8.

38 Programme SmartFish Rapport SF/2012/18
(viii) Product segmentation and revenue estimates are given in Table 2
Table 2: Gross Revenue Estimates
Product Segment Catch (kg) % of catch PSP ( Rs / Kg Sales (Rs)Grade 1Grade 2Grade 3Miscellaneous fish
25,22621,668
130,0429,766
14%10%70%
6%
140100
8060
3,531,6402,166,800
10,403,360585,960
TotalMean PSP / KgGross Revenue per License holder
186,702 100% -RsRs
16,687,76089.38
2,383,966
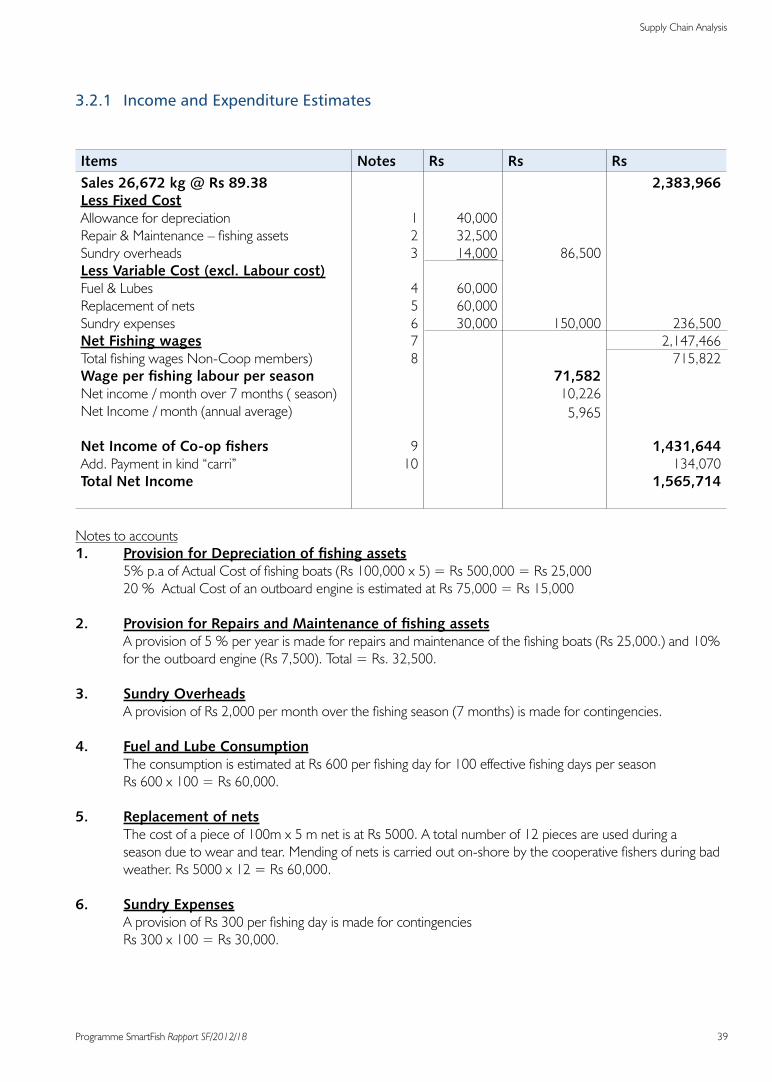
Supply Chain Analysis
39Programme SmartFish Rapport SF/2012/18
3.2.1 Income and Expenditure Estimates
Items Notes Rs Rs RsSales 26,672 kg @ Rs 89.38Less Fixed CostAllowance for depreciationRepair & Maintenance – fishing assetsSundry overheadsLess Variable Cost (excl. Labour cost)Fuel & LubesReplacement of nets Sundry expensesNet Fishing wagesTotal fishing wages Non-Coop members) Wage per fishing labour per seasonNet income / month over 7 months ( season) Net Income / month (annual average)
Net Income of Co-op fishersAdd. Payment in kind “carri”Total Net Income
123
45678
910
40,00032,50014,000
60,00060,00030,000
86,500
150,000
71,58210,226
5,965
2,383,966
236,5002,147,466
715,822
1,431,644134,070
1,565,714
Notes to accounts1. Provision for Depreciation of fishing assets 5% p.a of Actual Cost of fishing boats (Rs 100,000 x 5) = Rs 500,000 = Rs 25,000 20 % Actual Cost of an outboard engine is estimated at Rs 75,000 = Rs 15,000
2. Provision for Repairs and Maintenance of fishing assets A provision of 5 % per year is made for repairs and maintenance of the fishing boats (Rs 25,000.) and 10% for the outboard engine (Rs 7,500). Total = Rs. 32,500. 3. Sundry Overheads A provision of Rs 2,000 per month over the fishing season (7 months) is made for contingencies. 4. Fuel and Lube Consumption The consumption is estimated at Rs 600 per fishing day for 100 effective fishing days per season Rs 600 x 100 = Rs 60,000. 5. Replacement of nets The cost of a piece of 100m x 5 m net is at Rs 5000. A total number of 12 pieces are used during a season due to wear and tear. Mending of nets is carried out on-shore by the cooperative fishers during bad weather. Rs 5000 x 12 = Rs 60,000. 6. Sundry Expenses A provision of Rs 300 per fishing day is made for contingencies Rs 300 x 100 = Rs 30,000.

40 Programme SmartFish Rapport SF/2012/18
7. Net Sharing Income Net income (excl. Labour cost ) = Total Revenue – trip costs. In practice non-cash items such as depreciation or interest on loan are ignored. 8. Income sharing ratio The income sharing ratio between Coop fishers and the casual fisher is 2 to1. One third of the net income is distributed in 10 casual fishers and the difference (2/3) is shared equally among the Coop fishers. 9 Share of Income to Coop Fishers Net sharing Income – payment to casual fishers Rs 2,147,466 – Rs 715,822 = Rs 1,431,644; 10. Payment in Kind ( fish kept aside for “carry”) 1.5 kg / fishing day / Coop fisher calculated at prevailing primary sale price ( Rs 89.38/kg) Total : Rs 134,070 or Rs 13,407 per Coop fisher / season
3.2.2 Economic analysis
The annual revenue of the LN fishery is estimated at Rs. 17,626,25217 2that represents Rs 2,518,036 per license holder or fishing enterprise. The net annual income of an enterprise (after payment to fishing workers and provision for depreciation), that is distributed among the cooperative members is at Rs 1,565,714. The breakdown is as follows:
Net Annual Income per registered fisher for a fishing season : Rs 156,571Net monthly Income -ditto- : Rs 22,367Net Monthly income on an annual basis : Rs 13,048
Assuming that the140 fishers engaged in the LN fishers are all registered fishers and the net income is share equitably among them, the income distribution would be as follows:
Net monthly Income -ditto- : Rs 16,279Net Monthly income on an annual basis : Rs 9,506
The Break-Even production18 is estimated at 159,4 Mt, 85% of the total catch of 2010.
From the above, it is concluded that the LN fishery is economically viable. It can employ 140 registered fishers with a mean monthly income of Rs 9506 spread over 12 months. However the fishery employs 49 registered fishers through 7 license holders (FPS records of November 2011) and non-registered fishers are recruited as fishing workers, and under paid. It is recommended to promote equal opportunities in the fishery by halting exploitation of fishers by their follow fishers under the shade of existing regulations.
There is no genuine hardship case for the Regional Government to pay closed season allowance to registered LN fishers. It is also acknowledged that LN fishers perform alternate fishing activities such as Harpoon, HL and BT during the LN close season. The annual average monthly income of an LN fisher including alternate fishing activities during close season is estimated at Rs 13,756. There is an urgent need for empowering the fisher households with basic entrepreneurial and cash flow management skills to correct the trend of day to day livelihood and indebtedness (negative saving). The revenue derived from the LN fishery is believed to be much higher than the estimates of the case study due to 17 This figure includes Rs. 938,490 representing the PSP market value of fish kept by fishers for household consumption.18 The minimum wage of Rs 7,500 / month per fisher is assumed as fixed cost for the calculation of the B/E level of production.

Supply Chain Analysis
41Programme SmartFish Rapport SF/2012/18
the absence of an efficient MCS system.
3.3. Off-lagoon Hand Line (HL) fishery
The main features of an off-lagoon HL fishing enterprise are as follows:
• The chief fisher is also owner of the fishing assets.• The fishing crew comprises 3 fishers • Operating costs including fuel are borne by the boat owner.• The fishing workers are remunerated at a fixed price per Kg.
The key determinants and assumptions of this fishery are presented below:
(i) The mean catch per fisherman day is estimated at 6.99 Kg which is made up of 3 Kg per fishing day during winter (5 months) and 8 Kg per fishing day during summer.
(ii) The number of effective fishing days is estimated at 214 (FPS 2010) on the basis of 2 fishing days / week in winter and 5 fishing days in summer. Sometimes the unit goes out for night fishing.
(iii) The targeted fish species are mainly Vieille Rouge, Vacoas, Sacréchien; Vielle Laboue and Capitaine. The Catch comprises 100 % of commercial grade 1.
(iv) The total catch is sold to a regular fishmonger and /or end consumers at prevailing PSP, Rs 140 / kilo
Table 3 Off-lagoon HL fishery - Annual catch Estimates
Items Winter Summer Total / KgEffective fishing daysMean Catch per fisherman dayTotal No of fishersTotal Catch Primary Sale Price (Rs/kg)Gross Revenue
433
129
1718
1368
Rs
2146.99
14964
5983140
837,681

42 Programme SmartFish Rapport SF/2012/18
3.3.1. Income and Expenditure Estimates
Items Notes Rs Rs RsSales 5,983 kg @ Rs 140.01Less Fixed CostAllowance for depreciationRepair & Maintenance – fishing assetsSundry overheadsLess Variable Cost (excl. Labour cost)Fuel & LubesReplacement of fishing gearsSundry expensesNet fishing Income / WagesRs 100 per Kilo sold to Boat Owner Annual Income / fishing crew Monthly Income / fisherShare of Income Boat Owner-C/fisherMonthly Income
123
45678
9
30,00020,000
6,000
128,4006,000
21,400
56,000
155,800
149,60012,467
17708114,757
837,681
211800625,881
Notes to accounts
1. Allowance for Depreciation of fishing assets 5% of Actual Cost of 8 m long fibreglass boat ( Rs 200,000) = Rs 10,000. 20%of Actual Cost of an outboard engine (Rs100,000) = Rs 20,000 Total provision for depreciation: Rs 30,000. 2. Provision for Repairs and Maintenance of fishing assets A provision of 5 % per year for repairs and maintenance of the fishing boat (Rs 10,000.) and 10% for the outboard engine (Rs10,000). Total = Rs. 20,000. 3. Sundry Overheads A provision of Rs 500 per month : Rs 6000 per annum for contingencies. 4. Fuel and Lube Consumption Rs 600 per fishing day x 214 effective fishing days = Rs 128,400. 5. Replacement of fishing gears Rs 500 per month x 12 = Rs 6000 per annum. 6. Sundry Expenses A provision of Rs 100 per fishing day is made for contingencies Rs 100 x 214 = Rs 21,400. 7. Net Operating Surplus excluding Labour cost Gross Revenue – Operating Cost ( Rs 837,682 – 211,800 = Rs 625,881)

Supply Chain Analysis
43Programme SmartFish Rapport SF/2012/18
8. Fishing Crew Income 4488 x Rs 100 / kilo = Rs 448,800 Annual Income = ( Rs 448800 ÷ 3 ) = Rs 149,333 9 Net Income for Boat Owner / Chief fisher Surplus Income = Rs 177,081 excluding provision for depreciation (non-cash items: Rs 40,000) Mean monthly income : Rs 14,757; 3.3.2. Economic Analysis
• Net monthly income of fishing enterprise: Rs 14,757.• Net monthly income of fishing worker : Rs 12,467• Operating Cost (excluding fishing wages ): Rs 35.40 per kilo• Break-Even Price : Rs 95.57 per kilo• Break-Even Qty : 4,084 kg (CPFD of 4.77 kg)• Break-Even Effective fishing days is: 136 (approx.)
From the above, it is found that the fishery provides the highly average monthly income fishers. The other advantages for the development of this fishery are:
• It is selective and harvests highest commercial value of fish species.• It is environment friendly and helps to reduce fish pressure on the lagoon.
A large number of fishing boats operating in the lagoon can be diverted to off-lagoon hand line fishing through appropriate technical and financial supports.
3.4. Non-motorized BT and HL fishery
Non-motorized fishing boats are confined to the lagoon and are engaged in BT and HL fishing besides the seasonal octopus fishery. This case-study focuses on their HL and BT fishing operations while the revenue derived from the octopus fishery will be examined subsequently.
The main features of non-motorized HL & BT fishing enterprises are as follows:• Fishing asset: 7 metre long wooden boats using oars and sail.• Fishing Crew: 3 including Owner/Chief fisher and 2 fishers• Main activity: BT and HL • No of BT: 5 - 2 galvanized steel mesh + 3 Bamboo• Fishing area: Lagoon / inner reef • Effective fishing days: Every day except bad weather • Fishing trip: 6 to 8 hours; sometimes up to 2 fishing in trip in a day.• Activities during bad weather: Making / repairing basket traps.
The main determinants and assumptions are as follows:
i) Effective fishing days per year: 190 – winter: 43 days and summer: 147 daysii) Catch per BT – Winter: 2 Kg ; summer: 7 Kg (every alternate day)iii) Catch per fisherman day (HL): winter: 1.5 Kg and summer: 4 kgiv) Catch Composition – BTGrade 2: 90% (Cordonier, Licorne & Mullet)Grade 3: 10 % (Rouget & Others)

44 Programme SmartFish Rapport SF/2012/18
(v) Catch Composition – HLGrade 1: 100% (Vielle Rouge & Capitaine)PSP slightly lower due to relatively small size of fish caught in the lagoon.
Table 4: Non-Motorized BT & HL fishery - Annual Catch Estimates
Items Winter Summer Total / KgEffective fishing days / yearBasket Trap fisheryNo of basket TrapsCatch per BT ( every alternate day)Annual Catch Hand line fisheryNo. of fishers incl. Boat OwnerMean Catch per fisherman dayTotal (b)Annual Catch (a+b)
43
52
215
31.5
194
147
57
2573
34
1764
190
10.22,788
4.231,9584,746
Table 5: Non-Motorized BT & HL fishery - Revenue Estimates
Items Qty / Kg PSP Revenue / RsHand line fishery100 % Grade 1 BT Fishery80% Grade 2 20% Grade 3Total Revenue
Mean Price
1,958
2,230558
100
8060
Rs/Kg
195,800
178,40033,480
407,680
85.89

Supply Chain Analysis
45Programme SmartFish Rapport SF/2012/18
Income and Expenditure Estimates
Items Notes Rs Rs RsSales 4746 kg @ Rs 85.89Less Fixed CostAllowance for depreciation – fishing boatRepair & Maintenance – fishing boatSundry overheads
Less Variable Cost (excl. Labour cost)Replacement of Basket Traps Replacement of fish gear HLSundry expenses
Net Income for sharing Equal Share to all Annual Income to each Monthly Income / fisher
123
5
6
7
5,0005,0002,400
12,5006,0009,500
12,400
28,000
122,42710,202
407,680
40,400
367,280
Notes to accounts1. Allowance for Depreciation of fishing boat ( 5% of Rs 100,000 = Rs 5,000)
2. Provision for Repairs and Maintenance of fishing assets A provision of 5 % per year for repairs and maintenance of the fishing boat & sail = Rs 5,000. 3. Sundry Overheads A provision of Rs 200 per month : Rs 2,400 per annum for contingencies. 5. Replacement of fishing gears Replacement of basket traps ( galvanized steel mesh ) : 2 x Rs 4000 = 8000 Replacement of basket traps ( Bamboo ) : 9 x Rs 500 = Rs 4,500 Hand line gears : Rs 500 / month = Rs 6000. 6. Sundry Expenses A provision of Rs 50 per fishing day is made for contingencies Rs 50 x 190 = Rs 9500; 7. Net Operating Surplus excluding Labour cost Gross Revenue – Operating Cost ( Rs 407,680 – 40,400 = Rs 367,280) 8. Fishers Income ( Equal share for all) Annual Income = (Rs 367,280 ÷ 3 ) = Rs 122,627 ; Monthly Income = Rs 10,202.
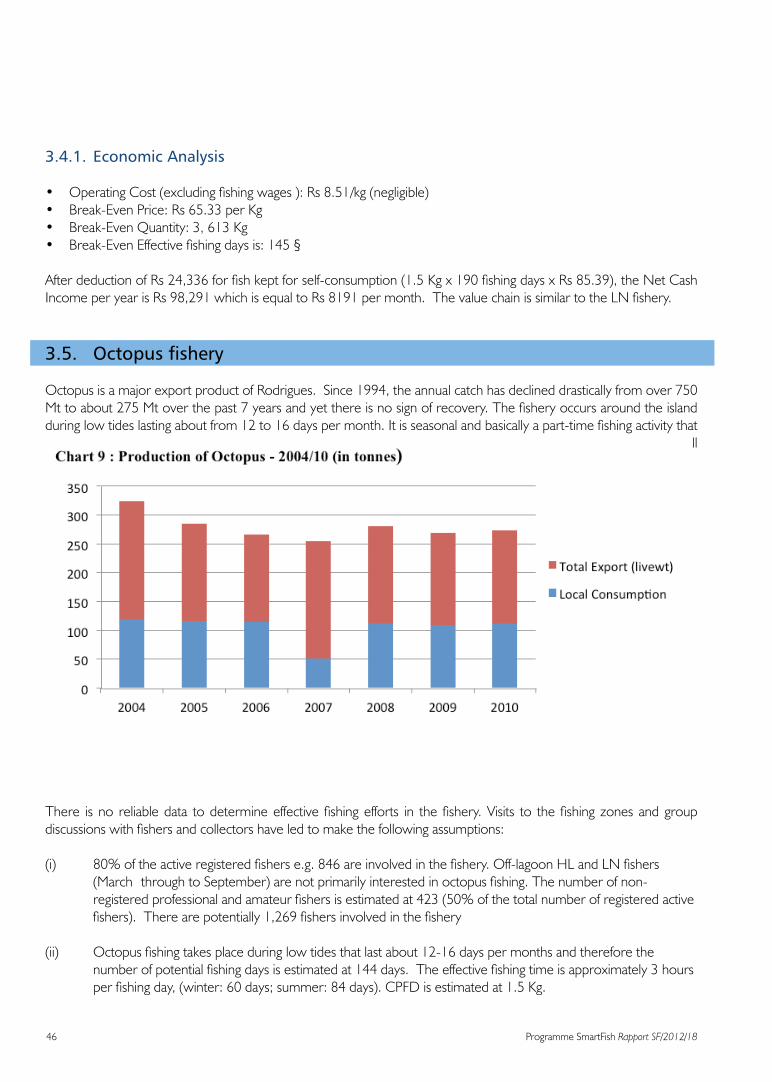
46 Programme SmartFish Rapport SF/2012/18
3.4.1. Economic Analysis
• Operating Cost (excluding fishing wages ): Rs 8.51/kg (negligible) • Break-Even Price: Rs 65.33 per Kg• Break-Even Quantity: 3, 613 Kg • Break-Even Effective fishing days is: 145 §
After deduction of Rs 24,336 for fish kept for self-consumption (1.5 Kg x 190 fishing days x Rs 85.39), the Net Cash Income per year is Rs 98,291 which is equal to Rs 8191 per month. The value chain is similar to the LN fishery.
3.5. Octopus fishery
Octopus is a major export product of Rodrigues. Since 1994, the annual catch has declined drastically from over 750 Mt to about 275 Mt over the past 7 years and yet there is no sign of recovery. The fishery occurs around the island during low tides lasting about from 12 to 16 days per month. It is seasonal and basically a part-time fishing activity that portrays an ideal open access and laissez faire situation. . Besides the registered fishers, it also attracts a crowd from all segments of the population.
There is no reliable data to determine effective fishing efforts in the fishery. Visits to the fishing zones and group discussions with fishers and collectors have led to make the following assumptions:
(i) 80% of the active registered fishers e.g. 846 are involved in the fishery. Off-lagoon HL and LN fishers (March through to September) are not primarily interested in octopus fishing. The number of non- registered professional and amateur fishers is estimated at 423 (50% of the total number of registered active fishers). There are potentially 1,269 fishers involved in the fishery
(ii) Octopus fishing takes place during low tides that last about 12-16 days per months and therefore the number of potential fishing days is estimated at 144 days. The effective fishing time is approximately 3 hours per fishing day, (winter: 60 days; summer: 84 days). CPFD is estimated at 1.5 Kg.

Supply Chain Analysis
47Programme SmartFish Rapport SF/2012/18
(iii) A primary survey of the octopus catchers has led to determine the actual Mean annual CPFD at 2.16 Kg (winter: 1 kg and summer: 3 Kg). The actual annual catch is estimated at 394.7 Mt. All the same, the total export of frozen octopus is estimated at 260 Mt on the basis of an annual weekly shipment of 5 Mt to Mauritius.
3.5.1. Economic analysis
At production level, the fishery generates gross revenue of approximately Rs 33 Million per year but it is dissipated in the open access fiesta. Revenue derived by an octopus fisher is estimated between Rs 21,544 and Rs 31,103 per year. It would increase in range of Rs 32,104 and Rs. 46,655 if the fishery restricted to registered fishers only
Table 6: Octopus Fishery Revenue Estimates Matrix Total CatchFishers
Assumption (ii)273.4 Mt
Assumption (iii)394.7 Mt
Registered & Active : 846 Rs 32,104 Rs 46,655All fishers : 1269 Rs 21,544 Rs 31,103
A shortage of reliable fisheries193 and socio-economic data on the octopus fishery is a major obstacle for formulation of an appropriate management plan. Registered fishers who relinquish their professional cards against some financial compensation continue to operate as unregistered or amateur fishers. Open access and laissez faire policy is the main cause of socio-economic and ecological chaos in the coastal fisheries. The octopus fishery cannot be managed efficiently in isolation because of the complex and interwoven links with other coastal fisheries. This can only be achieved through an integrated fisheries management plan with the active participation of the local fisher communities.
3.5.2. Processing and Value Added
Octopus is the star product in terms of processing and value added activities. It is limited by scarce supply of raw material and technical support while the absence of food safety and quality standards in the seafood sector is a major constraint for the development of export markets.
There are 3 main processors and exporters of some 150 Mt of frozen octopus to Mauritius. A relative small quantity of dried octopus is also produced by indigenous processors and either sold directly to end consumers or used as an intermediate input for other value-added products such as packed sliced smoked octopus, octopus pickles. Small quantities of dried salted fish are produced as it forms part of traditional delicacies of the islanders.
(i) Frozen Octopus for exports
Two corporate processors/exports have their cold storage facility (blast freezer and cold room) while a third one hires cold storage service of the RGF. Collectors mostly use pick-up vans to collect the raw octopus from the fish landing centres. There is no plug-in facility for refrigerated at the harbour. A processing unit as a running concern is worth at Rs 500,000 and it provides direct employment to 3 workers at a mean monthly salary of Rs 4,000.
19 Data describing fisheries - what, where and how much is caught and how fisheries are performed including effort by gear type – is the premise of fishery management. Such data is needed for scientific assessment of the state of the fish stocks and to estimate sustainable yield. It is also needed to monitor performance and compliance with regulations such catch, efforts, gear type, time and area fished.

48 Programme SmartFish Rapport SF/2012/18
Table 7: Costing of frozen octopus
Cost Items Rs / Kg %Raw MaterialOperating Variable CostOperating Fixed CostProfit MarginFob Price
9022
929
150
6015
520
100
Frozen octopus creates a value added of Rs 60 per Kg and approximately Rs 10 Million annually.
(ii) Dried octopus Nowadays dried octopus is scant and expensive due to decline on in production. Generally 3 kg of raw octopus is needed to produce 1 kg of sun-dried octopus and it may take up to 3 sunny days. The actual retail of dried octopus is at Rs 600 per kilo.
Table 8: Costing of dried octopus
Cost Items Rs / Kg RsSale price - 1 kg of sun dried octopus3 kg of raw octopus ( Rs 90 @ Kg)Labour ( negligible )Profit Margin Profit Margin to Sale
270100
600
370230
38%
(iii) Smoked Octopus
Dried octopus is smoked on wood fire, cleaned, sliced and packed in small portion of 100 grams. 1 Kg of dried octopus yields approximately 800 grams after processing. The final product is sold in the local markets at Rs 100 per packet.
Table 9: Costing of smoked and sliced octopus
Cost Items Rs / KgRetail portions of smoked and sliced octopus1 Kg of dried octopus* (wholesale price )Packaging materials Firewood or charcoalLabour ( part-time)Profit MarginMargin to Sales
5005025
100
800
675125
16 %%

Supply Chain Analysis
49Programme SmartFish Rapport SF/2012/18
In case the processor starts from fresh octopus, the profit margin including labour cost is estimated at Rs 185 / kg, twice the PSP of raw octopus.
(iv) Octopus flavoured chilli paste (Piment-Ourite)
This is another traditional delicacy in high demand. It is made of a mixture of hot chillies, local species and smoked octopus. The costing for the preparation 10 jars of 250 ml of “piment-ourite” is as follows:
Table 10: Costing of “Piment – Ourite” (2,5 kg of end product)
Cost Items Rs / Kg RsS12 jars x 250 ml @ Rs 100 Dried Octopus (500 grams)Hot Chillies ( 1000 grams)Ginger (250 grams)Garlic (250 grams)Special dry spices (“masala”) and sundriesSoya bean Oil ( 200 ml)Glass jar + cover @ Rs 10LabelsLabourProfit MarginProfit Margin to Sales
300200
25255020
10050
100
1,200
870330
28 %
3.6. Extended off-lagoon HL (chilled) fishery
Rodrigues General Fishing Co. Ltd. is private limited company fully owned by the RRA. Two years ago it has been assigned the operationalization of the fisheries complex at Pointe Monier commonly known as “Maison des Pêcheurs” and a fleet of six extended artisanal (chilled) handling line fishing boats. The main features of the fishing fleet are as follows:(i) Particulars of the fishing boats
• Overall length: 9.5 m• Engine: In-board • Cruising speed: 6 knots• Navigational equipment: coastal standard incl. VHF and Echo sounder• Safety equipment: standard• Fish hold: 500 Kg, isotherm • Autonomy at sea: 72 hours• Crew: 4 (I skipper + 3 fishing crew)• Fishing gear: drift and bottom hand line• Handling & Preservation: whole, chilled on ice flake
ii) Operational arrangement
• The boat is leased to a team of 4 registered HL fishers including a qualified skipper on relatively flexible terms.• Trip cost is advanced by RFG and is deducted from sale proceeds• Lease price is agreed at Rs 650 per fishing trip on the basis of 10 trips per month and 120 trips / year. (It is a simple
form of time charter)

50 Programme SmartFish Rapport SF/2012/18
• The lease price includes insurance, supply of ice flake.• The lessee is responsible for routine maintenance• Fishing gears on the care and account of the fishing crew.• The total catch is owned by RGF and is bought at a contracted price:
Grade 1: Rs 86 per KgGrade 2: Rs 80 per KgGrade 3: Rs 54 per Kg
iii) Assumptions
• Actual Cost of boat (hull & Engine): Rs 600,000• Duration of fishing trip: 24 hours• Effective fishing time: 18 hours; cruising : 6 hours• No of fishing trip per year: 120 at the tune of 10 per month• Annual mean Catch per fishing trip: 100 kg (excl. “carri” ) • Price of Ice-flake : Rs 5/kg • Qty of ice-flake per trip: 200 kg• Cost of provision/trip: Rs 1000.• Diesel : 50 L /trip (Lubes and Oil : 5% of Fuel Cost)• Insurance (Boats & Crew): Rs 20,000 per annum.• Replacement of fishing gears: Rs 500/ trip
iv) Revenue Estimates per fishing boat
Product Segments Qty (Kg) Rs / Kg Total (Rs)Grade 1 (80%)Grade 2 (10%)Grade 3 (10%)TotalMean Price Cost of ice flake per kg of fish at landing
9,7201,2151,215
12,150
86.0080.0054.00
8%
835,92097,20065,610
998,73082.2012.66

Supply Chain Analysis
51Programme SmartFish Rapport SF/2012/18
3.6.1. Income and Expenditure Estimates
Items Notes Rs Rs RsSales 12,150 kg @ Rs 82.20Less Fixed CostAllowance for depreciationRepair & Maintenance – fishing assetsInsuranceLease Less Variable Cost (excl. Labour cost)Fuel & LubesReplacement of fishing gearsProvision ( Food & Beverages)Net Fishing Income Annual Income per crew member (equal share)Monthly Income
1234
45678
---
78,000
259,56060,000
120,000
78,000
439,560
120,28810,024
998,730
517,560481,150
Notes 1. Provision for Depreciation Not applicable, borne by lessor 2. Repair & Maintenance Not applicable, borne by lessor 3. Insurance ( Boat and Crew) Not applicable, borne by lessor 4. Fuel and Lubes (40 L of Diesel x Rs 41.2 + 5% for lubes & oil) x 120 trips
5. Replacement of fishing gears Rs 500 @ trip x 120
6. Provision ( food & beverages) Rs 1000 @ trip x 120 7. Net Income to shared by fishing crew Gross Revenue – Operating Cost 8 Equal share for all crew member including skipper.
3.6.2. Adjustments
i) The lease price or time charter fees of Rs 78,000 per annum or Rs 6,500 per month includes insurance cost which is estimated at Rs 20,000 per year. Therefore the net lease is adjusted to Rs 58,000 per year or Rs 4,834 per month (Rs 483 per trip).

52 Programme SmartFish Rapport SF/2012/18
ii) The contracted purchase price (mean PSP) of fish is 82.20 per Kg. It excludes the cost of ice flake which is estimated at Rs 12.66 per Kg of fish. Therefore the adjusted PSP is at Rs 94.86 per Kg.
3.6.3. Economic Analysis
• Operating Cost ( fixed Cost + Variable Cost) : Rs 42.60 per Kg• Break Even Quantity: 6,296 Kg • Break Even Quantity (incl. minimum wage as fixed cost): 10,676 Kg or 89 Kg/trip
The fleet are some structural problems that have to be attended urgently20.1 They are relatively slow (cruising speed: 6 knots) that limit their fishing grounds to outer reefs and do not venture on FAD. Actually the boats are operating at about 20 % of its capacity mainly due to the abovementioned technical problems and inadequate operational environment.
At a minimum of 40% of its operating capacity, i.e. 200 Kg / fishing trip, the revenue flow is be as follows:
• Gross Revenue : Rs 1,972,800• Total Operating Cost (excl labour) : Rs 517,560 ; Rs 21.56 / Kg• Net Surplus Income : Rs 1,455,220 • Annual Income / fisher: Rs 363,810 or Rs 30,318 per month.
3.6.4. Shrimp Net (SN) Fishery
As at November 2011, there were 13 active SN licence holders in Rodrigues. No data is available on this fishery. A few fishers were interviewed to probe into the fishery and these are the main features:
(i) Fishing gear: A basket net with a stick is used by on-foot fishers to catch shrimps on the sea beds during low tides.
(ii) It is a seasonal fishery that is performed during low tides. Effective fishing days are approximately 168 days / per year.
(iii) Fishing area: sandy sea beds around the islets namely, Coco island.
(iv) The annual mean catch per fisherman day is assumed at 3 Kg.
(v) The production is sold directly to end consumers, hotels and restaurant at Rs 300/Kg.
(vi) The fishers are polyvalent and perform other fishing methods such as hand line, basket traps alternately
The annual net income of a shrimp net fisher is estimated at Rs 128,520 or Rs 10,710 per month. It is advisable to collect a minimum of data on the fishery.
3.7. FAD Fishery
Up to now the FAD fishery has not taken off. The off-lagoon fishing boats occasionally fish around the FADs, which are on the way to their traditional fishing grounds. However the sports fishery operates mainly around the FAD but it is not covered by the fisheries statistics.
20 Leakage at the cover and no drainage system in the fish hold causing loss in temperature and melting of ice flake. Fishing trip is shortened (24 hours) to avoid spoilage of fish.

Market Structures and Marketing Functions
53Programme SmartFish Rapport SF/2012/18
4.0 MARKET STRUCTURES AND MARKETING FUNCTIONS
Fishing activities have evolved progressively over time from subsistence to commercial but the development of market infrastructure has lagged behind. FLS are operational bases of coastal fisheries that provide a sheltered structure and basic amenities for cleaning, sorting of fish at landings prior to primary sale. They are in fact local fish markets where fishers sell their catch to fishmongers and direct consumers. Out of 22 FLS around the island there are only 4 sheltered structures (at Grand Bay, Tamarind, Pointe Aigle and St Francois), but all of them are inoperative. There are 2 institutional fish markets only namely at Mont Lubin and Port Mathurin Bazaar. The only private fish retail outlet belongs to the RGF and is located at Pointe Monier.
Generally fresh fish is sold whole (un-gutted) at the landing site or roadside. The supply chain is short and geographically limited. There is no post-capture handling and preservation to ensure food safety and quality. Fresh fish is usually sold a few hours after landing. Unsold catch is stored in domestic refrigerators and sold as “fresh fish” on the following day. Sometimes it is processed into dried salted fish. Isotherm vehicles and the use of ice flakes are non-existent in the local marketing channels.
Fishmonger licenses are a statutory requirement to trade in fish and fish products on the local markets while registered fishers are de facto authorized to market their catch. Out of 240 registered fishmongers approximately 75 are active either on a full time or seasonal basis. Some shopkeepers in the vicinity of landing centres act as agents for octopus collectors/processors.
The majority of fishmongers use motorcycles as a mean of transportation, a few can afford a pick up van and it is common to find on-foot fish vendors. Some off-lagoon HL fishing enterprises are involved in the marketing of their catch to hotels, restaurants and regular end consumers.
There are a few reputed and well established middlemen or wholesalers in the marketing channels who deal mostly with the LN and BT fishing enterprises. They buy in bulk and sell it in smaller lot to retailers.
From a marketing perspective, the catch of the coastal fisheries can be broadly classified into 3 distinct product segments namely high value (grade 1) fish, other fish species and octopus. Octopus belongs to the 2nd commercial grade of fish but it constitutes a specific fishery of its own. The total catch with the exception of frozen octopus is consumed fresh locally. The marketing channels of the fisheries sector are schematised below.

54 Programme SmartFish Rapport SF/2012/18
Chart 10: Marketing Channels
1st
OtherGradesFish
Octopus
Fish Hawkers
Fish Traders
Collectors
Fish Markets
Cottage Processors
Process/E
Hotels & Restaurants
End consumers
Export to Mauritius

Market Structures and Marketing Functions
55Programme SmartFish Rapport SF/2012/18
4.1. Market Price of Fresh Fish
The shortage of supply of fresh fish on the local market has led to demand-pulled inflation. Consequently the retail prices are increasing at approximately 10% per annum. The mean price of fresh fish at different levels of the supply chain is shown
The distribution of value-added between the production and marketing agents in the supply chain is realistic.
4.1.1. Income Estimates of a Fishmonger
A full time fishmonger operates 4 days per week and handles about 20 Kg/ day in winter and 50 Kg/ day in summer. The trade is mainly on cash sales while suppliers are paid on a weekly basis.
Table 11: Fishmonger – Cost Earnings Analysis
Items Winter Summer Total Working days (4 @ week)Volume of Fish @ working/dayAnnual quantity of fish traded
Total Sales (mean CSP = Rs 127.50/Kg)Total Purchase (mean PSP = Rs 95 /Kg)Marketing Margin (CSP – PSP)
8620
1720
12150
6,0504
207-
7,770
990,675738,150252,525

56 Programme SmartFish Rapport SF/2012/18
4.1.2. Income and Expenditure Estimates
Items Notes Rs RsSalesPurchasesFixed Cost Depreciation of Motor cycle (10% of Rs60,000)Repair and Maintenance of Motor cycleVariable CostFuel & Oil (Rs 200 / day )Sundries ( Rs 50 / day)Net Annual Income before interest & Tax.
6,0006,000
41,40010,350
738,150
12,000
51,750
990,675
801,900188,775
4.1.3. Economic Analysis
• Monthly Income: Rs 15,731• Marketing Margin: 32.50 per Kg• Marketing Cost : Rs 8.20 per Kg• Marketing Profit: Rs 24.30 per Kg
There is virtually no barrier to this trade due to low capital investment and low marketing cost which is coupled with an attractive level of income.

Value Chains
57Programme SmartFish Rapport SF/2012/18
5.0 VALUE CHAINS The value chains of the various type of fishing activities are examined although the most of them share the same products and market segments. The diagram below illustrates the complex and dynamic environment of the value chain.
Chart 12: Value Chain Enabling Environment
5.1. Value Chain of LN Fishery
Although the LN fishery is a seasonal activity, it is the single largest producer of fresh fish for the local market. The catch comprises mainly lower commercial value of fish; the mean PSP is estimated at Rs 89.38 per Kg. The fishery attracts a larger number of marketing agents (traders and fish vendors). The marketing margin of the fish trader is approximately Rs 10 per Kg or 12% of the PSP. During peak season, unsold catch is processed into dried salted fish. It is a means of preservation rather than value-added. Approximately 3 Kg of raw fish yield 1 Kg of dried salted fish and may last up to 3 to 4 days. The consumer price of dried salted fish varies between Rs 200 and Rs 250 per Kg. The product has become a traditional recipe for islanders. The product is in scares supply because of shortage of raw fish on local markets.

58 Programme SmartFish Rapport SF/2012/18
Chart 13: Value Chain of LN and BT fisheries
Several micro enterprises can be promoted in this value chain by re-skilling of redundant fishers and/or fisher households. The value chains of basket trap fishery are similar to the LN fishery because they harvest almost the same fish species and utilize the same marketing channels. In some managed fisheries, bio-economic models are used to determine fishing quotas for different fishing methods such as LN, BT and HL operating on same fish stocks in view to fish stocks economic rent or value chains.
5.2. Value chains of Off-lagoon Hand line fishery
Off-lagoon HL fishing enterprises harvest the high value fish species such as Vieille Rouge and Geule Pavé that have developed lucrative market segments. However fishing enterprise can further improve their revenue by sorting and grading their catch according to market demand and consumer preference. For instance the PSP of Vieille Rouge and Capitaine is the same (Rs 140 per Kg) whereas the CSP of Vieille Rouge is about Rs 200 per kilo and that of Capitaine, Rs 160 per Kg.
The value chain can be enhanced by adopting proper handling and preservation practices to extend the shelf life of the raw fish.
Chart 14: Value Chain of off-lagoon Hand line fishery
LN Fishery(Assorted catch)
Fishmongers(Wholesaler)
Fishmongers(Hawkers)
Local Market(End Consumer)
Processors(Dried Salted Fish)
HLFishery
FishmongersHotels/
restaurants
Air-freightedProcessor/Exporter
Possible actions on value chains

Value Chains
59Programme SmartFish Rapport SF/2012/18
5.3. Value chains of octopus fishery
Approximately 50 % of the annual octopus production is exported (frozen) to Mauritius. Another 40% is sold on the local market for direct consumption. The remaining 10% is sun-dried, part of which is sold on the local and export markets while small quantity is further processing into ready-to-cook and ready-to-eat products. Value added on the raw octopus varies between 60% for frozen octopus to up to 400 % for traditional value added products. There is tremendous scope for product and market development in this segment. An appropriate extension and facilitation framework has to be developed to promote a large number of micro enterprises in the value chain.
Chart 15: Value Chain of Octopus Fishery
OctopusCatchers
Fishmongers
Indigeneous/processors
Indigeneous/processors
Indigeneous/processors
Collector/Processors/Exporters
End Consumer
Export markets

60 Programme SmartFish Rapport SF/2012/18
5.4. Value chains of off lagoon (chilled fishery)
The value chain of high value chilled fish is promising and accessible to insular states like Rodrigues. It has tremendous export potential provided that appropriate infrastructural and logistics development is undertaken promptly. RGF is pioneering the chilled fish value chain for the local market. It is a vertically integrated enterprise combining fishing and marketing. However the capital assets (cold storage facility and fishing boats) inherited by company are worn out. The following weaknesses are identified:
i) The facility has to be renovated completely to comply with international food safety and quality standards and has to align to the HACCP system. Actually there is no specific guideline for handling and preservation of chilled and frozen at the facility. The chilled fish is not stored on ice but in cold room or domestic refrigerators.
ii) The production of flake ice is insufficient to cater for the company’s fleet, resulting in delays in fishing operations.
iii) The cold storage facility provides logistic services to an octopus exporter as a strategy to cover a part of the running expenses.
iv) The facility is underutilized because its fishing fleet is not operating efficient due to some structural problems.
The fish terminal has to be overhauled thoroughly in order to extend its economic life. This is considered as worthwhile investment on considering economic prospects of future off-lagoon chilled fisheries development namely the IFAD-MARS programme in Rodrigues.
Chart 16: Value Chains of Chilled fish
FishingUnits
[6
Ice FlakeUnit [500
kg/day]
Processing[CleaningGutting,octopus
Cold storage[Blast Freezer.cold & Chill
Room
MarketingFishmongers
Octopus Collector Export to MRU
FishingUnits
[Chilledfisheries]
FishTerminalSorting
ProcessingUnit Value added
Export MarketsMauritius
Local markets
Ice flakes
Value Chains
61Programme SmartFish Rapport SF/2012/18
The proposed value chain for the high value chilled fish is export oriented and it implies the following:
i) The supply chain is compliant with international sanitary and health standards for imports of raw fish and fish products.
ii) Outbound logistics are available to deliver chilled fish products to Mauritius and Reunion Island. Both options – sea and air have to be examined.
iii) Investment in a modern fishing port / fish terminal and associated facilities
iv) Setting the landmark for the development of Rodrigues seafood hub.

6.0 SPORT FISHERY
No formal data is available on the sport fishery. Actually there about 12 Game Fishing boats in Rodrigues. They fish on the high seas and around FADs. The catch is sold on the local market at par with the local fishers. A Game Fishing craft survey at Port Mathurin lands up to 2 Mt of chilled tuna and associated large pelagic on a fishing day. The catch sold at Rs 120 per kilo to fishmongers at the wharf. There is no conflict between local fishers and sport fishers due to scarce supply of fresh fish. However, with the future development of the FAD fishery, there is potential for conflict to arise between the two fisheries.
The potential value chain for tuna and large pelagic is illustrated below.
Chart 17: Value Chains of fish landed by Sport and FAD fisheries
SportFishery
Processing Fishmongers
Fishmongers
Restaurants
End Consumers

Conclusion
63Programme SmartFish Rapport SF/2012/18
7.0 CONCLUSIONS
7.1. Production functions
Formally the fisheries sector of Rodrigues comprises 1,410 registered fishers and 1,821 fishing boats while the annual fish production is approximately 1,600 t. Gross annual revenue generated by the various types of fishing operations (excluding the sport fishery), is estimated at Rs 174 Million on the basis of a mean producer sale price (PSP) of Rs 109 per kg. It represents an annual income of Rs 123,688 per registered fisher (Rs 10,307 per month). Given that a fishing boat carries 3 to 4 fishing crew21,1there are potentially 5,823 active fishers including 330 on-foot fishers mostly fisherwomen in the sector. Therefore the net annual income of a fisher operating in the lagoon, can fall as low as Rs 29,950. Approximately Rs 132 million (75 %) of the gross income does not benefit the registered fishers. The tendency to support the side of short term economic needs of fishers, instead of long term conservation and sustainable fisheries, has led to depletion of sedentary fish stocks and damage to marine habitats in the lagoon. There must be no compromise whatsoever to halt open access/common property rights and laissez faire in coastal fisheries. From an economic viewpoint, to accommodate 5,823 active fishers with a decent revenue (a minimum household income of Rs 7500 per month), the total catch has to be approximately 3,200 Mt. Fisheries expansion is plausible in the off-lagoon and high-seas areas around the island. To-date 70% of the high-sea fish stocks is still unknown or unexplored. The FAD fishery can easily support the production of tuna and large pelagics of approximately 1000 Mt / year on the basis of 60 Mt per FAD (Lojac H’meur 1987 and C. Roullot, 1991). The development initiatives to harness these untapped fish stocks in off-lagoon and high-seas areas are led by the RGF off-lagoon HL fishing fleet and the IFAD-MARS extended artisanal fishing fleet. They have to be supported by an enabling environment.
The fisheries statistics are not reliable due to out-dated sampling, data collection and processing systems in addition to a shortage of human and technical resources at the FRTU. It is likely that the actual production is much higher than that given by the fisheries statistics. Administrative records maintained by the FPS on registered fishers, fishing boats and fishmongers must be consolidated into a computerised data-base that can be useful for fisheries management.
7.2. Marketing functions
In marketing parlance, raw fish is considered as a non-branded, fast moving consumer product. Traditional fishing enterprises just sell their catch and do not market them per se. Fishers must be trained in marketing to increase their revenue and to obtain a fair share of the value added in the supply chain. The flow of market information is essential to promote a fair and transparent market mechanism. An increase in the supply of raw fish may depress prices on the local markets due to limited purchasing power of consumers. To enhance value chains of fresh/chilled fish it is important to also develop export markets. Effective demand for high quality chilled fish in Mauritius arises from local markets for direct consumption and from the Mauritian seafood hub where processing is undertaken for re-export. Two major hurdles have to be removed to connect the local chilled fish value to the Mauritian seafood hub, namely cost effective transportation (sea and air) logistics and compliance to international sanitary and health standards. In addition, Réunion Island has to be targeted as a prospective market for raw fish and fish products from Rodrigues.
Marketing infrastructure is virtually non-existent on the island. Raw fish is sold on the beach (at landing sites) or on the roadside. There are no sheltered FLS that can be used for handling, sorting and grading of fish prior to sale. Simply by improving the landing facilities (better sorting and grading of raw fish into difference commercial categories) can increase the revenue of a fishing enterprise by 5 to 10%. The existing FLS have to be renovated and operationalized
21 Rodriguan fishers are of the belief that more people or weight on board give more ballast or stability to the fishing boat at sea

64 Programme SmartFish Rapport SF/2012/18
at the earliest in close collaboration with the Local Fisher Communities (LFC). More FLS have to be set up in major fishing villages.
The supply chain for fresh fish is short and geographically limited because the product is highly perishable. To extend the shelf life of the product it is crucial to enforce adequate handling and preservation practices along the supply chain. The use of isotherm boxes, flexible containers and ice flakes is necessary to enhance the value chain of high value fish species for local and export markets. The implementation of world class food safety, quality and traceability standards in the seafood sector is a pre-condition for export oriented market development.
Chilled fish value chains are economically more attractive for artisanal and semi-industrial fisheries of insular states as compared to frozen raw fish. For instance the difference between consumer prices of chilled and frozen fish is approximately 2:1. Efficient downstream logistics have to be developed. A refrigerated supply chain is more appropriate for industrial or large scale fisheries due to its high initial investments. In the artisanal fisheries, refrigeration is rather a means of preservation of last recourse for unsold fish. The local practice of using domestic refrigerators or cold rooms to store fresh fish is hazardous to public health. An extension of the Mauritius Competent Authority into Rodrigues will be necessary to achieve capacity building in world class food safety, quality standards and HACCP alignment in the local seafood sector.
7.3. Processing and value added activities
The scope of value chains in processing and value added operations in the fisheries sector are minimized for the following reasons:
i) Scarce supply of raw fish; ii) Inadequate technical and financial support; iii) Absence of handling and preservation practices for raw fish. iv) Non-compliance to international sanitary and health standards and to HACCP;v) Restricted markets: only local consumers and visitors. vi) Lack of fisheries infrastructure such as FLS, ice-flake plants, etc.; vii) Absence of out-bound logistics for export of chilled products to Mauritius; viii) Lack of entrepreneurial and management skills.
A few examples of value added (chilled) fish products are given below:• Value added (vacuum packed) fish filet / loin, cubes, slices, whole and gutted.• Semi processed fish balls, burgers, sausages and paste• Ready to cook marinated, smoked, pre-cooked (traditional recipes), pickles.
In keeping with the above findings, it can be concluded that the fisheries sector can be promoted as the driving force the local economy. There should be an ambitious and performance oriented development and management plan to resolve the problem of conservation of the lagoon ecosystems and marshalling of a concerted action plan to develop export-oriented off-lagoon and high-seas fisheries around the island.
The existing extension services must be overhauled to provide adequate support to stakeholders in product development, fish handling and preservation of fish, up-grading of existing fishing boats, demonstration of new fishing techniques, exploration of new off-lagoon fisheries, entrepreneurial skill in fishing, processing, marketing, business management skills, project facilitation (one stop shop) and mentoring. Local leadership and community based management capabilities have to be developed in local fisher community to ascertain their active participation in voluntary compliance to the MCS of the coastal fisheries, fish handling and preservation practices and shared management of fisheries infrastructure. There is strong political determination to create an enabling business environment in Rodrigues. These efforts have to be seen in the fisheries sector through the development of crucial fisheries infrastructure such as FLS, an integrated fishing terminal, export logistics for chilled fish and fish products, promotion of export market development, private

Conclusion
65Programme SmartFish Rapport SF/2012/18
local and foreign investments, joint venture, strategic alliances and domestication of foreign fishing and processing companies.

66 Programme SmartFish Rapport SF/2012/18
8.0 RECOMMENDATIONS8.1. Policy advocacy
To establish coastal fisheries management to encompass effective monitoring, control and surveillance (MCS) measures. To enforce food safety and quality practices for fish and fish products sold on the local markets and for exports.To regulate and monitor the activities of amateur, leisure and game fishers (including on-foot fishers) in the coastal fishing zones.
8.2. Development of new extended artisanal (chilled) fisheries
Development of the FAD and open-sea tuna, tuna-like and large pelagic fisheries and the deep-sea demersal fishery
• Direct investment, transfer of technology, technical assistance• Motorization of traditional crafts, use of more efficient fishing techniques, fish prediction data, application of GIS and remote sensing etc.• Extension and facilitation services: training, re-skilling and mentoring• Transfer of technology and capacity building in quality assurance.• Fisheries exploration and trial of more efficient fishing technologies
8.3. Promote investment in infrastructure and equipment
• Air-freight logistics to enable export of chilled fish products• Fishing Landing Station (FLS) and fish markets in major regional fishing centres• Integrated fishing port, ice flake machinery, isotherm/cool room
8.4. Strengthen financial supports
• Suitable loan for asset and working capital finance for fisher folk, artisanal processors and traders;• Promote banking and saving culture• Provide financial literacy, entrepreneurial skills ( pricing and costing) and business management
8.5. Strengthen existing value chains
• (Strategic alliance / partnership) Partial processing of local catch and final processing in other markets• Second and third cycle of processing activities (ready-to-cook and ready to eat products)• Product Research and Development• Opening of export markets• Marketing Intelligence to obtain real time market information.

Appendix 1
67Programme SmartFish Rapport SF/2012/18
APPENDIX 1 – TERMS OF REFERENCE
1. Convene stakeholders meetings in selected areas to identify the current problems with marketing within this fishery and fully understand the main constraints / opportunities for fishers in handling, processing and marketing of fish nationally and for export
2. Investigate /define the structure of the distribution chain for the sub-sector from catch to markets, using 2 or 3 examples in the country
3. Investigate prices for fish products throughout the distribution channels and review costs / margins associated with the process to reach markets
4. Collect information on domestic / export markets, and compile information on individuals / groups involved in fish trade, products processed, successes, failures, opportunities, threats…
5. Collect information on processed fish products and assess possibilities for improved processing techniques in securing / sustaining current and future markets nationally / and for export.
6. Review and advise on systems for collecting and disseminating market information in the context of market performance for the artisanal fishery
7. Assess value-addition opportunities for the artisanal fisheries in Rodrigues, with a view to improving the sustainability of the sector for the future
8. Outline simple business model(s) (capital costs / revenue/ operating costs/ margins) that represent(s) the key processing activities in the fishery required to sustain and improve trade
9. Review required personal investment in the fishery to achieve market entry, as well as to secure current / future markets national / and for export and assess the requirements for investment in this fishery including access to funds and financing opportunities (e.g. micro-credit) for such personal investment, and other private sector opportunities in the sector.
10. The study should take the view that existing fisheries infrastructure should be used to define short term recommendations for implementable improvements – (this is not a study to define capital investment in new infrastructure, but rather use what is available and under-utilized. If specific infrastructure requirements are noted however that would support the strategic sustainability of the artisanal fishery – this should be noted together with budget estimates of capital costs for such new infrastructure.
11. Assess and analyse production and marketing situation with regards to community structure in relation to sustainable marketing of quality fisheries products performance with the assumption that performance is related to community input to the fishery
12. Investigate underlying reasons for non-performance of the artisanal fishery to perform in such an unbalanced market
13. Provide the business case for support for the fishery to inform private sector and others regarding potential for the sector
14. Towards the end of the study period, prepare and present the key findings of the study to stakeholders

68 Programme SmartFish Rapport SF/2012/18
(fishers, processors, exporters, transporters, investors, public sector at a feedback workshop (1 or 2). As well as a national briefing session to stakeholders in Mauritius/ Rodrigues it is also envisaged that a sub- regional workshop would take place to share experiences with other fisheries departments in the region to find applicable synergies for integrator regional interventions. Invite participants from regional countries to share their experiences in the artisanal sector also (note recent ACP FISH II activity in Praslin, Seychelles for example.) with a view to defining national and regional training initiatives that can be implemented
15. Produce a final report from the study activities and following incorporation of comments received at the workshop
16. Incorporate recommendations on the inclusion of existing training facilities and expertise in Rodrigues in terms of how it can respond to the needs of the artisanal sector
17. Produce a final report from the workshop upon receiving stakeholders’ comments

69Programme SmartFish Rapport SF/2012/18
Appendix 2
APPENDIX 2 – FISH PRICE SURVEY – NOV 2011
Rs / kg FISH LANDING STATION FISH VENDORSCommercial Category PSP TM WSP RM CSP Mourgate 240 20 260 40 300Shrimps 250 20 270 30 300
Lobster 270 30 300 50 350Commercial Category 1Vielle Rouge 140 10 150 50 200Vielle Laboue 140 10 150 30 180Geule Pave 140 10 150 30 180Capitaine / Dame Berri 140 10 150 10 160Mean 140 10 150 30 180Commercial Category 2Tuna & Others 100 10 110 20 130Bonite 100 10 110 20 130Becune 100 10 110 20 130Coordonier 100 10 110 20 130Mullet 100 10 110 20 120Congo 100 10 110 20 120Cateaux 100 10 110 20 120Caya 100 10 110 20 120Octopus 100 10 110 20 120Mean 100 10 110 20 120Commercial Category 3Madame Tombé 80 10 90 20 110Licorne 80 10 90 20 110Breton 80 10 90 20 110Rouget 80 10 90 20 110Mean 80 10 90 20 110MiscellaneousRays 60 10 70 20 90Other species 60 10 70 20 90Mean 60 10 70 20 90
PSP = Producer Sale Price at Fish Landing Station, TM = Trader / Middleman Margin
WSP = Wholesale / Distribution Price, RM = Retailer Margin, CSP = Consumer Sale Price

Appendix 3
70 Programme SmartFish Rapport SF/2012/18
APPENDIX 3 - FISHING BUSINESS MODEL Items Variable Notes / Data sourcesSALESMean catch per fishing dayMean PriceNumber of Fishing days per yearTOTAL ANNUAL REVENUEFIXED COSTSDepreciation (fishing boat + Engine)Interest payable on loans / advancesBoat & Engine repairs & maintenanceOther fixed cost TOTAL FIXED COSTSVARIABLE COSTS (excl. labour)Fishing gear repair / replacementFuel and LubricantsIceBaitsFood & ProvisionsMarketing Costs & othersTOTAL FISHING TRIPS COSTLABOUR COSTSShared Costs OR Crew SalaryANNUAL PROFIT
ABCD
EFGHI
JKLMNOP
QQ¹R
Intra-annual mean incl. lean & peak seasonsWeighted average mean PSP & fish species(Interviews & Secondary Surveys)(a x b x c)Actual Cost: F/boat , Engines & other AssetsIf any ( (Interviews and Secondary surveys) Contingent costs such as Insurance.. (e + f + g + h)
(Interviews & Secondary Surveys) -same as above - -same as above - -same as above - Not applicable Contingent costs / transport, communications...(j + k + l + m + n + o )(D – Q) / No of fishers (Agreed price x qty (Kg)D – (I + P + Q or Q¹)
Explanatory Notes
i) Total annual revenue (D) is presented in terms of CPFD (a), mean PSP (b) and number fishing days(c). These variables were determined by the fisheries statistics of the MOFR and complemented / cross checked by primary survey. Regional as wells as seasonal variations of landings and prices were taken into account.
ii) Fixed costs (I) are those costs that are incurred regularly, regardless of the fishing activities, i.e.:• Depreciation of fishing boat and engines and other assets (e);• Interest on loans & advances (f)• Fishing boat & Engine repairs and maintenance (g) • Other such costs incl. Insurance (h)
iii) Variable costs (Q) are costs that are related, directly or indirectly, to fishing activities, i.e.:• Fishing gear repair and replacement (j)• Fish trips costs incl. all direct costs of production and sale: - Fuel and lubricant (k) - ice flake (l) - Bait (m) - food and provisions (n) - marketing costs and others when appropriate (o)

Programme SmartFish Rapport SF/2012/18 71
Unit prices of inputs such as fuel, ice and so on are fairly standard in the country. Fuel consumption was learnt through the survey and was cross-checked by one-to-one interviews
iv) Labour cost (Q or Q¹) was structured in different ways according to the system in use by the fishing unit. The most common arrangements in Mauritius are:• Share system in which the boat owner and the crew take equal shares of the catch value after deduction trip costs (Q);• Payment of contracted price per kg for different grades of fish (Q¹) v) Annual profit of the fishing unit (R) is the gross revenue (d) , less all fixed costs, except depreciation (I), all variable costs (P) and labour costs (Q or Q¹ )
A fishing day usually starts at about 6 am to end at 1 pm and thus most lagoon and off-lagoon fishers spend 6 to 8 hours at sea.
vi) Fishing Trips: On an annual basis, a fishing boat undertakes 4 to 5 trips per week during the summer and 2 to 3 trips per week during winter that make 189 fishing days per year. The main cause of interruption of fishing activities is severe climatic conditions during winter and tropical depressions in summer.
The number of crews/fishers on a fishing boat depends on the fishery i.e. a basket and trap fishing boat will normally carry 2 fishers while it varies from 3 to 5 fishers for the hand line fishery. For the large net fishery, one fishing unit comprises 3 to 5 boats with a crew of 3 on each of them. For the purpose of the business model of fishing unit of the Large Net fishery consists of 3 boats and 10 fishers.
The most important value derived from the business model is the net daily income per fishing day and per calendar day that help to appraise the economic viability of the fishing activity.-

72 Programme SmartFish Rapport SF/2012/18
APPENDIX 4 – GRAPH I – REGISTERED FISHERS OPERATING IN LAGOON BY FLS - 2011
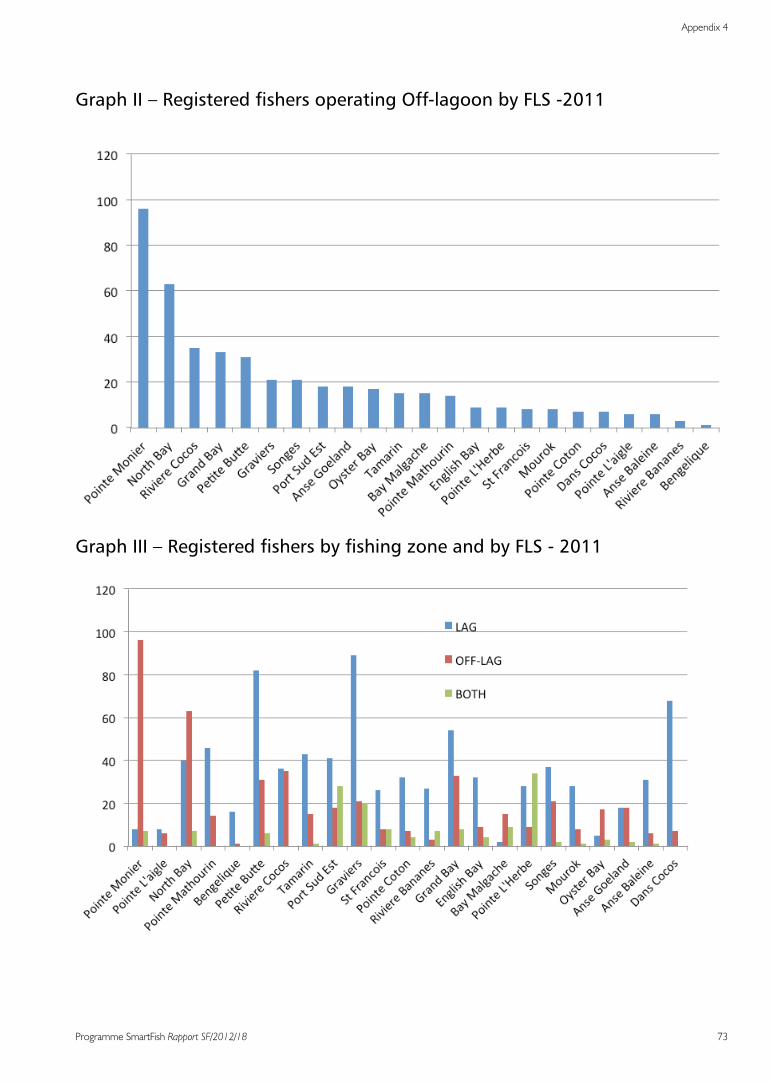
73Programme SmartFish Rapport SF/2012/18
Appendix 4
Graph II – Registered fishers operating Off-lagoon by FLS -2011
Graph III – Registered fishers by fishing zone and by FLS - 2011

74 Programme SmartFish Rapport SF/2012/18
Graph IV – Registered Male fishers by FLS - 2011
Graph V – Registered Female Fishers by FLS – 2011

75Programme SmartFish Rapport SF/2012/18
Appendix 4
Graph VI – Registered Male Fisher by Age Group -2011
Graph VII – Registered Female Fishers by Age Group – 2011

76 Programme SmartFish Rapport SF/2012/18
Graph VIII – Total Catch by fishing area (tonne) -2010
Graph IX – Catch Composition 2004-2010 (in tonnes)

77Programme SmartFish Rapport SF/2012/18
Appendix 4
Graph X – Export of seafood to Mauritius 2004-2008 (in tonnes)
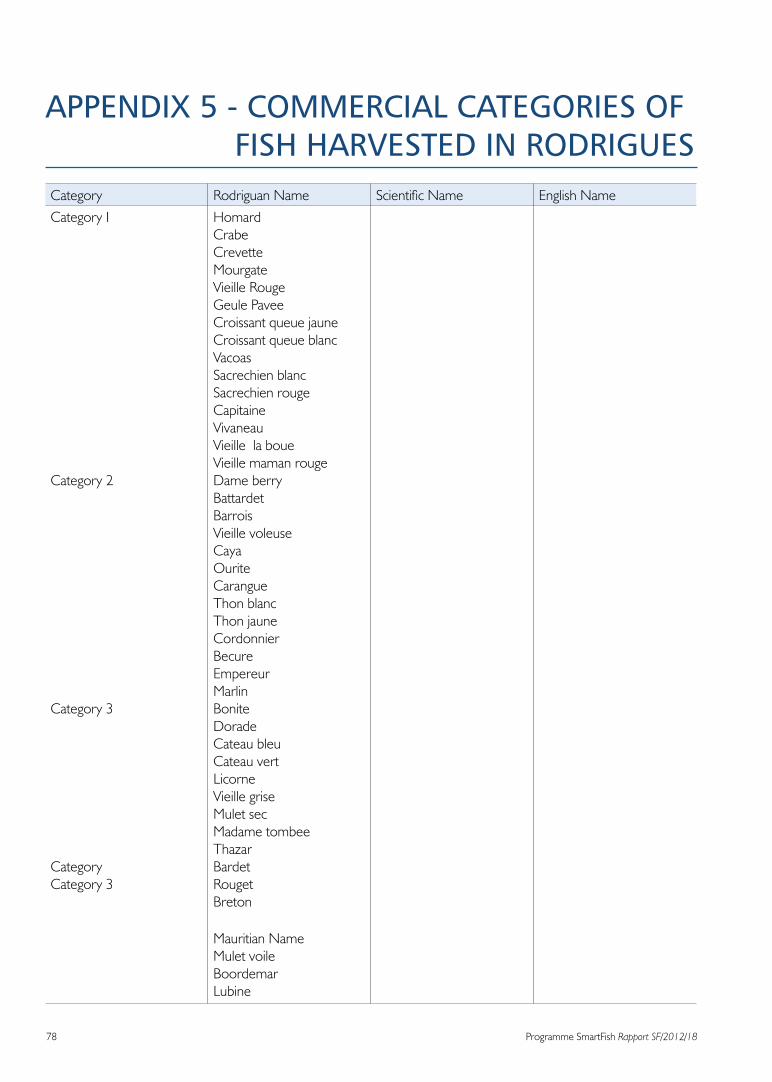
78 Programme SmartFish Rapport SF/2012/18
APPENDIX 5 - COMMERCIAL CATEGORIES OF FISH HARVESTED IN RODRIGUESCategory Rodriguan Name Scientific Name English NameCategory I
Category 2
Category 3
CategoryCategory 3
HomardCrabeCrevetteMourgateVieille RougeGeule Pavee Croissant queue jauneCroissant queue blancVacoasSacrechien blancSacrechien rougeCapitaineVivaneauVieille la boueVieille maman rougeDame berryBattardetBarroisVieille voleuseCayaOuriteCarangueThon blancThon jauneCordonnier BecureEmpereurMarlinBoniteDoradeCateau bleuCateau vertLicorneVieille griseMulet secMadame tombeeThazarBardetRougetBreton
Mauritian NameMulet voileBoordemarLubine

79Programme SmartFish Rapport SF/2012/18
Appendix 5
Misc. fish
CarandineChirrurgienPavillonBourseLionAiguilleSap-sapRequin

Appendix 6
80 Programme SmartFish Rapport SF/2012/18
APPENDIX 6 - LIST OF PERSONS CONTACTED
Name Position Oganisation / PlaceAdelah Mallele Reg. Fisherwoman BalladirouArchaya Ravane (fils) Technical officer Fisheries Training Instructor , Pointe
Monier.Aurelin Speville Leader Large Net Fishery / Port Sud estBotteveau J Favio Board Member Rodrigues General Fishing Co Ltd,
Pointe MonierCesar Jean Skipper/Off-lag fishery Rodrigues General Fishing Co Ltd, (.5
mt FRP boat)Claire J D Laval Reg Fisher Basket Trap Fishery / Port du Sud
Claudine Raboude Adm. Secretary Rodrigues General Fishing Co Ltd, Pointe Monier
Edourd Michel Registered Fisher SongesEdouard J Darkson Manager Rodrigues General Fishing Co Ltd,
Pointe MonierJean Laval Chansow Skipper Sport Fishery , Port Sud EstJean P Castor Registered Fisher GraviersJolicoeur Enumerator Fisheries Research and Training
Centre, Pointe Monier.Kong Wong Soo Director Solidarity Trading Co. Ltd, Port
MathurinLeopol J Steward Chairman Rodrigues General Fishing Co Ltd,
Pointe MonierM. Templin Officer-in-Chage Development Bank of Mauritius, Port
MathurinMariano Ravina Registered Fisher SongesMoostapha Jeetoo Office-In-Charge EPMU, Chief Commissioner OfficePaul Emilien Registered Fisher MouroukRaffaut Renoph Education Officer Shoals, Pointe MonierSylvio Perrine Scientific Officer Fisheries Research and Training
Centre, Pointe Monier.Zameer Trader / Octopus Port Sud-Est
81Programme SmartFish Rapport SF/2012/18
Appendix 7
APPENDIX 7 – REFERENCES
• Assessment of Current data for the Octopus Resource in Rodrigues – African Journal of Marine science presented by J Anderson, S. Perrine et al , 2010.
• Rodrigues Statistics Digest 2010 – Central Statistics Office
• Sustainable and Integrated Development Plan for Rodrigues, KPMG / UNDP , 2009
• Study of Fish Handling and Preservation in Mauritius and Rodrigues, HBL Appavoo & Associates, 2007
• Socio-economic Study of the Fishing Community – Case Study of Rodrigues , University of Mauritius, 2007
• Study on Fish Handling, Preservation and Marketing in Mauritius & Rodrigues, Appavoo & Associates, 2007
• Large Net Fishery Assessment, Shoal Rodrigues 2006
• Fish Handling, Processing and Marketing in Mauritius, FAO Project, 2005 .
• A handbook for Value Chain Research prepared for IDRC by Raphael Kapkinsky & al, 2000
• Traitement et Commercialisation des produits de pêche à Rodrigues, Max H Morel /FAO 1992
• Value Chain Analysis , M E Porter, Oxford Press Ltd. London , UK, 1980

Programme SmartFish Rapport SF/2012/1882

Programme SmartFish Rapport SF/2012/18 83
LIST OF PUBLICATIONS – LISTE DES PUBLICATIONSSmartFish Programme
1. Report of the Inception / Focal Point Meeting of the SmartFish Programme – Flic en Flac, Mauritius, 15th-16th June 2011. REPORT/RAPPORT: SF/2011/01. August/Août 2011. SmartFish Programme. Indian Ocean Commission (55 pages).
2. Report of the First Steering Committee Meeting of the SmartFish Programme – Flic en Flac, Mauritius,17th June 2011. REPORT/RAPPORT: SF/2011/02. August/Août 2011. SmartFish Programme Indian Ocean Commission (51 pages).
3. Rapport de la réunion de présentation du programme SmartFish aux points focaux – Flic en Flac, Ile Maurice, 15-16 juin 2011. REPORT/RAPPORT: SF/2011/03. August/Août 2011. SmartFish Programme. Indian Ocean Commission (55 pages).
4. Eco-Certification for the Tuna Industry, Technical Assistance for Implementation of a Regional Fisheries Strategy for ESA-IO (IRFS). REPORT/RAPPORT: SF/2011/04. May 2011. SmartFish Programme. Indian Ocean Commission (40 pages).
5. Regional Market Assessment (Supply and Demand). REPORT/RAPPORT: SF/2012/05. March/Mars 2012. SmartFish Programme. Indian Ocean Commission (264 pages).
6. Trade Assessment Study. REPORT/RAPPORT: SF/2012/06. March/Mars 2012. SmartFish Programme. Indian Ocean Commission (120 pages).
7. Gouvernance des Pêches Maritimes dans l’Ouest de l’Océan Indien. REPORT/RAPPORT: SF/2012/07. June/Juin 2012. SmartFish Programme. Indian Ocean Commission (101 pages).
8. Value Chain Assessment of the Artisanal Fisheries – Mauritius. REPORT/RAPPORT: SF/2012/08. June/Juin 2012. SmartFish Programme. Indian Ocean Commission (85 pages).
9. Kenya Fisheries Governance. REPORT/RAPPORT: SF/2012/09. June/Juin 2012. SmartFish Programme. Indian Ocean Commission (36 pages).
10. Training Needs Analysis – Quality and Hygiene: REPORT/RAPPORT: SF/2012/10. June/Juin 2012.SmartFish Programme. Indian Ocean Commission (95 pages).
11. A Review of Somalia’s & (Semi-Autonomous Regions) Fisheries Legislation and Management. REPORT RAPPORT: SF/2012/11. June/Juin 2012 SmartFish Programme. Indian Ocean Commission (49).
12. Assessment of IUU Activities On Lake Victoria. REPORT/RAPPORT: SF/2012/12. June/Juin 2012 SmartFish Programme. Indian Ocean Commission (130 pages).
13. Review Of The Legal Framework for the ESA-IO Region. REPORT/RAPPORT: SF/2012/13. June/Juin 2012 SmartFish Programme. Indian Ocean Commission (149 pages).
14. Comprehensive capacity review to implement effective MCS in the ESA-IO Region. REPORT/RAPPORT: SF/2012/14. June/Juin 2012 SmartFish Programme. Indian Ocean Commission (101 pages).

Programme SmartFish Rapport SF/2012/1884
15. Assessment of IUU Fishing in Lake Tanganyika. REPORT/RAPPORT: SF/2012/15. June/Juin 2012 SmartFish Programme. Indian Ocean Commission (52 pages).
16. Spirulina – A Livelihood and a Business Venture. REPORT/RAPPORT: SF/2012/16. SmartFish Programme. June/Juin 2012 Indian Ocean Commission (39 pages).
17. Diversification Study (Eco-Tourism and Recreational Fisheries). REPORT/RAPPORT: SF/2012/17. June/Juin 2012 SmartFish Programme. Indian Ocean Commission (76 pages).
18. Value Chain Analysis of Fisheries Sector for Rodrigues. REPORT/RAPPORT: SF/2012/18. June/Juin 2012 SmartFish Programme. Indian Ocean Commission (78 pages).

Indian Ocean Commission – SmartFish ProgramBlue Tower, 5th �oor, Institute Road - Ebène, MauritiusTél: (+230) 402 6100 Fax: (+230) 465 7933