Value Chain Analysis for Commercial Cassava Growing in NTT2007... · Table 1 Profile of NTT and the...
34
IFC SADI Agri Sectors Value Chain Analysis for Commercial Cassava Growing in NTT May 2007
-
Upload
truongphuc -
Category
Documents
-
view
217 -
download
0
Transcript of Value Chain Analysis for Commercial Cassava Growing in NTT2007... · Table 1 Profile of NTT and the...
IFC SADI Agri Sectors
Value Chain Analysis for
Commercial Cassava Growing in NTT
May 2007
Value chain analysis for SADI agri sectors Commercial Cassava Growing in NTT
Report Authors:
Nick Giera and Jock Struthers: Nimmo-Bell , Wellington and Hawkes Bay, New Zealand Disclaimer
Disclaimer While every effort has been made to ensure the accuracy of information in this report, no liability is accepted for errors of fact or opinion, or for any loss or damage resulting from reliance on, or the use of, the information it contains. This report is for the use of the International Finance Corporation (IFC) and is not to be disclosed to third parties without their consent.
Value Chain Analysis for SADI Agri sectors Commercial Cassava Growing in NTT
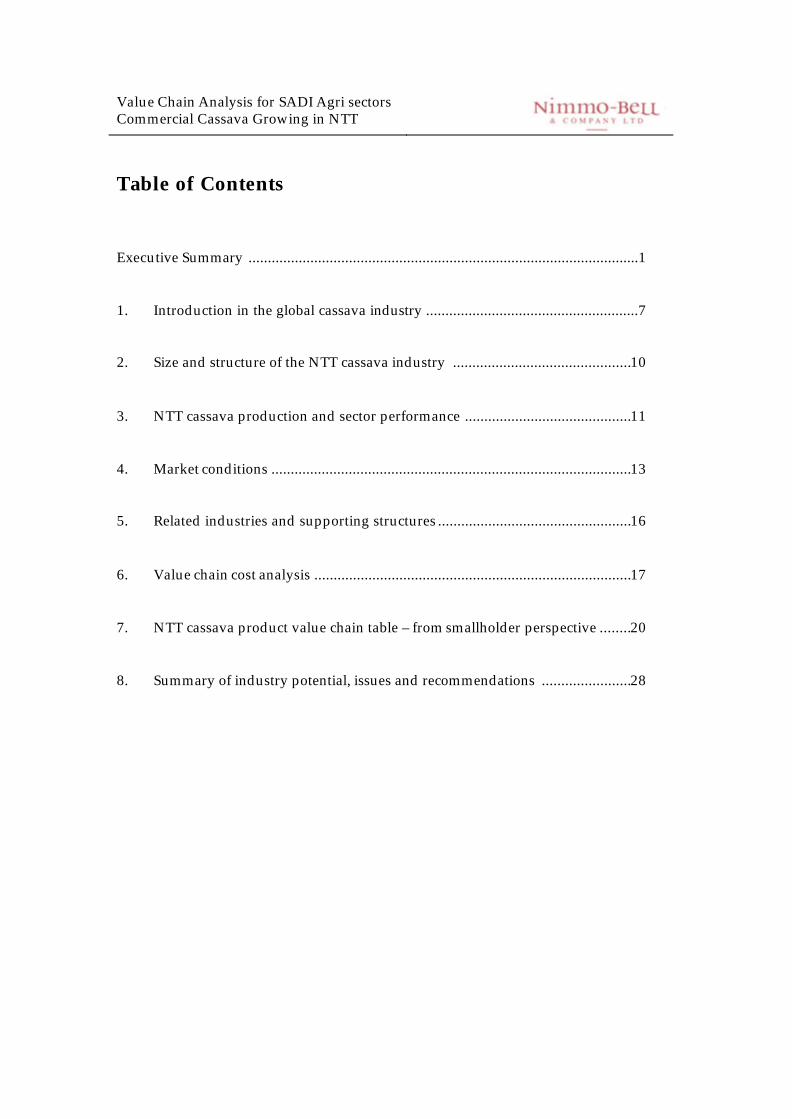
Table of Contents Executive Summary .....................................................................................................1 1. Introduction in the global cassava industry .......................................................7 2. Size and structure of the NTT cassava industry ..............................................10 3. NTT cassava production and sector performance ...........................................11 4. Market conditions .............................................................................................13 5. Related industries and supporting structures ..................................................16 6. Value chain cost analysis ..................................................................................17 7. NTT cassava product value chain table – from smallholder perspective ........20 8. Summary of industry potential, issues and recommendations .......................28
Value Chain Analysis for SADI Agri sectors Commercial Cassava Growing in NTT
__________________________________________________________________________________ 1
Executive Summary Summary of NTT Cassava Industry Potential, Issues and IFC TA Recommendations The interest shown by the major Chinese importer and the heads of agreement drawn up with the local government in West Manggarai to produce cassava chips for transportation by ship from Labuan Bajo to China (Guang Zi Port) would indicate that there is potential for increased commercial production of cassava in NTT. This agreement was established 2005. The project proposes is to grow cassava for chip production for later processing into bio-ethanol on an area of over 100,000 hectares in West Manggarai. A small pilot project of 1,000 ha has begun at Vol village, Lembor, West Manggarai. This site is in close proximity to the port at Labuan Bajo (one hour by road). Seed is currently being sourced from Surabaya and field research verifies that the region is well suited to growing cassava with large areas of unused arable land. The unused area of arable land at Lembor could potentially be developed into an area of over 50,000 hectares under the management of smallholders in the district. West Manggarai is a suitable district for developing such a project due to an existing supply base and traditional knowledge of basic cassava growing plus large areas of unused arable land suitable for cassava growing. The area may also be suitable for mechanization such as tractors for cultivation and harvest, although the economics of this need further investigation. Developing an area of cassava production in Flores is of particular interest to the IFC due to the potential smallholder benefits of developing integrated farming systems where cassava is used as a source of cash income and as a valuable feed source for cattle fattening. This approach to developing cassava production in Flores, and potentially other parts of NTT, also allows smallholders to diversify risk away from only one or two agricultural products. Industry Issues
• The potential for smallholder cassava production and NTT and the feasibility of a large-scale cassava growing project for bio ethanol production in Flores is still in an early stage of development. Field research and interviews with the local government and West Manggarai suggest that a full feasibility study on the district and market potential is required to manage the risk that exists for smallholders in growing large areas of cassava for bio-ethanol production.
• Initial field research indicates that cassava yields in NTT are comparable with other
regions of Indonesia. However, further work is required to understand whether NTT has comparative advantage in cassava production over other regions of Indonesia and whether there is a risk that the major buyer could reduce future buying operations.
Value Chain Analysis for SADI Agri sectors Commercial Cassava Growing in NTT
__________________________________________________________________________________ 2
• Like other agricultural commodities, smallholders producing cassava in NTT will
require adequate access to seasonal finance for basic agri-inputs. Such access does not currently exist and smallholders rely on informal forms of finance supplied by traders and intermediaries for other products.
• The proposed project will rely on Cassava chip purchases from a single large buyer
for processing in China. This buying situation creates considerable risk for smallholders and farmer groups investing in cassava production for chip production.
• Cassava chip production is not a traditional post harvest practice for smallholders in
NTT and will require extension to ensure that smallholders produce a quality product.
Recommendations for IFC TA The following points summarize the key recommendations made in the value chain analysis. The recommendations are made with a potential TA program to support the proposed cassava production project.
• Conduct research on the minimum average level of cash needed per household per year so that an integrated farming system to meet household cash requirements can be developed.
• Collaborate with ACIAR to undertake further research and trial improved high starch
varieties for specialist cassava production, including soil testing, best practice cultivation, weed and pest control, best practice harvest, drying and processing into chips.
• Collaborate with the local government DINAS, ACIAR and farmer groups to
establish a demonstration plot to encourage farmers to use best practice cassava growing techniques.
• A demonstration farm should also investigate the potential for farmers to increase
their overall cash income by utilizing cassava as a home consumption crop, cash crop from cassava chips production and also as a livestock feed for an integrated cattle farming/cropping system. The goal for a demonstration farm should be to achieve a minimum level of cash income per year from a range of crops from an average smallholding.
• Work with the ACIAR program and the major cassava chip processor to understand
cassava chip quality requirements and on-farm practices to meet these standards.
• Investigate other uses and markets for cassava chips once production has reached a critical mass to manage farmers’ marketing risks.
• Work with the local DINAS, farmer groups and village leaders to improve
smallholder access to on-farm research and information from other parts of Indonesia and incorporate this practice into the integrated cassava demonstration farm.
Value Chain Analysis for SADI Agri sectors Commercial Cassava Growing in NTT
__________________________________________________________________________________ 3
An Overview of Agribusiness in NTT
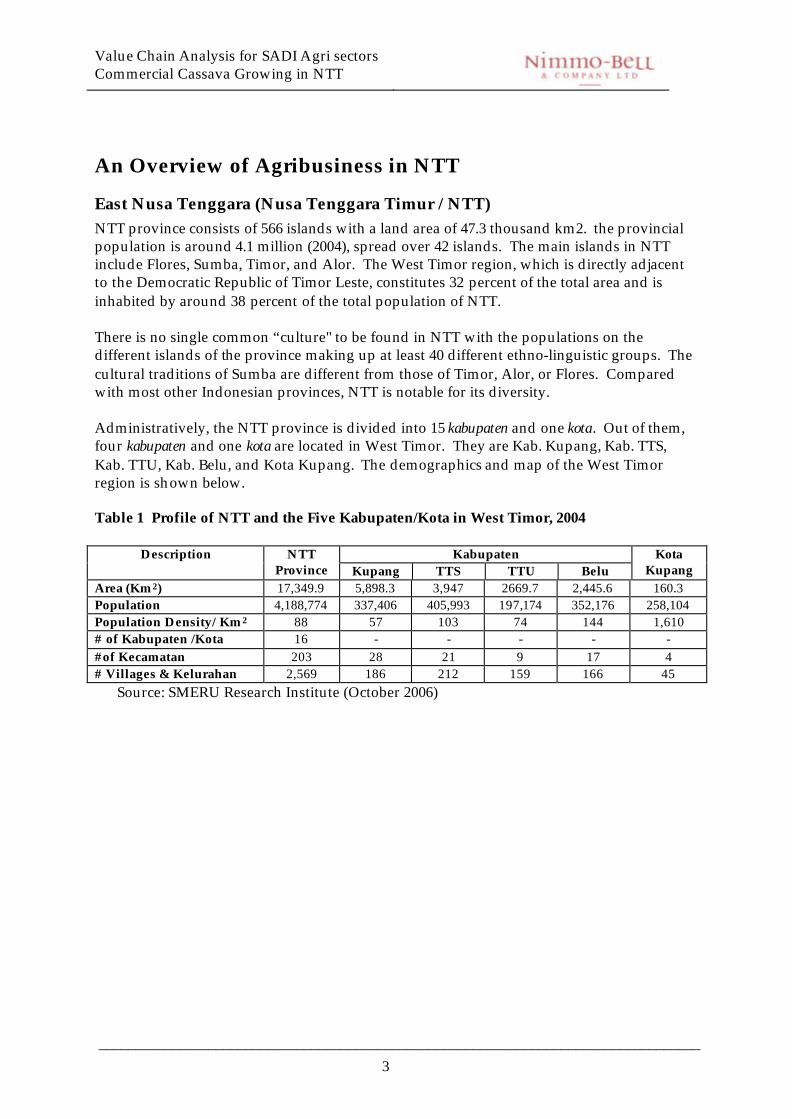
East Nusa Tenggara (Nusa Tenggara Timur / NTT) NTT province consists of 566 islands with a land area of 47.3 thousand km2. the provincial population is around 4.1 million (2004), spread over 42 islands. The main islands in NTT include Flores, Sumba, Timor, and Alor. The West Timor region, which is directly adjacent to the Democratic Republic of Timor Leste, constitutes 32 percent of the total area and is inhabited by around 38 percent of the total population of NTT. There is no single common “culture" to be found in NTT with the populations on the different islands of the province making up at least 40 different ethno-linguistic groups. The cultural traditions of Sumba are different from those of Timor, Alor, or Flores. Compared with most other Indonesian provinces, NTT is notable for its diversity. Administratively, the NTT province is divided into 15 kabupaten and one kota. Out of them, four kabupaten and one kota are located in West Timor. They are Kab. Kupang, Kab. TTS, Kab. TTU, Kab. Belu, and Kota Kupang. The demographics and map of the West Timor region is shown below. Table 1 Profile of NTT and the Five Kabupaten/Kota in West Timor, 2004
Kabupaten Description NTT Province Kupang TTS TTU Belu
Kota Kupang
Area (Km2) 17,349.9 5,898.3 3,947 2669.7 2,445.6 160.3 Population 4,188,774 337,406 405,993 197,174 352,176 258,104 Population Density/ Km2 88 57 103 74 144 1,610 # of Kabupaten /Kota 16 - - - - - #of Kecamatan 203 28 21 9 17 4 # Villages & Kelurahan 2,569 186 212 159 166 45 Source: SMERU Research Institute (October 2006)
Value Chain Analysis for SADI Agri sectors Commercial Cassava Growing in NTT
__________________________________________________________________________________ 4
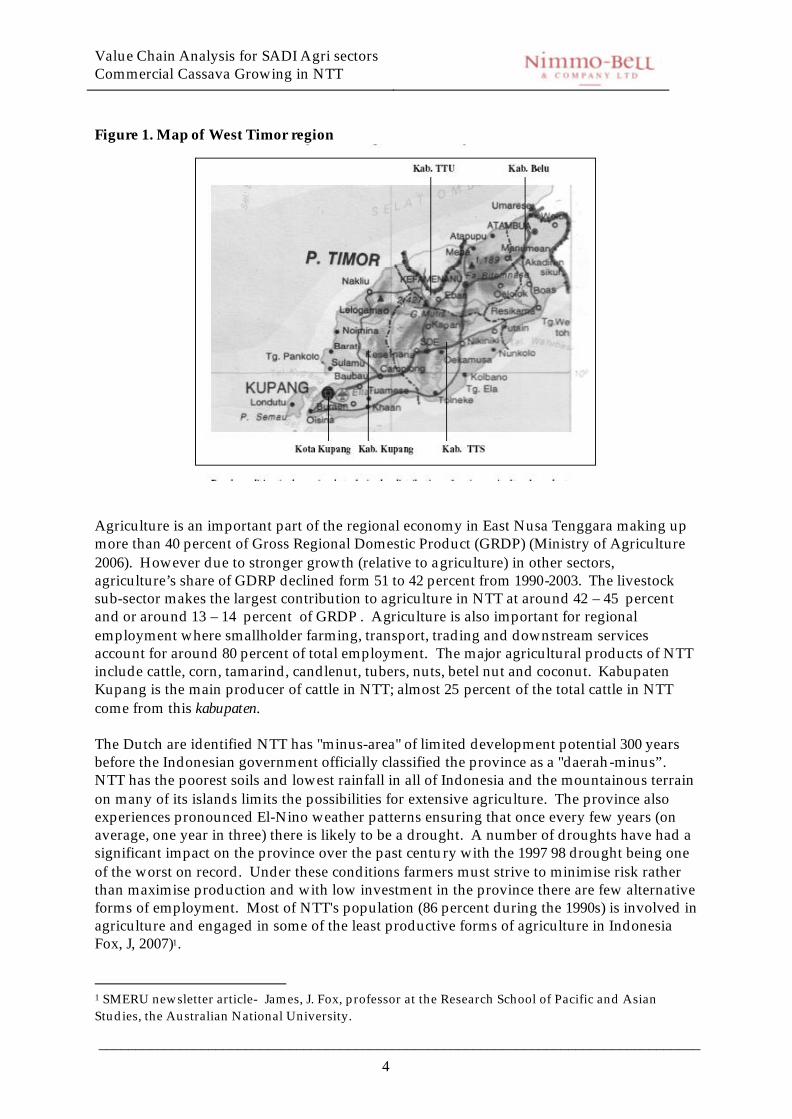
Figure 1. Map of West Timor region
Agriculture is an important part of the regional economy in East Nusa Tenggara making up more than 40 percent of Gross Regional Domestic Product (GRDP) (Ministry of Agriculture 2006). However due to stronger growth (relative to agriculture) in other sectors, agriculture’s share of GDRP declined form 51 to 42 percent from 1990-2003. The livestock sub-sector makes the largest contribution to agriculture in NTT at around 42 – 45 percent and or around 13 – 14 percent of GRDP . Agriculture is also important for regional employment where smallholder farming, transport, trading and downstream services account for around 80 percent of total employment. The major agricultural products of NTT include cattle, corn, tamarind, candlenut, tubers, nuts, betel nut and coconut. Kabupaten Kupang is the main producer of cattle in NTT; almost 25 percent of the total cattle in NTT come from this kabupaten. The Dutch are identified NTT has "minus-area" of limited development potential 300 years before the Indonesian government officially classified the province as a "daerah-minus”. NTT has the poorest soils and lowest rainfall in all of Indonesia and the mountainous terrain on many of its islands limits the possibilities for extensive agriculture. The province also experiences pronounced El-Nino weather patterns ensuring that once every few years (on average, one year in three) there is likely to be a drought. A number of droughts have had a significant impact on the province over the past century with the 1997 98 drought being one of the worst on record. Under these conditions farmers must strive to minimise risk rather than maximise production and with low investment in the province there are few alternative forms of employment. Most of NTT's population (86 percent during the 1990s) is involved in agriculture and engaged in some of the least productive forms of agriculture in Indonesia Fox, J, 2007)1. 1 SMERU newsletter article- James, J. Fox, professor at the Research School of Pacific and Asian Studies, the Australian National University.
Value Chain Analysis for SADI Agri sectors Commercial Cassava Growing in NTT
__________________________________________________________________________________ 5
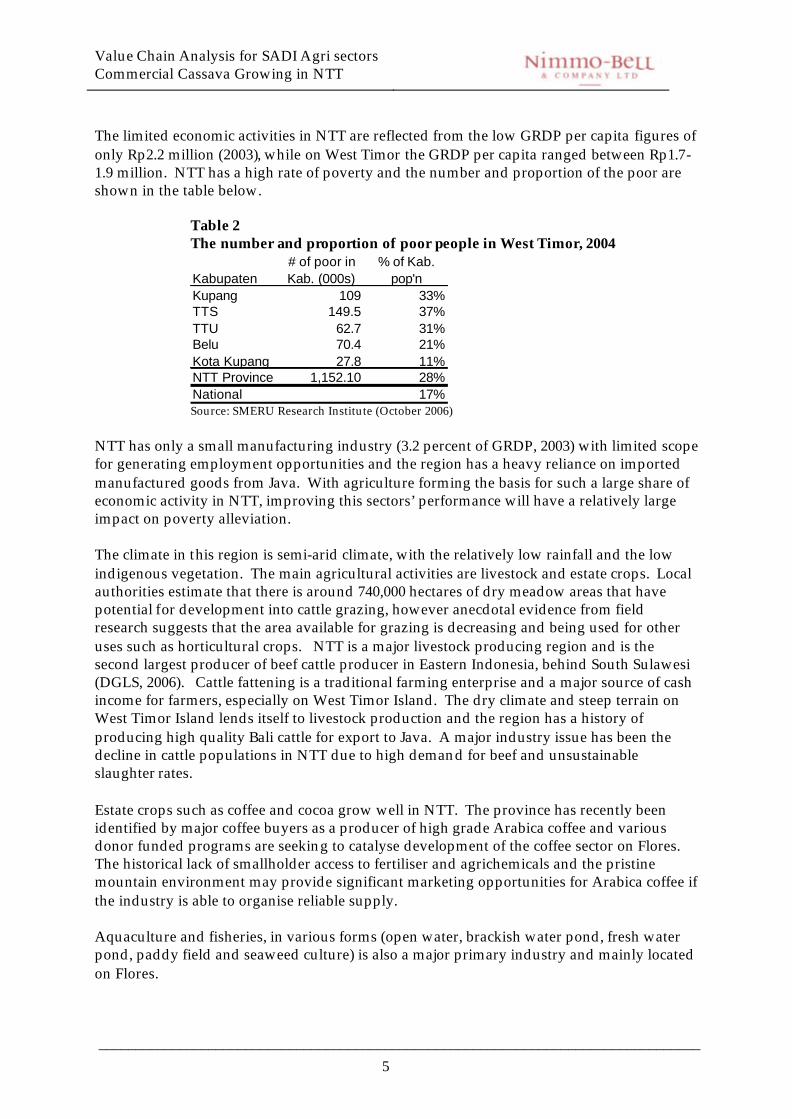
The limited economic activities in NTT are reflected from the low GRDP per capita figures of only Rp2.2 million (2003), while on West Timor the GRDP per capita ranged between Rp1.7-1.9 million. NTT has a high rate of poverty and the number and proportion of the poor are shown in the table below.
Table 2 The number and proportion of poor people in West Timor, 2004
Kabupaten# of poor in Kab. (000s)
% of Kab. pop'n
Kupang 109 33%TTS 149.5 37%TTU 62.7 31%Belu 70.4 21%Kota Kupang 27.8 11%NTT Province 1,152.10 28%National 17%
Source: SMERU Research Institute (October 2006) NTT has only a small manufacturing industry (3.2 percent of GRDP, 2003) with limited scope for generating employment opportunities and the region has a heavy reliance on imported manufactured goods from Java. With agriculture forming the basis for such a large share of economic activity in NTT, improving this sectors’ performance will have a relatively large impact on poverty alleviation. The climate in this region is semi-arid climate, with the relatively low rainfall and the low indigenous vegetation. The main agricultural activities are livestock and estate crops. Local authorities estimate that there is around 740,000 hectares of dry meadow areas that have potential for development into cattle grazing, however anecdotal evidence from field research suggests that the area available for grazing is decreasing and being used for other uses such as horticultural crops. NTT is a major livestock producing region and is the second largest producer of beef cattle producer in Eastern Indonesia, behind South Sulawesi (DGLS, 2006). Cattle fattening is a traditional farming enterprise and a major source of cash income for farmers, especially on West Timor Island. The dry climate and steep terrain on West Timor Island lends itself to livestock production and the region has a history of producing high quality Bali cattle for export to Java. A major industry issue has been the decline in cattle populations in NTT due to high demand for beef and unsustainable slaughter rates. Estate crops such as coffee and cocoa grow well in NTT. The province has recently been identified by major coffee buyers as a producer of high grade Arabica coffee and various donor funded programs are seeking to catalyse development of the coffee sector on Flores. The historical lack of smallholder access to fertiliser and agrichemicals and the pristine mountain environment may provide significant marketing opportunities for Arabica coffee if the industry is able to organise reliable supply. Aquaculture and fisheries, in various forms (open water, brackish water pond, fresh water pond, paddy field and seaweed culture) is also a major primary industry and mainly located on Flores.
Value Chain Analysis for SADI Agri sectors Commercial Cassava Growing in NTT
__________________________________________________________________________________ 6
With the province spread over 566 islands the cost of transport for NTT between the districts and with other parts of Indonesia is high and is a barrier to trade and further economic development The role of sea transportation is important for the province. A major problem is the poor condition of roads during periods of high rainfall. Official state data indicates that only 20 percent of the region’s regency and village roading are in good condition while other roads can be prone to slips and closure during heavy rain (BPS NTT, 2003). The limited size of local markets for the sale of agricultural products (due to very low levels of local consumer disposable income) highlights the importance of the region’s infrastructure for trade. In general, smallholders can capture the best returns by supplying export (including inter-regional export) markets. With high transportation costs and a lack of investment in NTT processing capabilities agricultural products for interregional and export market have been limited to traditional products e.g., cattle, cashew nut, sea weed and coffee. Other products such as banana, orange and avocado struggle to compete in Java markets due to the high cost of transportation. The fieldwork conducted for the VCA of priority commodities covered the areas of Kupang, and TTS Sub District for Beef Cattle, Ruteng, and Bajawa (Manggarai Sub District) for Coffee and West Manggarai Sub District for Cassava. Business Operating Environment in NTT The business operating environment in NTT, with respect to the level of informal and formal charges and taxes that farmers, middlemen and traders are required to pay was found to be a significant frustration of local business people although not necessarily a significant barrier to business. Further field research in this area is required to identify the impact that local charges have on the beef cattle industry. A recent study on the NTT business operating environment by the SMERU Institute found that the NTT cattle industry has been the subject of various regulations and excessive charges, starting at the village level. Most regulations include charges, such as: the certification of calves and a permit to export, retribusi to cover the administration cost, a quota limit on the number of cattle exported, and the SPK charge for issuing a permit for import and export, the services of slaughtering houses, the services of livestock markets, the services of livestock health checks, and quarantine. Other findings include that the presence of many middlemen and traders at the village and sub-district (kecamantan) levels has very limited impact on price information, since product prices are mostly determined by a small number of inter-island or large traders that form a monopsony market structure. The recent increase in the number of traders and exporters coming to Kupang, has not fully benefited farmers, due to the limited information on product location and excessive inspections that give rise to informal charges and uncertainty. The study found that the regional governments in NTT persist with imposing charges and regulations to agricultural products although the contribution of these charges to regional government revenues is very small. Some progress has been made on reducing regulations and charges for agricultural food crops, however less progress has been made in the beef cattle industry. The regulations and licensing have drawn out informal charges applied at various levels that distort the marketing of cattle (amongst other agricultural products) and in turn limit the opportunity of farmers to receive better prices and incomes.
Value Chain Analysis for SADI Agri sectors Commercial Cassava Growing in NTT
______________________________________________________________________________ 7
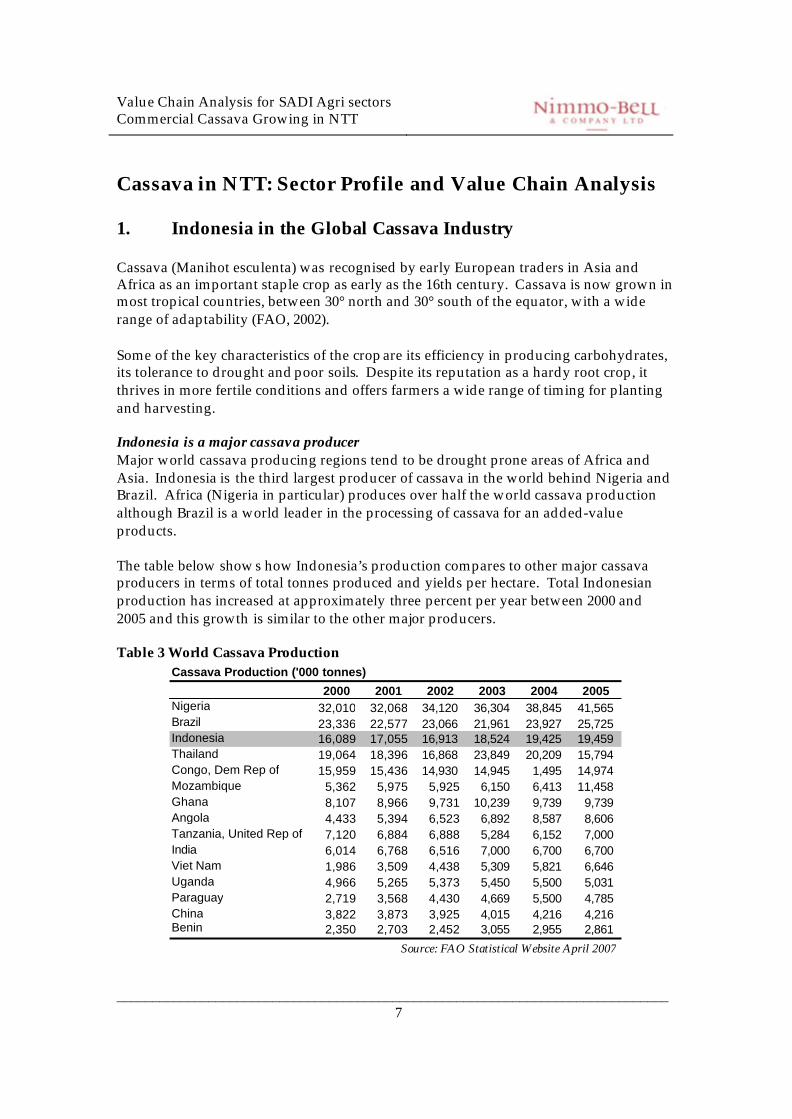
Cassava in NTT: Sector Profile and Value Chain Analysis 1. Indonesia in the Global Cassava Industry Cassava (Manihot esculenta) was recognised by early European traders in Asia and Africa as an important staple crop as early as the 16th century. Cassava is now grown in most tropical countries, between 30° north and 30° south of the equator, with a wide range of adaptability (FAO, 2002). Some of the key characteristics of the crop are its efficiency in producing carbohydrates, its tolerance to drought and poor soils. Despite its reputation as a hardy root crop, it thrives in more fertile conditions and offers farmers a wide range of timing for planting and harvesting. Indonesia is a major cassava producer Major world cassava producing regions tend to be drought prone areas of Africa and Asia. Indonesia is the third largest producer of cassava in the world behind Nigeria and Brazil. Africa (Nigeria in particular) produces over half the world cassava production although Brazil is a world leader in the processing of cassava for an added-value products. The table below shows how Indonesia’s production compares to other major cassava producers in terms of total tonnes produced and yields per hectare. Total Indonesian production has increased at approximately three percent per year between 2000 and 2005 and this growth is similar to the other major producers. Table 3 World Cassava Production
2000 2001 2002 2003 2004 2005Nigeria 32,010 32,068 34,120 36,304 38,845 41,565 Brazil 23,336 22,577 23,066 21,961 23,927 25,725 Indonesia 16,089 17,055 16,913 18,524 19,425 19,459 Thailand 19,064 18,396 16,868 23,849 20,209 15,794 Congo, Dem Rep of 15,959 15,436 14,930 14,945 1,495 14,974 Mozambique 5,362 5,975 5,925 6,150 6,413 11,458 Ghana 8,107 8,966 9,731 10,239 9,739 9,739 Angola 4,433 5,394 6,523 6,892 8,587 8,606 Tanzania, United Rep of 7,120 6,884 6,888 5,284 6,152 7,000 India 6,014 6,768 6,516 7,000 6,700 6,700 Viet Nam 1,986 3,509 4,438 5,309 5,821 6,646 Uganda 4,966 5,265 5,373 5,450 5,500 5,031 Paraguay 2,719 3,568 4,430 4,669 5,500 4,785 China 3,822 3,873 3,925 4,015 4,216 4,216 Benin 2,350 2,703 2,452 3,055 2,955 2,861
Cassava Production ('000 tonnes)
Source: FAO Statistical Website April 2007
Value Chain Analysis for SADI Agri sectors Commercial Cassava Growing in NTT
______________________________________________________________________________ 8
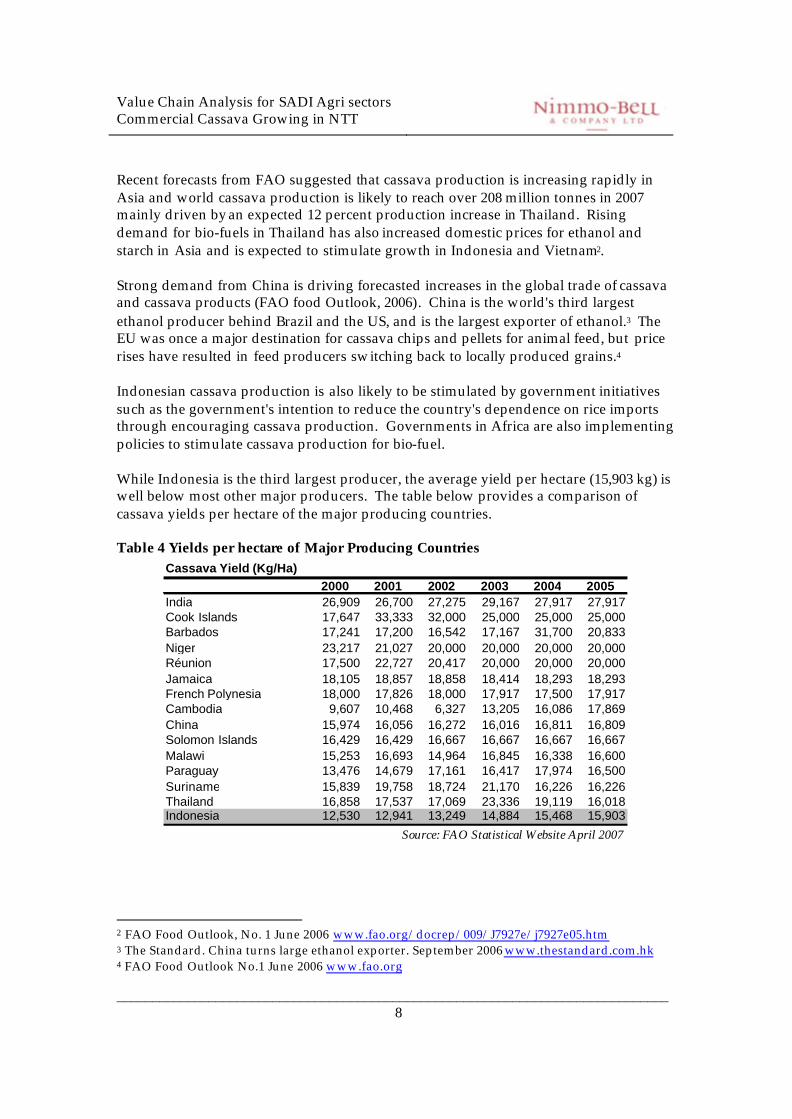
Recent forecasts from FAO suggested that cassava production is increasing rapidly in Asia and world cassava production is likely to reach over 208 million tonnes in 2007 mainly driven by an expected 12 percent production increase in Thailand. Rising demand for bio-fuels in Thailand has also increased domestic prices for ethanol and starch in Asia and is expected to stimulate growth in Indonesia and Vietnam2. Strong demand from China is driving forecasted increases in the global trade of cassava and cassava products (FAO food Outlook, 2006). China is the world's third largest ethanol producer behind Brazil and the US, and is the largest exporter of ethanol.3 The EU was once a major destination for cassava chips and pellets for animal feed, but price rises have resulted in feed producers switching back to locally produced grains.4 Indonesian cassava production is also likely to be stimulated by government initiatives such as the government's intention to reduce the country's dependence on rice imports through encouraging cassava production. Governments in Africa are also implementing policies to stimulate cassava production for bio-fuel. While Indonesia is the third largest producer, the average yield per hectare (15,903 kg) is well below most other major producers. The table below provides a comparison of cassava yields per hectare of the major producing countries. Table 4 Yields per hectare of Major Producing Countries
2000 2001 2002 2003 2004 2005India 26,909 26,700 27,275 29,167 27,917 27,917Cook Islands 17,647 33,333 32,000 25,000 25,000 25,000Barbados 17,241 17,200 16,542 17,167 31,700 20,833Niger 23,217 21,027 20,000 20,000 20,000 20,000Réunion 17,500 22,727 20,417 20,000 20,000 20,000Jamaica 18,105 18,857 18,858 18,414 18,293 18,293French Polynesia 18,000 17,826 18,000 17,917 17,500 17,917Cambodia 9,607 10,468 6,327 13,205 16,086 17,869China 15,974 16,056 16,272 16,016 16,811 16,809Solomon Islands 16,429 16,429 16,667 16,667 16,667 16,667Malawi 15,253 16,693 14,964 16,845 16,338 16,600Paraguay 13,476 14,679 17,161 16,417 17,974 16,500Suriname 15,839 19,758 18,724 21,170 16,226 16,226Thailand 16,858 17,537 17,069 23,336 19,119 16,018Indonesia 12,530 12,941 13,249 14,884 15,468 15,903
Cassava Yield (Kg/Ha)
Source: FAO Statistical Website April 2007
2 FAO Food Outlook, No. 1 June 2006 www.fao.org/docrep/009/J7927e/j7927e05.htm 3 The Standard. China turns large ethanol exporter. September 2006 www.thestandard.com.hk 4 FAO Food Outlook No.1 June 2006 www.fao.org
Value Chain Analysis for SADI Agri sectors Commercial Cassava Growing in NTT
______________________________________________________________________________ 9
Uses for cassava Cassava roots and leaves are suitable for human consumption although the consumption is mainly restricted to developing countries as a cheap source of carbohydrate (FAO, 2002). A typical cassava root is made up of moisture (70%), starch (24%), fibre (2%), protein (1%) and other nutrients (3%), while the cassava leaves contain protein and minerals. Some cassava roots contain large amounts of cyanohydrin (containing cyanide) and giving the root a bitter taste. Cultivars are classified as sweet or bitter depending on their cyanide contents, with the bitter variety unsuitable for human consumption unless properly treated. Bitter varieties are especially suitable for industrial and feed purposes, because of their higher starch content, while sweet varieties are generally preferred for consumption5. As a source of carbohydrate, cassava competes with grains such as corn and maize for stockfeed, rice and wheat flour for food staples, and sugarcane and corn for ethanol production. One main weakness with cassava for livestock feed is that products can be of variable nutritional quality compared to grain products.6 In 1994 about one fourth of world cassava production was estimated to be used as a feed ingredient for pork, poultry, cattle and fish farming (FAO, 2002) fed directly or indirectly through their incorporation into compound feeds. In Africa and Asia, only six percent of cassava production is fed to livestock, while in Latin America and the Caribbean (Brazil and Paraguay) the figure is closer to 50 percent. Cassava is also an important livestock feed ingredient in the European Union with the largest markets for cassava feed products being the Netherlands, Belgium, Germany, Spain and Portugal. Starch is the main product of cassava and can be used as a raw material for a wide range of food products and industrial goods, including paper, cardboard, textile, plywood, glue, alcohol pharmaceuticals and rubber. Globally, cassava is the fourth leading source of starch, after maize, wheat and potato. Four to five tonnes of roots are normally required to produce one tonne of cassava starch although this ratio can vary depending on the cassava quality. Cassava for bio-fuel production Global ethanol production more than doubled between 2000 and 2005 and there is now more interest in cassava as a source of starch for ethanol production.7 In Brazil, sugar cane is a major bio-energy crop and has made the country a world leader in bio-ethanol production, while cassava based ethanol is widely used to replace additives in petrol. Cassava has the potential to become a substitute for sugarcane and maize because of its high yields of starch with an overall starch efficiency rate of 32 percent.
5 FAO. The World Cassava Economy. 2000. www.fao.org 6 The Global Cassava Strategy www.fao.org/docrep/006/y0169e/y0169e04.htm 7 Bio-fuels for Transportation: Selected Trends and Facts. June 7, 2006. Worldwatch Institute
Value Chain Analysis for SADI Agri sectors Commercial Cassava Growing in NTT
______________________________________________________________________________ 10
Further research is required to develop cultivars with different starch compositions (Univ. Helsingiensis, 2007) and several projects are underway in Brazil, Thailand, China and Indonesia to develop cassava production capacity and ethanol processing plants. Some governments are also introducing policies to increase the use of bio-fuel to reduce greenhouse gas emissions. Indonesia is one of these countries investing in bio-fuel production capacity. In January 2007, 59 energy firms and institutions made preliminary commitments to invest US $12.4 billion in the renewable energy sector (Jakarta Post, 2007). The largest investment will come from China's energy firm CNOOC, which will partner with Sinar Mas Agro Resources and Technology and Hong Kong Energy to invest a total of US$5.5 billion. These investments are focused on the use of palm oil as a bio-fuel, however the Sugar Group would start producing ethanol from sugarcane in March and Medco Bioethanol will build an ethanol industry in Lampung based on cassava with a total investment of US$40million, and with a production capacity of 60 million litres of ethanol per year (Kompas, 2007). 2. Size and Structure of the NTT Cassava Industry Cassava in Indonesia tends to be grown in rain fed, intercropped farming systems. This is the main cropping pattern found in NTT. As noted cassava can adapt to poor soils, is resistant to drought, is an easy care crop to grow and is an important source of carbohydrate for smallholder producers in the NTT. These favourable characteristics have encouraged small holder farmers to plant cassava. Cassava is usually intercropped with grain and legumes (such as peanuts) rather than grown in pure stands. The NTT cassava industry is made up of a large number of smallholder farmers Data from local DINAS offices indicate that there were approximately 390,000 smallholders (farming households) growing cassava in the NTT district (Agriculture Census) in 2003 and predominantly in an intercropped system with other staple foods such as corn, beans, sweet potato, and livestock feed and horticulture crops. Cassava is predominantly consumed as fresh roots although mature cassava can be dried and used for cattle feed. NTT cassava industry requires low inputs When farmed in an intercropped system cassava is a low input crop for smallholders, only requiring cassava stems for replanting. Cassava is usually grown without any forms of fertiliser (apart from cattle manure) and smallholders are able to harvest cassava over a wide period depending on needs and intended uses. Commercial cassava growing in NTT is undertaken in a very limited way and the main purpose of the IFC SADI field research was to investigate the potential for commercial cassava (for use in bio-ethanol production) in the West Manggarai district. This potential is based on a heads of agreement drawn up in 2005 between the local
Value Chain Analysis for SADI Agri sectors Commercial Cassava Growing in NTT
______________________________________________________________________________ 11
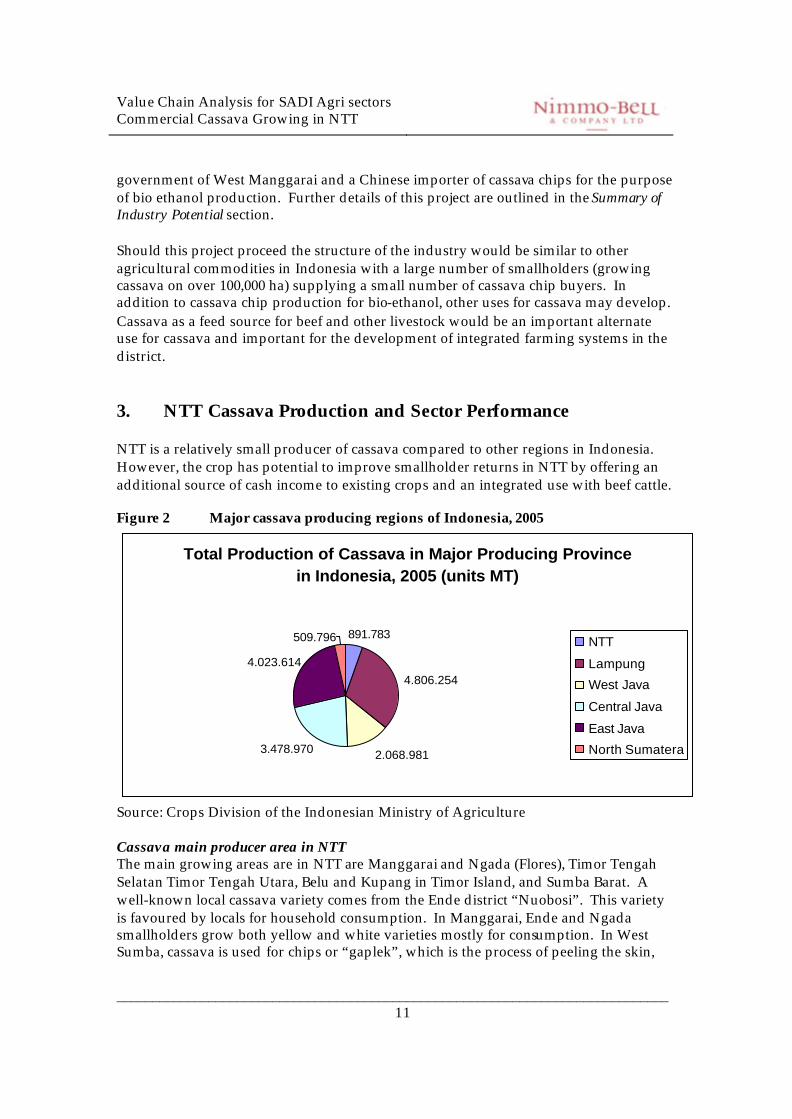
government of West Manggarai and a Chinese importer of cassava chips for the purpose of bio ethanol production. Further details of this project are outlined in the Summary of Industry Potential section. Should this project proceed the structure of the industry would be similar to other agricultural commodities in Indonesia with a large number of smallholders (growing cassava on over 100,000 ha) supplying a small number of cassava chip buyers. In addition to cassava chip production for bio-ethanol, other uses for cassava may develop. Cassava as a feed source for beef and other livestock would be an important alternate use for cassava and important for the development of integrated farming systems in the district. 3. NTT Cassava Production and Sector Performance NTT is a relatively small producer of cassava compared to other regions in Indonesia. However, the crop has potential to improve smallholder returns in NTT by offering an additional source of cash income to existing crops and an integrated use with beef cattle. Figure 2 Major cassava producing regions of Indonesia, 2005
Total Production of Cassava in Major Producing Province in Indonesia, 2005 (units MT)
891.783
4.806.254
2.068.9813.478.970
4.023.614
509.796 NTT
Lampung
West Java
Central Java
East Java
North Sumatera
Source: Crops Division of the Indonesian Ministry of Agriculture Cassava main producer area in NTT The main growing areas are in NTT are Manggarai and Ngada (Flores), Timor Tengah Selatan Timor Tengah Utara, Belu and Kupang in Timor Island, and Sumba Barat. A well-known local cassava variety comes from the Ende district “Nuobosi”. This variety is favoured by locals for household consumption. In Manggarai, Ende and Ngada smallholders grow both yellow and white varieties mostly for consumption. In West Sumba, cassava is used for chips or “gaplek”, which is the process of peeling the skin,
Value Chain Analysis for SADI Agri sectors Commercial Cassava Growing in NTT
______________________________________________________________________________ 12
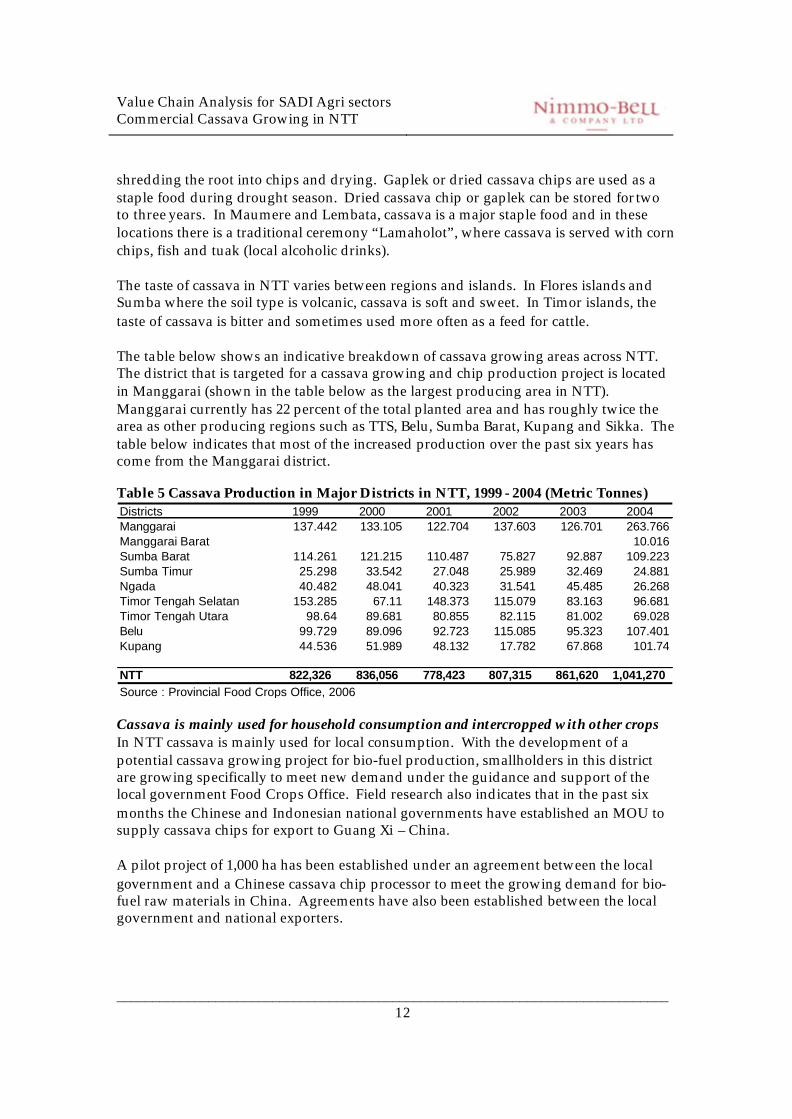
shredding the root into chips and drying. Gaplek or dried cassava chips are used as a staple food during drought season. Dried cassava chip or gaplek can be stored for two to three years. In Maumere and Lembata, cassava is a major staple food and in these locations there is a traditional ceremony “Lamaholot”, where cassava is served with corn chips, fish and tuak (local alcoholic drinks). The taste of cassava in NTT varies between regions and islands. In Flores islands and Sumba where the soil type is volcanic, cassava is soft and sweet. In Timor islands, the taste of cassava is bitter and sometimes used more often as a feed for cattle. The table below shows an indicative breakdown of cassava growing areas across NTT. The district that is targeted for a cassava growing and chip production project is located in Manggarai (shown in the table below as the largest producing area in NTT). Manggarai currently has 22 percent of the total planted area and has roughly twice the area as other producing regions such as TTS, Belu, Sumba Barat, Kupang and Sikka. The table below indicates that most of the increased production over the past six years has come from the Manggarai district. Table 5 Cassava Production in Major Districts in NTT, 1999 - 2004 (Metric Tonnes) Districts 1999 2000 2001 2002 2003 2004Manggarai 137.442 133.105 122.704 137.603 126.701 263.766Manggarai Barat 10.016Sumba Barat 114.261 121.215 110.487 75.827 92.887 109.223Sumba Timur 25.298 33.542 27.048 25.989 32.469 24.881Ngada 40.482 48.041 40.323 31.541 45.485 26.268Timor Tengah Selatan 153.285 67.11 148.373 115.079 83.163 96.681Timor Tengah Utara 98.64 89.681 80.855 82.115 81.002 69.028Belu 99.729 89.096 92.723 115.085 95.323 107.401Kupang 44.536 51.989 48.132 17.782 67.868 101.74
NTT 822,326 836,056 778,423 807,315 861,620 1,041,270 Source : Provincial Food Crops Office, 2006 Cassava is mainly used for household consumption and intercropped with other crops In NTT cassava is mainly used for local consumption. With the development of a potential cassava growing project for bio-fuel production, smallholders in this district are growing specifically to meet new demand under the guidance and support of the local government Food Crops Office. Field research also indicates that in the past six months the Chinese and Indonesian national governments have established an MOU to supply cassava chips for export to Guang Xi – China. A pilot project of 1,000 ha has been established under an agreement between the local government and a Chinese cassava chip processor to meet the growing demand for bio-fuel raw materials in China. Agreements have also been established between the local government and national exporters.
Value Chain Analysis for SADI Agri sectors Commercial Cassava Growing in NTT
______________________________________________________________________________ 13
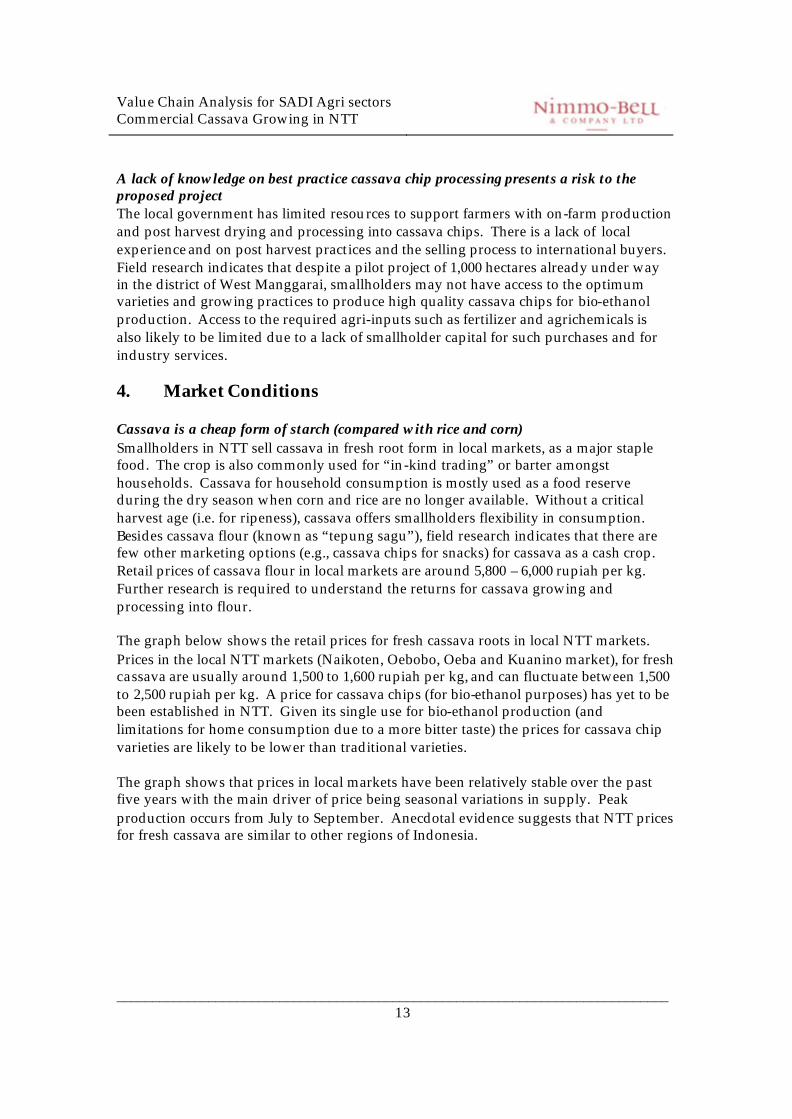
A lack of knowledge on best practice cassava chip processing presents a risk to the proposed project The local government has limited resources to support farmers with on-farm production and post harvest drying and processing into cassava chips. There is a lack of local experience and on post harvest practices and the selling process to international buyers. Field research indicates that despite a pilot project of 1,000 hectares already under way in the district of West Manggarai, smallholders may not have access to the optimum varieties and growing practices to produce high quality cassava chips for bio-ethanol production. Access to the required agri-inputs such as fertilizer and agrichemicals is also likely to be limited due to a lack of smallholder capital for such purchases and for industry services. 4. Market Conditions Cassava is a cheap form of starch (compared with rice and corn) Smallholders in NTT sell cassava in fresh root form in local markets, as a major staple food. The crop is also commonly used for “in-kind trading” or barter amongst households. Cassava for household consumption is mostly used as a food reserve during the dry season when corn and rice are no longer available. Without a critical harvest age (i.e. for ripeness), cassava offers smallholders flexibility in consumption. Besides cassava flour (known as “tepung sagu”), field research indicates that there are few other marketing options (e.g., cassava chips for snacks) for cassava as a cash crop. Retail prices of cassava flour in local markets are around 5,800 – 6,000 rupiah per kg. Further research is required to understand the returns for cassava growing and processing into flour. The graph below shows the retail prices for fresh cassava roots in local NTT markets. Prices in the local NTT markets (Naikoten, Oebobo, Oeba and Kuanino market), for fresh cassava are usually around 1,500 to 1,600 rupiah per kg, and can fluctuate between 1,500 to 2,500 rupiah per kg. A price for cassava chips (for bio-ethanol purposes) has yet to be been established in NTT. Given its single use for bio-ethanol production (and limitations for home consumption due to a more bitter taste) the prices for cassava chip varieties are likely to be lower than traditional varieties. The graph shows that prices in local markets have been relatively stable over the past five years with the main driver of price being seasonal variations in supply. Peak production occurs from July to September. Anecdotal evidence suggests that NTT prices for fresh cassava are similar to other regions of Indonesia.
Value Chain Analysis for SADI Agri sectors Commercial Cassava Growing in NTT
______________________________________________________________________________ 14
Figure 3 Local Market Retail Prices of Fresh Cassava
Retail Prices of Fresh Cassava Roots in the Local Market in NTT
2003 - 2007
0
500
1000
1500
2000
2500
1 2 3 4 5 6 7 8 9 10 11 12
month
Rp/
kg
2003 2004 2005 2006 2007
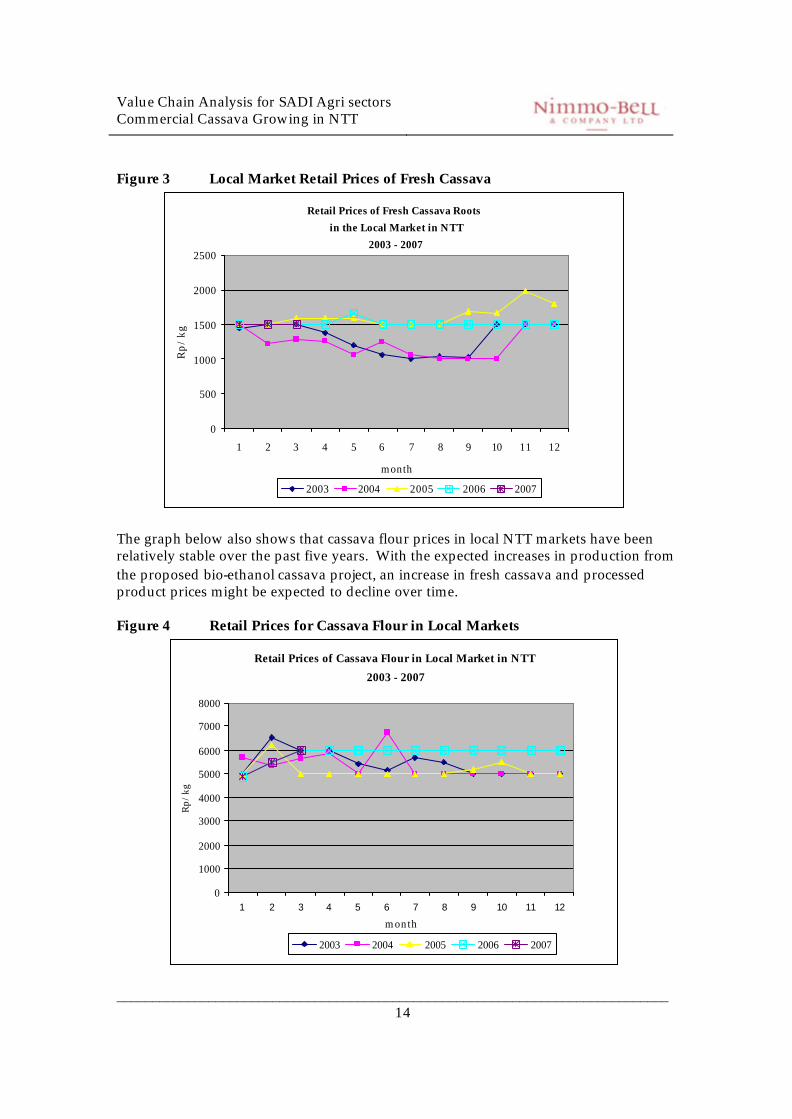
The graph below also shows that cassava flour prices in local NTT markets have been relatively stable over the past five years. With the expected increases in production from the proposed bio-ethanol cassava project, an increase in fresh cassava and processed product prices might be expected to decline over time. Figure 4 Retail Prices for Cassava Flour in Local Markets
Retail Prices of Cassava Flour in Local Market in NTT
2003 - 2007
0
1000
2000
3000
4000
5000
6000
7000
8000
1 2 3 4 5 6 7 8 9 10 11 12
month
Rp/
kg
2003 2004 2005 2006 2007
Value Chain Analysis for SADI Agri sectors Commercial Cassava Growing in NTT
______________________________________________________________________________ 15
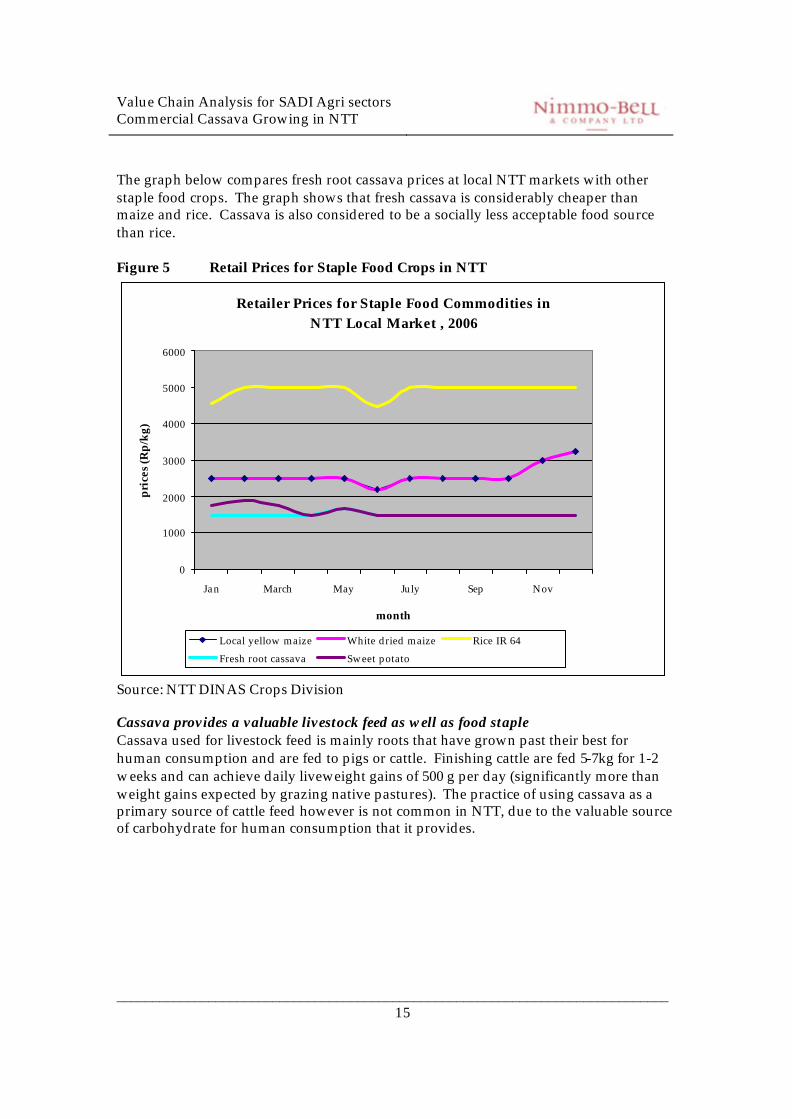
The graph below compares fresh root cassava prices at local NTT markets with other staple food crops. The graph shows that fresh cassava is considerably cheaper than maize and rice. Cassava is also considered to be a socially less acceptable food source than rice. Figure 5 Retail Prices for Staple Food Crops in NTT
Retailer Prices for Staple Food Commodities in NTT Local Market , 2006
0
1000
2000
3000
4000
5000
6000
Jan March May July Sep Nov
month
pric
es (R
p/kg
)
Local yellow maize White dried maize Rice IR 64
Fresh root cassava Sweet potato
Source: NTT DINAS Crops Division Cassava provides a valuable livestock feed as well as food staple Cassava used for livestock feed is mainly roots that have grown past their best for human consumption and are fed to pigs or cattle. Finishing cattle are fed 5-7kg for 1-2 weeks and can achieve daily liveweight gains of 500 g per day (significantly more than weight gains expected by grazing native pastures). The practice of using cassava as a primary source of cattle feed however is not common in NTT, due to the valuable source of carbohydrate for human consumption that it provides.
Value Chain Analysis for SADI Agri sectors Commercial Cassava Growing in NTT
______________________________________________________________________________ 16
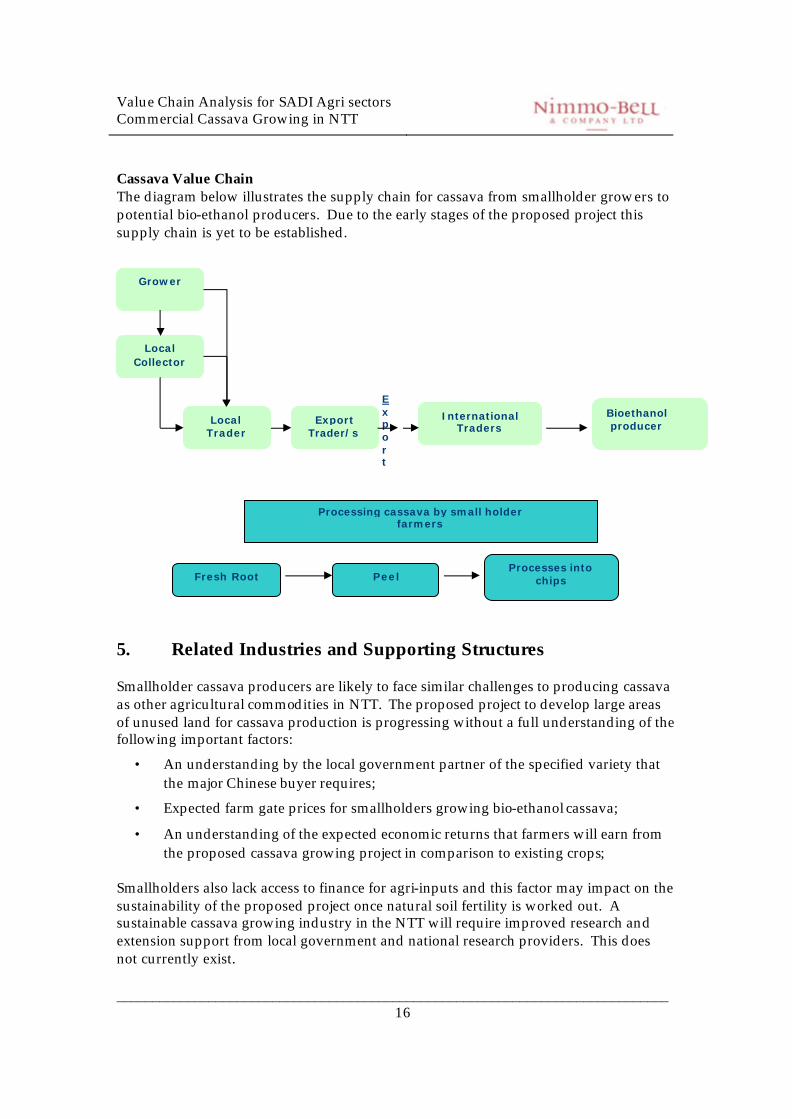
Cassava Value Chain The diagram below illustrates the supply chain for cassava from smallholder growers to potential bio-ethanol producers. Due to the early stages of the proposed project this supply chain is yet to be established.
5. Related Industries and Supporting Structures Smallholder cassava producers are likely to face similar challenges to producing cassava as other agricultural commodities in NTT. The proposed project to develop large areas of unused land for cassava production is progressing without a full understanding of the following important factors:
• An understanding by the local government partner of the specified variety that the major Chinese buyer requires;
• Expected farm gate prices for smallholders growing bio-ethanol cassava;
• An understanding of the expected economic returns that farmers will earn from the proposed cassava growing project in comparison to existing crops;
Smallholders also lack access to finance for agri-inputs and this factor may impact on the sustainability of the proposed project once natural soil fertility is worked out. A sustainable cassava growing industry in the NTT will require improved research and extension support from local government and national research providers. This does not currently exist.
Grower
Local Collector
Local Trader
Export Trader/s
International Traders
Export
Fresh Root Peel Processes into
chips
Processing cassava by small holder farmers
Bioethanol producer
Value Chain Analysis for SADI Agri sectors Commercial Cassava Growing in NTT
______________________________________________________________________________ 17
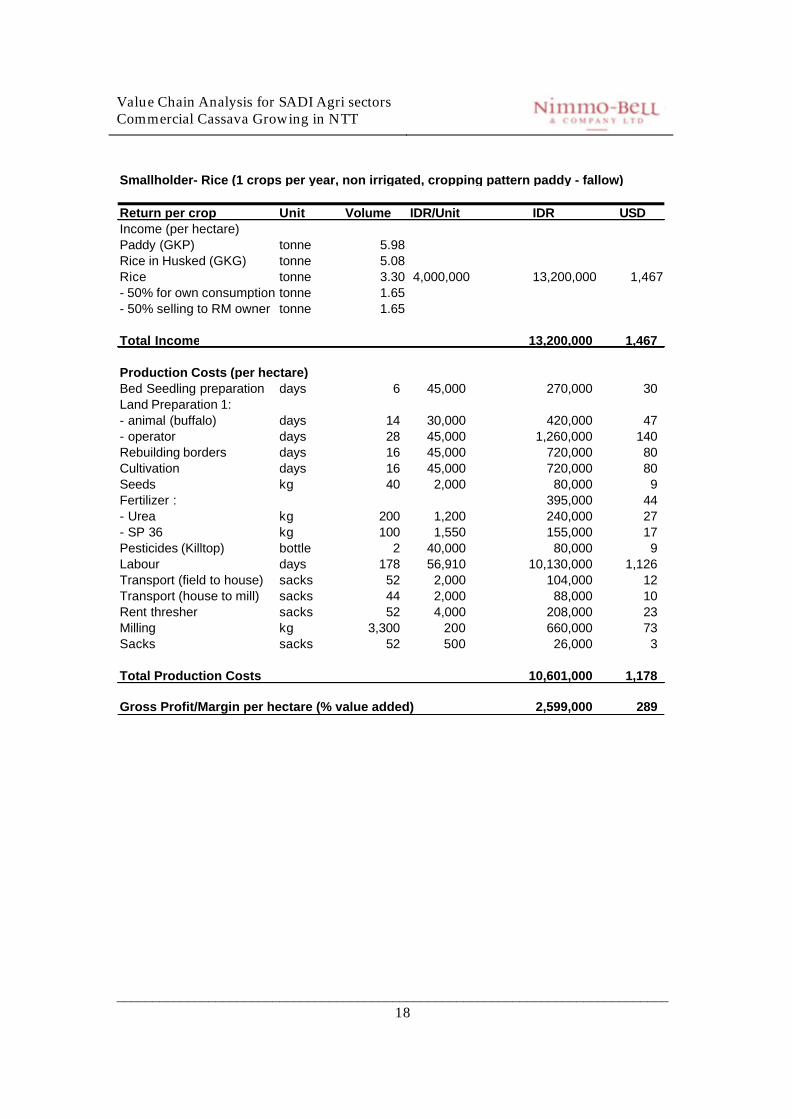
6. Value Chain Cost Analysis The following tables allocate costs and returns for smallholder farmers. The estimates of value are based on a brief site visit to the proposed cassava growing project in West Manggarai. The estimates of economic returns are shown below. Gross margins can be used as the first step involved in comparing the profitability of the different enterprises. The mathematics is simple- the direct or variable costs incurred in production are subtracted from the total income of the enterprise. They represent an indicative average, in reality weights and costs vary between regions and management. Gross margins are a simple means of comparing enterprises but care must be taken in interpreting the results, due to the following assumptions:
• That each enterprise is independent of all other related smallholder activities (in reality they’re not);
• That each additional unit of production is worth as much, and costs as much, as the preceding unit.
• No account of interest or overhead expenses are accounted for. 6.1. Farming Returns While most of the land targeted under the proposed project is unused, current returns from rice growing were researched as a comparison to projected cassava growing returns. The tables below show that, using production estimates made by smallholders for rice and cassava and using market price assumptions provided by the local government Crops Division, the expected returns from cassava growing are considerably higher than existing returns from rice.
Value Chain Analysis for SADI Agri sectors Commercial Cassava Growing in NTT
______________________________________________________________________________ 18
Smallholder- Rice (1 crops per year, non irrigated, cropping pattern paddy - fallow)
Return per crop Unit Volume IDR/Unit IDR USDIncome (per hectare)Paddy (GKP) tonne 5.98Rice in Husked (GKG) tonne 5.08Rice tonne 3.30 4,000,000 13,200,000 1,467- 50% for own consumption tonne 1.65- 50% selling to RM owner tonne 1.65
Total Income 13,200,000 1,467
Production Costs (per hectare)Bed Seedling preparation days 6 45,000 270,000 30 Land Preparation 1:- animal (buffalo) days 14 30,000 420,000 47 - operator days 28 45,000 1,260,000 140 Rebuilding borders days 16 45,000 720,000 80 Cultivation days 16 45,000 720,000 80 Seeds kg 40 2,000 80,000 9 Fertilizer : 395,000 44 - Urea kg 200 1,200 240,000 27 - SP 36 kg 100 1,550 155,000 17 Pesticides (Killtop) bottle 2 40,000 80,000 9 Labour days 178 56,910 10,130,000 1,126 Transport (field to house) sacks 52 2,000 104,000 12 Transport (house to mill) sacks 44 2,000 88,000 10 Rent thresher sacks 52 4,000 208,000 23 Milling kg 3,300 200 660,000 73 Sacks sacks 52 500 26,000 3
Total Production Costs 10,601,000 1,178
Gross Profit/Margin per hectare (% value added) 2,599,000 289
Value Chain Analysis for SADI Agri sectors Commercial Cassava Growing in NTT
______________________________________________________________________________ 19
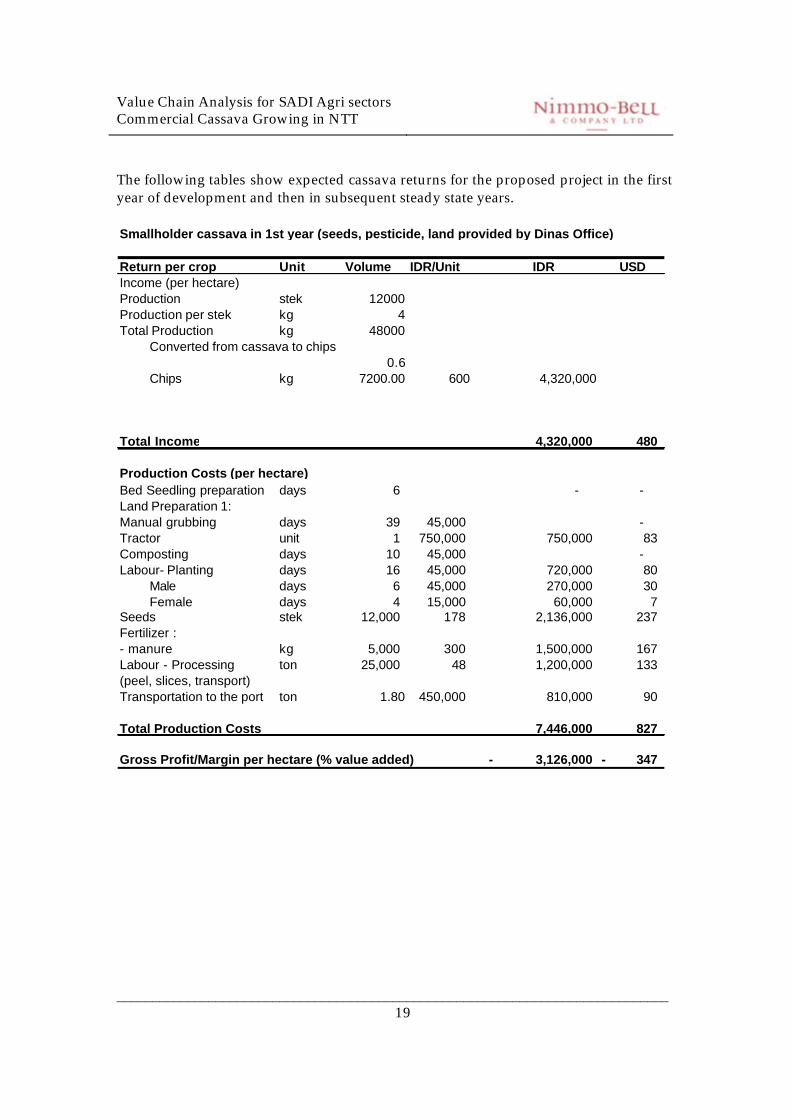
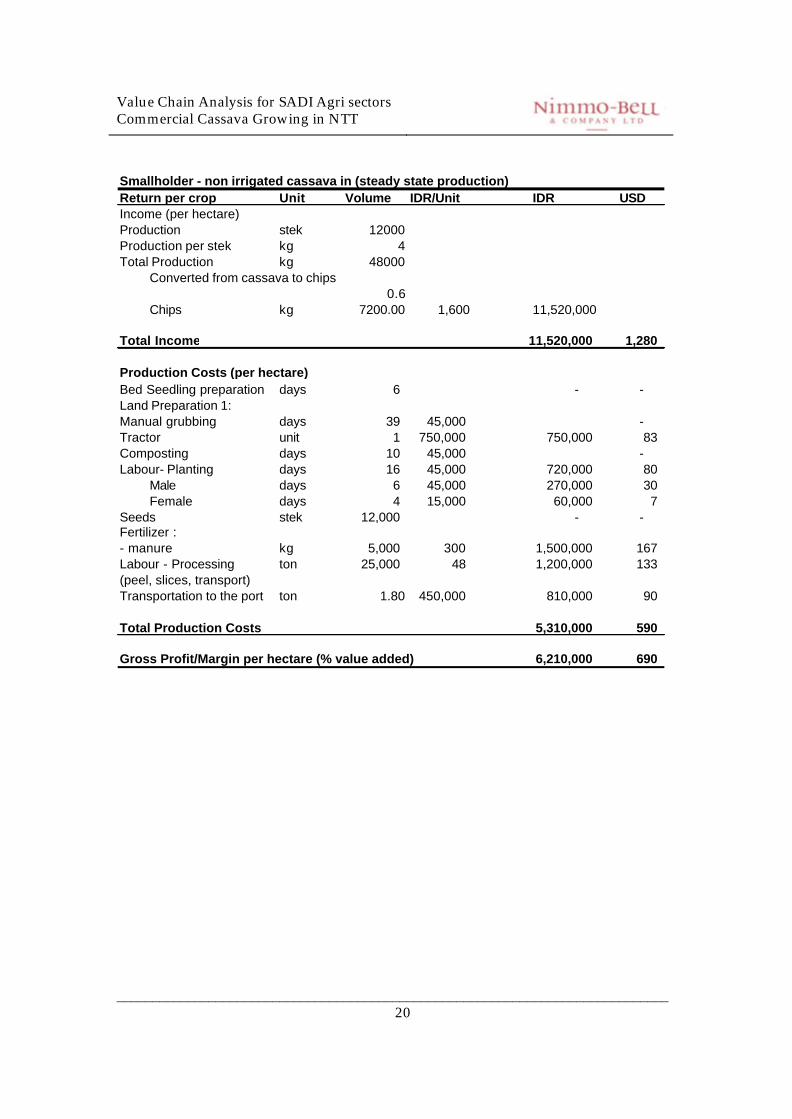
The following tables show expected cassava returns for the proposed project in the first year of development and then in subsequent steady state years. Smallholder cassava in 1st year (seeds, pesticide, land provided by Dinas Office)
Return per crop Unit Volume IDR/Unit IDR USDIncome (per hectare)Production stek 12000Production per stek kg 4Total Production kg 48000
Converted from cassava to chips0.6
Chips kg 7200.00 600 4,320,000
Total Income 4,320,000 480
Production Costs (per hectare)Bed Seedling preparation days 6 - - Land Preparation 1:Manual grubbing days 39 45,000 - Tractor unit 1 750,000 750,000 83 Composting days 10 45,000 - Labour- Planting days 16 45,000 720,000 80
Male days 6 45,000 270,000 30 Female days 4 15,000 60,000 7
Seeds stek 12,000 178 2,136,000 237 Fertilizer :- manure kg 5,000 300 1,500,000 167 Labour - Processing ton 25,000 48 1,200,000 133 (peel, slices, transport)Transportation to the port ton 1.80 450,000 810,000 90
Total Production Costs 7,446,000 827
Gross Profit/Margin per hectare (% value added) 3,126,000- 347-
Value Chain Analysis for SADI Agri sectors Commercial Cassava Growing in NTT
______________________________________________________________________________ 20
Smallholder - non irrigated cassava in (steady state production)Return per crop Unit Volume IDR/Unit IDR USDIncome (per hectare)Production stek 12000Production per stek kg 4Total Production kg 48000
Converted from cassava to chips0.6
Chips kg 7200.00 1,600 11,520,000
Total Income 11,520,000 1,280
Production Costs (per hectare)Bed Seedling preparation days 6 - - Land Preparation 1:Manual grubbing days 39 45,000 - Tractor unit 1 750,000 750,000 83 Composting days 10 45,000 - Labour- Planting days 16 45,000 720,000 80
Male days 6 45,000 270,000 30 Female days 4 15,000 60,000 7
Seeds stek 12,000 - - Fertilizer :- manure kg 5,000 300 1,500,000 167 Labour - Processing ton 25,000 48 1,200,000 133 (peel, slices, transport)Transportation to the port ton 1.80 450,000 810,000 90
Total Production Costs 5,310,000 590
Gross Profit/Margin per hectare (% value added) 6,210,000 690
Value chain analysis for SADI agri sectors Commercial Cassava Growing in NTT
_____________________________________________________________________________________________________________________ 21
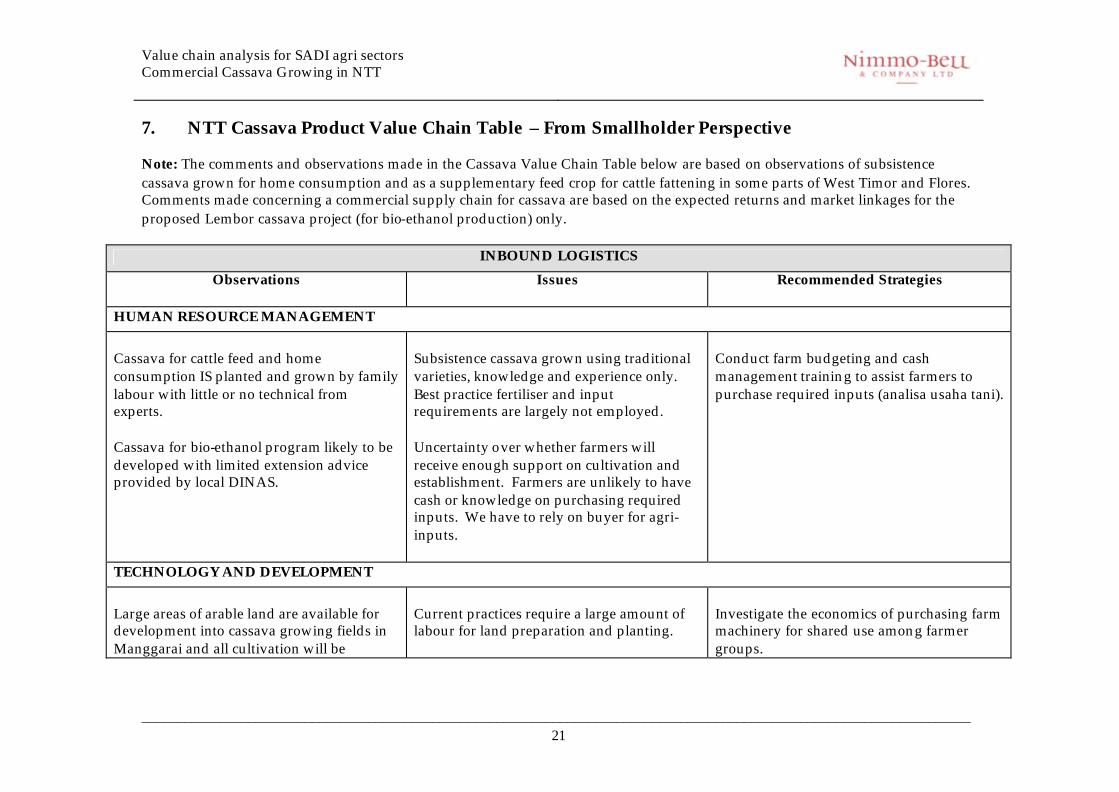
7. NTT Cassava Product Value Chain Table – From Smallholder Perspective Note: The comments and observations made in the Cassava Value Chain Table below are based on observations of subsistence cassava grown for home consumption and as a supplementary feed crop for cattle fattening in some parts of West Timor and Flores. Comments made concerning a commercial supply chain for cassava are based on the expected returns and market linkages for the proposed Lembor cassava project (for bio-ethanol production) only.
INBOUND LOGISTICS
Observations
Issues Recommended Strategies
HUMAN RESOURCE MANAGEMENT
Cassava for cattle feed and home consumption IS planted and grown by family labour with little or no technical from experts. Cassava for bio-ethanol program likely to be developed with limited extension advice provided by local DINAS.
Subsistence cassava grown using traditional varieties, knowledge and experience only. Best practice fertiliser and input requirements are largely not employed. Uncertainty over whether farmers will receive enough support on cultivation and establishment. Farmers are unlikely to have cash or knowledge on purchasing required inputs. We have to rely on buyer for agri-inputs.
Conduct farm budgeting and cash management training to assist farmers to purchase required inputs (analisa usaha tani).
TECHNOLOGY AND DEVELOPMENT
Large areas of arable land are available for development into cassava growing fields in Manggarai and all cultivation will be
Current practices require a large amount of labour for land preparation and planting.
Investigate the economics of purchasing farm machinery for shared use among farmer groups.
Value chain analysis for SADI agri sectors Commercial Cassava Growing in NTT
_____________________________________________________________________________________________________________________ 22
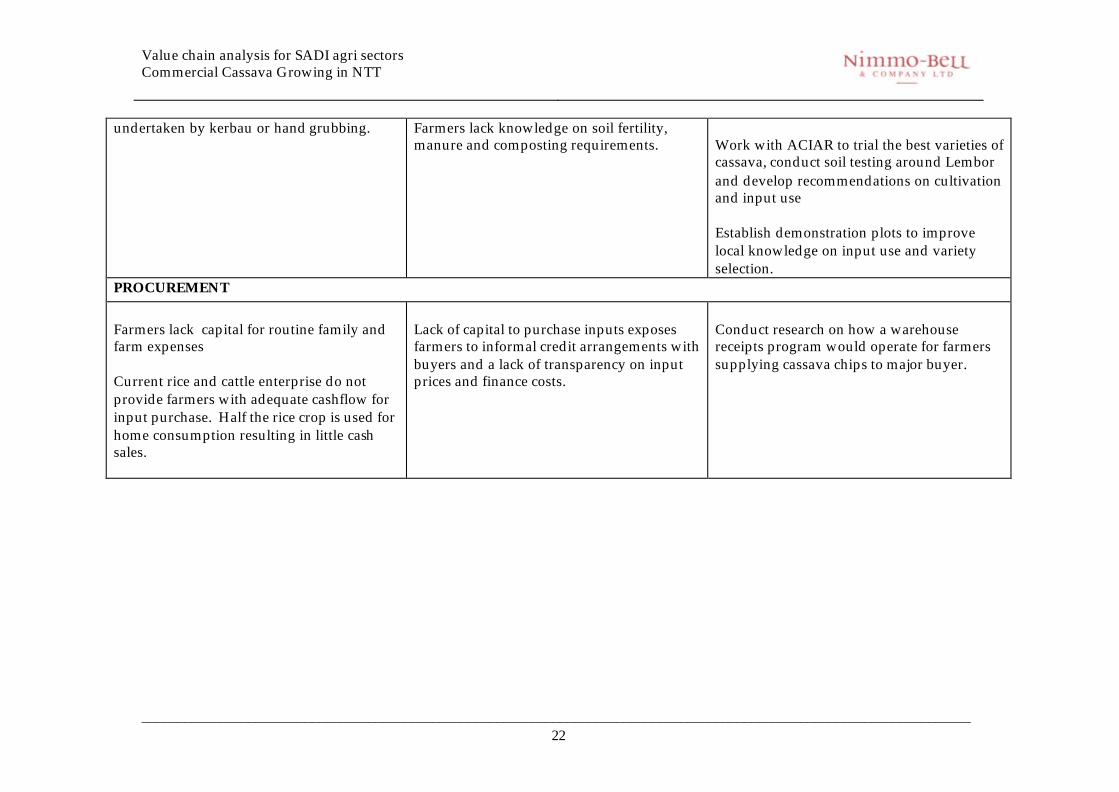
undertaken by kerbau or hand grubbing.
Farmers lack knowledge on soil fertility, manure and composting requirements.
Work with ACIAR to trial the best varieties of cassava, conduct soil testing around Lembor and develop recommendations on cultivation and input use Establish demonstration plots to improve local knowledge on input use and variety selection.
PROCUREMENT
Farmers lack capital for routine family and farm expenses Current rice and cattle enterprise do not provide farmers with adequate cashflow for input purchase. Half the rice crop is used for home consumption resulting in little cash sales.
Lack of capital to purchase inputs exposes farmers to informal credit arrangements with buyers and a lack of transparency on input prices and finance costs.
Conduct research on how a warehouse receipts program would operate for farmers supplying cassava chips to major buyer.
Value chain analysis for SADI agri sectors Commercial Cassava Growing in NTT
_____________________________________________________________________________________________________________________ 23
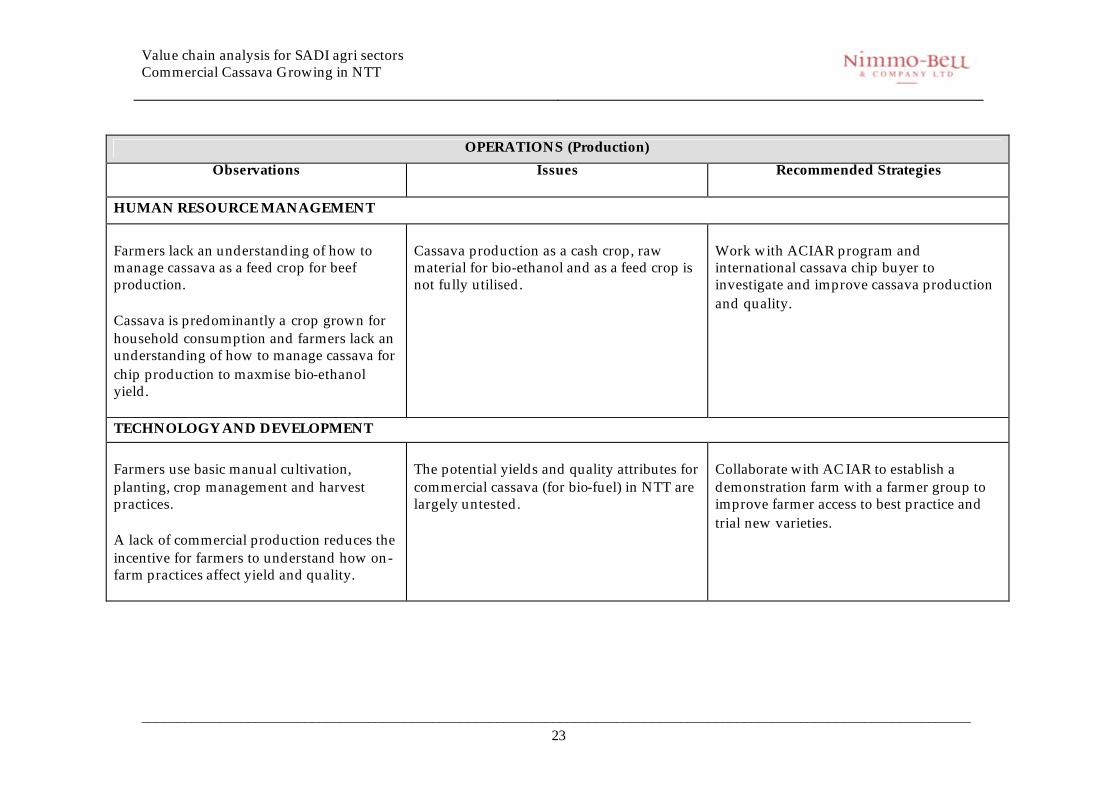
OPERATIONS (Production)
Observations
Issues Recommended Strategies
HUMAN RESOURCE MANAGEMENT
Farmers lack an understanding of how to manage cassava as a feed crop for beef production. Cassava is predominantly a crop grown for household consumption and farmers lack an understanding of how to manage cassava for chip production to maxmise bio-ethanol yield.
Cassava production as a cash crop, raw material for bio-ethanol and as a feed crop is not fully utilised.
Work with ACIAR program and international cassava chip buyer to investigate and improve cassava production and quality.
TECHNOLOGY AND DEVELOPMENT
Farmers use basic manual cultivation, planting, crop management and harvest practices. A lack of commercial production reduces the incentive for farmers to understand how on-farm practices affect yield and quality.
The potential yields and quality attributes for commercial cassava (for bio-fuel) in NTT are largely untested.
Collaborate with AC IAR to establish a demonstration farm with a farmer group to improve farmer access to best practice and trial new varieties.
Value chain analysis for SADI agri sectors Commercial Cassava Growing in NTT
_____________________________________________________________________________________________________________________ 24
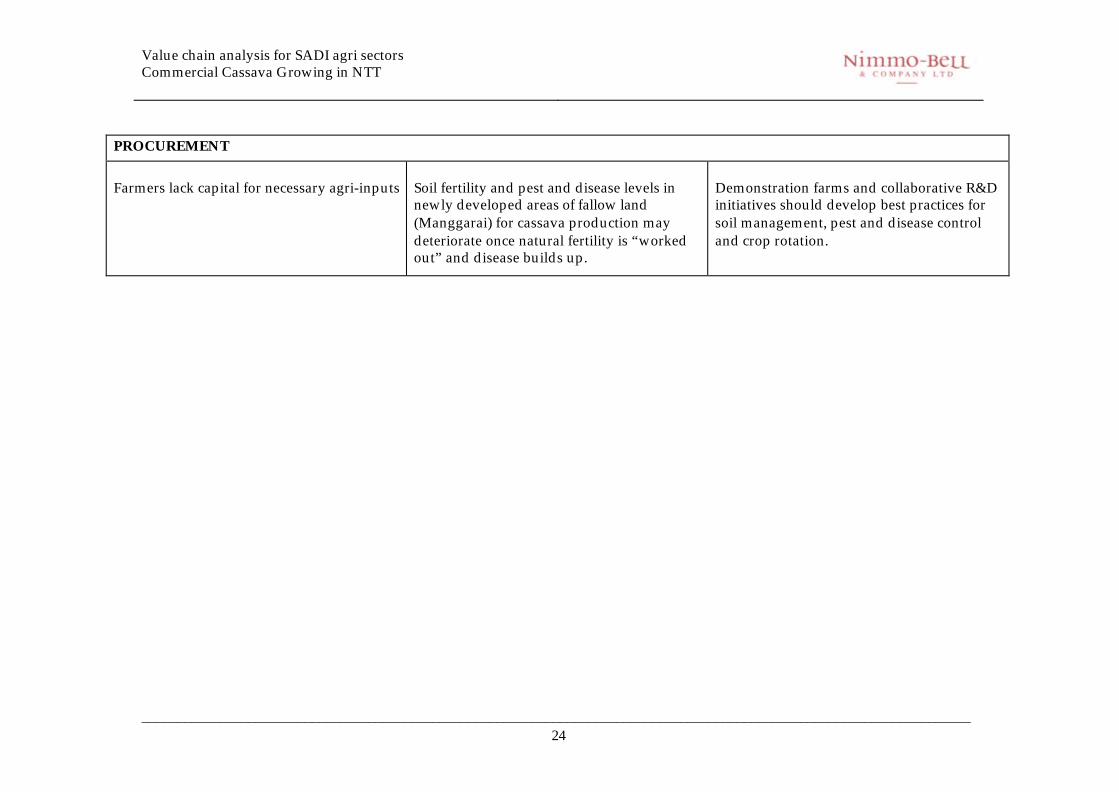
PROCUREMENT
Farmers lack capital for necessary agri-inputs
Soil fertility and pest and disease levels in newly developed areas of fallow land (Manggarai) for cassava production may deteriorate once natural fertility is “worked out” and disease builds up.
Demonstration farms and collaborative R&D initiatives should develop best practices for soil management, pest and disease control and crop rotation.
Value chain analysis for SADI agri sectors Commercial Cassava Growing in NTT
_____________________________________________________________________________________________________________________ 25
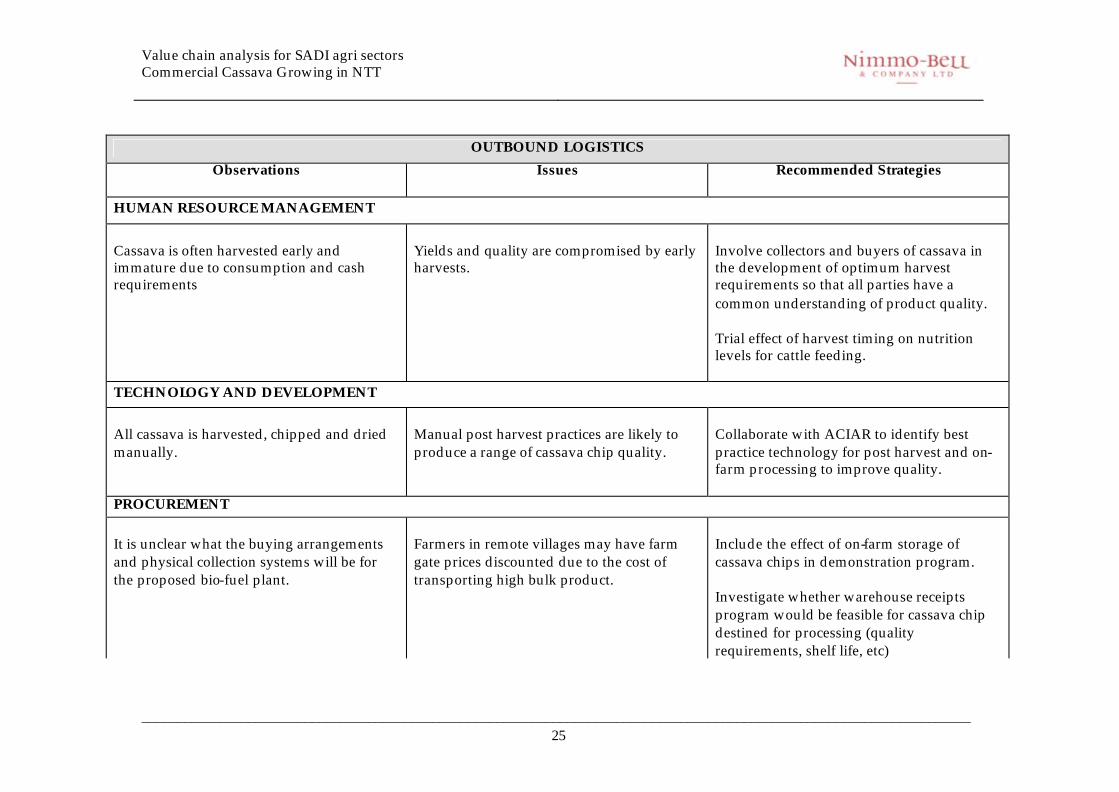
OUTBOUND LOGISTICS
Observations
Issues Recommended Strategies
HUMAN RESOURCE MANAGEMENT
Cassava is often harvested early and immature due to consumption and cash requirements
Yields and quality are compromised by early harvests.
Involve collectors and buyers of cassava in the development of optimum harvest requirements so that all parties have a common understanding of product quality. Trial effect of harvest timing on nutrition levels for cattle feeding.
TECHNOLOGY AND DEVELOPMENT
All cassava is harvested, chipped and dried manually.
Manual post harvest practices are likely to produce a range of cassava chip quality.
Collaborate with ACIAR to identify best practice technology for post harvest and on-farm processing to improve quality.
PROCUREMENT
It is unclear what the buying arrangements and physical collection systems will be for the proposed bio-fuel plant.
Farmers in remote villages may have farm gate prices discounted due to the cost of transporting high bulk product.
Include the effect of on-farm storage of cassava chips in demonstration program. Investigate whether warehouse receipts program would be feasible for cassava chip destined for processing (quality requirements, shelf life, etc)
Value chain analysis for SADI agri sectors Commercial Cassava Growing in NTT
_____________________________________________________________________________________________________________________ 26
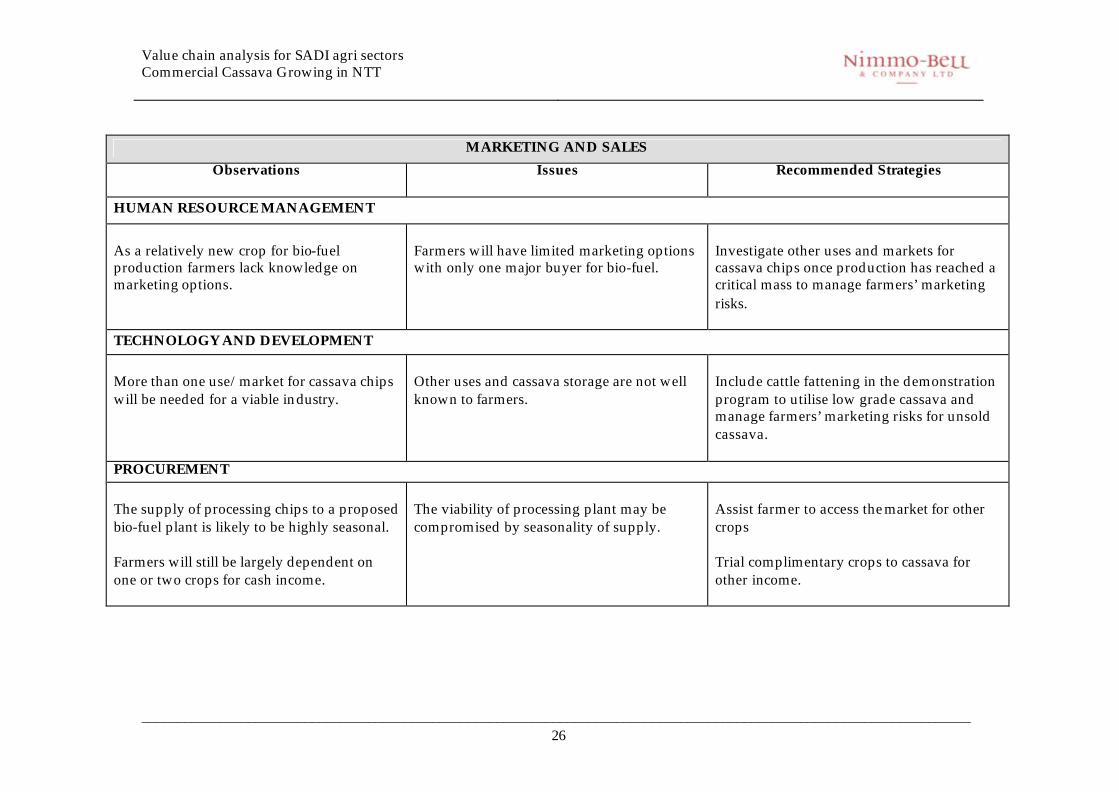
MARKETING AND SALES
Observations
Issues Recommended Strategies
HUMAN RESOURCE MANAGEMENT
As a relatively new crop for bio-fuel production farmers lack knowledge on marketing options.
Farmers will have limited marketing options with only one major buyer for bio-fuel.
Investigate other uses and markets for cassava chips once production has reached a critical mass to manage farmers’ marketing risks.
TECHNOLOGY AND DEVELOPMENT
More than one use/market for cassava chips will be needed for a viable industry.
Other uses and cassava storage are not well known to farmers.
Include cattle fattening in the demonstration program to utilise low grade cassava and manage farmers’ marketing risks for unsold cassava.
PROCUREMENT
The supply of processing chips to a proposed bio-fuel plant is likely to be highly seasonal. Farmers will still be largely dependent on one or two crops for cash income.
The viability of processing plant may be compromised by seasonality of supply.
Assist farmer to access the market for other crops Trial complimentary crops to cassava for other income.
Value chain analysis for SADI agri sectors Commercial Cassava Growing in NTT
_____________________________________________________________________________________________________________________ 27
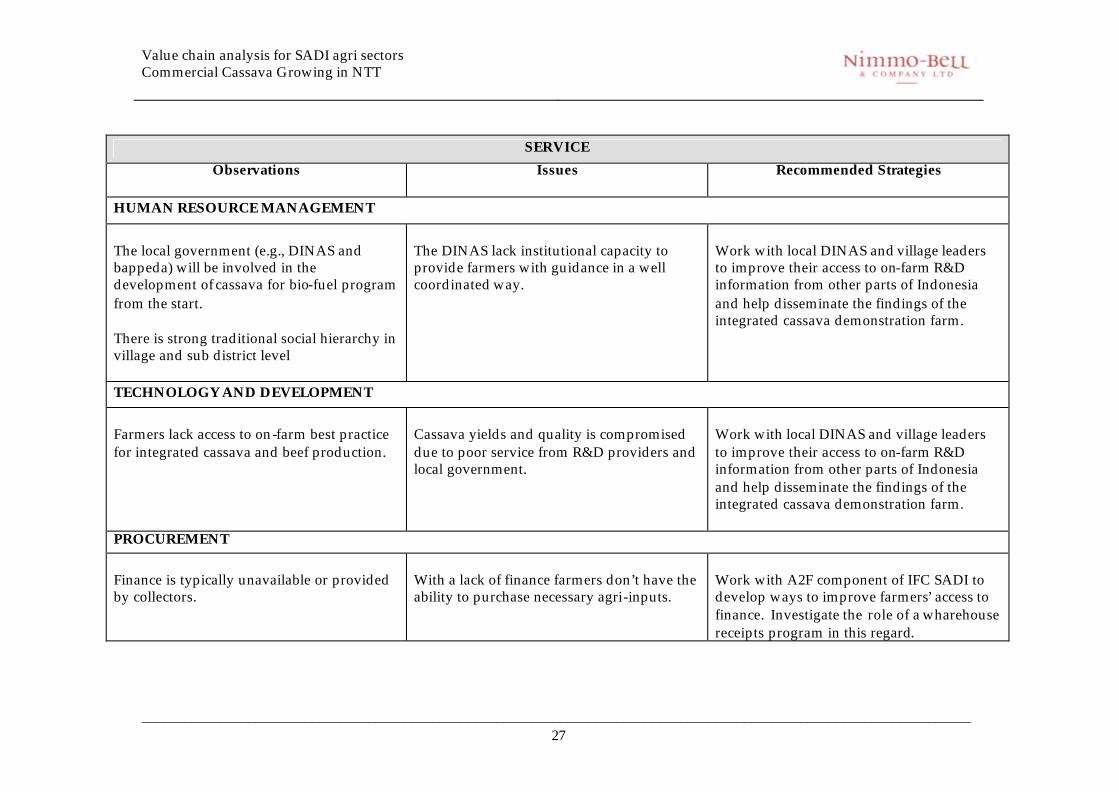
SERVICE
Observations
Issues Recommended Strategies
HUMAN RESOURCE MANAGEMENT
The local government (e.g., DINAS and bappeda) will be involved in the development of cassava for bio-fuel program from the start. There is strong traditional social hierarchy in village and sub district level
The DINAS lack institutional capacity to provide farmers with guidance in a well coordinated way.
Work with local DINAS and village leaders to improve their access to on-farm R&D information from other parts of Indonesia and help disseminate the findings of the integrated cassava demonstration farm.
TECHNOLOGY AND DEVELOPMENT
Farmers lack access to on-farm best practice for integrated cassava and beef production.
Cassava yields and quality is compromised due to poor service from R&D providers and local government.
Work with local DINAS and village leaders to improve their access to on-farm R&D information from other parts of Indonesia and help disseminate the findings of the integrated cassava demonstration farm.
PROCUREMENT
Finance is typically unavailable or provided by collectors.
With a lack of finance farmers don’t have the ability to purchase necessary agri-inputs.
Work with A2F component of IFC SADI to develop ways to improve farmers’ access to finance. Investigate the role of a wharehouse receipts program in this regard.
Value chain analysis for SADI agri sectors Commercial Cassava Growing in NTT
______________________________________________________________________________ 28
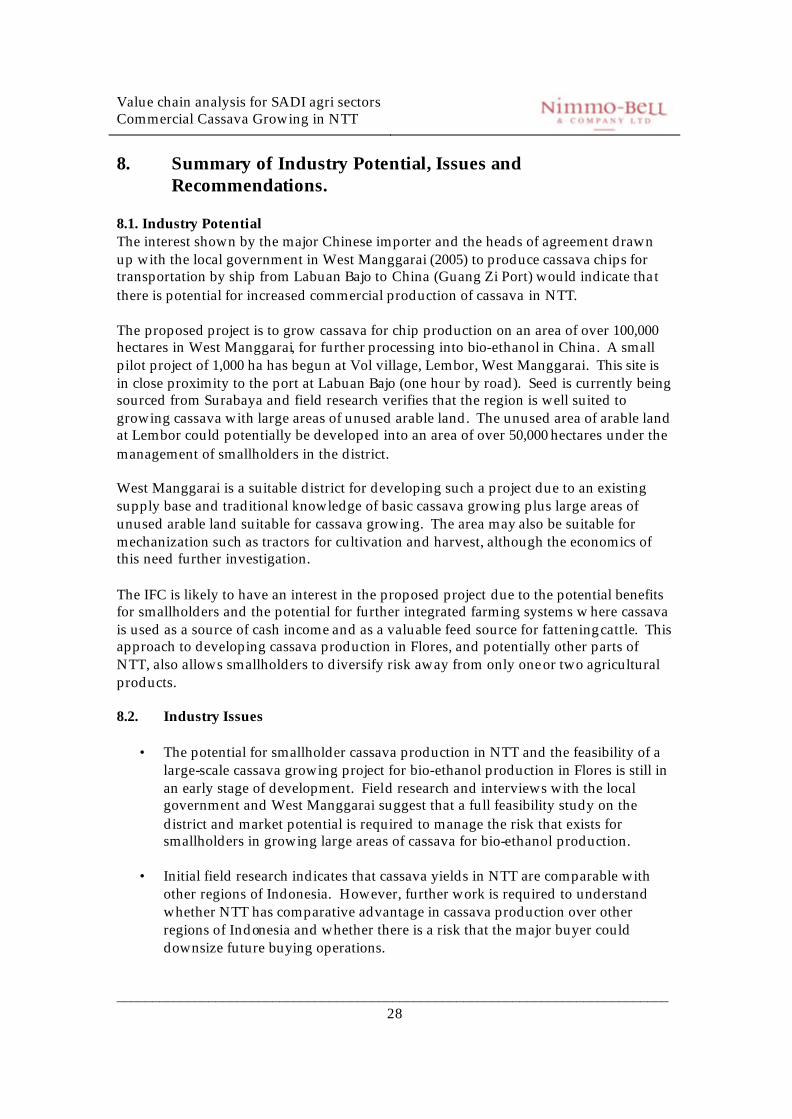
8. Summary of Industry Potential, Issues and Recommendations.
8.1. Industry Potential The interest shown by the major Chinese importer and the heads of agreement drawn up with the local government in West Manggarai (2005) to produce cassava chips for transportation by ship from Labuan Bajo to China (Guang Zi Port) would indicate that there is potential for increased commercial production of cassava in NTT. The proposed project is to grow cassava for chip production on an area of over 100,000 hectares in West Manggarai, for further processing into bio-ethanol in China. A small pilot project of 1,000 ha has begun at Vol village, Lembor, West Manggarai. This site is in close proximity to the port at Labuan Bajo (one hour by road). Seed is currently being sourced from Surabaya and field research verifies that the region is well suited to growing cassava with large areas of unused arable land. The unused area of arable land at Lembor could potentially be developed into an area of over 50,000 hectares under the management of smallholders in the district. West Manggarai is a suitable district for developing such a project due to an existing supply base and traditional knowledge of basic cassava growing plus large areas of unused arable land suitable for cassava growing. The area may also be suitable for mechanization such as tractors for cultivation and harvest, although the economics of this need further investigation. The IFC is likely to have an interest in the proposed project due to the potential benefits for smallholders and the potential for further integrated farming systems where cassava is used as a source of cash income and as a valuable feed source for fattening cattle. This approach to developing cassava production in Flores, and potentially other parts of NTT, also allows smallholders to diversify risk away from only one or two agricultural products. 8.2. Industry Issues
• The potential for smallholder cassava production in NTT and the feasibility of a large-scale cassava growing project for bio-ethanol production in Flores is still in an early stage of development. Field research and interviews with the local government and West Manggarai suggest that a full feasibility study on the district and market potential is required to manage the risk that exists for smallholders in growing large areas of cassava for bio-ethanol production.
• Initial field research indicates that cassava yields in NTT are comparable with
other regions of Indonesia. However, further work is required to understand whether NTT has comparative advantage in cassava production over other regions of Indonesia and whether there is a risk that the major buyer could downsize future buying operations.
Value chain analysis for SADI agri sectors Commercial Cassava Growing in NTT
______________________________________________________________________________ 29
• Like other agricultural commodities, smallholders producing cassava in NTT will require adequate access to seasonal finance for basic agri-inputs. Such access does not currently exist and smallholders rely on informal forms of finance supplied by traders and intermediaries for other products.
• The proposed project will rely on Cassava chip purchases from a single large
buyer for processing in China. This buying situation is a risk that will have to be managed by the smallholders and farmer groups intending to become involved in cassava growing and chip production.
• Cassava chip production is not a traditional post harvest practice for
smallholders in NTT and will require extension to ensure that smallholders produce a quality product.
8.3. Recommendations for IFC TA The following points summarize the key recommendations made in the value chain analysis. The recommendations are made with a potential TA program t o support the proposed cassava production project.
• Conduct research on the minimum average level of cash needed per household per year so that an integrated farming system to meet household cash requirements can be developed.
• Work with the IFC A2F program to investigate whether a linkage can be
established with the major cassava chip buyer to establish a wharehouse receipts program and provide farmers with improved access to finance. A tri-partite finance agreement between buyers, local banks and farmer groups may should also be investigated to improve access to finance.
• Collaborate with ACIAR to undertake further research and trial improved high
starch varieties for specialist cassava production, including soil testing, best practice cultivation, weed and pest control, best practice harvest, drying and processing into chips.
• Collaborate with the local government DINAS, ACIAR and farmer groups to
establish a demonstration plot to encourage farmers to use best practice cassava growing techniques.
• A demonstration farm should also investigate the potential for farmers to
increase their overall cash income by selling fresh roots for household consumption, as a cash crop for cassava chip production and also as a livestock feed for an integrated cattle farming/cropping system. The goal for a demonstration farm should be to achieve a minimum level of cash income per year from a range of crops from an average smallholding.
Value chain analysis for SADI agri sectors Commercial Cassava Growing in NTT
______________________________________________________________________________ 30
• Work with the ACIAR program and the major cassava chip processor to understand cassava chip quality requirements and on-farm practices to meet these standards.
• Investigate other uses and markets for cassava chips once production has
reached a critical mass to manage farmers’ marketing risks.
• Work with the local DINAS, farmer groups and village leaders to improve smallholder access to on-farm research and information from other parts of Indonesia and incorporate this practice into the integrated cassava demonstration farm.
Value chain analysis for SADI agri sectors Commercial Cassava Growing in NTT
______________________________________________________________________________ 31
References: Anonymous. 2007. Cassava as a bio-fuel crop. http://www. Helsinki.fi/uh/1-2007/
juttu16. html. Falcon, W.P., William O. Jones., Scott. R. Pearson., John A. Dixon., Gerald C. Nelson.,
Frederick C. Roche., and Laurian J. Unnevehr. 1984. The Cassava Economy of Java. Stanford University Press. Stanford, California.
FAO. 2003. June 2003 cassava market assessment. http: //www.fao.org/es/esc/en/
20953/21029/highlight_28829en_p.html. FAO. . FAO Food Outlook. http://www.fao.org/docrep/009/17927e/j7927e05.htm. FAO and IFAD. 2000. The World Cassava Economic, Facts, Trends and Outlook. http:
//fao.org/docrep/009/x4007e/X4007E02.htm. Krismantari, Ika. 2007. RI moving fast on bio-fuel development. Jakarta Post, January
10, 2007. Jakarta. Indonesia. Paterson, Mike. 2007. Bio-fuel to power Indonesia’s anti poverty drive. Agency France
– Presse (AFP). France. Simbolon, Benget. 2006. RI aims to become major producer of bio-fuels. Jakarta Post,
June 07, 2006. Jakarta. Indonesia. Sutanto, Iwan. Xxx. Bioethanol Prospect in Indonesia.