
Value and proportions of intangible...
71
MASTER THESIS WITHIN: Business Administration NUMBER OF CREDITS: 30 ECTS PROGRAMME OF STUDY: Civilekonom AUTHORS: Josefin Andersson and Beatrice Johansson TUTOR: Gunnar Rimmel JÖNKÖPING May 2016 A comparison between the private- and the public sector Value and proportions of intangible assets
Transcript of Value and proportions of intangible...

MASTER THESIS WITHIN: Business Administration
NUMBER OF CREDITS: 30 ECTS
PROGRAMME OF STUDY: Civilekonom
AUTHORS: Josefin Andersson and Beatrice Johansson
TUTOR: Gunnar Rimmel
JÖNKÖPING May 2016
A comparison between the private- and the public sector
Value and proportions of intangible assets

ii
Acknowledgements
The completion of this thesis would not have been possible without the participation and assistance
by our supervisor Professor Gunnar Rimmel whose interest in our progress and support are
sincerely appreciated. Furthermore, we wish to express our sincere gratitude to Auditor Arne
Månberg for his engagement and assistance throughout the process if this study. We would also
like to thank the respondents for their engagement which have contributed with feedback in order
to complete and make a better thesis.
2016-05-20
XBeatrice Johansson
XJosefin Andersson

iii
Civilekonom Thesis in Business Administration
Title: Value and proportions of intangible assets – A comparison between
the private- and the public sector
Authors: Josefin Andersson, Beatrice Johansson
Supervisor: Gunnar Rimmel
Date: 2016-05-20
Subject terms: Intangible assets, Internally generated intangible assets, Private
sector, Public sector
Abstract
Organizations within the public- and the private sector have different aims with their accounting.
Privately held organizations often have the intention to make profit, while authorities within the
public sector aim to provide citizens with different services. The difference between these two
sectors is also visible in the legislation, where International Accounting Standards Board set the
standards for privately held organizations and Ekonomistyrningsverket do the same for the public
sector. Because of the larger demand by the society for knowledge and technology, included in the
category intangible assets, these are more emphasized in the accounting for organizations.
Intangible assets are although linked with complexity which is associated with the measurement.
The purpose of this study is therefore to see whether there are any existing differences in how to
measure and value intangible assets and internally generated ones between listed companies in the
private sector and authorities operating in the public sector.
This study is conducted with both a qualitative and quantitative perspective. The data collected for
this study is secondary, and is gathered through samples of annual reports from different
companies in order to be representative for the whole population. The main results of this study is
that there are differences in the measurement and valuation of intangible assets dependent on
which sector an organization operates within and this is not due to the standards and regulations.
The differences are visible in the percentage change in value of intangible assets since they fluctuate
more heavily in the private sector than in the public sector. Simultaneously, the proportions of
internally generated intangible assets compared to intangible assets in general differ between the
two sectors.

iv
Abbreviations
ESV – Ekonomistyrningsverket
EU – European Union
FÅB - Förordningen om Årsredovisning och Budgetunderlag
GDP - Gross Domestic Product
IAS - International Accounting Standards
IASB - International Accounting Standards Board
IASC - International Accounting Standards Committee
IFRS - International Financial Reporting Standards
US GAAP - United States Generally Accepted Accounting Principles
Translations
Förordningen om Årsredovisning och Budgetunderlag - The Swedish Regulation on Annual
Accounts and Budgets
Försvarsmakten - The Swedish Armed Forces
Försäkringskassan - The Swedish Social Insurance Authority
Kronofogdemyndigheten - The Swedish Enforcement Authority
Migrationsverket - The Swedish Migration Agency
Rikspolisstyrelsen - The Swedish National Police Board
Transportstyrelsen - The Swedish Transport Agency
Trängselskatt - Congestion pricing
v
Table of content
1 Introduction ......................................................................... 1
1.1 Background ............................................................................................ 1 1.2 Problem discussion ................................................................................ 3 1.3 Research question ................................................................................. 5
1.4 Purpose ................................................................................................. 5 1.5 Delimitations .......................................................................................... 5 1.6 Contribution............................................................................................ 6 1.7 Thesis outline ......................................................................................... 6
2 Frame of reference .............................................................. 8
2.1 Private sector accounting ....................................................................... 8 2.2 Public sector accounting ........................................................................ 8
2.3 Intangible assets .................................................................................. 10 2.3.1 Intangible assets in Swedish private sector accounting ....................... 12 2.3.2 Intangible assets in the Swedish public sector accounting .................. 13
2.3.3 Implications of the adoption of IAS/IFRS in Sweden ............................ 14 2.4 Internally generated intangible assets .................................................. 15 2.4.1 Internally generated intangible assets in the private sector ................. 15 2.4.2 Internally generated intangible assets in the public sector ................... 16
2.5 Stakeholder theory ............................................................................... 17 2.6 Disclosure and legitimacy theory ......................................................... 17
3 Method ............................................................................... 20
3.1 Choice of method ................................................................................. 20
3.2 Sampling .............................................................................................. 21 3.3 Data collection ..................................................................................... 23
3.3.1 Frame of reference .............................................................................. 23 3.3.2 Information from annual reports ........................................................... 24 3.3.3 Information from Statistics Sweden ...................................................... 25
3.4 Critics and implications of chosen method ........................................... 25 3.5 Data analysis ....................................................................................... 26
4 Empirical findings ............................................................. 28
4.1 Value of intangible assets .................................................................... 28 4.2 Intangible assets in the public sector ................................................... 29 4.3 Intangible assets in the private sector .................................................. 31
5 Analysis ............................................................................. 42
6 Conclusions and discussion ............................................ 49
6.1 Conclusion ........................................................................................... 49 6.2 Critical reflections ................................................................................. 50 6.3 Ethical and social issues ...................................................................... 51
6.4 Suggestions for future studies.............................................................. 52
References .................................................................................... 53
vi
Figures Figure 4.1 Percentage changes in value of intangible assets (Own processing, 2016).
......................................................................................................... 29 Figure 4.2 Comparison between branches and examined companies (Own
processing, 2016). ........................................................................... 36
Figure 4.3 Comparison between branches and examined companies, modified version (Own processing, 2016). ..................................................... 38
Figure 4.4 Percentage change of internally generated intangible assets (Own processing, 2016). ........................................................................... 40
Tables Table 4.1 Value of intangible assets (Own processing, 2016) ...................... 28 Table 4.2 Percentage change in value of intangible assets (Own processing, 2016)
......................................................................................................... 28 Table 4.3 Value of intangible assets in the Swedish public sector (Own processing,
2016) ................................................................................................ 30 Table 4.4 Percentage change in value of intangible assets in the Public sector (Own
processing, 2016) ............................................................................ 31 Table 4.5 Proportion of internally generated intangible assets (Own processing,
2016) ................................................................................................ 31 Table 4.6 Value of intangible assets in Eniro Group AB (Own processing, 2016)
......................................................................................................... 32 Table 4.7 Value of intangible assets in AstraZeneca (Own processing, 2016)32 Table 4.8 Value of intangible assets in Swedish Orphan Biovitrum AB (Own
processing, 2016) ............................................................................ 34
Table 4.9 Value of intangible assets in Medivir AB (Own processing, 2016) 35 Table 4.10 Value of intangible assets in Poolia AB (Own processing, 2016) 35 Table 4.11 Percentage change in value of intangible assets (Own processing, 2016)
......................................................................................................... 36 Table 4.12 Value of intangible assets in Medivir AB, modified version (Own
processing, 2016) ............................................................................ 37 Table 4.13 Percentage change in value of intangible assets, modified version (Own
processing, 2016) ............................................................................ 37
Table 4.14 Percentage change in value of internally generated intangible assets (Own processing, 2016) ................................................................... 39
Table 4.15 Proportion of internally generated intangible assets (Own processing, 2016) ................................................................................................ 39
Appendices Appendix 1 – Branschstatistik ....................................................................... 58 Appendix 2 - Industry statistics ..................................................................... 62

1
1 Introduction
The first chapter aims to give the reader an introduction into the study. A background to the topic is presented and the problem is discussed. This first chapter ends with a specified purpose and research question that the study aims to answer.
Accounting is a phenomenon that is present in many aspects of the society; it ranges from sole
proprietors with a relatively small turnover to multinational companies with a total profit that
exceeds the amount of one small country’s GDP to organizations owned by the government that
operates within the public sector. Several of these different companies and organizations have
intangible assets which are recognized in their balance sheets (Baboukardos, Rimmel, Jonäll,
Hartmann, & Inkwinkl, 2016; Bandukwala, 2005). These specific assets have in common that they
are difficult to measure (Sahut, Boulerne, & Teulon, 2011; Stolowy & Jeny-Cazavan, 2001; Watts,
2003) and therefore, the value of them could vary. In order to achieve transparency in the valuation
of intangible assets there are several rules, practices and standards, both on national and
international level that try to meet this condition (Falkman & Orrbeck, 2001;
Ekonomistyrningsverket, 2012; Marton, Lumsden, Lundqvist, Pettersson, & Rimmel, 2010). In
Sweden, the standard setters and regulators differ depending on whether the company is listed on
a regulated market or an authority that operates under the government. These organizations are
regulated by the Swedish administrative authority ESV and listed companies operating in the
private sector are obliged to comply with regulations issued by IASB.
Because of the different regulators there might also be a difference in how to measure the value of
intangible assets. The presence of these specific assets seems to be more visible nowadays and
conversely, this leads to a greater demand for standards and regulations that clearly explains how
to recognize, but also how to measure intangible assets. Due to their peculiar character, the
valuation of these assets should be similar independent on whether they belong to a listed company
or an authority.
1.1 Background
Accounting is a sort of language that is widely understood and is being conducted with a similar
approach all over the world (Hayes, 1983). The accounting of companies and organizations have
for a long time been available for external parties throughout the financial statements and it has
been the company's way of communicating essential information (Joachim Hoøegh-Krohn &
Knivsflå, 2000; Rimmel, 2016; Meek, Roberts, & Gray, 1995). From these financial statements,
2
relevant information can be deduced as well as the value of the business (Joachim Hoøegh-Krohn
& Knivsflå, 2000). Because of the comprehensive existence of accounting as well as increased
globalization, many regulators have throughout the years tried to standardize how accounting
should be conducted in order to facilitate comparability and similarity between companies (Marton
et al., 2010; Paulsson, 2006). Regulations of the US GAAP have historically had an impact on large
European companies which adopted the rules on a voluntary basis. These standardized rules were
however influenced by standards from the US which meant that companies from Europe had no
significant power to affect these rules. Therefore, in the 1990’s, the European Commission began
to put more emphasis on standards provided by IASC. This lead to broader options for European
companies which could choose to apply either US GAAP or IAS (Alexander, Britton, Jorissen,
Hoogendoorn, & Van Mourik, 2014).
Companies located and operating within the EU contributed to the rapid growth of adopters of
IAS after 1 January 2005 (Daske & Gebhardt, 2006). This due to the Regulation (EC) No
1606/2002 (European Commission) which made it compulsory for companies to implement the
standards provided by IASB and arrange the consolidated accounts in accordance with these. The
compliance with the standards was mandatory, but this was not something that was seen as
unfavourable according to some European listed companies. This because of the perception that
the standards would lead to increased transparency as well as an enhanced comparison between
companies (Jermakowicz & Gornik-Tomaszewski, 2006). At the present time, IFRS is mandatory
for all listed companies within the EU as soon as they have been approved by the union
(Baboukardos et al., 2016).
Apparently, there have been some developments with respect to accounting in the private sector
but some changes are also visible within the public sector which have been in effect for the last 30
years. Previously, the publicly owned organizations have used accounting models developed
specifically for their sector. The change has led to a shift from those old specific accounting models
to models used in the private sector which have resulted in accounting nowadays are conducted on
an accrual basis (Falkman & Orrbeck, 2001). The shift to accrual accounting was expected to
provide information useful for both internal and external purposes that was more functional in the
long-term assessment of public financial sustainability. This to improve the government’s
transparency and accountability (Grossi & Soverchia, 2011).
3
The financial crisis in the 21th century has changed the view of the importance of attaining some
consensus in harmonization of financial reporting within the public sector and there are currently
some international initiatives to regulate this (Falkman, 2012). The European Commission is
engaged with this subject and are supposed to examine the possibilities of achieving some sort of
harmonization among the member states within the European Union. Despite this investigation,
there are some problems associated with trying to achieve harmonization of financial reporting
within the public sector. One of these is the question of who the real users of the financial
information, provided by public sector authorities, are. Although there seem to be some problems
with this, harmonization would lead to a reduction of the amount of transaction costs for the
society (Falkman, 2013).
Up until recently, the value of companies has been dependent on the resources visible for the
common man’s sight. Although there has been a transfer of where to put emphasis when trying to
make an evaluation of a company or organization (The Economist, 2006). Intangible assets are
now, more than ever, in many companies one of the main components in order for companies to
run their everyday business. Research stresses this phenomenon and states that as much as 80
percent of some organizations’ value is available in the intangible assets (Ocean Tomo, LLC, 2015).
Despite this increase in the amount of intangible assets, there are some problems associated with
them. Intangible assets are, due to their nature, difficult to measure. This is why it was common
that companies until the latter of the 1990´s expensed these assets and excluded them from the
balance sheet (Marton et al., 2010). However, this prudence in measurement was criticized.
Nowadays, there has been an increase in the value but also in the amount of intangibles assets
which have caused problems related to the valuation of these assets. IASB tries to deal with this
and has adopted the standard called IAS 38, which contains recommendations of how intangible
assets should be measured (Marton et al., 2010).
1.2 Problem discussion
Organizations have different aims with their accounting depending on whether they are privately-
or publicly owned. The intention with government accounting is not to make profit but to stick to
the budget and be as cost effective as possible (Tagesson, 2014). In organizations owned by the
Swedish government, the business is divided into two different parts; one budget for their daily
business, and one for the investments which are financed by loans from the state budget
(Ekonomistyrningsverket, 2012). There might therefore be a problem to allocate costs to the right
budget and purpose; money intended for the operating activities should not be used for

4
investments and vice versa. This potential problem is even more visible when trying to deal with
intangible assets which inherently are difficult to measure (Yallwe & Buscemi, 2014; Stolowy &
Jeny-Cazavan, 2001; Sahut, Boulerne, & Teulon, 2011).
Government owned organizations have to allocate the costs for their intangible assets in a proper
way and they have to estimate what is operating costs and what is costs due to investments
(Ekonomistyrningsverket, 2012). This is especially important since the government is only financed
by tax revenues (Tagesson, 2014; Ekonomistyrningsverket, 2012) and it could be tempting to
allocate costs differently than is originally intended. In such a case, authorities could allocate costs
associated with their daily business as cost due to investments. When this situation occurs, the
intention with government accounting will be affected in some way.
The modernized world implies a larger demand for knowledge and technology (Edquist, 2011) and
Bandukwala (2005) says organizations nowadays have intangible assets in their business to achieve
growth and profit. Those assets are associated with complexity of several reasons, for instance
when a company faces a potential liquidation. Intangible assets then have no resale value and if
these assets are valued too high in a liquidation, this might affect stakeholders, and mainly the
creditors. Therefore, intangible assets, and internally generated ones, are not of secure character
and they will probably not have a value in a liquidation (Anderson & Prezas, 1999; Bandukwala,
2005).
Because of the complexity of intangible assets, the disclosed information by the organizations
becomes important, especially since this information affects decisions made by investors in the
private sector (Meek, Roberts, & Gray, 1995). For instance, an organization could choose to
expense its internally generated intangible assets directly to get a lower result and therefore also a
lower tax. They could also overestimate their investments to give the impression of a better
financial performance (Lightstone & Driscoll, 2008), which could also be the case in the public
sector. Due to this, the measurement of intangible assets and internally generated ones might differ
between the private- and the public sector.
5
1.3 Research question
Private companies and public authorities operate in accordance with legislation and international
accounting standards. These binding regulations might differ in content due to which sector the
companies operate within. Due to the fact that intangible assets are difficult to measure, it would
be interesting to see whether the legislators have different views in how to measure intangibles.
Therefore, the following question that will be addressed in this study is:
How do the accounting standards in the private- and public sector contribute to potential
differences in the valuation and measurement of intangible assets?
1.4 Purpose
The purpose of this study is to see whether there are any existing differences in how to measure
and value intangible assets and internally generated ones between listed companies in the private
sector and authorities operating in the public sector. The report aims to be conducted with an
approach of stakeholder theory as well as disclosure and legitimacy theory.
1.5 Delimitations
The emphasis of this study is on the accounting for intangible assets as well as internally generated
intangible assets. These are examined within the Swedish public sector as well as some sampled
listed companies within the Swedish private sector. Only companies within the Swedish stock
market will be examined and the ones with similar characteristics as authorities within the public
sector will be selected and represented in this study. The empirical material will be based on annual
reports from both the Swedish government and from the examined companies as well as statistics
published by Statistics Sweden of the time-period of 2009-2014.
Since the purpose with this study is is to see whether there are any existing differences in how to
measure and value intangible assets and internally generated ones between listed companies in the
private sector and authorities operating in the public sector, only legislation and standards
concerning intangible assets, and internally generated ones, are used and presented in this paper.
When examining the intangible assets, and internally generated ones, in the selected companies,
regard has not been taken to goodwill. This since those types of assets are not available in the
public sector. Neither have consideration been taken to ongoing legislative developments.

6
1.6 Contribution
The aim of this study is to contribute to an increased awareness of that accounting differs
dependent of which sector an organization operates within. Through an explanation of how
accounting is conducted within both the public- and private sector, the intention is to give a greater
understanding for the measurement and valuation of intangible assets. Moreover, this study aims
to enhance practitioners’ awareness of the need for more uniformed accounting regulations and
standards, especially for intangible assets, in order to create more comparability between those
sectors.
1.7 Thesis outline
The framing of this study is outlined as follows. The first chapter aims to give an introduction to
the study. This is done through a background where the topic is presented and the problem is
discussed. The purpose and research question of this study is presented in the end of the first
chapter.
In the second chapter, the frame of reference of this study is presented. The chapter aims to
provide some fundamental knowledge about intangible assets, and the internally generated ones.
First, there will be a presentation of regulation IAS 38, which is made for companies operating in
the private sector. This will be followed by a description of accounting in the public sector in
Sweden, and also about how the regulations deal with intangible assets. Finally, there will be a
presentation of different theories that could explain the organizational phenomenon related to
intangible assets and their measurement.
The intention with the third chapter is to clarify how this study has been conducted. The aim of
this chapter is to give a description of choices and the motives behind these, but also how these
could have had an impact in this study. The purpose of this chapter is to enhance the possibilities
for the reader to measure the reliability and validity of this study.
In the fourth chapter, the empirical findings of this study is presented. Data from examined annual
reports from the government of Sweden and listed companies in Sweden is presented. The
intention with this chapter is to provide the reader with information about the presence of
intangible assets and internally generated ones in authorities as well as companies.

7
The fifth chapter has the intention to connect the empirical findings with the frame of reference.
In this chapter, the research question is considered to be the fundament for the analysis that is
presented. The aim with the analysis is to, in the upcoming chapter, draw a conclusion.
The intention with the sixth chapter is to draw a conclusion based on what is previously presented
in this study. Therefore, the research question is answered and hence the purpose of this study is
fulfilled. Moreover, critiques and implications of this study is presented as well as ethical and social
issues. This chapter ends with some suggestions for future studies within the subject.

8
2 Frame of reference
This chapter contains general information about intangible assets and especially the internally generated ones. In order to meet the purpose of this study, an observation of the characteristics of private- and public sector accounting will be included with additional focus on Sweden as well as different accounting theories. The intention with this chapter is to facilitate the understanding of this topic and later on also connect this to the empirical material and the purpose of this study.
2.1 Private sector accounting
IASC was founded in the year of 1973 with the aim to achieve harmonization in accounting
between companies all over the world (Marton et al., 2010). Not until many years later, more
precisely in the latter of the 20th century, a growth became visible in the number of companies that
adopted IAS provided by this organization (Daske & Gebhardt, 2006). By the year of 2001, some
changes within IASC was made and the organization eventually renamed itself to IASB. The
purpose with IASB is to develop standards within accounting that should not be based on rules
but on principles. These principles should provide a guideline to companies using the standards
but it is the companies´ responsibility to interpret the given information within their organizations.
The standards of IASB have different names depending on when they were published. Standards
completed before the reorganization are named IAS and the ones created afterwards are called
IFRS (Baboukardos et al., 2016).
Organizations within the private sector often have the intention and aim to make profit (Tagesson,
2014). When organizations in the private sector seek to raise equity, they do an initial public offering
where external shareholders meet this need. Later on, when the organizations are listed on a
publicly traded market, the financing is made mainly by profit earned from previous periods and
debt (Jenkinson & Ljungqvist, 2001). Swedish listed companies are obliged to disclose information
about their financial position and this should give a true and fair view of them (IAS 1, 2005, p. 15).
The information disclosed by the company is useful for both present and potential investors as
well as other stakeholders (International Accounting Standards Board, 2010).
2.2 Public sector accounting
Whilst there have been progresses within the business community concerning the efforts made
internationally for achieving transparency in accounting, the situation and the financial reporting
has been different for the public sector. There has been a lack of efforts similar to the actions taken
by the private business community which have also meant an absence of harmonization (Falkman,

9
2012). This because of the difference in structure of the public sector accounting among countries
(Falkman, 2013). The lack of efforts might also have an explanation of that there have always been
requirements made by politicians on companies within the private sector. Conversely, it has not
been the same situation for organizations that operates within the public sector since the politicians
have not been just as eager as putting requirements on themselves (Lennartsson, 2012).
The biggest difference between a public sector organization and a private organization is that the
aim in the public sector is not to make profit. Instead, public sector organizations should provide
citizens with goods and services, and meet different political policy objectives (Tagesson, 2014).
Furthermore, authorities within the public sector do not have any traditional owner, meaning that
there is no one that requires yield of return in the same way compared to the private sector
(Falkman & Orrbeck, 2001). Government accounting also has three main purposes; to safeguard
the public treasury by preventing and detecting corruption and graft, to facilitate sound financial
management within the government accounting, and to help government to discharge public
accountability (Rayegan, Parveizi, Nazari, & Emami, 2012). In the Swedish public sector,
authorities with losses can borrow money from authorities with profit which implies that the
government has more control because of this transaction allocation (Ekonomistyrningsverket,
2012).
Responsible for the generally accepted accounting principles in the Swedish public sector is ESV
who is the central administrative agency under the Ministry of Finance. ESV develops efficient
financial management for organizations owned by the public sector, this as an instrument to control
the authorities, and coordinates the internal audit in the public sector (Ekonomistyrningsverket,
2016a).
Budgeting in public sector organizations differs from organizations operating in the private sector.
In the public sector, organizations are assigned resources in order to run their daily business and
serve the citizens. This is in opposite to private firms who often operate in order to make profit
(Tagesson, 2014). The basic principle with financial and management accounting in the public
sector is that resources should be equivalent to the authority’s costs in order to meet the public
sector's commitment. Meaning that those authorities owned by the public sector and their activities
should not generate any profit or deficit. One of the most common ways in financing organizations
operating in the public sector is by awarded grants from the state budget and ordered by the
authority. These grants should cover costs related to the daily business and not costs associated
with investments (Ekonomistyrningsverket, 2012).

10
Authorities owned by the public sector in Sweden are financed with different resources, mainly by
grants, subsidies and fees. The most common one is grants, where the Swedish government assigns
these from the state budget (Ekonomistyrningsverket, 2012). In the Swedish government there is
a link between tangible assets and the investments, which contributes to that each funding is tied
to specific assets. Investments made for new assets is financed by loans in the National Debt
Office, but also from grants, gifts and donations, sales proceed and leasing. The main rule is that
assets should be financed by loan from the National Debt Office. It is although unusual that
authorities manage assets to obtain economic benefits in terms of yield or future increases in value
(Ekonomistyrningsverket, 2012).
2.3 Intangible assets
Financial statements are conducted with the purpose to disclose information that could be of
interest for stakeholders. Since intangible assets are part of several companies’ business, they should
therefore be recognized in the financial statements (Joachim Hoøegh-Krohn & Knivsflå, 2000).
Before the implementation of Regulation (EC) No 1606/2002 (European Commission),
accounting for intangible assets in the private sector were strongly dependent on which country
the companies were operating in. This diversity in how the systems of accounting dealt with
intangible assets implied a difficulty in whether the accountants should capitalize or expense these
assets directly (Sahut, Boulerne, & Teulon, 2011).
Bandukwala (2005) states that it is important to have in mind that all companies have some
intangible assets to be able to growth and make profit. Without these assets, the organization would
only consist of tangibles such as property, plant and equipment, hence there would be no economic
reasons for the company’s existence. However, in a potential liquidation of an organization,
intangible assets are linked with some sort of problem, this since they are perceived as “blue-sky”
and thereby become immaterial in an event like this (Bandukwala, 2005).
Accounting for intangible assets is associated with complexity and the existing accounting for these
peculiar items face criticism. There are some perceptions that there is a lack of comprehensive and
adequate guidance about the intangible assets and this contributes to a contradiction in the
measurement of these items (Yallwe & Buscemi, 2014). Simultaneously, intangible assets do not
provide cash flows, which is the case for tangible assets, which implies that they are not able to
cover the debt of an organization (Anderson & Prezas, 1999).

11
The complexity of intangible assets is also linked to the definitions of them since they do not
contain a clear and precise explanation of what could be recognized as intangibles. Instead, these
definitions often include a list where previously recognized intangible assets are mentioned. There
are two reasons for this; one of which explains that there is nothing that really differs between
tangible or intangible assets, and the other states that “there is no theoretical conceptual framework
behind the approaches to intangible assets.” (Stolowy & Jeny-Cazavan, 2001, p. 484).
The requirements for an asset to be capitalized could be seen as pretty restrictive and might lead
to situations where companies who have adopted the international standards choose to exclude
potential intangible assets in their balance sheets. In addition, there might also be a transfer of
intangible items that is of unidentifiable character in the direction of becoming goodwill. There is
also a possible situation that some intangible assets that currently do not fulfil the requirements of
separate capitalization in accordance with the standards instead are recognized as goodwill. This
was actually the case in 2005 when it became mandatory for European listed companies to adopt
the standards provided by IASB. The issue with this situation is that the measurement of goodwill
could be affected. This for the reason that the standards originally created for goodwill will be
applied on items that fails to comply with the goodwill definition but also is not considered to be
intangible assets (Sahut, Boulerne, & Teulon, 2011).
Intangible assets are expected to generate some benefits in the future which is why the company
has to measure the value of them. For the tangible assets to be recognized in the balance sheet, the
requirements are identical as for the intangible assets, which is why the accounting should be
conducted in an equal way independently of the character of the assets (Joachim Hoøegh-Krohn
& Knivsflå, 2000). Prudence affects the way companies perceive the possibility to gain economic
benefit in the future from intangible assets. This could affect whether companies, or for that matter
the standard-setters, intentionally avoid to recognize items that could fall into the scope of being
intangible assets. Severe requirements of actually being recognized could lead to that companies
instead choose to expense the costs of these items directly. Another consequence of prudence is
when companies try to re-evaluate intangible assets through impairment (Joachim Hoøegh-Krohn
& Knivsflå, 2000).
Joachim Hoøegh-Krohn and Knivsflå (2000) also believe that there is an existing conservatism
among organizations that operates as standard-setters and legislators when the accounting for
intangible assets are made. This because of the fact that some require an instant expensing of costs
related to research and development. Or simply, they just avoid a common use of capitalizing these

12
costs through some complicated recognition criteria. Instead of just capitalizing intangible assets
of uncertain character, Joachim Hoøegh-Krohn and Knivsflå (2000) propose that it should be a
possibility to capitalize the costs of these assets immediately when the criteria for recognition is
visible.
While Joachim Hoøegh-Krohn and Knivsflå (2000) as well as Yallwe and Buscemi (2014) argue
that companies should measure their intangible assets, others have a more critical view of this.
Kanodia, Sapra and Venugopalan (2004, p. 116) state that “intangibles should be measured only
when their relative importance in constituting the firm’s capital stock is high and when they can be
measured with sufficiently high precision.”. Further, they suggest that it might not even be
appropriate to measure intangible assets (Kanodia, Sapra, & Venugopalan, 2004).
Watts (2003) is also critical to standard setters and what they say about the measurement of
intangible assets since they are, according to him, too conservative. This implies that managers
have too much influence of the valuation of intangible assets and might overestimate the actual
value of them. Additionally, the research of Jones (2011) argues that a common situation in failing
firms is that they tend to capitalize intangible assets more aggressively than organizations being
more successful.
2.3.1 Intangible assets in Swedish private sector accounting
The definition of intangible assets and how to recognize them in accounting are included in
different standards provided by IASB. Those assets are specific in their character, which is why
they are mentioned in a certain standard. Intangible assets that are not associated with, or
mentioned by, any specific standard are regulated in IAS 38. This standard is of a more general
character and contains information about the requirements of the intangible assets and where to
recognize them (IAS 38, p. 1). The designation of intangible assets is attributable to two
requirements; they have to be controlled by the company and they are expected to generate some
economic benefits in the future (IAS 38, p. 8).
An intangible asset is, according to IAS 38, defined as being “an identifiable non-monetary asset
without physical substance” (IAS 38, p. 8). In accordance with the requirement of identifiability,
the potential intangible asset has to be either separable from the business, or the owner has to
possess contractual or other legal rights associated with the asset. The identifiability also enables
the intangible asset to be distinguished from goodwill, which is likewise of intangible character but
instead often is derived from business combinations (IAS 38, p. 11).

13
According to IAS 38, one prerequisite for intangible assets to be recognized by the company in
their financial statement is that the requirements of identifiability, control and future economic
benefits are met. Recognition should also be made if it is likely that the asset and the prospected
benefits linked with this will be assigned to the controlling business. Moreover, “the cost of the
asset can be measured reliably.” (IAS 38, p. 18). IAS 38 also imposes a requirement on the
management to use plausible and sustainable assumptions when trying to estimate the useful life
and the economic conditions of the intangible asset.
2.3.2 Intangible assets in the Swedish public sector accounting
In the beginning of the 21th century, the requirements for measuring intangibles within the public
sector were strengthened. This to achieve more uniformed annual reports and increase the value
in information for the stakeholders (Paulsson, 2006). The criteria of an intangible asset within the
public sector is not different from the private sector, thus it has to be an identifiable asset without
natural substance and of non-monetary character. The most common intangible assets in the public
sector in Sweden are internally generated IT-systems and acquired licenses, but other examples are
software, prototypes and models specific for their business activities (Ekonomistyrningsverket,
2016b).
Similar as in the private sector, intangible assets within the public sector is defined in FÅB 5:2 (SFS
2000:605) as “identifiable, non-monetary asset without physical substance which is used for
production or supply of goods and services or for administrative purposes.”1 As in the private
sector, the recognition criteria for intangible assets in the public sector is that they have to be
controlled by the authority, it is a result of a past event and it is expected to give a potential
economic benefit or service in the future (Ekonomistyrningsverket, 2016b). Furthermore, the
recognition criteria also state that a) the expected economic benefit or service potential that is
associated with the ownership of the intangible asset will be supplied to the authority, and b) the
purchase value could be measured reliably (Ekonomistyrningsverket, 2016b).
1 A translation of the Swedish definition which is ”En immateriell anläggningstillgång är en identifierbar, icke-monetär tillgång utan fysisk substans som används för produktion eller tillhandahållande av varor eller tjänster eller föradministrativa ändamål.” (SFS 2000:605).
14
2.3.3 Implications of the adoption of IAS/IFRS in Sweden
The quality of accounting has increased when companies have adopted IAS/IFRS (Barth,
Landsman, & Lang, 2008). Additionally, research of three European countries shows that these
standards have improved the perception of disclosure quality. This is independently whether the
companies have adopted the standards on a voluntarily or mandatory basis (Daske & Gebhardt,
2006). Investments in intangible assets began to increase in Sweden in the mid 1990’s which has
led to the Swedish economy being more dependent on these type of investments (Edquist, 2011).
During the transformation period where the adoption of IAS/IFRS began, the total value of
intangible assets increased by over 25 percent for companies in Sweden. It should be added that
also the information provided from intangible assets has increased (Sahut, Boulerne, & Teulon,
2011).
Intangible assets are perceived as being more informative than goodwill because of the stricter
requirements from IFRS for an item to be recognized. Therefore, investors perceive the intangible
assets as being a link to future economic benefits since they are more rent-generating. Intangible
assets, goodwill excluded, seem to be of high relevance in Sweden since they are seen as important
sources of information, and moreover reliable ones. Investors in Sweden were not affected in their
perception of the information content of intangible assets when an adoption of IAS 38 was
conducted. The adoption of IAS 38 has led to companies classifying their intangible assets in a
different way because the classification is no longer in accordance with the standard. Additionally,
an adjustment of the value of the intangible assets have been conducted. The purpose of IAS 38
seems to have been realized since the stricter requirements of capitalization have increased in the
importance of trustworthy information (Sahut, Boulerne, & Teulon, 2011).
The implementation of IAS 38 created a common concern among several companies because of
its complexity (Sahut, Boulerne, & Teulon, 2011). These thoughts seemed to be linked with the
recognition of intangible assets. The problem has gradually grown to its extent and is currently an
essential challenge for standard-setting organizations to cope with (Joachim Hoøegh-Krohn &
Knivsflå, 2000). According to some observers, standard-setters of international accounting
principles have to perform some modifications of the already existing standards about intangible
assets. This due to inaccuracies in how companies value these items in the financial statements.
Sometimes, a recognition is not even made and this could lead to investments in intangible assets
might get affected in an unfavourable way (Skinner, 2008).

15
2.4 Internally generated intangible assets
Intangible assets could be acquired from more than just purchases, they might as well be created
within the company as a result of different activities. The future economic benefits from intangible
assets that are created internally are difficult to measure and sometimes also not that trustworthy,
which is why there is a proposal that the companies should expense with conditional reversion
(Joachim Hoøegh-Krohn & Knivsflå, 2000). An item fails to meet the recognition criteria for being
an asset when the potential benefits are not beyond reasonable certainty. This is why a company
should expense the costs attributable to the asset and this is made in the phase these costs arose
(Joachim Hoøegh-Krohn & Knivsflå, 2000). The difficulty with the costs of internally generated
intangible assets is the measurement since they have already been expensed when the company
decides to categorize them as assets (Pkf International Ltd, 2015). The matching principle states
that when an asset of intangible character is created internally, capitalization of the costs for this
item should be made as well as subsequent revaluation and amortization of the value of the asset
during its useful economic life (Joachim Hoøegh-Krohn & Knivsflå, 2000).
The conditions of when to capitalize internally generated intangible assets could be seen as limiting
and because of this, financial information could become less comparable and be reduced in the
amount of transparency if certain situations occur. For instance, companies who expense the costs
for internally generated potential assets seem to have a reduced amount of value that could be
obtained from the disclosed financial information compared to other companies whose growth in
intangibles is attributable to other activities, such as acquisitions and mergers (Sahut, Boulerne, &
Teulon, 2011). In addition, stakeholders might not be given enough information about a company’s
financial status. This because of the potential inaccuracies in the accounting where internally
generated intangible assets might not be capitalized by the company since the accounting rules
impedes a measurement of these assets (Wilson & Stenson, 2008).
2.4.1 Internally generated intangible assets in the private sector
Internally generated intangible assets have the same requirements for recognition as other
intangibles mentioned in IAS 38, that is that they have to be identified, there has to be some
prediction that the asset will generate economic benefits in the future and the cost of the asset has
to be determined in a reliable way (IAS 38, p. 51). Research and development are the two activities
that refers to the classification of internally generated intangible assets (IAS 38, p. 52). Costs that
have occurred because of these activities are difficult to separate, particularly when these costs are
16
associated with intangible assets whose measurement of the future benefits is somewhat difficult
(Pkf International Ltd, 2015).
There is a difference between research and development according to IAS 38 which states that
costs attributable to the period when the research is made have to be expensed directly while costs
in the period of development can be capitalized. This is only permitted if the criteria of recognizing
assets as intangibles are met. Nevertheless, if the costs in the period of development have been
expensed, there is no possibility to capitalize these later on (Pkf International Ltd, 2015). The
reason for why a company cannot capitalize costs in the period of research is that there is a distrust
in whether the future economic benefits associated with this project will occur. Conversely, this
applies to costs in the development period since the project is in its latter phase and the costs could
therefore be capitalized immediately since it is possible to measure the future benefits (IAS 38, p.
58). Moreover, IAS 38 contains some conditions that have to be fulfilled for a development activity
to be capitalized within a company.
2.4.2 Internally generated intangible assets in the public sector
Many authorities develop their own intangible assets, for instance specific IT-systems. The
assessment is if those assets are classified as internally generated intangible ones or not and whether
they fulfil the requirements to be recognized as assets in the balance sheet
(Ekonomistyrningsverket, 2012). To determine if the internally generated intangible asset fulfil the
requirements to be recognized in the balance sheet, this process is divided into two phases; research
and development (Ekonomistyrningsverket, 2016b).
Costs associated with research in authorities within the public sector can never be recognized as
assets in the balance sheet. Those costs should instead be recognized as costs directly in the income
statement. Criteria for development activities and what is required of an item to be recognized as
an internally generated intangible asset are mentioned in FÅB (SFS 2000:605). The development
phase in the public sector is similar to the one in the private sector, whereas the authority in some
cases could identify an internally generated intangible asset and prove that it will bring an economic
benefit in the future (Ekonomistyrningsverket, 2016b).

17
2.5 Stakeholder theory
The recognition of assets in the balance sheet, and especially the recognition of intangible assets,
is in some case difficult (Baboukardos et al., 2016). Whether the assets are recognized or not will
affect the annual reports, and thereby it could also affect the stakeholders in different ways. This
implies that it is important to understand who the stakeholders are and what their demand is. The
stakeholder theory describes different stakeholders and their relationships with the organization.
Stakeholders could also be divided in either internal or external ones. In opposite to the common
view that only shareholders should be seen as stakeholders, this theory extends the perspective and
includes more parties as well such as employees, suppliers, customers, financers, communities and
government, competitors and owners (Grönlund, Tagesson, & Öhman, 2010). Scholars have
during the years developed and added their point of view to this theory, which was initially
developed by R. Edward Freeman (2010) in his landmark book named Strategic Management: A
Stakeholder approach. The definition of who is a stakeholder differs from scholar to scholar
(Mitchell, Agle, & Wood, 1997).
Freeman (2010, p. 25) defines a stakeholder as someone that “…can affect or is affected by the
achievement of the organization's objectives”. Donaldson and Preston (1995, p. 67) claim that
stakeholders are “persons or groups with legitimate interest in procedural and/or substantive
aspects of corporate activity” and a stakeholder is “identified by their interest in the corporation,
whether the corporation has any corresponding functional interest in them”. According to this,
organizations’ and stakeholders’ relationship are mutually dependent on each other which implies
that it is of great importance for an organization to define their stakeholder. In order for an
organization to define their stakeholder, they both need to understand the behaviour of the
stakeholder and consider each and every one of the them (Bruzelius & Skärvad, 2004).
2.6 Disclosure and legitimacy theory
Disclosure is a concept used within accounting which means that a company publishes information
about their business (Rimmel, 2016). Accounting information is often required by shareholders
and other users to ease their process of making relevant decisions (Meek, Roberts, & Gray, 1995).
In authorities operating within the public sector, these users are primarily internal decision makers,
politicians and officials. Simultaneously, citizens could be seen as owners in an organization held
under the public sector because they get directly affected by the actions taken by the government
(Falkman & Orrbeck, 2001).
18
The demand of accounting information is accommodated by companies who voluntary disclose a
part of this information (Meek, Roberts, & Gray, 1995). Disclosure could also be mandatory for
companies and this is often made through financial statements and annual- and sustainability
reports. The companies could also describe how they comply with the different accounting
standards and other legislation (Rimmel, 2016).
Accounting standards have an impact on companies and their disclosure activities since the
standards require compulsory disclosures. Associated with this form of disclosure is high quality in
the information provided and low asymmetric information (Rimmel, 2016). Furthermore, the
quality of compulsory disclosures contributes to differences between companies with growth
opportunities. The asymmetric information will be high and the disclosure quality of a lower
amount when the companies have more opportunities to grow. Conversely, the disclosed
information by companies with a minimum chance to growth will be of greater quality and there
will be a low amount of asymmetric information produced (Core, 2001). The amount of
information that is disclosed is essentially higher in bigger companies compared to smaller ones
(Meek, Roberts, & Gray, 1995). Empirical studies show that there is a connection between
disclosure and credibility. There is a relationship between asymmetric information, the quality of
disclosure, initiatives taken by the management, and corporate governance (Core, 2001). Core
further states that there is a demand for developing the measurement of disclosure quality.
Companies have several different stakeholders which also implies that there are several interests to
considerate in the business. The communication and the way managers dealt with external parties
were one of the aims with the legitimacy theory in the sense that it sought to explain why managers
acted as they did (Magness, 2006). The legitimacy theory states that the frames of the society affect
the behaviour of companies since they aim to act within these frames. The fundament for this
theory is therefore that there is some sort of contract of social character between companies and
the society they operate within (Rimmel, 2016).
The subsequent reactions of disclosures have been observed through the legitimacy theory and
Lightstone and Driscoll (2008) have found a connection between disclosures made voluntarily and
symbolic legitimacy management. The disclosed information could include inaccuracies or
manipulations that seek to give a perception of the company as being legitimate. This despite the
increase in both expectations from the industry and requirements from legislators that the disclosed
information should be accurate (Lightstone & Driscoll, 2008).
19
Different expectations from the society pressures the companies to act in certain ways and this
could contribute to an increase in the amount of voluntary disclosure (Rimmel, 2016). Furthermore,
if the power of stakeholders is of a high amount, the active and strategic companies seem to put
more emphasis on disclosures that provides information about their responsibility in a social
manner (Magness, 2006).
20
3 Method
In this chapter, an explanation of how this study have been conducted is made. The intention is to describe which choices that have been made and why, but also how these might have affected this study. This chapter has the aim to give a possibility for the reader to make a perception of the reliability and validity of this study.
3.1 Choice of method
Research could be of either quantitative or qualitative character. The difference between these two
is the measurement which is a part of the quantitative research but not the qualitative. The
measurement of quantitative research reflects the collection and analysis of data whereas in the
qualitative research, emphasis is put on words rather than numbers (Bryman, 2012). In this study,
a combination of both quantitative and qualitative research is made. This due to the fact that a
qualitative approach is used when examining the measurement of the intangible assets in companies
and authorities. This is made through observations of annual reports from the organizations
concerned. Subsequently, the information obtained from the observations is used with the
intention to compare the development of values, but also the extent of these, for intangible assets
as well as internally generated ones between companies in the private sector and authorities in the
public sector. This approach will thereby be of a quantitative character.
One of the critiques facing the qualitative approach when conducting a research is that the
researchers might not be completely objective when choosing which source of information to use.
Instead, they are making a personal judgement and become selective in their approach (Bryman,
2012). This critique is, as a researcher, difficult to defend since one could never guarantee that the
study has been conducted with an objective approach. Valuations could be made subconsciously
and neither could we assure that this study has been completely objective. Despite this, the
intention has been to be as objective as possible when conducting this study.
To answer the research questions, a research strategy could be used in this orientation which will
provide a guidance for the selection of strategy (Yin, 2007). There are different research strategies
(Yin, 2007) and for this research, the most appropriate one is the case study. A case study is a
“Research strategy that involves the empirical investigation of a particular contemporary
phenomenon within its real-life context, using multiple sources of evidence.” (Saunders, Lewis, &
Thornhill, 2009, p. 588). This research design is suitable when trying to answer the questions “why”,
“what” and “how” (Saunders, Lewis, & Thornhill, 2009). There are although some concerns
associated with the case study design. One of these is that the researcher might have affected the
21
case study in an unfavourable way, for instance infringed some systematic procedures by being
disordered in the execution (Yin, 2014).
In this study, however, different cases have been examined but this examination has not been that
extensive. What has been studied is the value of both intangible assets and internally generated
ones, which also implies that the systematization has not been that difficult to conduct. This means
that an infringement of the data collection procedures is not visible. Another concern with the case
study design is the generalization from the findings, which could be difficult to do when there is a
single case that have been examined (Yin, 2014). Even though, this study is not based on a single
case but several which also implies that this concern is not applicable to the same extent. This study
aims to answer the research question of how the accounting standards in the private- and public
sector contributes to potential differences in the valuation and measurement of intangible assets.
Therefore, a case study is the most suitable one since it is in line with the purpose of this study.
3.2 Sampling
Sampling is a technique for the researcher to collect some specific information from a population.
Later on, the collected information is perceived as being representative for the whole population
which means that effort and time could be reduced. Sampling could be conducted with two
techniques; probability and non-probability. Probability sampling is not focused on specific items
within the population, each unit has equal chances of being selected. Conversely, non-probability
sampling ignores this random selection and focuses on generalization from the sampled data but
without any statistical grounds (Saunders, Lewis, & Thornhill, 2009). The purpose of this study is
not to make any statistical generalizations and therefore, a non-probability sampling technique is
used.
When conducting a study based on non-probability sampling, the delimitation of the sample is
dependent on the research questions and the objectives of the study (Saunders, Lewis, & Thornhill,
2009). Purposive sampling is a technique to draw a sample out of a population. Specific for this
technique is that the researcher has a chance to affect the selection of the sample by its own
opinions, this to better meet the objectives and research questions of the study. The characteristics
of this technique is that small samples are used which means that it is suitable for case studies
(Saunders, Lewis, & Thornhill, 2009). Because of the large amount of companies within the private
sector in Sweden, it would have been impossible to examine all representatives and their annual
reports. Therefore, a selection has been made due to the different branches. After this selection,
an examination of each branch have been made to see which companies that were capable of being
22
representative in this study. This selection has been based on the researchers’ judgment and the
objectives of this study. Because of this, a purposive sampling technique is used.
The selection of branches has been based on their equivalence with the activities and services of
the public sector. This in order to reach more consensus and to achieve some comparability of the
value of intangible assets, and the internally generated ones, between those sectors. For this
selection, information provided by Statistics Sweden have been used which is further mentioned
in section 3.3.3. The branches that have been selected for this study is: Information service
companies; Headquarters, consultants’ firms within PR and communication together with
companies’ organization; Research- and development institutions; Employment agencies etc.; and
the Education system.2 These branches consist of knowledge- and service companies which are
similar to the activities in the public sector.
The examination of each branch has been made to see which companies that were capable of being
representative in this study. Since the public sector operates with substantial resources, one
constraint for being a comparable representative for the private sector is that the company’s
turnover has been significant. Therefore, a website which provides information about the biggest
companies according to branches based on turnovers in Sweden has been used to facilitate the
selection of companies (Nordic Netproducts AB). In this selection, consideration has only been
taken to the website’s branch classification as well as information from Statistics Sweden. This
implies that no regard has been taken to each specific company and their definition of their
business. An examination of the top 20 companies in each specific branch has been made to reach
the requirement of significant turnover. In order to answer the research question of this study, two
other criteria had to be fulfilled; the company had to be listed on OMX Stockholm and thereby
also obliged to apply the standards provided by IASB. The first two companies that fulfilled the
requirements would also be examined in this study.
When the selection process was finished, a total of seven companies that fulfilled all stated criteria
remained. After an examination of the annual reports in each specific company, only five of them
had internally generated intangible assets. This also meant that neither of the companies within the
branch of education system achieved the stated requirements, which is why no company within
this branch is represented in this study. The companies that have been represented in this study is
2 These branches have been translated from the Swedish definitions, which are: Informationstjänstföretag; Huvudkontor, konsultbyråer inom PR och kommunikation samt företags organisation; Forsknings- och utvecklingsinstitutioner; Arbetsförmedlingar, rekryteringsföretag, personaluthyrningsföretag o.d.; and Utbildningsväsendet.
23
Eniro Group AB, which belongs to the branch Information service companies, AstraZeneca,
operating within the branch Headquarters, consultants’ firms within PR and communication
together with companies’ organization, Swedish Orphan Biovitrum AB and Medivir AB, both
belonging to Research- and development institutions, and Poolia AB is the representative for
Employment agencies etc.
3.3 Data collection
Primary and secondary data could be used in the collection of relevant information in order to
conduct a research (Jacobsen, 2002). Primary data is information that is collected directly from the
source. The intention with this data is for the researcher to acquire information to the specific
purpose of the study. Conversely, secondary data could be compounded of information not created
for the specific study and this data is not obtained from the source directly (Saunders, Lewis, &
Thornhill, 2009). For this study, secondary data is used to collect the relevant information to answer
the purpose of the study. The main sources of secondary data are regulations and standards
provided by both IASB and ESV. Additionally, as a supplement, academic journals and other
relevant literature have been studied and used. Annual reports of the Swedish government as well
as different companies are used to fulfil the purpose of the study.
3.3.1 Frame of reference
The frame of reference has its focus on IAS 38 as well as standards about intangible assets provided
by ESV. A review of these standards had to be made in the beginning of this study in order to
achieve some understanding about the rules and the complexity of intangible assets. In the search
for relevant information to the frame of reference, different databases as well as published literature
have been used. In the search for standards provided by IASB, the EU’s official website has been
a helpful source of information. To attain information about standards for the public sector
accounting, publications provided by ESV as well as their webpage have been used.
Essential information about useful sources have been examined and later on the most appropriate
ones have been used in the research, this throughout the webpage of Jönköping University Library.
Scopus, which is a database, has been the main source when finding articles. In the research,
following keywords have been used: Intangible assets, Intangibles, Internally generated intangible assets, IAS
38, Public sector accounting and Government accounting. When the information of potentially relevant
articles has been collected, databases such as Business Source Premier and ABI/Inform have
provided several of the articles used in this study. Another database that has been used is FAR
24
Online, which is a Swedish webpage that provides information about, for instance, accounting rules
in Sweden. From this, articles about government accounting with focus on intangible assets have
been examined.
The section in the frame of reference that contains information about different theories and their
explanation of different phenomenon in organizations have been collected in a similar way as
mentioned above. Following key words have been used: Stakeholder theory, Stakeholder approach,
Disclosure, Disclosure theory and Legitimacy theory. These theories have been used to draw a conclusion
out of the empirical results in this study.
3.3.2 Information from annual reports
In this study, annual reports from December 31th from each fiscal year of 2009-2014 from the
Swedish government and annual reports from the examined companies have been studied. These
annual reports have been collected from the Swedish government’s webpage and from each
examined company’s webpage respectively. The annual reports have not been examined generally
since the purpose of this study focuses on intangible assets, and the internally generated ones.
Therefore, only the accounts in the balance sheets and notes concerning these assets have been
studied. This also implies that account only has been taken to the net value of these assets. In order
to get a comparable result, all values not presented in SEK have been converted from its currency.
The currency translation has been made with values from 31 December each year respectively.
Those values have been received from the currency converter at www.oanda.com.
When calculations of internally generated intangible assets have been made, acquisitions have not
been included. In situations where there is a lack of information in the annual reports of what is
due to acquisitions and what is due to own developments, the whole account has been included.
This to achieve a higher and more comparable result.
To find relevant information regarding the accounts of intangible assets and internally generated
ones, the “search tool” in Adobe Acrobat Reader have been used and the keywords in this research
have been Intangible assets, Internally developed intangible assets and Internally generated intangible assets.
When it was considered to be necessary, the Swedish translation of these words have been used.
25
3.3.3 Information from Statistics Sweden
Statistics provided from Statistics Sweden have been used to develop this study. The statistics used
are solely concerning information about different branches in the Swedish trade and industry. An
examination of the value of intangible assets within these branches have been made in order to
collect information and conduct a compilation of the total value of these assets within the private
sector. This compilation has been conducted through Excel where different calculations have been
made in order to see the value, but also the percentage changes of it.
3.4 Critics and implications of chosen method
As previously mentioned above, only secondary data have been used. It is advantageous to use
secondary data since the information is already existing and the researcher could evaluate this
directly. Because of this, the researcher could make relevant choices from the beginning of the
study which implies that the time could be used more effectively (Saunders, Lewis, & Thornhill,
2009). Additionally, when analysing secondary data, the researcher is able to use more and larger
sets of data. The secondary data is already published and available for others which could contribute
to it being of higher quality compared to primary data (Saunders, Lewis, & Thornhill, 2009).
The purpose of this study is to see whether there are any existing differences in how to measure
and value intangible assets and internally generated ones between listed companies in the private
sector and authorities operating in the public sector. According to this, an investigation and use of
primary data could be difficult and maybe not even motivated since it could be too costly and too
time consuming according to the limited period of time for this study. Disadvantages by using
secondary data is that the information observed might not be suitable for the researcher’s study
(Saunders, Lewis, & Thornhill, 2009). Furthermore, it is not guaranteed that secondary data is of
higher quality and it might not be published with an objective view and an evaluation of it has to
be made before use (Saunders, Lewis, & Thornhill, 2009). Despite these disadvantages of using
secondary data, they are not of enough relevance for take into account and therefore only secondary
data is used in this study.
Due to the fact that the sampling has not been as extensive as originally intended, a less amount of
companies have been examined in this study. This might meet some critics since it is difficult for
only five companies to represent the population and therefore the reality. Despite this, it might not
have been possible to get a comparable and consistent result when examining companies that

26
would not fulfil the requirements stated earlier. The research question of this study implied that
some conditions had to be meet in order to answer it. Therefore, the sample size is of a small
character but this can simultaneously be compared with the public sector authorities which are not
of a big amount in number either. The difference is that the public authorities have a greater
amount of money circulating, and therefore also a higher value of intangible assets and internally
generated ones, compared to the examined listed companies. Because of this difference in value, a
comparison has been made with respect to the percentage change instead of the change in value.
3.5 Data analysis
Reliability measures the quality of data; i.e. how consistent the findings are. This means that another
researcher should be able to replicate the study (Saunders, Lewis, & Thornhill, 2009). Because of
the fact that this study is conducted through observations of regulations as well as annual reports
of the Swedish government and different companies, it should not be difficult to make a similar
study. The information that have been used in this study is official and available on the internet as
well as in hard copies. When conducting a qualitative study, Bryman and Bell (2015) state that there
are some implications in how to control the reliability and Saunders, Lewis and Thornhill (2009, p.
156), state that “Care should also be taken when analysing the data to ensure that your data are
telling you what you think they are telling you.”
In consideration to the requirement above, it could be somewhat difficult to achieve reliability since
intangible assets, and the internally generated ones, is associated with complexity. The
measurement of intangible assets is widely debated and a careful interpretation have to be made
when studying this field. Nevertheless, this study has been conducted through extensive
observations of different articles and books that is currently available for analysis. If consideration
only had been taken to a few sources, it would have been difficult to get a broader view of this
controversial topic. Therefore, different sources of information have been observed and analysed
carefully to get a correct interpretation in this study.
The measurement of reliability also comprises some concerns about the person conducting the
study since the researcher might affect and/or interpret the information provided differently
(Saunders, Lewis, & Thornhill, 2009). Since this study has been conducted by two researchers, this
has often meant four different eyes when the information has been analysed and interpreted.
Because of this, one could expect that the risk of affecting the study by own interpretations have
been reduced.

27
Validity is a measurement tool which is about whether the data collected is in compliance with the
initial intensions, i.e. “really about what they appear to be about.” (Saunders, Lewis, & Thornhill,
2009, p. 157). There is a difference between internal and external validity. When the data collection
is consistent with what theories the researcher has developed, internal validity is notable.
Conversely, external validity is notable when the results of the study could be generally applied in
different social settings (Bryman & Bell, 2015). According to accounting standards, annual reports
should give a true and fair view of the organization. Since this study is conducted with reference to
annual reports, one has to believe that internal validity is reached. External validity is somewhat
more difficult to apply on this study since the purpose is not to show generalizability but to generate
some sort of understanding for how different organizations measure intangible assets and internally
generated ones.
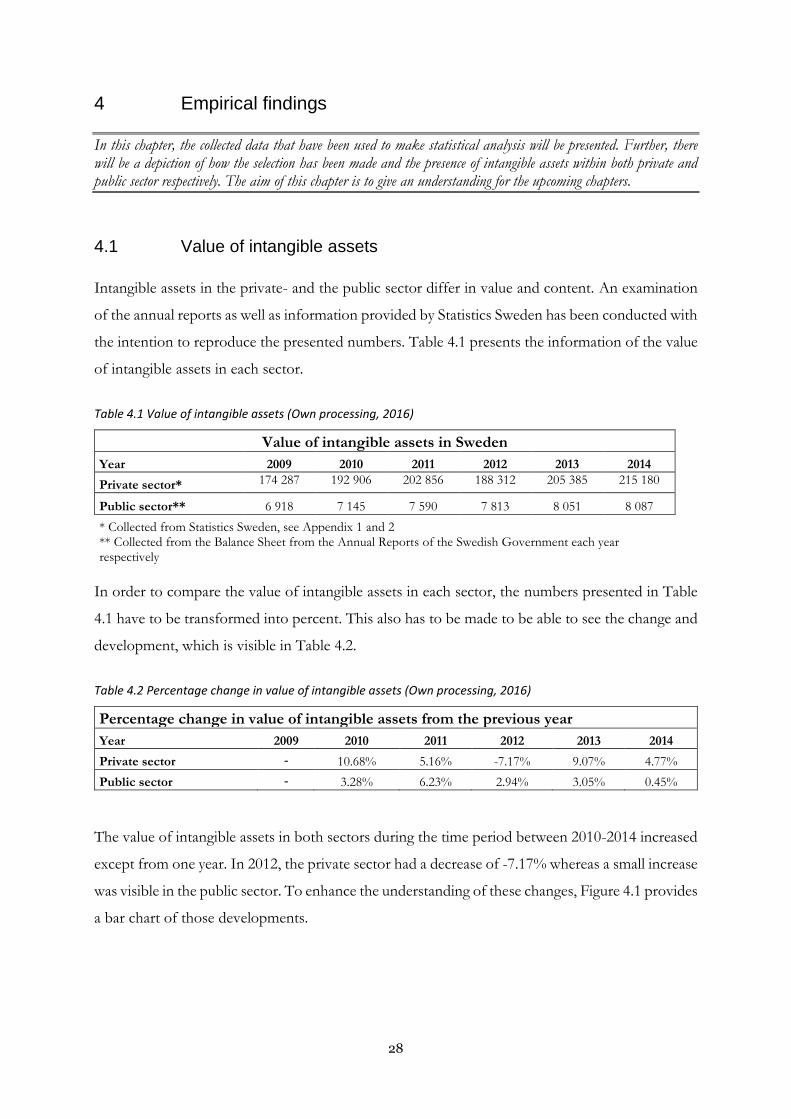
28
4 Empirical findings
In this chapter, the collected data that have been used to make statistical analysis will be presented. Further, there will be a depiction of how the selection has been made and the presence of intangible assets within both private and public sector respectively. The aim of this chapter is to give an understanding for the upcoming chapters.
4.1 Value of intangible assets
Intangible assets in the private- and the public sector differ in value and content. An examination
of the annual reports as well as information provided by Statistics Sweden has been conducted with
the intention to reproduce the presented numbers. Table 4.1 presents the information of the value
of intangible assets in each sector.
Table 4.1 Value of intangible assets (Own processing, 2016)
Value of intangible assets in Sweden
Year 2009 2010 2011 2012 2013 2014
Private sector* 174 287 192 906 202 856 188 312 205 385 215 180
Public sector** 6 918 7 145 7 590 7 813 8 051 8 087
* Collected from Statistics Sweden, see Appendix 1 and 2 ** Collected from the Balance Sheet from the Annual Reports of the Swedish Government each year respectively
In order to compare the value of intangible assets in each sector, the numbers presented in Table
4.1 have to be transformed into percent. This also has to be made to be able to see the change and
development, which is visible in Table 4.2.
Table 4.2 Percentage change in value of intangible assets (Own processing, 2016)
Percentage change in value of intangible assets from the previous year
Year 2009 2010 2011 2012 2013 2014
Private sector - 10.68% 5.16% -7.17% 9.07% 4.77%
Public sector - 3.28% 6.23% 2.94% 3.05% 0.45%
The value of intangible assets in both sectors during the time period between 2010-2014 increased
except from one year. In 2012, the private sector had a decrease of -7.17% whereas a small increase
was visible in the public sector. To enhance the understanding of these changes, Figure 4.1 provides
a bar chart of those developments.

29
From this table, it becomes more visible that the fluctuations in the private sector is of a greater
amount than in the public sector. The most significant changes with respect to increase in value in
the private sector were between 2009-2010, where there was an increase with 10.68% due to a raise
in value from 174 287 MSEK to 192 906 MSEK (Table 4.1), and between 2012-2013 were there
was an increase with 9.07% due to a raise in value from 188 312 MSEK to 205 385 MSEK (Table
4.1). A decrease in value was also visible between 2011-2012 where the value dropped with 7.17%
because of a change from 202 856 MSEK to 188 312 MSEK, also visible in Table 4.1. The most
significant change in the public sector was between 2010-2011 where the increase of intangible
assets was 6.23% since the value of these assets increased in amount from 7 145 MSEK to 7 590
MSEK which is visible in Table 4.1. The least change in value in the public sector was between
2013-2014 where the value of intangible assets increased with only 0.45% where there was an
increase in value from 8 051 MSEK to 8 087 MSEK.
4.2 Intangible assets in the public sector
Intangible assets in the public sector in Sweden mainly consist of costs for developments and
licenses for IT-software and similar rights (Regeringen, 2015, p. 7). The internally generated
intangible assets in the annual reports for the Swedish Government consist of capitalized
expenditures for developments, primarily of internally generated IT-systems and programs. This is
specifically stated in the annual reports of each year in Note 15. Table 4.3 provides the value of
intangible assets and internally generated ones each year respectively.
-10,00%
-5,00%
0,00%
5,00%
10,00%
15,00%
2010 2011 2012 2013 2014
Percentage changes of the value of intangible assets compared to previous year
Public sector Private sector
Figure 4.1 Percentage changes in value of intangible assets (Own processing, 2016).
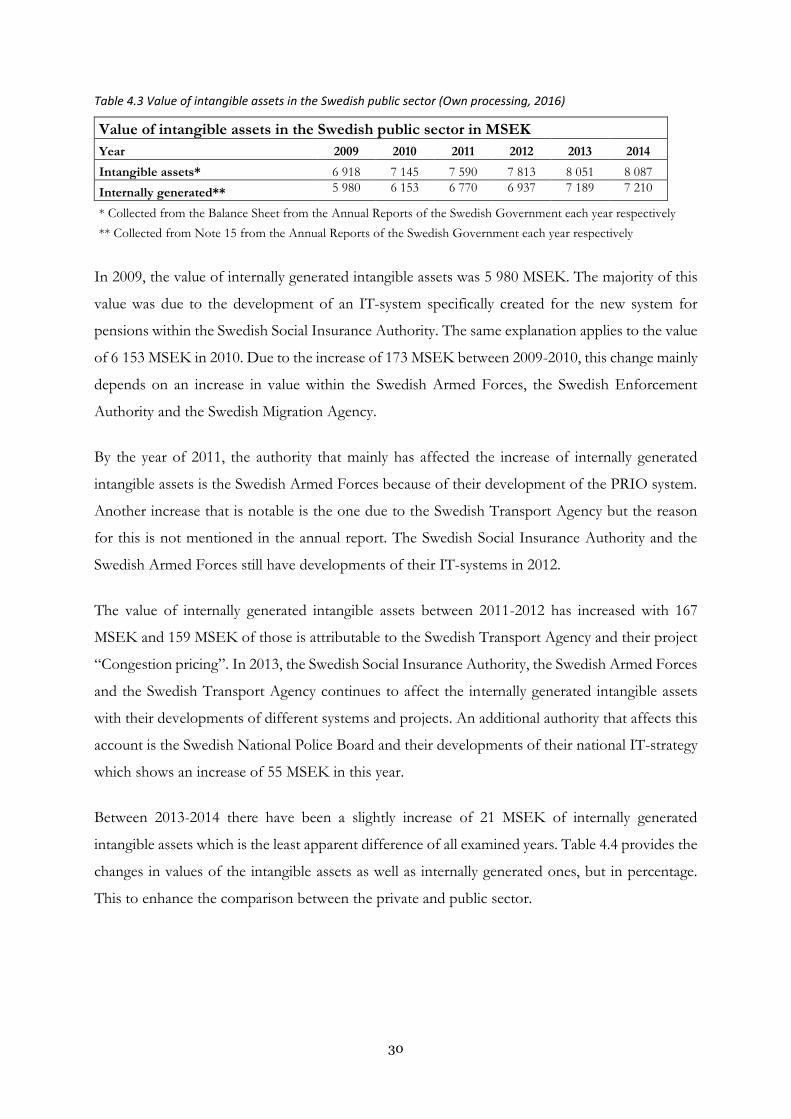
30
Table 4.3 Value of intangible assets in the Swedish public sector (Own processing, 2016)
Value of intangible assets in the Swedish public sector in MSEK
Year 2009 2010 2011 2012 2013 2014
Intangible assets* 6 918 7 145 7 590 7 813 8 051 8 087
Internally generated** 5 980 6 153 6 770 6 937 7 189 7 210
* Collected from the Balance Sheet from the Annual Reports of the Swedish Government each year respectively
** Collected from Note 15 from the Annual Reports of the Swedish Government each year respectively
In 2009, the value of internally generated intangible assets was 5 980 MSEK. The majority of this
value was due to the development of an IT-system specifically created for the new system for
pensions within the Swedish Social Insurance Authority. The same explanation applies to the value
of 6 153 MSEK in 2010. Due to the increase of 173 MSEK between 2009-2010, this change mainly
depends on an increase in value within the Swedish Armed Forces, the Swedish Enforcement
Authority and the Swedish Migration Agency.
By the year of 2011, the authority that mainly has affected the increase of internally generated
intangible assets is the Swedish Armed Forces because of their development of the PRIO system.
Another increase that is notable is the one due to the Swedish Transport Agency but the reason
for this is not mentioned in the annual report. The Swedish Social Insurance Authority and the
Swedish Armed Forces still have developments of their IT-systems in 2012.
The value of internally generated intangible assets between 2011-2012 has increased with 167
MSEK and 159 MSEK of those is attributable to the Swedish Transport Agency and their project
“Congestion pricing”. In 2013, the Swedish Social Insurance Authority, the Swedish Armed Forces
and the Swedish Transport Agency continues to affect the internally generated intangible assets
with their developments of different systems and projects. An additional authority that affects this
account is the Swedish National Police Board and their developments of their national IT-strategy
which shows an increase of 55 MSEK in this year.
Between 2013-2014 there have been a slightly increase of 21 MSEK of internally generated
intangible assets which is the least apparent difference of all examined years. Table 4.4 provides the
changes in values of the intangible assets as well as internally generated ones, but in percentage.
This to enhance the comparison between the private and public sector.

31
Table 4.4 Percentage change in value of intangible assets in the Public sector (Own processing, 2016)
Percentage change in value of intangible assets from the previous year
Year 2009 2010 2011 2012 2013 2014
Intangible assets - 3.28% 6.23% 2.94% 3.05% 0.45%
Internally generated - 2.89% 10.03% 2.47% 3.63% 0.29%
From Table 4.4, it is visible that the most significant difference between the changes of intangible
assets and internally generated ones is between 2010-2011 where the difference is 3.8 percentage
points. Conversely, the smallest difference is visible between 2013-2014 where the change consists
of 0.16 percentage points.
Table 4.5 provides information about the proportions of internally generated intangible assets
compared to intangible assets in general. This to facilitate a comparison between the proportions
of these assets in the Swedish government and companies within the private sector.
Table 4.5 Proportion of internally generated intangible assets (Own processing, 2016)
Proportion of internally generated intangible assets compared to intangible assets
Year 2009 2010 2011 2012 2013 2014
Value 86.44% 86.12% 89.20% 88.79% 89.29% 89.16%
The proportions of internally generated intangible assets compared to intangible assets is of a
significant amount. Internally generated intangible assets remains at a constant level above 86%
where the lowest amount of these assets is in 2010 and the highest is in 2013.
4.3 Intangible assets in the private sector
The intangible assets in the private sector sampled companies vary to their extent in the annual
reports. In Eniro Group AB, intangible assets consist of goodwill; trademarks with indefinite useful
life; trademarks, other; and customer relationships. The account that refers to goodwill has been
excluded from the calculations of the total amount of intangible assets in this study, which leaves
a lower value of these in the examined annual reports.
Internally generated intangible assets in Eniro Group AB is found in “Other intangible assets”
within the category “Internally developed assets”. In the annual reports of 2009 and 2010, this
information is found in Note 11 whereas between 2011-2014 the information is visible in Note 8.
By the year of 2013 and 2014, the value of “Other intangible assets” was due to product
development. In the previous examined years this category consisted of, among others, costs for
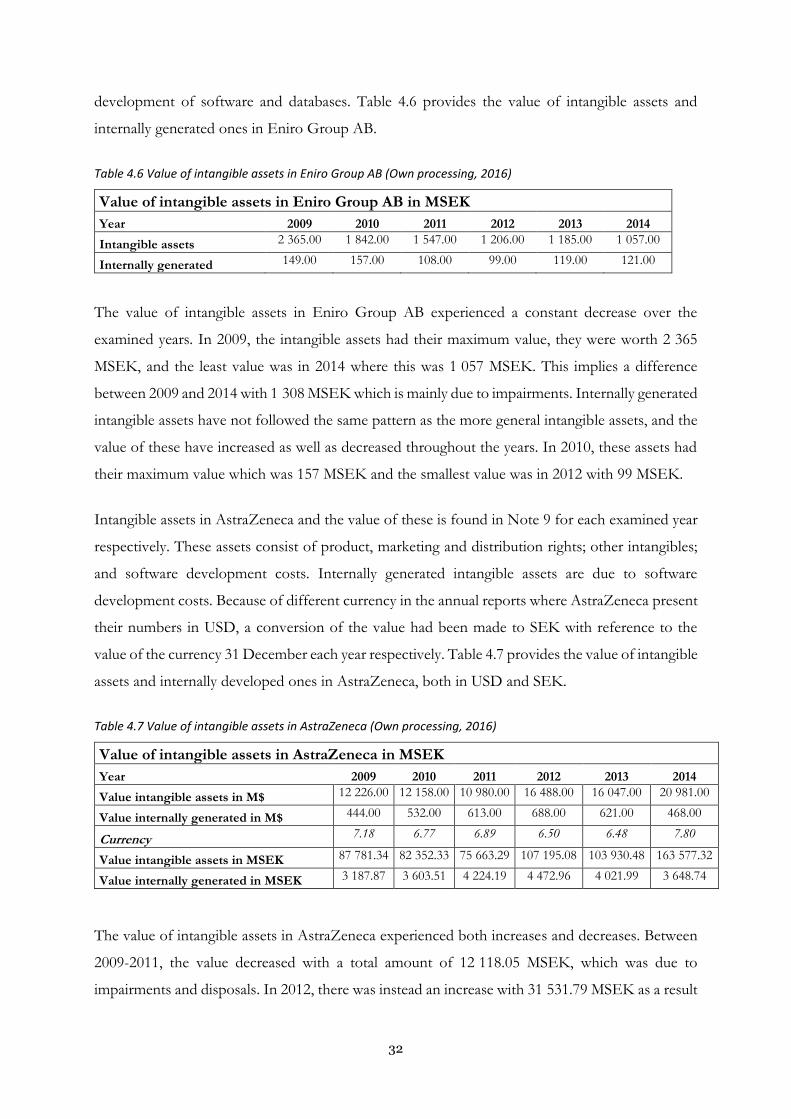
32
development of software and databases. Table 4.6 provides the value of intangible assets and
internally generated ones in Eniro Group AB.
Table 4.6 Value of intangible assets in Eniro Group AB (Own processing, 2016)
Value of intangible assets in Eniro Group AB in MSEK
Year 2009 2010 2011 2012 2013 2014
Intangible assets 2 365.00 1 842.00 1 547.00 1 206.00 1 185.00 1 057.00
Internally generated 149.00 157.00 108.00 99.00 119.00 121.00
The value of intangible assets in Eniro Group AB experienced a constant decrease over the
examined years. In 2009, the intangible assets had their maximum value, they were worth 2 365
MSEK, and the least value was in 2014 where this was 1 057 MSEK. This implies a difference
between 2009 and 2014 with 1 308 MSEK which is mainly due to impairments. Internally generated
intangible assets have not followed the same pattern as the more general intangible assets, and the
value of these have increased as well as decreased throughout the years. In 2010, these assets had
their maximum value which was 157 MSEK and the smallest value was in 2012 with 99 MSEK.
Intangible assets in AstraZeneca and the value of these is found in Note 9 for each examined year
respectively. These assets consist of product, marketing and distribution rights; other intangibles;
and software development costs. Internally generated intangible assets are due to software
development costs. Because of different currency in the annual reports where AstraZeneca present
their numbers in USD, a conversion of the value had been made to SEK with reference to the
value of the currency 31 December each year respectively. Table 4.7 provides the value of intangible
assets and internally developed ones in AstraZeneca, both in USD and SEK.
Table 4.7 Value of intangible assets in AstraZeneca (Own processing, 2016)
Value of intangible assets in AstraZeneca in MSEK
Year 2009 2010 2011 2012 2013 2014
Value intangible assets in M$ 12 226.00 12 158.00 10 980.00 16 488.00 16 047.00 20 981.00
Value internally generated in M$ 444.00 532.00 613.00 688.00 621.00 468.00
Currency 7.18 6.77 6.89 6.50 6.48 7.80
Value intangible assets in MSEK 87 781.34 82 352.33 75 663.29 107 195.08 103 930.48 163 577.32
Value internally generated in MSEK 3 187.87 3 603.51 4 224.19 4 472.96 4 021.99 3 648.74
The value of intangible assets in AstraZeneca experienced both increases and decreases. Between
2009-2011, the value decreased with a total amount of 12 118.05 MSEK, which was due to
impairments and disposals. In 2012, there was instead an increase with 31 531.79 MSEK as a result
33
of investments and acquisitions in Product, marketing and distribution rights. Another small
decrease in value is visible in 2013 but later on, in 2014 there was an increase of 59 646.84 MSEK.
This increase was due to investments. Compared to the value of intangible assets in general,
internally generated assets in AstraZeneca did also experience increases as well as decreases. There
was although no significant fluctuations of the value of these assets. The smallest value is visible in
2009 with an amount of 3 187.87 MSEK whereas the greatest amount is by the year 2012 with
4 472.96 MSEK.
Intangible assets in Swedish Orphan Biovitrum AB consist of several categories: Goodwill;
Research and development; Licenses and patents; product rights; Advanced payment; Capitalized
software expenditure; and IT-software in progress. The account that refers to goodwill has been
excluded from the calculations of the total amount of intangible assets in this study, which leaves
a lower value of these in the examined annual reports.
The internally generated intangible assets in Swedish Orphan Biovitrum AB are found in the
categories of research and development, capitalized software expenditures and IT-software in
progress. The value of these categories are dependent on whether the units are due to acquisitions
or internal development. In the annual report of 2014, the internally generated intangible assets are
found in Note 19 which shows that there is no research and development because of impairments.
However, there is a value visible in capitalized software expenditure which is not only due to
acquisitions. The same applies to IT-software in progress. In the annual report of 2013, the value
of internally generated intangible assets are visible in Note 21.
The value of research and development and capitalized software expenditures are not due to
acquisitions. Conversely, this is not the case for IT-software in progress where the value is
dependent on some acquisitions. Note 21 in the annual report of 2012 shows that capitalized
software expenditures is the only account that has been affected by acquisitions. In the annual
report of 2011, the internally generated intangible assets are also found in Note 21 where research
and development is the only account whose value is not due to acquisitions. There are not IT-
software in progress in the annual report of 2010 and 2009, and Note 21 shows that research and
development and capitalized software expenditures are affected by acquisitions. Table 4.8 shows
the value of internally generated intangible assets in Swedish Orphan Biovitrum AB.
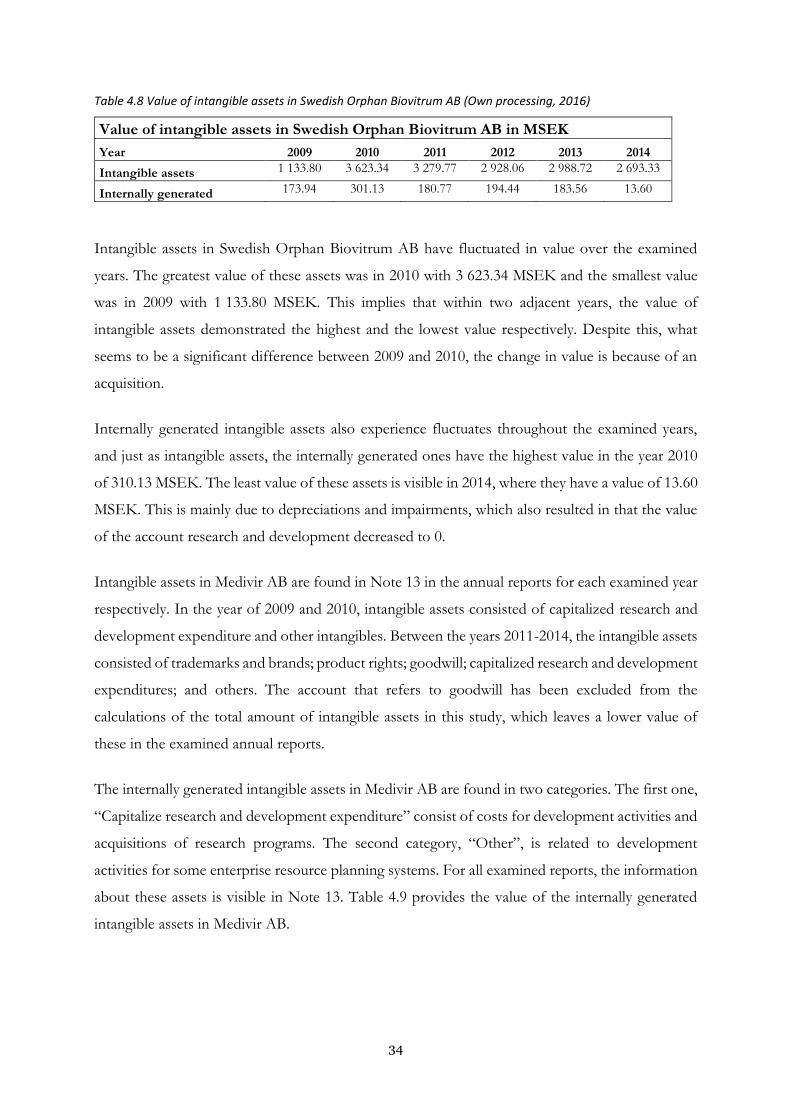
34
Table 4.8 Value of intangible assets in Swedish Orphan Biovitrum AB (Own processing, 2016)
Value of intangible assets in Swedish Orphan Biovitrum AB in MSEK
Year 2009 2010 2011 2012 2013 2014
Intangible assets 1 133.80 3 623.34 3 279.77 2 928.06 2 988.72 2 693.33
Internally generated 173.94 301.13 180.77 194.44 183.56 13.60
Intangible assets in Swedish Orphan Biovitrum AB have fluctuated in value over the examined
years. The greatest value of these assets was in 2010 with 3 623.34 MSEK and the smallest value
was in 2009 with 1 133.80 MSEK. This implies that within two adjacent years, the value of
intangible assets demonstrated the highest and the lowest value respectively. Despite this, what
seems to be a significant difference between 2009 and 2010, the change in value is because of an
acquisition.
Internally generated intangible assets also experience fluctuates throughout the examined years,
and just as intangible assets, the internally generated ones have the highest value in the year 2010
of 310.13 MSEK. The least value of these assets is visible in 2014, where they have a value of 13.60
MSEK. This is mainly due to depreciations and impairments, which also resulted in that the value
of the account research and development decreased to 0.
Intangible assets in Medivir AB are found in Note 13 in the annual reports for each examined year
respectively. In the year of 2009 and 2010, intangible assets consisted of capitalized research and
development expenditure and other intangibles. Between the years 2011-2014, the intangible assets
consisted of trademarks and brands; product rights; goodwill; capitalized research and development
expenditures; and others. The account that refers to goodwill has been excluded from the
calculations of the total amount of intangible assets in this study, which leaves a lower value of
these in the examined annual reports.
The internally generated intangible assets in Medivir AB are found in two categories. The first one,
“Capitalize research and development expenditure” consist of costs for development activities and
acquisitions of research programs. The second category, “Other”, is related to development
activities for some enterprise resource planning systems. For all examined reports, the information
about these assets is visible in Note 13. Table 4.9 provides the value of the internally generated
intangible assets in Medivir AB.

35
Table 4.9 Value of intangible assets in Medivir AB (Own processing, 2016)
Value of intangible assets in Medivir AB in MSEK
Year 2009 2010 2011 2012 2013 2014
Intangible assets 4.63 4.35 340.84 326.30 281.66 267.16
Internally generated 4.63 4.35 3.76 3.22 3.14 10.99
Table 4.9 shows that the value of intangible assets and internally generated ones is the same in the
years 2009 and 2010 which is due to that Medivir AB only had capitalized research and
development expenditure and other intangibles, which was considered to be internally generated.
In the year of 2011, the value of intangible assets increased significantly due to an acquisition that
affected trademarks and brands. The greatest amount of intangible assets is visible in 2011, which
is also when the acquisition was made.
Internally generated intangible assets have not been affected in the same way as intangible assets in
general since they are not assigned to acquisitions. This is also why the amount of these do not
experience any significant changes until 2014 which shows the highest value of 10.99 MSEK. This
high value, in comparison with the previous examined years is due to increases in capitalized
research and development expenditures and others.
Intangible assets in Poolia AB are found in Note 16 in the annual reports for all years examined,
except the year of 2014 where they are visible in Note 15. These assets are found in the account of
“Other intangible assets”, which includes improvements of different systems for administration.
This account is also considered to be where the internally generated intangible assets are found and
Table 4.10 provides the value of the internally generated intangible assets in Poolia AB.
Table 4.10 Value of intangible assets in Poolia AB (Own processing, 2016)
Value of intangible assets in Poolia AB in MSEK
Year 2009 2010 2011 2012 2013 2014
Intangible assets 19.93 13.24 13.61 4.43 4.26 3.29
Internally generated 19.93 13.24 13.61 4.43 4.26 3.29
Table 4.11 provides information of the percentage change in value of intangible assets from the
previous year within each examined company. This information is needed to make a comparison
between the branches in the private sector and the examined companies.
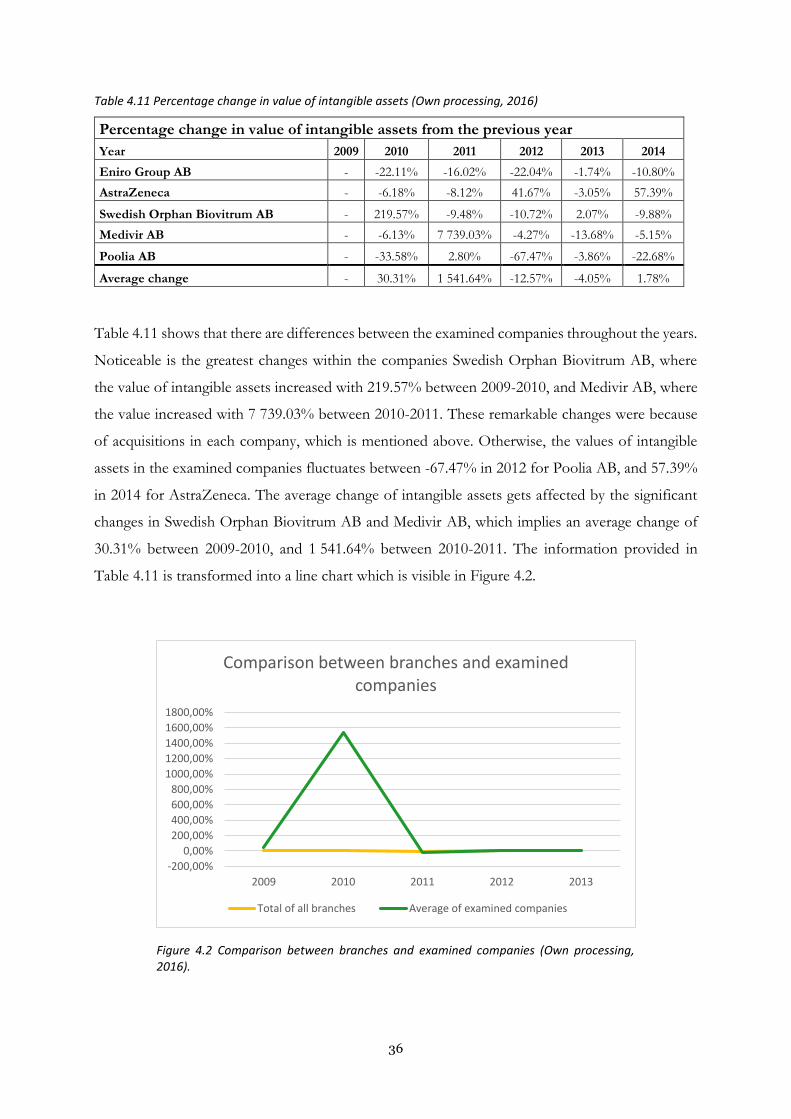
36
Table 4.11 Percentage change in value of intangible assets (Own processing, 2016)
Percentage change in value of intangible assets from the previous year
Year 2009 2010 2011 2012 2013 2014
Eniro Group AB - -22.11% -16.02% -22.04% -1.74% -10.80%
AstraZeneca - -6.18% -8.12% 41.67% -3.05% 57.39%
Swedish Orphan Biovitrum AB - 219.57% -9.48% -10.72% 2.07% -9.88%
Medivir AB - -6.13% 7 739.03% -4.27% -13.68% -5.15%
Poolia AB - -33.58% 2.80% -67.47% -3.86% -22.68%
Average change - 30.31% 1 541.64% -12.57% -4.05% 1.78%
Table 4.11 shows that there are differences between the examined companies throughout the years.
Noticeable is the greatest changes within the companies Swedish Orphan Biovitrum AB, where
the value of intangible assets increased with 219.57% between 2009-2010, and Medivir AB, where
the value increased with 7 739.03% between 2010-2011. These remarkable changes were because
of acquisitions in each company, which is mentioned above. Otherwise, the values of intangible
assets in the examined companies fluctuates between -67.47% in 2012 for Poolia AB, and 57.39%
in 2014 for AstraZeneca. The average change of intangible assets gets affected by the significant
changes in Swedish Orphan Biovitrum AB and Medivir AB, which implies an average change of
30.31% between 2009-2010, and 1 541.64% between 2010-2011. The information provided in
Table 4.11 is transformed into a line chart which is visible in Figure 4.2.
-200,00%
0,00%
200,00%
400,00%
600,00%
800,00%
1000,00%
1200,00%
1400,00%
1600,00%
1800,00%
2009 2010 2011 2012 2013
Comparison between branches and examined companies
Total of all branches Average of examined companies
Figure 4.2 Comparison between branches and examined companies (Own processing, 2016).
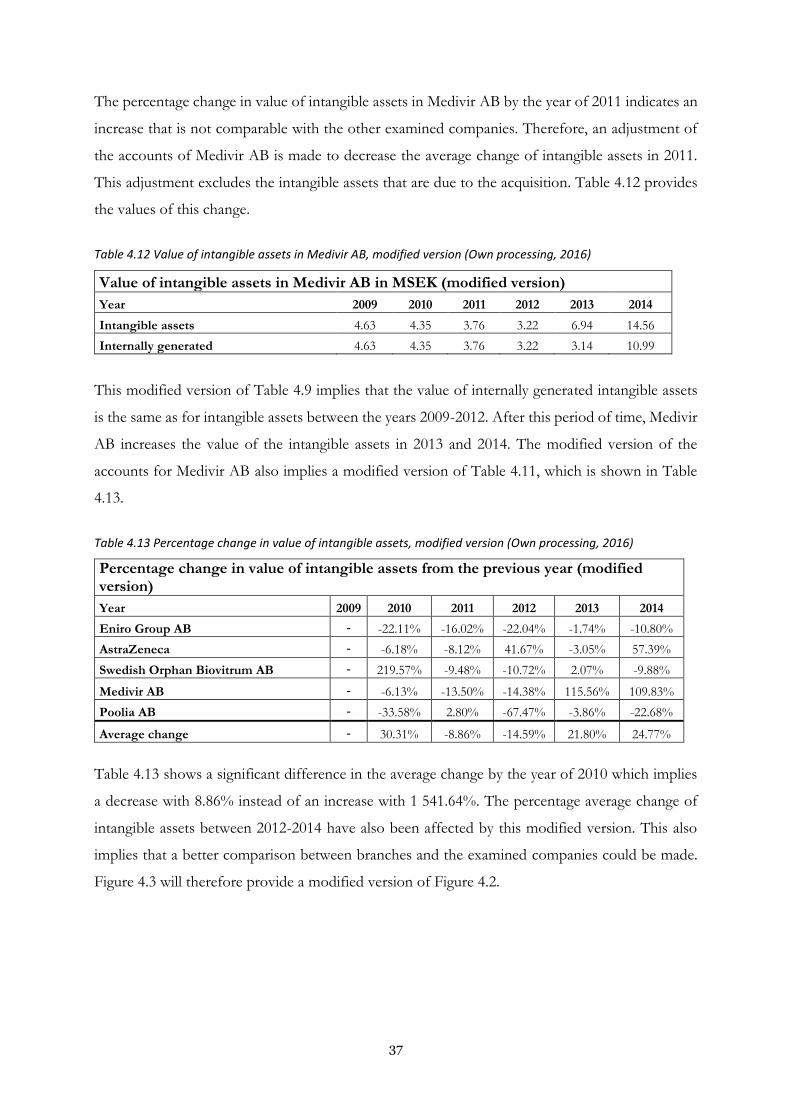
37
The percentage change in value of intangible assets in Medivir AB by the year of 2011 indicates an
increase that is not comparable with the other examined companies. Therefore, an adjustment of
the accounts of Medivir AB is made to decrease the average change of intangible assets in 2011.
This adjustment excludes the intangible assets that are due to the acquisition. Table 4.12 provides
the values of this change.
Table 4.12 Value of intangible assets in Medivir AB, modified version (Own processing, 2016)
Value of intangible assets in Medivir AB in MSEK (modified version)
Year 2009 2010 2011 2012 2013 2014
Intangible assets 4.63 4.35 3.76 3.22 6.94 14.56
Internally generated 4.63 4.35 3.76 3.22 3.14 10.99
This modified version of Table 4.9 implies that the value of internally generated intangible assets
is the same as for intangible assets between the years 2009-2012. After this period of time, Medivir
AB increases the value of the intangible assets in 2013 and 2014. The modified version of the
accounts for Medivir AB also implies a modified version of Table 4.11, which is shown in Table
4.13.
Table 4.13 Percentage change in value of intangible assets, modified version (Own processing, 2016)
Percentage change in value of intangible assets from the previous year (modified version)
Year 2009 2010 2011 2012 2013 2014
Eniro Group AB - -22.11% -16.02% -22.04% -1.74% -10.80%
AstraZeneca - -6.18% -8.12% 41.67% -3.05% 57.39%
Swedish Orphan Biovitrum AB - 219.57% -9.48% -10.72% 2.07% -9.88%
Medivir AB - -6.13% -13.50% -14.38% 115.56% 109.83%
Poolia AB - -33.58% 2.80% -67.47% -3.86% -22.68%
Average change - 30.31% -8.86% -14.59% 21.80% 24.77%
Table 4.13 shows a significant difference in the average change by the year of 2010 which implies
a decrease with 8.86% instead of an increase with 1 541.64%. The percentage average change of
intangible assets between 2012-2014 have also been affected by this modified version. This also
implies that a better comparison between branches and the examined companies could be made.
Figure 4.3 will therefore provide a modified version of Figure 4.2.
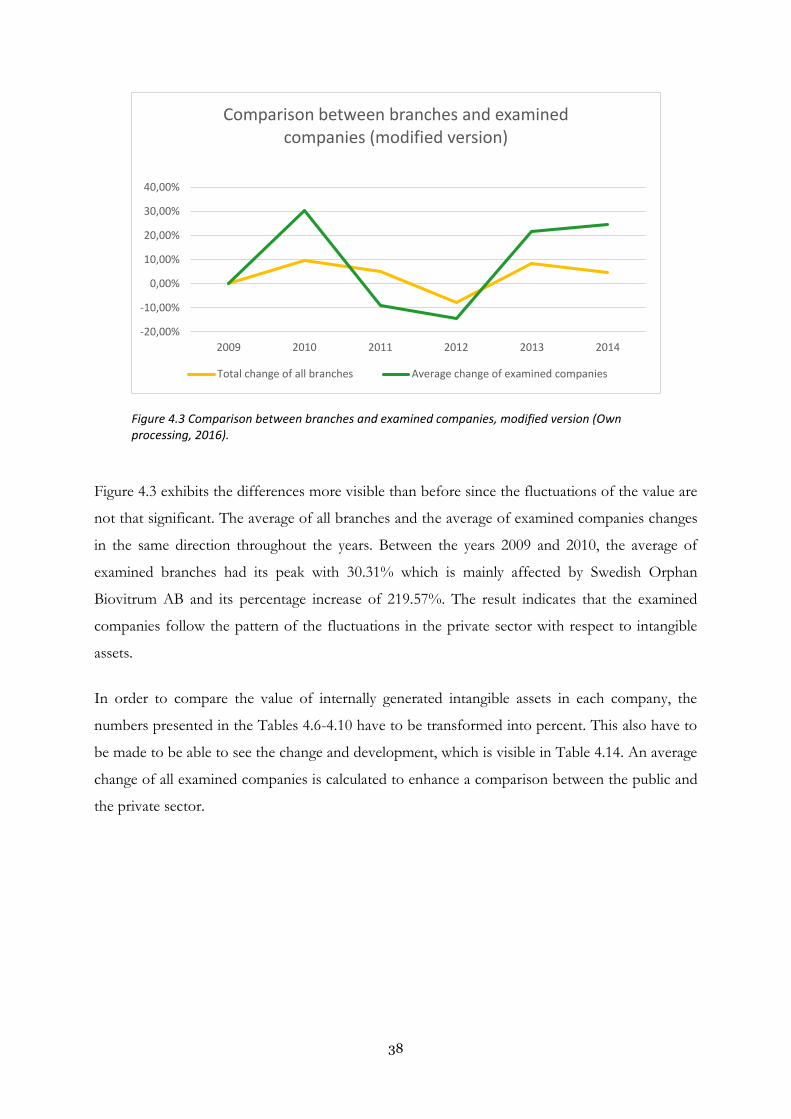
38
Figure 4.3 exhibits the differences more visible than before since the fluctuations of the value are
not that significant. The average of all branches and the average of examined companies changes
in the same direction throughout the years. Between the years 2009 and 2010, the average of
examined branches had its peak with 30.31% which is mainly affected by Swedish Orphan
Biovitrum AB and its percentage increase of 219.57%. The result indicates that the examined
companies follow the pattern of the fluctuations in the private sector with respect to intangible
assets.
In order to compare the value of internally generated intangible assets in each company, the
numbers presented in the Tables 4.6-4.10 have to be transformed into percent. This also have to
be made to be able to see the change and development, which is visible in Table 4.14. An average
change of all examined companies is calculated to enhance a comparison between the public and
the private sector.
-20,00%
-10,00%
0,00%
10,00%
20,00%
30,00%
40,00%
2009 2010 2011 2012 2013 2014
Comparison between branches and examined companies (modified version)
Total change of all branches Average change of examined companies
Figure 4.3 Comparison between branches and examined companies, modified version (Own processing, 2016).

39
Table 4.14 Percentage change in value of internally generated intangible assets (Own processing, 2016)
Percentage change in value of internally generated intangible assets from the previous year
Year 2009 2010 2011 2012 2013 2014
Eniro Group AB - 5.37% -31.21% -8.33% 20.20% 1.68%
AstraZeneca - 13.04% 17.22% 5.89% -10.08% -9.28%
Swedish Orphan Biovitrum AB - 73.12% -39.97% 7.56% -5.59% -92.59%
Medivir AB - -6.13% -13.50% -14.38% -2.39% 249.60%
Poolia AB - -33.58% 2.80% -67.47% -3.86% -22.68%
Average change - 10.36% -12.93% -15.35% -0.35% 25.35%
The average change in each year of the examined companies fluctuates slightly but the most
significant change in the average value of internally generated intangible assets is between 2013-
2014. Medivir AB contributed to this increase with 249.60% which left an average increase of
25.35%.
Table 4.15 provides information about the proportions of internally generated intangible assets
compared to intangible assets in general. This to facilitate a comparison between the proportions
of these assets in the Swedish government and companies within the private sector.
Table 4.15 Proportion of internally generated intangible assets (Own processing, 2016)
Proportion of internally generated intangible assets compared to intangible assets in general
Year 2009 2010 2011 2012 2013 2014
Eniro Group AB 6.30% 8.52% 6.98% 8.21% 10.04% 11.45%
AstraZeneca 3.63% 4.38% 5.58% 4.17% 3.87% 2.23%
Swedish Orphan Biovitrum AB 15.34% 8.31% 5.51% 6.64% 6.14% 0.50%
Medivir AB 100.00% 100.00% 1.10% 0.99% 1.12% 4.11%
Poolia AB 100.00% 100.00% 100.00% 100.00% 100.00% 100.00%
Average percentage of internally generated intangible 45.05% 44.24% 23.84% 24.00% 24.23% 23.66%
Average percentage of internally generated intangible* 8.42% 7.07% 4.79% 5.00% 5.29% 4.57%
*Year 2009-2010 for Medivir AB and all years for Poolia AB excluded
Significant for Table 4.16 is that intangible assets in Poolia AB only consist of internally generated
ones, which is why a proportion of 100% is visible throughout the examined years. Medivir AB
exhibits similar indications in 2009 and 2010 which was before the acquisition was made and the
only accounts visible in their financial statements was due to internally generated intangible assets.
Later on, small increases in value of these assets was visible.
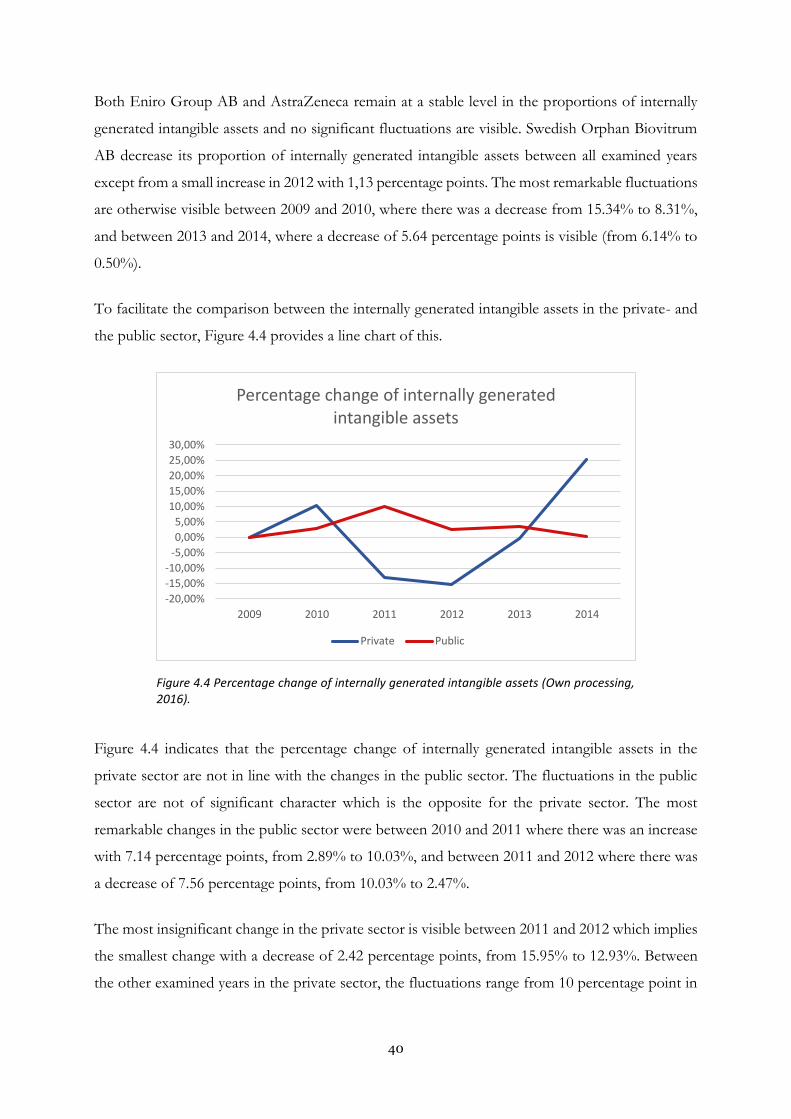
40
Both Eniro Group AB and AstraZeneca remain at a stable level in the proportions of internally
generated intangible assets and no significant fluctuations are visible. Swedish Orphan Biovitrum
AB decrease its proportion of internally generated intangible assets between all examined years
except from a small increase in 2012 with 1,13 percentage points. The most remarkable fluctuations
are otherwise visible between 2009 and 2010, where there was a decrease from 15.34% to 8.31%,
and between 2013 and 2014, where a decrease of 5.64 percentage points is visible (from 6.14% to
0.50%).
To facilitate the comparison between the internally generated intangible assets in the private- and
the public sector, Figure 4.4 provides a line chart of this.
Figure 4.4 indicates that the percentage change of internally generated intangible assets in the
private sector are not in line with the changes in the public sector. The fluctuations in the public
sector are not of significant character which is the opposite for the private sector. The most
remarkable changes in the public sector were between 2010 and 2011 where there was an increase
with 7.14 percentage points, from 2.89% to 10.03%, and between 2011 and 2012 where there was
a decrease of 7.56 percentage points, from 10.03% to 2.47%.
The most insignificant change in the private sector is visible between 2011 and 2012 which implies
the smallest change with a decrease of 2.42 percentage points, from 15.95% to 12.93%. Between
the other examined years in the private sector, the fluctuations range from 10 percentage point in
-20,00%
-15,00%
-10,00%
-5,00%
0,00%
5,00%
10,00%
15,00%
20,00%
25,00%
30,00%
2009 2010 2011 2012 2013 2014
Percentage change of internally generated intangible assets
Private Public
Figure 4.4 Percentage change of internally generated intangible assets (Own processing, 2016).

41
difference up to 25 percentage points in difference. This due to both increases but also decreases
in change of internally generated intangible assets.

42
5 Analysis
This chapter contains an analysis of the empirical findings together with the frame of reference. The structure of this chapter is based on the stated research question for this study. The aim with this chapter is to connect the empirical findings and the frame of reference in order to in the conclusion answer the research question.
Accounting in the public sector has experienced a change in order to enhance a more uniform and
harmonized accounting in Sweden. Falkman and Orrbeck (2001) state that this change led to that
accounting nowadays is conducted in similar ways independent on which sector the organization
operates within. Despite this, the regulators differ dependent on which sector the organization
belongs to. After an examination of IAS 38 and the regulations provided by ESV (2016b), there
are no considerable differences in the legislation with connections to intangible assets and the
measurement of these. The only visible difference in the regulations is the choice of words in
definitions and explanations of how to conduct the accounting with respect to these peculiar assets.
Because of this, one could expect that the measurement of intangible assets should be similar
independent of which sector they belong to. However, there are no guarantees that the accounting
of intangible assets in the private- and the public sector are in compliance. This since accounting
is made with different purposes (Tagesson, 2014; Ekonomistyrningsverket, 2012; Rayegan et al.,
2012).
The differences between the private- and the public sector with respect to stakeholders implies that
organizations experience diverse pressure of how to account for their business. This leads to
differences in the accounting. The survival of companies within the private sector is often
dependent by investments from external parties, such as shareholders (Tagesson, 2014; Jenkinson
& Ljungqvist, 2001). According to Grönlund, Tagesson and Öhman (2010), shareholders are a part
of an organization’s stakeholders. These stakeholders could, according to Freeman (2010);
Donaldson and Preston (1995); and Bruzelius and Skärvad (2004), affect or be affected but also
have interest in the organization.
In contradiction to the financing in the private sector, Tagesson (2014) and ESV (2012) clarify that
the authorities within the public sector is financed by the government, hence taxes and fees.
Therefore, the survival of authorities does not depend on financing from external investors but
from one single contributor, the government. This only contributor does not require dividend pay-
outs to the same extent as in the private sector, which is in accordance to what is specified by
Falkman and Orrbeck (2001). Tagesson (2014) further states that the business of the government
is focused on serving citizens with goods and services, which implies that they are affected and
have interest in the activities made by different authorities. Therefore, there is an existing
43
connection between the authorities and citizens in Sweden, but this could although not be
compared to the relationship between shareholders and a privately held organization. This further
implies that there is not a mutual dependency between the government and citizens, at least not to
the same extent as between companies and their stakeholders.
IAS 1 states that it is important that the accounting for privately listed companies is giving a true
and fair view of how the company is acting and how the economic performance looks like. Meek,
Roberts and Gray (1995) argue that accounting information often is the basis for stakeholders,
especially shareholders and investors in their decision-making process. Therefore, it is of a great
importance that the organization have this in mind when they impose their accounting. With
respect to that every organization should give a true and fair view, there are different aims with
accounting dependent on which sector an organization or a company operates within. Tagesson
(2014) states that companies within the private sector often seek to make profit whilst authorities
in the public sector has the aim to follow policy objectives in order to offer goods and services for
citizens. These differences imply that the objectives of accounting vary, which could contribute to
differences in approach of how to handle the valuation of intangible assets.
Yallwe and Buscemi (2014) state that there are difficulties in the measurement of intangible assets
which could be inferred by the legislation and standards about these. Both legislative acts for the
private- and the public sector, IAS 38 and regulations provided by ESV, state that the item has to
be controlled by the entity as well as give a potential future economic benefit. The complexity of
these items, together with the fact that these assets often have no value in a liquidation according
to Bandukwala (2005), might be an indicator of why the fluctuations in the two sectors differ.
Because of the fact that IAS 38 and ESV have the same type of requirements for capitalization, the
fluctuations of the changes in value of intangible assets and internally generated ones should not
depend on these. Therefore, this indicates that the fluctuations visible in this study should be due
to other circumstances than the legislative acts.
Despite those similarities, there is no clear connection between the intangible assets and the
changes in value of them when comparing the private- and the public sector which is notable in
Table 4.2 and Figure 4.1. What has been visible is also that the examined companies in this study
follow the same pattern as the private sector in total, which is notable in Table 4.11 and a modified
version of this in Table 4.13 as well as Figure 4.2 and a modified version in Figure 4.3. The
consequences of this is that it is difficult to analyse and conclude what the changes in value depends
on. Simultaneously this non connection could infer that there might not even be a relation between
44
the private- and the public sector. However, there is a connection between the private sector in
general and the examined companies in this study since they follow the same pattern with respect
to percentage changes in value in Figure 4.3.
In this study, the percentage change in value of intangible assets have been measured, both in the
public- and the private sector. What is characteristic in the public sector is that intangible assets
have increased in value throughout the examined years (Table 4.1). This has also been the case for
internally generated intangible assets (Table 4.3), although this increase sometimes not has been to
the same extent as the more general ones. What could be of a more interesting observation is that
the internally generated intangible assets have increased with a bigger percentage than intangible
assets in general. This was the case in 2011 and 2013, which is visible in Table 4.4.
In contrast to the increase in value of intangible assets within the public sector, which have been
constant throughout the examined years, the private sector has experienced fluctuations with
respect to these assets. Increases as well as one decrease in value are visible in this study, which
could be observed in Table 4.2. The decrease is related to the year 2012 which implied a drop in
value of 7.17%, this while the public sector experienced an increase in value of intangible assets
with 2.94%. This difference might be due to the recognition criteria for intangible assets and
Joachim Hoøegh-Krohn and Knivsflå (2000) argue that this is problematic for organizations. This
implies that the fluctuations of intangible assets in the private sector might have been affected by
the recognition criteria in IAS 38.
Further, Skinner (2008) says that inaccuracies in how to value intangible assets is common among
companies within the private sector and therefore, some might prefer to not capitalize peculiar
items in their balance sheets. This actual non-capitalization of intangible assets implies that
stakeholders might suffer (Wilson & Stenson, 2008). When companies choose to not capitalize
items that could be defined as intangible assets, this indicates that the recognition criteria in IAS
38 could be a barrier (Sahut, Boulerne, & Teulon, 2011; Wilson & Stenson, 2008). According to
Sahut, Boulerne and Teulon (2011), this has actually been one of the concerns with the
implementation of this regulation. Additionally, Skinner (2008) says that this situation leads to that
companies would be rather careful in their valuation of intangible assets. Joachim Hoøegh-Krohn
and Knivsflå (2000) also propose that prudence affects the valuation and potential impairments of
intangible assets. This, together with inaccuracies in how to measure intangible assets could be a
potential explanation to the empirical findings where there is a greater increase in internally
generated intangible assets compared to the increase in intangible assets in general. Simultaneously,
45
other intangible assets might have been affected by impairments to a greater extent which implies
a decrease in the total value of these.
The differences in the value of intangible assets between the public and the private sector are visible
in the examined companies in this study. There is also a difference between these companies and
the value in total of the private sector since the fluctuations in value of intangible assets in these
companies are of a greater amount. The private sector in total experienced only one decrease in
value, which was in 2012 (Table 4.1), while each of the examined companies experienced several
decreases and some increases in value throughout the years (Table 4.6-4.10, Table 4.12). Actually,
the characteristic of this limit of time in the examined companies is that most of the changes in
value of intangible assets are due to decreases. Two companies experienced an increase in value
during two years, which is Swedish Orphan Biovitrum AB and Medivir AB. Although, the
explanations behind this deviation have not been further examined in this study.
The changes in the value of internally generated intangible assets do not, to some extent, experience
the same amount of decreases in value as the more general intangible ones. Although decreases in
value are more representative throughout the examined years, the increase in value when this is
made is often above 7.5%, which is visible in Table 4.14, except from two years in Eniro Group
AB and one year in Poolia AB respectively. This could be compared to the internally generated
intangible assets in the public sector, where Table 4.4 shows that the increase in value never is
above 10.03%, which is also the greatest value visible in the examined years. The second biggest
increase in value in the public sector is by the year of 2013, where the increase was 3.63%. The
differences between the percentage change of internally generated intangible assets are also visible
in Figure 4.4 where it becomes more clear that these changes are not mutually dependent.
Based on the information provided above, companies in general seem to capitalize their internally
generated intangible assets to a greater amount than authorities within the public sector. This due
to the fact that when there is an increase in value, this is often above 7.5% (Table 4.14).
Simultaneously, according to this study there seem to be more impairments in the private sector
than in the public sector since there are many decreases in value of internally generated intangible
assets. Despite this, the aim with this study has not been to compare the public sector with only
one company within the private sector, which is why a comparison between each examined
company and the public sector in total cannot be made. Therefore, a comparison of the average
change of all examined companies visible in Table 4.14, which implies a different result, have to be
made. The average change of these indicate greater fluctuations between the years and the value

46
gets affected by both increases and decreases. When comparing this to the public sector, it is visible
in Table 4.4 that the fluctuations are not to the same extent as in the examined companies, but
there is although a constant increase in value of internally generated intangible assets. The changes
in value of internally generated intangible assets in the examined companies could be due to
impairments and other changes within the companies, while this is not notable to the same extent
within the public sector.
Despite similar possibilities to capitalize intangible assets offered in the standards and regulations,
the proportions of internally generated intangible assets with respect to intangible assets in total
differ between the two sectors. In the public sector, the proportion of these is never less than 86%,
visible in Table 4.5. This could be compared to the average values in the examined companies in
Table 4.15 where the highest corresponding number is, after a modification, 8.42% (originally
45.05%). This significant difference in proportion could indicate that publicly hold authorities value
their internally generated intangible assets differently than private companies.
In order for an item to be considered as an asset, some requirements in either IAS 38 or regulations
regarding intangible assets provided by ESV have to be fulfilled to capitalize it in the balance sheet.
One of these is that the item has to be linked with future economic benefits. Because of the
complexity in the measurement of intangible assets (Stolowy & Jeny-Cazavan, 2001; Sahut,
Boulerne, & Teulon, 2011; Watts, 2003) together with a potential impact by managers (Jones, 2011),
the requirement of future economic benefits might be interpreted differently dependent on which
organization that faces this phenomenon. Publicly held authorities do not operate with the
intention to make profit which could be a contributing factor to diverse perception of what could
be a potential future economic benefit. Additionally, assets in general in the public sector are not
managed in order to obtain economic benefits (Ekonomistyrningsverket, 2012). Because of this,
the requirement that the capitalization of intangible assets have to be linked with future economic
benefit becomes questionable in the public sector.
As Anderson and Prezas (1999) state, intangible assets do not provide any direct cash flows which
also implies that these items could not contribute to debt finance. In the public sector, this problem
might not occur since authorities that experience debt could cover their costs by finances from
other authorities (Ekonomistyrningsverket, 2012). Conversely, companies within the private sector
might not have this support. This might imply that more emphasis is put on other, more tangible
resources that could contribute to the longevity of the business within the private sector in

47
comparison to the public sector. This could also be a potential explanation of the difference in
proportions of internally generated intangible assets in Table 4.5 and 4.15.
Rimmel (2016) suggests that accounting standards enhance the quality of disclosures in companies.
The information of the accounting in the annual reports in this study is although of diverse quality.
This is especially true when comparing the annual reports of the Swedish government and the
examined companies. Despite the fact that all annual reports state what sort of legislative acts they
have applied in their accounting, i.e. either IAS 38 or regulations by ESV, the explanations of how
the accounting actually have been conducted is of different character. This is especially visible in
the annual reports of the government where comprehensive information has been disclosed and
the activities that have affected intangible assets, and especially the internally generated ones, have
been extensively explained. Contrariwise, the annual reports of the examined companies include
more brief descriptions of what is included in the accounts of intangible assets and internally
generated ones. This implies that stakeholders might suffer because they are not provided with
enough information (Wilson & Stenson, 2008).
One potential reason for this difference between companies within the private sector and the public
sector could be the chances to growth. Core (2001) argues that companies with a less chance to
growth will inherently disclose more information compared to those who possess a possibility to
grow. Additionally, Bandukwala (2005) argues that companies need intangible assets in order to
grow and make profit. This means that companies with a big amount of intangible assets have a
higher chance to growth and thereby less information disclosed about these specific assets. Further,
this also implies that the authorities within the public sector do not have the possibility to growth
to the same extent as privately held organizations since authorities disclose more information about
those intangible assets.
Despite the fact that the managers of an organization should be as sincere as possible when making
assumptions about intangible assets (IAS 38), Lightstone and Driscoll (2008) state that the
managers sometimes try to falsify the perceptions of the business in order to be perceived as
legitimate. The government disclose significant information about the value of intangible assets
and internally generated ones while the examined companies do not reveal this information to the
same extent. In accordance wo what is stated by Lightstone and Driscoll (2008), this would imply
that authorities within the public sector have more to hide than companies within the private sector.
Moreover, Rayegan et al. (2012) state that one of the purposes with government accounting is to

48
achieve public accountability. Therefore, this could be an alternative explanation to the larger
amount of disclosed information in authorities.
Meek, Roberts and Gray (1995) propose another reason for why there might be a difference in the
disclosed information which is that a greater amount is provided in larger companies. Throughout
this study, the publicly held authorities and the accounting for these have been considered to be
one unit. This implies that the accounts for the Swedish government include a greater amount of
value which is visible in Table 4.1. In comparison with the examined companies in the private
sector, these do not comprise the same value for intangible assets which is notable in Table 4.6-
4.10. With respect to the empirical findings, the government could be considered as a big company
which implies an explanation for the amount disclosed information.
Because of the comprehensive information disclosed by the government, the legitimacy of the
examined companies might be questioned since they do not disclose the same amount of
information in their annual reports. This because investors tend to relate intangible assets as a link
with future economic benefits as well as an important source of information (Sahut, Boulerne, &
Teulon, 2011). According to Rimmel (2016), the legitimacy theory states that companies are
affected by the frames within the society they operate within. The amount of disclosure within the
examined companies might therefore reflect the expectations of the society.
In the literature, there is a common view that intangible assets are difficult to measure and
associated with complexity (Sahut, Boulerne, & Teulon, 2011; Watts, 2003; Kanodia, Sapra, &
Venugopalan, 2004). Therefore, the literature might be a reflection of the expectations of the
society, hence the moderate explanation of the accounting of the intangible assets in the examined
companies. This is although questionable since investors put high value on this source of
information which should also imply that the expectations from the society within the private
sector is of a higher content than what this study’s empirical findings suggest. Contrariwise, the
empirical findings in this study indicates that the public sector emphasize disclosure of intangible
assets through their extensive explanations of these.
49
6 Conclusions and discussion
This chapter presents a conclusion of this study which is made in alignment with the stated research question and the purpose. The conclusion is based on the information that is previously presented in this study. This chapter also contains critical reflections as well as ethical and social issues of this study. The intention with this chapter is also to give some suggestions for future studies.
6.1 Conclusion
The aim with this study was to see whether there are any existing differences in how to measure
and value intangible assets and internally generated ones between listed companies in the private
sector and authorities operating in the public sector. According to IAS 38 and regulations provided
by ESV, there are similarities with respect to the measurement of intangible assets. Therefore, this
implies that the valuation of these should not be that different dependent of which sector an
organization operates within. Despite this, the empirical findings in this study indicate that
organizations differ in the measurement of intangible assets and the accounting of these.
Companies within the private sector tend not to capitalize intangible assets, and especially internally
generated ones, to the same extent as authorities within the public sector. This phenomenon is to
some extent notable in this study where the proportions of internally generated intangible assets
compared to intangible assets in total largely differs between the public sector and the examined
companies within the private sector. Due to this, we can conclude that there seems to be differences
in the accounting for intangible assets which are not due to regulations and standards.
Intangible assets are associated with complexity and the legislation do not offer an explicit
definition of what characterises an intangible asset. Because of this, we can conclude that the
regulations and standards for intangible assets leave a gap which implies that companies and
organizations have to make their own estimation of the value of these assets. This possibility of
affecting intangible assets with own interpretations means that managers thereby have extensive
influence and hence the accounting for these items.
The annual reports of the public sector are rather comprehensive with respect to the intangible
assets and the proportions of the internally generated ones, while the examined companies are not
that extensive in their information about these. A potential explanation for this difference is the
pressure from outside parties. Organizations tend to have diverse pressure from different
stakeholders and companies within the private sector are often dependent by investments from
externals. Companies should disclose information with a true and fair view of their financial
50
performance. This implies that they might be more careful when capitalizing internally generated
intangible assets, since this disclosed information is the base for the decision making by the
stakeholders. Additionally, the differences in to what extent the examined companies choose to
disclose information could also reflect the expectations from the society. In comparison, the greater
capitalization of these assets within the public sector might be due to a lower extent of pressure
from external sources since the business of these authorities are dependent on tax payments. We
can therefore conclude that there seems to be a greater tendency to capitalize peculiar items as
internally generated intangible assets in the public sector.
The complexity of intangible assets and the differences in the measurement of these might indicate
that the disclosed information does not give a true and fair view. The disclosed information is often
the basis for future decisions and therefore, it is of a great importance that this information is
trustworthy and correct. Intangible assets increase in value and therefore, they might be more
important in the balance sheets in the future. Since those assets are associated with complexity, it
leaves the question of how to interpret the information given in the balance sheets. The
measurement of intangible assets might be questionable. We can therefore conclude that a
capitalization of these assets might not always be ethically defendable since they might be assigned
a greater value than what is legitimate.
6.2 Critical reflections
One implication with this study has been the difficulty in finding representative companies
according to the stated requirements. This has implied that a smaller selection of companies than
what was originally intended are used in order to achieve the purpose. With consideration to this,
the results of the studied sample might not be in accordance with the population in total. Despite
this, the intention was to collect samples that could be of comparable character with the
characteristics of the public sector authorities. Therefore, a bigger sample might not have generated
a more comparable and representative result with respect to the population in total.
The examined companies have not been that extensive with the description of what has been
internally generated intangible assets in their annual reports. One explanation for this could be that
they are more careful with disclosures in order to protect their business secrets. Because of this
lack of information, interpretations as well as conclusions had to be made of which numbers that
should be included in this study. Therefore, there might be a small margin of error in this study
with respect to internally generated intangible assets in the examined companies and the
calculations of these.

51
Despite this, when questions have been raised of what is considered to belong to these peculiar
assets, the calculations have included the total value of the questioned account. This further means
that a potential larger value of internally generated intangible assets from the examined companies
have been used which will not be of a big relevance to this study. This due to the fact that if a
higher value has been used for these assets, it has only implied a smaller gap between the
proportions of internally generated intangible assets in the two sectors. Hence, the value in the
private sector will be closer to the public sector. One can therefore argue that if this study contains
a margin of error, this will not bring any weaknesses since the gap between the sector will be of a
greater amount without this error. This would imply that the analysis and conclusion made in this
study would be strengthened.
6.3 Ethical and social issues
Giving a true and fair view of the accounting is something that is required of both companies
within the private sector and authorities within the public sector. With respect to privately listed
companies, this phenomenon is of a great importance since the business of these organizations
often is dependent on additions of capital from inside as well as outside investors. What is common
for these is that they want some sort of return on investment, which implies that the choices made
within the companies also affect the possibility of attaining some dividends. One of the
contributing factors to if someone chooses to invest within a company is the information provided
in the annual reports, especially the numbers in the balance sheet and income statement. Therefore,
the accounting of privately listed companies is of a great importance, likewise the valuation of
intangible assets.
With respect to the findings in this study there seem to be a tendency among companies to not
capitalize intangible assets and internally generated ones to the same extent as in the public sector.
If this is due to carefulness or an implicit awareness is not exhibited, but either case might imply
some implications. The carefulness could be motivated if companies actually are not sure of
whether they should capitalize some assets or not. Conversely, if there is an awareness of why a
capitalization is not made this might imply some ethical and social issues. Companies might choose
to not recognize some intangible assets in the balance sheet since these assets instead are expensed
to decrease the result. This is made to decrease the tax payments since companies prefer to pay as
low tax as possible. If the result is decreased with expenses of items that could be capitalized as
intangible assets, this leads to less possibilities for investors to get some dividends. Thereby, the
company does not exhibit a true and fair view of their business.
52
The accounting of authorities within the public sector differ from privately listed companies since
it does not affect return on investment. Instead of affecting investors, it is the citizens of Sweden
that is significantly affected by the choices of authorities. The aim of authorities is to provide the
citizens with goods and services and if the accounting is made with different objectives than what
is intended, these might get affected. There might be a tendency within the authorities to use money
allocated for investments to cover costs for daily business. If this is the case, either the regulation
about this is too unrestrained or the grants are simply too tight. Because of the fact that the business
of the authorities within the public sector is mainly financed by tax income from citizens as well as
companies in Sweden, these contributors might get affected directly or indirectly through, for
instance, an increase in tax. Due to the responsibility of the public sector, it is important that the
accounting of this is giving a true and fair view. This implies both ethical and social issues if it is
conducted in the wrong way.
6.4 Suggestions for future studies
One suggestion for future studies are due to the fact that the accounting standards and legislative
acts for private- and public sector accounting differs. Despite this, the rules are often not that
different and the valuation of intangible assets have similar requirements. This leads to the question
of whether accounting standards in general are similar to each other? If this is the case, it would be
interesting to see whether it is possible to develop accounting standards that are applicable by both
companies within the private sector and authorities within the public sector.
Another suggestion for future studies is to further develop this study and make a deeper
investigation with a larger sample. Furthermore, this investigation could include some focus of why
the changes in value of intangible assets actually consist. This study has not focused on the motives
and thoughts behind the valuation process and therefore it would be interesting to investigate
which perspectives that could be a contributing factor to differences in valuation. Could there be
any worldwide or societal forces that have contributed to the ups- and downs? Are there any
connections between worldwide events and the way companies and authorities conduct their
accounting?
The complexity of intangible assets and the discussion made in the previous chapter emphasizes
the balance sheets of companies and their importance for decisions by outside parties. The value
of intangible assets seems to increase in general, and thereby also affects the value in the balance
sheets. Therefore, it would be interesting to investigate the future significance of the information
and numbers presented in the financial statements with respect to decisions for externals.
53
References
Alexander, D., Britton, A., Jorissen, A., Hoogendoorn, M., & Van Mourik, C. (2014).
International financial reporting and analysis (6 ed.). Hampshrie: Cengage Learning
EMEA.
Anderson, M., & Prezas, A. (1999). Intangible investment, debt financing and managerial
incentives. Journal of Economic and Business, 51, 3-19. Retrieved March 17, 2016
AstraZeneca AB. (2010, March). AstraZeneca Annual Report and Form 20-F Information
2009. Retrieved March 29, 2016, from
https://www.astrazeneca.com/content/dam/az/our-company/investor-
relations/presentations-and-webcast/Annual-Reports/2009-Annual-Report.pdf
AstraZeneca AB. (2011, March). AstraZeneca Annual Report and Form 20-F Information
2010. Retrieved March 29, 2016, from
https://www.astrazeneca.com/content/dam/az/our-company/investor-
relations/presentations-and-webcast/Annual-Reports/2010-Annual-Report.pdf
AstraZeneca AB. (2012, March). Annual Report and Form 20-F Information 2011. Retrieved
March 29, 2016, from https://www.astrazeneca.com/content/dam/az/our-
company/investor-relations/presentations-and-webcast/Annual-Reports/2011-Annual-
report.pdf
AstraZeneca AB. (2013, March). AstraZeneca Annual Report and Form 20-F Information
2012. Retrieved March 29, 2016, from
https://www.astrazeneca.com/content/dam/az/our-company/investor-
relations/presentations-and-webcast/Annual-Reports/2012-Annual-report.pdf
AstraZeneca AB. (2014, March). AstraZeneca Annual Report and Form 20-F Information
2013. Retrieved March 29, 2016, from http://www.astrazeneca-
annualreports.com/2013/_assets/pdfs/AstraZeneca_Annual_Report_2013.pdf
AstraZeneca AB. (2015, March). AstraZeneca Annual Report and Form 20-F Information
2014. Retrieved March 29, 2016, from
https://www.astrazeneca.com/content/dam/az/our-company/investor-
relations/presentations-and-webcast/Annual-Reports/2014-Annual-report-Annual-
Reports.pdf
Baboukardos, D., Rimmel, G., Jonäll, K., Hartmann, B., & Inkwinkl, P. (2016).
Redovisningsteorier: viktiga begrepp och teoretiska perspektiv inom redovisning (1
ed.). Stockholm: Sanoma Utbildning. Retrieved March 7, 2016
Bandukwala, S. (2005). Intangible Asset and Enterprise Value Lending. The Secured Lender,
16-21. Retrieved March 17, 2016
Barth, M., Landsman, W., & Lang, M. (2008). International Accounting Standards and
Accounting Quality. Journal of Accounting Research, 467-498.
Biovitrum AB. (2010). Annual Report 2009. Stockholm, Sweden. Retrieved March 29, 2016,
from
http://www.sobi.com/Global/Financial%20information/Annual%20Reports/Biovitrum
_AR09_ENG_webb_v3.pdf
Bruzelius, L., & Skärvad, P.-H. (2004). Integrerad organisationslära. Lund: Studentlitteratur.
Bryman, A. (2012). Social Research Methods (4 ed.). Oxford: Oxford University Press.
Bryman, A., & Bell, E. (2015). Business Research Methods. Oxford: Oxford University Press.
Core, J. (2001). A review of the empirical disclosure literature: discussion. Journal of
Accounting and Economics, 441-456.
Daske, H., & Gebhardt, G. (2006). International Financial Reporting Standards and Experts'
Perceptions of Disclosure Quality. ABACUS, 461-498.
54
Donaldson, T., & Preston, L. (1995). The Stakeholder Theory of the Corporation: Concepts,
Evidence and Implications. The Academy of Management Review, 65-91.
Edquist, H. (2011). Can investment in intangibles explain the Swedish productivity boom in
the 1990s? Review of Income and Wealth, 658-682.
Ekonomistyrningsverket. (2012). Basbok: Grunderna i statlig redovisning. Taberg:
Ekonomistyrningsverket.
Ekonomistyrningsverket. (2016a, February 16). ekonomistyrningsverket.se. Retrieved from
About the ESV: http://www.esv.se/ESV/English/About-the-ESV/
Ekonomistyrningsverket. (2016b, 02 10). Verktyg och stöd: Publikationer. Retrieved from
Ekonomistyrningsverket-webbplats:
http://www.esv.se/contentassets/b94aec4ab5594acb940f5aa416de2d14/immateriella-
anlaggningstillgangar.pdf
Eniro Group AB. (2010, March). Annual Report 2009. Stockholm, Sweden. Retrieved March
29, 2016, from http://www.enirogroup.com/afw/files/press/eniro/201003312563-2.pdf
Eniro Group AB. (2011, March). Annual Report 2010. Stockholm, Sweden. Retrieved from
http://www.enirogroup.com/afw/files/press/eniro/201103242267-1.pdf
Eniro Group AB. (2012, March ). Annual Report 2011. Stockholm, Sweden. Retrieved March
29, 2016, from http://www.enirogroup.com/afw/files/press/eniro/Eniro_ENG_low.pdf
Eniro Group AB. (2013, March ). Annual Report 2012. Stockholm, Sweden. Retrieved March
29, 2016, from
http://www.enirogroup.com/afw/files/press/eniro/Eniro_AR_2012_EN.pdf
Eniro Group AB. (2014, March). Annual Report 2013. Stockholm, Sweden. Retrieved March
29, 2016, from
http://www.enirogroup.com/sites/default/files/report/annual_report_2013.pdf
Eniro Group AB. (2015, March). Annual Report 2014 . Stockholm, Sweden. Retrieved March
29, 2016, from http://www.enirogroup.com/afw/files/press/eniro/201503064347-1.pdf
European Commission. (2002). Regulation No 1606/2002.
Falkman, P. (2012, June 4). Vad händer med den finansiella rapporteringen i offentlig sektor?
Balans, 6-7, p. 29.
Falkman, P. (2013, January 7). Stora utmaningar för rapportering i offentlig sektor. Balans, 1,
p. 31.
Falkman, P., & Orrbeck, K. (2001). Den offentliga sektorns redovisning. Lund:
Studentlitteratur.
Freeman, R. (2010). Strategic Management: a stakeholder approach. Cambridge: Cambridge
University Press.
Grossi, G., & Soverchia, M. (2011). European Commission Adoption of IPSAS to Reform
Financial Reporting. Abacus, 525-552.
Grönlund, A., Tagesson, T., & Öhman, P. (2010). Principbaserad redovisning (4 ed.). Lund:
Studentlitteratur.
Hayes, D. (1983). Accounting for accounting: A story about managerial accounting.
Accounting, Organizations and Society, 241-249. Retrieved February 9, 2016
International Accounting Standards Board. (2005). IAS 1. Presentation of Financial
Statements.
International Accounting Standards Board. (2008). IAS 38. Intangible assets.
International Accounting Standards Board. (2010). Conceptual Framework for Financial
Reporting 2010.
Jacobsen, D. (2002). Vad, hur och varför? - Om metodval i företagsekonomi och andra
samhällsvetenskapliga ämnen. Lund: Studentlittaratur AB.

55
Jenkinson, T., & Ljungqvist, A. (2001). Going Public: The Theory and Evidence on How
Companies Raise Equity Finance (2 ed.). New York: Oxford University Press.
Retrieved May 2, 2016
Jermakowicz, E., & Gornik-Tomaszewski, S. (2006). Implementing IFRS from the
perspective of EU publicly traded companies. Journal of Internation Accounting,
Auditing and Taxation, 170-196.
Joachim Hoøegh-Krohn, N., & Knivsflå, K. (2000). Accounting for intangible assets in
Scandinavia, the UK, the US and by the IASC: Challenges and a solution.
International Journal of Accounting, 243-265.
Jones, S. (2011, March 1). Does the Capitalization of Intangible Assets Increasse the
Predictability of Corporate Failure? Accounting Horizons, 25, 41-70. Retrieved March
17, 2016
Kanodia, C., Sapra, H., & Venugopalan, R. (2004, March). Should Intangibles Be Measured:
What Are the Economic Trade-Offs? Journal of Accounting Research, 42, 89-120.
Retrieved March 17, 2016
Lennartsson, R. (2012, December 3). Offentlig redovisning: Många hinder finns på vägen mot
en internationell standard. Balans, 10, pp. 18-20.
Lightstone, K., & Driscoll, C. (2008). Disclosing elements of disclosure: a test of legitimacy
theory and company ethics. Canadian Journal of Administrative Sciences, 7-21.
Magness, V. (2006). Strategic posture, financial performance and environmental disclosure;
An empirical test of legitimacy theory. Accounting, Auditing & Accountability
Journal, 540-563.
Marton, J., Lumsden, M., Lundqvist, P., Pettersson, A., & Rimmel, G. (2010). IFRS - I teori
och praktik (2 ed.). Stockholm: Bonnier Utbildning.
Medivir. (2014, April 7). Annual Report 2013. Stockholm, Sweden. Retrieved March 29,
2016, from http://www.medivir.se/v5/images/pdf/2014/Medivir_2013_ENG.pdf
Medivir AB. (2010, March 22). Annual Report 2009. Stockholm, Sweden. Retrieved March
29, 2016, from
http://www.medivir.se/v4/images/pdf/2010/2009_Medivir_webb_E.pdf
Medivir AB. (2011, April 6). Annual Report 2010. Stockholm, Sweden. Retrieved March 29,
2016, from http://www.medivir.se/v4/images/pdf/2011/2010_Medivir_webb_E.pdf
Medivir AB. (2012, April 10). Annual Report 2011. Stockholm, Sweden. Retrieved March 29,
2016, from http://www.medivir.se/v4/images/pdf/2012/Medivir_annualreport.pdf
Medivir AB. (2013, April 4). Annual Report 2012. Stockholm, Sweden. Retrieved March 29,
2016, from http://www.medivir.se/v5/images/pdf/2013/Medivir-ENG-
web_140619.pdf
Medivir AB. (n.d.). Annual Report 2014. Stockholm. Retrieved March 29, 2016, from
http://www.medivir.se/v5/images/pdf/2015/ENG-Medivir_web2014.pdf
Meek, G., Roberts, C., & Gray, S. (1995). Factors Influencing Voluntary Annual Report
Disclosures Buy U.S., U.K. and Continental European Multinational Corporations.
Journal of International Business Studies, 555-572.
Mitchell, R., Agle, B., & Wood, D. (1997). Toward a Theory of Stakeholder Identification
and Salience: Defining the Principle of Who and What Really Counts. The Academy of
Management Review, 853-886.
Nordic Netproducts AB. (n.d.). largestcompanies.com. Retrieved March 24, 2016, from
Industry top lists in Sweden: http://largestcompanies.com/index-toplists-
industry/sweden
OANDA Corporation. (2016, March 29). oanda.com. Retrieved March 29, 2016, from
Currency Converter: https://www.oanda.com/currency/converter/
56
Ocean Tomo, LLC. (2015, April 3). Ocean Tomo. Retrieved February 14, 2016, from
http://www.oceantomo.com/2015/03/04/2015-intangible-asset-market-value-study/
Paulsson, G. (2006). Accrual accounting in the public sector: Experiences from the central
government in Sweden. Financial Accountability & Management, 47-62.
Pkf International Ltd. (2015). Wiley IFRS 2015: Interpretation and Application of
International Financial Reporting Standards. Hoboken: John Wiley & Sons, Inc.
Poolia AB. (2010, March). Annual Report 2009. Stockholm, Sweden. Retrieved March 29,
2016, from
http://www.poolia.com/PageFiles/6896/Poolia_annualreport_2009_EN_web.pdf
Poolia AB. (2011, March). Annual Report 2010. Stockholm, Sweden. Retrieved March 29,
2016, from
http://www.poolia.com/PageFiles/6896/Poolia%20AR%202010%20ENG%20hres.pdf
Poolia AB. (2012, March). Annual Report 2011. Stockholm, Sweden. Retrieved March 29,
2016, from http://www.poolia.com/Files-com/FinancialReports/Poolia_AR%202011-
EN.pdf
Poolia AB. (2013, March). Annual Report 2012. Stockholm, Sweden. Retrieved March 29,
2016, from http://www.poolia.com/Files-
com/FinancialReports/Poolia%20AR%202012%20ENG%20FINAL.pdf
Poolia AB. (2014, March). Annual Report 2013. Stockholm, Sweden. Retrieved March 29,
2016, from http://www.poolia.com/Files-
com/FinancialReports/Poolia_2013ENG%20FINAL.pdf
Poolia AB. (2015, March). Annual Report 201. Stockholm, Sweden. Retrieved March 29,
2016, from http://www.poolia.com/Files-
com/FinancialReports/Poolia%20%20Annual%20Report%202014.pdf
Rayegan, E., Parveizi, M., Nazari, K., & Emami, M. (2012). Government Accounting: An
Assessment of Theory, Purposes and Standards. Interdisciplinary Journal of
Contemporary Research in Business, 521-531.
Regeringen. (2010, April 8). Regeringens skrivelse 2009/10:101. Årsredovisning för staten
2009. Stockholm. Retrieved March 10, 2016, from
http://www.regeringen.se/contentassets/cdfdb777bd73471a8c47da025c60faa1/arsredo
visning-for-staten-2009-skr-200910101
Regeringen. (2011, April 7). Regeringens skrivelse 2010/11:101. Årsredovisning för staten
2010. Stockholm. Retrieved March 10, 2016, from
http://www.regeringen.se/contentassets/067e525095d2488eb4540095f9cf17d5/arsredo
visning-for-staten-2010-hela-dokumentet-skr.-201011101
Regeringen. (2012, April 12). Regeringens skrivelse 2011/12:101. Årsredovisning för staten
2011. Stockholm. Retrieved March 10, 2016, from
http://www.regeringen.se/contentassets/30b9031a18f943efb4d426757ce3fa22/arsredo
visning-for-staten-2011-hela-dokumentet-skr.-201112101
Regeringen. (2013, April 11). Regeringens skrivelse 2012/13:101. Årsredovisning för staten
2012. Stockholm. Retrieved March 10, 2016, from
http://www.regeringen.se/contentassets/486c4f9e8c194ce5af0b5aecf7f52aef/arsredovi
sning-for-staten-2012-skr.-201213101
Regeringen. (2014, April 10). Regeringens skrivelse 2013/14:101. Årsredovisning för staten
2013. Stockholm, Sweden. Retrieved March 10, 2016, from
http://www.regeringen.se/contentassets/129cf650ac1b447d930c625ce132ff60/arsredo
visning-for-staten-2013-skr.-201314101
Regeringen. (2015, April 9). Regeringens skrivelse 2014/15:101. Årsredovisning för staten
2014. Stockholm, Sweden. Retrieved March 10, 2016, from
57
http://www.regeringen.se/contentassets/beaf6dd98f254aa394f11e66bd4e1bbe/arsredo
visning-for-staten-2014-skr.-201415101
Rimmel, G. (2016). Disclosureteorier. In G. Rimmel, K. Jonäll, D. Baboukardos, B.
Hartmann, & P. Inwinkl, Redovisningsteorier: Viktiga begrepp och teoretiska
perspektiv inom redovisning (pp. 77-87). Stockholm: Sanoma Utbildning.
Sahut, J.-M., Boulerne, S., & Teulon, F. (2011). Do IFRS provide better information about
intangibles in Europe? Review of Accounting and Finance, 267-290.
Saunders, M., Lewis, P., & Thornhill, A. (2009). Research methods for business students (5
ed.). Essex: Pearson Education Limited.
SFS. (n.d.). SFS 2000:605. Förordningen om årsredovisning och budgetunderlag.
Skinner, D. (2008). Accounting for intangibles - a critical review of policy recommendations.
Accounting and Business Research, 191-204.
Stolowy, H., & Jeny-Cazavan, A. (2001). International accounting disharmony: the case of
intangibles. Accounting, Auditing and Accountability Journal, 477-497.
Swedish Orphan Biovitrum AB. (2011). Annual Report 2010. Stockholm, Sweden. Retrieved
March 29, 2016, from
http://www.sobi.com/Global/Financial%20information/Annual%20Reports/sobi_ENG
_2010_web_Final.pdf
Swedish Orphan Biovitrum AB. (2012, April 5). Annual Report 2011. Retrieved March 29,
2016, from http://www.sobi.com/PageFiles/541/SOBI_ar11_ENG.pdf
Swedish Orphan Biovitrum AB. (2013, April 5). Annual Report 2012. Stockholm, Sweden.
Retrieved March 29, 2016, from
http://www.sobi.com/Global/Financial%20information/Annual%20Reports/Sobi_%20
Annual%20Report_2012.pdf
Swedish Orphan Biovitrum AB. (2014, April 16). Annual Report 2013. Stockholm, Sweden.
Retrieved March 29, 2016, from
http://www.sobi.com/Global/Financial%20information/Annual%20Reports/Sobi%20
Annual%20Report%202013.pdf
Swedish Orphan Biovitrum AB. (2015, April 15). Annual Report 2014. Stockholm, Sweden.
Retrieved March 29, 2016, from
http://www.sobi.com/Global/Financial%20information/Annual%20Reports/Sobi%20
Annual%20Report%202014.pdf
Tagesson, T. (2014). The conditions for and the users of public sector accounting. In T.
Budding, G. Grossi, & T. Tagesson, Public Sector Accounting (p. 4). Abingdon:
Routledge.
The Economist. (2006, June 15). Securitising intellectual property: Intangible opportunities.
Retrieved February 26, 2016, from http://www.economist.com/node/7068382
Watts, R. (2003, September). Conservatism in accounting Part I: explanations and
implications. Accounting Horizons, 17, 207-221. Retrieved March 17, 2016
Wilson, R., & Stenson, J. (2008). Intermezzo. Valuation of information assets on the balance
sheet: The recognition and approaches to the valuation of intangible assets. Business
Information Review, 167-182.
Yallwe, A., & Buscemi, A. (2014). An Era of Intangible Assets. Journal of Applied Finance
and Banking, 17-26.
Yin, R. (2007). Fallstudier: design och genomförande. Malmö: Liber AB.
Yin, R. (2014). Case Study Research: Design and Methods (Vol. 5). London: SAGE
Publications Ltd.

58
Appendices
Appendix 1 – Branschstatistik
Preliminära balansräkningsposter enligt Företagens ekonomi, mnkr efter näringsgren SNI 2007, balansräkningsposter och år
2009 2010 2011 2012 2013 2014
01 jordbruksföretag och serviceföretag till jordbruk
434 505 435 408 379 328
02 skogsbruksföretag 292 427 468 468 446 498
03 fiskare och vattenbrukare 18 17 144 141 213 241
05-09 gruvor och mineralutvinningsindustri
.. .. .. .. 1228 ..
05 kolgruvor .. .. .. .. .. ..
06 industri för utvinning av råpetroleum och naturgas
.. .. .. .. .. ..
07-09 utvinning av metallmalmer och annan utvinning av mineral samt service till utvinning
794 2902 2713 1035 .. ..
07 metallmalmsgruvor .. .. .. .. .. 356
08 annan industri för mineralutvinning
.. .. .. .. .. 139
09 serviceföretag till utvinning .. .. .. .. .. 3006
10 livsmedelsindustri 2880 4070 3677 2901 2911 2645
11-12 dryckesvaru- och tobaksindustri
527 484 16059 394 17147 16153
13 textilindustri 30 47 25 297 264 231
14 beklädnadsindustri 18 7 12 11 18 17
15 industri för läder och lädervaror
23 31 28 24 23 21
16 industri för trä och varor av trä, kork och rotting o.d. utom möbler
2422 2054 1791 1368 1061 368
17 massa-, pappers- och pappersvaruindustri
3079 2619 2063 1689 1436 1003
18 grafisk och annan reproduktionsindustri
516 465 501 444 383 209
19-21 kemisk industri, petroleumprodukter och läkemedelsindustri
16355 20793 15460 13647 14544 ..
19-20 industri för stenkolsprodukter och raffinerade petroleumprodukter och kemisk industri
.. .. .. .. .. 3211
21 industri för farmaceutiska basprodukter och läkemedel
.. .. .. .. .. 30450
22 gummi- och plastvaruindustri
869 1061 935 2210 1548 2175
23 industri för andra icke-metalliska mineraliska produkter
743 655 601 570 473 277
24 stål- och metallverk 830 14849 14004 13125 12318 11562
25 industri för metallvaror utom maskiner och apparater
1203 1057 866 1710 1626 1567
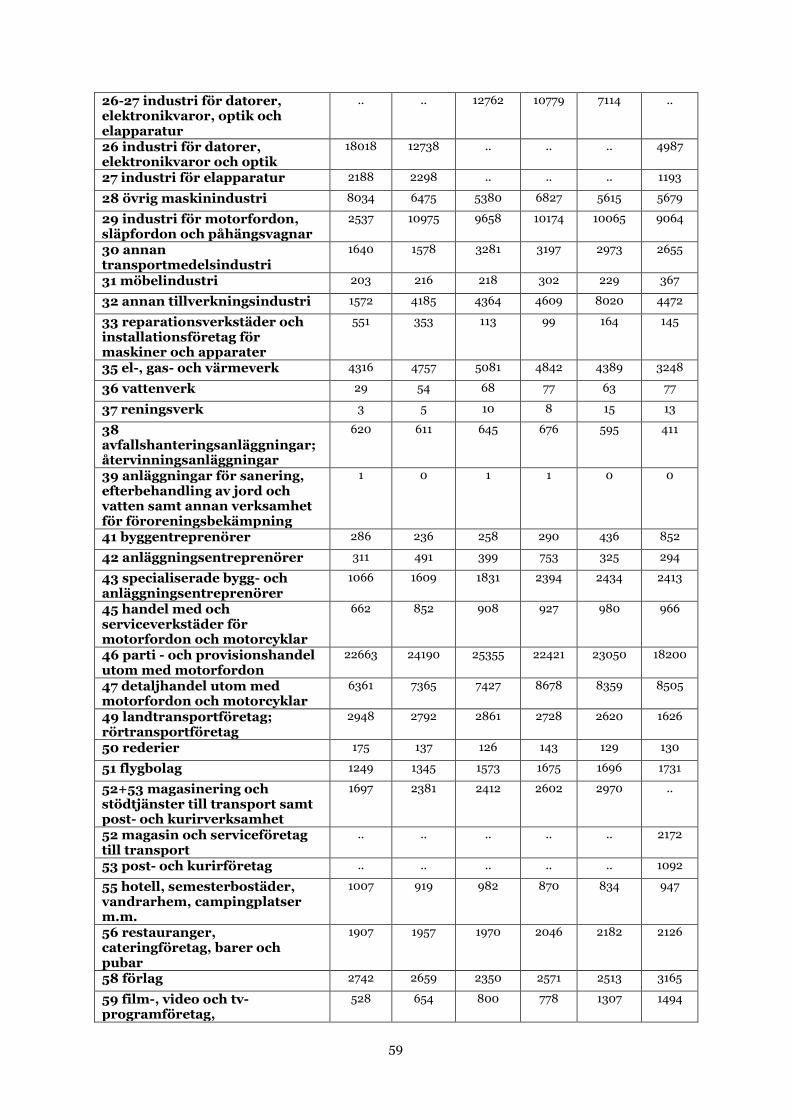
59
26-27 industri för datorer, elektronikvaror, optik och elapparatur
.. .. 12762 10779 7114 ..
26 industri för datorer, elektronikvaror och optik
18018 12738 .. .. .. 4987
27 industri för elapparatur 2188 2298 .. .. .. 1193
28 övrig maskinindustri 8034 6475 5380 6827 5615 5679
29 industri för motorfordon, släpfordon och påhängsvagnar
2537 10975 9658 10174 10065 9064
30 annan transportmedelsindustri
1640 1578 3281 3197 2973 2655
31 möbelindustri 203 216 218 302 229 367
32 annan tillverkningsindustri 1572 4185 4364 4609 8020 4472
33 reparationsverkstäder och installationsföretag för maskiner och apparater
551 353 113 99 164 145
35 el-, gas- och värmeverk 4316 4757 5081 4842 4389 3248
36 vattenverk 29 54 68 77 63 77
37 reningsverk 3 5 10 8 15 13
38 avfallshanteringsanläggningar; återvinningsanläggningar
620 611 645 676 595 411
39 anläggningar för sanering, efterbehandling av jord och vatten samt annan verksamhet för föroreningsbekämpning
1 0 1 1 0 0
41 byggentreprenörer 286 236 258 290 436 852
42 anläggningsentreprenörer 311 491 399 753 325 294
43 specialiserade bygg- och anläggningsentreprenörer
1066 1609 1831 2394 2434 2413
45 handel med och serviceverkstäder för motorfordon och motorcyklar
662 852 908 927 980 966
46 parti - och provisionshandel utom med motorfordon
22663 24190 25355 22421 23050 18200
47 detaljhandel utom med motorfordon och motorcyklar
6361 7365 7427 8678 8359 8505
49 landtransportföretag; rörtransportföretag
2948 2792 2861 2728 2620 1626
50 rederier 175 137 126 143 129 130
51 flygbolag 1249 1345 1573 1675 1696 1731
52+53 magasinering och stödtjänster till transport samt post- och kurirverksamhet
1697 2381 2412 2602 2970 ..
52 magasin och serviceföretag till transport
.. .. .. .. .. 2172
53 post- och kurirföretag .. .. .. .. .. 1092
55 hotell, semesterbostäder, vandrarhem, campingplatser m.m.
1007 919 982 870 834 947
56 restauranger, cateringföretag, barer och pubar
1907 1957 1970 2046 2182 2126
58 förlag 2742 2659 2350 2571 2513 3165
59 film-, video och tv-programföretag,
528 654 800 778 1307 1494
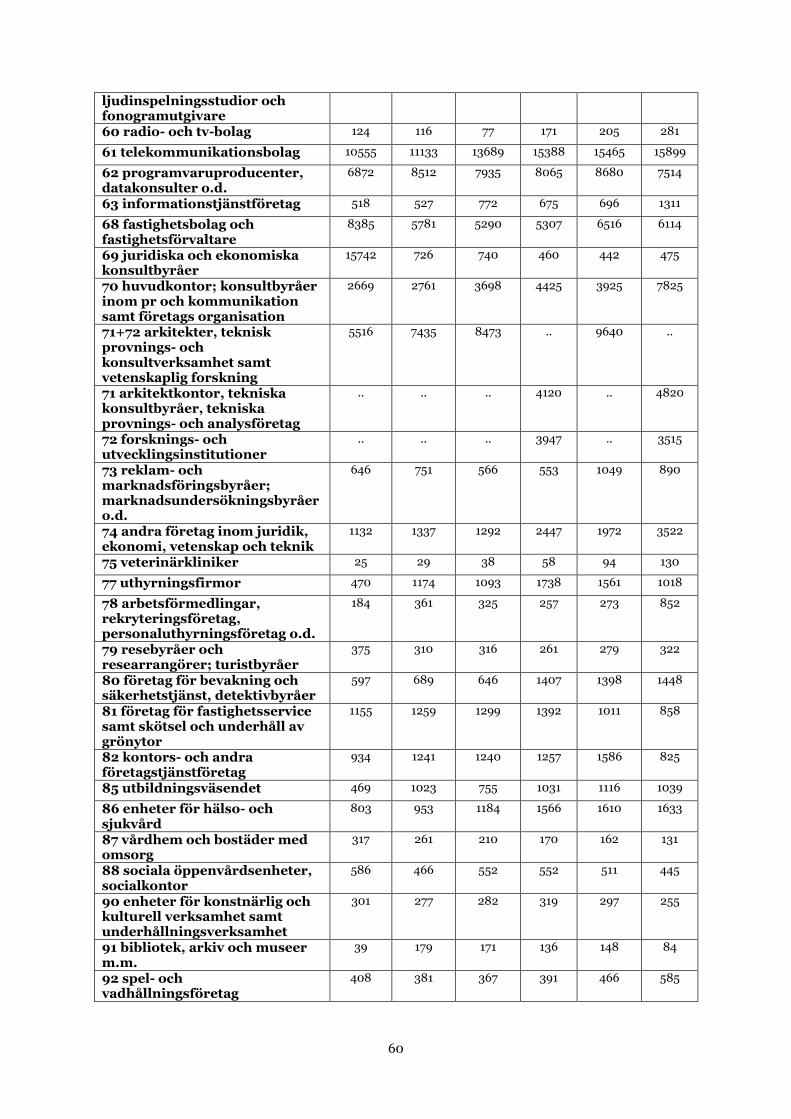
60
ljudinspelningsstudior och fonogramutgivare 60 radio- och tv-bolag 124 116 77 171 205 281
61 telekommunikationsbolag 10555 11133 13689 15388 15465 15899
62 programvaruproducenter, datakonsulter o.d.
6872 8512 7935 8065 8680 7514
63 informationstjänstföretag 518 527 772 675 696 1311
68 fastighetsbolag och fastighetsförvaltare
8385 5781 5290 5307 6516 6114
69 juridiska och ekonomiska konsultbyråer
15742 726 740 460 442 475
70 huvudkontor; konsultbyråer inom pr och kommunikation samt företags organisation
2669 2761 3698 4425 3925 7825
71+72 arkitekter, teknisk provnings- och konsultverksamhet samt vetenskaplig forskning
5516 7435 8473 .. 9640 ..
71 arkitektkontor, tekniska konsultbyråer, tekniska provnings- och analysföretag
.. .. .. 4120 .. 4820
72 forsknings- och utvecklingsinstitutioner
.. .. .. 3947 .. 3515
73 reklam- och marknadsföringsbyråer; marknadsundersökningsbyråer o.d.
646 751 566 553 1049 890
74 andra företag inom juridik, ekonomi, vetenskap och teknik
1132 1337 1292 2447 1972 3522
75 veterinärkliniker 25 29 38 58 94 130
77 uthyrningsfirmor 470 1174 1093 1738 1561 1018
78 arbetsförmedlingar, rekryteringsföretag, personaluthyrningsföretag o.d.
184 361 325 257 273 852
79 resebyråer och researrangörer; turistbyråer
375 310 316 261 279 322
80 företag för bevakning och säkerhetstjänst, detektivbyråer
597 689 646 1407 1398 1448
81 företag för fastighetsservice samt skötsel och underhåll av grönytor
1155 1259 1299 1392 1011 858
82 kontors- och andra företagstjänstföretag
934 1241 1240 1257 1586 825
85 utbildningsväsendet 469 1023 755 1031 1116 1039
86 enheter för hälso- och sjukvård
803 953 1184 1566 1610 1633
87 vårdhem och bostäder med omsorg
317 261 210 170 162 131
88 sociala öppenvårdsenheter, socialkontor
586 466 552 552 511 445
90 enheter för konstnärlig och kulturell verksamhet samt underhållningsverksamhet
301 277 282 319 297 255
91 bibliotek, arkiv och museer m.m.
39 179 171 136 148 84
92 spel- och vadhållningsföretag
408 381 367 391 466 585

61
93 sport-, fritids- och nöjesanläggningar
470 499 435 518 503 375
94 intresseorganisationer och religiösa samfund
56 41 31 117 44 48
95 reparationsverkstäder för datorer, hushållsartiklar och personliga artiklar
146 154 121 61 49 38
96 andra konsumenttjänstföretag
446 655 644 614 592 447
SUMMA 174 287 192 906 202 856 188 312 205 385 215 180
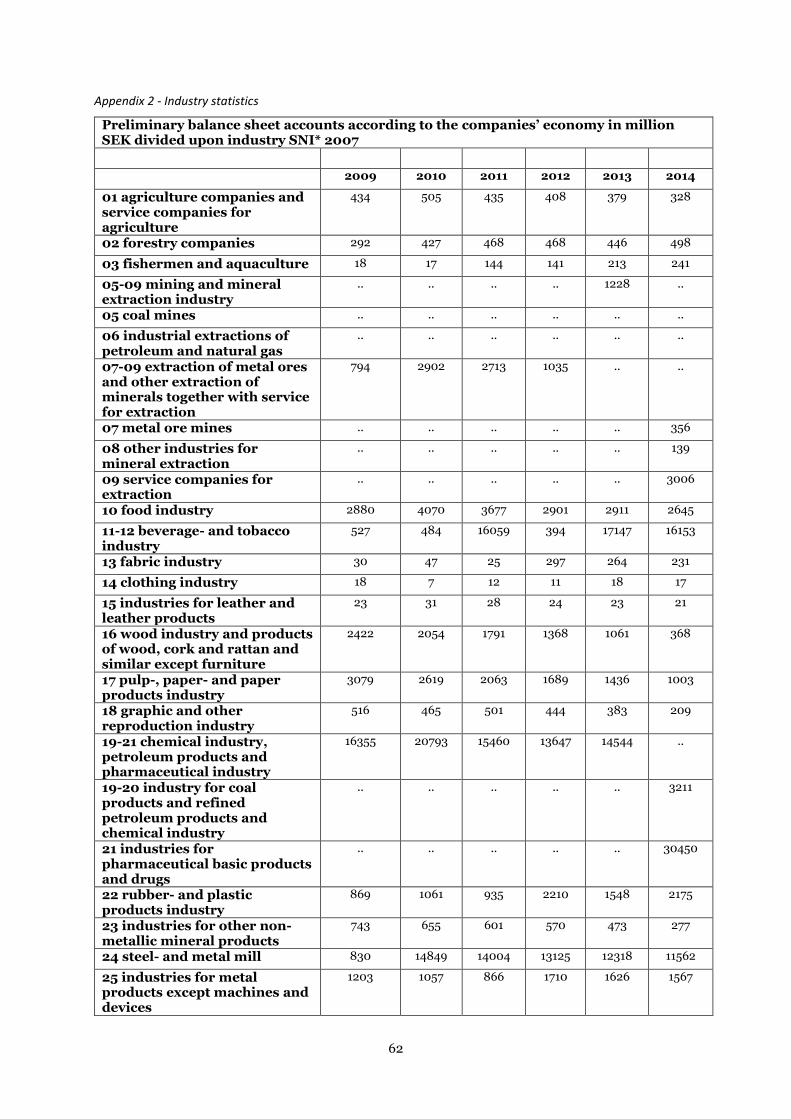
62
Appendix 2 - Industry statistics
Preliminary balance sheet accounts according to the companies’ economy in million SEK divided upon industry SNI* 2007
2009 2010 2011 2012 2013 2014
01 agriculture companies and service companies for agriculture
434 505 435 408 379 328
02 forestry companies 292 427 468 468 446 498
03 fishermen and aquaculture 18 17 144 141 213 241
05-09 mining and mineral extraction industry
.. .. .. .. 1228 ..
05 coal mines .. .. .. .. .. ..
06 industrial extractions of petroleum and natural gas
.. .. .. .. .. ..
07-09 extraction of metal ores and other extraction of minerals together with service for extraction
794 2902 2713 1035 .. ..
07 metal ore mines .. .. .. .. .. 356
08 other industries for mineral extraction
.. .. .. .. .. 139
09 service companies for extraction
.. .. .. .. .. 3006
10 food industry 2880 4070 3677 2901 2911 2645
11-12 beverage- and tobacco industry
527 484 16059 394 17147 16153
13 fabric industry 30 47 25 297 264 231
14 clothing industry 18 7 12 11 18 17
15 industries for leather and leather products
23 31 28 24 23 21
16 wood industry and products of wood, cork and rattan and similar except furniture
2422 2054 1791 1368 1061 368
17 pulp-, paper- and paper products industry
3079 2619 2063 1689 1436 1003
18 graphic and other reproduction industry
516 465 501 444 383 209
19-21 chemical industry, petroleum products and pharmaceutical industry
16355 20793 15460 13647 14544 ..
19-20 industry for coal products and refined petroleum products and chemical industry
.. .. .. .. .. 3211
21 industries for pharmaceutical basic products and drugs
.. .. .. .. .. 30450
22 rubber- and plastic products industry
869 1061 935 2210 1548 2175
23 industries for other non-metallic mineral products
743 655 601 570 473 277
24 steel- and metal mill 830 14849 14004 13125 12318 11562
25 industries for metal products except machines and devices
1203 1057 866 1710 1626 1567

63
26-27 industry for computers, electronic products, optics and electrical appliances
.. .. 12762 10779 7114 ..
26 industries for computers, electronic products and optics
18018 12738 .. .. .. 4987
27 industries for electrical appliances
2188 2298 .. .. .. 1193
28 other machine industry 8034 6475 5380 6827 5615 5679
29 industries for motor vehicles, trailers and semitrailers
2537 10975 9658 10174 10065 9064
30 other transport industry 1640 1578 3281 3197 2973 2655
31 furniture industry 203 216 218 302 229 367
32 other manufacturing industry
1572 4185 4364 4609 8020 4472
33 repair shops and installation companies for machines and appliances
551 353 113 99 164 145
35 electricity-, gas- and heating plant
4316 4757 5081 4842 4389 3248
36 water plant 29 54 68 77 63 77
37 purification plant 3 5 10 8 15 13
38 recycling plant 620 611 645 676 595 411
39 facilities for decontamination, after treatment of soil and water together with other activities for pollution control
1 0 1 1 0 0
41 building contractors 286 236 258 290 436 852
42 plant contractors 311 491 399 753 325 294
43 specialized building- and plant contractors
1066 1609 1831 2394 2434 2413
45 trade with and service workshops for motor vehicles and motor cycles
662 852 908 927 980 966
46 wholesale trade except with motor vehicles
22663 24190 25355 22421 23050 18200
47 retail except with motor vehicles and motor cycles
6361 7365 7427 8678 8359 8505
49 land transportation companies
2948 2792 2861 2728 2620 1626
50 shipping companies 175 137 126 143 129 130
51 airlines 1249 1345 1573 1675 1696 1731
52+53 warehousing and support services for transport together with postal and courier activities
1697 2381 2412 2602 2970 ..
52 warehouse and service companies for transport
.. .. .. .. .. 2172
53 postal- and courier activities
.. .. .. .. .. 1092
55 hotels, vacation residential, hostels, campsites etc.
1007 919 982 870 834 947
56 restaurants, catering companies, bars and pubs
1907 1957 1970 2046 2182 2126
58 publishers 2742 2659 2350 2571 2513 3165
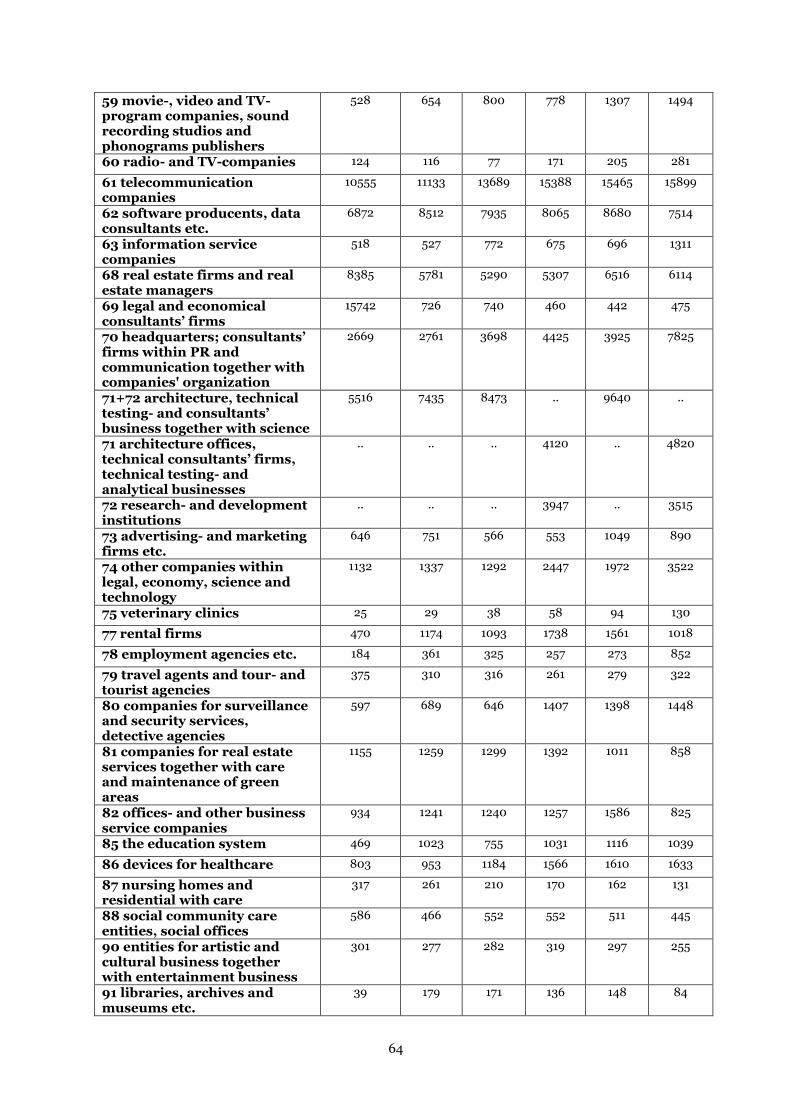
64
59 movie-, video and TV-program companies, sound recording studios and phonograms publishers
528 654 800 778 1307 1494
60 radio- and TV-companies 124 116 77 171 205 281
61 telecommunication companies
10555 11133 13689 15388 15465 15899
62 software producents, data consultants etc.
6872 8512 7935 8065 8680 7514
63 information service companies
518 527 772 675 696 1311
68 real estate firms and real estate managers
8385 5781 5290 5307 6516 6114
69 legal and economical consultants’ firms
15742 726 740 460 442 475
70 headquarters; consultants’ firms within PR and communication together with companies' organization
2669 2761 3698 4425 3925 7825
71+72 architecture, technical testing- and consultants’ business together with science
5516 7435 8473 .. 9640 ..
71 architecture offices, technical consultants’ firms, technical testing- and analytical businesses
.. .. .. 4120 .. 4820
72 research- and development institutions
.. .. .. 3947 .. 3515
73 advertising- and marketing firms etc.
646 751 566 553 1049 890
74 other companies within legal, economy, science and technology
1132 1337 1292 2447 1972 3522
75 veterinary clinics 25 29 38 58 94 130
77 rental firms 470 1174 1093 1738 1561 1018
78 employment agencies etc. 184 361 325 257 273 852
79 travel agents and tour- and tourist agencies
375 310 316 261 279 322
80 companies for surveillance and security services, detective agencies
597 689 646 1407 1398 1448
81 companies for real estate services together with care and maintenance of green areas
1155 1259 1299 1392 1011 858
82 offices- and other business service companies
934 1241 1240 1257 1586 825
85 the education system 469 1023 755 1031 1116 1039
86 devices for healthcare 803 953 1184 1566 1610 1633
87 nursing homes and residential with care
317 261 210 170 162 131
88 social community care entities, social offices
586 466 552 552 511 445
90 entities for artistic and cultural business together with entertainment business
301 277 282 319 297 255
91 libraries, archives and museums etc.
39 179 171 136 148 84
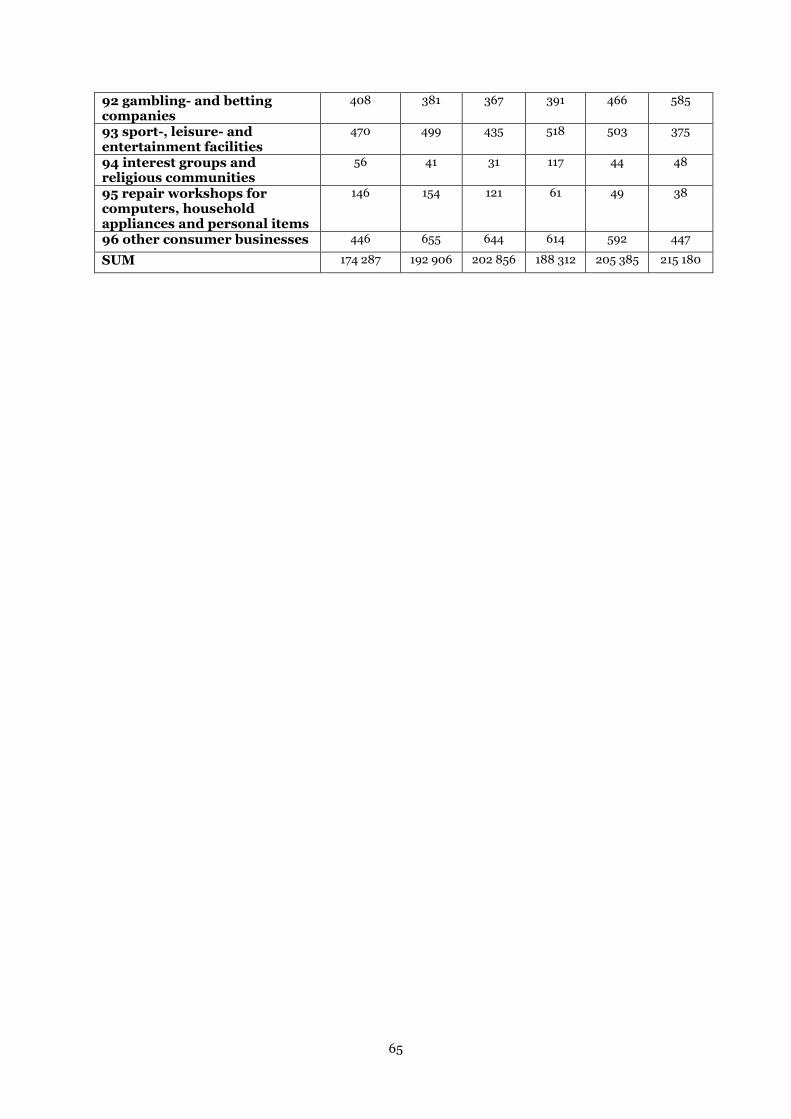
65
92 gambling- and betting companies
408 381 367 391 466 585
93 sport-, leisure- and entertainment facilities
470 499 435 518 503 375
94 interest groups and religious communities
56 41 31 117 44 48
95 repair workshops for computers, household appliances and personal items
146 154 121 61 49 38
96 other consumer businesses 446 655 644 614 592 447
SUM 174 287 192 906 202 856 188 312 205 385 215 180


![CHAPTER 12 INTANGIBLE ASSETS - John Wiley & Sons · based on a value-in-use estimate.4 Because the fair value of the division exceeds the Chapter 12 Intangible Assets [1]Intangible](https://static.fdocuments.net/doc/165x107/5af3f3dd7f8b9a9e598bfe75/chapter-12-intangible-assets-john-wiley-on-a-value-in-use-estimate4-because-the.jpg)


![INTANGIBLE VALUE –FACT OR FICTION - AI Home | … · [IAS 38.8] 3. INTANGIBLE VALUE –FACT OR FICTION ... 2.36 INTANGIBLE PROPERTY (INTANGIBLE ASSETS): Non-physical assets, …](https://static.fdocuments.net/doc/165x107/5af0812f7f8b9ac2468e1bc2/intangible-value-fact-or-fiction-ai-home-ias-388-3-intangible-value.jpg)