VALUE AND MOMENTUM EVERYWHERE - Q Group · VALUE AND MOMENTUM EVERYWHERE ... • US stock selection...
37
VALUE AND MOMENTUM EVERYWHERE Clifford S. Asness AQR Capital Management, LLC Tobias J. Moskowitz University of Chicago, Booth School and NBER Lasse H. Pedersen NYU, CEPR, and NBER The information set forth herein has been obtained or derived from sources believed by the author to be reliable. However, the author does not make any representation or warranty, express or implied, as to the information’s accuracy or completeness, nor does the author recommend that the attached information serve as the basis of any investment decision. This document has been provided to you solely for information purposes and does not constitute an offer or solicitation of an offer, or any advice or recommendation, to purchase any securities or other financial instruments, and may not be construed as such. This document is intended exclusively for the use of the person to whom it has been delivered by the author, and it is not to be reproduced or redistributed to any other person.
Transcript of VALUE AND MOMENTUM EVERYWHERE - Q Group · VALUE AND MOMENTUM EVERYWHERE ... • US stock selection...

AQR Capital Management, LLC |Two Greenwich Plaza, Third Floor | Greenwich, CT 06830 |T: 203.742.3600 | F: 203.742.3100 |www.aqr.com
VALUE AND MOMENTUM EVERYWHERE
Clifford S. AsnessAQR Capital Management, LLC
Tobias J. MoskowitzUniversity of Chicago, Booth School and NBER
Lasse H. PedersenNYU, CEPR, and NBER
The information set forth herein has been obtained or derived from sources believed by the author to be reliable. However, the author does not make any representation or warranty, express or implied, as to the information’s accuracy or completeness, nor does the author recommend that the attached information serve as the basis of any investment decision. This document has been provided to you solely for information purposes and does not constitute an offer or solicitation of an offer, or any advice or recommendation, to purchase any securities or other financial instruments, and may not be construed as such. This document is intended exclusively for the use of the person to whom it has been delivered by the author, and it is not to be reproduced or redistributed to any other person.
2
Motivation
Some of the most studied capital market phenomena are• Value effect: assets with high “book value”-to-market value outperform low ones• Momentum effect: recent relative winners outperform recent relative losers
Value and momentum are often studied• only separately• only in certain asset classes• only one asset class at a time

3
Literature
Literature• US stock selection (Statman (1980), Fama-French (1992), Jegadeesh and Titman
(1993), Asness (1994))• Stocks in other countries (Fama and French (1998), Rouwenhorst (1998), Liew
and Vassalou (2000), Griffin and Martin (2003), Chui, Titman, Wei (2002))• Country equity indices (Asness, Liew, and Stevens (1997), Bhojraj and
Swaminathan (2006))• Currency momentum (Shleifer and Summers (1990), Kho (1996), LeBaron
(1999))• Commodity momentum (Gorton, Hayashi and Rouwenhorst (2007))• Value effects in currencies and commodities (?)• Value and momentum in government bonds (?)
4
What We Do
Extend and unify analysis of value and momentum (almost) “everywhere”
• Breadth of asset classes and markets studied in a unified setting simultaneously
• Combining asset classes and combining value with momentum large economicand statistical gains
• Gain insight by looking across asset classes and globally at once
Identify connections between value and momentum across markets
• Providing evidence for common global phenomena/ factors
• Consider common explanations: macro and liquidity risks
New evidence consistent with or against existing theories for these phenomena
• Rational explanations---common factor structure, production-based theories?
• Behavioral explanations---misreaction to idiosyncratic information?

5
Main Results
Value and momentum effects appear in all of the major asset classes
• Value and momentum strategies both have positive Sharpe ratios despite beingnegatively correlated
• Therefore, a 50/50 combination has higher Sharpe than either stand alone
• Large diversification benefits from combining asset classes globally:
1. Economic power of the combined asset class portfolios
2. Statistical power of the combined portfolio reduces noise
Striking co-movement patterns across asset classes:
• Value here correlates with value there
• Momentum here correlates with momentum there
• Value and momentum negatively correlated everywhere
6
Main Results
Macro risk doesn’t explain much
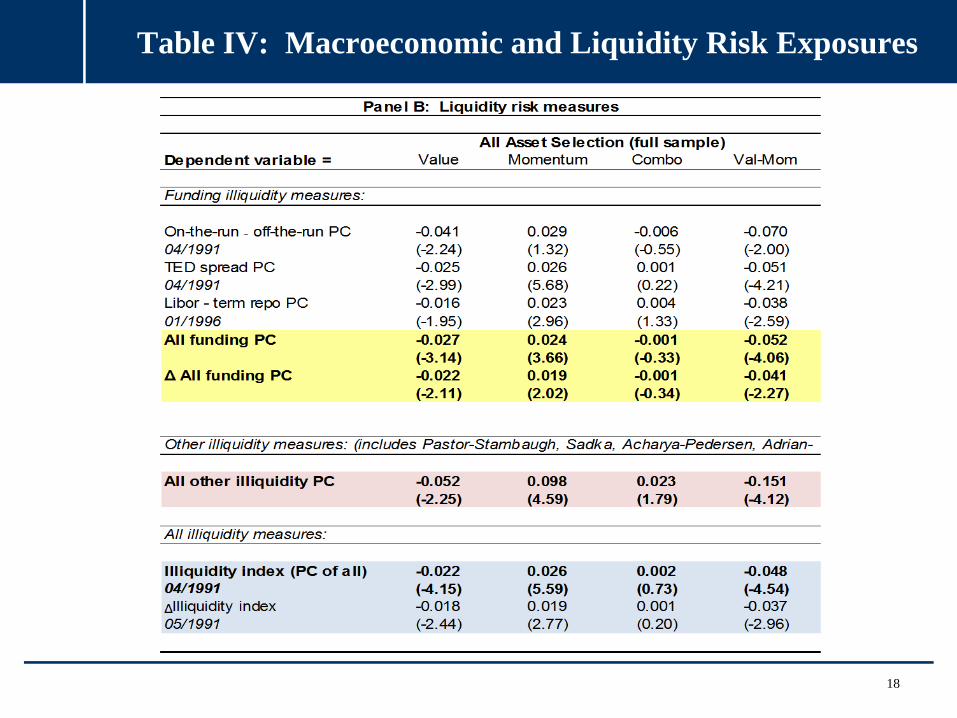
Liquidity risk:
• Value loads positively and momentum loads negatively on our measure offunding liquidity risk
• Liquidity risk is priced and may explain part of value premium, but makesmomentum more puzzling
• Partly explains global comovement patterns and negative correlation betweenvalue and momentum
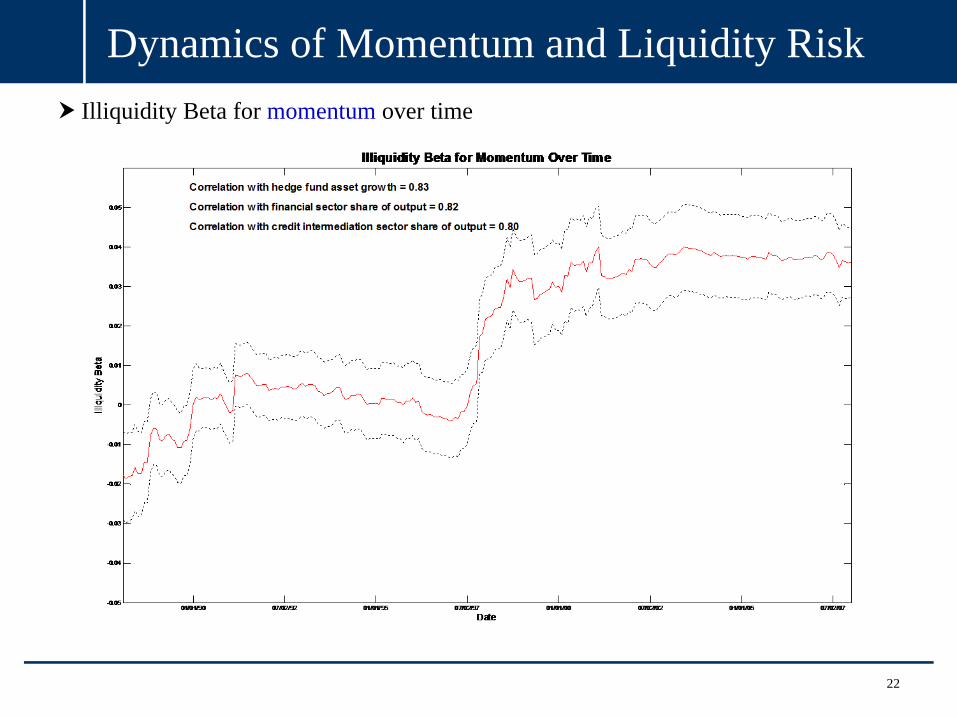
Interesting dynamic effects:
• Importance of liquidity risk increases significantly over time, rising sharply afterthe summer of 1998
• Over time, value and momentum both become less profitable, more correlatedacross markets and asset classes, and more correlated with each other
7
Main Results
These risks and patterns are statistically present when looking everywhere
• Not easy to detect these in any single strategy or asset class
• Liquidity risk and dynamics may point to the importance of trading costs andlimited arbitrage in explaining these phenomena
• But, there is a lot left to be explained
We’re planning to make our data available for other researchers and to maintain itgoing forward at: http://www.aqr.com/research.htm

8
Overview of Talk
Data and methodology
New facts on performance of value and momentum everywhere
Co-movement patterns
Exposures to macroeconomic and liquidity risks
• The power of looking everywhere at once
• Some interesting dynamics

9
Data SourcesStock selection• U.S.:
– Universe: CRSP common equity with a recent book value, at least 12 months of returns, excluding ADR’s, foreignshares REITS, financials, closed-end funds, stocks with share prices less than $1, and stocks in bottom quartile ofmarket cap. Focus on top half of remaining universe based on market cap (top 37.5% of total universe).
– Prices and returns: CRSP– Book values: Compustat
• U.K., Japan, Continental Europe:– Universe: BARRA with recent book value from Worldscope, at least 12 months of returns and same filters as US.– Prices and returns: Barra– Book values: Worldscope
Equity country selection• Stock index returns and book values: MSCI
Bond country selection• Returns: Datastream MSCI 10-year government bond index in excess of local short rate• Short rate and 10-year government bond yield: Bloomberg• Inflation forecasts for next 12 months: analysts estimates compiled by Consensus Economics
Currency selection• Spot exchange rates: Datastream• LIBOR short rates: Bloomberg

10
Data SourcesCommodity selection
• Aluminum, Copper, Nickel, Zinc, Lead, Tin: London Metal Exchange (LME)• Brent Crude, Gas Oil: Intercontinental Exchange (ICE)• Live Cattle, Feeder Cattle, Lean Hogs: Chicago Mercantile Exchange (CME)• Corn, Soybeans, Soy Meal, Soy Oil, Wheat: Chicago Board of Trade (CBOT)• WTI Crude, RBOB Gasoline, Heating Oil, Natural Gas: New York Mercantile Exchange (NYMEX)• Gold, Silver: New York Commodities Exchange (COMEX)• Cotton, Coffee, Cocoa, Sugar: New York Board of Trade (NYBOT)• Platinum: Tokyo Commodity Exchange (TOCOM)
Macro indicators• Recession = linear interpolation between peak (=0) and trough dates (=1)
– US dates from NBER, Non-US dates from Economic Cycle Research Institute• Long-run consumption growth = 3-year future growth in per capita consumption (sum of 3-year changes
in above)
Funding liquidity indicators• TED spread (3 month LIBOR minus 3 month T-bill rate), U.S., U.K., Japan, Germany (Bloomberg and
International Fund Services (IFS))• 3-month LIBOR minus term repo rate (IFS, various brokers)• Supplement with quantity and market liquidity indicators: VIX, Pastor-Stambaugh, Acharya-Pedersen,
Sadka, Adrian-Shin.

11
We use simple and, to the extent possible, standard and uniform measures
Momentum: Return from t-12 to t-2 months
Value:• Stocks: book-to-price• Country equity indices: aggregate book-to-price• Commodities: “book” is the average commodity spot price 4.5 to 5.5 years ago• Currencies: “book” is the average exchange rate 4.5 to 5.5 years ago adjusted for
interest-rate differentials, i.e. excess return from t-60 to t-1– deviation from UIP, or change in PPP if real rates are constant across countries
• Bonds: real bond yield, i.e. yield minus expected inflation– “book” is discounted cash-flows using expected inflation
Measures of Value and Momentum

12
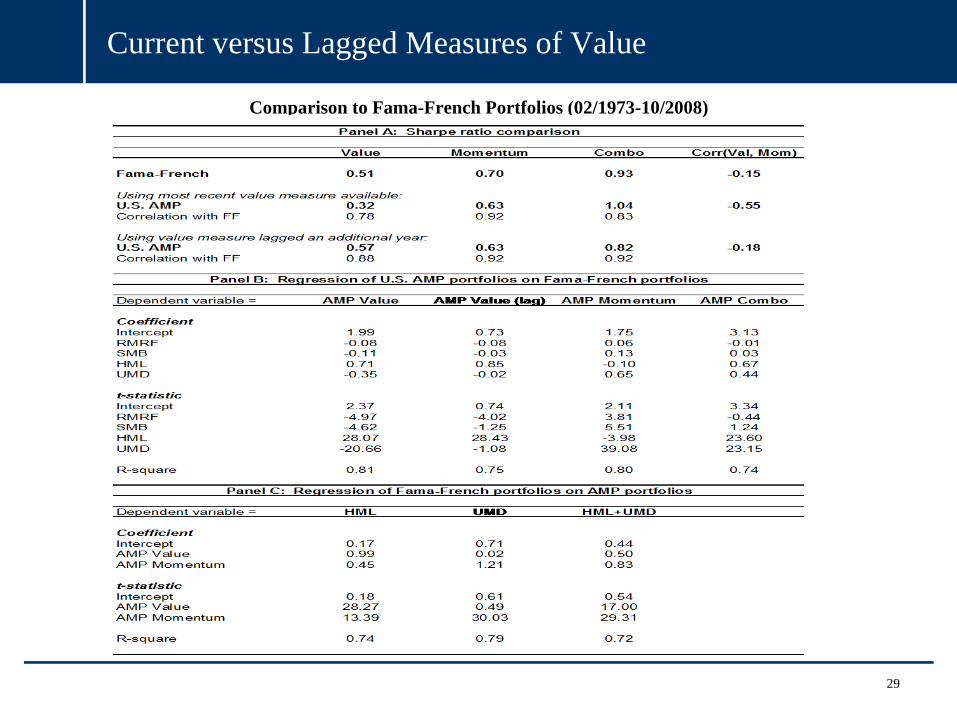
We use most recently available price in our value measure
• Induces some negative correlation between value and momentum within (but notacross) asset classes
• Easy to create highly negatively correlated portfolios, harder to have them bothdeliver positive expected returns/alphas
• Replicate using lagged value measures for robustness (appendix in the paper)
• Using most recent price is a natural value measure (hard to imagine more recentprice does not provide useful information)
• Efficient frontier will look the same
Lagging Price in the Value Measure

13
Methodology
Portfolios sorted on value and momentum within each asset class:• Three equal groups (high, middle, low)• Value-weight for stocks, equal-weight for other asset classes
Portfolios based on 50/50 combination of value/momentum:
Also examine High – Low spread returns
Allows us to also examine long vs. short side of trade
*Robustness: when combine across asset classes, do both equal-weighting and equal-volatility weighting(e.g., commodities have 5 times the volatility as bonds)

14
Table I: Performance of Value and Momentum Sorted Portfolios Across Markets and Asset Classes

15
Table I (cont.)

16
Table II: Correlation of Value and Momentum Across Markets and Asset Classes

17
Table II (cont.)
18
Table IV: Macroeconomic and Liquidity Risk Exposures

19
Power of Looking Everywhere: Liquidity Risk

20
Economic Magnitudes
Statistical correlations we uncover are significant and interesting, but only a startingpoint
Economic magnitudes of premia and correlation structure explained is small
Liquidity risk may explain part of value premium and negative correlation betweenvalue and momentum, but only makes momentum premium more puzzling
A lot left to be explained!

21
Dynamics of Value and Liquidity RiskIlliquidity Beta for value over time
22
Dynamics of Momentum and Liquidity RiskIlliquidity Beta for momentum over time

23
Value in Liquid vs. Illiquid Times

24
Momentum in Liquid vs. Illiquid Times

25
Conclusions
Value and momentum work in a variety of markets and asset classes
• Their combination works better than either stand alone
• Large economic and statistical benefits to our unified approach of looking acrossmarkets and asset classes
Identify interesting global co-movement structure
Data hint toward a link between these phenomena and liquidity risk
Interesting dynamics related to liquidity risk and extreme events
Still far from a full explanation
26
Conclusions
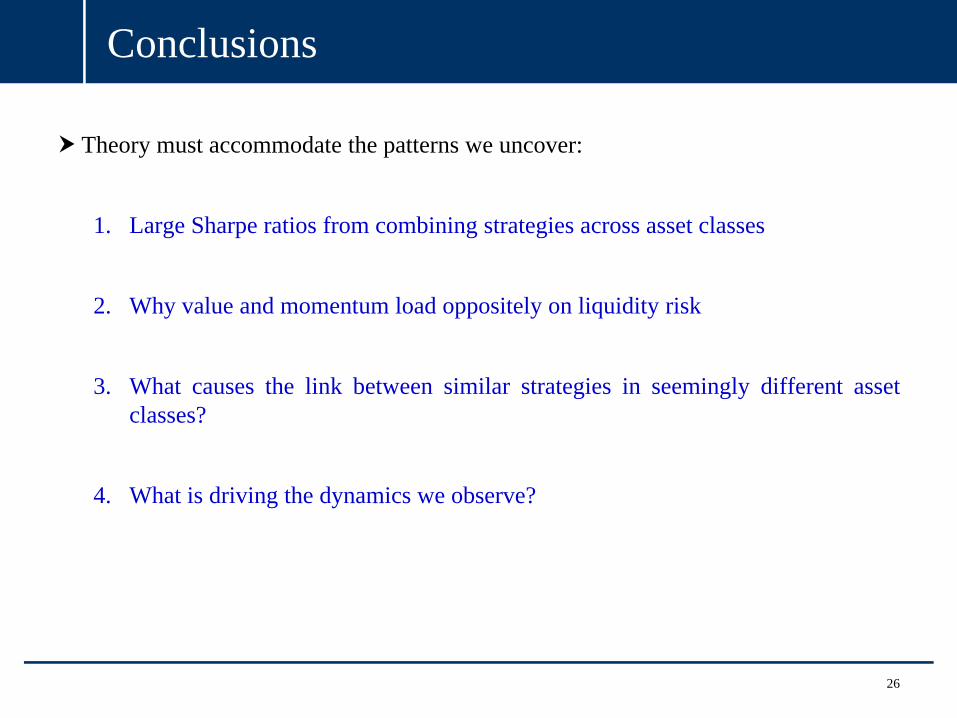
Theory must accommodate the patterns we uncover:
1. Large Sharpe ratios from combining strategies across asset classes
2. Why value and momentum load oppositely on liquidity risk
3. What causes the link between similar strategies in seemingly different assetclasses?
4. What is driving the dynamics we observe?

27
Appendix

28
Over-Optimistic or Pessimistic for Real-World Implementation?
Over-optimistic
• No transactions or financing costs– makes performance closer for stock vs. non-stock and val vs. mom
• Backtests never hit a funding-liquidity (or confidence) problem
• Going forward returns may be lower– data-mining (though having looked everywhere reduces this risk)
– because some people trade on these strategies
or, not, e.g. because returns are compensation for risk?
Over-pessimistic
• We used only the simplest value and momentum measures; weighting each strategy the same
• There are many possible improvements (that must be balanced vs. the dangers of data-mining); e.g.,improved value/momentum measures, variable strategy weighting (statically and dynamically)
29
Current versus Lagged Measures of Value
Comparison to Fama-French Portfolios (02/1973-10/2008)

30
First principal component for value and momentum strategies

31
Comovement Everywhere
*Significant at the 5% level.

32
Table 5: Asset Pricing Tests

33
Table 5: Asset Pricing Tests (cont.)
34
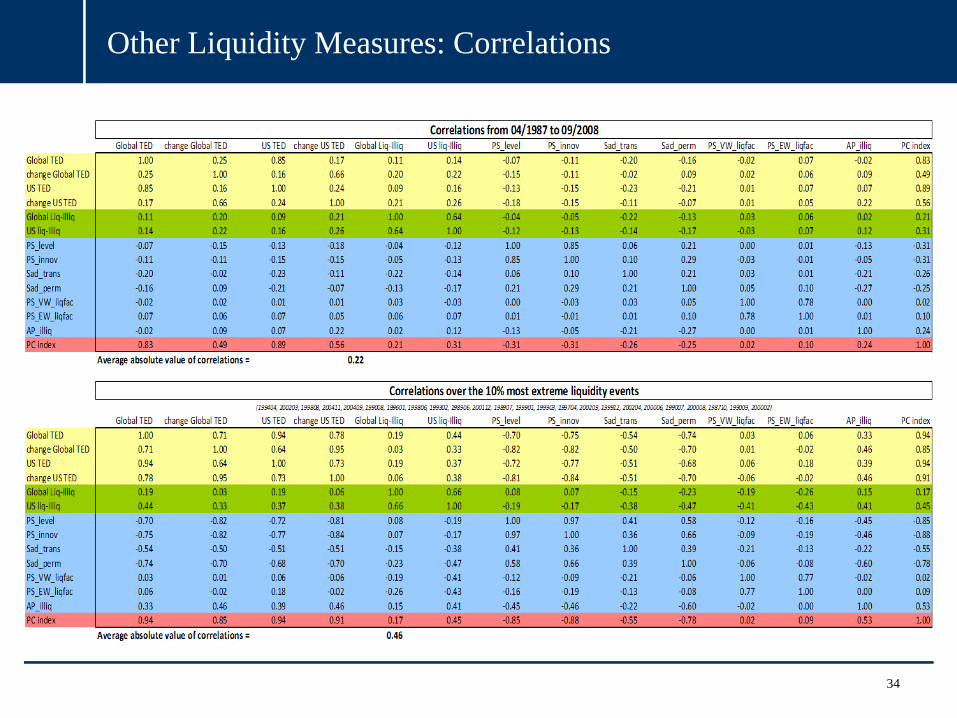
Other Liquidity Measures: Correlations

35
Table 7: Dynamics of Value and Momentum

36
Not Everything Works Everywhere
The power of looking everywhere at once can also highlight patterns specific to an asset class or market.
• Provides a more general test of patterns found in U.S. equities
Example: January effect in value and momentum (Table 8)

37
Seasonal patterns to correlation structure?
Are seasonal effects in value and momentum driving the strong correlation structure?