Value Analysis Presentation
30
Value Analysis & Flexible Project Appraisal Presented By M H Nadeem (F-10) Sandeep Jadhav (F- )
Transcript of Value Analysis Presentation

8/7/2019 Value Analysis Presentation
http://slidepdf.com/reader/full/value-analysis-presentation 1/30
Value Analysis & Flexible
Project Appraisal
Presented By
M H Nadeem (F-10)
Sandeep Jadhav (F- )

8/7/2019 Value Analysis Presentation
http://slidepdf.com/reader/full/value-analysis-presentation 2/30
Cost
Cost control
Cost reduction

8/7/2019 Value Analysis Presentation
http://slidepdf.com/reader/full/value-analysis-presentation 3/30
Cost
Control
It is preventive
Within specified deviation limit isacceptable.

8/7/2019 Value Analysis Presentation
http://slidepdf.com/reader/full/value-analysis-presentation 4/30
Cost Reduction
Corrective :
Continuous:
Process, procedures, organization &Methods are continuously challenged.
8/7/2019 Value Analysis Presentation
http://slidepdf.com/reader/full/value-analysis-presentation 5/30
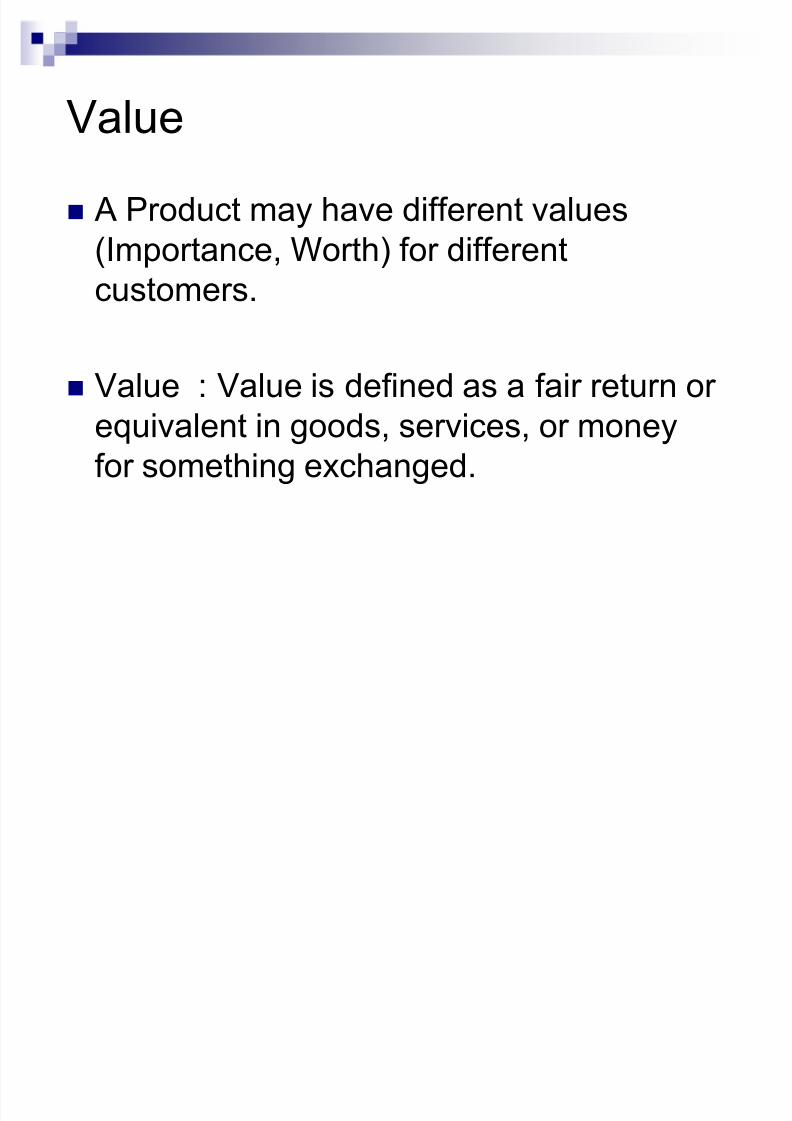
Value A Product may have different values
(Importance, Worth) for different
customers.
Value : Value is defined as a fair return or
equivalent in goods, services, or moneyfor something exchanged.
8/7/2019 Value Analysis Presentation
http://slidepdf.com/reader/full/value-analysis-presentation 6/30
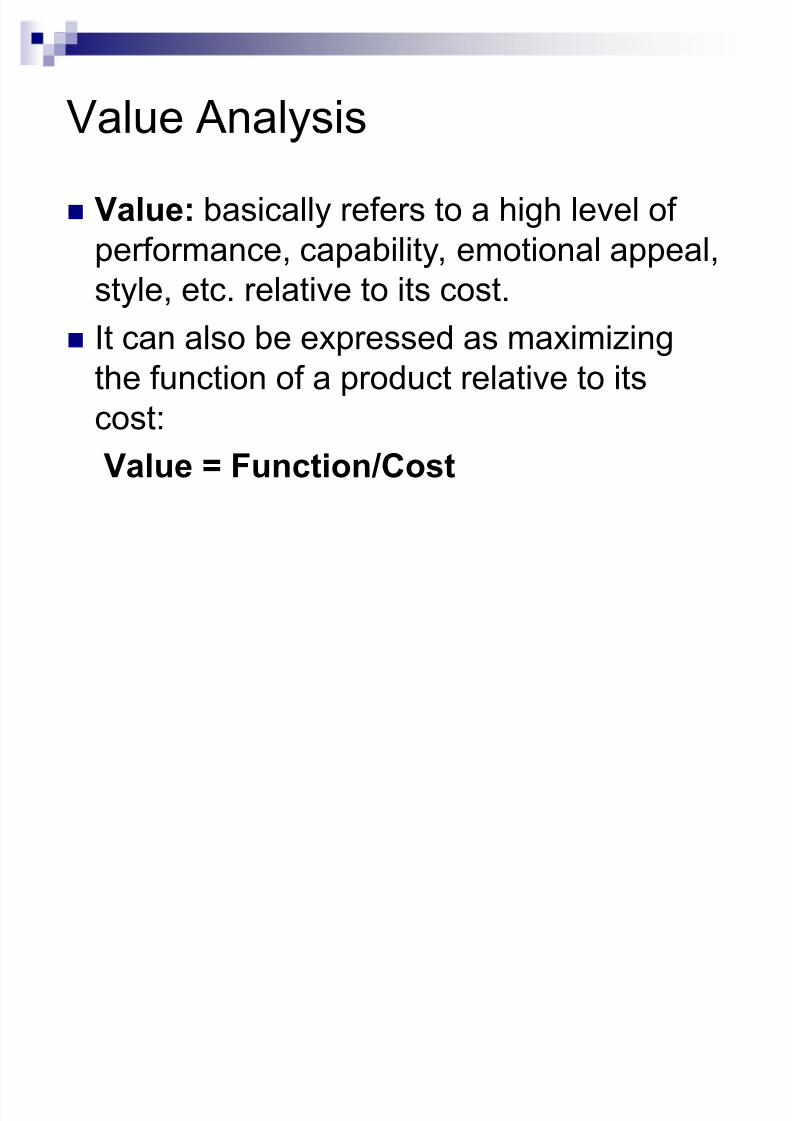
Value Analysis Value: basically refers to a high level of
performance, capability, emotional appeal,
style, etc. relative to its cost.
It can also be expressed as maximizingthe function of a product relative to its
cost:Value = Function/Cost

8/7/2019 Value Analysis Presentation
http://slidepdf.com/reader/full/value-analysis-presentation 7/30
Value Analysis Basic Function
Which makes product sell
Cannot change
Supporting Function
the manner in which the basic functions were
implemented. can be modified or eliminated

8/7/2019 Value Analysis Presentation
http://slidepdf.com/reader/full/value-analysis-presentation 8/30
Value Analysis Value = Function/Cost
As VA progressed to larger and morecomplex products and systems, it evolvedinto the "Function Analysis SystemTechnique" (FAST)
8/7/2019 Value Analysis Presentation
http://slidepdf.com/reader/full/value-analysis-presentation 9/30
Functions Use AND Aesthetic
Primary AND Secondary
Higher order (why) AND Lower order(how)
8/7/2019 Value Analysis Presentation
http://slidepdf.com/reader/full/value-analysis-presentation 10/30
Functions From a product design point of view, products that are
perceived to have high value, first address the basic function'sperformance and stress the achievement of all of the
performance attributes. Once the basic functions are satisfied, the designer's then
address the secondary functions necessary to attract customers.
Secondary functions are incorporated in the product as featuresto support and enhance the basic function and help sell the
product. The elimination of secondary functions that are not very
important to the customer will reduce product cost andincrease value without detracting from the worth of theproduct.
8/7/2019 Value Analysis Presentation
http://slidepdf.com/reader/full/value-analysis-presentation 11/30
FAST Function Analysis System Technique
- use boxes
- these boxes represent function name
- a function is related to its right functionwith the question ³HOW´
- a function is related to its left functionwith the question ³Why´
8/7/2019 Value Analysis Presentation
http://slidepdf.com/reader/full/value-analysis-presentation 12/30
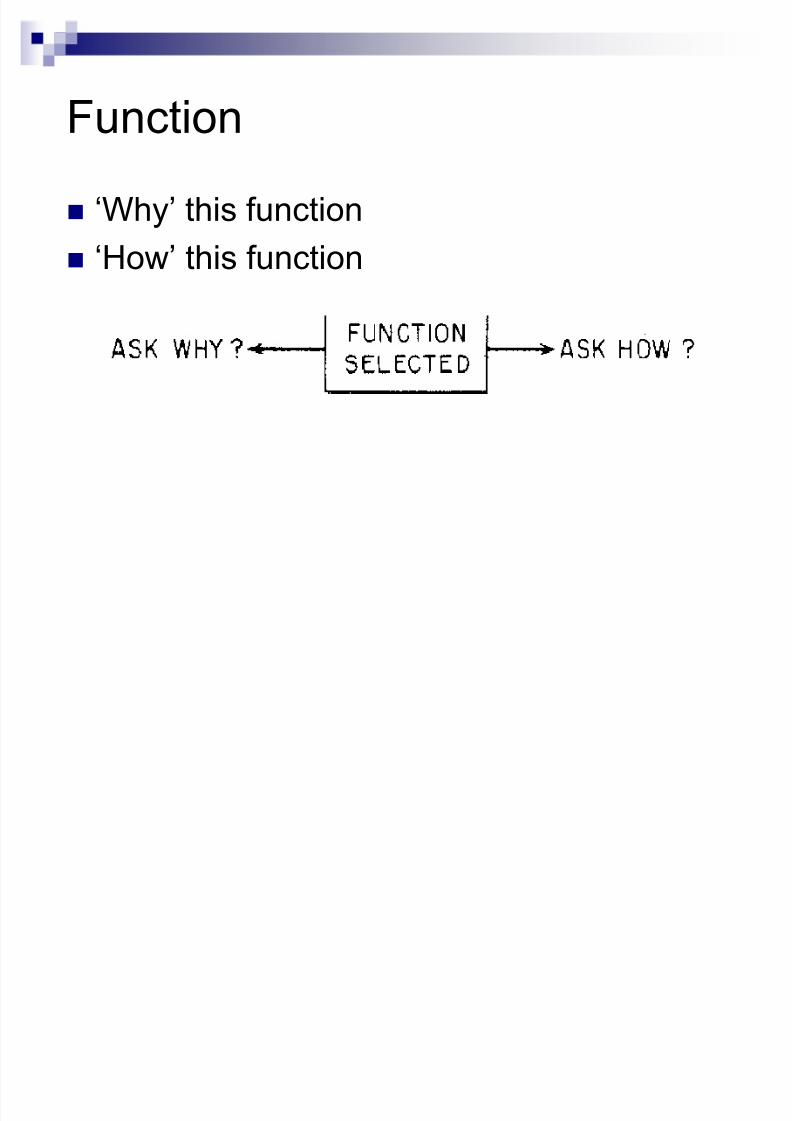
Function µWhy¶ this function
µHow¶ this function

8/7/2019 Value Analysis Presentation
http://slidepdf.com/reader/full/value-analysis-presentation 13/30
Example : A teacher teaching students using
a projector.

8/7/2019 Value Analysis Presentation
http://slidepdf.com/reader/full/value-analysis-presentation 14/30
FAST flow when

8/7/2019 Value Analysis Presentation
http://slidepdf.com/reader/full/value-analysis-presentation 15/30
Scope line The right scope line is drawn to the left of a function that is an acceptable
interface to the product or service under consideration-a suitable input tothe system. Left scope line will satisfy partially the fn left to it.

8/7/2019 Value Analysis Presentation
http://slidepdf.com/reader/full/value-analysis-presentation 16/30
Steps for cost ReductionStep 1: A list of components is created.
Step 2: The cost of each component is determined.
Once the costs have been determined for each component or sub-assembly in relation to the function(s) they support, the total cost of the component or sub-assembly is determined.
The total product cost is calculated by summing the totals for allcomponents. This total is then used to calculate the percentage of the total cost that each part represents.
For example, if a component costs $0.27 and the total cost of theproduct is $4.90, the component represents 5.5% of the total cost.

8/7/2019 Value Analysis Presentation
http://slidepdf.com/reader/full/value-analysis-presentation 17/30
Steps for cost Reduction
Step 3: The value of functions is considered.
(customer feedback).
If a certain function is not perceived to be valuable to thecustomer and the function is determined not to benecessary for reasons such as performance or reliability,
then that function(s) should be simplified or eliminated.

8/7/2019 Value Analysis Presentation
http://slidepdf.com/reader/full/value-analysis-presentation 18/30
Steps for cost ReductionStep 4: The value of each component is
determined.
This step is one of the most difficult in the functionalvalue analysis because much of it is subjective and itrequires an estimate of the value as perceived by the
customer . If absolute evaluation is not possible then evaluation
based on comparison can also be employed.

8/7/2019 Value Analysis Presentation
http://slidepdf.com/reader/full/value-analysis-presentation 19/30
Steps for cost ReductionStep 5: Alternatives that lead to reduced costs and/or
increased value are generated.
Once the existing product has been assessed, the next step is tofind design or component alternatives that serve to reduce costswithout risking value or increase value without adding cost.
The most ideal situation is to find alternatives that reduce costswhile adding value.
Step 6: The best option is selected.

8/7/2019 Value Analysis Presentation
http://slidepdf.com/reader/full/value-analysis-presentation 20/30
ProjectC
ost Reduction CPM (Critical Path Method).
Time cost Relation ship.
Crash Cost
Crashed time
Cost slope
8/7/2019 Value Analysis Presentation
http://slidepdf.com/reader/full/value-analysis-presentation 21/30
Time-C
ost Relationship It assumes that the time to perform any project
activity is depending on the amount of effort or
resources applied to it.
The Critical Path Method assumes that theestimated completion time for a project can be
shortened by applying additional resources:equipment, labor and capital to particular keyactivities.

8/7/2019 Value Analysis Presentation
http://slidepdf.com/reader/full/value-analysis-presentation 22/30
Normal AndC
rashC
onditionNormal Condition
-How long the activity will take under normal workconditions.
-How much the Activity will cost.-This is the minimum cost.
Crash Condition
-Activity is crashed to consume minimum possible time.-Cost consumed to complete the activity in this time.-This is the maximum cost.

8/7/2019 Value Analysis Presentation
http://slidepdf.com/reader/full/value-analysis-presentation 23/30
C
ost slope The cost slope shows by how much the
cost of the job would change if activities
were sped up or slowed down.

8/7/2019 Value Analysis Presentation
http://slidepdf.com/reader/full/value-analysis-presentation 24/30
Project Activities

8/7/2019 Value Analysis Presentation
http://slidepdf.com/reader/full/value-analysis-presentation 25/30
Critical Path
Hgyip

8/7/2019 Value Analysis Presentation
http://slidepdf.com/reader/full/value-analysis-presentation 26/30

8/7/2019 Value Analysis Presentation
http://slidepdf.com/reader/full/value-analysis-presentation 27/30

8/7/2019 Value Analysis Presentation
http://slidepdf.com/reader/full/value-analysis-presentation 28/30
Non critical activities Critical Path: Start-A-B-C-D-E-G-H-I-K-L-
Q-R-S-U-V.
Activities in Non Critical Path Starting withhighest cost slope
T,P,V,F,J,O,N,M
8/7/2019 Value Analysis Presentation
http://slidepdf.com/reader/full/value-analysis-presentation 29/30
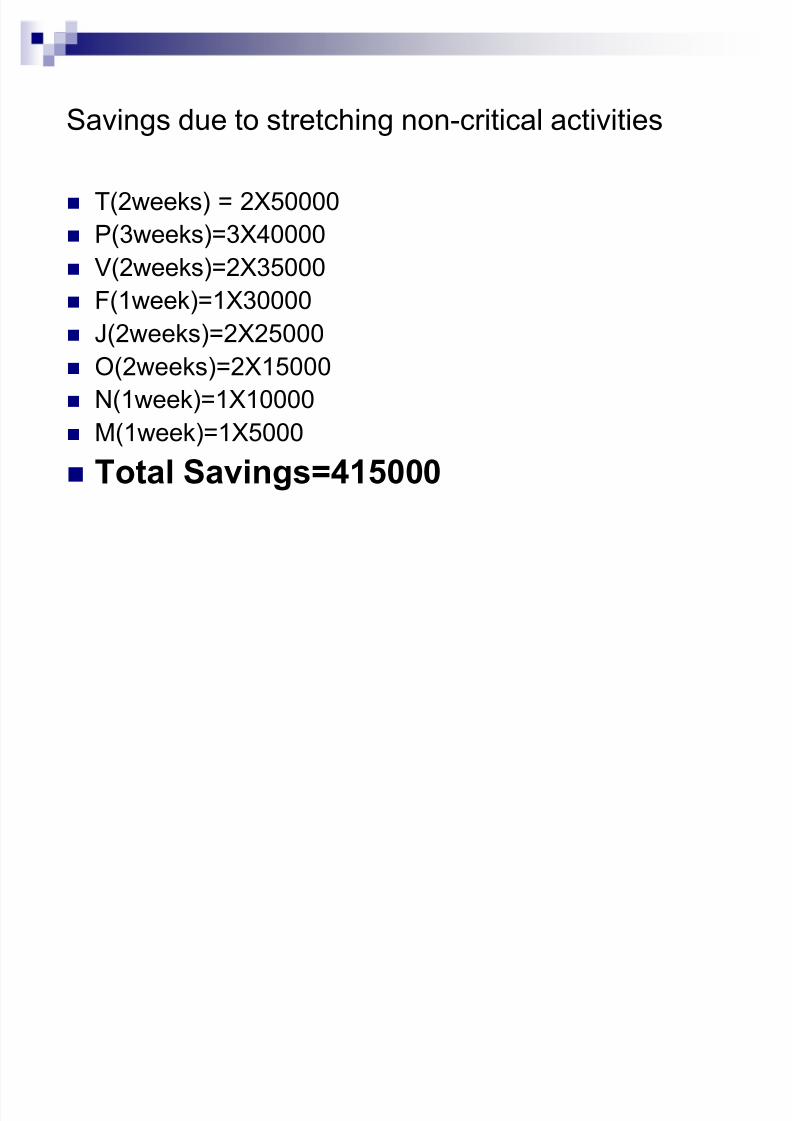
Savings due to stretching non-critical activities
T(2weeks) = 2X50000
P(3weeks)=3X40000
V(2weeks)=2X35000 F(1week)=1X30000
J(2weeks)=2X25000
O(2weeks)=2X15000
N(1week)=1X10000
M(1week)=1X5000
Total Savings=415000

8/7/2019 Value Analysis Presentation
http://slidepdf.com/reader/full/value-analysis-presentation 30/30
THANK YOU