Value Added Statement VAS 2017
23
Value Added 2017 Statement VAS Coffee Highway, Colombia
Transcript of Value Added Statement VAS 2017
Value Added
2017
Statement VAS
Coffee Highway, Colombia

Disclaimer
The main purpose of our Value Added Statement (VAS) is to illustrate the relative importance of our
externalities. Since this assessment reflects the order of magnitude of our added value in monetized
terms, it will help us to increase our corporate and societal value over time. The calculations contained
in this statement do not reflect our past, present or future income nor are they part of our financial
reporting.
Our VAS results should be considered as indicative, as they are calculated through a customized model
based on a set of assumptions. Current approaches could be refined further as new studies become
available. In the coming years, results from former VAS assessments could be re-expressed according
to further methodological refinements.
Although we strive to provide accurate and timely information in this statement, there can be no
guarantee that it represents an exact description of reality. Thus, no actions should be taken based on
the information disclosed in this report without previous appropriate technical advice and a
comprehensive analysis of the specific situation.
For more information, please contact:
Sustainability Investor Relations
Diana Carrero Manuela Ramírez

Value Added Statement 3
Contents
Introduction 1 4
Page
52 Our VAS
7Externalities3
4 8Value Added Statement 2017
5 9
6
Results 2017
10Applications
Appendix 2: Updates of our VAS 20178 20
Argos Panama
7 14Appendix 1: Assumptions and details on indicators

Value Added Statement4
Introduction
In 2016 Argos became one of the industry and
regional pioneers in quantifying and valuing in
monetary terms the main economic, social and
environmental externalities derived from our
operations*. The result of this initiative is our
Value Added Statement (VAS), which provides a
comprehensive overview of how we retain, add
or reduce value for society as a whole.
Externalities are impacts that the company
generates towards third parties and which
represents for them costs and benefits that
are not being reflected in our financial
statements. Hence, our VAS allows us to
know the balance between our positive and
negative impacts and, as a result, a
magnitude of the intangible value that we
create for society. In addition, our VAS can
provide us with the necessary information to
increase this value, while aiming to:
Figure 1: VAS objectives
Make better
informed and more
responsible
business decisions
Enable more
accurate risk
management
Promote accountability
within and outside our
sector
In 2017, we achieved significant progress on each objective, through the development and
exploration of specific applications (see page 10).
2017 brought up significant challenges that
required the redefinition of our strategy to
ensure the sustainability of our company over
time. Our VAS not only allowed us to identify the
main impacts derived from this transformation,
but also reassured our commitment with the
superior purpose we have as a company: to
build dreams that foster development and
change lives. As a result, in 2017 the net value
that we created for society was 804.3 million
dollars, 4.73 times the benefit we retained
during the same period.
Results 2017
* Visit our VAS Report 2015-2016 at: http://reporteintegrado.argos.co/pdf/vas.pdf
Argos Center for Innovation, Colombia

Value Added Statement 5
Our VAS
Our VAS is designed to calculate the net value
we create for society during a given fiscal
year. Its results are expressed in monetary
terms and portrayed as a financial bridge
chart (see figure 2), which begins with the
benefit we retain in the form of earnings. This
amount can be tracked in our annual financial
statements (see Appendix 1).
Each subsequent bar shows the societal value
we created through our economic, social and
environmental externalities. The positive or
negative result of each bar depends on the
nature of each impact (see box 1).
The final bar represents the net value added
to society, that is, the societal value we
created after accounting for all externalities.
Additionally, we calculate the proportion
between our retained earnings and the net
value to society, in order to obtain a clear
vision of the relationship between the
generation of corporate and social value.
Currently, our VAS comprises eleven valued
externalities, which derive from our operations
and cover all our regional divisions (Colombia,
United States, Caribbean and Central
America) and business lines (cement,
concrete and aggregates). As new possibilities
arise to quantify and monetize our impacts,
we will explore the feasibility of expanding our
reach to a broader range of externalities and
to the other segments of our value chain.
Box 1: example of an externality
An externality is an impact generated
during the execution of our business
activities, which may generate costs or
benefits to third parties and that we do not
assume as a company, i.e., they are not
accounted in our financial statements.
For example: the effects that our
extraction activities have on biodiversity
can generate costs to society in terms of
fewer or reduced ecosystem services.
However, these negative impacts can be
mitigated by rehabilitation or
compensation projects undertaken by us.
Therefore, the monetary value of this
externality results from the balance
between the use and rehabilitation of our
intervened areas, as well as the effective
compensation actions we take on.
Retained
benefitExternalities
Net value to
society
Figure 2: basic bridge chart

Value Added Statement6
Reviewing scope and
methodology:
The technical teams involved in
the methodology review the scope
of the model
Analyzing and
communicating results:
We report the results,
communicate to our
stakeholders and explore
future applications
> >
Figure 3: Main stages of the Argos VAS update
Our VAS was based on KPMG’s True Value
methodology for 2015 and 2016. We built a
model with the input of all technical areas of
the company, which participated during the
scope definition, data collection and analysis of
results.
The procedure for developing the subsequent
versions of our VAS is explained in Figure 3.
First, we refine our current monetization
approaches as new theoretical developments
become available (see box 2). Therefore, in
2017 we reviewed and updated the
assumptions and multipliers of our VAS.
This exercise will be carried out annually, so
the model always counts on references
aligned with globally implemented impact
valuation methodologies, which guarantees
the reliability of our results, as well as their
correct interpretation and transparent
communication (see Appendix 2).
After disclosing our results, we develop
specific applications oriented to fulfilling our
VAS’ three main objectives. This is possible
due to the contribution of multidisciplinary
teams and stakeholders interested in
initiatives that maximize societal value (see
page 10).
Updating the model:
We update the model with the
most recent data and multipliers
Box 2: how do we monetize our externalities?
In order to quantify and monetize each externality, we require two basic components:
Input data, which are captured when performing our business activities (e.g.: emitted
tons) and are directly related to the externality.
Multipliers, which can be mainly found on the literature and transform the input data
into monetary values.
However, each externality is monetized differently and requires specific assumptions and
valuation approaches in order to adapt these values to the required time and locations. All
calculations are gathered in a model that aggregates the monetized externalities. Appendix
1 explains in detail the assumptions, the methodology and the sources used for each case.
METHODOLOGY

Value Added Statement 7
Externalities
Climate change impact through
Greenhouse gas emissions
(Scope 1 and 2)
Air pollution impacts
associated with Argos’
emissions of NOx, SOx and
Particulate Matter
Impacts on water scarcity
caused by our water
consumption
Impacts on biodiversity via
extraction operations and
facilities as well as offsets and
rehabilitation programs
Environmental externalities
Impacts of replacing raw
materials and fuels with
alternative ones, which results
in avoided CO2 emissions
Impacts on workers and
communities associated with
occupational incidents (injuries
& fatalities) and illnesses
Impacts deriving from the
additional salary earned by
more skilled employees that
return to the job market after
leaving Argos
Impacts of projects on housing,
community and educational
infrastructure,
scholarships and others
Social externalities
Impacts in the economy
deriving from the remuneration
of our employees
Impacts in the economy
related to interest and dividend
payments to financial
institutions and investors
Impacts in the economy
associated with tax payments
done to the governments of
the countries in which we
operate
Economic externalities
The following are the externalities that we valued in 2017:
Salaries and benefits Interests and dividends Taxes
Talent development Community investment Health and safety
Greenhouse Gas (GHG)
emissions
Air emissions Water consumption
Biodiversity Alternative materials and
fuels
Value Added Statement
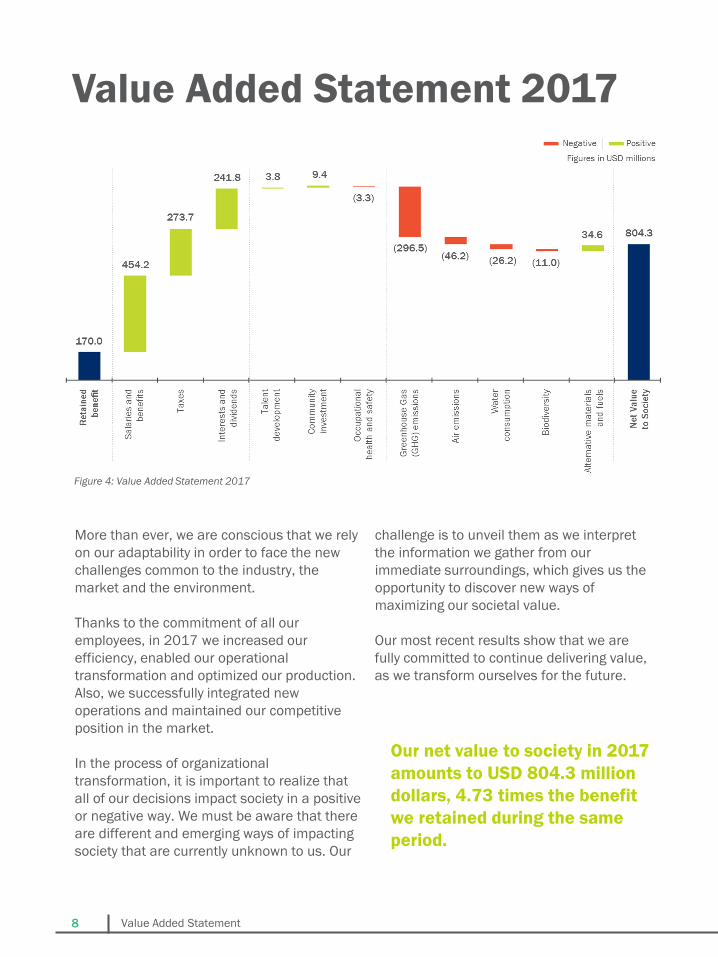
More than ever, we are conscious that we rely
on our adaptability in order to face the new
challenges common to the industry, the
market and the environment.
Thanks to the commitment of all our
employees, in 2017 we increased our
efficiency, enabled our operational
transformation and optimized our production.
Also, we successfully integrated new
operations and maintained our competitive
position in the market.
In the process of organizational
transformation, it is important to realize that
all of our decisions impact society in a positive
or negative way. We must be aware that there
are different and emerging ways of impacting
society that are currently unknown to us. Our
challenge is to unveil them as we interpret
the information we gather from our
immediate surroundings, which gives us the
opportunity to discover new ways of
maximizing our societal value.
Our most recent results show that we are
fully committed to continue delivering value,
as we transform ourselves for the future.
8
Our net value to society in 2017
amounts to USD 804.3 million
dollars, 4.73 times the benefit
we retained during the same
period.
Figure 4: Value Added Statement 2017
Value Added Statement 2017

Value Added Statement
Results 2017
The net costs to society associated with our
environmental externalities amounted to
345.4 million dollars. Greenhouse Gas (GHG)
emissions are the most significant externality
in this dimension, which currently account for
78% of the total costs to society derived from
our environmental impacts. However, during
2017, the use of alternative materials and
fuels allowed us to avoid 11.7% of the societal
costs derived from our GHG emissions.
The main challenge in 2017 in terms of
reducing our negative externalities was
implementing our guidelines and practices in
our recently acquired operations. We are
committed to continue enforcing our
Environmental Strategy, which includes
climate change, emissions, water and
biodiversity, circular economy and
sustainable construction as fundamental
pillars.
The net social benefits derived from our
economic externalities amounted to 969.8
million dollars, 47% of which come from
the effects in local economies generated
by our salaries and benefits. The effects of
our economic externalities increased by
5.4% compared to 2016.
The main challenge in 2017 in this
dimension was creating social value given
the reorganization of our business
activities and our increasing operational
efficiency, in line with our BEST initiative
(Building Efficiency and Sustainability for
Tomorrow). We continued complying with
the payments to our interest groups in a
timely manner, contributing in this way to
greater dynamism in local economies.
Thus, in the future, our ability to generate
positive economic externalities will be
determined by our increasing
competitiveness and our capability to
endure over time.
9
The net benefit associated with our social
externalities was 9.8 million dollars, mainly
as a result of community investments. In
2017, the returns on these investments
accounted for 71% of the total benefits
derived from our social externalities.
The results in 2017 show greater
opportunities to create value through the
strengthening of our human and social
capital, and to continue preserving the life
and integrity of the people through our I
Promise management system.
Environmental externalities
Social externalitiesEconomic externalities

Value Added Statement10
Applications
Our first strategic objective as a company is to create sustainable value. Our VAS serves as a
tool to assess our progress in the achievement of such purpose. At a more detailed level, with
our VAS, we aim to:
Develop a robust metric for measuring progress on value creation
Integrate sustainability criteria into investment appraisal processes
Understand correlations between externalities and risks, both
strategic and emerging
Identify and compare risk scenarios
3
Continuously inform our stakeholders about our performance in
a transparent manner
Improve our reporting methods and capabilities
1
We conducted the first assessment to analyze financial vs.
environmental cost for potential investments in machinery and
equipment.
We mapped potential risks of internalization of negative
externalities associated with the strategic risks of the company.
We developed new methods for quantifying risks, based on our
impact valuation approaches (see case study).
We disclosed the methodology and results of our VAS for external,
internal and specialized audiences.
2
Make better informed and more responsible business decisions
Applications
Progress
2017
Enable more accurate risk management
Applications
Progress
2017
Promote accountability within and outside our sector
Applications
Progress
2017

Value Added Statement 11
RISK MANAGEMENT
Internalization is the process through which a
company may eventually assume all or part of
its externalities. In particular, the costs to
society derived from our negative externalities
may be internalized through regulations,
natural hazards, changing market dynamics or
stakeholder actions. A lack of awareness of
such internalization possibilities could increase
our exposure to the risks we face as a company
and affect our financial results as a
consequence.
Currently there are limited and case-specific
approaches to quantify the potential drivers
of internalization and the way they affect
business performance. To this date our VAS
has allowed us to make progress in this field,
through the following steps:
Develop quantification methodologies, in order to estimate the impact of internalization
on the company's financial performance
Analyze and communicate results for decision-making
1
2
3
Find common variables of our externalities and our strategic risks and assess the
feasibility of quantification
For the first step, we designed and explored the
feasibility of quantifying certain scenarios. For
example, when facing potential opposition from
stakeholders to keep operating or developing
projects (Strategic Risk 8 - R8), the societal
costs derived from our negative externalities
towards the community might be assumed by
the company in the future through
compensations, taxes, or losses of business
opportunities.
As a result of step 1, we obtained scenarios
that are feasible to be assessed in the short
and medium terms (see figure 5), based on
which we will develop case studies in order to
quantify our risks in a more accurate way (see
box 3).
R12R8
R5
R7
R1
R2
R9 R11
Figure 5: Feasibility of quantification of Strategic Risks (R)
and externalities.
The aforementioned risks are: R1: Loss of market participation and
fall in production/prices in key regions; R2: Delays in closing
competitiveness gaps in costs and expenses in key markets; R5:
Limited access to capital or necessary opportunities for achieving
growth plans; R7: Regulatory changes or political instability that
inhibit cost-efficient, profitable and sustainable operations; R8:
Objections from stakeholders to keep operating or developing
projects; R9: Improper actions associated to fraud, corruption,
money laundering and financing terrorism; R11: Lack of talent for
critical levels and positions, with suitable skills and know-how in
order to execute the strategy and expansion plan.
Short term
Medium term

Value Added Statement12
Box 3: Quantifying our exposure to water-related risks
Water stress is the degree to which the availability of water in a certain territory meets its
demand. Therefore, an increased water demand by different local stakeholders could
derive in negative consequences for our company due to the internalization of the
externality we cause.
Although our VAS currently quantifies and monetizes the costs generated to society derived
from the water we consume, we want to forecast not only the potential future increases in
societal costs, but also the effects of a probable internalization, that is, the magnitude of
the impact on our financial results in the future.
Internalization could be determined by the potential increase in water stress in the areas
which we operate. Water stress is influenced by factors such as demographic growth and
hence an higher demand from different parties for this limited resource. Consequently,
costs to society derived from our consumption in areas of higher water stress could be
internalized through market dynamics (e.g., via prices) and be reflected in our operational
costs. This would represent a materialization of our Strategic Risk 12, which refers to the
occurrence of natural events that could affect the continuity of our key operations.
To estimate our degree of risk exposure, we designed a model that estimates the financial
effects of internalization in the long term (2030), based on:
Our water consumption projections, determined by our Environmental Strategy goals,
Forecasts of water stress in the areas in which we operate,
A demand factor by local inhabitants on water
In 2018, we will run the model for operations located in areas with higher water stress,
which allows us to estimate the relative importance of complying with the goals
established by our Environmental Strategy regarding water consumption, plus the extent to
which our consumption levels can have an impact on the financial results of our company.
Quarry, Dominican Republic

Value Added Statement 13
Since our first impact valuation exercises for
2015 and 2016, we have designed and carried
out a communication strategy in order to
explain the methodology and results of our VAS
to different stakeholders through numerous
platforms. With this, we positioned our VAS as a
transparency mechanism to show the
magnitude of our impacts and the
advancements regarding our applications.
Among others, we disclosed our VAS through
case studies in the Natural and Social Capital
Protocols*.
To date, quantifying and monetizing
externalities does not result from a worldwide
accepted and standardized methodology. For
more than two decades, several organizations
have developed conceptual frameworks that
have awakened the interest of several global
sustainability initiatives, such as the World
Business Council for Sustainable
Development (WBCSD) and the Dow Jones
Sustainability Index (DJSI) (see figure 6)**.
We follow the emerging guidelines in these
initiatives regarding impact valuation, and
contribute to the discussion and definition of
methodological approaches in joint platforms
such as the Impact Valuation Roundtable
(IVR). This allows us to continuously explore
possible improvements of current approaches
and replicability of previously applied
methods in different regions and industries.
Figure 6: Impact evaluation over time. Based on the analysis of KPMG 2016
*: Visit our case studies at the Social Capital Protocol http://social-capital.org/case-studies/understanding-societal-value-creation-
through-cementos-argos-value-added-statement-vas and the Natural Capital Protocol http://www.wbcsd.org/Clusters/Natural-
Capital-and-Ecosystems/Business-Examples/Argos-Assessment-enhances-decision-making-risk-management-and-transparency
**: Figure 6 shows examples of organizations and companies that have publicly disclosed their valuation results. The acronyms
include: ESIA (Environmental Social Impact Assessment); FMO (Netherlands Development Finance Company) NS (Dutch Railways);
TCO (Total cost of ownership); TNC (The Nature Conservancy); DJSI (Dow Jones Sustainability Index); WBCSD (World Business Council
for Sustainable Development); P&L (Profit & Loss); FES (Financial, Environmental and Social).
TRANSPARENCY AND ADVOCACY

14
Appendix 1Assumptions and details on indicators
Pervious concrete

Value Added Statement 15
We calculate the retained benefit by subtracting income tax, as well as the interest and
dividends paid by the company, from ebitda. This information is available in our Financial
Statements found in our 2017 Integrated Report1.
EBITDA: USD 501.331.520
Income tax: USD 72.168.131
Finance cost: USD 150.533.993
Dividends: USD 108.604.351
.
Supplier spend
For 2017 we monetize the economic effects derived from payments to our suppliers. However,
we exclude this item from our VAS report in order to guarantee consistency in the scope, since
we value other externalities only for our operations.
Salaries and benefits, taxes, interests and dividends
We define our economic externalities as the effects on the dynamisation of local economies
derived by stakeholder payments. We made these disbursements during the year to employees,
governments, investors and financial institutions2.
We calculate the value we create using an indirect effect multiplier, which we define as the rise
in demand and consumption in a local economy by an increased liquidity in the economy. This
effect consists of:
GVA (Gross Value Added): percentage of initial expenses injected into different sectors of the
economy through increased consumption and spending by interest groups. GVAs are taken
from the OECD’s input-output tables3.
Backward linkages: multiplier effects created by triggering supply and demand among
interdependent sectors in the economy. A proxy for backward linkages are the inverse
Leontief functions, derived from the OECD’s input-output tables.
Due to limited data availability, we use the same GVA and backward linkage multipliers for
Colombia, Caribbean and Central America.
Initially, we monetize our economic externalities assuming fully efficient local economies
regarding resource distribution and economic impact. Subsequently, we correct for economic
inefficiencies in order to take into account external corruption-related activities in the countries
where we operate and in which we do not participate. We calculate this correction using
Transparency International Corruption Perception Indexes for each country4, which reflect the
way in which external conditions may affect our company's societal value creation.
1) Visit our Integrated Report 2017 at: https://www.argos.co/en/Sustainability/Materiality-Analysis-and-Integrated-Reporting. Figures from our
financial statements are reported in COP and were converted using average rates for the accounts of the Comprehensive Income: 2.950,94.
2) For more information about taxes paid, visit https://www.argos.co/en/Sustainability/Materiality-Analysis-and-Integrated-Reporting
3) Input-output tables are available at: http://stats.oecd.org/Index.aspx?DataSetCode=IOTS
4) Our VAS 2017 took Corruption Perception Indexes of 2016, available at:
https://www.transparency.org/news/feature/corruption_perceptions_index_2016
Economic externalities
Retained benefit

Value Added Statement16
.
Occupational Health and Safety
We monetize the externalities taking into account the work-related incidents (serious or
moderate severity, and fatalities) of employees and contractors, plus occupational diseases of
employees and third-party fatalities (e.g. road incidents).
We multiply the incidents by the social costs of the injuries or fatalities according to Safe Work
Australia (2015)5, which estimates the average costs for the employee and the community in
rehabilitation and healthcare expenses, administrative fees and loss of current and future
income. We do not take into account costs for the employer, since we assume that they are
already reflected in our financial results. Given that monetization factors are expressed in
Australian dollars (AUD) for 2013, we adjusted the currency and GDP, so they reflect the total
costs for each regional division.
Talent development
We assume that employee training translates into greater productivity and efficiency for the
company, which are already internalized in our financial results.
Effects derived by talent development become an externality once employees leave Argos and
earn a higher income in the labor market from higher qualifications. We designed an approach
that allows us to monetize such externalized effects as the impact on the local economy of the
additional salary that the employee receives when getting a new job. We monetize by
multiplying the social return rates of education for a given level of training (Montenegro and
Patrinos, 2014)6 times the average training hours of our employees per year and the annual
turnover rate.
Community investment
We monetize the impacts of the following investment lines: low-income housing, community
infrastructure, educational infrastructure and scholarships. We adopt the Social Return on
Investment (SROI) methodology, which consists of calculating the benefits for the community
derived from a specific project in a given locality, for each monetary unit invested in the project.
SROI multipliers are location or country-specific. When no local multipliers are available, we
select the closest methodological reference and perform approximations to local conditions.
The following are the studies from which we extracted the SROI multipliers:
Low-income housing: For Colombia, Caribbean and Central America, we selected the average
multipliers from four different studies7; while for the United States we use calculations by
Mitchell and McKenzie (2009)8.
5) Safe Work Australia, The Cost Of Work-Related Injury And Illness For Australian Employers, Workers And The Community: 2012-2013, 2015
https://www.safeworkaustralia.gov.au/system/files/documents/1702/cost-of-work-related-injury-and-disease-2012-
13.docx.pdf?_sm_au_=iMVZ1fTLNLrQ8LS8
6) Claudio E. Montenegro and Harry Anthony Patrinos. Comparable Estimates Of Returns To Schooling Around The World, 2014, World Bank Policy
Research Working Paper #7020 http://documents.worldbank.org/curated/en/830831468147839247/pdf/WPS7020.pdf
Social externalities
Value Added Statement 17
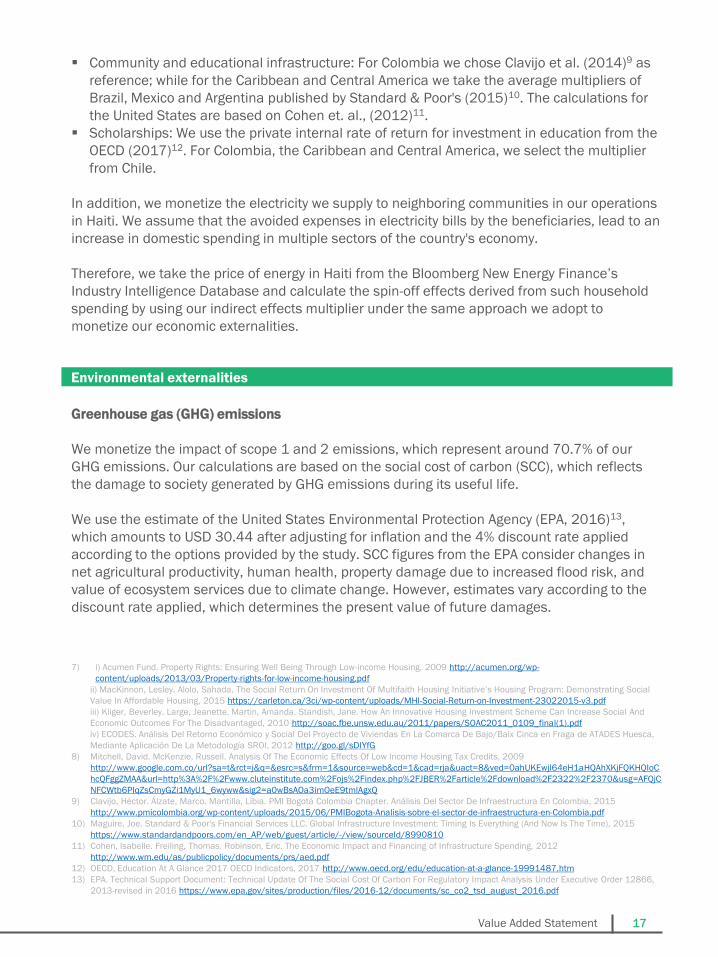
Community and educational infrastructure: For Colombia we chose Clavijo et al. (2014)9 as
reference; while for the Caribbean and Central America we take the average multipliers of
Brazil, Mexico and Argentina published by Standard & Poor's (2015)10. The calculations for
the United States are based on Cohen et. al., (2012)11.
Scholarships: We use the private internal rate of return for investment in education from the
OECD (2017)12. For Colombia, the Caribbean and Central America, we select the multiplier
from Chile.
In addition, we monetize the electricity we supply to neighboring communities in our operations
in Haiti. We assume that the avoided expenses in electricity bills by the beneficiaries, lead to an
increase in domestic spending in multiple sectors of the country's economy.
Therefore, we take the price of energy in Haiti from the Bloomberg New Energy Finance’s
Industry Intelligence Database and calculate the spin-off effects derived from such household
spending by using our indirect effects multiplier under the same approach we adopt to
monetize our economic externalities.
.
Greenhouse gas (GHG) emissions
We monetize the impact of scope 1 and 2 emissions, which represent around 70.7% of our
GHG emissions. Our calculations are based on the social cost of carbon (SCC), which reflects
the damage to society generated by GHG emissions during its useful life.
We use the estimate of the United States Environmental Protection Agency (EPA, 2016)13,
which amounts to USD 30.44 after adjusting for inflation and the 4% discount rate applied
according to the options provided by the study. SCC figures from the EPA consider changes in
net agricultural productivity, human health, property damage due to increased flood risk, and
value of ecosystem services due to climate change. However, estimates vary according to the
discount rate applied, which determines the present value of future damages.
7) i) Acumen Fund. Property Rights: Ensuring Well Being Through Low-income Housing, 2009 http://acumen.org/wp-
content/uploads/2013/03/Property-rights-for-low-income-housing.pdf
ii) MacKinnon, Lesley. Alolo, Sahada. The Social Return On Investment Of Multifaith Housing Initiative’s Housing Program: Demonstrating Social
Value In Affordable Housing, 2015 https://carleton.ca/3ci/wp-content/uploads/MHI-Social-Return-on-Investment-23022015-v3.pdf
iii) Kliger, Beverley. Large, Jeanette. Martin, Amanda. Standish, Jane. How An Innovative Housing Investment Scheme Can Increase Social And
Economic Outcomes For The Disadvantaged, 2010 http://soac.fbe.unsw.edu.au/2011/papers/SOAC2011_0109_final(1).pdf
iv) ECODES. Análisis Del Retorno Económico y Social Del Proyecto de Viviendas En La Comarca De Bajo/Baix Cinca en Fraga de ATADES Huesca,
Mediante Aplicación De La Metodología SROI, 2012 http://goo.gl/sDIYfG
8) Mitchell, David. McKenzie, Russell. Analysis Of The Economic Effects Of Low Income Housing Tax Credits, 2009
http://www.google.com.co/url?sa=t&rct=j&q=&esrc=s&frm=1&source=web&cd=1&cad=rja&uact=8&ved=0ahUKEwjl64eH1aHQAhXKjFQKHQIoC
hcQFggZMAA&url=http%3A%2F%2Fwww.cluteinstitute.com%2Fojs%2Findex.php%2FJBER%2Farticle%2Fdownload%2F2322%2F2370&usg=AFQjC
NFCWtb6PIqZsCmyGZi1MyU1_6wyww&sig2=a0wBsAOa3imOeE9tmlAgxQ
9) Clavijo, Héctor. Álzate, Marco. Mantilla, Libia. PMI Bogotá Colombia Chapter. Análisis Del Sector De Infraestructura En Colombia, 2015
http://www.pmicolombia.org/wp-content/uploads/2015/06/PMIBogota-Analisis-sobre-el-sector-de-infraestructura-en-Colombia.pdf
10) Maguire, Joe. Standard & Poor's Financial Services LLC. Global Infrastructure Investment: Timing Is Everything (And Now Is The Time), 2015
https://www.standardandpoors.com/en_AP/web/guest/article/-/view/sourceId/8990810
11) Cohen, Isabelle. Freiling, Thomas. Robinson, Eric. The Economic Impact and Financing of Infrastructure Spending, 2012
http://www.wm.edu/as/publicpolicy/documents/prs/aed.pdf
12) OECD, Education At A Glance 2017 OECD Indicators, 2017 http://www.oecd.org/edu/education-at-a-glance-19991487.htm
13) EPA. Technical Support Document: Technical Update Of The Social Cost Of Carbon For Regulatory Impact Analysis Under Executive Order 12866,
2013-revised in 2016 https://www.epa.gov/sites/production/files/2016-12/documents/sc_co2_tsd_august_2016.pdf
Environmental externalities

Value Added Statement18
Air emissions
Global multipliers from TruCost (2013)14 are used to monetize air emissions in order to reflect
their corresponding social cost in the three regions where we operate. Due to data availability,
we calculate the negative impact of particulate matter (PM) emissions based on the cost of
PM10 (relative to particle size), while the impact of sulfur oxide emissions SOx is based on SO2.
The scope also includes nitrogen oxide (NOx) emissions. The impact derived from air emissions
depends on the population density of the areas where we operate. As a conservative approach,
we use the average cost of atmospheric pollutants.
Selected multipliers include impacts on human health, forest and crop yields, corrosion of
materials and water acidification. However, health impacts (monetized according to the value of
a statistical life) account form approximately 90% of the total cost.
Water consumption
We monetize the externality associated with water consumption by multiplying the amount of
water consumed times the cost it generates to society, based on a study conducted by TruCost
(2013)15. This approach assumes that the societal cost derived from water use varies
depending on the level of water scarcity in a given territory. Calculations include water
consumption across all operations, taking into account direct non-consumptive use and indirect
use (e.g., value for recreation, biodiversity, groundwater recharge, waste assimilation).
Biodiversity
We calculate the impact on biodiversity using the estimated annual benefits of restoration
projects in different ecosystems around the world (TEEB, 2009)16 due to the limited availability
of local assessments. We apply this multiplier to the liberated areas, plus the current active
operations, less the areas we rehabilitate.
We excluded the areas of concrete plants, since they were established on built areas, and
therefore we assumed that there was no additional impact on biodiversity.
Alternative materials and fuels
We estimate the relative impact of the use of alternative fuels and materials taking into
account:
Landfill emissions avoided by the use of alternative materials or fuels (if the alternative
material or fuel had not been used by another company).
The emissions that were avoided by not extracting, producing or consuming natural
resources (in the case of fuels).
14) TruCost PLC Natural Capital at Risk: The Top 100 Externalities Of Business, 2013 https://www.scribd.com/document/282468297/Natural-
Capital-at-Risk-The-Top-100-Externalities-of-Business-TEEB-2015-pdf
15) Idem.
16) TEEB (2009) TEEB Climate Issues Update. September 2009 http://www.teebweb.org/wp-
content/uploads/Study%20and%20Reports/Additional%20Reports/TEEB%20climate%20Issues%20update/TEEB%20Climate%20Issues%20Upd
ate.pdf

Value Added Statement 19
Since the materials and alternative fuels used are waste or by-products, we do not include the
negative impact of manufacturing them. We monetize avoided emissions based on the social
cost of carbon that we choose in the externality generated by our GHG emissions.
.
Geographic scope
Our Value Added Statement (VAS) covers our three business lines (Cement, Concrete and
Aggregates) in our three regional divisions: Colombia, the United States and Caribbean and
Central America. The latter comprises the following countries: Haiti, the Dominican Republic,
Honduras, Panama, Suriname, Dominica, Antigua, Puerto Rico, Saint Marteen, the Virgin
Islands, the British Virgin Islands and French Guiana.
Inputs from Argos White and Argos Aggregates were added to the Colombia regional division
under geographical criteria and given that the company has financial control over these two
companies.
Adjustments for inflation
When necessary, we brought to present values the monetary figures of 2017 using the
variations of the Consumer Price Indexes from the International Monetary Fund World
Economic Outlook (WEO) databases.
External assurance
Indicators for building our VAS were verified by Deloitte as part of their Independent Review of
our 2017 Integrated Report. The corresponding assurance statement is available on pages 116
to 120 of such report17.
General remarks
17) https://www.argos.co/en/Sustainability/Materiality-Analysis-and-Integrated-Reporting

20
Appendix 2Updates of our VAS 2017
Colored concrete

Value Added Statement 21
We constantly update and refine our model, so we always count on the most recent approaches
and studies for our impact valuation calculations. We can make the following changes with
respect to previous years:
Changes in data collection mechanisms
Changes in monetization approaches
Update of multipliers with new external references
The following table shows the updates and changes for each externality in 2017:
Table A2.1. VAS updates and changes in 2017
Occupational Health and Safety
The costs to society derived from incidents and fatalities were updated with a new version of
the study The Cost Of Work-Related Injury And Illness For Australian Employers, Workers And
The Community. This version updates the 2008-2009 estimated costs, which were selected as
reference for our VAS 2015 and 2016. The update consists of an alignment with the most
recent version of the Work-related Injuries Survey (WRIS, by its acronym in English) by the
Australian Bureau of Statistics (ABS).
Externality
Changes in data
collection
mechanisms
Changes in
monetization
approaches
Updates in
multiplier
Salaries and benefits
Taxes
Interests and dividends
Talent development
Health and Safety X
CI* – infrastructure
CI – housing
CI – education
CI – scholarships X
CI – electricity
GHG emissions** X
Air emissions
Water consumption X
Biodiversity
Alternative materials and
fuels
*CI: Community investment.
**: Although an updated version of the EPA study was published, the value of the multipliers did not change.

Value Added Statement22
Community investment: scholarships
The private internal rate of return for investment in education by the OECD was updated to
2017 values found in the most recent version of Education At A Glance. For this version, the
counterfactual of the educational levels also comprises middle education. For 2016 values,
post-secondary non-tertiary education was also taken into account. Additionally, for calculating
foregone earnings in the 2017 version, the income of non-students replaces the minimum
wage used in the previous version.
GHG Emissions
We recalculated the baseline (2006) and the series of direct emissions from cement operations
in 2014, 2015, and 2016, in compliance with the Energy and CO2 Protocol (WBCSD - CSI,
2011), in its chapter on baselines, acquisitions and divestments.
Water consumption
In 2017, for the definition of facilities located in areas with some degree of water stress, we
used the Aqueduct tool of the World Resources Institute (WRI), which measures the relationship
between the total water intake and the total supply available per year. This tool replaces the
Global Water Tool, used for calculating estimates in our VAS 2015 and 2016.

23