Value-added models of teacher and school effectiveness in ... Oloff... · Value-added models of...
32
This article was downloaded by: [National Science Foundation], [Finbarr Sloane] On: 21 March 2013, At: 05:49 Publisher: Routledge Informa Ltd Registered in England and Wales Registered Number: 1072954 Registered office: Mortimer House, 37-41 Mortimer Street, London W1T 3JH, UK Irish Educational Studies Publication details, including instructions for authors and subscription information: http://www.tandfonline.com/loi/ries20 Value-added models of teacher and school effectiveness in Ireland: wise or otherwise? Finbarr C. Sloane a , Jennifer Oloff-Lewis b & Seong Hee Kim c a National Science Foundation, Arlington, VA, USA b Department of Education, California State University, Chico, CA, USA c Mary Lou Fulton Teachers College, Arizona State University, Tempe, AZ, USA To cite this article: Finbarr C. Sloane , Jennifer Oloff-Lewis & Seong Hee Kim (2013): Value-added models of teacher and school effectiveness in Ireland: wise or otherwise?, Irish Educational Studies, 32:1, 37-67 To link to this article: http://dx.doi.org/10.1080/03323315.2013.773233 PLEASE SCROLL DOWN FOR ARTICLE Full terms and conditions of use: http://www.tandfonline.com/page/terms-and- conditions This article may be used for research, teaching, and private study purposes. Any substantial or systematic reproduction, redistribution, reselling, loan, sub-licensing, systematic supply, or distribution in any form to anyone is expressly forbidden. The publisher does not give any warranty express or implied or make any representation that the contents will be complete or accurate or up to date. The accuracy of any instructions, formulae, and drug doses should be independently verified with primary sources. The publisher shall not be liable for any loss, actions, claims, proceedings, demand, or costs or damages whatsoever or howsoever caused arising directly or indirectly in connection with or arising out of the use of this material.
Transcript of Value-added models of teacher and school effectiveness in ... Oloff... · Value-added models of...

This article was downloaded by: [National Science Foundation], [Finbarr Sloane]On: 21 March 2013, At: 05:49Publisher: RoutledgeInforma Ltd Registered in England and Wales Registered Number: 1072954 Registeredoffice: Mortimer House, 37-41 Mortimer Street, London W1T 3JH, UK
Irish Educational StudiesPublication details, including instructions for authors andsubscription information:http://www.tandfonline.com/loi/ries20
Value-added models of teacher andschool effectiveness in Ireland: wise orotherwise?Finbarr C. Sloane a , Jennifer Oloff-Lewis b & Seong Hee Kim ca National Science Foundation, Arlington, VA, USAb Department of Education, California State University, Chico, CA,USAc Mary Lou Fulton Teachers College, Arizona State University,Tempe, AZ, USA
To cite this article: Finbarr C. Sloane , Jennifer Oloff-Lewis & Seong Hee Kim (2013): Value-addedmodels of teacher and school effectiveness in Ireland: wise or otherwise?, Irish Educational Studies,32:1, 37-67
To link to this article: http://dx.doi.org/10.1080/03323315.2013.773233
PLEASE SCROLL DOWN FOR ARTICLE
Full terms and conditions of use: http://www.tandfonline.com/page/terms-and-conditions
This article may be used for research, teaching, and private study purposes. Anysubstantial or systematic reproduction, redistribution, reselling, loan, sub-licensing,systematic supply, or distribution in any form to anyone is expressly forbidden.
The publisher does not give any warranty express or implied or make any representationthat the contents will be complete or accurate or up to date. The accuracy of anyinstructions, formulae, and drug doses should be independently verified with primarysources. The publisher shall not be liable for any loss, actions, claims, proceedings,demand, or costs or damages whatsoever or howsoever caused arising directly orindirectly in connection with or arising out of the use of this material.

Value-added models of teacher and school effectiveness in Ireland:wise or otherwise?
Finbarr C. Sloanea*, Jennifer Oloff-Lewisb, and Seong Hee Kimc
aNational Science Foundation, Arlington, VA, USA; bDepartment of Education, California StateUniversity, Chico, CA, USA; cMary Lou Fulton Teachers College, Arizona State University,Tempe, AZ, USA
The government of Ireland, like many European countries, is currently undersevere pressure from external forces to grow the economy. One possible way tomaintain and grow its economy is through the production of a highly educatedand globally competitive workforce. In an effort to develop such a workforce, thegovernment, through the Department of Education, is considering ways toincrease accountability in its schools. This paper examines value-added account-ability systems used in the USA and raises critical questions about their perceivedvalue for Irish schools.
Keywords: accountability; educational policy; growth models; value-addedmodels; teacher effectiveness
Introduction
The Organization for Economic Cooperation and Development (OECD) argues
cogently in its Economic Survey of Ireland (2011) for linkages between quality
education and Ireland’s potential for economic recovery and growth. They note that
concerns have arisen about Ireland’s capacity to sustain high-quality education.
They point to sizable declines in Ireland’s PISA 2009 performance in reading,
and mathematics (OECD 2010). Ireland’s scores now stand at the OECD average for
reading and are below average for mathematics. The negative change in performance
between the 2000 and 2009 PISA tests in reading was the largest such change.
The negative change in mathematics performance was the second largest of the
28 participating countries. Further, the report notes that Ireland has limited
accountability systems in place. Drawing on data from the 2009 TALIS report, a
survey studying lower secondary education of 23 participating countries, OECD notes
‘that Ireland had the 4th highest percentage of teachers not having received any
appraisal or feedback in their schools (26%), and the highest share of teachers working
in schools where no evaluation had been conducted over the past 5 years (39%).
Inspection of the work of individual teachers falls almost exclusively on primary
teachers on probation, and limited data on comparative school performance is made
public’ (OECD 2011, 29).
Further, the OECD exhorts the Irish government to move forward with
accountability efforts, noting that Irish ‘authorities should setup mechanisms to
*Corresponding author. Email: [email protected]
Irish Educational Studies, 2013
Vol. 32, No. 1, 37�67, http://dx.doi.org/10.1080/03323315.2013.773233
# 2013 Educational Studies Association of Ireland
Dow
nloa
ded
by [
Nat
iona
l Sci
ence
Fou
ndat
ion]
, [Fi
nbar
r Sl
oane
] at
05:
49 2
1 M
arch
201
3

systematically evaluate teachers’ and schools’ performance, and make the latter
public once adjusted for socioeconomic background. Evaluation results should have
implications for career progression, and inform any needed corrective action in
relevant areas. These include teacher training, where shortcomings have been
detected at primary and secondary levels, especially in mathematics’ (OECD
2011, 29). Responses to this concern have been voiced by many, including those of
the President of the ASTI, Mr Broderick in the electronic outlet of the Irish Times
(Broderick 2011) quoted in full here to present a contrasting view and set the stage
for this paper. ‘I wish to point out that since 2008 two new forms of inspection have
been introduced in second-level schools:
� Whole school inspection � management, leadership and learning (WSE-MLL);
� Most recently, incidental or unannounced inspections.
These two new forms of inspection are in addition to whole school inspection and
subject inspection which have been in use for a number of years. What this means is
that all second-level schools are subject to rigorous and thorough inspections
which normally involve a team of inspectors attending for a number of days during
which they
� inspect teachers in the classroom,� evaluate school planning,
� examine teachers’ teaching and learning plans,
� conduct interviews with teachers.
In the case of WSE-MLL, parents and students are surveyed as part of school
inspections.
The resulting inspection reports are published on the Internet and are available to
any member of the public. Since 2006, nearly 5000 primary and second-level school
inspection reports have been published on the Department of Education and Skills
website. [With regard] to information on schools’ ‘‘performance’’, the ASTI is in no
doubt that were students’ Leaving Cert results to be made public, they would be used
by newspapers to construct league tables of so-called ‘‘top performing schools’’.The ASTI believes that such ‘‘performance’’ tables provide an incomplete picture
of schools, are socially divisive, distort the work of schools, and exacerbate social
inequalities. The UK league tables, which were a product of the ‘‘Thatcherite’’ raw
market philosophy, are recognized as having damaged the education system there
and have not led to improved educational outcomes. Irish second-level schools aim
to deliver a holistic education service which caters for all young people, regardless of
ability, needs, socioeconomic status (SES), or family background. Previous OECD
reports have remarked on the success of the Irish second-level education system in
negating social inequalities amongst students by offering a quality and consistent
standard of education across all types of schools. This is one of the reasons why
Ireland has one of the highest school completion rates in the world’. Mr Broderick’s
concerns, and the concerns of the teachers he represents are quite real, the league
tables he refers to have not proven to positively impact the quality of teaching in
England’s schools. However, the concerns of the OECD are also appropriate. Can
Ireland’s economy recover without investment and improvements in education?
38 F.C. Sloane et al.
Dow
nloa
ded
by [
Nat
iona
l Sci
ence
Fou
ndat
ion]
, [Fi
nbar
r Sl
oane
] at
05:
49 2
1 M
arch
201
3

We will not argue the pros and cons of such an investment here. Rather, we
evaluate a set of tools currently being by used by US school districts to support a
system of teacher (and school accountability) that we believe may not be particularly
useful to the Irish government, or Irish teachers, as the government continues toaddress the perceived need at home and abroad for increased accountability in its
schools. Further, we urge that the government exercise due caution in building a
system of accountability based solely on measures of student performance. It is with
this contextual backdrop that we now explore the problems and possibilities for the
use of Value-Added Modeling (VAM) of educational effects in Ireland as they are
currently practiced in the USA. Consequently, the presentation focuses on how these
tools are used but does not address recent developments in these tools presented in
the methodological literature (see references section).
The US context
In the USA, the elementary and secondary education act (ESEA) has had several
tangible effects on education and the monitoring of education. There have been
both intended and unintended consequences. ESEA’s newer generation of federal
programs, such as Race to the Top, and the recent ESEA flexibility guidelines, have
continued to push development of methods to accurately and fairly monitor school(and more recently teacher) performance. One result of the 2001 reauthorization of
ESEA, titled No Child Left Behind (NCLB 2002), is that there is considerable
agreement that monitoring schools based on unconditional mean school perfor-
mance or the percentage of students proficient does not hold schools accountable for
processes for which they ought to be held accountable and tends to place diverse
schools at a disadvantage. Static average student performance measures are poor
indicators of school performance and tend to reflect input characteristics (i.e., stu-
dent enrollment characteristics) of schools as much as they do actual school quality(Goldschmidt et al. 2005; Goldstein and Spiegelhalter 1996) and capture factors
outside of school control more than actual processes facilitated by schools
(Raymond and Hanushek 2003). This insight has prompted some statisticians to
incorporate growth models into accountability systems. There may be some debate
as to what constitutes the optimal psychometric characteristics for assessments to
be used in systems desiring to use growth models (Briggs and Weeks 2009;
Goldschmidt, Choi, and Beaudoin 2012), but states are unlikely to step outside of
their assessment development cycle for the sole purpose of basing accountability onstudent growth.
The search for ‘accurate, verifiable information’ about the effectiveness of
teachers and schools has long frustrated educational researchers and practitioners.
However, many now believe that VAM hold the long-awaited solution to this
problem (Sanders 2005). The objective of VAM is straightforward: to attribute
changes in student achievement to sources responsible for those changes, most
commonly teachers and schools. The output of VAM is an estimated teacher
(or school) ‘effect’, a numerical measure of the effectiveness of a particular teacher orschool. In its most basic form, VAM is based simply on the calculation of year-to-
year changes in students’ test scores; more complicated forms of VAM incorporate
statistical techniques to account for such factors as differences in student
characteristics and persisting effects of previous teachers and schools.
Irish Educational Studies 39
Dow
nloa
ded
by [
Nat
iona
l Sci
ence
Fou
ndat
ion]
, [Fi
nbar
r Sl
oane
] at
05:
49 2
1 M
arch
201
3
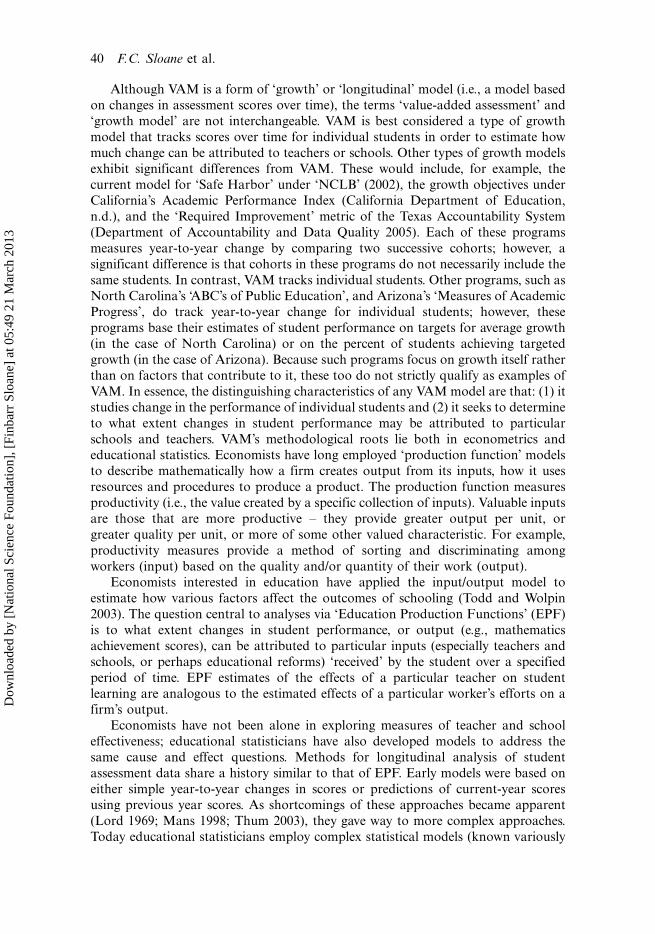
Although VAM is a form of ‘growth’ or ‘longitudinal’ model (i.e., a model based
on changes in assessment scores over time), the terms ‘value-added assessment’ and
‘growth model’ are not interchangeable. VAM is best considered a type of growth
model that tracks scores over time for individual students in order to estimate how
much change can be attributed to teachers or schools. Other types of growth models
exhibit significant differences from VAM. These would include, for example, the
current model for ‘Safe Harbor’ under ‘NCLB’ (2002), the growth objectives underCalifornia’s Academic Performance Index (California Department of Education,
n.d.), and the ‘Required Improvement’ metric of the Texas Accountability System
(Department of Accountability and Data Quality 2005). Each of these programs
measures year-to-year change by comparing two successive cohorts; however, a
significant difference is that cohorts in these programs do not necessarily include the
same students. In contrast, VAM tracks individual students. Other programs, such as
North Carolina’s ‘ABC’s of Public Education’, and Arizona’s ‘Measures of Academic
Progress’, do track year-to-year change for individual students; however, these
programs base their estimates of student performance on targets for average growth
(in the case of North Carolina) or on the percent of students achieving targeted
growth (in the case of Arizona). Because such programs focus on growth itself rather
than on factors that contribute to it, these too do not strictly qualify as examples of
VAM. In essence, the distinguishing characteristics of any VAM model are that: (1) it
studies change in the performance of individual students and (2) it seeks to determine
to what extent changes in student performance may be attributed to particular
schools and teachers. VAM’s methodological roots lie both in econometrics andeducational statistics. Economists have long employed ‘production function’ models
to describe mathematically how a firm creates output from its inputs, how it uses
resources and procedures to produce a product. The production function measures
productivity (i.e., the value created by a specific collection of inputs). Valuable inputs
are those that are more productive � they provide greater output per unit, or
greater quality per unit, or more of some other valued characteristic. For example,
productivity measures provide a method of sorting and discriminating among
workers (input) based on the quality and/or quantity of their work (output).
Economists interested in education have applied the input/output model to
estimate how various factors affect the outcomes of schooling (Todd and Wolpin
2003). The question central to analyses via ‘Education Production Functions’ (EPF)
is to what extent changes in student performance, or output (e.g., mathematics
achievement scores), can be attributed to particular inputs (especially teachers and
schools, or perhaps educational reforms) ‘received’ by the student over a specified
period of time. EPF estimates of the effects of a particular teacher on student
learning are analogous to the estimated effects of a particular worker’s efforts on afirm’s output.
Economists have not been alone in exploring measures of teacher and school
effectiveness; educational statisticians have also developed models to address the
same cause and effect questions. Methods for longitudinal analysis of student
assessment data share a history similar to that of EPF. Early models were based on
either simple year-to-year changes in scores or predictions of current-year scores
using previous year scores. As shortcomings of these approaches became apparent
(Lord 1969; Mans 1998; Thum 2003), they gave way to more complex approaches.
Today educational statisticians employ complex statistical models (known variously
40 F.C. Sloane et al.
Dow
nloa
ded
by [
Nat
iona
l Sci
ence
Fou
ndat
ion]
, [Fi
nbar
r Sl
oane
] at
05:
49 2
1 M
arch
201
3

as ‘hierarchical linear models’, ‘multilevel models’, or ‘random effects models’), to
account for the ‘nested’ structure of educational settings � groups of students belong
to a particular teacher, groups of teachers teach in a particular school, and groups of
schools make up a particular district (see Bryk and Raudenbush 1992; Burstein 1980;Laird and Ware 1982, respectively).
VAM’s methodological predecessors may not have emerged as prominent policy
tools had it not been for the rise of standards-based accountability. The reauthoriza-
tion of the ESEA, NCLB (2002) gave a push to an assessment-based accountability
movement that had already gained momentum in many states. VAM’s benefits appear
perfectly matched to the requirements of such accountability systems. In the past
years, the VAM movement has picked up even greater momentum, as states have
requested increased flexibility to allow adequate yearly progress (AYP) plans basedon growth models. Former US Secretary of Education Margaret Spellings has
responded to the increasing enthusiasm for growth models by announcing support
for 10 statewide pilot programs that incorporate growth models into AYP (Olsen and
Hoff 2005). If shown to provide valid inferences, AYP programs based on growth
models (and possibly VAM) will likely see even more widespread adoption in
the coming years.
VAM is increasingly a darling of US policy-makers and is gaining support among
some scholars. Accountability advocates attracted to its promises of facilitatingapples-to-apples comparisons of the effectiveness of specific schools or teachers �free of context effects that have traditionally made such comparisons problematic �continue to push for its adoption at district and state levels. VAM appears to be here
to stay � at least for the foreseeable future.
General issues in the basic approaches to value-added assessment
The term ‘value-added assessment’ actually encompasses several different statistical
models. Varying substantially in complexity and underlying assumptions, these
approaches all satisfy the same necessary condition: they link changes in individual
student achievement to particular teachers or schools. Much recent research has
focused on methodological and other substantive issues surrounding VAM as anaccountability tool. The most comprehensive discussion of such research to date is
provided by McCaffrey et al. (2003); also, a nontechnical review of this discussion was
written by Braun (2005). The next section draws from each of these works to provide a
brief overview of issues concerning the validity of VAM-based accountability models.
Attribution of teacher effects
Braun (2005, 9) describes what he terms the ‘fundamental concern’ about VAM:
whether VAM systems can in fact reliably estimate the effect of a particular teacher
or group of teachers (or school/s) on student learning: ‘. . . the reader [of typical VAM
studies] is invited to treat [teacher effect estimates] as if, in fact, they unambiguously
capture the relative contributions of different teachers to student learning’. A majorissue here is that cause and effect research generally requires that subjects (students)
be randomly placed into treatment groups (classrooms). However, randomly
grouping students into classes and randomly assigning teachers to those classes
are unlikely in school systems; teachers are often assigned classes based on seniority,
Irish Educational Studies 41
Dow
nloa
ded
by [
Nat
iona
l Sci
ence
Fou
ndat
ion]
, [Fi
nbar
r Sl
oane
] at
05:
49 2
1 M
arch
201
3

and various forms of ability grouping and streaming/tracking are common. More-
over, schools within a given district, and districts within a given state, enroll students
varying greatly in prior achievement, skills, and knowledge. In the absence of being
able to randomly group students into classes, researchers typically make statistical
adjustments for identifiable and quantifiable ‘irregular’ circumstances (such as an
imbalance in student ability across different classes) that would cause teacher
effect estimates to be inaccurate. However, even when statistical adjustment is made,it is unlikely to make enough difference to support cause/effect claims about
teacher performance. As Braun (2005, 8) notes: ‘It is impossible . . . to document and
model all such irregular circumstances; yet they may well influence, directly or
indirectly, the answers we seek nearly as much as what the teacher actually does in the
classroom’.
The heart of this problem is that the inability to randomly group students and
teachers can result in factors other than teacher effectiveness influencing VAM
estimates. Because students are not randomly assigned to teachers, and teachers are
not randomly assigned to classes, students assigned to one teacher may differ
significantly in capability and family context from those assigned to another teacher.
Class characteristics may differ as well; for example, as Todd and Wolpin (2003, F3)
point out, ‘if a popular teacher has higher enrollments and class-size is omitted from
the specification, then the estimated teacher effect will include the impact of class size
on performance’. Or, as Braun (2005, 9) notes, the ‘implicit assumption that [teachers
being compared] all have been assigned similar academic goals for their classesand have equivalent resources . . . flies in the face of the reality that tracking
(i.e., streaming) is endemic in schools, particularly in middle schools and above.
Students in different classes may be exposed to different material and assigned
different end-of-year targets. These differences will influence the estimates of teacher
effects’. Similarly, schools may differ in policies, resources, and contexts. Parents, too,
may influence student performance by promoting different activities (such as more
reading at home or after-school tutoring).
Even if the ideal situation � randomly grouping teachers and students � were
possible, the small number of students a teacher works with each year can influence
the teacher’s estimated effects. Annual changes in class composition can produce
year-to-year volatility that makes the estimated teacher effect in any given year
atypical (see McCaffrey et al. 2003). Again, an example provided by Braun
(2005, 10), ‘with a relatively small number of students contributing to the estimated
effect for a particular teacher, the averaging power of randomization can’t work for all
teachers in a given year. Suppose, for example, that there are a small number of truly
disruptive students in a cohort. While all teachers may have an equal chance offinding one (or more) of those students in their class each year, only a few actually will
� with potentially deleterious impact on the academic growth of the class in that year.
The bottom line is that even if teachers and students come together in more or less
random ways, estimated teacher effects can be quite variable from year to year’.
As this section demonstrates, many factors other than teacher performance may
be reflected in estimates of teacher effectiveness; these factors are difficult to
disentangle from true differences across teachers. Striving to make estimates more
reliable, researchers have devised various statistical methods to accommodate other
factors; differences in these accommodations are one of the main ways various
VAM approaches differ from each other.
42 F.C. Sloane et al.
Dow
nloa
ded
by [
Nat
iona
l Sci
ence
Fou
ndat
ion]
, [Fi
nbar
r Sl
oane
] at
05:
49 2
1 M
arch
201
3

Persistence of teacher effects
VAM approaches differ in the assumptions they make regarding the persistence of
teacher effects in the years after students have moved to other classes. Some models
assume that a teacher’s effect extends undiminished into the future. Other models
make no such assumption; rather, the persistence of teacher effects (be it constant,
growing, or diminishing over time) is estimated through the data. This assumption
affects the degree to which changes in student scores are attributable alternatively to
current and previous teachers; therefore, it is likely to have significant ramifications
on teacher effect estimates. For example, if prior teachers continue to be credited for
a student’s current performance, the effect estimated for a current teacher whose
students previously had teachers with large positive effects will tend to be artificially
lowered.
For example, let us say that teacher effects truly do diminish over time, at a rate of
20% of the initial effect per year. Consider a class of students that started with a
second-class average score of 100, then had a third-class teacher with an effect of five
points, followed by a fourth-class teacher who had an effect of three points. That
class would, on average, score 107 on the fourth-class test:
100 (Average at end of second class)
� 4 (Contribution of the third-class teacher to the fourth-class test; the
original effect of 5 has diminished by 20% over the single year since
having that teacher)
�3 (Contribution of fourth-class teacher)
�107 (Average score on fourth-class test)
In this case, if teacher effects are assumed (erroneously) to persist undiminished,
the effect for the fourth-class teacher would be underestimated:
107 (Average score on fourth-class test)
�100 (Average at end of second class)
�005 Estimated effect of third-class teacher to fourth-class test; original effect
of 5 is assumed to have persist undiminished over the single year since
having that teacher)
�2 (Estimated effect of fourth-class teacher; actual effect is �3)
In this example, the fourth-class teacher’s effect was artificially lower than it should
have been, because the third-class teacher’s positive effect was assumed to persist
undiminished. In this case, because of the assumption that teacher effects persist
undiminished, a previous teacher with a positive effect was given credit for
achievement effects that should have been attributed to a future teacher.
Nature of growth in student achievement
Another way in which VAM approaches differ is in their assumptions about growth
in student achievement. Given only ‘average’ teachers over a period of years, should
we expect student achievement to grow at a constant (linear) annual rate? Or should
we expect growth to vary among individual students and over different years?
Different assumptions about student growth lead to different VAM models, which in
turn are likely to yield significantly different estimates of teacher effectiveness
(see Corcoran, Jennings, and Beveridge 2011; Papay 2011).
Irish Educational Studies 43
Dow
nloa
ded
by [
Nat
iona
l Sci
ence
Fou
ndat
ion]
, [Fi
nbar
r Sl
oane
] at
05:
49 2
1 M
arch
201
3
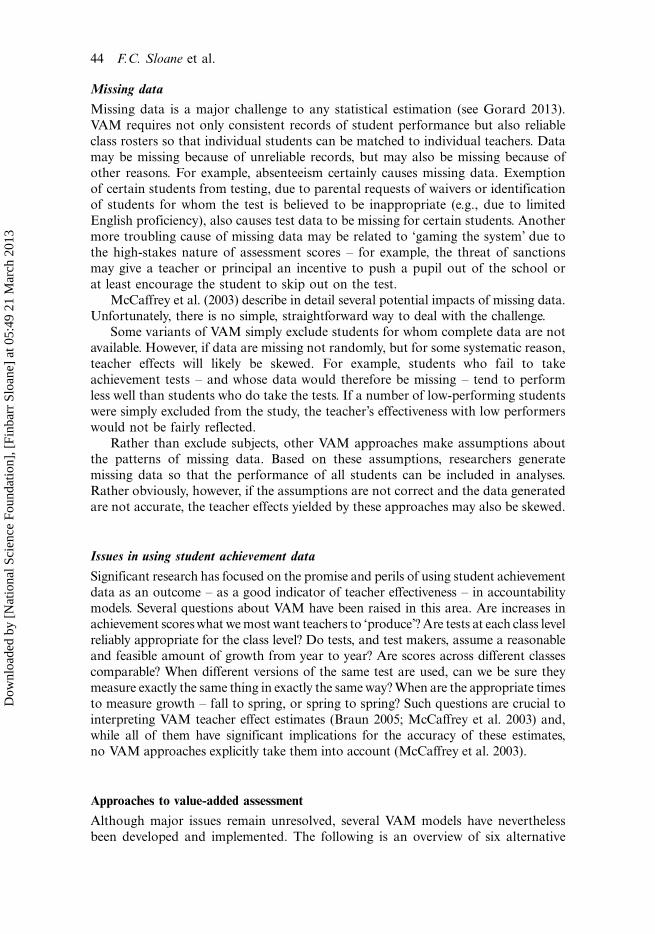
Missing data
Missing data is a major challenge to any statistical estimation (see Gorard 2013).
VAM requires not only consistent records of student performance but also reliable
class rosters so that individual students can be matched to individual teachers. Data
may be missing because of unreliable records, but may also be missing because of
other reasons. For example, absenteeism certainly causes missing data. Exemption
of certain students from testing, due to parental requests of waivers or identificationof students for whom the test is believed to be inappropriate (e.g., due to limited
English proficiency), also causes test data to be missing for certain students. Another
more troubling cause of missing data may be related to ‘gaming the system’ due to
the high-stakes nature of assessment scores � for example, the threat of sanctions
may give a teacher or principal an incentive to push a pupil out of the school or
at least encourage the student to skip out on the test.
McCaffrey et al. (2003) describe in detail several potential impacts of missing data.
Unfortunately, there is no simple, straightforward way to deal with the challenge.Some variants of VAM simply exclude students for whom complete data are not
available. However, if data are missing not randomly, but for some systematic reason,
teacher effects will likely be skewed. For example, students who fail to take
achievement tests � and whose data would therefore be missing � tend to perform
less well than students who do take the tests. If a number of low-performing students
were simply excluded from the study, the teacher’s effectiveness with low performers
would not be fairly reflected.
Rather than exclude subjects, other VAM approaches make assumptions aboutthe patterns of missing data. Based on these assumptions, researchers generate
missing data so that the performance of all students can be included in analyses.
Rather obviously, however, if the assumptions are not correct and the data generated
are not accurate, the teacher effects yielded by these approaches may also be skewed.
Issues in using student achievement data
Significant research has focused on the promise and perils of using student achievement
data as an outcome � as a good indicator of teacher effectiveness � in accountability
models. Several questions about VAM have been raised in this area. Are increases inachievement scores what we most want teachers to ‘produce’? Are tests at each class level
reliably appropriate for the class level? Do tests, and test makers, assume a reasonable
and feasible amount of growth from year to year? Are scores across different classes
comparable? When different versions of the same test are used, can we be sure they
measure exactly the same thing in exactly the same way? When are the appropriate times
to measure growth � fall to spring, or spring to spring? Such questions are crucial to
interpreting VAM teacher effect estimates (Braun 2005; McCaffrey et al. 2003) and,
while all of them have significant implications for the accuracy of these estimates,no VAM approaches explicitly take them into account (McCaffrey et al. 2003).
Approaches to value-added assessment
Although major issues remain unresolved, several VAM models have nevertheless
been developed and implemented. The following is an overview of six alternative
44 F.C. Sloane et al.
Dow
nloa
ded
by [
Nat
iona
l Sci
ence
Fou
ndat
ion]
, [Fi
nbar
r Sl
oane
] at
05:
49 2
1 M
arch
201
3

models, including each model’s unique characteristics (McCaffrey et al. 2003) as well
as its strengths and weaknesses. Specific examples of models already in use are also
discussed. In total, this overview provides policy-makers a guide to the current status
of VAMs as a tool for accountability systems. Although models are described as theyapply to assessing the effects of teachers, they could just as easily be used to estimate
the effects of schools or other units of analysis.
To ensure that this guide is accessible to a broad audience, technical exposition
has been kept to a minimum. Therefore, the complex statistical underpinnings of
each model do not appear here; readers interested in such detail are directed to
McCaffrey et al. (2003) and Todd and Wolpin (2003). The six VAM formulations
presented in the next section, and the primary dimensions on which they differ, are
summarized in Table 1. As the table indicates, a primary characteristic of all modelsis whether they are ‘single wave’, based on only two measurements (perhaps a
student’s fall and spring reading achievement scores), or ‘multiple wave’, based on
more than two measurements (perhaps a student’s reading achievement scores for
classes 2, 4, and 6). All models are based on the central idea that vertically equated
tests exist � something quite problematic in an Irish context as few such tests exist.
The simple ‘gain score model’
A student’s year-to-year change in achievement scores provides the basis for VAM in
its most simple form. The ‘gain score model’ links the 1-year gain in a student’s score
to that student’s teacher. For each student, last year’s score is subtracted from this
year’s score to measure the student’s change in achievement while in a particular
teacher’s classroom. Gains for all of one teacher’s students are averaged, and the
average is then compared to that of other teachers’ students. For example, one
teacher’s average gain score might be compared to the average gain score of all
other teachers in the same building, or in the same district, or area of a large city.The ‘teacher effect’ is the difference between an individual teacher’s gain score and
that of the comparison group. This model can include statistical adjustments for
student characteristics; however, the basic idea � that the best teachers are those
whose students show the biggest year-to-year gains in achievement tests � remains
the same.
The following simple example describes how the gain score model works; in most
practical cases, the statistical mechanics are more complex (and comparisons are
made at the district rather than school level), but the general idea is consistent.Consider a (very small) school with three fourth-class teachers, each of whom has
only three students. Scores for these students on the state math assessment are
presented in Table 2.
In this example, all three teachers have positive gains; each one’s students have
(on average) gained in math knowledge from the third-class assessment to the fourth-
class assessment. Teacher 1 has the greatest ‘effect’, however, with a classroom gain
more than four points larger than the school average. Even though their students
demonstrated positive gains, teachers 2 and 3 had negative teacher effects; their gainswere about two points below the school average.
A primary strength of the gain score model is that it is intuitively easy to
understand; better teachers are those whose students show greater gains in achieve-
ment scores. Additional advantages to the gain score model are that it requires only
Irish Educational Studies 45
Dow
nloa
ded
by [
Nat
iona
l Sci
ence
Fou
ndat
ion]
, [Fi
nbar
r Sl
oane
] at
05:
49 2
1 M
arch
201
3

Table 1. Types of VAM models.
VAM model
Single-wave models
(two sets of measurements)
Multiple-wave models
(multiple sets of measurements)
Gain score
Covariate
adjustment Layered Cross-classified Persistence
Cumulative
within-child
Issue
Years of data Maximum of 2 Maximum of 2 Multiple Multiple Multiple Multiple
Content areas Maximum of 1 Maximum of 1 Multiple Multiple Multiple Multiple
Student cohorts Maximum of 1 Maximum of 1 Multiple Multiple Multiple Multiple
Persistence of teacher effects
(How does the influence of
previous teachers carry on in
subsequent years?)
Teacher effects
persist
undiminished
Teacher effects
may diminish
over time
Teacher effects
persist
undiminished
Teacher effects
persist
undiminished
Teacher effects
may diminish over
time
Teacher effects
may diminish over
time
Rates of growth in student
achievement
(Given ‘average’ teachers over
a period of years, does student
achievement grow at the same
average rate every year? Or are
rates of achievement growth
unique year to year?)
No assumption
made
No assumption
made
No assumption
made
Annual growth in
student achievement
assumed to be
constant (linear)
No assumption
made
No assumption
made (though
possible)
Treatment of missing data
(Should teacher effects be
adjusted if a student is absent
on exam day?)
Students with
missing data
excluded from
analysis
Students with
missing data
excluded from
analysis
Students with
missing data
included using
projected (imputed)
scores
Students with
missing data
included using
projected
(imputed) scores
Students with
missing data
included using
projected
(imputed) scores
Students with
missing data
included using
projected
(imputed) scores
46
F.C
.S
loa
ne
eta
l.
Dow
nloa
ded
by [
Nat
iona
l Sci
ence
Fou
ndat
ion]
, [Fi
nbar
r Sl
oane
] at
05:
49 2
1 M
arch
201
3

Table 1 (Continued )
VAM model
Single-wave models
(two sets of measurements)
Multiple-wave models
(multiple sets of measurements)
Gain score
Covariate
adjustment Layered Cross-classified Persistence
Cumulative
within-child
Inclusion of student
demographic characteristics
(e.g., ethnicity, poverty, ELL
status)
Possible Possible No Possible Possible Yes
Consideration of student’s
previous educational experiences
(e.g., participation in preschool
programs or reduced class sizes
in primary grades)
Possible Possible No Possible Possible Yes
Consideration of family inputs
(e.g., amount of reading done
with parents at home;
participation in
after-school tutoring programs)
No No No Possible Possible Yes
IrishE
du
catio
na
lS
tud
ies4
7
Dow
nloa
ded
by [
Nat
iona
l Sci
ence
Fou
ndat
ion]
, [Fi
nbar
r Sl
oane
] at
05:
49 2
1 M
arch
201
3

2 years of data in a single subject, and that implementation is straightforward with
commonly available software (such as Microsoft Excel or Statistical package for the
Social Sciences).The gain score model is not without its shortcomings, however. First, it considers
only 2 years of data; therefore, estimating teacher effects over 5 years would require
four separate analyses. Second, it does not consider student achievement in previous
years, which more complex models take into account. In addition, gain score models
assume that the effects of a student’s previous educational experiences (including
previous teachers) persist into the future undiminished. To accept a gain score
estimate of teacher effects as valid, then, means accepting that the effects of a
student’s prior teachers never fade; and that a teacher’s effectiveness is best measuredby the achievement scores of her most recent students.
Another shortcoming is that the gain score model does not consider where
students started. In other words, the gain score model treats gains as similarly
meaningful no matter where they appear on a scale. For example, on a 100-point test,
a student’s gain from a score of 15 to 20 appears the same as a student’s gain from
85 to 90; both students show a gain of 5. These two gains may not be comparable
instructionally or cognitively, but the gain score model treats them as the same.
Finally, the typical gain score model does not use information from students forwhom data are missing. Students without complete information are excluded from
analysis. If the nature of missing data is not random � if, for example, scores are
missing primarily for high-mobility students who tend to have lower achievement
scores � the teacher effects estimate will likely be skewed, as noted earlier.
The gain score model in practice: the Texas growth index
The Texas Growth Index (TGI) provides an estimate of a student’s academic growth
based on scores from the Texas Assessment of Knowledge and Skills (TAKS) in two
consecutive grades. Texas uses the TGI primarily to identify schools eligible for stateperformance awards (the Gold Performance Acknowledgment for Comparable
Improvement in Reading/English Language Arts and Mathematics); TGI also plays
a role in some alternative accountability systems (Department of Accountability and
Data Quality 2005).
Table 2. Example of the gain score model.
Teacher Student
Fourth-grade
math score
Third-grade
math score
Gain, third
to fourth
Average gain,
teacher
School
average gain
Teacher
effect
1 1 35 25 10 8.67 4.44 4.23
2 33 27 6
3 39 29 10
2 4 33 31 2 2.67 4.44 �1.77
5 35 33 2
6 39 35 4
3 7 43 41 2 4.23 �1.77 �2.44
8 47 43 4
9 45 45 0
48 F.C. Sloane et al.
Dow
nloa
ded
by [
Nat
iona
l Sci
ence
Fou
ndat
ion]
, [Fi
nbar
r Sl
oane
] at
05:
49 2
1 M
arch
201
3

For each student with 2 years of TAKS scores, an ‘expected’ current-year score is
calculated by multiplying the previous year’s score by some amount of growth that
the state has established as a target. The expected score is subtracted from the
student’s actual score and adjusted to account for differences across grades. Theresult is a student’s TGI score. If TGI is zero (as would be the case if the expected
grade and the actual grade were the same), the inference is that 1 year’s growth has
occurred. Higher scores indicate more rapid learning. Student TGI scores in reading
and mathematics are averaged for the school.
School TGI scores are ranked relative to average TGIs of a comparison group �created uniquely for each school � of 40 other Texas schools most similar demo-
graphically (based on ethnicity, economic disadvantage, limited English proficiency,
and student mobility). A school’s Comparable Improvement score comes from acomparison of its students’ average growth with the average student growth in
comparison schools. It is measured in quartiles; a ‘quartile 1’ school would rank in
the top 25% of schools in its comparison group. Schools receive separate quartile
rankings for reading and for mathematics.
TGI scores are assumed to reflect school-level contributions to student growth.
These scores should be interpreted with caution, however, as the TGI program
exhibits many of the shortcomings common to gain score models (described above
and listed in Figure 1). Like other VAM-based approaches, TGI relies on studentachievement data, which has been questioned as an appropriate indicator, and it does
not provide for random selection of students. TGI also considers only 2 years of
data, disregarding potentially useful information from previous years. The system
excludes from consideration those students with missing data. Finally, student
growth targets are constant, no matter where students begin on a developmental
scale; the TGI program expects that student growth should be the same whether
a student started out very high or very low.
As Texas state policy-makers appear to realize, these shortcomings createuncertainty that makes TGI scores unsuitable for high-stakes decisions. At this
point, Texas uses TGI scores primarily for recognizing schools for commendable
performance. The percentage of students with TGI scores greater than zero (denoting
positive growth) is also used as one of many indicators in alternative education
accountability systems designed specifically for charter schools and for schools with
nontraditional programs.
The ‘covariate adjustment model’
A second basic type of VAM based on change over a single period is the covariate
adjustment model, which has been most prominent in the literature of educational
economists (Hanushek 1972; Murnane 1975). This model is similar to the gain score
model in linking achievement changes to current teachers only, and in allowing for
adjustments based on student characteristics.
The primary difference between the covariate adjustment model and the gain
score model is in how the two models treat the effects of previous teachers. As notedabove, the gain score model assumes these effects are permanent and unchanging.
In contrast, the covariate adjustment model makes no such assumption. Rather,
persistence of teacher effects is estimated. This allows for effects of previous teachers
to change (generally, to diminish) as time passes.
Irish Educational Studies 49
Dow
nloa
ded
by [
Nat
iona
l Sci
ence
Fou
ndat
ion]
, [Fi
nbar
r Sl
oane
] at
05:
49 2
1 M
arch
201
3

Outside of this difference, the covariate adjustment model shares the strengths
and weaknesses of the gain score model. It is easy to understand and implement,
requiring only 2 years of data in a single subject (a ‘single wave’); it excludes students
with missing data; and it treats gains similarly no matter where they occur along a
developmental scale. Because it is limited to a single wave of two assessment scores,
separate analyses are necessary for multiple cohorts and subjects.
Characteristics of the covariate adjustment model are summarized in Figure 2.
Assessment system (DVAAS)
The Dallas value-added assessment system (DVAAS) has been in place since the
early 1990s, ranking it among the oldest of VAM-based accountability programs
(Webster and Mendro 1997). Its name is similar to the most famous VAM-based
approach � the Tennessee value added assessment system (TVAAS); however, the two
should not be confused. The DVAAS differs significantly from its more famous
counterpart, as will become clear in the later discussion of TVAAS.
The DVAAS model allows for the inclusion of a variety of student- and school-
level factors that affect student performance. The model begins with scores
for student growth from a prior period, and then adjusts them to allow for student
characteristics such as ethnicity, gender, language proficiency, and SES. Scores are
adjusted a second time for school-level factors such as student mobility, crowding,
overall SES, and percentage minority. Teacher and school effects are estimated based
on averages of student scores once all adjustments have been made.
GainScoreModel
Outcomes modeled:• Individual assessment scores across a single period (two score comparison) • Single Subject • Single Cohort
Adjustments: Student and School characteristics
What differentiates it from covariate adjustment models• Assumption that teacher effects persist undiminished
Key Strengths• Simplicity; easy to understand and explain • Straightforward implementation
Key Shortcomings• No consideration of information from previous years • Exclusion of students with missing data (may skew teacher effects) • No consideration of point at which students start along the developmental scale • Assumption of undiminished teacher effects (may not be reliable) • Omission of statistical adjustments for student ability (may skew teacher effects) • No accommodation for problems associated with using student assessment scores
Accountability programs based on the gain score model:Texas Growth Index
Figure 1. Characteristics of the gain score model.
50 F.C. Sloane et al.
Dow
nloa
ded
by [
Nat
iona
l Sci
ence
Fou
ndat
ion]
, [Fi
nbar
r Sl
oane
] at
05:
49 2
1 M
arch
201
3

DVAAS uses different calculations each year, with only two time points included
in each set of calculations. Separate estimates for reading and math are made across
all grades, as well as for writing, science, and social studies in selected grades.
Students missing achievement data are eliminated from some analyses, as are
students with high absenteeism, the apparent assumption being that students’
absences should not be attributed to their teachers.
DVAAS estimates of teacher and school effects should be used with caution for
several reasons. Like other VAM-based approaches, DVAAS is faced with the
challenges of using student achievement data as its outcome measure. Missing data is
also a problem for DVAAS; the exclusion of high-mobility and frequently absent
students could easily skew results, as these students tend to perform less well on
achievement measures than other students.
However, DVAAS does include student- and school-level characteristics, which
may mitigate some of the issues caused by nonrandom grouping of teachers and
students. How well the model actually accommodates significant differences among
students and schools depends on the specific calculations used � although no
statistical representation can perfectly capture teacher and student characteristics
under nonrandom assignment, and so the validity of estimated effects may remain
questionable.
A final weakness of DVAAS is the limited capacity of covariate adjustment
models. Students typically take assessments in several subjects across multiple
years, and information provided by the combination of these many assessments is
potentially useful in estimating teacher and school effects. However, DVAAS must
CovariateAdjustmentModels
Outcomes modeled:• Individual assessment scores across a single period (two score comparison) • Single Subject • Single Cohort
Adjustments: Student and School characteristics
What differentiates it from gain score models• Previous teacher effects modeled by data and allowed to diminish
Key Strengths• Simplicity; easy to understand • Straightforward implementation • Allowance for effects of prior educational experiences, including teachers
Key Shortcomings• No consideration of information from previous years • Exclusion of students with missing data (may skew teacher effects) • No consideration of point at which students start along the developmental scale • Omission of statistical adjustments for student ability (may skew teacher effects) • No accommodation for problems associated with using student assessment scores
Accountability programs based on the covariate adjustment model: Dallas Value Added Assessment System(DVAAS)
Figure 2. Characteristics of the covariate adjustment model.
Irish Educational Studies 51
Dow
nloa
ded
by [
Nat
iona
l Sci
ence
Fou
ndat
ion]
, [Fi
nbar
r Sl
oane
] at
05:
49 2
1 M
arch
201
3

ignore this wealth of information because covariate adjustment models are single-
wave models � limited to only two-student achievement scores.
Such concerns argue for caution in interpreting DVAAS generated estimates of
teacher and school effects, and Dallas wisely does not base high-stakes decisionssolely on these estimates. Instead, they are used primarily to help design teacher and
school improvement plans. Although they may be considered in personnel decisions,
estimates ultimately play only a small part in such decisions.
The ‘layered’ model
The gain score model and covariate adjustment model are similar in that they are
‘single wave’ � that is, they consider changes across a single period characterized byonly two points of measurement (e.g., fall and spring reading scores). All other
models are ‘multiple-wave’ models by design and estimation; that is, they consider
more than two sets of measurements. Also referred to as ‘multivariate’ (McCaffrey
et al. 2004) or ‘cumulative’ models (Todd and Wolpin 2003); such approaches are
more complex in that they use multiple assessments to estimate how multiple
teachers across multiple years affect student achievement. Multiple-wave models can,
for example, provide teacher effects estimates based on both reading and math
assessments for several groups of students over several years.The most well-known multiple-wave model is a ‘layered’ model, the TVAAS.
William Sanders, the father of the TVAAS, has been so prominent a champion of
VAM that many refer to the TVAAS � and even VAM in general � as the ‘Sanders
Model’. Designed specifically to measure educational outcomes in Tennessee, the
layered approach now underlies statistical models used by the many clients of
educational value-added assessment system (EVAMS).
As a multiple-wave model, the layered model uses several years of data to
estimate teacher effects. Like the gain score model, however, it assumes that teachereffects persist undiminished in subsequent years: a particular third-class teacher has
the same impact on a student’s third-class assessment as she does on the student’s
sixth-class assessment. Together, these characteristics mean that a layered model not
only assumes that teacher effects persist undiminished, but that they can be estimated
over multiple years. While these may be problematic assumptions, the layered model
does move beyond the disconnected year-to-year estimates of gain score models. Put
simply, the layered model assesses student growth over a number of school years and
adjusts for the value added of each teacher year to year, while also considering thatsome teacher impacts may last longer than others.
Nothing would prohibit the layered model from including student background
factors � but TVAAS does not include them. In the words of its developers, TVAAS
uses a highly parsimonious model that omits controls for SES, demographic, or other
factors that influence achievement (Ballou, Sanders, and Wright 2004). Student
characteristics are not considered in any way because the model assumes student
scores in prior years adequately reflect student characteristics. According to SAS†
EVAMS† for K-12 (n.d, 2), the ‘reliability of SAS EVASS reporting has beenreviewed and confirmed by prominent experts, including four US Department of
Education peer review committees, the US Government Accountability Office and
RAND Corp’. However, not everyone agrees that this is the best way to deal with the
complexity of educational contexts; the issue of whether statistical adjustments for
52 F.C. Sloane et al.
Dow
nloa
ded
by [
Nat
iona
l Sci
ence
Fou
ndat
ion]
, [Fi
nbar
r Sl
oane
] at
05:
49 2
1 M
arch
201
3

student characteristics need to be included in VAM models is far from being resolved
(Wainer 2004).
The layered model teacher effect is the difference between a specific teacher’s
average gain and the average gain of all district teachers. Because the effect iscalculated as an average across all of a teacher’s students, factors idiosyncratic to any
given student do not enter into the teacher effect. No adjustments are made on the
basis of student characteristics or previous educational experiences (though nothing
prohibits such adjustments), and effects of former teachers persist undiminished over
time. Characteristics of the layered model are summarized in Figure 3.
The layered model in practice: EVAMS
With the adoption of TVAAS, Tennessee became the first state to adopt a statewide
accountability system based on VAM. The TVASS was the first generation of the
now widely available layered model known as the EVAMS.EVAMS estimates teacher effects using student assessment scores across multiple
years and subjects (e.g., Tennessee uses 5 years of assessment data across five different
subjects). To account for the relationships between these multiple assessments, the
Layered Model
Outcomes modeled:• Individual assessment scores across multiple time periods (typically five years of
assessment scores) • Multiple subjects possible • Multiple cohorts possible
Adjustments: None
What differentiates it from other multiple-wave models• Exclusion of adjustments for student or school characteristics • Assumption that teacher effects persist undiminished • No assumption about student achievement growth
Key Strengths• Inclusion of information from previous years • Capability to include students with missing data (though missing scores must be
estimated) • No requirement for information on student or school characteristics • Uses multiple years/subjects rather than student controls
Key Shortcomings• Complexity; difficult to understand and explain • Required specialized (commercial) software • Projected scores for students with missing data (may skew teacher effects) • No consideration of point at which students start along the developmental scale • Assumption of undiminished teacher effects (may not be reliable) • Omission of statistical adjustments for student ability (may skew teacher effects) • No accommodation for problems associated with using student assessment scores
Accountability programs based on the layered model: Educational Value Added Assessment System(EVAMS)
Figure 3. Characteristics of the layered model.
Irish Educational Studies 53
Dow
nloa
ded
by [
Nat
iona
l Sci
ence
Fou
ndat
ion]
, [Fi
nbar
r Sl
oane
] at
05:
49 2
1 M
arch
201
3

EVAMS model uses complex statistical processes which embed two key assumptions.
The first is that a student’s test score reflects the effects of both the current teacher and
all previous teachers; the second is that a student’s test score reflects (or captures, for
purposes of statistical modeling) the student’s personal characteristics. To estimate the
effect of a specific teacher, then, the model makes statistical adjustments to student
scores in order to allow for the effects of previous teachers. (As noted above, no
adjustments are made for student characteristics because proponents believe suchadjustments are unnecessary.) The average of the adjusted student scores is compared
to the district’s average; the difference between the teacher’s average and district’s
average indicates the teacher’s estimated effectiveness. Estimates are typically averaged
over 3 years for each individual teacher.
EVAMS is the most widely used approach to VAM-based accountability. As is
true for other models, however, its results should be used with caution. Several
issues � some common among VAM approaches and some specific to EVAMS � may
undermine the validity of estimated teacher effects. First and most obviously,
EVAMS shares with other VAM-based approaches the multiple issues surrounding
the use of student achievement data as the singular outcome measure. As is also true
for other approaches, EVAMS must deal with the challenge of missing data; however,
the fact that EVAMS uses test scores across multiple years and subjects may mean
that its estimates are less affected by missing data than estimates from models using
fewer measurements. In addition, EVAMS reduces the year-to-year volatility of
single-wave teacher effect estimates by averaging estimates from 3 years to arrive ata single teacher-effect score.
Unique to EVAMS is the exclusion of student and school characteristics, which
may well skew its estimates. EVAMS developers claim that the exclusion of these
characteristics makes little difference (Ballou, Sanders, and Wright 2004), although
they note that differences may be bigger in districts characterized by greater
stratification among teachers and students. This issue is far from being resolved, and
many studies have pointed to the potential impact of omitting important student-
and school-level characteristics (McCaffrey et al. 2004).
Another issue which may affect the validity of EVAMS estimates is the
assumption that previous teachers’ effects persist undiminished throughout a
student’s education. This assumption has been questioned, and empirical analyses
have suggested that teacher effects do actually diminish as a student progresses
through school. If this is indeed the case, contrary to the EVAMS assumption,
teacher effects will be predictably skewed. The estimated effects of teachers whose
students were previously taught by teachers with large positive effects will tend to beartificially lowered (because prior teachers continue to be credited for a student’s
current performance); the estimated effects of teachers whose students were
previously taught by teachers with negative effects will tend to be artificially raised
(because prior teachers continue to be blamed for a student’s current performance).
It is important that any user of EVAMS understands these concerns about the
validity of EVAMS scores. At the very least, due to the uncertainty around these
issues, EVAMS scores should not be used as the sole basis for high-stakes decisions.
For example, the Pennsylvania value-added assessment system (PVAAS) is a case
in point (The Center for Greater Philadelphia, n.d.). The state has taken two
precautions in using effectiveness estimates from the system. First, because questions
remain concerning the validity of VAM estimates, Pennsylvania uses its estimates as
54 F.C. Sloane et al.
Dow
nloa
ded
by [
Nat
iona
l Sci
ence
Fou
ndat
ion]
, [Fi
nbar
r Sl
oane
] at
05:
49 2
1 M
arch
201
3

only one of multiple measures in teacher evaluation. Second, rather than simply
assigning the PVAAS estimate as a teacher’s effectiveness rating, Pennsylvania
instead uses the estimates to categorize a teacher’s performance as ‘highly effective’,
‘effective’, or ‘ineffective’. These two features of PVAAS implementation representreasonable ways of dealing with VAM uncertainties.
The ‘cross-classified model’
The ‘cross-classified model’ is similar to the layered model with a slight modification:
it assumes that student achievement grows at a predictable and even rate over time.
Specifically, it assumes that students would improve at some constant rate even
without the added effects of teachers � so teachers should only be credited after thatconstant growth is taken into consideration. The cross-classified model is unique in
this respect. Other models allow for individual student growth but do not explicitly
model it as constant over time. The cross-classified model could incorporate any
parametric growth model, though linear growth is most often assumed in practice.
Other models typically allow for idiosyncratic growth through residual terms specific
to student year combinations.
The difference between assuming constant growth and not assuming constant
growth is subtle but important. Consider the following example that follows anothernine students in a very small school. These students are in fifth class; their scores on
the mathematics assessment are shown in Table 3.
If student growth was not assumed to be constant year to year (as with all VAM
approaches except the cross-classified model), teacher effects are estimated based on
the average of all student gains. In this case, differences between any particular
student’s gain and the average gain represent the effect that is idiosyncratic to that
student in that year. The calculation of effects of fifth-class teachers would be the
same as noted in the example above.The results are different if constant annual student growth is considered, as is the
case with the cross-classified model. In such cases, gains associated with a particular
teacher are adjusted by student average annual growth before teacher effects are
estimated.
A given effect under this assumption is essentially the average of what is left
over of annual student gains after each student’s gain has been adjusted to take into
account that student’s constant annual growth. The calculations under this
assumption are shown in Table 4. It should be noted that in practice the calculationsare more complex, including statistical adjustments for student and school
characteristics, but the general idea remains consistent with this example.
In this example, teacher effects differ substantially under the two different
assumptions. In fact, the highest-scoring teacher under the assumption of noncon-
stant growth (Teacher 1) is rated most poorly under the assumption of constant
growth. Which one is right? This depends on your beliefs about the true nature of
student growth and the contributions of teachers. As noted earlier, the cross-classified
model assumes that students would improve at some constant rate even without theadded effects of teachers � so teachers should only be credited after that constant
growth is taken into consideration. The other models make no such assumption.
In most other ways, the cross-classified model is similar to the layered model. It
considers data across multiple years, subjects, and cohorts; it assumes teacher effects
Irish Educational Studies 55
Dow
nloa
ded
by [
Nat
iona
l Sci
ence
Fou
ndat
ion]
, [Fi
nbar
r Sl
oane
] at
05:
49 2
1 M
arch
201
3

persist undiminished; and it measures the effects of teachers across different years
simultaneously, rather than piecemeal for each individual year. Unlike the layered
model, the cross-classified model typically takes student and school characteristics
into account. The cross-classified model adjusts scores for (a) the constant growth of
individual students and (b) any student characteristics or previous educational
experiences formally specified as part of the model. Once scores are adjusted, the
difference between a specific teacher’s average gain and the average gain of all
teachers in the sample provides the teacher’s effectiveness estimate. Characteristics of
the cross-classified model are summarized in Figure 4.
The ‘persistence’ model
A team led by RAND statistician Daniel McCaffrey created a multiple-wave model
similar to the layered model but different in one major respect. In this ‘persistence’
Table 3. Example of the cross-classified model.
Fifth-class
teacher Student
Fourth-class
math score
Fifth-class
math score
Gain,
fourth to
fifth
Average gain,
fifth-class
teacher
School
average
gain
Teacher
effect
1 1 39 47 8 8.00 3.33 4.67
2 37 39 2
3 43 57 14
2 4 35 39 4 �0.67 3.33 �4.00
5 37 35 �2
6 39 35 �4
3 7 45 51 6 2.67 3.33 �0.66
8 47 45 �2
9 49 53 4
Table 4. The cross-classified model assuming constant growth
Fifth-
class
teacher Student
Fourth-
class
math
score
Fifth-
class
math
score
Gain,
fourth
to fifth
Student
average
yearly
gain1
Student
adjusted
gain
Teacher
average
adjusted
gain
School
average
adjusted
gain
Teacher
effect
1 1 39 47 8 12 �4 �3.67 �0.22 �3.45
2 37 39 2 7 �5
3 43 57 14 16 �2
2 4 35 39 4 2 2 �0.33 �0.22 �0.11
5 37 35 �2 �1 �1
6 39 35 �4 �2 �2
3 7 45 51 6 1 5 3.33 �0.22 3.56
8 47 45 �2 �4 2
9 49 53 4 1 3
1Average yearly gain is typically estimated using data from several previous years.
56 F.C. Sloane et al.
Dow
nloa
ded
by [
Nat
iona
l Sci
ence
Fou
ndat
ion]
, [Fi
nbar
r Sl
oane
] at
05:
49 2
1 M
arch
201
3

model, teacher effects are not assumed to persist undiminished; rather, the model
allows for the actual rate of persistence to be estimated (McCaffrey et al. 2003).
The persistence model shares several characteristics with the layered model. It can
consider data across multiple years, subjects, and cohorts; it measures the effects of
teachers simultaneously across different years; and it allows for individual student
growth (although, unlike the cross-classified model, it does not model student growth
as constant over time). In the persistence model, student scores are adjusted for (a) the
growth unique to each student each year and (b) any student characteristics or
previous educational experiences formally specified as part of the model. Persistence
of the effects of former teachers is always estimated as part of this model. As such,
when a model is built and estimated, the impact of a student’s prior teachers is already
built in. Consequently, the estimate in a given year for a teacher X is reduced by the
impact of a student’s prior good teachers and increased by the estimate of the same
student’s weaker teachers in prior years. As is true of some other models, the estimate
of teacher effect in the persistence model is the difference between a specific teacher’s
average gain (based on adjusted scores) and the average gain of all teachers in the
sample. Characteristics of the persistence model are summarized in Figure 5.
Cross-classified Model
Outcomes modeled:• Individual assessment scores across amultiple time periods (typically five years of
assessment scores) • Multiple subjects possible • Multiple cohorts possible
Adjustments: Student and schoolcharacteristics
What differentiates it from other multiple-wave models• Assumption that teacher effects persist undiminished • Assumption that model can allow for predictable growth in student achievement
Key Strengths• Inclusion of information from previous years • Capability to include students with missing data (though missing scores must be
estimated) • Accommodation for constant student growth
Key Shortcomings• Complexity; difficult to understand and explain • Required specialized software • Projected scores for students with missing data (may skew teacher effects) • No consideration of point at which students start along the developmental scale • Assumption of undiminished teacher effects (may be unreliable) • Assumption of constant, predictable student growth (may be unreliable) • Omission of statistical adjustments for student ability (may skew teacher effects) • No accommodation for problems associated with using student assessment scores
Accountability programs based on the cross-classified model: VAM models based on the cross-classified model have been proposed, but to date they have been used primarily for research.
Figure 4. Characteristics of the cross-classified model.
Irish Educational Studies 57
Dow
nloa
ded
by [
Nat
iona
l Sci
ence
Fou
ndat
ion]
, [Fi
nbar
r Sl
oane
] at
05:
49 2
1 M
arch
201
3

Todd and Wolpin’s ‘cumulative within-child’ mixed-effects model
A final model comes from the EPF literature. Todd and Wolpin (2003) discuss
several approaches to modeling educational outcomes. Their most general model, of
which all related models are special cases, is the ‘cumulative within-child’ mixed-
effects model. This model is similar to the other multiple-wave models described
above in that it uses multiple sets of data. The key difference between the cumulative
within-child model and other VAM models generally is that the cumulative within-
child model explicitly includes consideration of unobserved characteristics of
children that are permanently related to performance � labeled ‘child endowment’
by Todd and Wolpin (2003) � as well as other historical and contemporary family
and school characteristics. The technical details are beyond the scope of this paper.
Because ‘child endowment’ is measured with error, the cumulative within-child
approach applies an instrumental variables technique (in which lagged values of
student and siblings serve as instruments) to a model that includes within-child fixed
effects to model it. It is worth noting that the cumulative within-child model is
distinguished by its attention to the specific ability of individual children.The model considers child endowment in order to explicitly address a major
shortcoming of other VAM models � the fact that it uses nonexperimental data from
situations in which teachers and students were not randomly grouped. Todd and
PersistenceModel
Outcomes modeled:• Individual assessment scores across amultiple time periods (typically five years of
assessment scores) • Multiple subjects possible • Multiple cohorts possible
Adjustments: Student and schoolcharacteristics
What differentiates it from other multiple-wave models• Estimated persistence of previous teacher effects (no assumption of undiminished
persistence)• No accommodation for student achievement growth
Key Strengths• Inclusion of previous information • Capability to include students with missing data (though missing scores must be
estimated) • Effects of previous teachers estimated, not assumed • Assumption regarding constant student growth is not required
Key Shortcomings• Complexity; difficulty tounderstand and explain • Specialized software required • Projected scores for students with missing data (may skew teacher effects) • No consideration of point at which students start along the developmental scale • Omission of statistical adjustments for student ability (may skew teacher effects) • No accommodation for problems associated with using student assessment scores
Accountability programs based on the persistence model: VAM models based on the persistence model have been proposed, but to date they have been used primarily for research.
Figure 5. Characteristics of the persistence model.
58 F.C. Sloane et al.
Dow
nloa
ded
by [
Nat
iona
l Sci
ence
Fou
ndat
ion]
, [Fi
nbar
r Sl
oane
] at
05:
49 2
1 M
arch
201
3

Wolpin (2003, F28) summarize the potential impact of omitting child endowment
(as most VAM approaches do):
. . . there is an implicit assumption of random assignment with respect to unobservedcharacteristics of children that are permanently related to performance (child endow-ment). If a particular teacher were systematically assigned to children with highendowments, the influence of the teacher on performance would be overstated. Averagingmeasured teacher gains over time, as is the practice in implementing TAAVS, will noteliminate this bias. However, it would seem possible to circumvent this problem byaugmenting the specification to include child-specific fixed effects.
This model does provide the greatest accommodation for differences in child
endowment when estimating teacher effects; however, modeling this construct can be
highly problematic, as it is dependent on the validity of variables used to represent it.
Characteristics of the cumulative within-child model are summarized in Figure 6.
Additional VAM models currently in use
Potential weaknesses of existing VAM models have led to the proposal of several
‘next-generation’ approaches. Although they will not be discussed in detail here, the
interested reader may consult Damian Betebenner’s (2005) work on Markov Chain
Models and Rich Hill et al.’s (2005) work on Value Tables. In this short overview, we
have attended to the basic foundational models. These models have been presented
conceptually as they intellectually undergird all of the newer models. The interested
reader can find the newer work in the following references: Aaronson, Barrow, andSanders (2007), Ballou (2012), Broatch and Lohr (2011)), Corcoran, Jennings, and
Beveridge (2011), Han, Dalal, and McCaffrey (2012), Harris (2011), Jacob, Lefgren,
and Sims (2010), Lockwood and McCaffrey (2009)), Lohr (no date), Mariano,
McCaffrey, and Lockwood (2010), McCaffrey and Hamilton (2007), McCaffrey
et al. (2009), McCaffrey and Lockwood (2011), Papay (2011), and Schochet and
Chiang (2010).
Making decisions regarding VAM-based accountability
This paper has been prepared as a primer for the practitioner or policy-maker needing
to learn more about currently used alternative models for VAM-based accountability.
The detail provided herein should make clear that the issues surrounding VAM-based
programs are many and complex. As presented in Table 5, approaches vary in their
strengths, weaknesses, and suitability for any particular context. However, all VAM
approaches share challenges that threaten the validity of teacher effect estimates they
are designed to generate.
This section provides specific guidance for choosing a VAM-based approach to
become part of an accountability program. The first half of this section covers issues
specific to various VAM approaches to help guide the practitioner in crafting the
optimum VAM-based approach for the targeted accountability program. No matter
which model seems best suited to a particular context; however, general issues
relating to the validity of VAM estimates must also be taken into consideration when
determining how to incorporate VAM into systems of accountability. The second
Irish Educational Studies 59
Dow
nloa
ded
by [
Nat
iona
l Sci
ence
Fou
ndat
ion]
, [Fi
nbar
r Sl
oane
] at
05:
49 2
1 M
arch
201
3

half of this section addresses challenges that threaten the validity of VAM teacher
and school effect estimates regardless of the VAM approach selected (Table 5).
Selecting a VAM approach
Multiple-wave models: The layered model (EVAMS)
As noted above, the most common form of the layered model � EVAMS � is by far
the most popular VAM-based approach with over 300 district and state programs in
practice. Whereas most of the other approaches described above have been developed
by researchers for research purposes, EVAMS is being aggressively marketed by a
for-profit entity (The SAS Corporation) solely for accountability programs. As such,the overwhelming majority of practitioners faced with the prospect of implementing
a VAM-based program as part of an educational accountability system are
considering the EVAMS layered model. However, in recent years, the Betebenner
models have become quite popular.
Cumulative Within-Child Model
Outcomes modeled:• Individual assessment scores across multiple time periods (typically five years of
assessment scores) • Multiple subjects possible • Multiple cohorts possible
Adjustments:• Student and school characteristics • Student past and present experiences • Child-specific ability (modeled through statistical variables)
What differentiates it from other multiple-wave models
• Specific consideration of child’s ability • Flexibility to accommodate specific aspects of other VAM models
Key Strengths• Inclusion of information from previous years • Capability to include students with missing data (though missing scores must be
estimated) • Explicit allowance for non-random grouping of teachers and students through
consideration of child’s ability
Key Shortcomings• Complexity; difficult to understand and explain • Specialized software required • Dependence on validity of variables used to estimate child endowment • Projection of scores for students with missing data (may skew teacher effects) • No consideration of point at which students start along the developmental scale • No accommodation for problems associated with using student assessment scores
Accountability programs based on the cumulative within-student model: VAM models based on the cumulative within-student model have been used primarily for research.
Figure 6. Characteristics of the cumulative within-child model.
60 F.C. Sloane et al.
Dow
nloa
ded
by [
Nat
iona
l Sci
ence
Fou
ndat
ion]
, [Fi
nbar
r Sl
oane
] at
05:
49 2
1 M
arch
201
3

Table 5. VAM approaches: Strengths, shortcomings, and current programs.
VAM model
Single-wave models
(two sets of measurements)
Multiple-wave models
(multiple sets of measurements)
� Gain score Covariate adjustment Layered Cross-classified Persistence Cumulative within-child
Key strengths � Simple; easy
to understand
� Easy to
implement
� Simple; easy to
understand
� Easy to
implement
� Can model
effects of prior
educational
experiences
� Effects of
previous
teachers estimated,
not assumed
� Data across �2
years
� Can estimate
scores for missing
students
� Requires no
school/student
information
� Uses multiple
years/subjects rather
than student
controls
� Data across
�2 years
� Can estimate
scores for
missing students
� Accommodates
linear student growth
� Data across �2 years
� Can estimate scores for
missing students
� Effects of previous
teachers estimated,
not assumed
� Linear student
growth assumption
not required
� Data across
�2 years
� Can estimate
scores for missing
students
� Adjusts for
nonrandom
grouping of teachers
and students
through adjustment
for child’s ability
Key shortcomings � No
consideration
of data from previous
years
� Students with
missing data
excluded
� No
consideration
of point at which
students start along
developmental
scale
� Assumption of
undiminished
teacher
effects
� No statistical
adjustments for
student
ability
� No accommodation
for problems
of using
student
assessment scores
� No
consideration of
information from
previous years
� Students with
missing data
excluded
� No
consideration of
point
at which students
start along
developmental
scale
� No statistical
adjustments for
student ability
� No
accommodation
for problems of
using
student assessment
scores
� Complex; difficult to
understand and
explain
� Specialized
(proprietary)
� software required
� Projected scores for
students with
missing data (may
skew teacher effects)
� No consideration of
point at which
students start along
developmental scale
� Assumption of
undiminished
teacher effects
� No statistical
adjustments for
student ability
� No accommodation
for problems of
using student
assessment scores
� Complex; difficult
to understand
and explain
� Specialized
software
required
� Projected scores for
students with missing
data (may skew teacher
effects)
� No consideration of
point at which students
start along
developmental scale
� Assumption of
undiminished teacher
effects
� Requires assumption of
linear student growth
� No statistical
adjustments for student
ability
� No accommodation for
problems of using
student assessment
scores
� Complex; difficult to
understand and explain
� Specialized software
required
� Projected scores for
students with missing
data (may skew teacher
effects)
� No consideration of
point at which students
start along
developmental scale
� No statistical
adjustments for student
ability
� No accommodation for
problems of using
student assessment
scores
� Complex; difficult to
understand and
explain
� Specialized software
required
� Dependence on
validity of variables
used to estimate
child endowment
� Projection of scores
for students with
missing data (may
skew teacher effects)
� No consideration of
point at which
students start along
developmental scale
� No accommodation
for problems of
using student
assessment scores
Approach in practice Texas Growth Index DVAAS EVAMS
None (used primarily for
research)
None (used primarily for
research)
None (used primarily for
research
IrishE
du
catio
na
lS
tud
ies6
1
Dow
nloa
ded
by [
Nat
iona
l Sci
ence
Fou
ndat
ion]
, [Fi
nbar
r Sl
oane
] at
05:
49 2
1 M
arch
201
3

As detailed above, EVAMS is distinguished primarily by two characteristics � its
reliance on equated (i.e., vertically scaled) assessment scores across multiple years
and multiple subjects rather than covariates for student and school characteristics,
and its assumption that teacher/school effects persist undiminished as time passes.Research has suggested that using as many as 5 years of data across three separate
assessments can render the use of statistical controls for student characteristics
unnecessary (Ballou, Sanders, and Wright 2004). As such, those building an EVAMS
system are strongly advised to incorporate no fewer than 5 years and three subjects
worth of assessment data. In the context of Irish schools, this would imply a program
of annual testing in Mathematics, reading in English, and reading in Irish at the
primary level, or mathematics across each year of secondary school (assuming
a teacher taught at each year: first year through sixth year). Doing so does notguarantee that results will be unbiased in the absence of student statistical controls;
additional studies have suggested that using even the expansive set of data suggested
above fails to fully correct for differences in students not attributable to teachers or
schools (Raudenbush 2004).
A second distinguishing characteristic of EVAMS-based models is their assump-
tion that teacher effects persist undiminished � that is, for example, the effect on a
student’s achievement of having had a particular third-class teacher will continue
undiminished in all subsequent years. This turns out to be a problematic assumption;the most prominent work examining this assumption has suggested that teacher
effects actually do diminish over time (McCaffrey et al. 2003). As a result, a particular
teacher’s VAM-based effect could end up unfairly higher or lower depending on
whether she followed a relatively weaker or stronger teacher, as EVAMS would
incorrectly credit previous teachers with effects that had actually diminished (and were
therefore attributable to the more recent teacher). The only correction for this problem
is to allow for diminishing teacher effects, a characteristic of the persistence model that
has yet to be allowed by EVAMS.In sum, although EVAMS is the most prominent VAM-based approach currently
in use, it is not without its particular issues. One of these � the use of multiple scores
rather than covariates � may be mitigated if a sufficient number of scores for each
individual (such as scores across three subjects and 5 years) are used. The second �assuming undiminished teacher effects � is more pernicious and may result in
unfairly crediting previous teachers for achievement associated with more recent
teachers. This is a problem for which EVAMS currently allows no adjustment; as
such, practitioners are strongly advised to either abandon EVAMS for more flexiblemodels such as the persistence model, or � if this is not possible � to lower the stakes
of EVAMS-based estimates and use them only as suggestive, for example, of where to
target professional development resources (and not as a basis for personnel
decisions).
Multiple-wave models: The cross-classified model
The cross-classified model’s identifying characteristics are three-fold: (1) the assump-tion of constant (linear) annual growth for each student’s achievement, (2) the ability
to use demographic covariates to adjust for student differences not attributable
to teachers, and (3) the assumption that teacher effects persist undiminished.
The assumption of linear achievement growth for each student (rather than unique
62 F.C. Sloane et al.
Dow
nloa
ded
by [
Nat
iona
l Sci
ence
Fou
ndat
ion]
, [Fi
nbar
r Sl
oane
] at
05:
49 2
1 M
arch
201
3

year-to-year growth) may in fact be reasonable if an assessment’s score scale is crafted
to reflect an underlying construct that is truly believed to grow linearly. This is a
decision that must be made in consultation with assessment developers. If it is
warranted, then use of the cross-classified model may be recommended. The cross-classified model can be used with data across multiple years or subjects; it can also
handle statistical adjustments for student differences. If the use of data across multiple
years and subjects is to take the place of student covariates (as is the case
with EVAMS), individual scores across at least 5 years and three subjects are
recommended. Finally, as was the case with the EVAMS above, the assumption of
undiminished teacher effects is problematic and warrants that that assumption be
relaxed in practice or that a different model (revoking that assumption) be used.
Multiple-wave models: The persistence and cumulative within-child models
The persistence model and cumulative within-child models are essentially the same
with one distinction � the modeling of student differences via child inherited attributes,which is possible with the persistence model and compulsory with the cumulative
within-child model. In practice, the unavailability of measures of child inherited
attributes for large-scale accountability programs renders the cumulative within-child
model less applicable for purposes outside of research. In fact, although the persistence
model has yet to be used as part of a formal accountability program, its flexibility
situates it well for that use. It can handle data across multiple years and subjects
(a strength of the EVAMS layered model) as well as covariates to adjust for student
differences; it requires no assumption about persistence of teacher effects, allowingthem to be estimated as part of the model estimation; also, although typically it does
not do so, the persistence model could allow for linear growth (as does the cross-
classified model). In most cases, the persistence model provides for adjustments that
relax assumptions of other models, so it is an ideal alternative among VAM-based
approaches. It still does not overcome many problems of VAM-based approaches in
general, which are discussed in the latter part of this section.
Single-wave models: The gain score and covariate adjustment models
In the infancy of the assessment-based accountability movement, single-wave models
were often the only alternatives available due to the lack of more than 2 years of data.
Today, they are less prominent as many testing programs have been in place longenough to generate several years worth of achievement scores. As such, it is less likely
that a practitioner would be called upon to consider implementation of a single-wave
model. Nevertheless, it is helpful to have guidance on the two primary single-wave
models � the gain score model and the covariate adjustment model � and how these
two models differ.
The primary difference between the gain score model and covariate adjustment
model is the same as that which distinguishes the layered and persistence models � the
assumption regarding persistence of teacher effects. The gain score model is similar tothe layered model in that teacher effects are assumed to persist undiminished; on the
other hand, the covariate adjustment model � like the persistence model � makes no
such assumption. As noted before, recent research has suggested a diminishment of
teacher effects over time, rendering the covariate adjustment model preferable to
Irish Educational Studies 63
Dow
nloa
ded
by [
Nat
iona
l Sci
ence
Fou
ndat
ion]
, [Fi
nbar
r Sl
oane
] at
05:
49 2
1 M
arch
201
3

the gain score model (similar to the persistence model’s preference over the layered
model). If policy-makers must choose between the two, it appears that the covariate
adjustment model is preferable.
Issues common to all VAM approaches
The previous section provided guidance regarding selection among several alter-
native VAM-based approaches. However, no matter which model seems best suited to
a particular context, general issues relating to the validity of VAM estimates must
also be taken into consideration. Implementers are always wise to remember that
because it is generally impossible to randomly group teachers and students, any
VAM estimate of teacher effects will likely be influenced by other factors. While aparticular approach may attempt to deal with a specific issue using statistical
adjustments, no set of adjustments can fully compensate for the lack of randomiza-
tion. Furthermore, important questions remain about whether student achievement
scores are appropriate measures of teacher effects; whether achievement tests are
appropriately designed; whether and how assessment errors may affect estimates; and
when assessments are best administered. Although these are crucial and complex
questions, no VAM approach yet takes them into account.
No VAM approach yet provides perfectly valid estimates of teacher and schoolcontributions to student learning. The tasks to which VAM approaches are applied
simply do not allow for a single correct or perfect way of accomplishing them. Trade-
offs and risky assumptions are required in any case, so any given model is necessarily
going to be imperfect. This should not be taken as criticism toward the developers of
any given approach; rather, it is meant as a criticism of the construct validity of any
approach as applied as a tool of accountability.
Above all, expectations for what any VAM-based tool can reasonably accomplish
should be tempered, and the use of its estimates should be judicious. The weaknessesof VAM detailed in this paper render VAM inadvisable as the cornerstone of a
system of teacher or school accountability. Any teacher or school effect estimated
from VAM models should be taken as only that � an estimate. VAM-based estimates
may help identify teachers who appear to be successful as well as those who appear to
need assistance in improving their practice. However, until more is known about the
accuracy of and tradeoffs between VAM approaches, VAM-based estimates should
never serve as a single indicator of teacher effectiveness, and high-stakes decisions
should never be made primarily on the basis of VAM-based estimates.The government of Ireland is currently under pressure to respond to the OECD’s
call for more accountability in Irish schools. However, given the current fiscal
situation the country faces, it would be unwise to borrow accountability systems
from abroad that appear at first glance to be a simple answer to the needs of the
nation. Rather, the finite resources available need to be allotted to improving
schooling for all. Were the current limited funds employed to develop a rigorous
accountability system they could not then be used to support better preparing
preservice teachers and the continued professional development of the nation’steachers. Moreover, systems in place around the world, and specifically in the USA,
cannot improve the quality of teaching in Irish schools. At best, they can only point
to a deficit and, in general, they provide very little information that can be used to
improve the system itself. The Irish government needs to be critically aware of both
64 F.C. Sloane et al.
Dow
nloa
ded
by [
Nat
iona
l Sci
ence
Fou
ndat
ion]
, [Fi
nbar
r Sl
oane
] at
05:
49 2
1 M
arch
201
3

the likely costs and benefits of such assessment systems for its teachers. The costs
include: fiscal costs (in the form of testing, scoring, equating, etc.), the psychological
costs to participants (all decisions based on a single test score and its impact on
teacher morale, etc.). The benefits appear minor, a single score (with doubts about its
validity) that serves to highlight deficits without being formative in nature. A score
unable to support important change in the ways teachers teach and develop as
teachers. The government needs to be extraordinarily careful should it choose to go
down this particular road as a measured response to political pressure from OECD
and European agencies; for it is highly unlikely to improve the lives, or the learning,
of teachers and their students.
Notes on contributors
Finbarr Sloane is a program director and cluster chair for the Research on Learning andEducation program at the national Science Foundation. His research explores growthmodeling in the context of mathematics development.
Jennifer Oloff-Lewis is a assistant professor of mathematics education at California StateUniversity, Chico. Her research investigates growth models and the learning of gifted childrenin mathematics.
Seong Hee Kim is now a primary school teacher in South Korea. Her research looks at therelationship of teacher knowledge to student performance and growth in mathematics.
The opinions expressed in this paper of those of the authors only and do not reflect anyposition of the National Science Foundation (NSF).
References
Aaronson, D., L. Barrow, and W. Sanders. 2007. Teacher and student achievement in theChicago public high schools. Journal of Labor Economics 25, no. 1: 95�135.
Ballou, D. 2012. Review of the long-term impacts of teachers. National Education PolicyCenter. http://www.greatlakescenter.org/docs/Think_Twice/TT_Ballou_ValAdd.pdf
Ballou, D., W. Sanders, and P. Wright. 2004. Controlling for students’ background invalue-added assessment of teachers. Journal of Educational and Behavioral Statistics 29,no. 1: 37�66.
Betebenner, D.W. 2005. Performance standards in measures of educational effectiveness. Paperpresented at Large Scale Assessment Conference, San Antonio, TX.
Braun, H. 2005. Using student progress to evaluate teachers: A primer on value added models[Policy Information Perspective]. Princeton, NJ: ETS.
Briggs, D.C., and J.P. Weeks. 2009. The sensitivity of value-added modeling to the creation of avertical score scale. Education Finance and Policy 4, no. 4: 384�414.
Broatch, J., and S. Lohr. 2011. Multidimensional assessment of value added by teachers toreal-world outcomes. Journal of Educational & Behavioral Statistics 37, no. 2: 256�77.
Broderick, B. 2011. Accountability in secondary schools. Educationmatters.ie. (accessed May24, 2012) http://www.educationmatters.ie/2011/10/31/apologia-for-secondary- schools%e2%80%99-accountability/
Bryk, A.S., and S.W. Raudenbush. 1992. Hierarchical linear models: Applications and dataanalysis methods. Newbury Park, CA: Sage Publications.
Burstein, L. 1980. The analysis of multilevel data in educational research and evaluation,Review of Research in Education, ed. D.C. Berliner, Vol. 8, 158�223. Washington, DC:American Educational Research Association.
Irish Educational Studies 65
Dow
nloa
ded
by [
Nat
iona
l Sci
ence
Fou
ndat
ion]
, [Fi
nbar
r Sl
oane
] at
05:
49 2
1 M
arch
201
3

California Department of Education (n.d.). Academic Performance Index API (accessedJanuary 10, 2012). http://www.cde.ca.gov/ta/ac/ap/.
Corcoran, S., J. Jennings, and A. Beveridge. 2011. Teacher effectiveness on high- and lowstakes tests. Paper presented at the annual conference of the Association for EducationFinance and Policy in Seattle, WA.
Department of Accountability and Data Quality. 2005. Texas Education Agency,Accountability manual (accessed January 10, 2012) http://www.tea.state.tx.us/perfreport/account/2005/manual.
Goldschmidt, P., K. Choi, and J.P. Beaudoin. 2012. Growth model comparison study: Practicalimplications of alternative models for evaluating school performance. Washington, DC:Council of Chief State School Officers.
Goldschmidt, P., P. Roschewski, K. Choi, W. Auty, S. Hebbler, and R. Blank. 2005.Policymakers’ guide to growth models for school accountability: How do accountabilitymodels differ. Washington, DC: Council of Chief State School Officers (accessed February20, 2006).
Goldstein, H., and D.J. Spiegelhalter. 1996. League tables and their limitations: Statisticalissues in comparisons of institutional performance. Journal of the Royal Statistical SocietySeries A (Statistics in Society) 159, no. 3: 385�443.
Gorard, S. 2013. What difference do teachers make? A consideration of the wider outcomes ofschooling. Irish Educational Studies 32, no. 1: 69�82.
Han, B., S. Dalal, and D.F. McCaffrey. 2012. Simultaneous one-sided tests with application toeducation evaluation systems. Journal of Educational and Behavioral Statistics 37, no. 1:114�36.
Hanushek, E. 1972. Education and race. Lexington, MA: D.C. Heath and Company.Harris, D. 2011. Value-added measures in education: What every educator needs to know.
Cambridge, MA: Harvard Education Press.Hill, R., B. Gong, S. Marion, C. DePascale, J. Dunn, and M.A. Simpson. 2005. Using value
tables to explicitly value growth. Presentation given at MARCES Conference on Long-itudinal Modeling of Student Achievement (accessed January 10, 2012) http://www.nciea.org/publications/MARCES_RHBGSMCDJDMS05.pdf.
Jacob, B., L. Lefgren, and D. Sims. 2010. The persistence of teacher-induced learning. Journalof Human Resources 45, no. 4: 915�43.
Laird, N.M., and J.H. Ware. 1982. Random-effects models for longitudinal data. Biometrics38: 963�74.
Lockwood, J.R., and D.F. McCaffrey. 2009. Exploring student-teacher interactions inlongitudinal achievement data. Education Finance and Policy 4, no. 4: 439�67.
Lohr, S.L. 2011. The value Deming’s ideas can add to educational evaluation. Joint StatisticalMeetings. Statistics: An All-encompassing Discipline. JSM 2011 Online Program, July 30�August 4, in Miami Beach, Florida.
Lord, F.M. 1969. Statistical adjustments when comparing preexisting groups. PsychologicalBulletin 72, no. 5: 336�7.
Mans, E. 1998. Covariance adjustment versus gain scores*revisited. Psychological Methods 3,no. 3: 309�27.
Mariano, L.T., D.F. McCaffrey, and J.R. Lockwood. 2010. A model for teacher effects fromlongitudinal data without assuming vertical scaling. Journal of Educational & BehavioralStatistics 35, no. 3: 253�79.
McCaffrey, D.F., and L. Hamilton. 2007. Value-Added Assessment in Practice: Lessons fromthe Pennsylvania Value-Added Assessment System Pilot Project, TR-506-CC. Santa Monica,CA: RAND Corporation.
McCaffrey, D.F., and J.R. Lockwood. 2011. Missing data in value-added modeling of teachereffects. The Annals of Applied Statistics 5, no. 2A: 773�97.
McCaffrey, D., J.R. Lockwood, D.M. Koretz, and L.S. Hamilton. 2003. Evaluating valueadded models for teacher accountability (Report MG-158). Santa Monica, CA: RANDCorporation.
McCaffrey, D.F., J.R. Lockwood, D. Koretz, T.A. Louis, and L. Hamilton. 2004. Models forvalue-added modeling of teacher effects. Journal of Educational & Behavioral Statistics 29,no. 1 (Value-Added Assessment Special Issue): 67�101.
66 F.C. Sloane et al.
Dow
nloa
ded
by [
Nat
iona
l Sci
ence
Fou
ndat
ion]
, [Fi
nbar
r Sl
oane
] at
05:
49 2
1 M
arch
201
3

McCaffrey, D.F., T.R. Sass, J.R. Lockwood, and K. Mihaly. 2009. The intertemporalvariability of teacher effect estimates. Education Finance and Policy 4, no. 4: 572�606.
Murnane, R.J. 1975. The impact of school resources on the learning of inner city children.Cambridge, MA: Ballinger Publishing Co.
No Child Left Behind (NCLB) Act of 2001. 2002. Public Law 107-11- Statute 1425.OECD. 2010. PISA 2009 Results: What students know and can do � student performance
in reading, mathematics and science (Volume I). http://dx.doi.org/10.1787/9789264091450-en
OECD. 2011. Economic Survey of Ireland 2011. Paris, France: Organization for EconomicCooperation and Development (OECD).
Olsen, L., and D. Hoff. 2005. U.S. to pilot new gauge of ‘growth’. EdWeek 25, no. 13: 1�16.Papay, J. 2011. Different tests, different answers: The stability of teacher value-added estimates
across outcome measures. American Educational Research Journal 48, no. 1: 163�93.Raudenbush, S.W. 2004. What are value-added models estimating and what does this imply for
statistical practice? Journal of Educational & Behavioral Statistics 29, no. 1: 121�30.Raymond, M.E., and E.A. Hanushek. 2003. High-stakes research: The campaign against
accountability has brought forth a tide of negative anecdotes and deeply flawed research.Solid analysis reveals a brighter picture. Education Next 3, no. 3: 48�55.
Sanders, W.L. 2005. A summary of conclusions drawn from longitudinal analyses of studentachievement data over the past 22 years (1982*2004). Presentation to GovernorsEducation Symposium, Asheville, NC.
SAS† EVAMS† for K-12 (n.d.). (Accessed May 20, 2012) http://www.sas.com/govedu/edu/services/effectiveness.html.
Schochet, P.Z., and H.S. Chiang. 2010. Error rates in measuring teacher and school performancebased on student test score gains (NCEE 2010-4004). Washington, DC: National Center forEducation Evaluation and Regional Assistance, Institute of Education Sciences, U.S.Department of Education.
The Center for Greater Philadelphia. (n.d.). Value-added assessment across the nation(accessed May 20, 2012) http://www.cgp.upenn.edu/ope_nation.html
Thum, Y.M. 2003. Measuring progress towards a goal: Estimating teacher productivity using amultivariate multilevel model for value added analysis. Sociological Methods & Research 32,no. 2: 153�207.
Todd, P.E., and K.I. Wolpin. 2003. On the specification and estimation of the productionfunction for cognitive achievement. The Economic Journal 113, no. 485: F3�F33.
Wainer, H., ed. 2004. Value-added assessment [Special Issue]. Journal of Educational &Behavioral Statistics 29, (1): 1�3.
Webster, W., and R. Mendro. 1997. The Dallas value-added accountability system. In Gradingteachers, grading schools: Is student achievement a valid evaluation measure?, ed. J. Millman,81�99. Thousand Oaks, CA: Corwin Press, Inc.
Irish Educational Studies 67
Dow
nloa
ded
by [
Nat
iona
l Sci
ence
Fou
ndat
ion]
, [Fi
nbar
r Sl
oane
] at
05:
49 2
1 M
arch
201
3