Valuation Metrics and Drivers in Today’s Economy · Generates a Good Valuation Address the market...
41
Valuation Metrics and Drivers in Today’s Economy September 19, 2012
Transcript of Valuation Metrics and Drivers in Today’s Economy · Generates a Good Valuation Address the market...

Valuation Metrics and Drivers in Today’s Economy
September 19, 2012
Speakers
Adrian Bray, Assay
Tony Yeh, Silicon Valley Bank
Jim Goldhawk, RoseRyan
Jim Chapman, Foley & Lardner LLP
Agenda
Welcome/Objectives Vince Timoney, Silicon Valley Bank
Off the Balance Sheet Adrian Bray, Assay
Valuation Trends in Technology Tony Yeh, Silicon Valley Bank
Get your Financial House in Order Jim Goldhawk, RoseRyan
The Legal Side of Building Value James Chapman, Foley & Lardner
Q&A All

Valua%on = Profit X Mul%ple

Copyright © Assay Advisory 2012
Income Follows Assets
Copyright © Assay Advisory 2012
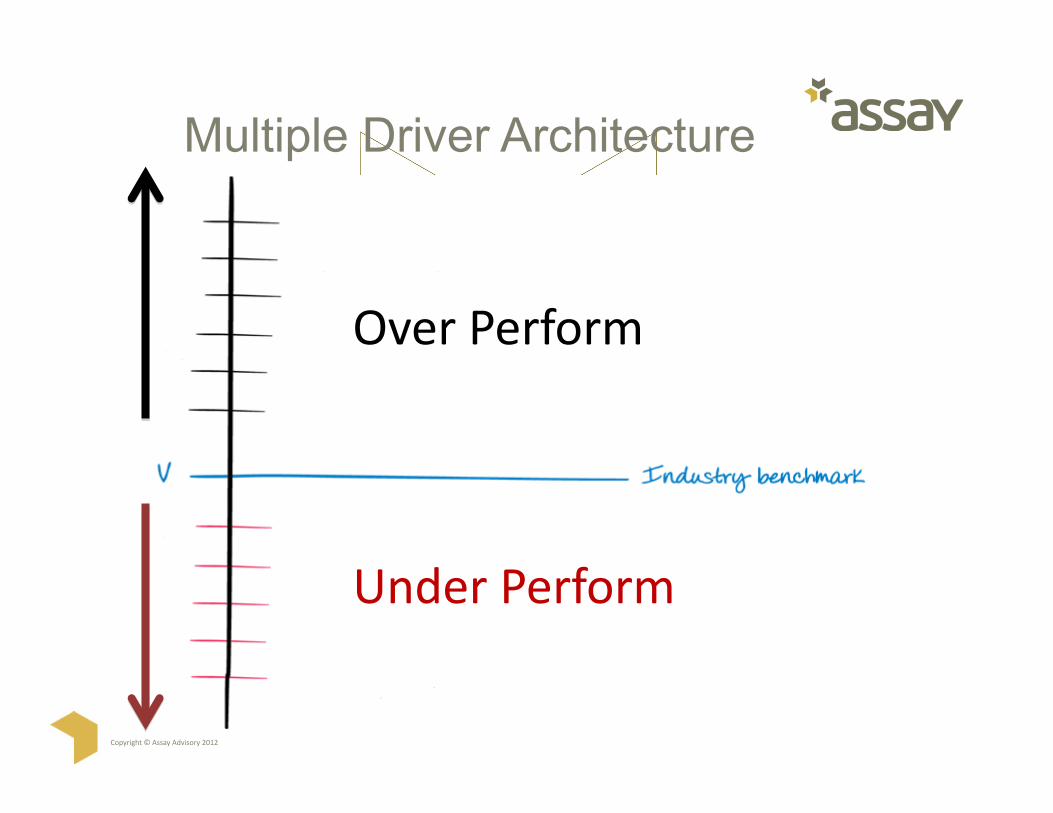
Multiple Driver Architecture
Over Perform
Under Perform
Copyright © Assay Advisory 2012
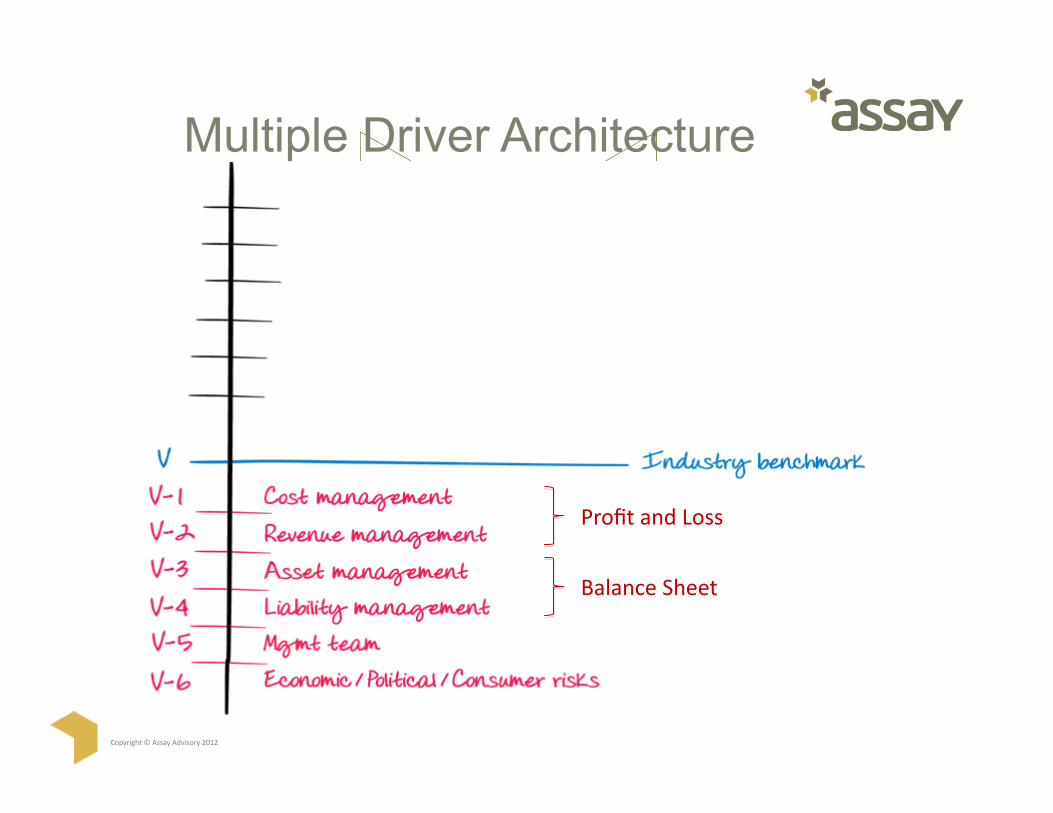
Multiple Driver Architecture
Profit and Loss
Balance Sheet

Copyright © Assay Advisory 2012
Multiple Driver Architecture
Profit and Loss
Balance Sheet
Copyright © Assay Advisory 2012
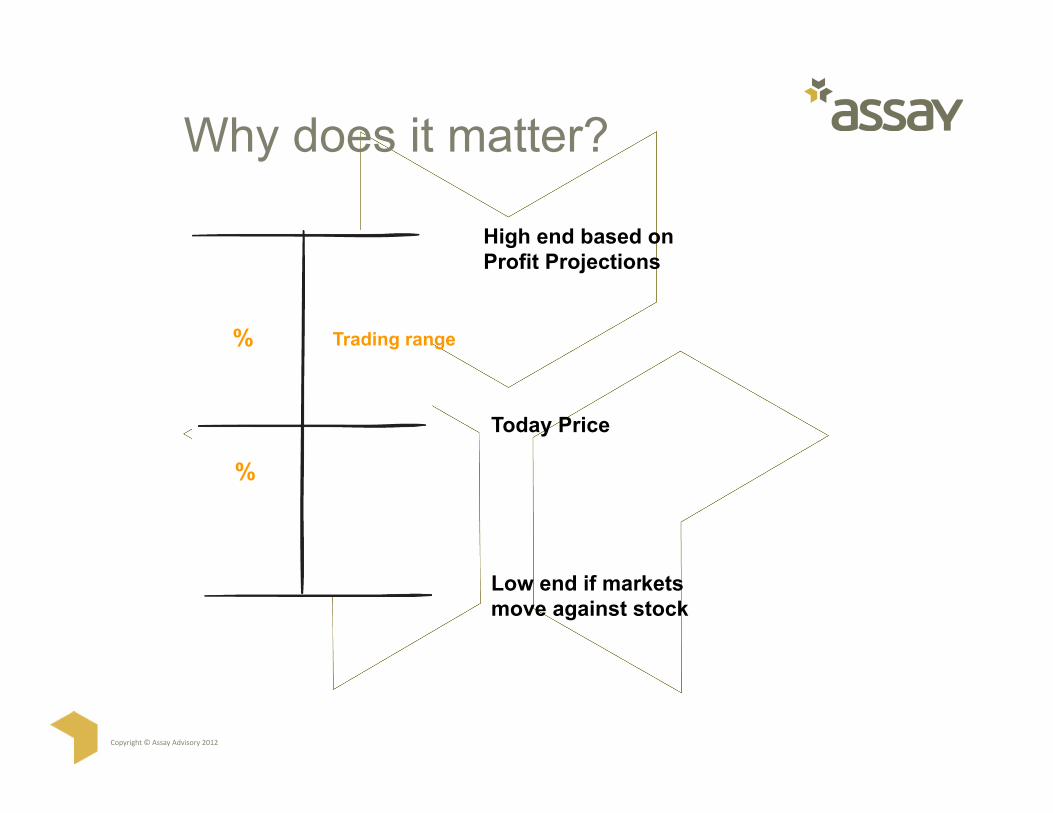
Why does it matter?
High end based on Profit Projections
Today Price
Low end if markets move against stock
Trading range %
%
Copyright © Assay Advisory 2012
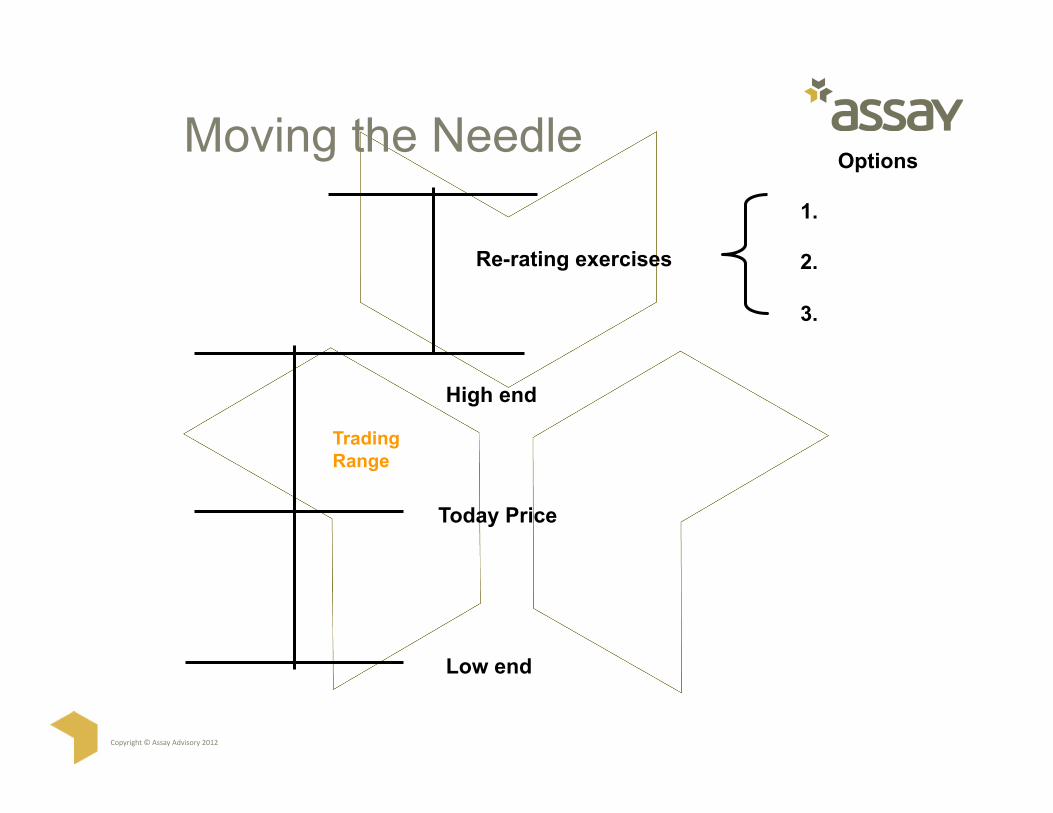
Moving the Needle 1.
2.
3.
High end
Today Price
Low end
Re-rating exercises
Options
Trading Range

Copyright 2012 by SVB Financial Group.
CN-TDYEH2012-Q1-RR-2.3
Prepared by SVB Analytics September 19, 2012
VALUATION TRENDS AND INSIGHTS FOR TECHNOLOGY COMPANIES

Copyright 2012 by SVB Financial Group.
CN-TDYEH2012-Q1-RR-2.3
12
IPO Multiples | 2002 – 2012
Trends of Price/Revenue multiples for IPO exits
SOURCE Silicon Valley Bank, Capital IQ
To a certain extent, the IPO valuations are a derivative of the S&P IT index. As the S&P Infotech index improves, so has IPO valuation multiples.
From the lows of the Great recession, improvements in IPO valuation multiples can be observed as
1) Median multiples have increased
2) Range of multiples have improved on the upside
Great Recession Tech Recession
BOX PLOT
40th
20th
60th
80th
Percentile Median

Copyright 2012 by SVB Financial Group.
CN-TDYEH2012-Q1-RR-2.3
13
M&A Multiples | 2002 – 2012
Trends of Price/Revenue multiples for M&A transactions
SOURCE Silicon Valley Bank, Capital IQ
The acquisition multiples for technology companies, likewise, track the demand for publicly traded IT shares.
Compared to the IPO valuations, acquisition valuations appear even more tightly linked to the IT market.
Similar to the IPO multiples, we are observing increases in median multiples and multiple range expansion.
Great Recession Tech Recession
BOX PLOT
40th
20th
60th
80th
Percentile Median

Copyright 2012 by SVB Financial Group.
CN-TDYEH2012-Q1-RR-2.3
14
Funding Multiples | Post-money greater than $100 million, 2007 – H1.2012
SOURCE Silicon Valley Bank
Trends of Price/Revenue multiples for funding rounds with post-valuations greater than $100M Large fundraising amounts by private companies often provide founders and initial investors with a partial exit event …
… however, valuation multiples for large fund raises by private companies do not have a tight link to the publicly traded markets.
So what drives these valuations?
Is it revenue growth?
Or some other market factors?
* For 2008, most valuation fell into the lower bucket post Lehman’s bankruptcy in September.
?
Great Recession Tech Recession
BOX PLOT
40th
20th
60th
80th
Percentile Median
*

Copyright 2012 by SVB Financial Group.
CN-TDYEH2012-Q1-RR-2.3
15
Although the median sales growth of companies in the different price/revenue buckets appear consistent with their respective multiple bucket, a more rigorous statistical analysis would show the effect to be modest, at best.
Investment banks often advise companies to focus on revenue growth. However, strong revenue growth explains less than 20% of the variation in exit/funding multiples (even when excluding the data points from 2008 & 2009). Many other factors come into play.
Sales Growth of Exited Companies | 2003 – 2012
SOURCE Silicon Valley Bank, Capital IQ
Median sales growth rates of companies exiting within various Price/Revenue multiple tiers
Price/Rev Multiple 2003 2004 2005 2006 2007 2008 2009 2010 2011 2012
1x – 3x 7.6% 12.3% 7.4% 10.4% 12.2% 12.6% 8.8% 11.6% 14.5% 32.4%
3x – 6x 29.8% 24.8% 35.9% 23.7% 28.2% 22.2% 35.5% 20.2% 22.2% 21.9%
Greater than 6x 46.9% 61.4% 57.0% 51.7% 65.5% 15.9% 22.8% 36.3% 63.7% 59.3%
Price/Revenue Multiple
SALES GROWTH
CHANGE IN NET REVENUE PRIOR PERIOD NET
REVENUE

Copyright 2012 by SVB Financial Group.
CN-TDYEH2012-Q1-RR-2.3
16
Example: Organic Growth | “Recession Resistant” Sales Growth
Organic growth is highly valued by investors, GDP growth not so much (analysis from 2006 to 2012)
SOURCE Silicon Valley Bank
Organic growth is incremental sales that is driven by fundamental demand for a company’s product; not reliant on general macro or sector economic activity.
“GDP sensitive” growth is based on the overall economy. As the economy slows, so does GDP derived sales.
In this example, the Gaming/Social/Lifestyle niche’s notable high organic growth and low economic sensitivity mix (“recession resistance”) would be attractive to investors.
However, not all organic growth is equal.
* Advertising niche’s 2.68:1 sensitivity implies that a 1% increase in GDP would spur a 2.68% increase in sales.

Copyright 2012 by SVB Financial Group.
CN-TDYEH2012-Q1-RR-2.3
17
Momentum sales is viewed favorably by investors
Example: Mobile Advertising | Achieving Sales Momentum
SOURCE Silicon Valley Bank
REVENUE/EXPENSE GROWTH
(ANNUALIZED %)
Revenue (51.3%)
COGS (48.4%)
Operating Expenses (26.9%)
Viability Ratio (1.19)
Great Recession*
In this example, the Mobile Advertising niche exhibits sales momentum: revenue is increasing at a faster rate than total expenses (in particular, operating expenses).
Advertising companies’ ability to hold their operating expenses when they hit their Q1 lulls is highly suggestive of scalable business models. Expenses seem fixed when sales growth is happening, and can be quickly reigned in as needed.
An increasing cumulative viability ratio captures this effect.
VIABILITY RATIO
CHANGE IN NET REVENUE CHANGE IN OPERATING
EXPENSES
Copyright 2012 by SVB Financial Group.
CN-TDYEH2012-Q1-RR-2.3
18
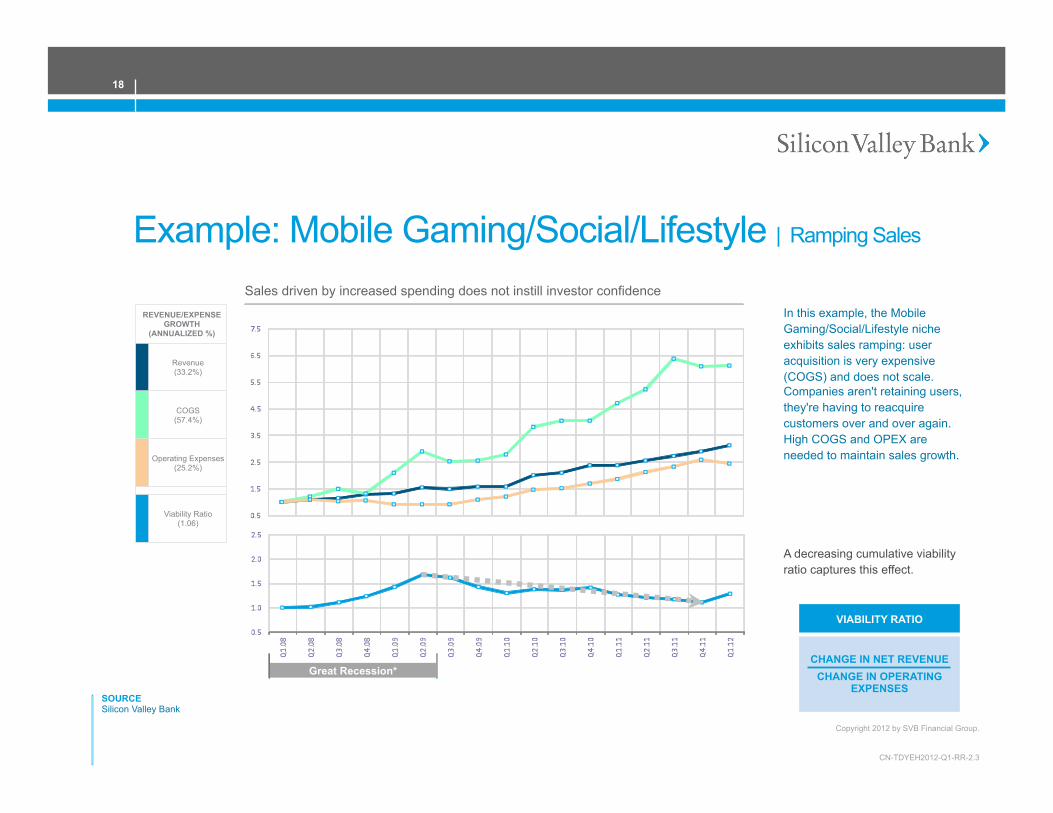
Sales driven by increased spending does not instill investor confidence
Example: Mobile Gaming/Social/Lifestyle | Ramping Sales
SOURCE Silicon Valley Bank
REVENUE/EXPENSE GROWTH
(ANNUALIZED %)
Revenue (33.2%)
COGS (57.4%)
Operating Expenses (25.2%)
Viability Ratio (1.06)
Great Recession*
In this example, the Mobile Gaming/Social/Lifestyle niche exhibits sales ramping: user acquisition is very expensive (COGS) and does not scale. Companies aren't retaining users, they're having to reacquire customers over and over again. High COGS and OPEX are needed to maintain sales growth.
A decreasing cumulative viability ratio captures this effect.
VIABILITY RATIO
CHANGE IN NET REVENUE CHANGE IN OPERATING
EXPENSES
Copyright 2012 by SVB Financial Group.
CN-TDYEH2012-Q1-RR-2.3
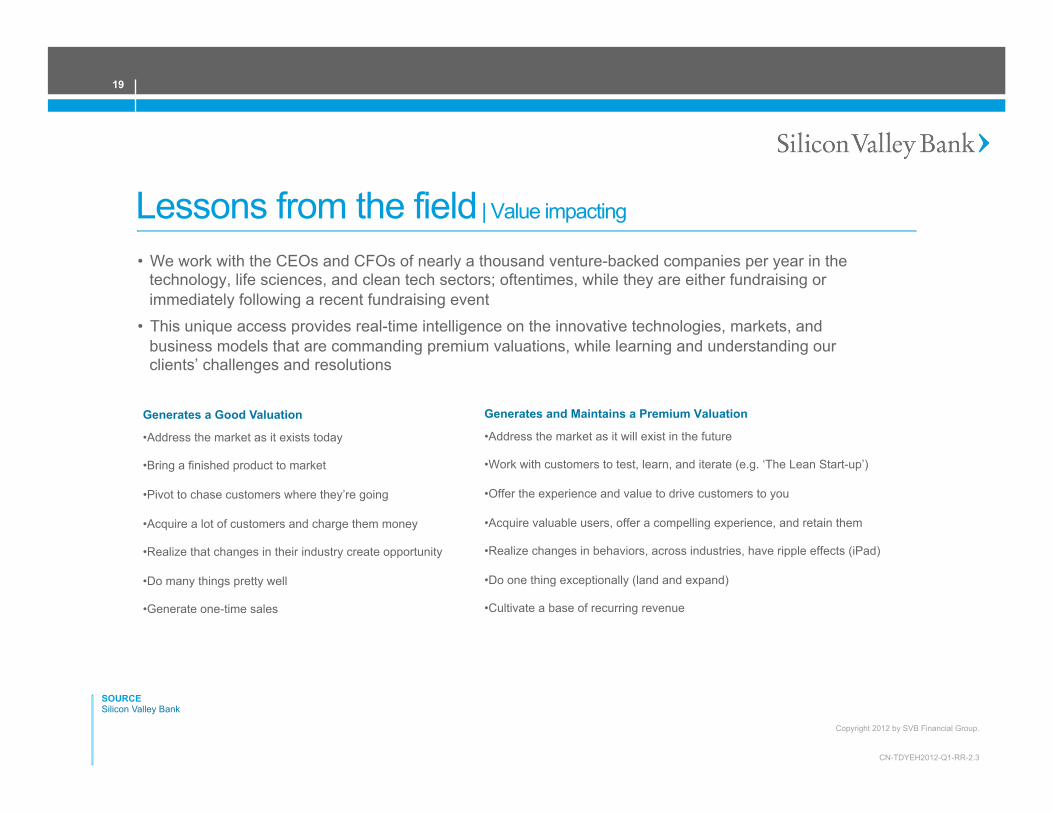
• We work with the CEOs and CFOs of nearly a thousand venture-backed companies per year in the technology, life sciences, and clean tech sectors; oftentimes, while they are either fundraising or immediately following a recent fundraising event
• This unique access provides real-time intelligence on the innovative technologies, markets, and business models that are commanding premium valuations, while learning and understanding our clients’ challenges and resolutions
Generates and Maintains a Premium Valuation
• Address the market as it will exist in the future
• Work with customers to test, learn, and iterate (e.g. ‘The Lean Start-up’)
• Offer the experience and value to drive customers to you
• Acquire valuable users, offer a compelling experience, and retain them
• Realize changes in behaviors, across industries, have ripple effects (iPad)
• Do one thing exceptionally (land and expand)
• Cultivate a base of recurring revenue
Generates a Good Valuation
• Address the market as it exists today
• Bring a finished product to market
• Pivot to chase customers where they’re going
• Acquire a lot of customers and charge them money
• Realize that changes in their industry create opportunity
• Do many things pretty well
• Generate one-time sales
Lessons from the field | Value impacting
SOURCE Silicon Valley Bank
19

Copyright 2012 by SVB Financial Group.
CN-TDYEH2012-Q1-RR-2.3
SMB* Software as a Service • Customer acquisition costs
can be high
• Retention beyond a few months can be low
• Capital intensity is high up-front
• Repayment times can be long
• Sales cycles are shorter, decisions made faster (to come and go)
Mobile / Apps • Start-up costs are pretty low
• Hosting costs can escalate quickly as user base grows
• Users expect a lot, including not having to pay
• A one-way flow of content may not cultivate an engaged user base
• How to make it easy to discover and engage, but hard to leave?
Lessons from the field | Niche Specific Themes
eCommerce • The property that serves the
ad may not get credit for creating the sale (see it on Facebook, buy it on Amazon)
• Amazon literally sells everything cheaper than you do
• Creating a custom-curated shopping experience appeals to users, and advertisers
• Mobile payments is a fragmented market that everyone’s into. Consumers won’t make the first move
SOURCE Silicon Valley Bank
* SMB = Small to Medium Business
20
Copyright 2012 by SVB Financial Group.
CN-TDYEH2012-Q1-RR-2.3
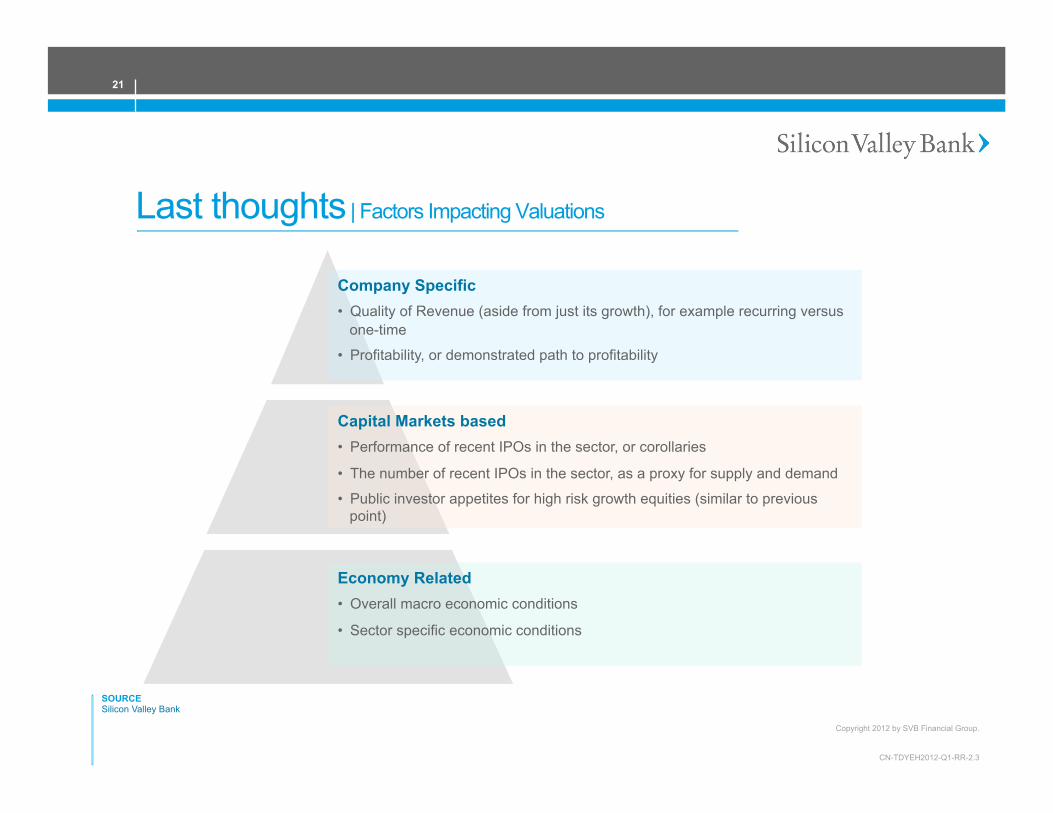
Company Specific • Quality of Revenue (aside from just its growth), for example recurring versus
one-time
• Profitability, or demonstrated path to profitability
Last thoughts | Factors Impacting Valuations
Economy Related • Overall macro economic conditions
• Sector specific economic conditions
Capital Markets based • Performance of recent IPOs in the sector, or corollaries
• The number of recent IPOs in the sector, as a proxy for supply and demand
• Public investor appetites for high risk growth equities (similar to previous point)
SOURCE Silicon Valley Bank
21

Copyright 2012 by SVB Financial Group.
CN-TDYEH2012-Q1-RR-2.3
22
SVB Analytics 555 Mission Street, Suite 900 San Francisco, California 94105 800.760.9644 www.svb.com
This material, including without limitation the statistical information herein, is provided for informational purposes only. The material is based in part upon information from third-party sources that we believe to be reliable, but which has not been independently verified by SVB Financial Group and, as such, we do not represent that the information is accurate or complete. The information should not be viewed as tax, investment, legal or other advice nor is it to be relied on in making an investment or other decisions. You should obtain relevant and specific professional advice before making any investment decision. Nothing relating to the material should be construed as a solicitation or offer to acquire or dispose of any investment or transaction.
©2012 SVB Financial Group. All rights reserved. Member Federal Reserve System. SVB>, SVB>Find a way, SVB Financial Group, and Silicon Valley Bank are registered trademarks. SVB Analytics is a member of SVB Financial Group and a non-bank affiliate of Silicon Valley Bank. Products and services offered by SVB Analytics are not FDIC insured and are not deposits or other obligations of Silicon Valley Bank. SVB Analytics does not provide tax or legal advice. Please consult your tax or legal advisors for such guidance. Rev. 04-12-11

Get your financial house in order
Jim Goldhawk, Senior Consultant
RoseRyan
Sell Your Financial Statements
Present high quality financial statements and forecasts
Reflects a strong management team
Experts save time and money

Due Diligence
Anticipate intense scrutiny • Actual results
• Budgets and forecasts
Document/reconcile account balances • Basic internal controls
Demonstrate a consistent view of the business • How you forecast and manage should be consistent with
how you measure and report
Understand your numbers as well as you know your technology and products
Time is of the essence
Assume due diligence will feel chaotic • Deadlines
• One-way information flow
• Volume of information
• Virtual warehouse
• Unexpected questions, assumptions and conclusions
• Helps build Schedule of Exceptions
Plan adequate resources
GAAP
Unaudited financial statements • Engage a qualified advisor to document compliance with
GAAP
• Write accounting memos for specialized GAAP
Complex equity/debt structures • Record the transactions now!!
• Best practice: Investigate the accounting during negotiations
If an audit is needed, do it early

Reliable financial statements
Lowers transaction risk to the buyer • Subsequent gains and losses either flow through the
buyer’s income statement, or
• Settle through an escrow account (to be absorbed by the seller)
Provides a consistent view of the business to all stakeholders

Know your buyer
Public or private? Note: Public buyers need quarterly financials
Motivated buyer?
Synergies?
Financial standing/resources
Culture
Optimal tax structure • Offshore vs domestic
©2012 Foley & Lardner LLP • Attorney Advertising • Prior results do not guarantee a similar outcome • Models used are not clients but may be representative of clients • 321 N. Clark Street, Suite 2800, Chicago, IL 60654 • 312.832.4500
Building Valuation: Demystifying the Equation The Legal Side of Building
Valuation and Making a Deal James C. Chapman
Foley & Lardner LLP September 19, 2012

©2012 Foley & Lardner LLP
Risk Management for the Emerging Company Analytical framework Risks that can be safely ignored Risks that can be mitigated through simple
changes in behavior Risks that can mitigated through insurance Risks to actively identify, monitor, and mitigate

©2012 Foley & Lardner LLP
Basics Relationships among founders Employment law compliance Tax returns and withholdings Licenses and permits Board and shareholder meetings

©2012 Foley & Lardner LLP
Advanced Intellectual property – offensive/defensive use Trade secret protection plan Human resources Contract management Information technology and security Financial controls Regulatory compliance

©2012 Foley & Lardner LLP
Preparing the Business for Sale Remove assets which seller wishes to retain or
which may be objectionable to the buyer including condominiums or vacation homes, automobiles, or other company owned items;
Ensure that the financial and corporate records are in good order;
Seller should have up-to-date minutes of the meetings of the board of directors and a validly- elected board of directors;

©2012 Foley & Lardner LLP
Preparing the Business for Sale (cont’d) Settle lawsuits or terminate unfavorable
contracts before the seller's adversaries see the potential sale as added leverage;
Thoroughly clean and organize the premises; Ensure that all shares of stock required to be
issued have been issued and that all verbal agreements regarding future ownership are either honored or terminated in writing;

©2012 Foley & Lardner LLP
Preparing the Business for Sale (cont’d) Develop a comprehensive list of all of seller's
assets; Create a list of all necessary governmental
permits; Document all loans to or from shareholders and
employees; Review the development of the company's
technology to determine that no others have any ownership rights;

©2012 Foley & Lardner LLP
Preparing the Business for Sale (cont’d) Compile a list of the company's patents,
trademarks, and copyrights; Compile information regarding the company's
product and/or service warranties and warranty claims; and
Compile information regarding the presence, use, storage, and disposal of hazardous materials.

©2012 Foley & Lardner LLP
Deal Breakers and Obstacles Lack of integrity of management – cut too many
corners The inability to establish clear title to assets –
co-mingling High expectations of value – gap is too large Unreliability of financial statements or lack
thereof – cannot justify price Ownership of the company itself – oral stock
option commitments, former founders/partners
©2012 Foley & Lardner LLP
Deal Breakers and Obstacles (cont’d) Culture - differences between buyer and seller
too great Employees – key employees will not go along or
work for the buyer Customer concentration – 1 or 2 major
customers Intellectual property challenges – does the seller
own what it thinks it owns Tax problems – misclassifying employees as
independent contractors

©2012 Foley & Lardner LLP
Common Mistakes Made by Sellers Sellers fail to prepare themselves for the time
and emotional commitment required Sellers fail to adequately prepare the business
for sale Sellers treat buyers as friends Sellers convince themselves that the transaction
is completed when it has only just begun Sellers fail to develop a negotiation strategy prior
to beginning negotiations
Tony D. Yeh Silicon Valley Bank
Jim Goldhawk RoseRyan
James Chapman Foley & Lardner LLP
Contact info:
Adrian Bray Assay
Questions?