Valuable, but Simple Techniques for “Bigger Box” Thinking · 2007-06-08 · 9 Distance Between...
51
Point Proximity Analysis Valuable, but Simple Techniques for “Bigger Box” Thinking Susan L. Zwillinger Director, Training & Customer Services Thinformation, Inc. / A WEC Company ESRI Business GeoInfo Summit April 23-25, 2007
Transcript of Valuable, but Simple Techniques for “Bigger Box” Thinking · 2007-06-08 · 9 Distance Between...

Point Proximity Analysis
Valuable, but Simple Techniques for “Bigger Box” Thinking
Susan L. ZwillingerDirector, Training & Customer ServicesThinformation, Inc. / A WEC Company
ESRI Business GeoInfo SummitApril 23-25, 2007

2
Discussion Points
Health Care Case Study
Distance matrix
Insurance Case Study
Desire lines analysis
Retail Case Study
Spatial statistics tools

3
Since 2001, XLHealth has consistently been named one of the “Ten Best Disease Management Companies in America” by the Health Industries Research Companies.
In 2005, XLHealth was recognized by the Disease Management International Purchasing Consortium with its “Best Disease Management Ideas” award.
XLHealth has been awarded the Disease Management Association of America’s Recognizing Excellence Award for “Best Disease Management Program: Medicare”.
XL Health

4
A shift in government policyHigher payments from Medicare
Medicare encourages “special needs” plans.
Requires reports and maps that document that access to services.
XL Health’s Need for GIS Analysis

5
Access to contracted Primary Care Providers
% of beneficiaries in Urban Areas with access to 2 or more PCPs within 30 minutes/30 miles.
% of beneficiaries in Rural Areas with access to 1 or more PCPs within 45 min/45 mi.
Reporting Requirements (One Example)
6
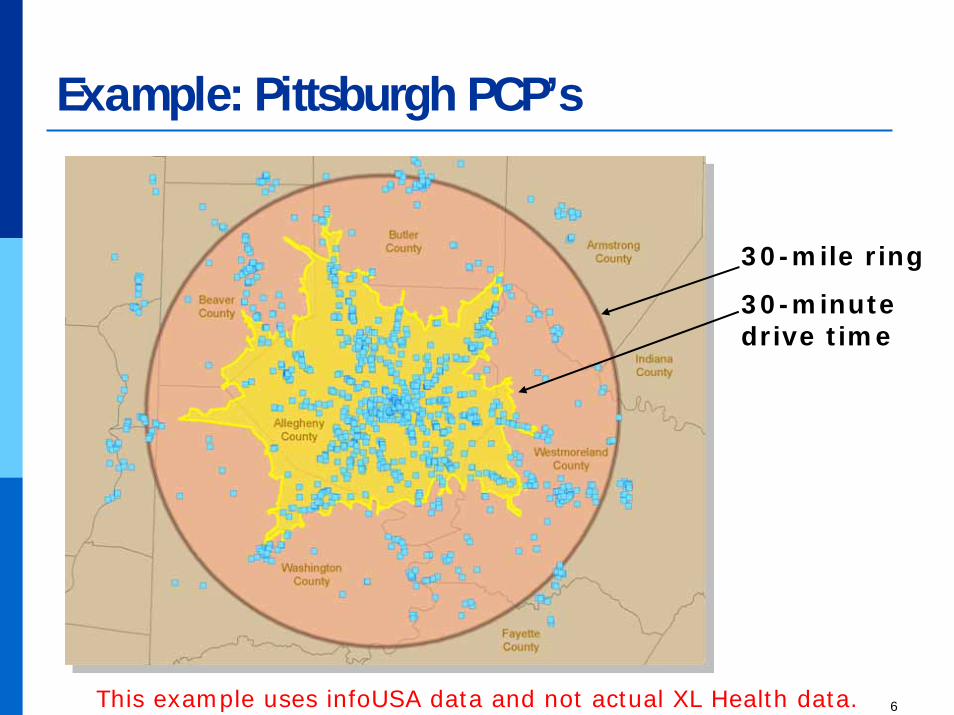
Example: Pittsburgh PCP’s
This example uses infoUSA data and not actual XL Health data.
30-minute drive time
30-mile ring

7
Example: Pittsburgh Beneficiaries & PCP’s
This example uses infoUSA data and not actual XL Health data.
8
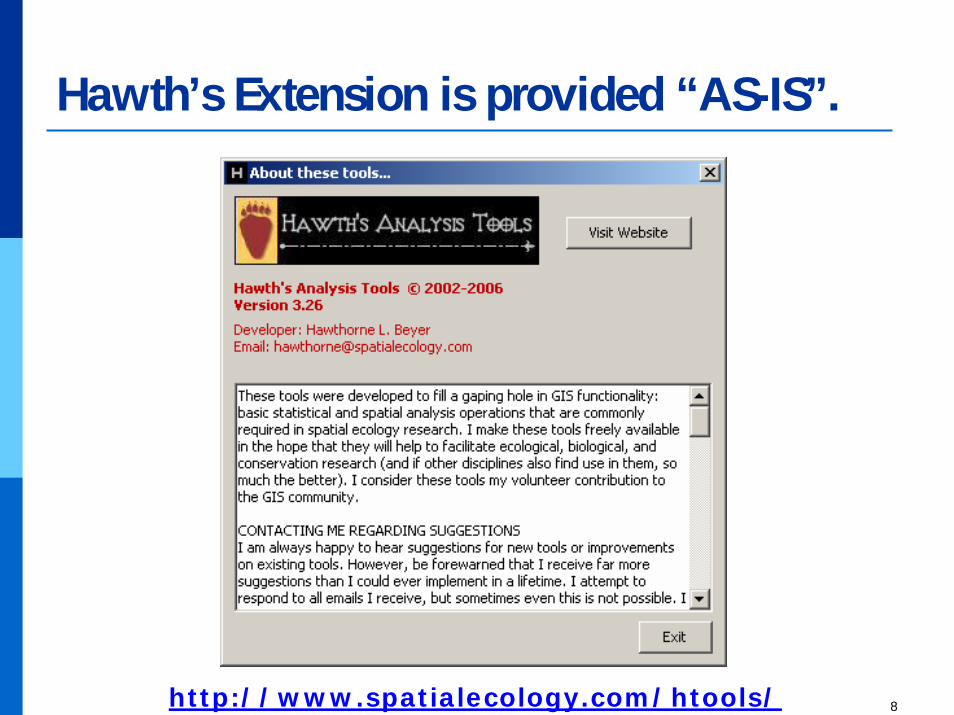
Hawth’s Extension is provided “AS-IS”.
http://www.spatialecology.com/htools/

9
Distance Between Points (Between Layers)

10
DistanceBetween Points (Between Layers)
11
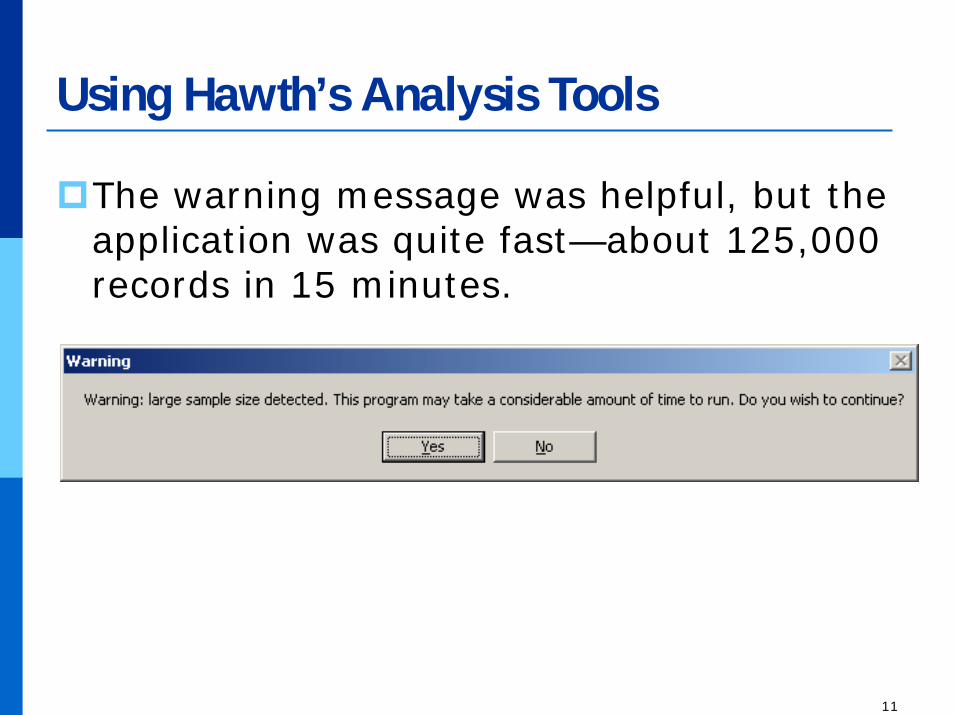
Using Hawth’s Analysis Tools
The warning message was helpful, but the application was quite fast—about 125,000 records in 15 minutes.

12
Using Hawth’s Analysis Tools
Shapefiles.
An assigned projected coordinate system.Same projection for both layers.
Distances calculated from map units.
A custom projection with map units in miles saves a calculation step.

13
Using the Results

14
Using the Results
79,472 Beneficiaries
Distance to the
Closest PCP
Distance to the 2nd
Closest PCP
Distance to the 3rd Closest
PCPMaximum Distance(in Miles): 8.18 9.68 9.9
Average Distance(in Miles): 0.48 0.68 0.85

15
99.99% of Beneficiaries:Access to at least 5 providers within 30 miles

16
A Business Analyst Solution

17
A Business Analyst Solution

18
A Business Analyst Solution

19
A Business Analyst Solution

20
A Business Analyst Solution

21
A Business Analyst SolutionThe exported report has the data you need.
You will find the DBF file in your output folder under the Reports directory.
E.g. C:\My Output Data\Projects\Default Project\Reports\[report name]
ID NAME LOCATOR1 DISTANCE DIRECTIONMember 0 Member 0 PCP 0 1.54 SWMember 0 Member 0 PCP 3 1.75 SWMember 0 Member 0 PCP 4 1.75 SWMember 0 Member 0 PCP 5 1.75 SWMember 0 Member 0 PCP 6 1.75 SWMember 1 Member 1 PCP 0 0.31 SWMember 1 Member 1 PCP 3 0.53 NWMember 1 Member 1 PCP 4 0.53 NW

22
A Starting Point
Identify gaps: improve their services
Opportunity: provide new services in new geographies

23
State Auto Insurance Companies
Based in Columbus, OH
Products:Personal auto
Nonstandard auto
Homeowners
Business coverages, including workers’ compensation
Fidelity and surety bonds
Farmowners
Image used with permission.

24
State Auto Insurance Companies
Image used with permission.

25
State Auto: Committed to Excellence
Forbes magazine’s Best Managed Company-Insurance, (2006)
Member of Forbes’ Platinum 400 companies (2005, 2006)
ACORD Upload Company of the Year –(1997, 2002, 2003, 2004) (2005 ACORD Certification award)
Demonstrating commitment to efficiency through automation

26
State Auto: Committed to Excellence
Every year since 1954, State Auto Mutual has earned a rating of A+, or better, from the A.M. Best Company, the premier evaluator of insurance company financial strength and stability.
State Auto is one of only 14 US companies that have earned that distinction.

27
"People who live in the present often wind up exploiting the present to an extent that it starts removing the possibility of having a future.“
-Alan Kay in CIO InsightFebruary 1, 2007, “Expert Voices: Beyond The Box”
By Allan E. Alter
Excellence: Seeing possibilities
http://www.cioinsight.com/article2/0,1540,2089567,00.asp?kc=CMCIOEMNL020607EP18

28
GIS Analysis: Looking for possibilities
To find answers to questions about how to do business in a better way.
Lower Cost
Better Service
Higher Productivity
29
GIS Analysis
State Auto studied the distance between their offices and agency accounts using the Business Analyst Desire Line Wizard.
Offices are mapped using the Store Setup option and agencies using the Customer Setup option.
Business Analyst Menu Analysis Desire Lines.

30
Using Desire Lines

31
Desire Lines
Image used with permission.

32
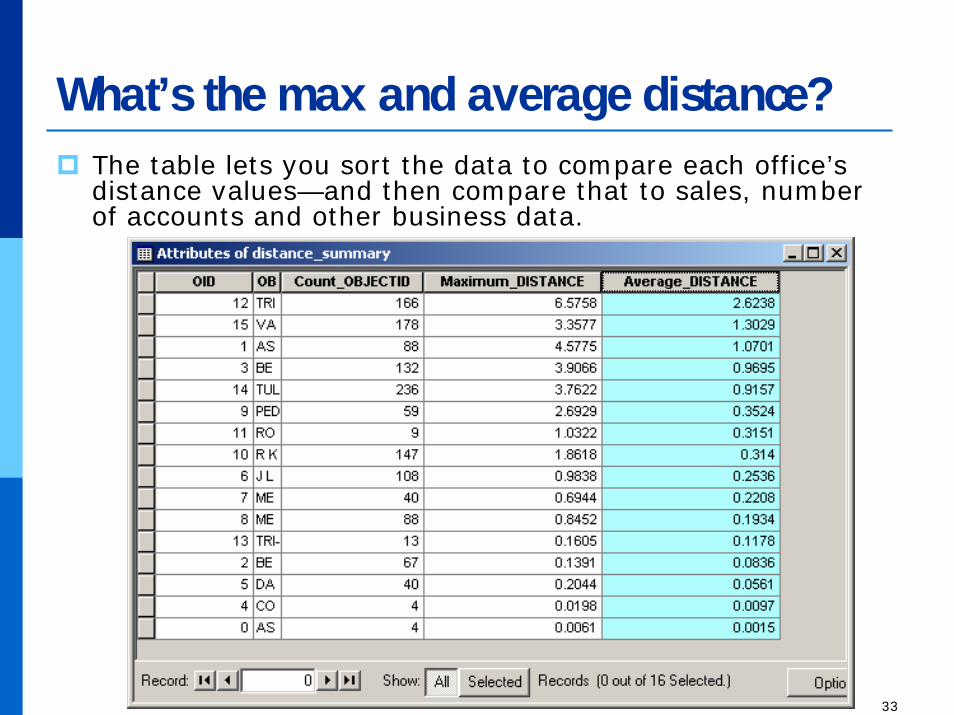
What’s the max and average distance?
Right click the field that identifies your stores and select “Summarize”.
33
What’s the max and average distance?The table lets you sort the data to compare each office’s distance values—and then compare that to sales, number of accounts and other business data.

34
Is the organizational structure equally distributed? Is this efficient and cost effective?
Image used with permission.

35
Why are some accounts assigned to very distant locations when another office is closer?
Image used with permission.
36
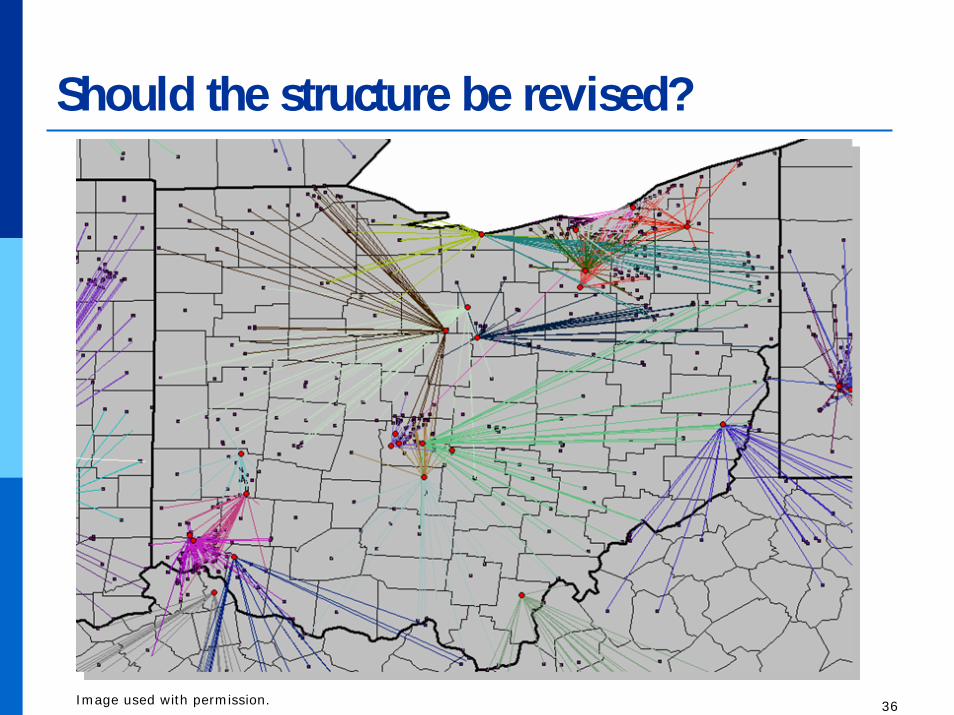
Should the structure be revised?
Image used with permission.

37
6 + 2 = 8 vs. 8 = 6 + 2
“Having the right answer means you do not have to listen to other answers
because they can never be 'more than right'.
The result is a severe limitation on thinking.”
-Dr. Edward DeBono
http://www.edwarddebono.com/WeeklyMessage.php?PHPSESSID=666a4387cc52495aaf8db2443982231b

38
Point Proximity for Retail Market Study
We don’t have “right” answers.
There are limitations in market analysis.
But GIS gives us a way to look at the market in a different way.

39
Defining the Market Area
How do we define the market area? How large should the market area be?
Can our competitors help us understand the market?
How do competitors cover the market?What is the average proximity of the competitors within the market area?

40
Step 1: Select your Business LocationsShow population density for the market area. (Indianapolis)Load the competition business locations. (Quick Lubes)The points are clearly clustered, but how big should the market area be?

41
Step 2: Spatial Statistics Tools

42
Step 2: Spatial Statistics Tools
43
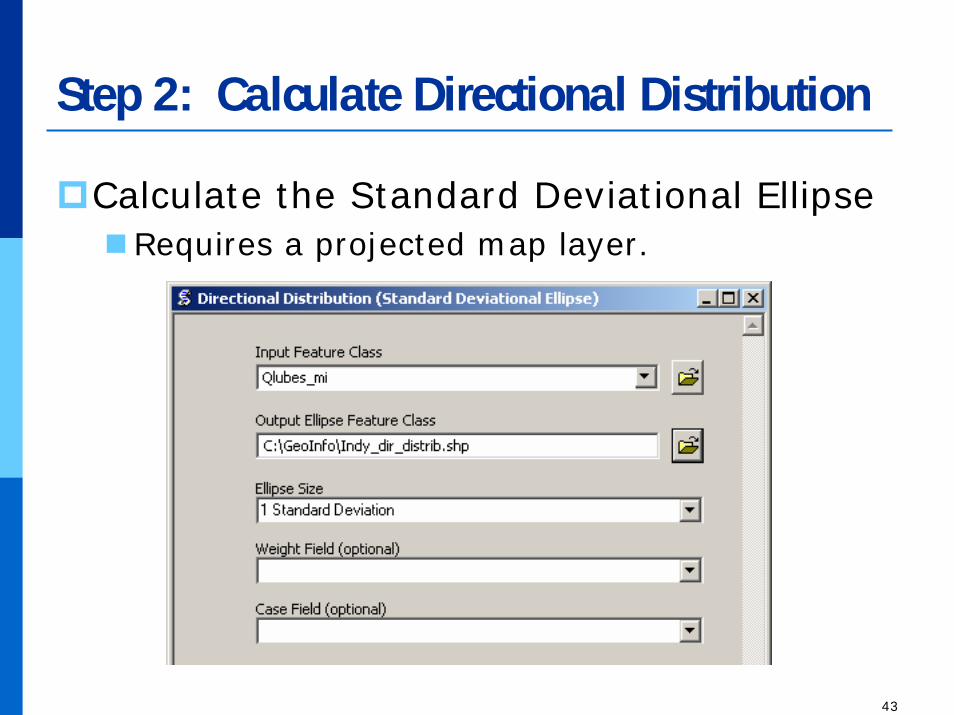
Step 2: Calculate Directional Distribution
Calculate the Standard Deviational EllipseRequires a projected map layer.

44
Step 2: Calculate Directional Distribution
The ellipse helps to define the market area.
45
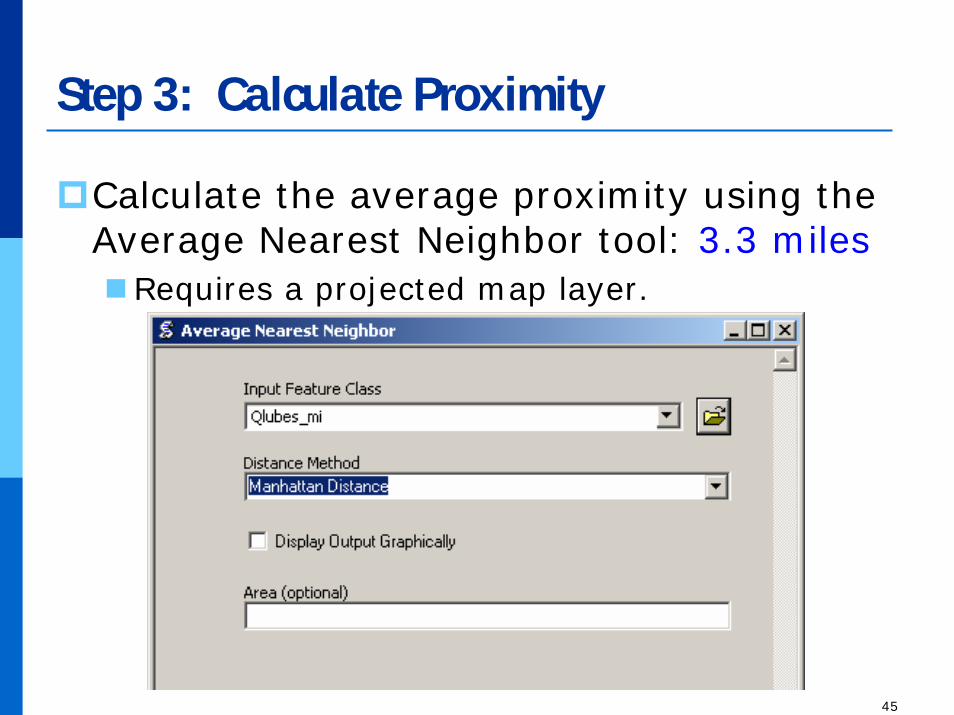
Step 3: Calculate Proximity
Calculate the average proximity using the Average Nearest Neighbor tool: 3.3 miles
Requires a projected map layer.

46
3-Mile Grid with Population 18+
20,010 - 33,280
10,010 - 20,000
5,001 - 10,000
1,001 - 5,000
0 - 1,000
2006 Total Pop 18+3-Mile Grid
47
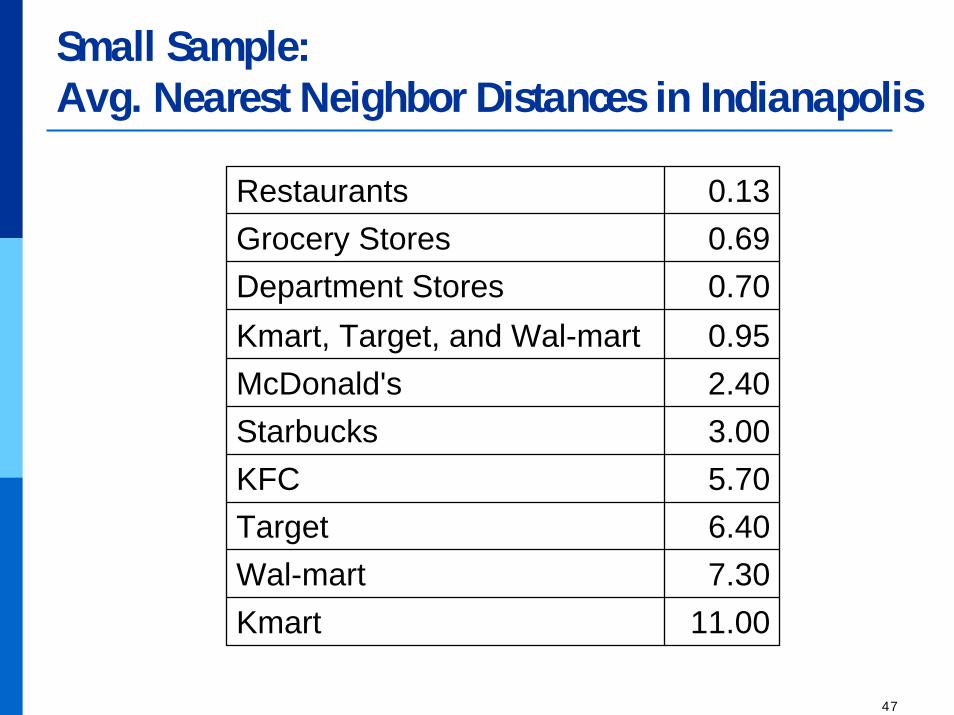
Small Sample:Avg. Nearest Neighbor Distances in Indianapolis
Restaurants 0.13Grocery Stores 0.69Department Stores 0.70Kmart, Target, and Wal-mart 0.95McDonald's 2.40Starbucks 3.00KFC 5.70Target 6.40Wal-mart 7.30Kmart 11.00

48
More Work Is Needed
More industriesMore marketsComparison of similar market areas
E.g. Using a “Threshold Ring” for CBSA centroids to generate rings of equal population and then use “Find Similar” to find those that have the same population density.

49
Point Proximity Analysis–A Tool for “Bigger Box” Thinking
“Innovation is not just about connecting dots in a new way.
It's also about picking the right dots and, as Steve Jobs has pointed out,
having a lot of dots to connect.”-Anders Hemre
http:/thoughtblender.blogspot.com/2006/09/connecting-dots-and-thinking-inside.html
http://www.wired.com/wired/archive/4.02/jobs.html?pg=8&topic=

50
References
1. Gilbert, Daniel. Stumbling on Happiness. Vintage Books, 1st edition, January 2007, p. 139.
2. Gilbert, Daniel. TED Talks Video: Dan Gilbert: Why are we happy? Why aren't we happy? Technology Entertainment Design Conference, February 2004. http://www.ted.com/index.php/talks/view/id/97
3. Heming, Hans Henrik H. Is “Outside-the-box” thinking always recommendable?, August 3, 2005. http://www.cph127.com/cph127/2005/08/is_outsidethebo.html
4. Clarke, Peter and Jeff George. Big Box Thinking: Overcoming Barriers to Creativity in Manufacturing DMI Review, Vol. 16, No. 2, Spring 2005. http://www.dmi.org/dmi/html/publications/journal/fullabstract_d.jsp?itemID=05162CLA42
5. Lueck, Sarah and Jane Zhang. Give Us Your Sick . . . The Wall Street Journal, October 21, 2006. Reprint: http://webreprints.djreprints.com/1583770724499.pdf
6. De Bono, Edward. Weekly Message, Week 20, 2003. http://www.edwarddebono.com/WeeklyMessage.php, http://www.edwarddebono.com/about.htm
7. Hemre, Anders. Connecting the Dots and Thinking Inside the Box. MindMatters, September 10, 2006. http://thoughtblender.blogspot.com/2006/09/connecting-dots-and-thinking-inside.html
8. Wolfe, Gary. Steve Jobs: The Next Insanely Great Thing. The Wired Interview, Issue 4.02 - Feb 1996. http://www.wired.com/wired/archive/4.02/jobs.html?pg=8&topic=
9. Richardsona. Wicked problems: Beyond Innovation, February 13, 2006 http://www.cph127.com/cph127/design_process/index.html

Questions?
Author Contact Information:Susan Zwillinger
Director, Training & Customer ServicesThinformation, Inc.
1370 Washington Pike, Suite 304Bridgeville, PA 15017
Phone: 412-257-8774 x27Fax: 412-257-8815