Valmet becomes stronger as a result of acquiring Process ... · as a result of acquiring Process...
89
Valmet becomes stronger as a result of acquiring Process Automation Systems Roadshow material February 2015 Capital Markets Day 2015 March 19, London www.valmet.com/cmd
Transcript of Valmet becomes stronger as a result of acquiring Process ... · as a result of acquiring Process...

Valmet becomes stronger as a result of acquiring Process Automation Systems
Roadshow material
February 2015
Capital Markets Day 2015
March 19, London
www.valmet.com/cmd

AgendaValmet Roadshow
Valmet overview
Investment highlights
Financials
Acquisition of Process Automation Systems
1
2
3
4
Conclusions5
Appendix6

Valmet overview
© Valmet4
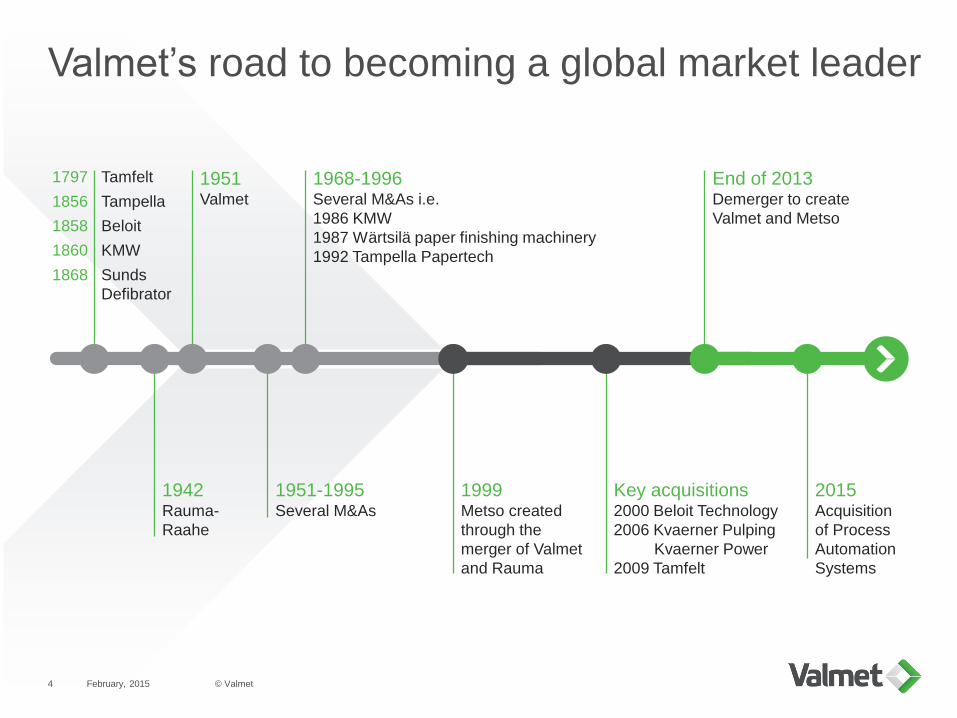
Valmet’s road to becoming a global market leader
February, 2015
1942Rauma-
Raahe
1951Valmet
1951-1995Several M&As
1968-1996Several M&As i.e.
1986 KMW
1987 Wärtsilä paper finishing machinery
1992 Tampella Papertech
1999Metso created
through the
merger of Valmet
and Rauma
Key acquisitions2000 Beloit Technology
2006 Kvaerner Pulping
Kvaerner Power
2009 Tamfelt
End of 2013Demerger to create
Valmet and Metso
1797 Tamfelt
1856 Tampella
1858 Beloit
1860 KMW
1868 Sunds
Defibrator
2015Acquisition
of Process
Automation
Systems

Capitalizing on the growing pulp, energy, tissue, and packaging board needs globally
February, 2015 © Valmet5
40%
39%
21%
Net sales (2014)Global market leader with
#1-2 market positions in all
markets served
Stable, growing and profitable
EUR 1 billion services business
High barrier to entry capital
business with good long-term
growth potential in businesses
such as board, tissue, pulp, and
biotechnology
2014 figures
Orders received EUR 3,071 m
Net sales EUR 2,473 m
EBITA1 EUR 106 m
Employees 10,464
Market position
#1-2 Services
#1-2 Pulping
#1-2 Bioenergy generation
#1-2 Paper, board, tissue
1) EBITA before non-recurring items
Services
Pulp and EnergyPaper
18%
13%
43%
11%
15%
North America
EMEA
South America
Asia-Pacific
China

877 974 1,011 1,032 989
2010 2011 2012 2013 2014
698975
1,198907 956
2010 2011 2012 2013 2014
875 743 805 674 528
2010 2011 2012 2013 2014
Our three business lines serve the samecustomer base
February, 2015 © Valmet6
1) Estimated market size for current offering in 2012 (EUR)
2) Net sales 2010–2013 by business line on a carve-out basis for the periods indicated (excl. Intra-Metso net sales)
Description Mill and plant improvements, roll and
workshop services, parts and fabrics,
and life-cycle services
Technologies and solutions for pulp
production, power generation, and
biomass conversion
Technologies and solutions for
board, tissue, and paper
Market position #1-2 Pulping #1-2,
Bioenergy generation #1-2
Board #1-2, Tissue #1,
Paper #1-2
Market size1 EUR 7 bn Pulp EUR 1.4 bn,
Energy EUR 2.0 bn
Board EUR 1.0 bn, Tissue EUR 0.6
bn, Paper EUR 0.6 bn
Customers Companies mainly in the pulp, paper
and energy industries
In pulp, mechanical and chemical
pulp producers as well as companies
in the panelboard industry
Mainly paper companies as well as
board and tissue producers
Main competitors Voith, Andritz, Xerium Technologies,
AstenJohnson, Foster Wheeler,
Alstom etc.
Andritz in Pulp; Andritz and Foster
Wheeler in Energy; Andritz main
global competitor in biomass
Voith and Andritz
Net sales2 1.0 bn, 40% 1.0 bn, 39% 0.5 bn, 21%
Services Pulp and Energy Paper

Strong global presence – good platformfor growth
February, 2015 © Valmet7
North America• Large installed base
to be serviced
• Growth opportunity in
increased outsourcing
• Capital project oppor-
tunities in tissue
and board
South America• Capital project opportunities
in pulp, tissue and bioenergy
• Good services growth potential
EMEA• Large installed base to
be serviced
• Growth opportunity in
increased outsourcing
• Machine closures in printing
and writing
• Capital project opportunities
in pulp, tissue, and bioenergy
Asia Pacific• Capital project
opportunities in pulp,
tissue, and board
• Good services market
with growth potential
China• Capital project opportunities
in board and tissue
• Good services market
with growth potentialNet sales1)
EUR 449 m
Net sales1)
EUR 381 m
Net sales1)
EUR 325 m
Net sales1)
EUR 266 m
Net sales1)
EUR 1,053 m432
employees
6,376
employees
588
employees
1,141
employees
1,927
employees
1) Net sales breakdown by area for 2014. Breakdown of employees by area as at December 31, 2014.

© Valmet8 February, 2015
Valmet’s way forward
Our Must-Wins
Customer excellence
Leader in technology
and innovation
Excellence in processes
Winning team
Our Vision
To become the global
champion in serving our
customersOur Strategy
Valmet develops and
supplies competitive
technology and services to
the pulp, paper and energy
industries.
We are committed to
moving our customers’
performance forward.
Our Mission
Converting renewable
resources into sustainable
results
Our Values create and strengthen our culture
Customers - We move our customers’ performance forward
Renewal – We promote new ideas to create the future
Excellence – We improve every day to deliver results
People – We work together to make a difference
Megatrends
Need for renewable solutions
Bio-economy and climate change
Increase in standards of living

Investment highlights
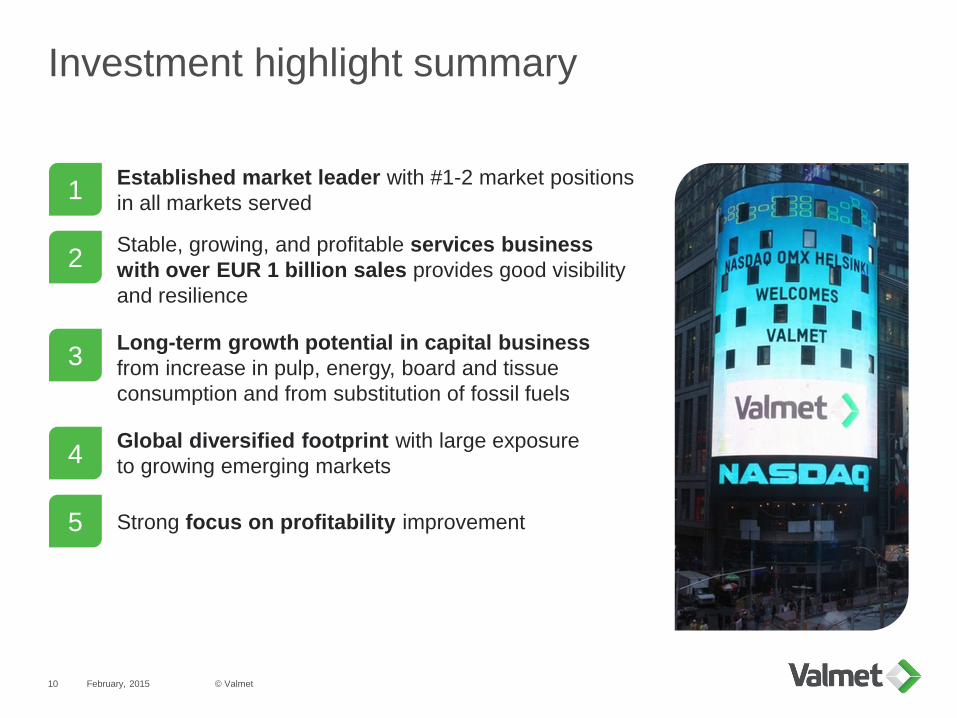
Investment highlight summary
© Valmet10
Established market leader with #1-2 market positions
in all markets served
Stable, growing, and profitable services business
with over EUR 1 billion sales provides good visibility
and resilience
Long-term growth potential in capital business
from increase in pulp, energy, board and tissue
consumption and from substitution of fossil fuels
Global diversified footprint with large exposure
to growing emerging markets
Strong focus on profitability improvement
1
2
3
4
5
February, 2015

Established market leader with #1-2 market positions in all markets served
11
Market position
Services #1-2 Pulping #1-2 Bioenergy generation #1-2 Board #1-2
Tissue #1
Paper #1-2
Machines
• 3,800 pulp and paper mills
in the world
• Over 50% purchase services
from Valmet
Large installed base
• 200 wood-handling systems
• 470 cooking systems
• 300 complete fiber lines
• 400 evaporation systems
• 350 recovery islands
• 200 mechanical pulping lines
• 270 fluidized bed boilers
• 120 BioGrate boilers
• 400 environmental protection
systems
• 700 board machines
• 180 tissue machines
• 900 paper machines
Consistent investments in R&D
2014: EUR 42 m (1.7% of sales)
Extensive IP portfolio
~1,800 protected inventions
>70 new products launched per year
Pulp Energy Paper
1) Net sales in 2014.
1
Superior technological know-how
February, 2015 © Valmet
Services (~EUR 1 bn)1 Capital (~EUR 1.5 bn)1

EUR 1 billion of net sales from stable and growing services
Strong trends driving services
market expansion
Customers outsource non-core
operations
Capacity increases in China,
South America and Asia-Pacific
Customer cost pressure and efficiency
requirements increase demand for
process improvements and maintenance
services
Machine closures in EMEA region
and North America
Large target market1
Comprehensive offering
12
1) Management estimate based on the size of Valmet’s services markets using an average services cost per volume produced, based on
Valmet’s existing customers and estimates of current and forecasted growth in total production volumes
2) Annual growth between 2010 and 2014 based on actual figures and available carve-out financials
>3.1%
2010-2014
p.a.2
2
EUR 7.0 bnValmet services
business line growth
February, 2015 © Valmet
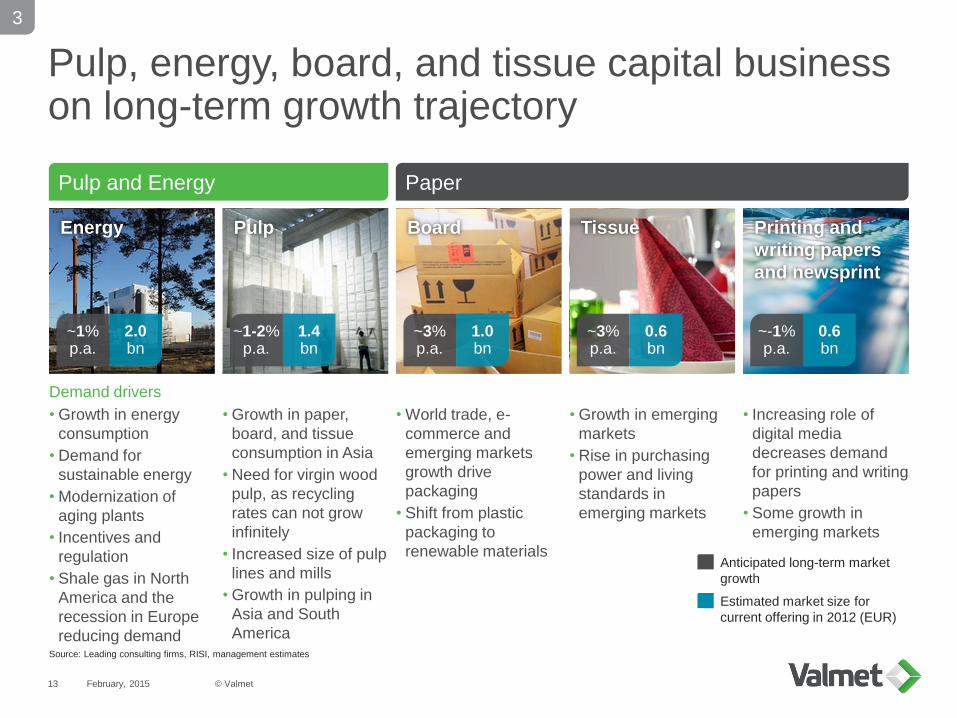
Energy
Pulp, energy, board, and tissue capital business on long-term growth trajectory
13
Source: Leading consulting firms, RISI, management estimates
Estimated market size for
current offering in 2012 (EUR)
• Growth in energy
consumption
• Demand for
sustainable energy
• Modernization of
aging plants
• Incentives and
regulation
• Shale gas in North
America and the
recession in Europe
reducing demand
• Growth in paper,
board, and tissue
consumption in Asia
• Need for virgin wood
pulp, as recycling
rates can not grow
infinitely
• Increased size of pulp
lines and mills
• Growth in pulping in
Asia and South
America
• World trade, e-
commerce and
emerging markets
growth drive
packaging
• Shift from plastic
packaging to
renewable materials
• Growth in emerging
markets
• Rise in purchasing
power and living
standards in
emerging markets
• Increasing role of
digital media
decreases demand
for printing and writing
papers
• Some growth in
emerging markets
Anticipated long-term market
growth
Demand drivers
BoardPulp Tissue Printing and
writing papers
and newsprint
~1%p.a.
2.0bn
~1-2%p.a.
1.4bn
~3%p.a.
1.0bn
~3%p.a.
0.6bn
~-1%p.a.
0.6bn
3
February, 2015 © Valmet
Pulp and Energy Paper
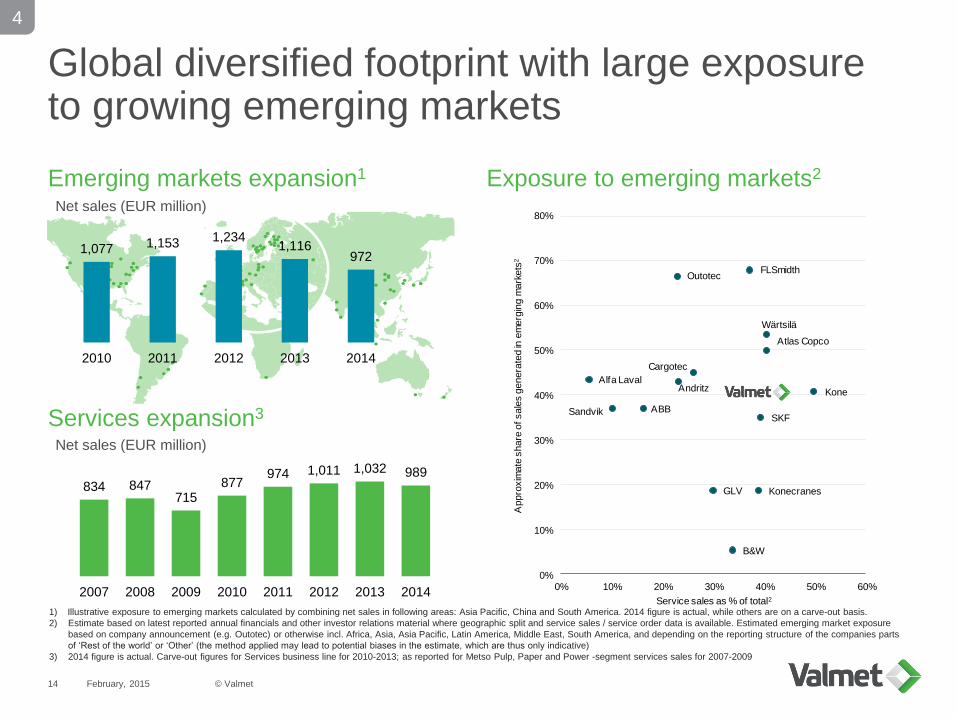
834 847715
877974 1,011 1,032 989
2007 2008 2009 2010 2011 2012 2013 2014
Global diversified footprint with large exposure to growing emerging markets
Services expansion3
Exposure to emerging markets2
14
Cargotec
Kone
Konecranes
Outotec
Wärtsilä
ABB
Alfa Laval
Atlas Copco
SandvikSKF
FLSmidth
Andritz
GLV
B&W
0%
10%
20%
30%
40%
50%
60%
70%
80%
0% 10% 20% 30% 40% 50% 60%
Appro
xim
ate
share
of sale
s g
enera
ted in
em
erg
ing m
ark
ets
2
Service sales as % of total2
1) Illustrative exposure to emerging markets calculated by combining net sales in following areas: Asia Pacific, China and South America. 2014 figure is actual, while others are on a carve-out basis.
2) Estimate based on latest reported annual financials and other investor relations material where geographic split and service sales / service order data is available. Estimated emerging market exposure
based on company announcement (e.g. Outotec) or otherwise incl. Africa, Asia, Asia Pacific, Latin America, Middle East, South America, and depending on the reporting structure of the companies parts
of ‘Rest of the world’ or ‘Other’ (the method applied may lead to potential biases in the estimate, which are thus only indicative)
3) 2014 figure is actual. Carve-out figures for Services business line for 2010-2013; as reported for Metso Pulp, Paper and Power -segment services sales for 2007-2009
Emerging markets expansion1
4
Net sales (EUR million)
Net sales (EUR million)
February, 2015 © Valmet
1,077 1,153 1,2341,116
972
2010 2011 2012 2013 2014

Strong focus on profitability improvement
February, 2015 © Valmet15
5
Improve project
and service
margin
• Harmonization of
processes
• Localization of
competencies
• Better selection of
sales cases
• Development in
project
management
• Common quality
development
approach
• Quality tools and
processes
• Highlight the
importance of
quality initiatives
and accountability
Reduce quality
costs and lead
times
• Increase sourcing
from cost
competitive
countries
• Increase use of
sub-contracting
• Consolidation of
shipment and
warehouse
network
Savings in
procurement
Continue to
improve cost
competitiveness
• Focus on cost
competitiveness
also after the
EUR 100 million
program
Improve product
cost
competitiveness
to increase gross
profit
• Focus on cost
efficient design
• Modularity and
standardization
Key Must-Win objectives to improve profitability to the targeted level of
6–9%

Financials

Dividend
policy
Financial targets
February, 2015 © Valmet17
Profitability
Growth
ROCE
Net sales growth to exceed market growth
EBITA1 before non-recurring items: 6-9%
Return on capital employed (pre-tax),
ROCE 2: minimum of 15%
Dividend payout at least 40% of net profit
1) EBITA before non-recurring items = operating profit + amortization + non-recurring items
2) ROCE (pre-tax) = ( profit before taxes + interests and other financial expenses ) / ( balance sheet total - non-interest-bearing liabilities )

February, 2015 © Valmet18
Q4/2014 in brief
• Orders received increased by 17%
• Services net sales stable
• EBITA1 increased in Q4/2014 compared with Q4/2013
• Profitability improved in every quarter of 2014
• Further profitability improvement potential through savings in procurement and quality, by actions
to improve project and service margin, by continuing to improve cost competitiveness, and by
improving product cost competitiveness to increase gross profit
• Orders received increased in Paper and decreased in Pulp and Energy
• Net sales increased in Paper, and Pulp and Energy
Orders received increased in capital business
Profitability reached the targeted range in Q4/2014
Balance sheet continues to be strong
• Net debt EUR -166 million, and gearing -21%
• Cash flow provided by operating activities EUR 30 million in Q4/2014
Orders received increased in services in Q4/2014
• Order backlog approximately EUR 2 billion at the end of 2014
Order backlog decreased compared with Q3/2014
1) EBITA before non-recurring items

February, 2015 © Valmet19
Key figures Q4/2014
Non-recurring items: EUR -5 million in Q4/2014 (EUR -34 million in Q4/2013)
EUR -12 million in 2014 (EUR -86 million in 2013)
1) Before non-recurring items
2) After non-recurring items
3) Proposal made by the Board of Directors
EUR million Q4/2014 Q4/2013 Change 2014 2013 Change
Orders received 480 428 12% 3,071 2,182 41%
Order backlog 1,998 1,398 43%
Net sales 777 666 17% 2,473 2,613 -5%
EBITA1 48 -25 106 54 94%
% of net sales 6.1% -3.7% 4.3% 2.1%
EBIT2 38 -66 72 -59
% of net sales 4.8% -9.9% 2.9% -2.2%
Earnings per share, EUR 0.17 -0.41 0.31 -0.42
Return on capital employed (ROCE), before taxes 9% -4%
Dividend per share, EUR 0.253 0.15
Cash flow provided by operating activities 30 -38 236 -43
Gearing at the end of period -21% 0%
The comparison figures are based on financial carve-out
data. The balance sheet and its related key figures as at
December 31, 2013 are based on actual figures.

February, 2015 © Valmet20
121 94 104 95185
82 135 88
69
402
20 4224 194 23 40
212
214
201 178
437
567
189 277
33
103
31 74
34
120
53 34
76
47
27 39
42260
66 41
511
861
382428
1,1011,023
466 480
0
500
1,000
1,500
2,000
2,500
3,000
3,500
0
200
400
600
800
1,000
1,200
1,400
Q1/13 Q2/13 Q3/13 Q4/13 Q1/14 Q2/14 Q3/14 Q4/14
North America (LHS) South America (LHS)EMEA (LHS) China (LHS)Asia-Pacific (LHS) Last 4 quarters (RHS)
282 281 237 233 267 273 242 273
61
452
66 102
622 560
96 66
168
128
80 93
212190
128 142
511
861
382428
1,1011,023
466 480
0
500
1,000
1,500
2,000
2,500
3,000
3,500
0
200
400
600
800
1,000
1,200
1,400
Q1/13 Q2/13 Q3/13 Q4/13 Q1/14 Q2/14 Q3/14 Q4/14
Services (LHS) Pulp and Energy (LHS)
Paper (LHS) Last 4 quarters (RHS)
Orders received exceeded EUR 3 billion in 2014
Development in Q4/2014 compared with Q4/2013:
• Orders received increased in Services
• Orders received decreased in Pulp and Energy
• Orders received increased in Paper
• Orders received increased in EMEA and Asia-Pacific and decreased in China and
North America
Orders received (EUR million),
by business line
Orders received (EUR million),
by area

February, 2015 © Valmet21
1,807 1,883
1,658
1,398
1,972
2,4062,312
1,998
0
500
1,000
1,500
2,000
2,500
3,000
Q1/13 Q2/13 Q3/13 Q4/13 Q1/14 Q2/14 Q3/14 Q4/14
Order backlog approximately EUR 2 billion
• Management estimates that ~80% of the order backlog will be recognized as net
sales during 2015
• Approximately 20% of the order backlog relates to the Services business line
Order backlog (EUR million)
~20%
~80%
Services business Capital business
Structure of order backlog

February, 2015 © Valmet22
243 256 256 274224 251 235 278
631
714
601
666
519
588 590
777
4.1%3.1%
5.1%
-3.7% 0.7%
3.7%
5.5% 6.1%
Q1/13 Q2/13 Q3/13 Q4/13 Q1/14 Q2/14 Q3/14 Q4/14
Services
Capital
EBITA-%
EBITA margin in the targeted range in Q4/2014
EBITA target 6–9%
Net sales and EBITA before NRI (EUR million)
• Net sales increased compared with Q4/2013
• Profitability improved in every quarter of 2014
EBITA before
NRI (EUR million)22 31 -25 4 2226 32 48

February, 2015 © Valmet23
0%
5%
10%
15%
20%
25%
30%
35%
0
20
40
60
80
100
120
140
160
Q1/2
013
Q2/2
013
Q3/2
013
Q4/2
013
Q1/2
014
Q2/2
014
Q3/2
014
Q4/2
014
EUR million (LHS) % of net sales (RHS)
0%
5%
10%
15%
20%
25%
30%
35%
0
20
40
60
80
100
120
140
Q1/2
013
Q2/2
013
Q3/2
013
Q4/2
013
Q1/2
014
Q2/2
014
Q3/2
014
Q4/2
014
EUR million (LHS) % of net sales (RHS)
Good development in gross profit – SG&A at a normalized level
Gross profit (EUR million and % of net sales)
• Selling, general and administrative expenses (SG&A) at an annual level of
approximately EUR 400 million
- SG&A in relation to net sales decreased in every quarter of 2014
• Gross profit improved
• Further actions to improve gross profit through Must-Win implementation
SG&A (EUR million and % of net sales)

February, 2015 © Valmet24
282 281
237 233
267 273242
273
0
200
400
600
800
1,000
1,200
0
50
100
150
200
250
300
Q1/1
3
Q2/1
3
Q3/1
3
Q4/1
3
Q1/1
4
Q2/1
4
Q3/1
4
Q4/1
4
Orders received (LHS)
Orders received, last 4 quarters (RHS)
243 256 256274
224251
235
278
0
200
400
600
800
1,000
1,200
0
50
100
150
200
250
300
Q1/1
3
Q2/1
3
Q3/1
3
Q4/1
3
Q1/1
4
Q2/1
4
Q3/1
4
Q4/1
4
Net sales (LHS)
Net sales, last 4 quarters (RHS)
Services orders received stable in 2014, growth in Q4/2014
Net sales (EUR million)Orders received (EUR million)
• Services orders received increased compared with Q4/2013
- Orders received increased in all areas, especially in North America
- Orders received increased in the Energy and Environmental, Mill
Improvements, and Performance Parts business units, and remained on a
par with the comparison period in Rolls, and Fabrics business units
• Orders received stable in 2014 compared with 2013
• Net sales stable compared with Q4/2013
2014:
EUR 1,055 million
2013:
EUR 1,035 million
2014:
EUR 989 million
2013:
EUR 1,032 million

February, 2015 © Valmet25
61
452
66 102
622560
96 66
0
200
400
600
800
1,000
1,200
1,400
1,600
0
100
200
300
400
500
600
700
800
Q1/1
3
Q2/1
3
Q3/1
3
Q4/1
3
Q1/1
4
Q2/1
4
Q3/1
4
Q4/1
4
Orders received (LHS)
Orders received, last 4 quarters (RHS)
221240
206240
181
229 234
312
0
200
400
600
800
1,000
1,200
1,400
1,600
0
50
100
150
200
250
300
350
400
Q1/1
3
Q2/1
3
Q3/1
3
Q4/1
3
Q1/1
4
Q2/1
4
Q3/1
4
Q4/1
4
Net sales (LHS)
Net sales, last 4 quarters (RHS)
Pulp and Energy orders received almost doubled in 2014
Net sales (EUR million)Orders received (EUR million)
• Orders received decreased compared with Q4/2013
- Orders received decreased in all areas
- Orders received increased in Energy and decreased in Pulp
• Orders received almost doubled in 2014 compared with 2013
• Net sales increased compared with Q4/2013
2013:
EUR 907 million
2013:
EUR 680 million
2014:
EUR 956 million
2014:
EUR 1,344 million
February, 2015 © Valmet26
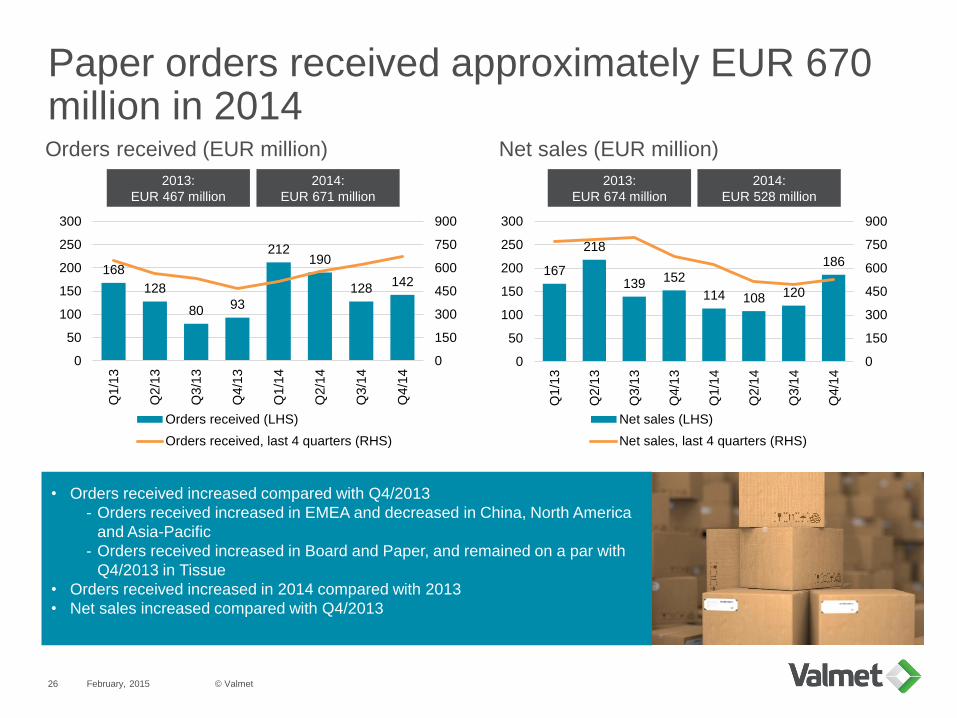
168
128
80 93
212190
128142
0
150
300
450
600
750
900
0
50
100
150
200
250
300
Q1/1
3
Q2/1
3
Q3/1
3
Q4/1
3
Q1/1
4
Q2/1
4
Q3/1
4
Q4/1
4
Orders received (LHS)
Orders received, last 4 quarters (RHS)
167
218
139152
114 108 120
186
0
150
300
450
600
750
900
0
50
100
150
200
250
300
Q1/1
3
Q2/1
3
Q3/1
3
Q4/1
3
Q1/1
4
Q2/1
4
Q3/1
4
Q4/1
4
Net sales (LHS)
Net sales, last 4 quarters (RHS)
Paper orders received approximately EUR 670 million in 2014
Net sales (EUR million)Orders received (EUR million)
2013:
EUR 674 million
2013:
EUR 467 million
• Orders received increased compared with Q4/2013
- Orders received increased in EMEA and decreased in China, North America
and Asia-Pacific
- Orders received increased in Board and Paper, and remained on a par with
Q4/2013 in Tissue
• Orders received increased in 2014 compared with 2013
• Net sales increased compared with Q4/2013
2014:
EUR 528 million
2014:
EUR 671 million

February, 201527 © Valmet
Dividend proposal
Dividend payout at least 40% of net profit
Board of Directors’ dividend proposal to the
Annual General Meeting
EUR 0.25 per share
Dividend policy

February, 201528 © Valmet
Satisfactory
Guidance and short-term market outlook
Pulp and
Energy
Paper
Satisfactory
Pulp
Energy
Board and Paper
Tissue
Guidance for
2015
Services
Short-term market outlook
Guidance for 2015
Satisfactory
Satisfactory
Satisfactory
Satisfactory
Satisfactory
Satisfactory
Satisfactory
Good
Satisfactory
Q1/2014 Q2/2014
Satisfactory
Satisfactory
Satisfactory
Good
Satisfactory
Q3/2014
Satisfactory
Satisfactory
Good
Satisfactory
Q4/2014
Valmet estimates that, including the acquisition of Process Automation
Systems1, net sales in 2015 will increase in comparison with 2014 (EUR
2,473 million) and EBITA before non-recurring items in 2015 will increase in
comparison with 2014 (EUR 106 million).
1) The completion of the acquisition of Process Automation Systems
is subject to approval by the competition authorities.

Acquisition of Process Automation Systems

Valmet becomes a stronger company
February, 2015 © Valmet30
The acquisition has an excellent strategic fit
Process Automation Systems is a strong, established business
Combination of Valmet and Process Automation Systems creates
a unique customer offering
Acquisition makes Valmet more stable and more profitable

February, 2015 © Valmet31
Combination of Valmet and Process Automation Systems creates a unique customer offering
Valmet becomes a technology
and service company with full
automation offering
Strengthened competitiveness
from combining paper, pulp
and power plant technology,
process know-how and
automation
Full scope offering gives better
differentiation from competitors
80% of Process Automation
Systems’ sales to Valmet’s
current customer industries
Process
technology
Services Automation
Valmet becomes a unique company
Customer

February, 2015 © Valmet32
Process Automation Systems is a strong, established business
Long-term customer relations
High level of technology and
know-how
Strong service business, based
on large installed base and
captive business model
~1,600 automation professionals
working close to customers at ~80
locations around the world
Significant proprietary know-how
Good financial track record and
stable cash flow

Improving profitability
Process Automation Systems has
solid financial track record
- Relatively stable margins during the last 10
years, EBITA margin 10–12%
- Stable net sales, with slight growth
Increases Valmet’s profitability
- Valmet’s financial target: EBITA margin of
6–9%
Strengthens Valmet’s differentiation
from competitors
No significant cost synergies
Increasing stability
Valmet will have approximately EUR
1,300 million of stable business
- Existing services EUR 1,000 million
- Process Automation Systems EUR 300 million
February, 2015 © Valmet33
Increasing stability and improving profitability
1) Illustrative net sales split when Valmet and Process Automation Systems combined (2013 figures).
Illustrative net sales (2013)1
35%
31%
23%
10%
ServicesPulp and EnergyPaperProcess Automation Systems
16%
16%
44%
14%
11%
North America South AmericaEMEA ChinaAsia-Pacific

Conclusion

Valmet becomes a unique market leader
February, 2015 © Valmet35
Services
#1-23,800 pulp and
paper mills in the
world, of which over
50% purchase
services from
Valmet
Energy
#1-2
Paper
#1-2
Pulp
#1-2200 wood-handling
systems
470 cooking
systems
300 complete fiber
lines
400 evaporation
systems
350 recovery islands
200 mechanical
pulping lines
270 fluidized bed
boilers
120 BioGrate boilers
400 environmental
protection
systems
700 board machines
180 tissue machines
900 paper machines
4,500 delivered
automation systems
40,000 analyzers
and measurements
delivered
professionals working close to customers~12,000
Process Automation
#1-3

Important notice
IMPORTANT: You must read the following before continuing. The following applies to this document, the oral presentation of the information in this document by Valmet (the
“Company”) or any person on behalf of the Company, and any question-and-answer session that follows the oral presentation (collectively, the “Information”). In accessing the
Information, you agree to be bound by the following terms and conditions.
The Information is not directed to, or intended for distribution to or use by, any person or entity that is a citizen or resident of, or located in, any locality, state, country or other
jurisdiction where such distribution or use would be contrary to law or regulation or which would require any registration or licensing within such jurisdiction. The Information is not for
publication, release or distribution in the United States, the United Kingdom, Australia, Canada or Japan.
The Information does not constitute or form part of, and should not be construed as an offer or the solicitation of an offer to subscribe for or purchase any securities, and nothing
contained therein shall form the basis of or be relied on in connection with any contract or commitment whatsoever, nor does it constitute a recommendation regarding any securities.
Prospective investors are required to make their own independent investigations and appraisals of the business and financial condition of the Company before taking any investment
decision with respect to securities of the Company. Prospective investors should make any investment decision solely on the basis of the information contained in the demerger
prospectus published on September 23, 2013 and any stock exchange releases regarding the Company following the publication of the demerger prospectus.
No securities of the Company are being offered or sold, directly or indirectly, in or into the United States and no shares in the Company have been, or will be, registered under the
Securities Act of 1933, as amended (the “Securities Act”), or under the securities laws of any state of the United States and, accordingly, may not be offered or sold, directly or
indirectly, in or into the United States (as defined in Regulation S under the Securities Act), unless registered under the Securities Act or pursuant to an exemption from the
registration requirements of the Securities Act and in compliance with any applicable state securities laws of the United States.
The Information is directed solely at: (i) persons outside the United Kingdom, (ii) persons with professional experience in matters relating to investments falling within Article 19(5) of
the Financial Services and Markets Act 2000 (Financial Promotion) Order 2005 as amended (the “Order”), (iii) high net worth entities, and other persons to whom it may lawfully be
communicated, falling within Article 49(2)(a) to (d) of the Order and (iv) persons to whom an invitation or inducement to engage in investment activity (within the meaning of section
21 of the Financial Services and Markets Act 2000) in connection with the issue or sale of any securities of the Company or any member of its group may otherwise lawfully be
communicated or caused to be communicated (all such persons in (i)-(iv) above being “Relevant Persons”). Any investment activity to which the Information relates will only be
available to and will only be engaged with Relevant Persons. Any person who is not a Relevant Person should not act or rely on the Information. By accessing the Information, you
represent that you are a Relevant Person.
The Information contains forward-looking statements. All statements other than statements of historical fact included in the Information are forward-looking statements. Forward-
looking statements give the Company’s current expectations and projections relating to its financial condition, results of operations, plans, objectives, future performance and
business. These statements may include, without limitation, any statements preceded by, followed by or including words such as “target,” “believe,” “expect,” “aim,” “intend,” “may,”
“anticipate,” “estimate,” “plan,” “project,” “will,” “can have,” “likely,” “should,” “would,” “could” and other words and terms of similar meaning or the negative thereof. Such forward-
looking statements involve known and unknown risks, uncertainties and other important factors beyond the Company’s control that could cause the Company’s actual results,
performance or achievements to be materially different from the expected results, performance or achievements expressed or implied by such forward-looking statements. Such
forward-looking statements are based on numerous assumptions regarding the Company’s present and future business strategies and the environment in which it will operate in the
future.
No representation, warranty or undertaking, express or implied, is made as to, and no reliance should be placed on, the fairness, accuracy, completeness or correctness of the
Information or the opinions contained therein. The Information has not been independently verified and will not be updated. The Information, including but not limited to forward-
looking statements, applies only as of the date of this document and is not intended to give any assurances as to future results. The Company expressly disclaims any obligation or
undertaking to disseminate any updates or revisions to the Information, including any financial data or forward-looking statements, and will not publicly release any revisions it may
make to the Information that may result from any change in the Company’s expectations, any change in events, conditions or circumstances on which these forward-looking
statements are based, or other events or circumstances arising after the date of this document. Market data used in the Information not attributed to a specific source are estimates
of the Company and have not been independently verified.
February, 2015 © Valmet36

Appendix
Management, ownership and share price development
Financials
Process Automation Systems
1
2
3
Market statistics4
AppendixManagement, ownership and share price development

Experienced management team
© Valmet39
1) Includes 100 shares in Valmet owned by Ms. Salonsaari-Posti’s family members
2) Includes 100 shares in Valmet owned by Mr. Tiitinen’s family members
Corporate
Business
lines
Areas
23
Pasi LainePresident and CEO
Share ownership: 30,046
23
6
Markku HonkasaloChief Financial Officer
Share ownership: 700
1
2
Kari SaarinenSVP, Strategy and
Operational Development
Share ownership: -
2
10
Julia MachareySVP, Human Resources
Share ownership: -
1
19
Anu Salonsaari-PostiSVP, Marketing &
Communications
Share ownership1: 100
1
24
Jukka TiitinenBusiness Line President,
Services
Share ownership2: 13,748
24
17
Bertel KarlstedtBusiness Line President, Pulp
and Energy
Share ownership: 0
17
26
Jari VähäpesolaBusiness Line President,
Paper
Share ownership: 5,013
26
37
William BohnArea President, North
America
Share ownership: -
20
27
Celso TaclaArea President, South
America
Share ownership: 4,740
19
37
Hannu MälkiäArea President, EMEA
Share ownership: 10,559
35
21
Aki NiemiArea President, China
Share ownership: -
19
30
Hannu T. PietiläArea President, Asia Pacific
Share ownership: 1,000
27
# years at Valmet /
its predecessor
# years of experience
in the sector
February, 2015

• MSc in Real Estate Development, Diplom-
Ingenieur in Urban Planning, CFA
charterholder
• Selected experience:
- Partner at Cevian Capital, joined Cevian
Capital in 2008
- Engagement Manager at McKinsey
(2004-2008)
• Share ownership1: 2,305
• Independent of company: Yes
• Independent of owners: not independent
of a significant shareholder
Friederike
Helfer(b. 1976)
Board member
Austrian citizen
Board of Directors
• MSc in Engineering
• Selected experience:
- CoB of Metso since 2009, board
member since 2008
- CoB of Kemira
• Share ownership: 10,820
• Independent of company: Yes
• Independent of owners: Yes
• MSc in Social Sciences
• Selected experience:
- Vice CoB of Metso since 2012, board
member since 2010
- Member of the BoD of Antti Ahlströmin
Perilliset Oy and Sponsor Capital Oy
• Share ownership: 105,636
• Independent of company: Yes
• Independent of owners: Yes
• MSc in Mechanical Engineering
• Selected experience:
- Member of Metso board since 2010
- CoB of Raute Corporation
- President and CEO of Pöyry (1999-
2008)
• Share ownership: 5,484
• Independent of company: Yes
• Independent of owners: Yes
• MSc in Economics, Accounting; LL.M.
• Selected experience:
- Member of the BoD of Saxobank A/S,
Aker Solutions, Volvo PV AB, NKT
Holding A/S, Schneider SE, Bilfinger
Berger SE
• Share ownership: 2,882
• Independent of company: Yes
• Independent of owners: Yes
Jukka
Viinanen(b. 1948)
Chairman of
the Board
Finnish citizen
Mikael Von
Frenckell(b. 1947)
Vice Chairman of
the Board
Finnish citizen
Erkki Pehu-
Lehtonen(b. 1950)
Board member
Finnish citizen
Lone Fønss
Schrøder(b. 1960)
Board member
Danish citizen
• MSc in Engineering
• Selected experience:
- President and CEO of Konecranes
- CoB of Marimekko and Vice COB of the
Federation of Finnish Technology
Industries (CoB in 2011 and 2012)
• Share ownership2: 2,309
• Independent of company: Yes
• Independent of owners: Yes
• BSc in Business Management, MSc in
Business Administration
• Selected experience:
- Member of the BoD of Contax
Participações S.A and HSBC – SRI – FI
– Sustainability Fund
- Member of the Brazilian Institute of
Corporate Governance
• Share ownership: 2,305
• Independent of company: Yes
• Independent of owners: Yes
Pekka
Lundmark(b. 1963)
Board member
Finnish Citizen
Rogério
Ziviani(b. 1956)
Board member
Brazilian citizen
1) Ms. Helfer is employed by Cevian Capital. The
total holding of Cevian funds amounted to
20,813,714 shares in Valmet Corporation on
March 10, 2013.
2) Includes 4 shares in Valmet owned by Mr.
Lundmark’s family members
© Valmet40 February, 2015
The Nomination Board of Valmet Corporation
proposes to the AGM (planned to be held on
March 27, 2015) that Bo Risberg is elected as
the Chairman of the Board.
Bo Risberg (b. 1956, Swedish citizen, BSc
(Mech. Eng), MBA) serves as the Chairman of
the Board of Directors in Piab Group Holding
AB. Before that Risberg worked for Hilti
Corporation during years 1999-2013 of which as
Chief Executive Officer during 2007-2013.

© Valmet41 February, 2015
Largest shareholders on January 31, 2014Based on the information given by Euroclear Finland Ltd.
1) A holding company that is wholly owned by the Finnish State
# Shareholder name Number of shares % of shares and votes
1 Solidium Oy1 16,695,287 11.14%
2 Nordea Funds 5,099,644 3.40%
3 Skagen Global Verdipapirfond 3,202,627 2.14%
4 Ilmarinen Mutual Pension Insurance Company 3,092,126 2.06%
5 Varma Mutual Pension Insurance Company 2,908,465 1.94%
6 The State Pension Fund 1,520,000 1.01%
7 Keva 1,502,166 1.00%
8 Mandatum Life Insurance Company Limited 1,500,307 1.00%
9 Skagen Global II Verdipapirfond 987,963 0.66%
10 Sigrid Jusélius Foundation 610,865 0.41%
10 largest shareholders, total 37,119,450 24.76%
Other shareholders 112,745,169 75.24%
Total 149,864,619 100.00%
Date Shareholder name Number of shares % of shares and votes
November 6, 2014 Nordea Funds Oy 7,240,716 4.83%
October 15, 2014 Franklin Templeton Institutional, LLC 7,517,629 5.02%
March 10, 2014 Cevian Capital Partners Ltd. 20,813,714 13.89%
Flagging notifications

© Valmet42 February, 2015
55.5%
19.5%
11.1%
13.9%
Nominee registered and non-Finnish holders
Finnish institutions, companies and foundations
Solidium Oy
Finnish private investors
1) A holding company that is wholly owned by the Finnish State
Ownership structure on January 31, 2014
Sector Number of shareholders % of total shareholders Number of shares % of shares
Nominee registered and non-Finnish holders 305 0.6% 83,104,132 55.5%
Finnish institutions, companies and foundations 2,764 5.7% 29,278,567 19.5%
Solidium Oy1 0 0.0% 16,695,287 11.1%
Finnish private investors 45,806 93.7% 20,786,633 13.9%
Total 48,875 100.0% 149,864,619 100.0%
The ownership structure is based on the classification of sectors determined by Statistics Finland.

48,000
50,000
52,000
54,000
56,000
58,000
60,000
45%
47%
49%
51%
53%
55%
57%
12/2
01
3
01/2
01
4
02/2
01
4
03/2
01
4
04/2
01
4
05/2
01
4
06/2
01
4
07/2
01
4
08/2
01
4
09/2
01
4
10/2
01
4
11/2
01
4
12/2
01
4
01/2
01
5
Non-Finnish holders (LHS) Total number of shareholders (RHS)
© Valmet43 February, 2015
Share of non-Finnish holders and number of shareholders

© Valmet44 February, 2015
Share price development and trading volume
6.00
7.00
8.00
9.00
10.00
11.00
12.00
01/1
4
01/1
4
01/1
4
02/1
4
02/1
4
03/1
4
03/1
4
04/1
4
04/1
4
05/1
4
05/1
4
06/1
4
06/1
4
07/1
4
07/1
4
07/1
4
08/1
4
08/1
4
09/1
4
09/1
4
10/1
4
10/1
4
11/1
4
11/1
4
12/1
4
12/1
4
01/1
5
01/1
5
01/1
5
Valmet OMX Helsinki (rebased)
012345678
01/1
4
01/1
4
01/1
4
02/1
4
02/1
4
03/1
4
03/1
4
04/1
4
04/1
4
05/1
4
05/1
4
06/1
4
06/1
4
07/1
4
07/1
4
07/1
4
08/1
4
08/1
4
09/1
4
09/1
4
10/1
4
10/1
4
11/1
4
11/1
4
12/1
4
12/1
4
01/1
5
01/1
5
01/1
5
Mil
lio
n s
ha
res
Valmet volume (million shares)

AppendixFinancials

Latest development in sustainability
Valmet has defined a sustainability agenda as part of
the implementation of its business strategy
Valmet has been selected for the world’s leading Dow
Jones Sustainability Index among three (3) other
Finnish companies
Valmet scored high points in CDP climate change
index and was included in the Nordic Climate
Disclosure Leadership Index (CDLI)
Join the discussion to develop Valmet’s sustainability
performance further at Valmet’s website
February, 2015 © Valmet46

February, 2015 © Valmet47
Customer activity increased in 2014
Date Description Business line Country Value
Jan 9 Prehydrolysis system (pilot scale) Pulp and Energy Netherlands Not disclosed
Jan 27 Multi-fuel boiler Pulp and Energy Finland Not disclosed
Jan 31 Upgrade of recovery boiler and power boiler Pulp and Energy Sweden and Bulgaria Not disclosed
Feb 7 Key technology for pulp mill Pulp and Energy Indonesia Approximately EUR 340 million
Feb 10 Paper machine rebuild Paper Austria Not disclosed (typically above EUR 20 million)
Feb 13 Heat recovery steam generator Pulp and Energy Sweden Nearly EUR 10 million
Feb 17 Bleach plant rebuild Pulp and Energy Portugal Not disclosed (typically above EUR 20 million)
Feb 27 Wood-chip-fired heating plant Pulp and Energy Finland Around EUR 27 million
Mar 7 Containerboard line Paper Vietnam Not disclosed
Mar 19 Tissue production line Paper Mexico Not disclosed (typically EUR 20-40 million)
Mar 27 CompactCooking G2 cooking plant Pulp and Energy Sweden About EUR 30 million
Mar 27 Waste to energy boiler Pulp and Energy Sweden Not disclosed
Apr 3 Advantage tissue production line Paper Turkey Not disclosed
Apr 28 Large-scale boiler plant Pulp and Energy Finland Typically one third of the total investment of EUR 260 million.
May 5 Pulp and board production lines Paper, and Pulp and Energy China Around EUR 115 million
May 6 Finalized order agreement for pulp dryers Pulp and Energy Brazil A project of this size and scope is typically valued at EUR 150-200 million.
May 13 Paper machine grade conversion rebuild Paper Finland Around EUR 30 million
May 20 Complete boiler plant Pulp and Energy Hungary About EUR 50 million
May 20 Complete boiler plant Pulp and Energy Czech Republic About EUR 50 million
May 21 Part of a major pulp mill rebuild Pulp and Energy Thailand Around EUR 30 million
May 21 A boiler plant Pulp and Energy Finland Around EUR 30 million
Jun 3 Major rebuild and new equipment for pulp mill Pulp and Energy Sweden Around EUR 200 million
Jun 16 Part of a pulp mill upgrade Pulp and Energy Portugal Not disclosed
Jun 24 New sizing technology Paper Germany Not disclosed
Jun 27 Complete Advantage ThruAir tissue line Paper USA Not disclosed
Announced orders during H1/2014

February, 2015 © Valmet48
Customer activity increased in 2014Announced orders during H2/2014
Date Description Business line Country Value
Jul 2 Advantage DCT 200 tissue line Paper Middle East Not disclosed
Jul 8 Wood chipping plant Pulp and Energy Sweden Around EUR 20 million
Aug 4 Advantage NTT line Paper USA Not disclosed
Aug 15 Paper machine grade conversion rebuild Paper Thailand Typically valued at around EUR 20 million
Aug 18 OptiConcept M board production line Paper USA Not disclosed
Aug 20 Tissue production line Paper Turkey Not disclosed
Sep 11 Flue-gas cleaning system Pulp and Energy Finland Roughly EUR 10 million
Oct 7 Equipment for evaporator train upgrade Pulp and Energy USA Not disclosed
Oct 13 Biomass based power plant Pulp and Energy Sweden About EUR 30 million
Oct 30 Advantage DCT 200HS tissue line Paper China Not disclosed
Nov 18 Flue gas scrubber Pulp and Energy Finland Not disclosed
Nov 19 Press section rebuild Paper Czech Republic Not disclosed
Nov 20 Advantage DCT 200HS tissue line Paper Poland Not disclosed
Dec 3 A winder and auxiliaries Paper Finland Not disclosed
Dec 8 Flue-gas cleaning and condensation plant Pulp and Energy Finland Around EUR 8 million
Dec 15 New machine for folding boxboard production Paper Sweden Typically valued at around EUR 60-70 million
Date Description Business line Country Value
Jan 23 Key board machine solutions Paper China Not disclosed
Feb 4 Flue-gas cleaning and condensation plant Pulp and Energy Finland Around EUR 8 million
Announced orders during 2015
February, 2015 © Valmet49
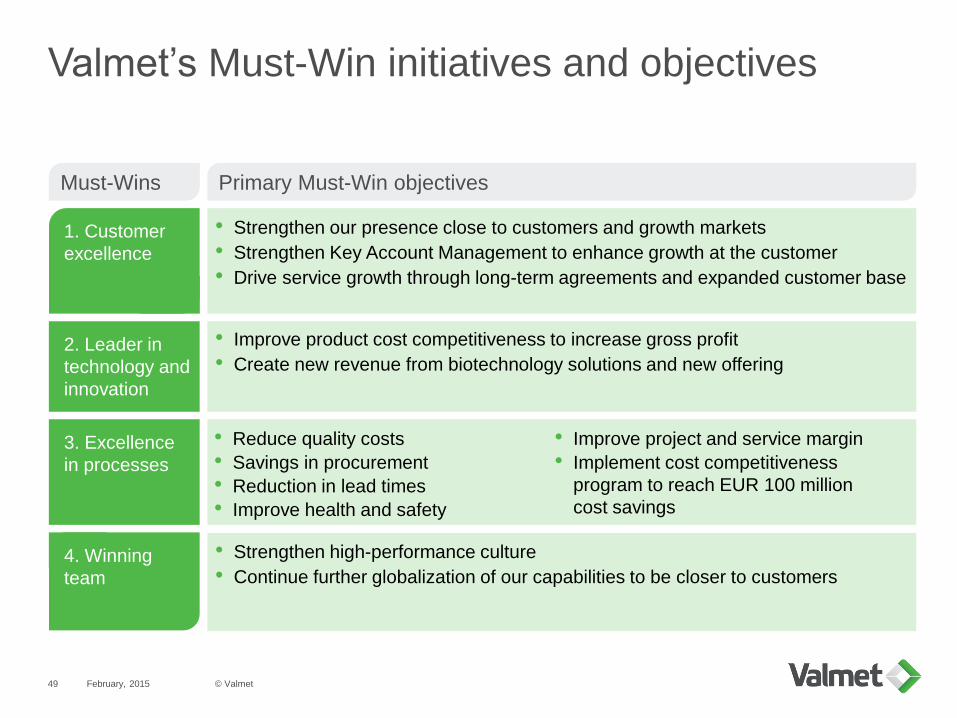
Valmet’s Must-Win initiatives and objectives
• Reduce quality costs
• Savings in procurement
• Reduction in lead times
• Improve health and safety
• Improve project and service margin
• Implement cost competitiveness
program to reach EUR 100 million
cost savings
• Strengthen our presence close to customers and growth markets
• Strengthen Key Account Management to enhance growth at the customer
• Drive service growth through long-term agreements and expanded customer base
• Improve product cost competitiveness to increase gross profit
• Create new revenue from biotechnology solutions and new offering
• Strengthen high-performance culture
• Continue further globalization of our capabilities to be closer to customers
1. Customer
excellence
2. Leader in
technology and
innovation
3. Excellence
in processes
4. Winning
team
Primary Must-Win objectivesMust-Wins

February, 2015 © Valmet50
Positive cash flow
-38
43 46
117
30
-60
-40
-20
0
20
40
60
80
100
120
140
Q4/2
01
3
Q1/2
01
4
Q2/2
01
4
Q3/2
01
4
Q4/2
01
4
• At the end of 2014, net working capital was EUR -353 million
• CAPEX less than depreciation
Cash flow provided by operating activities (EUR million)

February, 2015 © Valmet51
-1
-39 -54
-158-166
0%
-5%-7%
-20% -21% -25%
-20%
-15%
-10%
-5%
0%
5%
10%
15%
20%
-250
-200
-150
-100
-50
0
50
100
150
200
Q4/1
3
Q1/1
4
Q2/1
4
Q3/1
4
Q4/1
4
Net debt (EUR million) Gearing (%)
41%40% 40%
41%42%
30%
35%
40%
45%
Q4/1
3
Q1/1
4
Q2/1
4
Q3/1
4
Q4/1
4
Strong balance sheet with negative gearing
• Gearing -21% and net debt EUR -166 million
Net debt (EUR million) and gearing (%) Equity to assets ratio (%)
February, 2015 © Valmet52
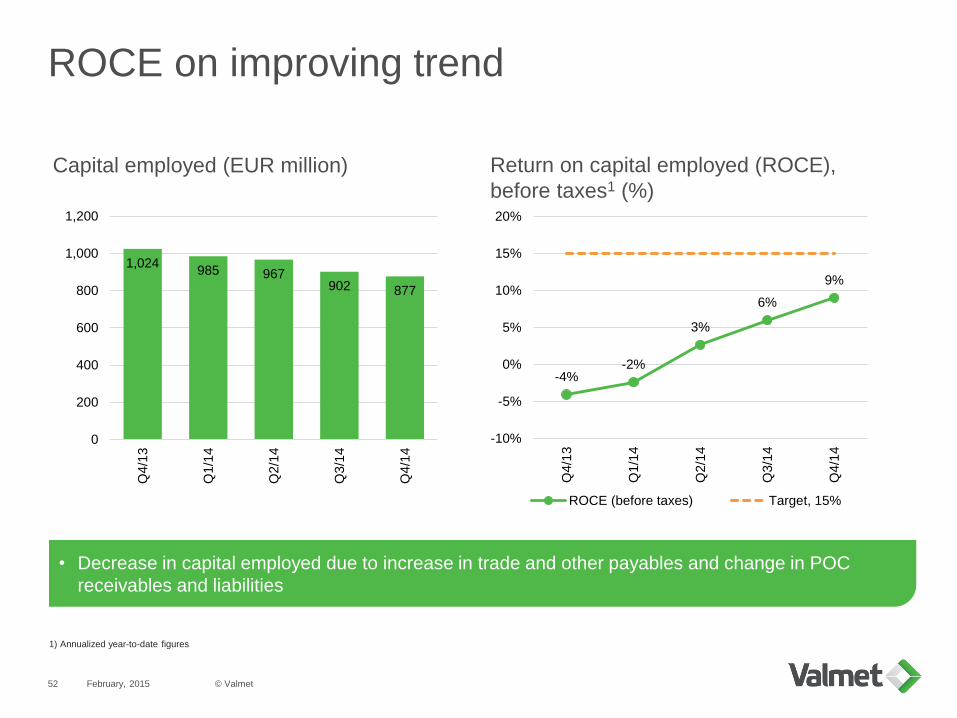
-4%-2%
3%
6%
9%
-10%
-5%
0%
5%
10%
15%
20%
Q4/1
3
Q1/1
4
Q2/1
4
Q3/1
4
Q4/1
4
ROCE (before taxes) Target, 15%
1,024985 967
902 877
0
200
400
600
800
1,000
1,200
Q4/1
3
Q1/1
4
Q2/1
4
Q3/1
4
Q4/1
4
ROCE on improving trend
Return on capital employed (ROCE),
before taxes1 (%)
• Decrease in capital employed due to increase in trade and other payables and change in POC
receivables and liabilities
Capital employed (EUR million)
1) Annualized year-to-date figures
February, 2015 © Valmet53
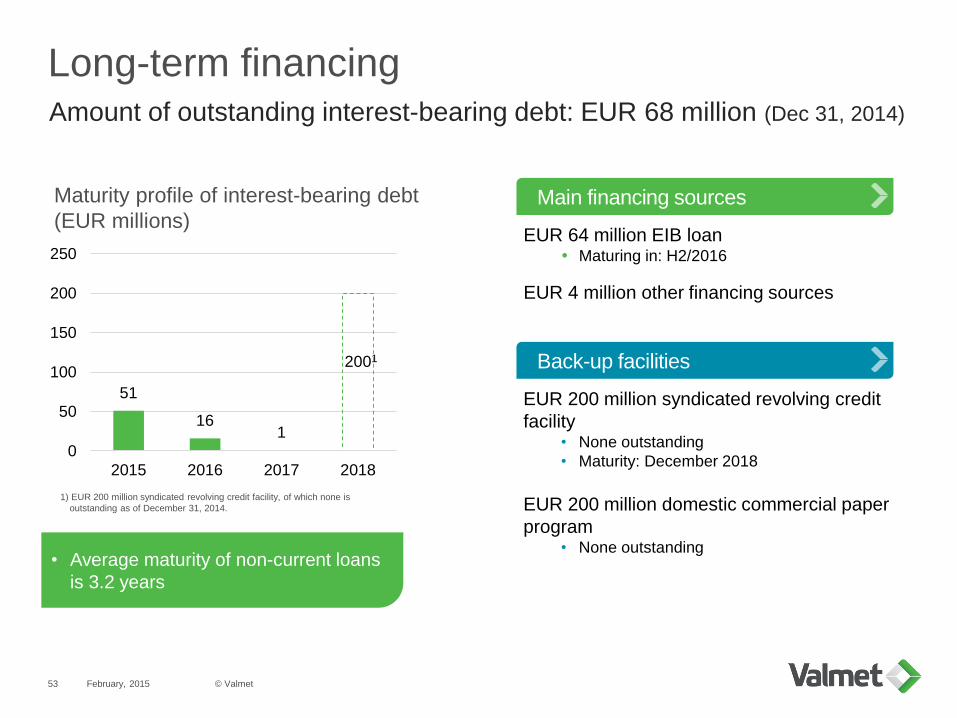
Long-term financingAmount of outstanding interest-bearing debt: EUR 68 million (Dec 31, 2014)
51
161
2001
0
50
100
150
200
250
2015 2016 2017 2018
Maturity profile of interest-bearing debt
(EUR millions)
1) EUR 200 million syndicated revolving credit facility, of which none is
outstanding as of December 31, 2014.
• Average maturity of non-current loans
is 3.2 years
EUR 64 million EIB loan Maturing in: H2/2016
EUR 4 million other financing sources
EUR 200 million syndicated revolving credit
facility • None outstanding
• Maturity: December 2018
EUR 200 million domestic commercial paper
program • None outstanding
Main financing sources
Back-up facilities

Strong balance sheet to support large orders
Financial position as of December 31, 2014 (EUR million)
February, 2015 © Valmet54
Net debt
Gearing
EUR -166 million
-21%
Equity to assets ratio1 42%
• Valmet has a strong balance sheet that enables it to participate in large projects
• Valmet has long-term liquidity in place
809
2,412 2,266
146
Total equity Balance sheettotal
Advancesreceived
Adj. balancesheet total
1) Total equity / (Balance sheet total - advances received - billings in excess of cost and earnings of projects under construction)
51
Current debt
192
41
Cash and
equivalents
Net debtOther
financial
assets
-166
16
Non-current
debt

February, 2015 © Valmet55
Net sales and profitability development, annual
Net sales and EBITA before NRI (EUR million)1
1) Actual figures for 2014. Carve-out figures for 2010-2013; as reported for Metso’s Pulp, Paper and Power segment for 2006-2009
• Timing of large projects has had an impact on the level of net sales
• Good stimulus-driven demand in China 2009–2010 supported orders
• The paper machine market has shifted to smaller and lower-cost machines
• In 2013, the power generation market was affected by low-cost shale gas and political and
economical uncertainty in Europe
• Profitability improved in 2014 as a result of cost savings
EBITA before
NRI (MEUR)
EBITA target 6-9%
636 834 847 715 877 974 1,011 1,032 989
2,092
2,9252,735
2,061
2,4532,703
3,014
2,6132,473
5.5%6.3%
7.1%5.6%
6.5%7.6%
6.4%
2.1%
4.3%
2006 2007 2008 2009 2010 2011 2012 2013 2014
Services
Capital
EBITA-%
115 184 194 116 159 205 192 54 106

Key ratios
© Valmet56 February, 2015
1) The earnings per share information was computed as if the shares issued in conjunction with the Demerger had been outstanding for the entire comparison period.
2) In calculating this key ratio, an adjustment of EUR 468 million has been made from ‘Non-current debt, Metso Group’ to ‘equity’ in order to reflect the conversion of Metso Svenska AB’s
non-current debt to Metso Group which took place in January 2013.
2014 2013
Carve-out
Earnings per share, EUR 0.31 -0.421
Diluted earnings per share, EUR 0.31 -0.421
Equity per share at end of period, EUR 5.36 5.39
Return on equity (ROE), % (annualized) 6% -7%2
Return on capital employed (ROCE) before taxes, % (annualized) 9% -4%
Equity to assets ratio at end of period, % 42% 41%
Gearing at end of period, % -21% 0%
Cash flow provided by operating activities, EUR million 236 -43
Cash flow after investments, EUR million 194 -97
Gross capital expenditure (excl. business acquisitions), EUR million -46 -54
Business acquisitions, net of cash acquired, EUR million - -3
Depreciation and amortization, EUR million -72 -82
Number of outstanding shares at end of period 149,864,220 149,864,619
Average number of outstanding shares 149,863,252 149,864,619
Average number of diluted shares 149,863,252 149,864,619
Net interest-bearing liabilities at end of period, EUR million -166 -1

Consolidated statement of income
© Valmet57 February, 2015
1) The earnings per share information was computed as if the shares issued in conjunction with the Demerger had been outstanding for the entire comparison period.
Q4/2014 Q4/2013 Q1-Q4/
2014
Q1-Q4/
2013
EUR million Carve-out Carve-out
Net sales 777 666 2,473 2,613
Cost of goods sold -633 -591 -2,004 -2,172
Gross profit 144 75 469 441
Selling, general and administrative expenses -109 -126 -401 -469
Other operating income and expenses, net 3 -15 4 -32
Share in profits and losses of associated companies 0 0 0 1
Operating profit 38 -66 72 -59
Financial income and expenses, net -1 3 -5 -5
Profit before taxes 36 -63 67 -64
Income taxes -11 2 -21 2
Profit / loss 25 -61 46 -62
Attributable to:
Owners of the parent 25 -61 46 -63
Non-controlling interests 0 0 0 1
Profit / loss 25 -61 46 -62
Earnings per share attributable to owners of the parent
Earnings per share, EUR 0.17 -0.411 0.31 -0.421
Diluted earnings per share, EUR 0.17 -0.411 0.31 -0.421

Balance sheet as at December 31, 2014
© Valmet58 February, 2015
Assets As at December 31, 2014 As at December 31, 2013
EUR million
Non-current assets
Intangible assets
Goodwill 446 443
Other intangible assets 91 107
Total intangible assets 537 550
Property, plant and equipment
Land and water areas 22 21
Buildings and structures 132 137
Machinery and equipment 202 210
Assets under construction 25 21
Total property, plant and equipment 381 389
Financial and other non-current assets
Investments in associated companies 5 5
Available-for-sale financial assets 9 3
Loan and other receivables 7 1
Derivative financial instruments 0 -
Deferred tax asset 86 80
Other non-current assets 14 8
Total financial and other non-current assets 121 97
Total non-current assets 1,040 1,036
Current assets
Inventories 474 431
Receivables
Trade and other receivables 445 436
Cost and earnings of projects under construction
in excess of advance billings
192 159
Loan and other receivables 0 -
Available-for-sale financial assets 28 1
Derivative financial instruments 20 18
Income tax receivables 22 21
Total receivables 706 635
Cash and cash equivalents 192 211
Total current assets 1,372 1,277
Total assets 2,412 2,313
© Valmet59 February, 2015
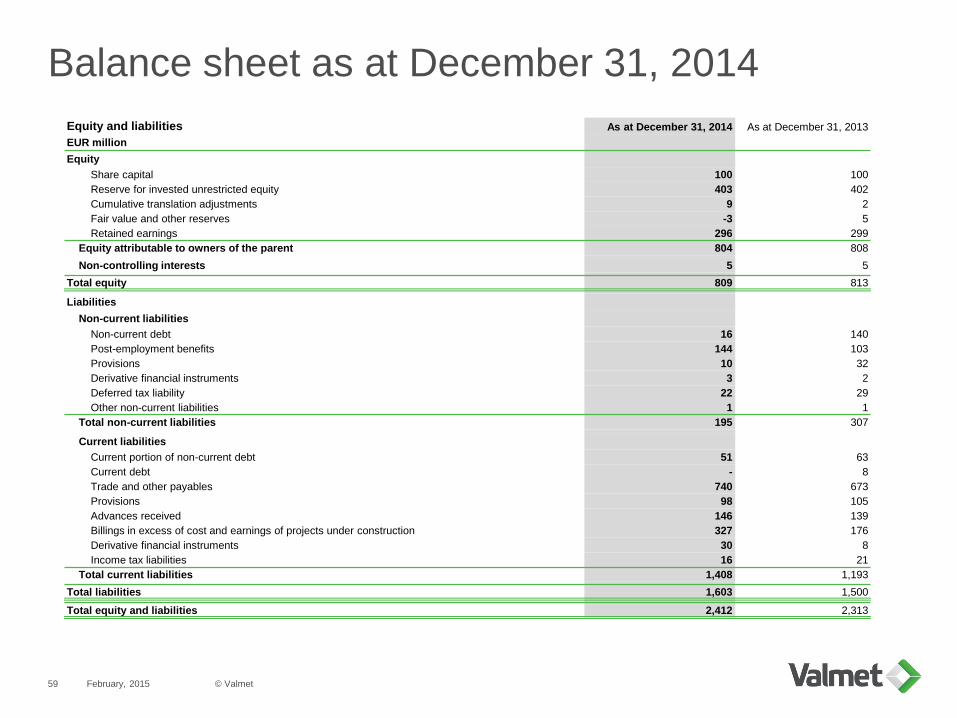
Balance sheet as at December 31, 2014
Equity and liabilities As at December 31, 2014 As at December 31, 2013
EUR million
Equity
Share capital 100 100
Reserve for invested unrestricted equity 403 402
Cumulative translation adjustments 9 2
Fair value and other reserves -3 5
Retained earnings 296 299
Equity attributable to owners of the parent 804 808
Non-controlling interests 5 5
Total equity 809 813
Liabilities
Non-current liabilities
Non-current debt 16 140
Post-employment benefits 144 103
Provisions 10 32
Derivative financial instruments 3 2
Deferred tax liability 22 29
Other non-current liabilities 1 1
Total non-current liabilities 195 307
Current liabilities
Current portion of non-current debt 51 63
Current debt - 8
Trade and other payables 740 673
Provisions 98 105
Advances received 146 139
Billings in excess of cost and earnings of projects under construction 327 176
Derivative financial instruments 30 8
Income tax liabilities 16 21
Total current liabilities 1,408 1,193
Total liabilities 1,603 1,500
Total equity and liabilities 2,412 2,313
AppendixProcess Automation Systems

Process Automation Systems in brief
February, 2015 © Valmet61
Supplies and develops automation and information management
systems, applications and services
Process Automation Systems’ net sales1Global market leader with
#1 market position in pulp and
paper
Industry-leading product portfolio
Comprehensive services
High barriers to entry and a limited
number of focused players
2013 figures1
Net sales EUR 296 m
Employees ~1,600
EBITA margin historically
approximately 10–12%
Position in Pulp and Paper
#1 Analyzers
#1-2 Quality control systems
#3 Distributed control systems
1) Stand-alone figures for the year of 2013
Services business
Capital business
19%
5%
57%
10%
8%
North America
EMEA
South America
Asia-Pacific
China
~55%~45%

Process Automation Systems’ offering
February, 201562
• Complete control system platform for several processes: process,
machine, drive controls and information management
• Used for monitoring and controlling distributed equipment in process
plants and industrial processes
• Advanced process controls for process optimization
• Condition monitoring in paper, power and process plants
• Systems for simulating and analyzing industrial production processes
Distributed
Control
System (DCS)
• A system that controls process quality
• Integrates process quality management, measurements and profilers
Quality Control
System
(QCS)
• Profilers control the process as part of the QCS systemProfilers
• Equipment that analyzes and helps optimize the process
• Equipment that measures different variables in industrial processes,
e.g. consistency in pulp and paper processes
Analyzers and
measurements
• High resolution and high speed digital imaging technology, e.g. pulp or paper
web inspection and web break analysis system
• The system improves process runnability and end product quality
Vision systems
© Valmet
Performance
solutions

80% of Process Automation
Systems’ sales to Valmet’s current
customer industries
Valmet and Process Automation Systems serve mainly the same customer base
February, 2015 © Valmet63
Pulp Process
Valmet is a registered trademark of Valmet Corporation. Other trademarks appearing here are trademarks of their respective owners.
20% of Process Automation
Systems’ sales to other
process industries
PaperEnergy

333304 309
261
0
50
100
150
200
250
300
350
400
20
11
20
12
20
13
1-9
/20
14
Orders received
310 322296
200
0
50
100
150
200
250
300
350
400
20
11
20
12
20
13
1-9
/20
14
Net sales
Recent development
February, 2015 © Valmet64
Net sales (EUR million)1Orders received (EUR million)1
Process Automation Systems is relatively stable business
• Customers choose an automation provider for as long as a decade- During this time, servicing and upgrading is needed
• High service business content (~45%)
• High-level technology and know-how business with high barriers to
entry
• Strong focus on R&D ensures a high level of technology, know-how
and innovations1) Stand-alone figures

Enterprise value of acquisition1:
EUR 340 million
The acquisition will be financed
with committed long-term
financing
Average maturity of long-term
debt will increase to over 4
years2
February, 2015 © Valmet65
Price and financing the acquisition
1) Refers to the debt-free enterprise value of the acquisition.
2) Average maturity 2.8 years on September 30, 2014

Process Automation Systems
had net assets of approximately
EUR 55 million on June 30, 2014
Valmet will have a strong balance
sheet also after the acquisition
To illustrate, if the transaction
would have taken place on
September 30, 2014, Valmet’s
gearing would have been
approximately 23% and equity
ratio approximately 35%1
February, 2015 © Valmet66
Valmet will have a strong balance sheet also after the acquisition
1) Illustrative figures when Valmet and Process Automation Systems combined (based on 09/2014 figures).

Automation will be Valmet’s fourth business line
February, 2015 © Valmet67
North America
South America
EMEA
China
Asia-Pacific
Services
business line
Paper
business line
Automation
business line
Pulp and Energy
business line
• Acquisition is estimated to be completed by April 1, 2015 and is subject to approval by the competition
authorities
• Valmet will continue to have a single reporting segment
• Net sales, orders received and personnel will be reported for all business lines and areas after the
completion of the acquisition
• Sakari Ruotsalainen appointed as Business Line President, Automation
AppendixMarket statistics

© Valmet69 February, 2015
Comprehensive life-cycle services offering and large customer base with significant potential
Comprehensive life-cycle services offering
Spare and wear parts
• All OEM spare parts and
standard parts in Valmet
deliveries
• Inventory management
services and process parts,
such as consumables and
auxiliary products
Fabrics
• Paper machinery clothing
• Filter fabrics used in the pulp
and paper, mining and
chemical industries and
power plants for various
filtration purposes as well as
in commercial laundries
Mill and plant
improvements
• Plant upgrades
• Modifications and
environmental improvements
• Troubleshooting
• Shutdown maintenance
• Maintenance outsourcing for
the entire customer plant
Roll and workshop
services
• Maintenance services on
rotating equipment: roll
covers, spare rolls and roll
upgrades
• Rebuilds for all
manufacturers’ board, tissue,
pulp and paper machines
• Workshop services: pressure
part manufacturing, boiler
component services, parts to
protect and enhance boiler
performance and fiber
equipment refurbishing
Comprehensive life-cycle services offering serving global customer base with over 2,000 plants purchasing
services from Valmet annually
Energy and
environmental
• Services for evaporation
plants, power and recovery
boilers, and environmental
equipment

Services marketMarket trends
EMEA and North America► Largest market for the
Services BL where majority of
installed base is located
► Customer cost pressure and
machine closures key drivers
China► Largest single country for
Valmet
► The services market
expected to grow by ~5% in
2012-2016 in China, South
America and Asia Pacific
region
► Growth supported by
significant amounts of new
capacity being installed in
these areas during the last
ten years and the installed
base is aging
Asia Pacific► Important growth market,
together with China and
South and Central America
South and Central America► Important growth market,
together with China and Asia
Pacific
Total market for Valmet’s
services offering ~EUR 7bn1
• Pulp and paper services = ~EUR 6bn
• Power services market = ~EUR 1bn
Cost pressure and outsourcing
► Customer cost pressure and machine
closures increase demand for solutions
decreasing costs, net working capital, and
raw material and energy consumption
► Increased demand for more competitive
processes and decreasing in-house
customer competencies expected to provide
growth in demand for services
Packaging growth
► Growing demand for containerboard
expected to increase need for services
Closure of graphic machines
► Reduces demand for spare parts and
process consumables, but instead
► Increases demand for expert and
outsourcing services
► Increases demand for process
improvements and debottlenecking of the
remaining machines
1) Global market size for current offering in 2012 estimated by using an average services cost per volume produced based on Valmet’s
existing customers and estimates of current and forecasted growth in total production volumes
© Valmet70
The total market for Valmet’s services offering estimated to grow to EUR 7.7 billion
by the end of 2016, corresponding to an annual global growth rate of about 2.0%1
February, 2015

Pulp marketMarket trends
EMEA and North America► Chemical pulp production
growing by ~1% p.a. in 2010-
2020 in the EMEA region and
decline by ~0.2% p.a. in North
America3
► Demand in Europe and North
America mainly focused on
upgrades and conversions
China► Chemical pulp production
growing by ~6% p.a. in 2010-
20203
► Chemical wood pulp
production growing by ~2.4%
p.a. in Asia in 2011-20253
► Especially mid-sized plants
market segment growing in
Asia
► Increase in new hardwood
pulp production capacity
second largest in Asia after
South America
► Increasing standard of living
in Asia driving demand for
paper, board and tissue
based products, expected to
increase the demand for fiber
► Paper, board and tissue
growing fastest in Asia,
especially China and India,
which do not have sufficient
indigenous fiber resources3
Asia Pacific► Chemical pulp production
growing by ~3% p.a. in 2010-
20203
► Main markets for larger pulp
plant deliveries are South
America and Asia Pacific
region
► Especially mid-sized plants
market segment growing in
Asia
► Increase in new hardwood
pulp production capacity
second largest in Asia after
South America
South and Central America► Chemical wood pulp
production growing by ~3.4%
p.a. in 2011-20253
► Main markets for larger pulp
plant deliveries are South
America and Asia Pacific
region
► Growing virgin fiber demand
expected to be met primarily
by increase in new hardwood
pulp production capacity,
especially in South America
Total market for Valmet’s pulp
technology ~EUR 1.4bn1
• Chemical pulp accounts for ~70% of the total
volume of virgin papermaking fiber raw materials2
Virgin wood pulp growth due to
limitations of recycled paper growth
and growing demand for tissue
► Growth of pulp produced from recycled
paper limited by increasing marginal costs
and the decreasing quality of recovered
paper3
► Management expects demand for pulp to be
driven primarily by tissue production growth
Increased size of pulp lines and mills
► Typical greenfield pulp mill size up from avg.
capacity of ~0.7-1.0m metric tons of pulp
p.a. in 2000-2007 to ~1.3-1.5m metric tons
of pulp p.a. in 2007-2013
► Expected to benefit technology providers,
such as Valmet and Andritz with good
references of large project deliveries and
comprehensive product offering covering
complete plant solutions
1) Management estimate for total market size for Valmet’s pulp production technology offering based on historical and projected pulp capacity increases
2) Virgin papermaking fibre raw materials in 2011, where virgin papermaking fibre raw materials include chemical wood pulp, mechanical and semi-mechanical wood pulp and
non-wood pulp (source: Leading consulting firm)
3) Source: Leading consulting firm
© Valmet71
Total market for Valmet’s pulp technology estimated to be around EUR 1.4bn1 and virgin pulp
consumption is estimated to grow 1.0% annually on average between 2010 and 20253
February, 2015

Energy marketMarket trends
EMEA and North America► EMEA region and North
America, represent ~50% of
the global market4
► Totals ~ EUR 2.3bn in 2013-
2015 on average4
► Expected to grow to an
average of EUR 2.6bn in next
3 years4
► North American market
impacted by low price of
natural gas
► EMEA region impacted by
slow economy and political
uncertainty around renewable
energy support schemes
► EU target of 20% share of
energy from renewable
sources in overall EU energy
consumption by 2020
China► Market in Asia-Pacific, China
and South America,
estimated to EUR 2.1bn
between 2013 and 20154
► Expected to grow to EUR
3.6bn in next 3 year period4
► China’s current 5 year plan
targets 13,000 MW of
biomass power production
capacity by 2015, a
substantial increase from the
5,500 MW installed biomass-
based power capacity in
2010
Asia Pacific► Market in Asia-Pacific, China
and South America,
estimated to EUR 2.1bn
between 2013 and 20154
► Expected to grow to EUR
3.6bn in next 3 year period4
South and Central America► Market in Asia-Pacific, China
and South America,
estimated to EUR 2.1bn
between 2013 and 20154
► Expected to grow to EUR
3.6bn in next 3 year period4
Global biomass and waste power
plant market ~EUR 4.5bn1
• Average estimate for global biomass and waste
power plant market between 2013-2015
Growth in energy consumption and
demand for sustainable energy
► Global electricity demand to grow 2.2% p.a.
from 18,443 TWh in 2010 to 31,859 TWh in
20353
► Fossil fuels continue to be the predominant
fuel in energy production, but the share of
fossil fuels in energy production expected to
decrease from 68% in 2010 to 58% in 20353
► Biomass-based electricity generation
represented ~1.6% of global electricity
generation in 2011, but is forecast to grow
6.9% p.a. between 2011 and 20183
Incentives and regulation supporting
biomass and new biomass conversion
technology-based solutions
► Aim to reduce emissions and mitigate
climate change has resulted in targeted
reductions of CO2 emissions and use of
fossil fuel-based energy production in many
countries
► Policy decisions also impacted by
governments’ objectives to increase the
energy security and decrease dependence
on imported energy
Biomass conversion technology
market >EUR 1.5bn by 20202
• Management estimate for Valmet’s offering
1) Global biomass and waste power plant market estimated by Management to total ~ EUR 4.5bn on average between 2013 and 2015, a decline from an average of EUR
5.0bn between 2010 and 2012. The market is forecast to recuperate and reach an average of EUR 6.2bn between 2016 and 2018
2) Management estimates that the market for its biomass conversion technology solutions will exceed EUR 1.5 billion in 2020
3) Source: IEA, 2012
4) Source: Leading consulting firm
© Valmet72
The global biomass and waste power plant market estimated to be some EUR 4.5 billion on average in
2013-2015 and increase to EUR 6.2 billion on average in 2016-2018
February, 2015

Paper marketMarket trends
EMEA and North America► Market expected to mainly
relate to rebuilds of existing
installed capacity
► Changes in consumer
demographics and shopping
behavior expected to create
additional demand for board in
developed countries2
► Tissue consumption growth
1.4% p.a. in North America, 5-
9% p.a. in Eastern Europe and
3.5% p.a. in Western Europe
in 2010-20213
China► Emerging markets, e.g.
China, expected to drive
containerboard demand
► Higher product penetration
together with improved
product quality drive tissue
consumption e.g. in China
► Tissue consumption growing
5-9% between 2010-20213
Asia Pacific► Emerging markets expected
to account for largest share
of capacity growth for carton
board3
South and Central America► Tissue consumption growing
5-9% between 2010-2021 in
Latin America3
Total market for Valmet’s1:
Board technology ~EUR 1bn• Containerboard consumption growing by ~2.7%
and carton board by ~2.4% p.a. in 2010-20255
Tissue technology ~EUR 0.6bn• Global tissue paper consumption growing by
~3% p.a. through 20252
Newsprint and P&W paper
technology ~EUR 0.6bn• P&W paper demand growing marginally while
global consumption of newsprint declines ~1-
2% p.a. in 2010-20252
General: Demand for increased energy,
water and raw material efficiency
► Focus on environmental responsibilities and
stricter energy and environmental
regulations drive demand for machines that
use less energy, water and raw materials, as
well as use of renewable energy sources
Board: Increased demand due to growth
in packaging and emerging markets
► Containerboard demand driven by GDP
growth and industrial manufacturing
► Demand for carton board driven by
increased retail sales, consumer packaging
and urbanization3
Tissue: Growth driven by increasing
standard of living and tissue
consumption
► Use of tissue-based hygiene products
generally correlated with economic growth,
population growth and standard of living
► Increased product penetration from
improved product quality drive tissue
consumption e.g. in China3
► Tissue products not conducive to long-
distance transportation due to their bulky
nature, thus the size of tissue mills expected
to continue to be relatively small while the
number of mills is expected to increase
Newsprint and writing and printing
papers: Decreased demand due to
growth of digital media
► Ongoing structural change resulting in
production overcapacity in EMEA
region and North America has
weakened demand for writing and
printing paper machines and shifted
demand to lower-cost solutions, mid-
sized machines and machine rebuilds
► Despite decline in demand in
EMEA region and North America
the demand is still growing in
China and other emerging
markets2
► Average order size from the paper
industry to decrease and paper
machines will need to produce
different paper grades more
flexibly and meet more stringent
environmental regulations
1) Management estimate based on current machine demand
2) Source: Leading consulting firms
3) RISI
© Valmet73
General demand driven by increased need for energy, water and raw material efficiency; board and
tissue demand growing with packaging and emerging markets
February, 2015

The majority of new pulp lines are being builtin South America and Asia
Market fluctuates from year to year New chemical pulp lines in SA and Asia
SA AP China NA EMEA Total
1,300
700
700200
600 3,500
February, 2015 © Valmet74
Gross capacity additions 2011-20202
(Avg. ktons p.a.)
New lines
Other increases
1) Market size based on orders received. Includes all pulp business units, recovery boilers, and evaporation plants
2) Average capacity additions p.a. 2011-2020. Only positive capacity changes included, not shutdowns
Source: Valmet, Pöyry
04 05 06 07 08 09 10 11 12 13
Valmet
Other
Market size1
(EUR million)
1,000

Market for larger size (> 50 MWth) biomass boilers has significantly declined in EMEA and North America
2005 2006 2007 2008 2009 2010 2011 2012 1-9/2013
EMEA Rest of the world
Key messages
and implications
• Strong market decline in
2013 and unclear future
market development
• Increased political
uncertainty about meeting
CO2 targets and reduced
ability to finance support
schemes
• Price of coal has reduced,
making it more attractive for
power generation in Europe
and elsewhere
• North American biomass
power market has declined
significantly
• Price of energy has dropped
and previous subsidy
schemes supporting
biomass have expired
1) Note: Includes the power boiler market served by Valmet excluding small power plants < 50MW (EUR 200-300 million), air pollution control
(EUR 50-100 million p.a.), retrofits (EUR 100-200 million), and projects where Valmet has not competed (boilers ~EUR 1 billion p.a.)
Source: Valmet
New boiler market served by Valmet1 (EUR million)(only projects where Valmet has been involved)
500
February, 2015 © Valmet75

Board
machines:
Narrow, slow,
and lower
technology
Paper
machines:
Wide, fast, and
high technology
Major changes in the paper and board market
February, 2015 © Valmet76
1) Company estimate based on estimated capacity by start-up year and estimated average price per ton (constant value of EUR180/ton used over time)
Estimated net sales1 (EUR millions)
0
100
200
300
400
500
600
700
800
900
1,000
1996 1998 2000 2002 2004 2006 2008 2010 2012
Paper Board

February, 2015 © Valmet77
0
20
40
60
80
100
120
140
160
180
200
220
1995 2000 2005 2010 2015F 2020F 2025F
Newsprint Printing & Writing
Containerboard Cartonboard
Tissue
Consumption developmentGrowth in board and tissue consumption is expected to continue while
newsprint is declining
1) Source: RISI
Paper consumption1 (Mton)
CAGR 2001-2013 2013-2025F
Containerboard +3.4% +2.5%
Printing & Writing +0.5% -0.3%
Cartonboard +2.6% +2.8%
Tissue +3.1% +3.5%
Newsprint -2.1% -2.6%

Paper and board consumption growth trends
February, 2015 © Valmet78
Population growth in
emerging markets is
larger than in
developed markets
Level of
consumption per
capita in emerging
markets clearly
below that in
developed markets
This offers us long-
term growth potential
Paper and board consumption per capita vs. population1
Average global consumption: 53 kg per capita
1) Source: PPI Annual Review 2013 (2012 figures)
0
500
1,000
1,500
2,000
2,500
0
50
100
150
200
250
Easte
rn E
uro
pe
We
ste
rn E
uro
pe
Nort
h A
me
rica
Latin
Am
eri
ca
Ja
pa
n
Chin
a
Rest o
f A
sia
Ocea
nia
Afr
ica
Mid
dle
Ea
st
Consumption per capita, kg (LHS) Population, million (RHS)

Demand has shifted more towards smaller paper and board machines
February, 2015 © Valmet79
• We are focusing more on modularized and standardized solutions
• Competition is higher in smaller machines
Capacity of start-ups1, by machine size
29 Mton
35 Mton
47 Mton
26 Mton
1998-02 2003-07 2008-12 2013-17
S (<200 kton) M (200-350 kton)
L (350-550 kton) XL (>500 kton)
S
M
L
XL
Valmet’s market share1, by machine size
Competition is lower in
larger machine sizes.
Higher number of
players in smaller
machines.
1) Source: Pöyry, Valmet
40-60%
35-45%
25-35%
0%

0
5
10
15
20
25
0
500
1,000
1,500
2,000
2,500
Easte
rn E
uro
pe
We
ste
rn E
uro
pe
Nort
h A
me
rica
Latin
Am
eri
ca
Ja
pa
n
Ch
ina
Rest o
f A
sia
Ocea
nia
Afr
ica
Mid
dle
Ea
st
Population, million (LHS) Consumption per capita, kg (RHS)
Tissue consumption growth trends
February, 2015 © Valmet80
New products and
consumption models
based on tissue are
helping increase
consumption in
developed markets
Consumption in
emerging markets is
still low, but growing
Offers us long-term
growth potential in
both developed and
emerging markets
Tissue consumption per capita vs. population1
Average global consumption: 4.5 kg per capita
1) Source: PPI Annual Review 2013 (2012 figures)
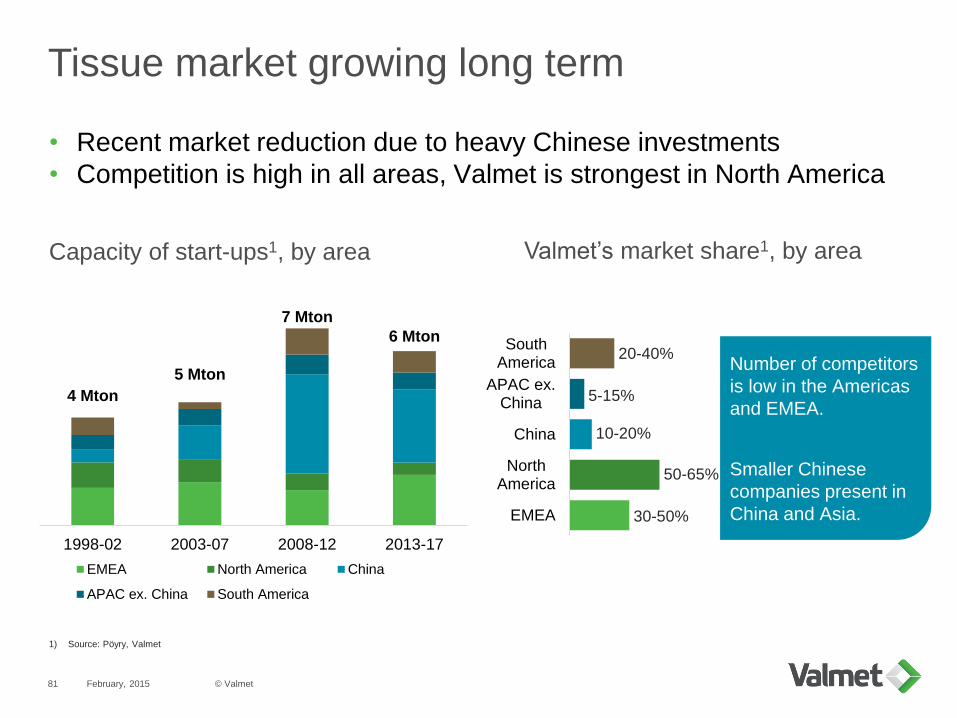
Tissue market growing long term
February, 2015 © Valmet81
EMEA
NorthAmerica
China
APAC ex.China
SouthAmerica
• Recent market reduction due to heavy Chinese investments
• Competition is high in all areas, Valmet is strongest in North America
Capacity of start-ups1, by area Valmet’s market share1, by area
4 Mton
5 Mton
7 Mton
6 Mton
1998-02 2003-07 2008-12 2013-17
EMEA North America China
APAC ex. China South America
Number of competitors
is low in the Americas
and EMEA.
Smaller Chinese
companies present in
China and Asia.
1) Source: Pöyry, Valmet
20-40%
5-15%
10-20%
50-65%
30-50%

February, 2015 © Valmet82
10
20
30
40
50
4
5
6
7
8
9
10
11
12
2008
2009
2010
2011
2012
2013
2014
2015
2016
2017
2018
Tissue (LHS) Newsprint (LHS)
Printing & Writing (RHS) Containerboard (RHS)
Cartonboard (RHS)
10
15
20
25
30
35
40
5
7
9
11
13
15
2008
2009
2010
2011
2012
2013
2014
2015
2016
2017
2018
Tissue (LHS) Newsprint (LHS)
Printing & Writing (RHS) Containerboard (RHS)
Cartonboard (RHS)
5
15
25
35
45
55
2
4
6
8
10
12
2008
2009
2010
2011
2012
2013
2014
2015
2016
2017
2018
Tissue (LHS) Newsprint (LHS)
Printing & Writing (RHS) Containerboard (RHS)
Cartonboard (RHS)
5
10
15
20
25
30
35
3
4
5
6
7
8
9
2008
2009
2010
2011
2012
2013
2014
2015
2016
2017
2018
Tissue (LHS) Newsprint (LHS)
Printing & Writing (RHS) Containerboard (RHS)
Cartonboard (RHS)
Paper, board, and tissue production trends
Source: RISI
North America (million tonnes) Europe (million tonnes)
China (million tonnes) Asia-Pacific (million tonnes)

February, 2015 © Valmet83
Paper, board, and tissue operating rates
Source: RISI
North America Europe
China Asia-Pacific
75%
80%
85%
90%
95%
100%
2008
2009
2010
2011
2012
2013
2014
2015
Tissue Newsprint Printing & Writing
Containerboard Cartonboard
80%
85%
90%
95%
100%
2008
2009
2010
2011
2012
2013
2014
2015
Tissue Newsprint Printing & Writing
Containerboard Cartonboard
70%
75%
80%
85%
90%
95%
100%
2008
2009
2010
2011
2012
2013
2014
2015
Tissue Newsprint Printing & Writing
Containerboard Cartonboard
80%
82%
84%
86%
88%
90%
92%
94%
2008
2009
2010
2011
2012
2013
2014
2015
Tissue Newsprint Printing & Writing
Containerboard Cartonboard

Pulp and paper price trends
February, 2015 © Valmet84
Source: Bloomberg
0
200
400
600
800
1,000
1,200
1-D
ec-0
7
1-M
ar-
08
1-J
un-0
8
1-S
ep
-08
1-D
ec-0
8
1-M
ar-
09
1-J
un-0
9
1-S
ep
-09
1-D
ec-0
9
1-M
ar-
10
1-J
un-1
0
1-S
ep
-10
1-D
ec-1
0
1-M
ar-
11
1-J
un-1
1
1-S
ep
-11
1-D
ec-1
1
1-M
ar-
12
1-J
un-1
2
1-S
ep
-12
1-D
ec-1
2
1-M
ar-
13
1-J
un-1
3
1-S
ep
-13
1-D
ec-1
3
1-M
ar-
14
1-J
un-1
4
1-S
ep
-14
1-D
ec-1
4
Eucalyptus pulp (USD/t) Northern bleached softwood pulp (USD/t)Uncoated (USD/t) Copy paper (EUR/t)Testliner (EUR/t)

0
50
100
150
200
250
300
350
400
500
600
700
800
900
1,000
1,100
31-J
an-0
6
30-J
un-0
6
30-N
ov-0
6
30-A
pr-
07
30-S
ep-0
7
29-F
eb
-08
31-J
ul-0
8
31-D
ec-0
8
31-M
ay-0
9
31-O
ct-
09
31-M
ar-
10
31-A
ug-1
0
31-J
an-1
1
30-J
un-1
1
30-N
ov-1
1
30-A
pr-
12
30-S
ep-1
2
28-F
eb
-13
31-J
ul-1
3
31-D
ec-1
3
31-M
ay-1
4
31-O
ct-
14
Spread (RHS) NBSK (LHS) BHKP (LHS)
Spread at the end of
October, 2014: $203
January, 2015: $186
February, 2015 © Valmet85
Historically large spread in pulp prices
• In the autumn of 2014, many pulp producers announced
price hikes NBSK
Northern bleached
softwood kraft pulp is
produced mainly in
Canada and the Nordic
countries. NBSK is
based on long fibre wood
species. It adds strength
to the final product.
BHKP
Bleached hardwood kraft
pulp, produced e.g. in
Brazil and Indonesia,
is based on short fibre
wood species. It adds
softness to the final
product.
Pulp prices, Europe: NBSK and BHKP (USD/ton)
Source: Bloomberg

Crude oil, steam coal, natural gas and electricity
February, 2015 © Valmet86
Source: Bloomberg
Europe
0
10
20
30
40
50
60
70
80
90
100
0
20
40
60
80
100
120
140
160
180
1-Jan-10 1-Jun-10 1-Nov-10 1-Apr-11 1-Sep-11 1-Feb-12 1-Jul-12 1-Dec-12 1-May-13 1-Oct-13 1-Mar-14 1-Aug-14
CIF ARA steam coal (USD/t) (LHS) Brent crude oil (USD/barrel) (LHS) Natural gas spot price NBP (GBP/therm) (RHS)
0
20
40
60
80
100
120
0
20
40
60
80
100
1-Jan-10 1-Jun-10 1-Nov-10 1-Apr-11 1-Sep-11 1-Feb-12 1-Jul-12 1-Dec-12 1-May-13 1-Oct-13 1-Mar-14 1-Aug-14
European Energy Exchange, Phelix (EUR/MWh) (LHS) Nordpool Power (EUR/MWh) (LHS)
UK Baseload (GBP/MWh) (RHS)

Crude oil, steam coal, natural gas and electricity
February, 2015 © Valmet87
Source: Bloomberg
United States
0
1
2
3
4
5
6
7
0
20
40
60
80
100
120
140
1-Jan-10 1-Jun-10 1-Nov-10 1-Apr-11 1-Sep-11 1-Feb-12 1-Jul-12 1-Dec-12 1-May-13 1-Oct-13 1-Mar-14 1-Aug-14
FOB steam coal Richards Bay (USD/t) (LHS) WTI crude oil (USD/barrel) (LHS) Henry Hub gas (USD/MMBtu) (RHS)
70
75
80
85
90
0
50
100
150
200
1-Jan-10 1-Jun-10 1-Nov-10 1-Apr-11 1-Sep-11 1-Feb-12 1-Jul-12 1-Dec-12 1-May-13 1-Oct-13 1-Mar-14 1-Aug-14
Electricity spot price, PJM (USD/MWh) (LHS) Electricity spot price, NEPOOL (USD/MWh) (LHS)US utility capacity utilization rate (RHS)

European Carbon Emission Allowance
February, 2015 © Valmet88
Source: Bloomberg
0
1
2
3
4
5
6
7
8
9
2-N
ov-1
2
23
-Nov-1
2
14
-Dec-1
2
4-J
an-1
3
25
-Jan
-13
15
-Fe
b-1
3
8-M
ar-
13
29
-Mar-
13
19
-Apr-
13
10
-May-1
3
31
-May-1
3
21
-Jun
-13
12
-Jul-
13
2-A
ug-1
3
23
-Aug
-13
13
-Sep
-13
4-O
ct-
13
25
-Oct-
13
15
-Nov-1
3
6-D
ec-1
3
27
-Dec-1
3
17
-Jan
-14
7-F
eb
-14
28
-Fe
b-1
4
21
-Mar-
14
11
-Apr-
14
2-M
ay-1
4
23
-May-1
4
13
-Jun
-14
4-J
ul-1
4
25
-Jul-
14
15
-Aug
-14
5-S
ep-1
4
26
-Sep
-14
17
-Oct-
14
7-N
ov-1
4
28
-Nov-1
4
19
-Dec-1
4
European Energy Exchange (EEX) spot price (EUR/t)