Validity and Reliability of Situational Judgement Test …users.ugent.be/~flievens/CDMORM.pdf ·...
27
Article Validity and Reliability of Situational Judgement Test Scores: A New Approach Based on Cognitive Diagnosis Models Miguel A. Sorrel 1 , Julio Olea 1 , Francisco J. Abad 1 , Jimmy de la Torre 2 , David Aguado 3 and Filip Lievens 4 Abstract Conventional methods for assessing the validity and reliability of situational judgment test (SJT) scores have proven to be inadequate. For example, factor analysis techniques typically lead to nonsensical solutions, and assumptions underlying Cronbach’s alpha coefficient are violated due to the multidimensional nature of SJTs. In the current article, we describe how cognitive diagnosis models (CDMs) provide a new approach that not only overcomes these limitations but that also offers extra advantages for scoring and better understanding SJTs. The analysis of the Q-matrix specification, model fit, and model parameter estimates provide a greater wealth of information than traditional procedures do. Our proposal is illustrated using data taken from a 23-item SJT that presents situations about student-related issues. Results show that CDMs are useful tools for scoring tests, like SJTs, in which multiple knowledge, skills, abilities, and other characteristics are required to correctly answer the items. SJT classifications were reliable and significantly related to theoretically relevant variables. We conclude that CDM might help toward the exploration of the nature of the constructs underlying SJT, one of the principal challenges in SJT research. Keywords situational judgment tests, cognitive diagnosis models, validity, reliability 1 Department of Social Psychology and Methodology, Universidad Auto ´noma de Madrid, Madrid, Spain 2 Department of Educational Psychology, The State University of New Jersey, New Brunswick, NJ, USA 3 Instituto de Ingenierı ´a del Conocimiento, Universidad Auto ´noma de Madrid, Madrid, Spain 4 Department of Personnel Management, Work and Organizational Psychology, Ghent University, Ghent, Belgium Corresponding Author: Miguel A. Sorrel, Department of Social Psychology and Methodology, Universidad Auto ´ noma de Madrid, Ciudad Universitaria de Cantoblanco, Madrid 28049, Spain. Email: [email protected] Organizational Research Methods 1-27 ª The Author(s) 2016 Reprints and permission: sagepub.com/journalsPermissions.nav DOI: 10.1177/1094428116630065 orm.sagepub.com at Bibliotheek fac Psych en on February 17, 2016 orm.sagepub.com Downloaded from
Transcript of Validity and Reliability of Situational Judgement Test …users.ugent.be/~flievens/CDMORM.pdf ·...

Article
Validity and Reliabilityof Situational JudgementTest Scores: A NewApproach Based onCognitive Diagnosis Models
Miguel A. Sorrel1, Julio Olea1,Francisco J. Abad1, Jimmy de la Torre2,David Aguado3 and Filip Lievens4
AbstractConventional methods for assessing the validity and reliability of situational judgment test (SJT)scores have proven to be inadequate. For example, factor analysis techniques typically lead tononsensical solutions, and assumptions underlying Cronbach’s alpha coefficient are violated due tothe multidimensional nature of SJTs. In the current article, we describe how cognitive diagnosismodels (CDMs) provide a new approach that not only overcomes these limitations but that alsooffers extra advantages for scoring and better understanding SJTs. The analysis of the Q-matrixspecification, model fit, and model parameter estimates provide a greater wealth of information thantraditional procedures do. Our proposal is illustrated using data taken from a 23-item SJT thatpresents situations about student-related issues. Results show that CDMs are useful tools forscoring tests, like SJTs, in which multiple knowledge, skills, abilities, and other characteristics arerequired to correctly answer the items. SJT classifications were reliable and significantly related totheoretically relevant variables. We conclude that CDM might help toward the exploration of thenature of the constructs underlying SJT, one of the principal challenges in SJT research.
Keywordssituational judgment tests, cognitive diagnosis models, validity, reliability
1Department of Social Psychology and Methodology, Universidad Autonoma de Madrid, Madrid, Spain2Department of Educational Psychology, The State University of New Jersey, New Brunswick, NJ, USA3Instituto de Ingenierıa del Conocimiento, Universidad Autonoma de Madrid, Madrid, Spain4Department of Personnel Management, Work and Organizational Psychology, Ghent University, Ghent, Belgium
Corresponding Author:
Miguel A. Sorrel, Department of Social Psychology and Methodology, Universidad Autonoma de Madrid, Ciudad Universitaria
de Cantoblanco, Madrid 28049, Spain.
Email: [email protected]
Organizational Research Methods1-27ª The Author(s) 2016Reprints and permission:sagepub.com/journalsPermissions.navDOI: 10.1177/1094428116630065orm.sagepub.com
at Bibliotheek fac Psych en on February 17, 2016orm.sagepub.comDownloaded from
Situational judgment tests (SJTs) have become increasingly popular for personnel selection both in
the United States and Europe (McDaniel, Morgenson, Finnegan, Campion, & Braverman, 2001;
Whetzel & McDaniel, 2009). SJTs are designed to evaluate candidate judgments regarding situa-
tions encountered in the workplace (Weekley & Ployhart, 2006). Test takers are asked to evaluate
each course of action either for the likelihood that they would perform the action or for the effec-
tiveness of the action. SJTs are intended to evaluate different constructs (knowledge, skills, abilities,
and other characteristics; KSAOs) related to job performance, which are different from those that are
measured through cognitive ability tests or personality inventories. More specifically, a recent meta-
analysis shows that SJTs intend to measure constructs that could be classified into four categories:
knowledge and skills, applied social skills (e.g., leadership), basic personality tendencies (e.g.,
integrity), and heterogeneous composites (Christian, Edwards, & Bradley, 2010).
Despite their success, various validity and reliability issues related to SJTs have not been appro-
priately addressed (Christian et al., 2010; Ployhart & Weekley, 2006) because, as argued in the
following, conventional methods for assessing the validity and reliability of SJT scores are based on
classical test theory (CTT), which are inadequate in light of the multidimensional nature of SJT
items. Therefore, this article explores the use of cognitive diagnosis models (CDMs) as a promising
approach that not only overcomes these shortcomings but that also offers several advantages for
scoring and better understanding SJTs.
The rest of the article is structured as follows. First, we briefly review existing validity and
reliability evidence for SJT scores and in the process touch on the limitations of the existing
approaches. The next section provides an introduction to CDMs. We then use an empirical example
to illustrate how CDMs can be used for evaluating the validity and reliability of SJT scores and
compare this approach with the traditional CTT approach. The last section discusses the advantages
and the disadvantages of CDMs.
Review of SJT Literature on Reliability and Validity
Similar to any type of test, validation studies should also be conducted to provide relevant infor-
mation for the interpretation and use of SJT scores. The Standards for Educational and Psycholo-
gical Testing (American Educational Research Association, American Psychological Association, &
National Council of Measurement in Education, 1999) specifies five ‘‘sources of evidence that might
be used in evaluating a proposed interpretation of test scores for particular purposes’’ (p. 11). These
sources of evidence are test content, consequences of testing, relations to other variables, internal
structure, and response processes. In the following, we discuss to what extent these sources of
evidence have been evaluated in the validation of SJT scores.
With regard to evidence based on test content, the norm in the development of SJTs is to recruit
and train external ‘‘subject matter experts’’ (SMEs) to generate critical incidents. This information is
used to develop the item stems, specify the extent to which these item situations represent the job
domain, and establish the response alternatives and scoring key. Generally, once experts have made
these decisions and judgments, the test is considered as more or less definitive. Furthermore, it is
recognized that ‘‘there is virtually no direct investigation of the relationships linking SJTs scores and
test content’’ (Schmitt & Chan, 2006, p. 147).
A more extensive strand of SJT studies focused on both intended and unintended consequences
of SJTs score interpretation and use. Most of this research examined potential adverse impact of
SJT scores, test taker perceptions toward various SJT formats, and the fake-ability of SJTs in
comparison to traditional tests (for reviews, see Lievens, Peeters, & Schollaert, 2008; Whetzel &
McDaniel, 2009).
Next, a voluminous stream of SJT validation studies scrutinized evidence of the relation of test
scores to a relevant criterion (e.g., other constructs), their criterion-related validity with respect to
2 Organizational Research Methods
at Bibliotheek fac Psych en on February 17, 2016orm.sagepub.comDownloaded from

performance criteria, and their incremental validity over and above other more traditional measures
(see the meta-analyses of McDaniel et al., 2001; McDaniel, Hartman, Whetzel, & Grubb, 2007).
Generally, SJTs were found to have corrected validities in the mid .20s and exhibited incremental
validity above and beyond traditional predictors, such as cognitive ability and personality (see also
Clevenger, Pereira, Wiechmann, Schmitt, & Schmidt-Harvey, 2001; Weekley & Ployhart, 2005).
In comparison to this large body of research on the criterion-related validity of SJT scores, there
is much less attention devoted to how constructs underlying SJTs are specified and examined
(Arthur et al., 2014; Schmitt & Chan, 2006). The meta-analysis of Christian et al. (2010), for
instance, reported that about one third of the papers published about SJTs did not indicate the
construct measured, did not provide enough information about these constructs, or provided only
the composite score. They concluded that ‘‘test developers and researchers often give little attention
to the constructs measured’’ (Christian et al., 2010, p. 84). In other words, although SJTs seem to
partly predict performance and enhance the criterion-related validity of traditional personality and
cognitive ability test scores, the underlying reasons are not clear because little is known about the
nature of the constructs measured by SJTs.
Therefore, it is widely acknowledged that more specific studies about the constructs underlying
SJTs are needed (Ployhart & Ehrhart, 2003). In a recent review of personnel selection research, Ryan
and Ployhart (2014) posited that among all current principal lines of research in SJTs, the explora-
tion of the nature of the constructs is the most pressing one. Such construct-level information is
pivotal because it offers several theoretical and applied advantages (Christian et al., 2010), namely,
understanding deeper why some tests predict work performance better than others, comparing more
clearly the effectiveness of different selection methods, reducing contamination by non–job-relevant
constructs, and justifying the interpretation of the scores and their fair use.
To assess the internal structure of SJTs, one of the strategies in past research typically involved
obtaining evidence via factor analytic techniques. However, the application of factor analytic tech-
niques to SJT data almost always led to ‘‘a plethora of factors that are difficult to interpret’’ (Lievens
et al., 2008, p. 430) as well as nonsensical factor structure solutions. Hence, it is recognized that
‘‘there has been little success in understanding what SJTs really measure’’ (Ployhart & Weekley,
2006, p. 346). Due to the uninterpretable factor analytic results, it has been posited that SJTs are
‘‘construct heterogeneous at the item level, because one item, for example, may target several
performance dimensions’’ (Patterson et al., 2012, p. 853). Despite the multidimensional nature of
SJTs, a single composite score is generally reported in SJT research and practice. All of these
findings point to the necessity of alternative approaches for examining the internal structure (dimen-
sionality) of SJTs and for obtaining ‘‘new insights into understanding the constructs assessed by
SJTs’’ (Whetzel & McDaniel, 2009, p. 200).
Apart from lack of progress on how the internal structure of SJTs can be better understood, little is
also known about the response processes that govern the ways in which individuals respond to SJT
items. In fact, different possibilities exist regarding how individuals might respond to SJT items and
solve them on the basis of their ability/skills. For instance, if a particular item includes several skills,
are test takers required to master each of the skills to produce the most accurate answer (i.e., a
noncompensatory model)? Or, could mastery of one of the skills compensate for the lack of mastery
of the other skills (i.e., a compensatory model)? Unfortunately, these different possibilities in how
individuals might respond to SJT items have not been examined with the appropriate psychometric
models. As such, there exists a need for psychometric models that can provide information not only
about the statistical quality of the items but also about the correspondence between the items and the
targeted cognitive processes. In other words, psychometric models are needed to evaluate, among
others, the appropriateness of compensatory and noncompensatory models to shed light on the item
responding processes.
Sorrel et al. 3
at Bibliotheek fac Psych en on February 17, 2016orm.sagepub.comDownloaded from
Finally, with respect to reliability of SJT scores, most studies have focused on internal consis-
tency reliability (see review of Lievens et al., 2008). Generally, the internal consistency indices
reported in the SJT literature are typically low. For example, a mean of .46 was obtained in some
meta-analyses (e.g., Catano, Brochu, & Lamerson, 2012). These low internal consistency reliability
values do not necessarily indicate poor precision of measurement. Rather, these results could reflect
the fact that Cronbach’s alpha is not appropriate for assessing the reliability of multidimensional
tests such as SJTs because Cronbach’s alpha requires that the construct domain be homogeneous
(Schmidt & Hunter, 1996). In this context, homogeneity refers to unidimensionality (i.e., items
measure a single latent construct). Given the heterogeneity of SJTs, even at the item level, research-
ers should look for other approaches for estimating reliability. Among other approaches, it has been
proposed that test-retest reliability might be a particularly better measure for assessing the reliability
of SJT scores (Lievens et al., 2008; Whetzel & McDaniel, 2009). However, ‘‘in most operational
situations . . . it is impractical to obtain test-retest data’’ (Catano et al., 2012, p. 344). This under-
scores the needs to find other, more practicable approaches to estimate reliability of SJTs.
To recap, our review of research on the validity of SJT scores shows that prior research thus far
has mainly focused on approaches to establishing validity evidence on the basis of test content,
testing consequences, and relations to other variables. In contrast, there have been few successful
attempts in providing evidence about the internal structure and response processes involved in
solving SJT items. Moreover, our review of prior research highlighted the problems with using
factor analytic techniques and Cronbach alpha for multidimensional tests such as SJTs. Our review
also makes it clear that reliance on CTT has hampered further progress on these unexplored issues,
which by nature are complex and may require more advanced psychometric models.
Thus, given these shortcomings in existing research on the validity and reliability of SJT scores,
a new psychometric approach in examining the nature of constructs in SJTs is needed. Consistent
with recommendations from a recent review on SJT research (Weekley, Hawkes, Guenole, &
Ployhart, 2015, p. 301), we propose a specific set of latent trait measurement models, namely,
cognitive diagnosis models, as an alternative psychometric approach to obtain evidence on the
validity of SJT scores, assess their reliability, and score the different KSAOs that are theoretically
measured by the SJT.
Cognitive Diagnosis Models: A Tutorial
In the past few years, there has been an increasing interest in psychometric models referred to as
cognitive diagnosis models. CDMs are latent trait measurement models that explicitly allow for
inferences about the underlying cognitive processes involved in responding to items and the manner
in which these processes interact. In this sense, CDMs establish a link between cognitive psychology
and statistical modeling. Earlier applications of CDMs are found in cognitively diagnostic educa-
tional assessment (Leighton & Gierl, 2007; Nichols, Chipman, & Brennan, 1995). The information
that these models provide has been used for diagnosing students’ strengths and weaknesses, thereby
giving teachers information that can be used to design instruction and intervention.
CDMs emerged from different fields: theory of classification (restricted latent class models;
Haertel, 1989), item response theory (linear logistic test model; Fischer, 1973), and mathematical
psychology (knowledge space theory; Doignon & Falmagne, 1999). Based on these different
approaches, CDMs have many labels (e.g., cognitively diagnostic models, Henson & Douglas,
2005, cognitive psychometric models, Rupp, 2007; structured IRT models, Rupp & Mislevy, 2007).
CDMs are multidimensional, categorical latent-trait models developed primarily for assessing
examinee mastery and nonmastery of a set of skills (e.g., competencies, task, knowledge, and
cognitive process). Unlike traditional item response theory (IRT) models, which generally involve
continuous latent variables, CDMs involve latent variables that are binary (e.g., mastery vs.
4 Organizational Research Methods
at Bibliotheek fac Psych en on February 17, 2016orm.sagepub.comDownloaded from

nonmastery). In the CDM literature, these categorical latent variables have been generically referred
to as attributes. The number of attributes is denoted by K, and the attribute profile of respondent i is
denoted by αi¼ fai1, ai2, . . . , aiKg, where aik¼ 1 or 0 represents mastery or nonmastery of attribute
k, respectively. CDMs are inherently confirmatory in nature as they involve a prespecified loading
structure. The loading structure of a CDM, which is commonly known as Q-matrix (Tatsuoka,
1983), is a mapping structure that indicates the KSAOs required for successfully answering each
individual item. A Q-matrix can be viewed as a cognitive design matrix that makes explicit the
internal structure of a test. Table 1 shows the initial Q-matrix for the 23-item SJT that will be used as
example in this article.
As can be seen from the table, for this test, K¼ 4 attributes are assumed to underlie the process of
responding. Consider the first five items in Table 1: Items 1 and 3 require attribute 1 only; item 2
requires both attributes 2 and 3; item 4 requires attribute 4 only; and item 5 requires both attributes 1
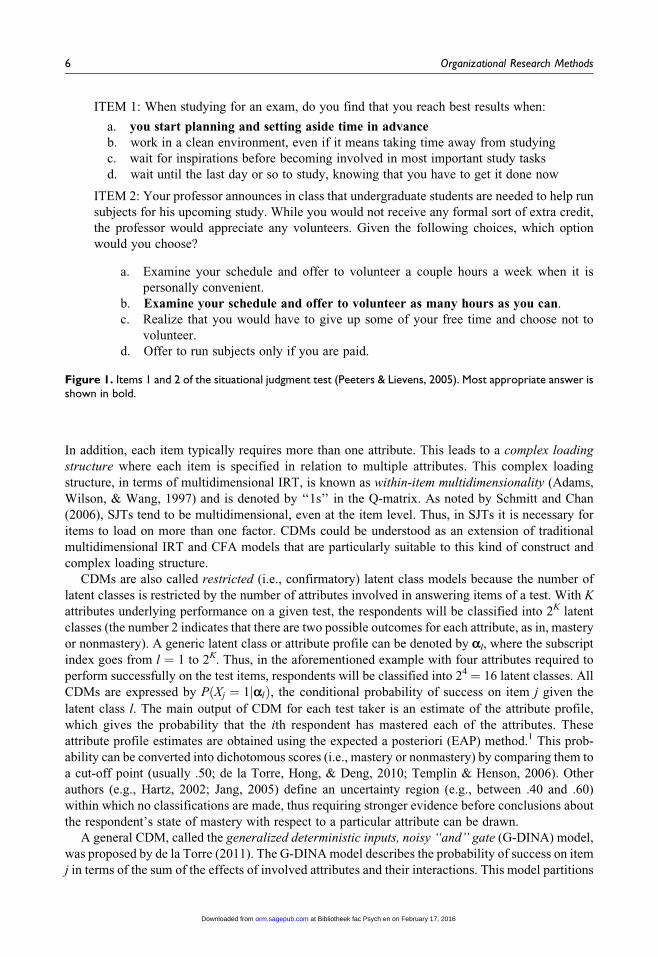
and 2. Items 1 and 2 are shown in Figure 1. Item 1 measures study habits. Students who engage in
regular acts of studying probably will answer this item correctly. Item 2 measures study attitudes and
helping others. More likely than not, students who approve the broader goals of education (e.g.,
education should be within everyone’s reach) and tend to help others will correctly answer this item.
Confirmatory factor analysis (CFA) models and IRT models usually have a simple structure, that
is, each item loads only on one factor (for a detailed discussion, see McDonald, 1999). Factors as
defined in these models are generally broader constructs (e.g., numerical ability). In contrast, in the
case of CDMs, attributes are more narrowly defined (e.g., converting a whole number to a fraction).
Table 1. Initial Q-matrix.
Attribute
Item 1. Study Habits 2. Study Attitudes 3. Helping Others 4. Generalized Compliance
1 1 0 0 02 0 1 1 03 1 0 0 04 0 0 0 15 1 1 0 06 1 0 0 07 1 0 0 08 1 1 0 19 1 0 0 010 0 0 1 011 1 1 0 012 1 0 1 013 1 0 0 114 1 1 0 015 1 1 0 116 1 0 0 017 0 0 1 018 0 0 1 019 1 1 0 120 1 0 0 021 1 1 0 022 0 1 1 123 0 1 1 0
Note: 1 ¼ the attribute is required to choose the most effective response option; 0 ¼ the attribute is not required to choosethe most effective response option.
Sorrel et al. 5
at Bibliotheek fac Psych en on February 17, 2016orm.sagepub.comDownloaded from
In addition, each item typically requires more than one attribute. This leads to a complex loading
structure where each item is specified in relation to multiple attributes. This complex loading
structure, in terms of multidimensional IRT, is known as within-item multidimensionality (Adams,
Wilson, & Wang, 1997) and is denoted by ‘‘1s’’ in the Q-matrix. As noted by Schmitt and Chan
(2006), SJTs tend to be multidimensional, even at the item level. Thus, in SJTs it is necessary for
items to load on more than one factor. CDMs could be understood as an extension of traditional
multidimensional IRT and CFA models that are particularly suitable to this kind of construct and
complex loading structure.
CDMs are also called restricted (i.e., confirmatory) latent class models because the number of
latent classes is restricted by the number of attributes involved in answering items of a test. With K
attributes underlying performance on a given test, the respondents will be classified into 2K latent
classes (the number 2 indicates that there are two possible outcomes for each attribute, as in, mastery
or nonmastery). A generic latent class or attribute profile can be denoted by αl, where the subscript
index goes from l ¼ 1 to 2K. Thus, in the aforementioned example with four attributes required to
perform successfully on the test items, respondents will be classified into 24 ¼ 16 latent classes. All
CDMs are expressed by PðXj ¼ 1jαlÞ, the conditional probability of success on item j given the
latent class l. The main output of CDM for each test taker is an estimate of the attribute profile,
which gives the probability that the ith respondent has mastered each of the attributes. These
attribute profile estimates are obtained using the expected a posteriori (EAP) method.1 This prob-
ability can be converted into dichotomous scores (i.e., mastery or nonmastery) by comparing them to
a cut-off point (usually .50; de la Torre, Hong, & Deng, 2010; Templin & Henson, 2006). Other
authors (e.g., Hartz, 2002; Jang, 2005) define an uncertainty region (e.g., between .40 and .60)
within which no classifications are made, thus requiring stronger evidence before conclusions about
the respondent’s state of mastery with respect to a particular attribute can be drawn.
A general CDM, called the generalized deterministic inputs, noisy ‘‘and’’ gate (G-DINA) model,
was proposed by de la Torre (2011). The G-DINA model describes the probability of success on item
j in terms of the sum of the effects of involved attributes and their interactions. This model partitions
ITEM 1: When studying for an exam, do you find that you reach best results when:
a. you start planning and setting aside time in advance
b. work in a clean environment, even if it means taking time away from studying
c. wait for inspirations before becoming involved in most important study tasks
d. wait until the last day or so to study, knowing that you have to get it done now
ITEM 2: Your professor announces in class that undergraduate students are needed to help run
subjects for his upcoming study. While you would not receive any formal sort of extra credit,
the professor would appreciate any volunteers. Given the following choices, which option
would you choose?
a. Examine your schedule and offer to volunteer a couple hours a week when it is
personally convenient.
b. Examine your schedule and offer to volunteer as many hours as you can.
c. Realize that you would have to give up some of your free time and choose not to
volunteer.
d. Offer to run subjects only if you are paid.
Figure 1. Items 1 and 2 of the situational judgment test (Peeters & Lievens, 2005). Most appropriate answer isshown in bold.
6 Organizational Research Methods
at Bibliotheek fac Psych en on February 17, 2016orm.sagepub.comDownloaded from
the latent classes into 2K�j latent groups, where K�j is the number of attributes required for item j. For
example, Item 2 in Figure 1 requires two of the four attributes. These two attributes lead to four
latent groups: those who mastered both attributes, one of the attributes, or none of the attributes.
Each latent group represents one reduced attribute vector a�lj and has an associated probability of
success, written as
PðXij ¼ 1jα�ljÞ ¼ dj0 þXK�j
k¼1
djkalk þXK�j
k0¼kþ1
XK�j�1
k¼1
djkk0alkalk
0 . . . þ dj12 ... K�j
YK�jk¼1
alk0
where dj0 is the intercept for item j (i.e., the probability of a correct response to an item when none
of the required attributes for the item has been mastered), djk is the main effect due to ak (i.e., the
change in the probability of a correct response as a result of mastering a single attribute), djkk0 is
the interaction effect due to ak and ak0 (i.e., the change in the probability of a correct response due to
the mastery of both attributes), and dj12 ... K�j
is the interaction effect due to a1; . . . ; aK�j
(i.e., the
change in the probability of a correct response due to the mastery of all the required attributes).
The G-DINA model subsumes several commonly encountered CDMs. These include the DINO
(deterministic input, noisy ‘‘or’’ gate; Templin & Henson, 2006) and DINA (deterministic input,
noisy ‘‘and’’ gate; Haertel, 1989; Junker & Sijtsma, 2001) models. If several attributes are required
for correctly answering the items, the DINA model can be obtained from the G-DINA model
by setting to zero all terms except for d0 and dj12 ... K�j; in the case of DINO model, there are also
only two parameters per item, namely d0 and djk , with the important exception that djk is constrained
to be equal to djk ¼ �djk0k00 ¼ � � � ¼ ð�1ÞK
�j þ1dj12 ... K�
jfor k ¼ 1; . . . ;K�j ; k0 ¼ 1; . . . ;K�j � 1, and
k00 > k0; . . . ;K�j , so that some lower-order terms will be cancelled by the corresponding high-order
terms. The DINA is a noncompensatory model that divides respondents in those who have mastered
all measured attributes and those who are lacking at least one measured attribute, whereas the DINO
is a compensatory model that divides respondents in those who master at least one measured
attribute and those who are lacking all measured attributes. In this respect, the DINA model involves
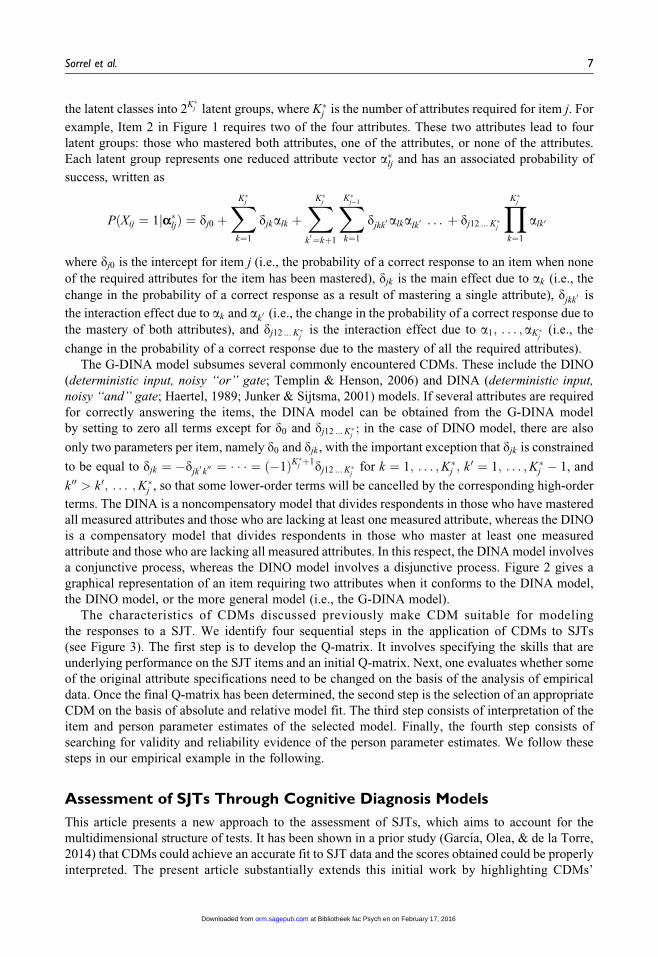
a conjunctive process, whereas the DINO model involves a disjunctive process. Figure 2 gives a
graphical representation of an item requiring two attributes when it conforms to the DINA model,
the DINO model, or the more general model (i.e., the G-DINA model).
The characteristics of CDMs discussed previously make CDM suitable for modeling
the responses to a SJT. We identify four sequential steps in the application of CDMs to SJTs
(see Figure 3). The first step is to develop the Q-matrix. It involves specifying the skills that are
underlying performance on the SJT items and an initial Q-matrix. Next, one evaluates whether some
of the original attribute specifications need to be changed on the basis of the analysis of empirical
data. Once the final Q-matrix has been determined, the second step is the selection of an appropriate
CDM on the basis of absolute and relative model fit. The third step consists of interpretation of the
item and person parameter estimates of the selected model. Finally, the fourth step consists of
searching for validity and reliability evidence of the person parameter estimates. We follow these
steps in our empirical example in the following.
Assessment of SJTs Through Cognitive Diagnosis Models
This article presents a new approach to the assessment of SJTs, which aims to account for the
multidimensional structure of tests. It has been shown in a prior study (Garcıa, Olea, & de la Torre,
2014) that CDMs could achieve an accurate fit to SJT data and the scores obtained could be properly
interpreted. The present article substantially extends this initial work by highlighting CDMs’
Sorrel et al. 7
at Bibliotheek fac Psych en on February 17, 2016orm.sagepub.comDownloaded from

Figure 2. This figure depicts the probability of correctly answering an item requiring two attributes fordeterministic input, noisy ‘‘and’’ gate (DINA), deterministic input, noisy ‘‘or’’ gate (DINO), and generalized deterministicinputs, noisy ‘‘and’’ gate (G-DINA) models. Model parameters are denoted by d.
Figure 3. Sequential steps in the application of cognitive diagnosis models (CDMs).
8 Organizational Research Methods
at Bibliotheek fac Psych en on February 17, 2016orm.sagepub.comDownloaded from
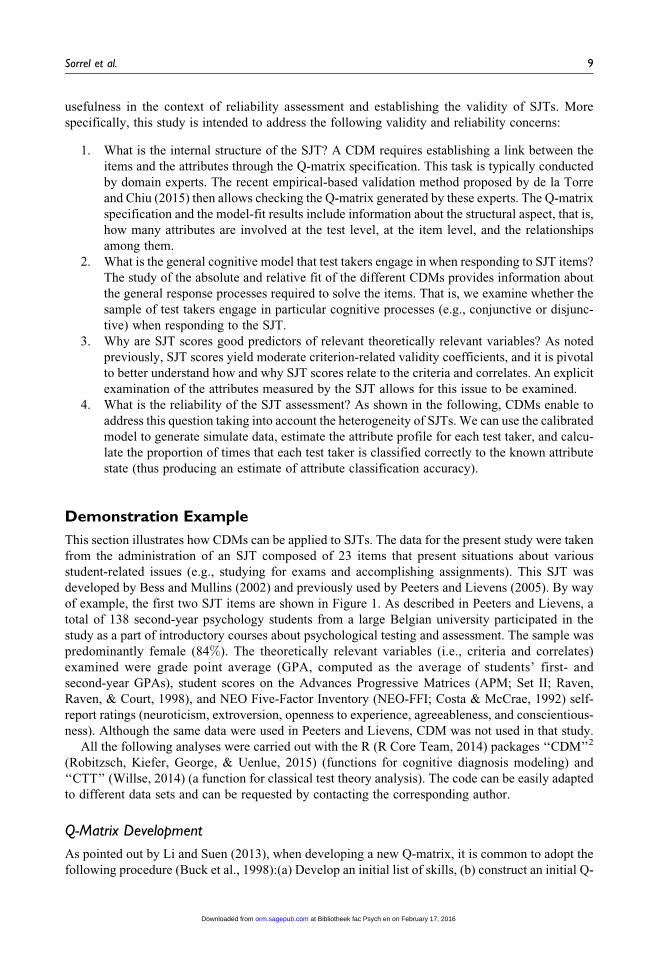
usefulness in the context of reliability assessment and establishing the validity of SJTs. More
specifically, this study is intended to address the following validity and reliability concerns:
1. What is the internal structure of the SJT? A CDM requires establishing a link between the
items and the attributes through the Q-matrix specification. This task is typically conducted
by domain experts. The recent empirical-based validation method proposed by de la Torre
and Chiu (2015) then allows checking the Q-matrix generated by these experts. The Q-matrix
specification and the model-fit results include information about the structural aspect, that is,
how many attributes are involved at the test level, at the item level, and the relationships
among them.
2. What is the general cognitive model that test takers engage in when responding to SJT items?
The study of the absolute and relative fit of the different CDMs provides information about
the general response processes required to solve the items. That is, we examine whether the
sample of test takers engage in particular cognitive processes (e.g., conjunctive or disjunc-
tive) when responding to the SJT.
3. Why are SJT scores good predictors of relevant theoretically relevant variables? As noted
previously, SJT scores yield moderate criterion-related validity coefficients, and it is pivotal
to better understand how and why SJT scores relate to the criteria and correlates. An explicit
examination of the attributes measured by the SJT allows for this issue to be examined.
4. What is the reliability of the SJT assessment? As shown in the following, CDMs enable to
address this question taking into account the heterogeneity of SJTs. We can use the calibrated
model to generate simulate data, estimate the attribute profile for each test taker, and calcu-
late the proportion of times that each test taker is classified correctly to the known attribute
state (thus producing an estimate of attribute classification accuracy).
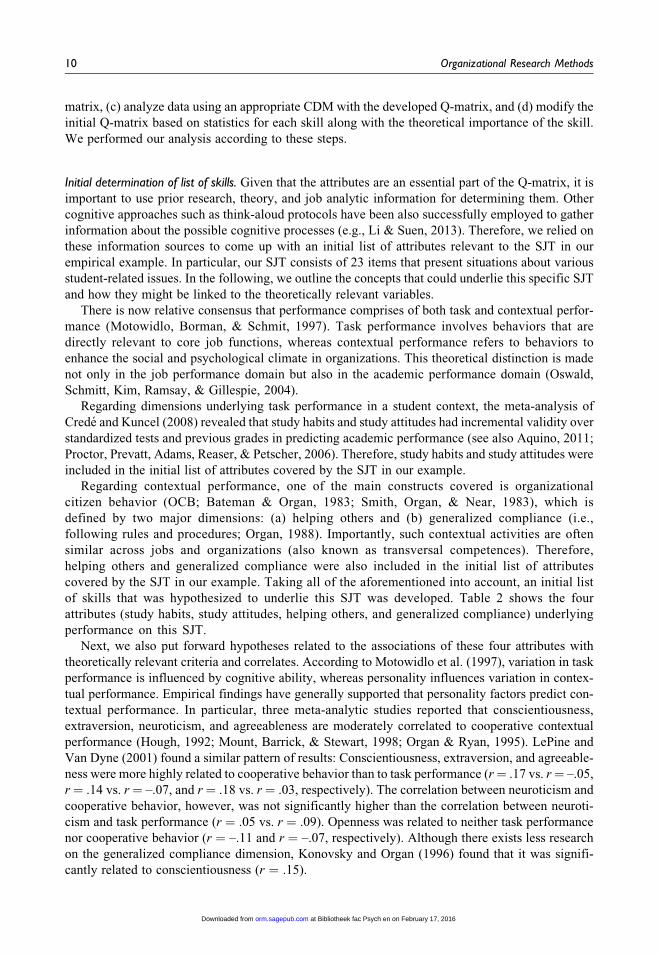
Demonstration Example
This section illustrates how CDMs can be applied to SJTs. The data for the present study were taken
from the administration of an SJT composed of 23 items that present situations about various
student-related issues (e.g., studying for exams and accomplishing assignments). This SJT was
developed by Bess and Mullins (2002) and previously used by Peeters and Lievens (2005). By way
of example, the first two SJT items are shown in Figure 1. As described in Peeters and Lievens, a
total of 138 second-year psychology students from a large Belgian university participated in the
study as a part of introductory courses about psychological testing and assessment. The sample was
predominantly female (84%). The theoretically relevant variables (i.e., criteria and correlates)
examined were grade point average (GPA, computed as the average of students’ first- and
second-year GPAs), student scores on the Advances Progressive Matrices (APM; Set II; Raven,
Raven, & Court, 1998), and NEO Five-Factor Inventory (NEO-FFI; Costa & McCrae, 1992) self-
report ratings (neuroticism, extroversion, openness to experience, agreeableness, and conscientious-
ness). Although the same data were used in Peeters and Lievens, CDM was not used in that study.
All the following analyses were carried out with the R (R Core Team, 2014) packages ‘‘CDM’’2
(Robitzsch, Kiefer, George, & Uenlue, 2015) (functions for cognitive diagnosis modeling) and
‘‘CTT’’ (Willse, 2014) (a function for classical test theory analysis). The code can be easily adapted
to different data sets and can be requested by contacting the corresponding author.
Q-Matrix Development
As pointed out by Li and Suen (2013), when developing a new Q-matrix, it is common to adopt the
following procedure (Buck et al., 1998):(a) Develop an initial list of skills, (b) construct an initial Q-
Sorrel et al. 9
at Bibliotheek fac Psych en on February 17, 2016orm.sagepub.comDownloaded from
matrix, (c) analyze data using an appropriate CDM with the developed Q-matrix, and (d) modify the
initial Q-matrix based on statistics for each skill along with the theoretical importance of the skill.
We performed our analysis according to these steps.
Initial determination of list of skills. Given that the attributes are an essential part of the Q-matrix, it is
important to use prior research, theory, and job analytic information for determining them. Other
cognitive approaches such as think-aloud protocols have been also successfully employed to gather
information about the possible cognitive processes (e.g., Li & Suen, 2013). Therefore, we relied on
these information sources to come up with an initial list of attributes relevant to the SJT in our
empirical example. In particular, our SJT consists of 23 items that present situations about various
student-related issues. In the following, we outline the concepts that could underlie this specific SJT
and how they might be linked to the theoretically relevant variables.
There is now relative consensus that performance comprises of both task and contextual perfor-
mance (Motowidlo, Borman, & Schmit, 1997). Task performance involves behaviors that are
directly relevant to core job functions, whereas contextual performance refers to behaviors to
enhance the social and psychological climate in organizations. This theoretical distinction is made
not only in the job performance domain but also in the academic performance domain (Oswald,
Schmitt, Kim, Ramsay, & Gillespie, 2004).
Regarding dimensions underlying task performance in a student context, the meta-analysis of
Crede and Kuncel (2008) revealed that study habits and study attitudes had incremental validity over
standardized tests and previous grades in predicting academic performance (see also Aquino, 2011;
Proctor, Prevatt, Adams, Reaser, & Petscher, 2006). Therefore, study habits and study attitudes were
included in the initial list of attributes covered by the SJT in our example.
Regarding contextual performance, one of the main constructs covered is organizational
citizen behavior (OCB; Bateman & Organ, 1983; Smith, Organ, & Near, 1983), which is
defined by two major dimensions: (a) helping others and (b) generalized compliance (i.e.,
following rules and procedures; Organ, 1988). Importantly, such contextual activities are often
similar across jobs and organizations (also known as transversal competences). Therefore,
helping others and generalized compliance were also included in the initial list of attributes
covered by the SJT in our example. Taking all of the aforementioned into account, an initial list
of skills that was hypothesized to underlie this SJT was developed. Table 2 shows the four
attributes (study habits, study attitudes, helping others, and generalized compliance) underlying
performance on this SJT.
Next, we also put forward hypotheses related to the associations of these four attributes with
theoretically relevant criteria and correlates. According to Motowidlo et al. (1997), variation in task
performance is influenced by cognitive ability, whereas personality influences variation in contex-
tual performance. Empirical findings have generally supported that personality factors predict con-
textual performance. In particular, three meta-analytic studies reported that conscientiousness,
extraversion, neuroticism, and agreeableness are moderately correlated to cooperative contextual
performance (Hough, 1992; Mount, Barrick, & Stewart, 1998; Organ & Ryan, 1995). LePine and
Van Dyne (2001) found a similar pattern of results: Conscientiousness, extraversion, and agreeable-
ness were more highly related to cooperative behavior than to task performance (r¼ .17 vs. r¼ –.05,
r ¼ .14 vs. r ¼ –.07, and r¼ .18 vs. r ¼ .03, respectively). The correlation between neuroticism and
cooperative behavior, however, was not significantly higher than the correlation between neuroti-
cism and task performance (r ¼ .05 vs. r ¼ .09). Openness was related to neither task performance
nor cooperative behavior (r ¼ –.11 and r ¼ –.07, respectively). Although there exists less research
on the generalized compliance dimension, Konovsky and Organ (1996) found that it was signifi-
cantly related to conscientiousness (r ¼ .15).
10 Organizational Research Methods
at Bibliotheek fac Psych en on February 17, 2016orm.sagepub.comDownloaded from

Concerning task performance, seven meta-analysis studies demonstrated consistent relationships
between conscientiousness and task performance (the r coefficients vary from .20 to .31) across
various occupational groups (Barrick & Mount, 1991; Hough, Eaton, Dunnette, Kamp, & McCloy,
1990; Hurtz & Donovan, 2000; Salgado, 1997; Tett, Jackson, & Rothstein, 1991). Although it has
been proposed that agreeableness may be an important predictor of task performance (Barrick &
Mount, 1991), there is generally no evidence supporting this claim (Borman, White, & Dorsey,
1995; Hough et al., 1990; Hurtz & Donovan, 2000; Kamdar & Van Dyne, 2007; LePine & Van
Dyne, 2001; Salgado, 1997).
Thus, given the aforementioned backdrop, we hypothesized that personality factors would be
more highly related to the contextual performance dimensions of helping others and generalized
compliance. Conversely, we hypothesized that cognitive ability and conscientiousness would be
more highly related to task performance–related attributes such as study habits and study attitudes.
In addition, we hypothesized that GPA would be more highly related to the studies-related attributes.
Construction of the initial Q-matrix. Four experts participated in an expert rating task. All of them were
senior researchers with expertise in competency modeling and with extensive experience in teaching
at the university level, and their native language was Spanish. The operational definitions of the four
attributes were presented for their review and critique. The experts were asked to identify the
Table 2. Attribute Descriptions Based on Test Specifications.
Content Domain Attribute Definition
Typical Behavioral Patterns forPeople Mastering the Attributein the Educational Environment
Task performance:(studies-relatedissues)
Study habits Study habits refers to the pattern ofbehavior adopted by students inthe pursuit of their studies thatserves as the vehicle of learning.It is the degree to which thestudent engages in regular acts ofstudying that are characterizedby appropriate studying routinesoccurring in an environment thatis conducive to studying.
Reviews of material, study everyday, take practice tests,efficiently organize his or herwork, etc.
Study attitudes Study attitudes refers to a student’spositive attitude toward thespecific act of studying and thestudent’s acceptance andapproval of the broader goalsof education.
Think education is relevant to theirfuture, persist with enthusiasmor effort, have a good opinion oftheir teachers, etc.
Contextualperformance:(transversalcompetencies)
Helping others Helping others refers to voluntaryactions that help another personwith a problem. These helpingbehaviors can both be directedwithin or outside theorganization.
Carry out volunteer actions that donot directly benefit them, sharenotes with their peers, helppeers who are in troubles, etc.
Generalizedcompliance
Generalized compliance refers tofollowing rules and procedures,complying with organizationalvalues and policies,conscientiousness, and meetingdeadlines.
Stick with the existing timetable, bealways punctual, do not defy theteacher, etc.
Sorrel et al. 11
at Bibliotheek fac Psych en on February 17, 2016orm.sagepub.comDownloaded from

attributes needed for each item, thereby building the Q-matrix. The experts were also asked to
specify the extent to which they were certain of their decisions. They employed the following
system: 0 ¼ it is certain that the attribute is not measured by the item, 1* ¼ it is possible that the
attribute is measured by the item, 1¼ it is certain that the attribute is measured by the item. A Delphi
process was used consisting of three rounds. In the first round, the experts were asked to identify the
attributes needed for each item. In the second round, each Delphi participant was anonymously
provided with the decisions of the other experts. This round provided an opportunity for participants
to revise their judgments. Finally, in the third round, the four experts met in person and discussed in
detail their opinions and settle the remaining differences. As done in Li and Suen (2013), we
computed the Fleiss’s kappa statistic (Fleiss, 1971) to evaluate the interrater reliability of the
judgments made. We considered Landis and Koch’s (1977) guidelines for interpreting kappa values,
with values from .0 to .20 indicating a slight agreement, .21 to .40 a fair agreement, .41 to .60 a
moderate agreement, .61 to .80 a substantial agreement, and .81 to 1 an almost perfect or perfect
agreement. On the basis of the available evidence, we built the initial Q-matrix.
The experts’ ratings across the three rounds are shown in Table 3. With regard to the first round,
the Fleiss’s kappa coefficients were .81 for helping others and generalized compliance and .53 for
study habits indicating almost perfect and moderate agreements, respectively. However, the coeffi-
cient was only .17 for study attitudes. One possible reason for this is that this attribute is much more
subjective than the other attributes, which made defining its behavioral outcomes more difficult. In
the second round, when the experts were anonymously provided with the decisions made by the
other experts, a high degree of agreement was achieved (the kappa coefficient for study attitudes
increased up to .57). Finally, in the third round, a total agreement was achieved. The resulting
attribute-item associations defined the initial Q-matrix (see Table 1). As can be seen, 11 items
involved only one attribute, 8 items involved two attributes, and 4 items involved three attributes.
Verification of the initial Q-matrix: Analysis of empirical data using an appropriate CDM. There are many
studies focused on the effect of Q-matrix misspecifications (e.g., de la Torre, 2008; Rupp &
Templin, 2008a). In general, the results suggest that whenever a Q-matrix row is underspecified
(i.e., a 1 is changed to a 0), the response probabilities for nonmasters of all measured attributes are
overestimated (i.e., the items appear ‘‘easier’’). In contrast, whenever a Q-matrix row is overspeci-
fied (i.e., a 0 is changed to a 1), we underestimate the response probabilities for masters of all
measured attributes (i.e., the items appear ‘‘harder’’). In addition, misspecifications in the Q-matrix
may have important effects on the classification rates. Once the initial Q-matrix is specified, it is
therefore important to verify its correctness. Otherwise, we cannot address any model misfit attri-
butable to the Q-matrix.
To accomplish this, we used the test takers’ responses to the SJT to empirically validate the Q-
matrix following the general method of empirical Q-matrix validation recently proposed by de la
Torre and Chiu (2015). This method is based on a discrimination index, which can be used in
conjunction with the G-DINA model. Thus, the proposed index does not require making an assump-
tion about which specific models are involved. The general discrimination index is defined as
B2j ¼X2K�
j
c¼1
wðα�cjÞ ½Pðα�cjÞ � �Pj�2;
where w ðα�cjÞ is the probability of the reduced attribute pattern, α�cj;Pðα�cjÞ is the probability of
success of the reduced attribute pattern α�cj, and �Pj ¼P2
K�j
c¼1wðα�cjÞPðα�cjÞ is the mean success prob-
ability. This discrimination index measures the extent to which an item can differentiate between the
12 Organizational Research Methods
at Bibliotheek fac Psych en on February 17, 2016orm.sagepub.comDownloaded from
different reduced attributed vectors based on their success probabilities and is minimum (i.e., equal
to zero) when Pðα�1 jÞ ¼ Pðα�2 jÞ ¼ . . . ¼ P α�2
K�j j
� �¼ �P: The maximum value of B2 for item
j (i.e., B2jmaxÞ is obtained when all attributes are specified (de la Torre & Chiu, 2015). In addition,
de la Torre and Chiu (2015) define the proportion of variance accounted for (PVAF) by a particular
q-vector relative to this maximum as B2=B2jmax.
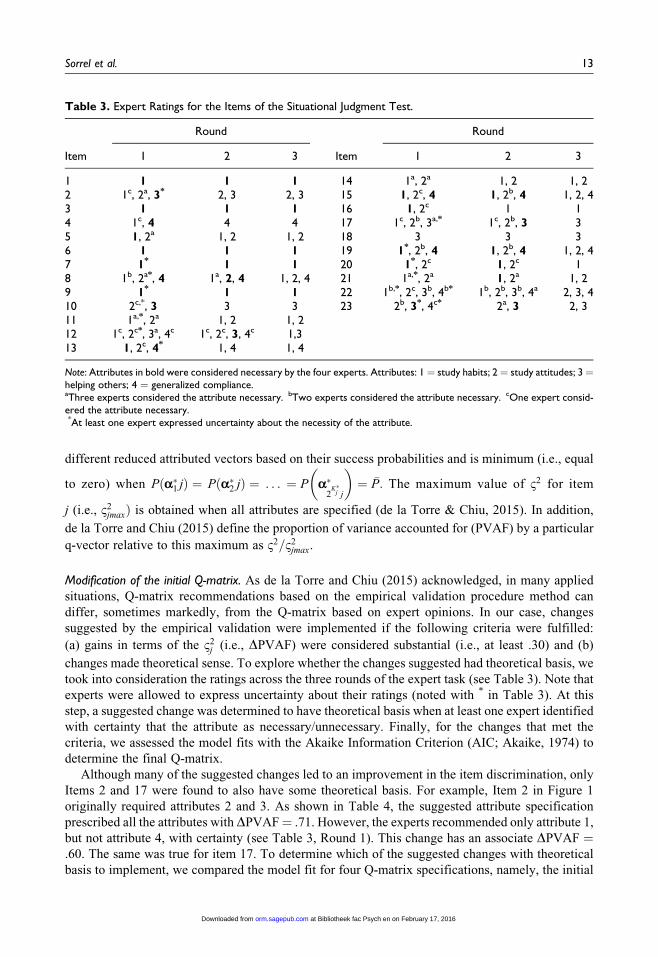
Modification of the initial Q-matrix. As de la Torre and Chiu (2015) acknowledged, in many applied
situations, Q-matrix recommendations based on the empirical validation procedure method can
differ, sometimes markedly, from the Q-matrix based on expert opinions. In our case, changes
suggested by the empirical validation were implemented if the following criteria were fulfilled:
(a) gains in terms of the B2j (i.e., DPVAF) were considered substantial (i.e., at least .30) and (b)
changes made theoretical sense. To explore whether the changes suggested had theoretical basis, we
took into consideration the ratings across the three rounds of the expert task (see Table 3). Note that
experts were allowed to express uncertainty about their ratings (noted with * in Table 3). At this
step, a suggested change was determined to have theoretical basis when at least one expert identified
with certainty that the attribute as necessary/unnecessary. Finally, for the changes that met the
criteria, we assessed the model fits with the Akaike Information Criterion (AIC; Akaike, 1974) to
determine the final Q-matrix.
Although many of the suggested changes led to an improvement in the item discrimination, only
Items 2 and 17 were found to also have some theoretical basis. For example, Item 2 in Figure 1
originally required attributes 2 and 3. As shown in Table 4, the suggested attribute specification
prescribed all the attributes with DPVAF¼ .71. However, the experts recommended only attribute 1,
but not attribute 4, with certainty (see Table 3, Round 1). This change has an associate DPVAF ¼.60. The same was true for item 17. To determine which of the suggested changes with theoretical
basis to implement, we compared the model fit for four Q-matrix specifications, namely, the initial
Table 3. Expert Ratings for the Items of the Situational Judgment Test.
Round Round
Item 1 2 3 Item 1 2 3
1 1 1 1 14 1a, 2a 1, 2 1, 22 1c, 2a, 3* 2, 3 2, 3 15 1, 2c, 4 1, 2b, 4 1, 2, 43 1 1 1 16 1, 2c 1 14 1c, 4 4 4 17 1c, 2b, 3a,* 1c, 2b, 3 35 1, 2a 1, 2 1, 2 18 3 3 36 1 1 1 19 1*, 2b, 4 1, 2b, 4 1, 2, 47 1* 1 1 20 1*, 2c 1, 2c 18 1b, 2a*, 4 1a, 2, 4 1, 2, 4 21 1a,*, 2a 1, 2a 1, 29 1* 1 1 22 1b,*, 2c, 3b, 4b* 1b, 2b, 3b, 4a 2, 3, 410 2c,*, 3 3 3 23 2b, 3*, 4c* 2a, 3 2, 311 1a,*, 2a 1, 2 1, 212 1c, 2c*, 3a, 4c 1c, 2c, 3, 4c 1,313 1, 2c, 4* 1, 4 1, 4
Note: Attributes in bold were considered necessary by the four experts. Attributes: 1¼ study habits; 2¼ study attitudes; 3¼helping others; 4 ¼ generalized compliance.aThree experts considered the attribute necessary. bTwo experts considered the attribute necessary. cOne expert consid-ered the attribute necessary.*At least one expert expressed uncertainty about the necessity of the attribute.
Sorrel et al. 13
at Bibliotheek fac Psych en on February 17, 2016orm.sagepub.comDownloaded from
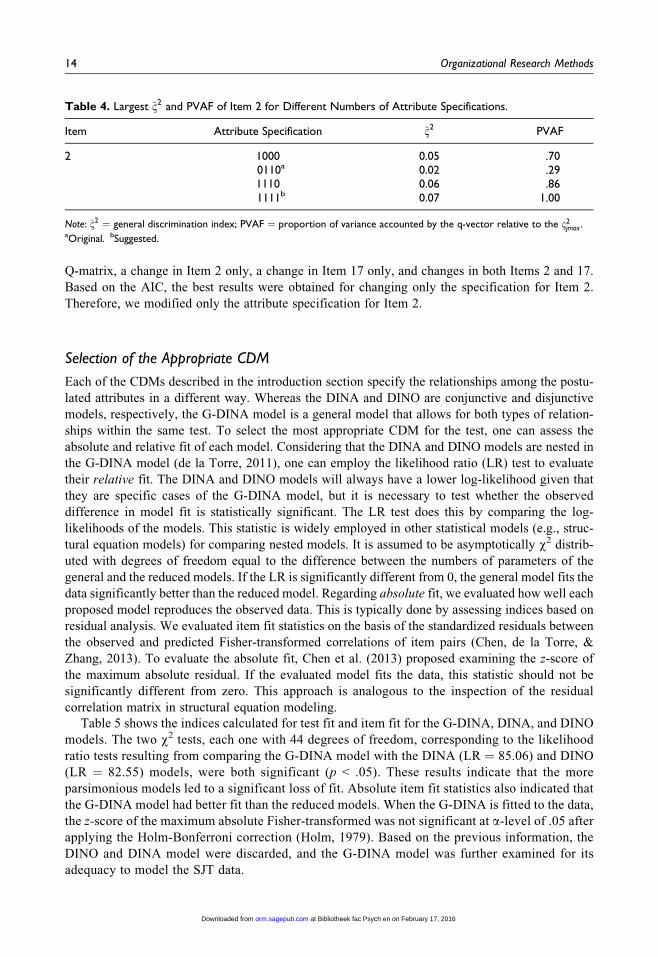
Q-matrix, a change in Item 2 only, a change in Item 17 only, and changes in both Items 2 and 17.
Based on the AIC, the best results were obtained for changing only the specification for Item 2.
Therefore, we modified only the attribute specification for Item 2.
Selection of the Appropriate CDM
Each of the CDMs described in the introduction section specify the relationships among the postu-
lated attributes in a different way. Whereas the DINA and DINO are conjunctive and disjunctive
models, respectively, the G-DINA model is a general model that allows for both types of relation-
ships within the same test. To select the most appropriate CDM for the test, one can assess the
absolute and relative fit of each model. Considering that the DINA and DINO models are nested in
the G-DINA model (de la Torre, 2011), one can employ the likelihood ratio (LR) test to evaluate
their relative fit. The DINA and DINO models will always have a lower log-likelihood given that
they are specific cases of the G-DINA model, but it is necessary to test whether the observed
difference in model fit is statistically significant. The LR test does this by comparing the log-
likelihoods of the models. This statistic is widely employed in other statistical models (e.g., struc-
tural equation models) for comparing nested models. It is assumed to be asymptotically w2 distrib-
uted with degrees of freedom equal to the difference between the numbers of parameters of the
general and the reduced models. If the LR is significantly different from 0, the general model fits the
data significantly better than the reduced model. Regarding absolute fit, we evaluated how well each
proposed model reproduces the observed data. This is typically done by assessing indices based on
residual analysis. We evaluated item fit statistics on the basis of the standardized residuals between
the observed and predicted Fisher-transformed correlations of item pairs (Chen, de la Torre, &
Zhang, 2013). To evaluate the absolute fit, Chen et al. (2013) proposed examining the z-score of
the maximum absolute residual. If the evaluated model fits the data, this statistic should not be
significantly different from zero. This approach is analogous to the inspection of the residual
correlation matrix in structural equation modeling.
Table 5 shows the indices calculated for test fit and item fit for the G-DINA, DINA, and DINO
models. The two w2 tests, each one with 44 degrees of freedom, corresponding to the likelihood
ratio tests resulting from comparing the G-DINA model with the DINA (LR ¼ 85.06) and DINO
(LR ¼ 82.55) models, were both significant (p < .05). These results indicate that the more
parsimonious models led to a significant loss of fit. Absolute item fit statistics also indicated that
the G-DINA model had better fit than the reduced models. When the G-DINA is fitted to the data,
the z-score of the maximum absolute Fisher-transformed was not significant at a-level of .05 after
applying the Holm-Bonferroni correction (Holm, 1979). Based on the previous information, the
DINO and DINA model were discarded, and the G-DINA model was further examined for its
adequacy to model the SJT data.
Table 4. Largest B2 and PVAF of Item 2 for Different Numbers of Attribute Specifications.
Item Attribute Specification B2 PVAF
2 1000 0.05 .700110a 0.02 .291110 0.06 .861111b 0.07 1.00
Note: B2 ¼ general discrimination index; PVAF ¼ proportion of variance accounted by the q-vector relative to the B2jmax .
aOriginal. bSuggested.
14 Organizational Research Methods
at Bibliotheek fac Psych en on February 17, 2016orm.sagepub.comDownloaded from
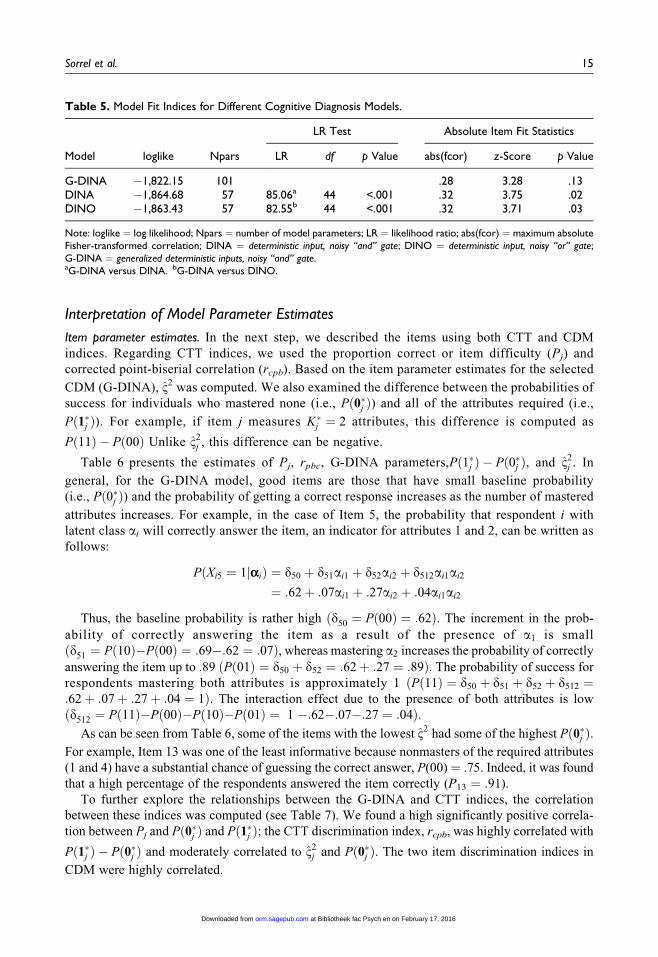
Interpretation of Model Parameter Estimates
Item parameter estimates. In the next step, we described the items using both CTT and CDM
indices. Regarding CTT indices, we used the proportion correct or item difficulty (Pj) and
corrected point-biserial correlation (rcpb). Based on the item parameter estimates for the selected
CDM (G-DINA), B2 was computed. We also examined the difference between the probabilities of
success for individuals who mastered none (i.e., Pð0�j Þ) and all of the attributes required (i.e.,
Pð1�j Þ). For example, if item j measures K�j ¼ 2 attributes, this difference is computed as
Pð11Þ � Pð00Þ Unlike B2j , this difference can be negative.
Table 6 presents the estimates of Pj, rpbc, G-DINA parameters,Pð1�j Þ � Pð0�j Þ, and B2j . In
general, for the G-DINA model, good items are those that have small baseline probability
(i.e., Pð0�j Þ) and the probability of getting a correct response increases as the number of mastered
attributes increases. For example, in the case of Item 5, the probability that respondent i with
latent class ai will correctly answer the item, an indicator for attributes 1 and 2, can be written as
follows:
PðXi5 ¼ 1jαiÞ ¼ d50 þ d51ai1 þ d52ai2 þ d512ai1ai2
¼ :62þ :07ai1 þ :27ai2 þ :04ai1ai2
Thus, the baseline probability is rather high ðd50 ¼ Pð00Þ ¼ :62Þ. The increment in the prob-
ability of correctly answering the item as a result of the presence of a1 is small
ðd51 ¼ Pð10Þ�Pð00Þ ¼ :69�:62 ¼ :07Þ, whereas mastering a2 increases the probability of correctly
answering the item up to .89 ðPð01Þ ¼ d50 þ d52 ¼ :62þ :27 ¼ :89Þ. The probability of success for
respondents mastering both attributes is approximately 1 ðPð11Þ ¼ d50 þ d51 þ d52 þ d512 ¼:62þ :07þ :27þ :04 ¼ 1Þ. The interaction effect due to the presence of both attributes is low
ðd512 ¼ Pð11Þ�Pð00Þ�Pð10Þ�Pð01Þ ¼ 1 �:62�:07�:27 ¼ :04Þ.As can be seen from Table 6, some of the items with the lowest B2 had some of the highest Pð0�j Þ.
For example, Item 13 was one of the least informative because nonmasters of the required attributes
(1 and 4) have a substantial chance of guessing the correct answer, P(00)¼ .75. Indeed, it was found
that a high percentage of the respondents answered the item correctly (P13 ¼ .91).
To further explore the relationships between the G-DINA and CTT indices, the correlation
between these indices was computed (see Table 7). We found a high significantly positive correla-
tion between Pj and Pð0�j Þ and Pð1�j Þ; the CTT discrimination index, rcpb, was highly correlated with
Pð1�j Þ � Pð0�j Þ and moderately correlated to B2j and Pð0�j Þ. The two item discrimination indices in
CDM were highly correlated.
Table 5. Model Fit Indices for Different Cognitive Diagnosis Models.
Model loglike Npars
LR Test Absolute Item Fit Statistics
LR df p Value abs(fcor) z-Score p Value
G-DINA �1,822.15 101 .28 3.28 .13DINA �1,864.68 57 85.06a 44 <.001 .32 3.75 .02DINO �1,863.43 57 82.55b 44 <.001 .32 3.71 .03
Note: loglike ¼ log likelihood; Npars ¼ number of model parameters; LR ¼ likelihood ratio; abs(fcor) ¼ maximum absoluteFisher-transformed correlation; DINA ¼ deterministic input, noisy ‘‘and’’ gate; DINO ¼ deterministic input, noisy ‘‘or’’ gate;G-DINA ¼ generalized deterministic inputs, noisy ‘‘and’’ gate.aG-DINA versus DINA. bG-DINA versus DINO.
Sorrel et al. 15
at Bibliotheek fac Psych en on February 17, 2016orm.sagepub.comDownloaded from

Person parameter estimates. Table 8 shows the attribute class probabilities and the class expected
frequency in the sample of 138 respondents. The second column shows the possible attribute profiles
for all the 16 latent classes. As the third column shows, the attribute profile of a16 ¼ f1111g had the
highest class probability of about .32. That is, approximately 32% of the respondents (as shown in
the fourth column, 44 respondents) were classified as belonging to this latent class and therefore
Table 6. Classical Test Theory Indices and G-DINA Model Item Parameter Estimates.
Item Pj rcpb
Pða�lj Þ Item Discrimination
P(0) P(1)
Pð1�j Þ � Pð0�j Þ B2j
P(00) P(10) P(01) P(11)P(000) P(100) P(010) P(001) P(110) P(101) P(011) P(111)
1 .71 .31 .42 .90 .48 .042 .35 .31 .00 .35 .36 .00 .02 .73 1 .54 .54 .063 .36 .28 .15 .49 .35 .024 .64 .21 .41 .76 .34 .005 .86 .36 .62 .69 .89 1 .38 .026 .52 .11 .43 .59 .16 .017 .60 .08 .62 .59 �.04 .008 .84 .07 .66 .62 1 1 1 1 .77 .83 .17 .019 .54 .14 .34 .67 .33 .0410 .59 .25 .41 .76 .36 .0011 .65 .32 .32 .68 .91 .75 .44 .0112 .63 �.05 .78 .64 .00 .57 �.21 .0113 .91 .16 .75 .95 1 .90 .16 .0014 .43 �.01 .45 .00 .28 .54 .09 .0115 .54 .29 .00 1 .00 .61 .85 .00 .67 .66 .66 .0716 .69 .44 .30 .95 .65 .0817 .37 .11 .24 .49 .25 .0018 .49 .05 .45 .54 .09 .0019 .27 .06 .38 .00 .00 .00 .38 .00 .00 .43 .05 .0320 .40 .03 .32 .45 .12 .0021 .55 .26 .17 1 1 .54 .37 .0022 .72 .12 .58 .00 1 .57 .00 .89 .88 1 .42 .0823 .12 .22 .00 .10 .00 .22 .22 .00
Note: Pða�lj Þ ¼ probability of correctly answer the item for each latent group; Pj¼ item difficulty; rcpb¼ corrected point biserial
correlation; B2j ¼ general discrimination index; G-DINA ¼ generalized deterministic inputs, noisy ‘‘and’’ gate.
Table 7. Relationships Between Classical Test Theory Indices and G-DINA Item Parameter Estimates.
Pj rcpb Pð0�j Þ Pð1�j Þ Pð1�j Þ � Pð0�j Þ B2j
Pj 1rcpb .18 1Pð0�j Þ .70** �.46* 1Pð1�j Þ .91** .40 .51* 1Pð1�j Þ � Pð0�j Þ .13 .87** �.57** .42* 1B2
j .11 .42* �.25 .40 .65** 1
Note: Pj ¼ item difficulty; rcpb ¼ corrected point biserial correlation; B2j general discrimination index; G-DINA ¼ generalized
deterministic inputs, noisy ‘‘and’’ gate.*p < .05. **p < .01.
16 Organizational Research Methods
at Bibliotheek fac Psych en on February 17, 2016orm.sagepub.comDownloaded from
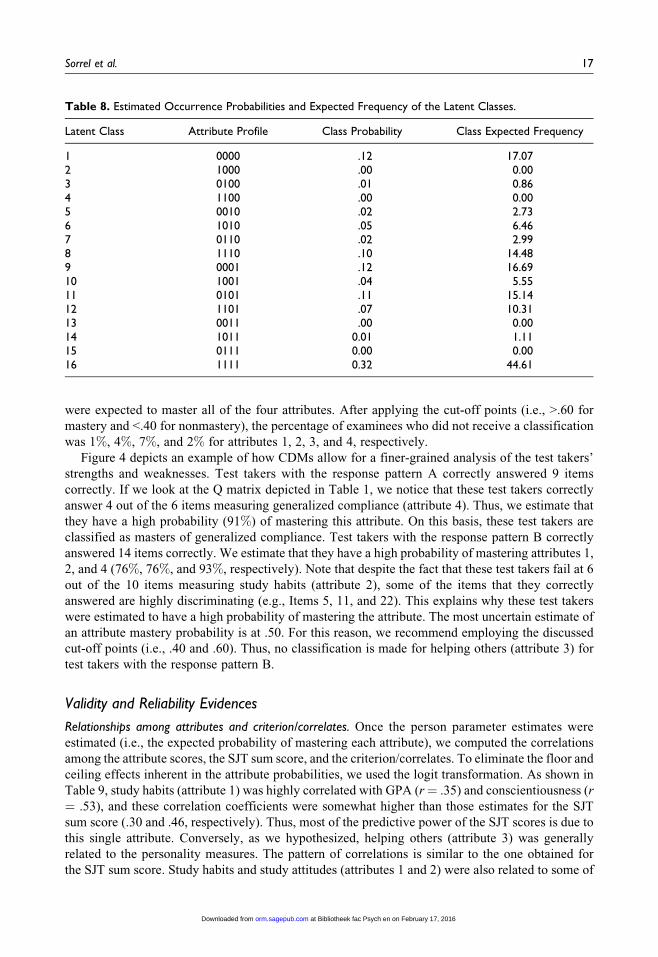
were expected to master all of the four attributes. After applying the cut-off points (i.e., >.60 for
mastery and <.40 for nonmastery), the percentage of examinees who did not receive a classification
was 1%, 4%, 7%, and 2% for attributes 1, 2, 3, and 4, respectively.
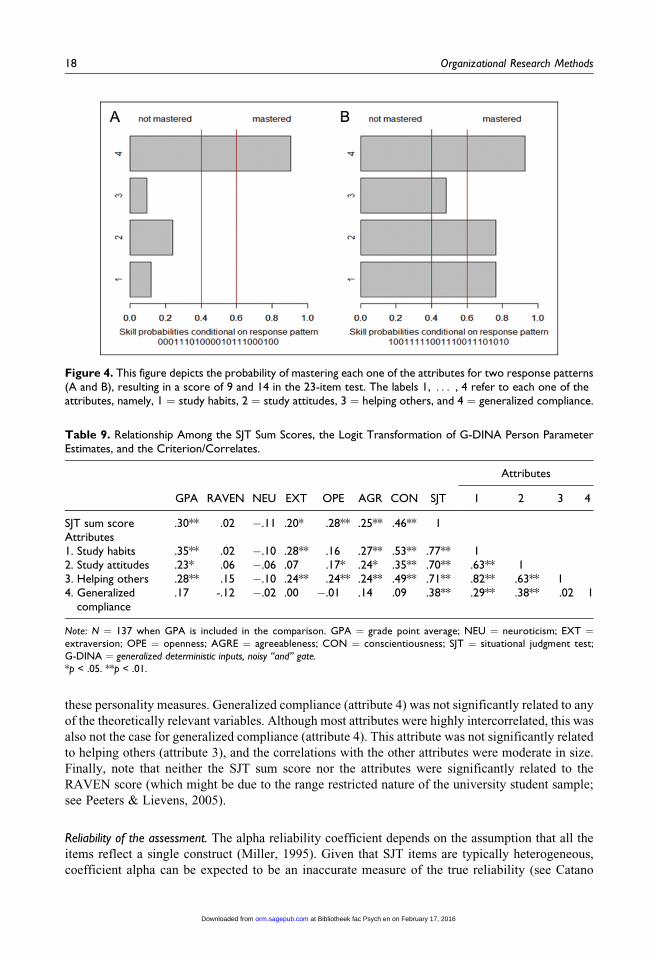
Figure 4 depicts an example of how CDMs allow for a finer-grained analysis of the test takers’
strengths and weaknesses. Test takers with the response pattern A correctly answered 9 items
correctly. If we look at the Q matrix depicted in Table 1, we notice that these test takers correctly
answer 4 out of the 6 items measuring generalized compliance (attribute 4). Thus, we estimate that
they have a high probability (91%) of mastering this attribute. On this basis, these test takers are
classified as masters of generalized compliance. Test takers with the response pattern B correctly
answered 14 items correctly. We estimate that they have a high probability of mastering attributes 1,
2, and 4 (76%, 76%, and 93%, respectively). Note that despite the fact that these test takers fail at 6
out of the 10 items measuring study habits (attribute 2), some of the items that they correctly
answered are highly discriminating (e.g., Items 5, 11, and 22). This explains why these test takers
were estimated to have a high probability of mastering the attribute. The most uncertain estimate of
an attribute mastery probability is at .50. For this reason, we recommend employing the discussed
cut-off points (i.e., .40 and .60). Thus, no classification is made for helping others (attribute 3) for
test takers with the response pattern B.
Validity and Reliability Evidences
Relationships among attributes and criterion/correlates. Once the person parameter estimates were
estimated (i.e., the expected probability of mastering each attribute), we computed the correlations
among the attribute scores, the SJT sum score, and the criterion/correlates. To eliminate the floor and
ceiling effects inherent in the attribute probabilities, we used the logit transformation. As shown in
Table 9, study habits (attribute 1) was highly correlated with GPA (r¼ .35) and conscientiousness (r
¼ .53), and these correlation coefficients were somewhat higher than those estimates for the SJT
sum score (.30 and .46, respectively). Thus, most of the predictive power of the SJT scores is due to
this single attribute. Conversely, as we hypothesized, helping others (attribute 3) was generally
related to the personality measures. The pattern of correlations is similar to the one obtained for
the SJT sum score. Study habits and study attitudes (attributes 1 and 2) were also related to some of
Table 8. Estimated Occurrence Probabilities and Expected Frequency of the Latent Classes.
Latent Class Attribute Profile Class Probability Class Expected Frequency
1 0000 .12 17.072 1000 .00 0.003 0100 .01 0.864 1100 .00 0.005 0010 .02 2.736 1010 .05 6.467 0110 .02 2.998 1110 .10 14.489 0001 .12 16.6910 1001 .04 5.5511 0101 .11 15.1412 1101 .07 10.3113 0011 .00 0.0014 1011 0.01 1.1115 0111 0.00 0.0016 1111 0.32 44.61
Sorrel et al. 17
at Bibliotheek fac Psych en on February 17, 2016orm.sagepub.comDownloaded from
these personality measures. Generalized compliance (attribute 4) was not significantly related to any
of the theoretically relevant variables. Although most attributes were highly intercorrelated, this was
also not the case for generalized compliance (attribute 4). This attribute was not significantly related
to helping others (attribute 3), and the correlations with the other attributes were moderate in size.
Finally, note that neither the SJT sum score nor the attributes were significantly related to the
RAVEN score (which might be due to the range restricted nature of the university student sample;
see Peeters & Lievens, 2005).
Reliability of the assessment. The alpha reliability coefficient depends on the assumption that all the
items reflect a single construct (Miller, 1995). Given that SJT items are typically heterogeneous,
coefficient alpha can be expected to be an inaccurate measure of the true reliability (see Catano
Figure 4. This figure depicts the probability of mastering each one of the attributes for two response patterns(A and B), resulting in a score of 9 and 14 in the 23-item test. The labels 1, . . . , 4 refer to each one of theattributes, namely, 1 ¼ study habits, 2 ¼ study attitudes, 3 ¼ helping others, and 4 ¼ generalized compliance.
Table 9. Relationship Among the SJT Sum Scores, the Logit Transformation of G-DINA Person ParameterEstimates, and the Criterion/Correlates.
GPA RAVEN NEU EXT OPE AGR CON SJT
Attributes
1 2 3 4
SJT sum score .30** .02 �.11 .20* .28** .25** .46** 1Attributes1. Study habits .35** .02 �.10 .28** .16 .27** .53** .77** 12. Study attitudes .23* .06 �.06 .07 .17* .24* .35** .70** .63** 13. Helping others .28** .15 �.10 .24** .24** .24** .49** .71** .82** .63** 14. Generalized
compliance.17 -.12 �.02 .00 �.01 .14 .09 .38** .29** .38** .02 1
Note: N ¼ 137 when GPA is included in the comparison. GPA ¼ grade point average; NEU ¼ neuroticism; EXT ¼extraversion; OPE ¼ openness; AGRE ¼ agreeableness; CON ¼ conscientiousness; SJT ¼ situational judgment test;G-DINA ¼ generalized deterministic inputs, noisy ‘‘and’’ gate.*p < .05. **p < .01.
18 Organizational Research Methods
at Bibliotheek fac Psych en on February 17, 2016orm.sagepub.comDownloaded from

et al., 2012). Indeed, the internal consistency of the SJT scores (.57) in this sample was rather low.
As noted previously, it therefore makes sense to use a reliability coefficient that takes into consid-
eration the multidimensional nature of the SJT items. More importantly, from the CTT, we cannot
estimate the reliability for the underlying dimensions that are being measured by the SJT. CDMs
represent a new approach for assessing the reliability of these scores. A common indicator of
reliability in CDM is called attribute classification accuracy, which indicates how accurately a CDM
classifies test takers into correct attribute profiles.
To estimate attribute classification accuracy, we use the calibrated model to generate simulated
data so that we could study the attribute classification accuracy once the true classifications are
known. For this purpose, the responses from 1,600 examinees were simulated, that is 100 exam-
inees for each one of the 24 ¼ 16 possible attribute profiles (i.e., latent classes). The model
employed was the G-DINA model, and the values of the item parameters were those estimated
from the empirical data. Then we fitted the G-DINA model to the simulated data set. The follow-
ing cut-off points were applied to the EAP estimates: We define mastery as a posterior probability
of mastering the attribute above .50 and nonmastery as a probability between below .50. We
calculated the proportion of times that a test taker is classified correctly according to the true
classifications. This analysis allowed determining: (a) the attribute level classification accuracy,
that is, the proportion of correct classifications for each of the four attributes, and (b) the pattern
level classification accuracy, which is defined as the proportion of times that a test taker is
correctly classified in all the assigned attributes.
Results of this simulation study show that the attribute level classification accuracy was con-
siderably high. The proportion of correctly classified individual attributes was always at least .85
(.95, .93, .85, and .93 for attributes 1, 2, 3, and 4, respectively). With regard to the pattern level
classification accuracy, the proportion of times all the classified attributes were classified correctly
was also considerably high (76%). Regarding the proportion of times that a test taker was correctly
classified at least in 2 or 3 attributes, the proportions increased to .94 and .97, respectively.
Discussion
Contributions of Cognitive Diagnosis Models
To date, in the SJT domain, some of the sources of validity (those based on internal structure and
response processes) and reliability have not been appropriately addressed. Therefore, it has been
reiterated that the constructs SJTs measure are unknown (e.g., Christian et al., 2010; Ployhart &
Weekley, 2006). This article posited that the absence of an appropriate psychometric approach has
been a major obstacle to move the field forward because traditional psychometric procedures (e.g.,
factor analysis and Cronbach’s alpha) cannot deal with the item multidimensionality in SJTs.
In this study, we explored how the CDM approach can offer useful solutions to these predica-
ments. We illustrated how common validity and reliability concerns in SJT research can be
addressed by assessing the Q-matrix specification, the model fit, and the item and examinee para-
meter estimates. As summarized in the following, we demonstrated that the advantages of CDM
over CTT in providing a greater wealth of information in analyzing SJTs are fourfold.
First, we showed that the application of a CDM model allows getting a better understanding of the
underlying internal structure of the SJT. In our empirical example, successful completion of the SJT
was found to require four attributes: study habits, study attitudes, helping others, and generalized
compliance. As we have seen, all of these attributes are positively correlated, except helping others
and generalized compliance. Importantly, the empirical validation of the Q-matrix allows for the
experts’ decisions and judgments to be verified. This empirical validation of the Q-matrix resulted in
a new specification for one item that was supported by substantive theory as well as increased the
Sorrel et al. 19
at Bibliotheek fac Psych en on February 17, 2016orm.sagepub.comDownloaded from
item’s discrimination power. On the basis of increased insight in the underlying multidimensional
structure of the SJT, CDMs allow for separately scoring the different attributes that are measured by
the test, which is not possible with the typical use of a single overall score in SJTs.
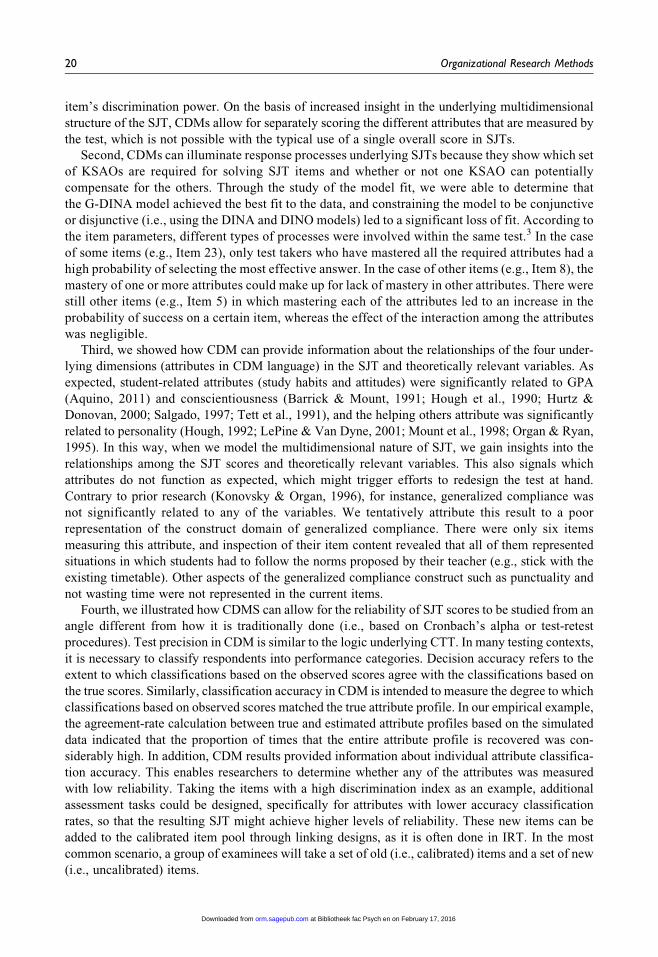
Second, CDMs can illuminate response processes underlying SJTs because they show which set
of KSAOs are required for solving SJT items and whether or not one KSAO can potentially
compensate for the others. Through the study of the model fit, we were able to determine that
the G-DINA model achieved the best fit to the data, and constraining the model to be conjunctive
or disjunctive (i.e., using the DINA and DINO models) led to a significant loss of fit. According to
the item parameters, different types of processes were involved within the same test.3 In the case
of some items (e.g., Item 23), only test takers who have mastered all the required attributes had a
high probability of selecting the most effective answer. In the case of other items (e.g., Item 8), the
mastery of one or more attributes could make up for lack of mastery in other attributes. There were
still other items (e.g., Item 5) in which mastering each of the attributes led to an increase in the
probability of success on a certain item, whereas the effect of the interaction among the attributes
was negligible.
Third, we showed how CDM can provide information about the relationships of the four under-
lying dimensions (attributes in CDM language) in the SJT and theoretically relevant variables. As
expected, student-related attributes (study habits and attitudes) were significantly related to GPA
(Aquino, 2011) and conscientiousness (Barrick & Mount, 1991; Hough et al., 1990; Hurtz &
Donovan, 2000; Salgado, 1997; Tett et al., 1991), and the helping others attribute was significantly
related to personality (Hough, 1992; LePine & Van Dyne, 2001; Mount et al., 1998; Organ & Ryan,
1995). In this way, when we model the multidimensional nature of SJT, we gain insights into the
relationships among the SJT scores and theoretically relevant variables. This also signals which
attributes do not function as expected, which might trigger efforts to redesign the test at hand.
Contrary to prior research (Konovsky & Organ, 1996), for instance, generalized compliance was
not significantly related to any of the variables. We tentatively attribute this result to a poor
representation of the construct domain of generalized compliance. There were only six items
measuring this attribute, and inspection of their item content revealed that all of them represented
situations in which students had to follow the norms proposed by their teacher (e.g., stick with the
existing timetable). Other aspects of the generalized compliance construct such as punctuality and
not wasting time were not represented in the current items.
Fourth, we illustrated how CDMS can allow for the reliability of SJT scores to be studied from an
angle different from how it is traditionally done (i.e., based on Cronbach’s alpha or test-retest
procedures). Test precision in CDM is similar to the logic underlying CTT. In many testing contexts,
it is necessary to classify respondents into performance categories. Decision accuracy refers to the
extent to which classifications based on the observed scores agree with the classifications based on
the true scores. Similarly, classification accuracy in CDM is intended to measure the degree to which
classifications based on observed scores matched the true attribute profile. In our empirical example,
the agreement-rate calculation between true and estimated attribute profiles based on the simulated
data indicated that the proportion of times that the entire attribute profile is recovered was con-
siderably high. In addition, CDM results provided information about individual attribute classifica-
tion accuracy. This enables researchers to determine whether any of the attributes was measured
with low reliability. Taking the items with a high discrimination index as an example, additional
assessment tasks could be designed, specifically for attributes with lower accuracy classification
rates, so that the resulting SJT might achieve higher levels of reliability. These new items can be
added to the calibrated item pool through linking designs, as it is often done in IRT. In the most
common scenario, a group of examinees will take a set of old (i.e., calibrated) items and a set of new
(i.e., uncalibrated) items.
20 Organizational Research Methods
at Bibliotheek fac Psych en on February 17, 2016orm.sagepub.comDownloaded from
Finally, apart from the fourfold information that test users and designers could get, CDMs also
provide finer-grained information about test takers’ strengths and weaknesses. This information
could be fruitfully used by HR practitioners in SJT applications, such as personnel selection and
needs analyses in training programs (Weekley et al., 2015). A generic example of the prototypical
feedback was shown in the empirical example. That is, the feedback consists of a list of attributes
and indicates per attribute the probability that the test taker has mastered the attribute. Providing this
feedback to test takers is relatively straightforward. The main point to consider when making a
decision on which cut-off point to employ to convert these probabilities into profiles is the goal of
the assessment (e.g., the willingness to report low-reliable profiles). If all respondents must be
classified one way or another, one can employ .50 as cut-off score. On the other hand, in some
applied contexts, one might be more interested in selecting high-performing (e.g., personnel selec-
tion) or low-performing (e.g., educational assessment) individuals. If that is the case, one needs to
ensure that those specific patterns are accurately estimated. In addition, cognitive diagnosis com-
puter adaptive assessments (CD-CAT) serve as one possible solution for the problem of having
nonclassified individuals (for an overview, see e.g., Huebner, 2010). The termination criterion is
generally based on the accuracy with which the respondents are assessed. Thus, for example, the
diagnostic assessment can only be terminated when the posterior probability that a respondent
belongs to a given state (i.e., mastery or nonmastery) achieves an acceptable value (e.g., less than
.20 or greater than .80).
Caveats Related to Cognitive Diagnosis Models
Some caveats related to CDM should be acknowledged. First, we want to emphasize that the initial
list of attributes should be carefully developed. As noted, this can be done via a variety of methods
such as prior research, theory, job analytic information, and think-aloud protocols. It is equally
pivotal to verify the Q-matrix developed (de la Torr, & Chiu, 2015), as we did in our empirical
example, to correct possible misspecifications in the original Q-matrix. De la Torre and Chiu (2015)
showed that the empirical validation procedure can accurately identify and correct misspecified q-
entries without altering correct entries, particularly when high-quality items are involved. This is
typically the case in educational assessment where items tend to be highly discriminating, but the
results cannot be directly extrapolated in the case of poor-quality items. Thus, we stress the impor-
tance of relying on the expert ratings to examine these discrepancies. We also suggest doing a cross-
validation in another sample to avoid the possibility of capitalization on chance, which might bias
the statistical estimates.
Second, the relations between CDM and CTT deserve attention. There are various points in
common between these two approaches. Lee, de la Torre, and Park (2011) explored the relationships
between CDM, CTT, and IRT indices. The pattern of correlations among CTT and CDM indices that
they reported is very similar to the one we obtained: Difficulty and discrimination CTT and CDM
indices are typically highly correlated. We do not see this similarity in results as a limitation of
CDM. Rather, it is a positive point that specific CDM indices correspond to the results of CTT
indices. Our results indicate that items can provide diagnostic information (e.g., help differentiate
between respondents who have mastered more attributes and respondents who have mastered fewer
attributes) even if they are not developed under a CDM framework. The CTT discrimination indices
may provide guidance on the diagnostic value of an item. In this way, items with low corrected
point-biserial correlation can be expected to have low discrimination in CDM. In addition, as shown
in our article, CDM indices provide a host of extra information over and above CTT indices. One
difference between CDMs and CTT, which is a potential disadvantage of CDMs, is that their
parameters must be estimated. Standard error of model parameters can be used as a measure of the
precision of the estimate. Standard error estimates depend on the sample size: As sample size
Sorrel et al. 21
at Bibliotheek fac Psych en on February 17, 2016orm.sagepub.comDownloaded from

increases, the standard error decreases. Note, however, that it has been shown that when the model
fits the data, the DINA model parameters are invariant (de la Torre & Lee, 2010). Thus, no matter
what sample of respondents takes the test, the item parameter estimates will generally be the same.
This means that item parameter estimates have to be estimated only once, provided the sample is
representative of the population.
A third caveat related to the application presented in the current study is that the specification of
Q-matrix was done after the test was developed. This approach, referred to as retrofitting, is actually
commonly found in the CDM literature. A good example is the study of Templin and Henson (2006),
who demonstrated how the hypothesized underlying factors contributing to pathological gambling
can be measured with the DINO model. However, in those applications, where CDM have been
retrofitted to assessments constructed using a unidimensional or CTT framework, convergence
problems may occur, as well as poor item, respondent, or model fit (Rupp & Templin, 2008b).
Thus, a more optimal approach is to design a test from the beginning and apply these theory-based
specifications during the test development process itself (de la Torre, Tjoe, Rhoads, & Lam, 2010).
Conclusion
This study proposed and illustrated how CDM can be used to explore the nature of the constructs that
SJTs measure, which is one of the current and principal challenges in SJT research (Ryan &
Ployhart, 2014; Weekley et al., 2015). Overall, we conclude that CDMs include a greater wealth
of information in analyzing SJTs than traditional procedures based on CTT do. That is, CDM holds
promise in evaluating the internal structure of the SJT, providing information about the cognitive
processes underlying the responses in the SJT, clarifying how and why the SJT scores relate to other
variables, and leading to a more appropriate estimation of the reliability of these scores.
Acknowledgements
The authors wish to thank associate editor Adam Meade and three anonymous reviewers for their valuable
comments and suggestions on earlier versions of this article.
Declaration of Conflicting Interests
The author(s) declared no potential conflicts of interest with respect to the research, authorship, and/or pub-
lication of this article.
Funding
The author(s) disclosed receipt of the following financial support for the research, authorship, and/or publica-
tion of this article: This research was partially supported by Grant PSI2013-44300-P (Ministerio de Economia y
Competitividad and European Social Fund).
Notes
1. Based on the probabilities of being classified into an attribute profile given the data (i.e., PðαljXÞÞ, the
individual attribute profile can be deduced via three methods: maximum likelihood estimation (MLE),
maximum a posteriori (MAP) estimation, and expected a posteriori (EAP) estimation. For a comparison
among MLE, MAP, and EAP classification methods, see Huebner and Wang (2011).
2. Currently there are different programs available for estimating cognitive diagnosis models (CDMs), for
example the G-DINA framework in Ox (Doornik, 2002) by de la Torre, the MDLTM program by von Davier
(2005), the LCDM framework in SAS (SAS Institute Inc., 2007) and Mplus (Muthen & Muthen, 2012) by
Templin, Henson, Douglas, and Homan. The main advantage of R is that it is freely available and very
flexible.
22 Organizational Research Methods
at Bibliotheek fac Psych en on February 17, 2016orm.sagepub.comDownloaded from
3. When referring to a particular underlying latent structure and the response processes implied, it should be
acknowledged that between-subjects conclusions should not be interpreted at the individual level (Bors-
boom, Mellenbergh, & van Heerden, 2003). Recently, this issue has been considered in measurement
equivalence (Tay, Meade, & Cao, 2015).
References
Adams, R. J., Wilson, M. R., & Wang, W.-C. (1997). The multidimensional random coefficients multinomial
logit model. Applied Psychological Measurement, 21, 1-23. doi:10.1177/0146621697211001
Akaike, H. (1974). A new look at the statistical identification model. IEEE Transactions on Automated Control,
19, 716-723. doi:10.1109/TAC.1974.1100705
American Educational Research Association, American Psychological Association, & National Council of
Measurement in Education (1999). Standards for educational and psychological testing. Washington,
DC: American Educational Research Association.
Aquino, L. B. (2011). Study habits and attitudes of freshmen students: Implications for academic intervention
programs. Journal of Language Teaching & Research, 2(5), 1116-1121. doi:10.4304/jltr.2.5.1116-1121
Arthur, W., Jr., Glaze, R. M., Jarrett, S. M., White, C. D., Schurig, I., & Taylor, J. E. (2014). Comparative
evaluation of three situational judgment test response formats in terms of construct-related validity, sub-
group differences, and susceptibility to response distortion. Journal of Applied Psychology, 99(3), 535-545.
doi:10.1037/a0035788
Barrick, M. R., & Mount, M. K. (1991). The big five personality dimensions and job performance: A meta-
analysis. Personnel Psychology, 44(1), 1-26. doi:10.1111/j.1744-6570.1991.tb00688.x
Bateman, T. S., & Organ, D. W. (1983). Job satisfaction and the good soldier: The relationship between affect
and employee ‘‘citizenship.’’ The Academy of Management Journal, 26(4), 587-595. doi:10.2307/255908
Bess, T. L., & Mullins, M. E. (2002, April). Exploring a dimensionality of situational judgment: Task and
contextual knowledge. Paper presented at the 17th annual conference of the Society for Industrial and
Organizational Psychology, Toronto, Canada.
Borman, W. C., White, L. A., & Dorsey, D. W. (1995). Effects of ratee task performance and interpersonal
factors on supervisor and peer performance ratings. Journal of Applied Psychology, 80(1), 168-177. doi:10.
1037/0021-9010.80.1.168
Borsboom, D., Mellenbergh, G. J., & Van Heerden, J. (2003). The theoretical status of latent variables.
Psychological Review, 110, 203-219. doi:10.1037/0033-295X.110.2.203
Buck, G., VanEssen, T., Tatsuoka, K., Kostin, I., Lutz, D., & Phelps, M. (1998). Development, selection and
validation of a set of cognitive and linguistic attributes for the SAT I Verbal: Analogy section (Research
Report, RR-98-19). Princeton, NJ: Educational Testing Service.
Catano, V. M., Brochu, A., & Lamerson, Ch. D. (2012). Assessing the reliability of situational judgment tests
used in high-stakes situations. International Journal of Selection and Assessment, 20(3), 333-346. doi:10.
1111/j.1468-2389.2012.00604.x
Chen, J., de la Torre, J., & Zhang, Z. (2013). Relative and absolute fit evaluation in cognitive diagnosis
modeling. Journal of Educational Measurement, 50(2), 123-140. doi:10.1111/j.1745-3984.2012.00185.x
Christian, M., Edwards, B., & Bradley, J. (2010). Situational judgment tests: Constructs assessed and a meta-
analysis of their criterion-related validities. Personnel Psychology, 63, 83-117. doi:10.1111/j.1744-6570.
2009.01163.x
Clevenger, J., Pereira, G. M., Wiechmann, D., Schmitt, N., & Schmidt-Harvey, V. (2001). Incremental validity
of situational judgment tests. Journal of Applied Psychology, 86, 410-417. doi:10.1037/0021-9010.86.3.410
Costa, P. T., & McCrae, R. R. (1992). Revised NEO Personality Inventory (NEO-PI-R) and NEO Five-Factor
Inventory (NEO-FFI) professional manual. Odessa, FL: Psychological Assessment Resources.
Crede, M., & Kuncel, N. R. (2008). Study habits, skills, and attitudes: The third pillar supporting collegiate
academic performance. Perspectives on Psychological Science, 3(6), 425-453. doi:10.1111/j.1745-6924.
2008.00089.x
Sorrel et al. 23
at Bibliotheek fac Psych en on February 17, 2016orm.sagepub.comDownloaded from
de la Torre, J. (2008). An empirically-based method of Q-matrix validation for the DINA model: Development
and applications. Journal of Educational Measurement, 45, 343-362. doi:10.1111/j.1745-3984.2008.00069.x
de la Torre, J. (2011). The generalized DINA model framework. Psychometrika, 76, 179-199. doi:10.1007/
s11336-011-9207-7
de la Torre, J., & Chiu, C. -Y. (2015). A general method of empirical Q-matrix validation. Psychometrika, 1-21.
doi:10.1007/s11336-015-9467-8
de la Torre, J., Hong, Y., & Deng, W. (2010). Factors affecting the item parameter estimation and classification
accuracy of the DINA model. Journal of Educational Measurement, 47, 227-249. doi:10.1111/j.1745-3984.
2010.00110.x
de la Torre, J., & Lee, Y. -S. (2010). A note on the invariance of the DINA model parameters. Journal of
Educational Measurement, 47(1), 115-127. doi:10.1111/j.1745-3984.2009.00102.x
de la Torre, J., Tjoe, H., Rhoads, K., & Lam, T. C. (2010, April). Conceptual and theoretical issues in
proportional reasoning. Paper presented at Annual Meeting of American Educational Research
Association, Denver, CO.
Doignon, J. P., & Falmagne, J. C. (1999). Knowledge spaces. Berlin: Springer.
Doornik, J. A. (2002). Object-oriented matrix programming using Ox. London: Timberlake Consultants Press.
Fischer, G. H. (1973). The linear logistic test model as an instrument in educational research. Acta
Psychologica, 37, 359-374. doi:10.1016/0001-6918(73)90003-6
Fleiss, J. L. (1971). Measuring nominal scale agreement among many raters. Psychological 15 Bulletin, 76(5),
378-382. doi:10.1037/h0031619
Garcıa, P. E., Olea, J., & de la Torre, J. (2014). Application of cognitive diagnosis models to competency-based
situational judgment tests. Psicothema, 3, 372-377. doi:10.7334/psicothema2013.322
Haertel, E. H. (1989). Using restricted latent class models to map the skill structure of achievement items.
Journal of Educational Measurement, 26, 333-352. doi:10.1111/j.1745-3984.1989.tb00336.x
Hartz, S. (2002). A Bayesian framework for the unified model for assessing cognitive abilities: Blending theory
with practicality. Unpublished doctoral dissertation, University of Illinois, Urbana-Champaign.
Henson, R., & Douglas, J. (2005). Test construction for cognitive diagnosis. Applied Psychological
Measurement, 29, 262-277. doi:10.1177/0146621604272623
Holm, S. (1979). A simple sequentially rejective multiple test procedure. Scandinavian Journal of Statistics,
6(2), 65-70
Hough, L. M. (1992). The ‘‘Big Five’’ personality variables-construct confusion: Description versus prediction.
Human Performance, 5(1-2), 139-155. doi:10.1080/08959285.1992.9667929
Hough, L. M., Eaton, N. K., Dunnette, M. D., Kamp, J. D., & McCloy, R. A. (1990). Criterion-related validities
of personality constructs and the effect of response distortion on those validities. Journal of Applied
Psychology, 75, 581-595. doi:10.1037/0021-9010.75.5.581
Huebner, A. (2010). An overview in recent developments in cognitive diagnostic computer adaptive assess-
ments. Practical Assessment, Research & Evaluation, 15, 1-7.
Huebner, A., & Wang, C. (2011). A note on comparing examinee classification methods for cognitive diagnosis
models. Educational and Psychological Measurement, 71, 407-419. doi:10.1177/0013164410388832
Hurtz, G. M., & Donovan, J. J. (2000). Personality and job performance: The Big Five revisited. Journal of
Applied Psychology, 85(6), 869-879. doi:10.1037/0021-9010.85.6.869
Jang, E. E. (2005). A validity narrative: Effects of reading skills diagnosis on teaching and learning in the
context of NG TOEFL. Unpublished doctoral dissertation, University of Illinois, Champaign, IL.
Junker, B. W., & Sijtsma, K. (2001). Cognitive assessment models with few assumptions, and connections with
nonparametric item response theory. Applied Psychological Measurement, 25, 258-272. doi:10.1177/
01466210122032064
Kamdar, D., & Van Dyne, L. (2007). The joint effects of personality and workplace social exchange relation-
ships in predicting task performance and citizenship performance. Journal of Applied Psychology, 92(5),
1286-1298. doi:10.1037/0021-9010.92.5.1286
24 Organizational Research Methods
at Bibliotheek fac Psych en on February 17, 2016orm.sagepub.comDownloaded from
Konovsky, M. A., & Organ, D. W. (1996). Dispositional and contextual determinants of organizational citizen-
ship behavior. Journal of Organizational Behavior, 17(3), 253-266.
Landis, J. R., & Koch, G. G. (1977). The measurement of observer agreement for categorical data. Biometrics,
33(1), 159-174. doi:10.2307/2529310
Lee, Y.-S., de la Torre, J., & Park, Y. S. (2011). Relationships between cognitive diagnosis, CTT, and IRT
indices: An empirical investigation. Asia Pacific Education Review, 13(2), 333-345. doi:10.1007/s12564-
011-9196-3
Leighton, J. P., & Gierl, M. J. (2007). Cognitive diagnostic assessment for education: Theory and applications.
Cambridge, UK: Cambridge University Press.
LePine, J. A., & Van Dyne, L. (2001). Voice and cooperative behavior as contrasting forms of contextual
performance: Evidence of differential relationships with Big Five personality characteristics and cognitive
ability. Journal of Applied Psychology, 86(2), 326-336. doi:10.1037/0021-9010.86.2.326
Li, H., & Suen, H. K. (2013). Constructing and validating a Q-Matrix for cognitive diagnostic analyses of a
reading test. Educational Assessment, 18(1), 1-25. doi:10.1080/10627197.2013.761522
Lievens, F., Peeters, H., & Schollaert, E. (2008). Situational judgement tests: A review of recent research.
Personnel Review, 37(4), 426-441. doi:10.1108/00483480810877598
McDaniel, M. A., Morgeson, F. P., Finnegan, E. B., Campion, M. A., & Braverman, E. P. (2001). Use of
situational judgment tests to predict job performance: A clarification of the literature. Journal of Applied
Psychology, 86, 730-740. doi:10.1037/0021-9010.86.4.730
McDaniel, M. A., Hartman, N. S., Whetzel, D. L., & Grubb, W. L. (2007). Situational judgment tests, response
instructions, and validity: A meta-analysis. Personnel Psychology, 60(1), 63-91. doi:10.1111/j.1744-6570.
2007.00065.x
McDonald, R. P. (1999). Test theory: A unified treatment. Mahwah, NJ: Erlbaum.
Miller, M. B. (1995). Coefficient alpha: A basic introduction from the perspectives of classical test theory and
structural equation modeling. Structural Equation Modeling, 2(3), 255-273. doi:10.1080/10705519509540013
Motowildo, S. J., Borman, W. C., & Schmit, M. J. (1997). A theory of individual differences in task and
contextual performance. Human Performance, 10(2), 71-83. doi:10.1207/s15327043hup1002_1
Mount, M. K., Barrick, M. R., & Stewart, G. L. (1998). Five-Factor Model of personality and performance in
jobs involving interpersonal interactions. Human Performance, 11(2-3), 145-165. doi:10.1080/08959285.
1998.9668029
Muthen, L. K., & Muthen, B. O. (2012). Mplus user’s guide (7th ed.). Los Angeles, CA: Muthen & Muthen.
Nichols, P. D., Chipman, S. F., & Brennan, R. L. (1995). Cognitively diagnostic assessment. Hillsdale, NJ: Erlbaum.
Organ, D. W. (1988). Organizational citizenship behavior: The good soldier syndrome (Vol. xiii). Lexington,
MA: Lexington Books/D. C. Heath and Com.
Organ, D. W., & Ryan, K. (1995). A meta-analytic review of attitudinal and dispositional predictors of
organizational citizenship behavior. Personnel Psychology, 48(4), 775-802. doi:10.1111/j.1744-6570.
1995.tb01781.x
Oswald, F. L., Schmitt, N., Kim, B. H., Ramsay, L. J., & Gillespie, M. A. (2004). Developing a biodata measure
and situational judgment inventory as predictors of college student performance. Journal of Applied
Psychology, 89, 187-207. doi:10.1037/0021-9010.89.2.187
Patterson, F., Ashworth, V., Zibarras, L., Coan, P., Kerrin, M., & O’Neill, P. (2012). Evaluations of situational
judgment tests to assess non-academic attributes in selection. Medical Education, 46, 850-868. doi:10.1111/
j.1365-2923.2012.04336.x
Peeters, H., & Lievens, F. (2005). Situational judgment tests and their predictiveness of college students’
success: The influence of faking. Educational and Psychological Measurement, 65(1), 70-89. doi:10.
1177/0013164404268672
Ployhart, R. E., & Ehrhart, M. G. (2003). Be careful what you ask for: Effects of response instructions on the
construct validity and reliability of situational judgment tests. International Journal of Selection and
Assessment, 11(1), 1-16. doi:10.1111/1468-2389.00222
Sorrel et al. 25
at Bibliotheek fac Psych en on February 17, 2016orm.sagepub.comDownloaded from

Ployhart, R. E., & Weekley, J. A. (2006). Situational judgment: Some suggestions for future science and
practice. In J. A. Weekley & R. E. Ployhart (Eds.), Situational judgment tests: Theory, measurement, and
application (pp. 345-350). Mahwah, NJ: Erlbaum.
Proctor, B. E., Prevatt, F. F., Adams, K. S., Reaser, A., & Petscher, Y. (2006). Study skills profiles of normal-
achieving and academically-struggling college students. Journal of College Student Development, 47(1),
37-51. doi:10.1353/csd.2006.0011
R Core Team. (2014). R: A language and environment for statistical computing. Vienna, Austria: R Foundation
for Statistical Computing.
Raven, J., Raven, J. C., & Court, J. H. (1998). Advanced progressive matrices manual. Oxford, UK: Oxford
Psychologists Press.
Robitzsch, A., Kiefer, T., George, A. C., & Uenlue, A. (2015). CDM: Cognitive diagnosis modeling (R package
version 4.4 1). Retrieved from http://CRAN.R-project.org/package¼CDM
Rupp, A. A. (2007). The answer is in the question: A guide for describing and investigating the conceptual
foundations and statistical properties of cognitive psychometric models. International Journal of Testing, 7,
95-125. doi:10.1080/15305050701193454
Rupp, A. A., & Mislevy, R. J. (2007). Cognitive foundations of structured item response theory models. In J.
Leighton & M. Gierl (Eds.), Cognitive diagnostic assessment in education: Theory and practice (pp.
205-241). Cambridge, UK: Cambridge University Press.
Rupp, A. A., & Templin, J. (2008a). The effects of Q-matrix misspecification on parameter estimates and
classification accuracy in the DINA model. Educational and Psychological Measurement, 68(1), 78-96. doi:
10.1177/0013164407301545
Rupp, A. A., & Templin, J. L. (2008b). Unique characteristics of diagnostic classification models: A compre-
hensive review of the current state-of-the-art. Measurement: Interdisciplinary Research and Perspectives,
6(4), 219-262. doi:10.1080/15366360802490866
Ryan, A. M., & Ployart, E. (2014). A century of selection. Annual Review of Psychology, 65, 693-717. doi:10.
1146/annurev-psych-010213-115134
Salgado, J. F. (1997). The Five Factor Model of personality and job performance in the European Community.
Journal of Applied Psychology, 82(1), 30-43. doi:10.1037/0021-9010.82.1.30
SAS Institute Inc. (2007). User’s guide for SAS software navigator. Cary, NC: Author.
Schmidt, F. L., & Hunter, J. E. (1996). Measurement error in psychological research: Lessons from 26 research
scenarios. Psychological Methods, 1(2), 199-223. doi:10.1037/1082-989X.1.2.199
Schmitt, N., & Chan, D. (2006). Situational judgment tests: Method or construct. In J. A. Weekley & R. E.
Ployhart (Eds.), Situational judgment tests. Theory, measurement, and application (pp. 135-155). Mahwah,
NJ: Erlbaum.
Smith, C. A., Organ, D. W., & Near, J. P. (1983). Organizational citizenship behavior: Its nature and ante-
cedents. Journal of Applied Psychology, 68, 655-663. doi:10.1037/0021-9010.68.4.653
Tatsuoka, K. K. (1983). Rule space: An approach for dealing with misconception based on item response
theory. Journal of Education Statistic, 20, 345-354. doi:10.1111/j.1745-3984.1983.tb00212.x
Tay, L., Meade, A. W., & Cao, M. (2015). An overview and practical guide to IRT measurement equivalence
analysis. Organizational Research Methods, 18, 3-46. doi:10.1177/1094428114553062
Templin, J. L., & Henson, R. A. (2006). Measurement of psychological disorders using cognitive diagnosis
models. Psychological Methods, 11(3), 287-305. doi:10.1037/1082-989X.11.3.287
Tett, R. P., Jackson, D. N., & Rothstein, M. (1991). Personality measures as predictors of job performance: A
meta-analytic review. Personnel Psychology, 44(4), 703-742. doi:10.1111/j.1744-6570.1991.tb00696.x
von Davier, M. (2005). mdltm—multidimensional discrete latent trait modeling software [Computer software].
Princeton, NJ: Educational Testing Service
Weekley, J. A., Hawkes, B., Guenole, N., & Ployhart, R.E. (2015). Low-fidelity simulations. Annual Review of
Organizational Psychology and Organizational Behavior, 2, 295-322. doi:10.1146/annurev-orgpsych-
032414-111304
26 Organizational Research Methods
at Bibliotheek fac Psych en on February 17, 2016orm.sagepub.comDownloaded from

Weekley, J. A., & Ployhart, R. E. (2005). Situational judgement: Antecedents and relationships with perfor-
mance. Human Performance, 18, 81-104. doi:10.1207/s15327043hup1801_4
Weekley, J. A., & Ployhart, R. E. (2006). An introduction to situational judgment testing. In J. A. Weekley & R.
E. Ployhart (Eds.), Situational judgment tests (pp. 1-10). Mahwah, NJ: Erlbaum.
Whetzel, D. L., & McDaniel, M. A. (2009). Situational judgment tests: An overview of current research. Human
Resource Management Review, 19, 188-202. doi:10.1016/j.hrmr.2009.03.007
Willse, J. T. (2014). CTT: Classical test theory functions (R package version 2.1). Retrieved from http://CRAN.
R-project.org/package¼CTT
Author Biographies
Miguel A. Sorrel is a PhD candidate at the Department of Social Psychology and Methodology at Universidad
Autonoma de Madrid. His research interests include item response theory, cognitive diagnosis modeling, and
computerized adaptive testing.
Julio Olea is a professor of methodology of behavioural sciences at Universidad Autonoma de Madrid. His
teaching and research work has focused on the field of psychometric: implementation of scaling methods,
cognitive diagnosis modeling, and computerized adaptive testing.
Francisco J. Abad is an associate professor at Universidad Autonoma de Madrid. He has developed his
teaching and research work in the field of psychometrics: polytomous IRT models, goodness of fit, software
development, and computerized adaptive testing.
Jimmy de la Torre is a professor of educational psychology at Rutgers University. His primary research
interests are in the field of psychological and educational testing and measurement, particularly in the areas of
item response theory, cognitive diagnosis modeling, and psychometric models for noncognitive test data.
David Aguado is an associate professor at the Universidad Autonoma de Madrid. He is the director of
innovation in talent management at the Instituto de Ingenierıa del Conocimiento (IIC). He has developed his
teaching and research work in competency development and performance management.
Filip Lievens is full professor at the Department of Personnel Management, Work and Organizational Psy-
chology at Ghent University. His research has influenced a variety of applied measurement issues in I-O
psychology. He has published in the Annual Review of Psychology, Journal of Applied Psychology, Personnel
Psychology, and Journal of Management.
Sorrel et al. 27
at Bibliotheek fac Psych en on February 17, 2016orm.sagepub.comDownloaded from