Validation of the Guidelines for Nonlinear Finite Element ...homepage.tudelft.nl/v5p05/RTD...
105
Rijkswaterstaat Technisch Document (RTD) Validation of the Guidelines for Nonlinear Finite Element Analysis of Concrete Structures Part: Reinforced beams Doc.nr.: RTD 1016-3A:2017 Versie: 1.0 Status: Final Datum: 15 June 2017 Water. Wegen. Werken. Rijkswaterstaat
Transcript of Validation of the Guidelines for Nonlinear Finite Element ...homepage.tudelft.nl/v5p05/RTD...

Rijkswaterstaat Technisch Document (RTD)
Validation of the Guidelines for Nonlinear Finite Element Analysis of Concrete Structures Part: Reinforced beams
Doc.nr.: RTD 1016-3A:2017
Versie: 1.0 Status: Final Datum: 15 June 2017
Water. Wegen. Werken. Rijkswaterstaat

Rijkswaterstaat Centre for Infrastructure
Validation of the Guidelines for Nonlinear Page 2 of 105
Finite Element Analysis of Concrete Structure Issued: 15 June 2017
Part: Reinforced beams Version: 1.0
RTD: 1016-3A: 2017 Status: Final
Preface
At an international workshop on shear force capacities of concrete structural element,
held in Rotterdam, the Netherlands in 2007, predictions of the ultimate limit state of
three different girder experiments were presented. This workshop was initiated by the
Dutch Ministry of Infrastructure and organized by TNO (Vervuurt & Leeghwater,
2008). The ultimate capacities, predicted by six teams using different nonlinear
software packages, showed a large scatter. Also the predicted crack patterns showed a
large scatter.
With this in mind, research on the development of a “guideline for nonlinear analysis
of concrete girders” was started. The fib Model Code 1990 was the background
document when Peter Feenstra started with the development of the guideline. Also,
Joop den Uijl was involved in validating the guidelines. From 2010 the draft version of
the fib Model Code 2010 was used as background document. Today, both the MC2010
and the Eurocode2 allow the use of nonlinear analysis to verify the design capacity of
concrete objects.
The validation of the guidelines is done by simulating old and new experiments. To
verify human and software factors, several people were involved in this project and
two commercially available software packages were used. Finally the first version of
the guideline was published in May 2012. It is used by the Dutch Ministry of
Infrastructure and the Environment when commissioning engineering work for re-
examinations of existing concrete structures in the Netherlands to reveal extra
remaining structural capacity.
To verify whether the guideline is also valid for a larger group of international end-
users and for other software packages, a prediction contest of T-shaped prestressed
girders was set up in 2014. The tests were performed by Sebastiaan Ensink in the
Stevin Laboratory of the Delft University of Technology. The participants of the
contest gathered in a workshop in Parma. The outcome of this contest showed that the
guidelines are indeed helpful for reducing model and human factors when predicting
the behaviour of concrete structures by means of nonlinear finite element analysis.
As a result of additional validation studies and making use of the experiences of the
workshop in Parma a new version of the guidelines has been published in 2016. The
present document gives an overview of validations studies for this version of the
guideline. Maciej Kraczla has contributed to this document.
This document is one from a series of documents. At the time of writing, the
following documents have been drafted:
RTD 1016-1: Guidelines for Nonlinear Finite Element Analysis of Concrete
Structures
RTD 1016-2: Validation of the Guidelines for Nonlinear Finite Element
Analysis of Concrete Structures - Part: Overview of results
RTD 1016-3A: Validation of the Guidelines for Nonlinear Finite Element
Analysis of Concrete Structures - Part: Reinforced beams
RTD 1016-3B: Validation of the Guidelines for Nonlinear Finite Element
Analysis of Concrete Structures - Part: Prestressed beams
RTD 1016-3C: Validation of the Guidelines for Nonlinear Finite Element
Analysis of Concrete Structures - Part: Slabs
Beatrice Belletti, Cecilia Damoni, Max A.N. Hendriks, Ane de Boer
March 2017

Rijkswaterstaat Centre for Infrastructure
Validation of the Guidelines for Nonlinear Page 3 of 105
Finite Element Analysis of Concrete Structure Issued: 15 June 2017
Part: Reinforced beams Version: 1.0
RTD: 1016-3A: 2017 Status: Final
Contents Preface ............................................................................................................................ 2
1 Introduction ............................................................................................................ 5
1.1 Background .................................................................................................... 5
1.2 Scope and objectives ...................................................................................... 5
1.3 Outline ........................................................................................................... 6
2 Methods used for modelling reinforced concrete members .................................... 7
2.1 Analytical code provisions ............................................................................. 7
2.2 Nonlinear finite element modelling approach ................................................ 7
2.3 Nonlinear finite element limit state verifications ........................................... 8
3 Case RB1: Vecchio & Shim (2004) ........................................................................ 9
3.1 Experimental setup and results ...................................................................... 9
3.2 Analytical analysis ....................................................................................... 11
3.3 Finite element model .................................................................................... 14
3.4 Nonlinear finite element analysis ................................................................. 19
3.5 Application of Safety Formats Model Code 2010 ....................................... 27
3.6 Parametric study on crack models ............................................................... 29
3.7 Parametric study on crack bandwidth .......................................................... 31
3.8 Parametric study of convergence criteria ..................................................... 36
3.9 Estimating crack widths ............................................................................... 38
3.10 Concluding remarks ..................................................................................... 40
4 Case RB2: Collins and Kuchma (1999) ................................................................ 42
4.1 Experimental setup and results .................................................................... 42
4.2 Analytical analysis ....................................................................................... 44
4.3 Finite element model .................................................................................... 48
4.4 Nonlinear finite element analysis ................................................................. 52
4.5 Application of Safety Formats Model Code 2010 ....................................... 57
4.6 Parametric study on crack models ............................................................... 59
4.7 Parametric study on crack bandwidth .......................................................... 60
4.8 Parametric study of convergence criteria ..................................................... 64
4.9 Concluding remarks ..................................................................................... 65
5 Case RB3: Grace (2001) ....................................................................................... 67
5.1 Experimental setup and results .................................................................... 67
5.2 Analytical analysis ....................................................................................... 68
5.3 Finite element model .................................................................................... 72
5.4 Nonlinear finite element analysis ................................................................. 76
5.5 Application of safety formats Model Code 2010 (fib, 2013) ....................... 81
Rijkswaterstaat Centre for Infrastructure
Validation of the Guidelines for Nonlinear Page 4 of 105
Finite Element Analysis of Concrete Structure Issued: 15 June 2017
Part: Reinforced beams Version: 1.0
RTD: 1016-3A: 2017 Status: Final
5.6 Parametric study on crack models ............................................................... 83
5.7 Concluding remarks ..................................................................................... 85
6 Case RB3A: Grace (2001) .................................................................................... 86
6.1 Experimental setup and results .................................................................... 86
6.2 Analytical analysis ....................................................................................... 86
6.3 Finite element model .................................................................................... 91
6.4 Nonlinear finite element analysis ................................................................. 94
6.5 Application of safety formats Model Code 2010 (fib, 2013) ....................... 99
6.6 Parametric study on crack models ............................................................. 102
6.7 Concluding remarks ................................................................................... 103
References .................................................................................................................. 105

Rijkswaterstaat Centre for Infrastructure
Validation of the Guidelines for Nonlinear Page 5 of 105
Finite Element Analysis of Concrete Structure Issued: 15 June 2017
Part: Reinforced beams Version: 1.0
RTD: 1016-3A: 2017 Status: Final
1 Introduction
In the period 2008-2015 the Dutch Ministry of Infrastructure and the Environment has
financed a project leading to a set of guidelines for the nonlinear finite element analysis
of concrete structures (RWS, 2016). Apart from the guidelines document itself, the
project resulted in the present publication: a document that describes the validation of
the guidelines.
This introductory chapter begins with describing the background of the project. It
continues with presenting the objectives and the outline of the present validation report.
1.1 Background
Modern codes of practice for civil engineering projects offer so-called levels-of-
approximations (Muttoni & Ruiz, 2012). Depending on the stage of the project, e.g.
preliminary design, executive design or a reassessment study, a modern code
distinguishes several levels of design expressions and design methods. The fib Model
Code for concrete structures 2010 (fib, 2013) is a good example. The idea is: the higher
the level-of-approximation, the more sophisticated the analysis, the more realistic the
estimation of the safety, the more possibilities of finding “hidden” structural capacities,
the higher is the likelihood of avoiding over-conservative designs and reassessments,
the more probable is that unnecessary costs can be avoided. The highest level-of-
approximation, sometimes denoted as level IV, is a design or a reassessment method
based on nonlinear finite element analysis.
Whereas the lower levels-of-approximations are usually well-described using clear-cut
expressions, applicability statements and examples, the situation is remarkably
different when it comes to using nonlinear finite element analysis for design or
reassessment studies. The fib Model Code has made an important step by providing
safety formats to be used in connection with nonlinear finite element analysis. These
safety formats define safety factors for the material properties and the global structural
resistance. However the development of specifications on how to perform the analyses
has not kept pace with the development of safety formats. It is beyond doubt that the
results of nonlinear finite element analysis can be substantially influenced by model
and human factors.
1.2 Scope and objectives
The development of the guidelines for the nonlinear finite element analysis of concrete
structures (RWS, 2016) has the primary goal to advice the analysts and consequently to
reduce the model and human factors. The development of the guidelines went hand in
hand with the performance of numerical benchmark studies. The guidelines were tuned
and, in the end, validated by comparing the results of numerical analyses with
experimental results. It is believed that by this process a coherent set of advices was
obtained. This document gives an overview of the main case studies that were used
during the development of the guidelines.
The case studies include numerical examples with reinforced concrete beams,
prestressed beams and slabs. The main objective is to compare the results of the
numerical analyses with the experimental results for these cases and, in this way, to
validate the set of advices.

Rijkswaterstaat Centre for Infrastructure
Validation of the Guidelines for Nonlinear Page 6 of 105
Finite Element Analysis of Concrete Structure Issued: 15 June 2017
Part: Reinforced beams Version: 1.0
RTD: 1016-3A: 2017 Status: Final
Next to the main objective, the case studies reported in this document are used to
demonstrate sensitivities of modelling choices, to compare the applications of different
safety formats and to show examples of documenting finite element analysis results.
1.3 Outline
After this introductory chapter, Chapter 2 summarizes the used methods. Each
subsequent chapter addresses a single case study of a reinforced concrete beam. These
chapters use a similar structure of sections, describing respectively: the experimental
setup and results, the finite element model adopting the advices of the guidelines,
analytical verifications, the nonlinear finite element results using mean or “measured”
material properties and the application of safety formats. Additional sections are e.g.
used to show sensitivity studies.
Rijkswaterstaat Centre for Infrastructure
Validation of the Guidelines for Nonlinear Page 7 of 105
Finite Element Analysis of Concrete Structure Issued: 15 June 2017
Part: Reinforced beams Version: 1.0
RTD: 1016-3A: 2017 Status: Final
2 Methods used for modelling reinforced concrete members
This chapter summarizes the methods that are used in the subsequent chapters.
2.1 Analytical code provisions
The analytical methods used in this report are based on the CEN Eurocode 2 (EC,
2005) and the fib Model Code 2010 (fib, 2013).
2.2 Nonlinear finite element modelling approach
There is a great variety of modelling options for modelling the nonlinear behaviour of
concrete structures. The guidelines for the nonlinear finite element analysis of concrete
structures (RWS, 2016) comprise specific modelling choices. It is important to
consider these modelling choices as a coherent set of advices. For the details about
these advises the reader is referred to the guidelines document itself. This section
includes a summary of the main advices.
Units. The preferred units are the base units of the International System of Units (SI).
Possibly, the length unit might be replaced by millimetres.
Constitutive models for concrete. Smeared cracking models are considered. A total
strain-based rotating or fixed crack model is preferred. Adequate tensile softening and
compressive hardening-softening relations should be considered, based on the
specification of tensile and compressive fracture energies and the definition of
equivalent lengths to define “crack-band” widths. For the fixed crack models variable
shear retention models are recommended. Tension-compression interaction needs to be
addressed in structures subjected to multi-axial stress states. These include the
reduction of the compressive strength due to lateral cracking and a diminishing Poisson
effect upon cracking.
Constitutive models for reinforcement. Elasto-plastic material models with
hardening should be used.
Constitutive models for concrete-reinforcement interaction. At the macro-level,
simplified models can be used, taking into account tension stiffening effects. Limited
attention is devoted to modelling slip and dowel action. These aspects should not be
significant in the global behaviour of a structure and are more related to details near the
USL load level.
Finite elements for concrete. Elements with quadratic interpolation of the
displacement field should be used. Typically, at least 6 elements over the height of a
structural element should be used.
Finite elements for reinforcement. Embedded reinforcement elements are preferred;
both embedded bars and grids can be used.
Prestressing. Prestressing should be applied taking into account prestress losses.
Existing cracks. Existing cracks in the structure should be taken into account
whenever detailed information about the location and crack widths is available.
Rijkswaterstaat Centre for Infrastructure
Validation of the Guidelines for Nonlinear Page 8 of 105
Finite Element Analysis of Concrete Structure Issued: 15 June 2017
Part: Reinforced beams Version: 1.0
RTD: 1016-3A: 2017 Status: Final
Loads. The design codes and national guidelines in force should be applied.
Boundary conditions. Unless the objective of the analysis is to study the detailed
behaviour of the loading and support points, the supports and loading platens should be
modelled such that local stress concentrations are reduced.
Loading. The loading sequence will contain an initial phase where dead weight,
permanent loads and, if appropriate, prestressing is applied to the structure. Following
the initial phase, the variable loads are increased until a clear failure mode is present or
a significant load reduction was achieved.
Note that in the current report, for all cases, we are referring to experimental tests. For
this reason, when safety formats are applied to obtain the design resistance, we are
considering a load combination of action with a partial safety factor related to self-
weight of 1.0.
Equilibrium iterations. Equilibrium between internal and external forces should be
achieved iteratively using a Newton-Raphson method with arc-length procedure.
Preferably an energy-norm together with a force-norm should be used.
All analyses have been performed with Diana 9.4.4.
2.3 Nonlinear finite element limit state verifications
Serviceability limit states. As requested by current codes (EC2, MC2010)
serviceability limit states verifications must be performed as post-analysis checks. For
the crack opening calculation, the average strain values are obtained from the analysis,
whereas crack spacings are obtained from codes.
Ultimate limit states. Three alternative methods to obtain the design resistance from
the non-linear finite element analysis: the Global Resistance Factor method (GRF), the
Partial Factor method (PF) and the Estimate of Coefficient of Variation or resistance
method (ECOV).

Rijkswaterstaat Centre for Infrastructure
Validation of the Guidelines for Nonlinear Page 9 of 105
Finite Element Analysis of Concrete Structure Issued: 15 June 2017
Part: Reinforced beams Version: 1.0
RTD: 1016-3A: 2017 Status: Final
3 Case RB1: Vecchio & Shim (2004)
The experimental program of Vecchio & Shim (2004) is a re-examination of the
classical experiments of Bresler & Scordelis (1963). The complete experimental
program consisted of twelve beams with different ratios of shear and longitudinal
reinforcement. Beam C3 is selected, as this beam has the longest span (6400 mm) and
featured a flexure-compressive failure mechanism.
3.1 Experimental setup and results
Geometry The geometry of the beam and reinforcement is shown in Figure 3-1 and Figure 3-2.
The beam has a total length of 6.840 m, a depth of 0.552 m, and a width of 0.152 m.
Figure 3-1: Case RB1. Dimensions (in mm), reinforcements and loading (Vecchio &
Shim 2004)
The bottom longitudinal reinforcement is extended outside the beam and welded to
one-inch thick plates. It is assumed that the dimensions of these plates are
0.192×0.350×0.025 m3.
Figure 3-2: Case RB1. Cross section details (in mm), (Vecchio & Shim 2004)
Material Properties Concrete and reinforcement properties, given in Vecchio & Shim (2004) are listed in
Table 3-1

Rijkswaterstaat Centre for Infrastructure
Validation of the Guidelines for Nonlinear Page 10 of 105
Finite Element Analysis of Concrete Structure Issued: 15 June 2017
Part: Reinforced beams Version: 1.0
RTD: 1016-3A: 2017 Status: Final
Table 3-1: Case RB1. Concrete and reinforcement properties
Concrete properties
fcm
(N/mm2)
dmax
(mm)
43.5 20
Reinforcement properties
Bar
(mm)
As
(mm2)
Es
(N/mm2)
fym
(N/mm2)
ftm
(N/mm2)
M10 11.3 100 200000 315 460
M25 25.2 500 220000 445 680
M30 29.9 700 200000 436 700
D4 3.7 25.7 200000 600 651
Loading and Boundary Conditions The loading and boundary conditions in the experimental setup are shown in Figure
3-3.
The out-of-plane dimensions of the loading and support plates are larger than the out-
of-plane thickness of the beam.
Figure 3-3: Case RB1. Loading and boundary conditions (Vecchio & Shim 2004)
Experimental Results The beam exhibited a flexural-compressive failure mode with a clear maximum in the
load-deflection response, Figure 3-4 and Figure 3-5. The experimental ultimate value
of applied load was equal to kNPExp 265 at the deflection of 44.3 mm.
Figure 3-4: Case RB1. Failure mechanisms at experimental ultimate value of applied
load (Vecchio & Shim 2004)

Rijkswaterstaat Centre for Infrastructure
Validation of the Guidelines for Nonlinear Page 11 of 105
Finite Element Analysis of Concrete Structure Issued: 15 June 2017
Part: Reinforced beams Version: 1.0
RTD: 1016-3A: 2017 Status: Final
Figure 3-5: Case RB1. Experimental load-deflection at midspan
3.2 Analytical analysis
In Figure 3-6 the load configuration at failure is reported. The distributed load
representing the beam weight is equal to mkNmkNmmq 098.225552.0152.0 3 .
Figure 3-6: Case RB1. Load configurations (dimensions in m)
Load case 1 Figure 3-7 shows that the maximum value of applied moment at the midspan is equal
to kNm.m).(
kN/m.m).(
kN/m.EM 69102
2200982
8
460982
22
max,
and the maximum value of applied shear force at the supports is equal to
kN.m.
mkN.VE, 7162
460982max .

Rijkswaterstaat Centre for Infrastructure
Validation of the Guidelines for Nonlinear Page 12 of 105
Finite Element Analysis of Concrete Structure Issued: 15 June 2017
Part: Reinforced beams Version: 1.0
RTD: 1016-3A: 2017 Status: Final
Figure 3-7: Case RB1. Load 1: Internal forces
Load case 2
The experimental ultimate value of the applied load is equal to kNPE 265max, .
Figure 3-8: Case RB1. Load 2: Internal forces
Figure 3-8 shows that the maximum value of applied moment at midspan is equal to
kNmm.
kNM E, 4244
46265max and the value of applied shear force is equal to
kN.VE, 5132max .
Load case 1 + Load case 2
At failure the maximum value of applied moment is
kNm.kNmkNm.M E, 694344246910max and the value of applied shear force is equal
to kN.kN.kN.VE, 211395132716max .
q(0.44+6.4)/2=7.17 kN q(0.44+6.4)/2=7.17 kN
-0.05 kNm
10.69 kNm
-0.05 kNm
-0.46 kN
0.46 kN
6.71 kN
-6.71 kN
Load 1: q = 2.098 kN/m
Load 2: P = 265 kN
P/2=132.5 kN P/2=132.5 kN
132.5 kN
-132.5 kN
424 kNm

Rijkswaterstaat Centre for Infrastructure
Validation of the Guidelines for Nonlinear Page 13 of 105
Finite Element Analysis of Concrete Structure Issued: 15 June 2017
Part: Reinforced beams Version: 1.0
RTD: 1016-3A: 2017 Status: Final
The design value of resistance moment is evaluated with sectional analysis by
assuming:
the tensile strength of concrete is ignored,
the compressive stresses in concrete are derived from a parabola-rectangle
relation,
the stresses in the reinforcing steel are derived from an elastic–plastic stress-
strain relation with hardening,
the partial safety factor for the mechanical properties of reinforcing steel
equals s=1.15, the factor for concrete material properties equals c=1.5.
The failure mechanism of the specimen is caused due to crushing of concrete after
yielding of reinforcing steel. The design bending moment resistance is calculated
below.
Figure 3-9: Case RB1. Stress block for determination of the design moment resistance
Assuming that reinforcement yields at strains: 310721 .E
fε
s
yd
s
mmxxbf.fAfAfA cdydsydsyds 248080950321
which is smaller than mmx 327lim .
Verification of the assumptions for the calculated value of x:
yieldssteel.mm
mm)mm(.
x
x)(dεε cu
s
3121 103873
248
24848800350
yieldssteel.mm
mm)mm(.
x
x)(dεε cu
s
3222 104842
248
24842400350
yieldssteel..mm
mmmmε
x
axε cus
3
21
3 10794200350248
50248
thus the assumptions that reinforcement yields is fulfilled.
The design value of the moment resistance in calculated around the centre of the
compression zone x416.0 :
kNm.)ax.(fAx).(dfAx).(dfAM ydsydsydsRd 7300416041604160 132211
The value of applied moment equals to
kNm.m.
Pm).(
qm).(
qME, 73004
46
8
46
2
220 22
max
which results in the value of the applied load
kN.m).(
qm).(
qkNm.m.
PRd 2321818
246
2
22207300
46
4

Rijkswaterstaat Centre for Infrastructure
Validation of the Guidelines for Nonlinear Page 14 of 105
Finite Element Analysis of Concrete Structure Issued: 15 June 2017
Part: Reinforced beams Version: 1.0
RTD: 1016-3A: 2017 Status: Final
The design value of shear resistance is kN.V,VV Rd,sRd,cRd 96149min . The design
shear resistance attributed to concrete is evaluated with:
kN.
.
.
mm
N.
..mmmm.
θ
θαfναdb.V cdcwwRd,c
95264521
5206723
250
535160146115290
cot1
cotcot90
22
21
whereas the design shear resistance provided by stirrups is calculated as:
kN..mm
N.
mm
mm.mm.θf
s
Ad.V ywd
swRd,s 961495256472
168
45146190cot90
2
2
The value of shear resistance equals to kN.P
kN.V EdRd 96149
2716 which solved for
unknown PEd yields the value of the applied load of 286.5kN.
From the comparison of the calculated values of the applied load related to the design
moment resistance – 181.23kN and dictated by the shear resistance – 286.5kN, it can
be concluded that because the former force is lower – thus governing, the beam fails in
bending.
Table 3-2: Case RB1. Design value of beam resistance expressed in terms of applied
load PRd
PRd (EC2 – MC2010)
(kN)
181.232
In Table 3-2 the design value of beam resistance expressed in terms of applied load PRd
obtained with Eurocode 2 (CEN, 2005) and Model Code 2010 (fib, 2013) is
summarized.
3.3 Finite element model
Units Units are N, m.
Material models and parameters The concrete model is based on a total strain rotating crack model with
exponential softening in tension and parabolic behavior in compression,
variable Poisson’s ratio of concrete dependent on crack strain values,
reduction of compressive strength of concrete due to lateral cracking with a
lower limit of 0.6 according to (Vecchio, 1986),
increase in compressive strength due to lateral confinement according to the
model proposed by Selby and Vecchio (Selby and Vecchio, 1993).
The mechanical properties for concrete are summarized inTable 3-3. The uniaxial
stress-strain curve is shown in Figure 3-10. In the input file of the analysis, the GF
value has been decreased with a factor 2 in order to compensate for an
underestimation of the crack band width for cracks with an inclination angle of 45
degrees, 102.02/144.0, reducedFG .

Rijkswaterstaat Centre for Infrastructure
Validation of the Guidelines for Nonlinear Page 15 of 105
Finite Element Analysis of Concrete Structure Issued: 15 June 2017
Part: Reinforced beams Version: 1.0
RTD: 1016-3A: 2017 Status: Final
Table 3-3: Case RB1. Constitutive model parameters for concrete
fcm
(N/mm2)
fctm
(N/mm2)
Ec
(N/mm2)
ν GF
(Nmm/mm2)
GC
(Nmm/mm2)
Mean
measured
values
43.5 3.24* 34925
* 0.15 0.144
* 35.99
*
* Not specified in reference; estimated according to MC2010 (fib, 2013).
Figure 3-10: Case RB1. Stress-strain curve for concrete
The model for the reinforcement bars and stirrups is based on hardening plasticity.
Geometrical and mechanical features of reinforcing bars are summarized in Table 3-1.
The stress- strain curve of the M30 reinforcing bars is plotted in Figure 3-11.
Figure 3-11: Case RB1. Stress-strain curve for M30 reinforcing bars
For the steel plates a linear elastic behavior is assumed, see Table 3-4.

Rijkswaterstaat Centre for Infrastructure
Validation of the Guidelines for Nonlinear Page 16 of 105
Finite Element Analysis of Concrete Structure Issued: 15 June 2017
Part: Reinforced beams Version: 1.0
RTD: 1016-3A: 2017 Status: Final
Table 3-4: Case RB1. Steel plates properties
E
(N/mm2)
200000 0.3
Interface elements were used between the steel plates and the concrete beam at the
supports and loading positions. The thickness of interface elements equals 10 mm.
Stress-strain relation in compression was derived by assuming a stiffness equivalent to
the stiffness of a layer of mortar 1 mm thick having a Young’s modulus derived from
the mean measured of compressive strength of concrete as reported in Table 3-3.
A bilinear behavior is assumed in normal direction (see Figure 3-12) and a linear
elastic relation is assumed in shear direction. The normal stiffness in tension and the
stiffness in shear direction were assumed almost equal to zero. For stableness of the
analysis horizontal displacements of one pair of nodes across the interface elements of
support plates and loading plate were tied. The mechanical features of the interface
elements are summarized in Table 3-5.
Figure 3-12: Case RB1. Traction-displacement diagram in normal direction for
interfaces (not to scale)
Table 3-5: Case RB1. Interface properties
Knn in tension
(N/mm3)
Knn in compression
(N/mm3)
Kt
(N/mm3)
3.42×10⁻⁸
3.42×10+4
3.42×10⁻⁸
Element types and finite element mesh For meshing the concrete, 8-node membrane elements (CQ16M) with a full Gauss
integration scheme (3×3) are used. The average element size is 44×36 mm2. The
reinforcement bars and stirrups are modelled with embedded truss elements with two
Gauss integration points along the axis of the element. A perfect bond is assumed. For
the steel plates 8-node membrane elements (CQ16M) with a full Gauss integration
scheme (3×3) are used.
The 6-node interfaces element have three Lobatto integration points.
Rijkswaterstaat Centre for Infrastructure
Validation of the Guidelines for Nonlinear Page 17 of 105
Finite Element Analysis of Concrete Structure Issued: 15 June 2017
Part: Reinforced beams Version: 1.0
RTD: 1016-3A: 2017 Status: Final
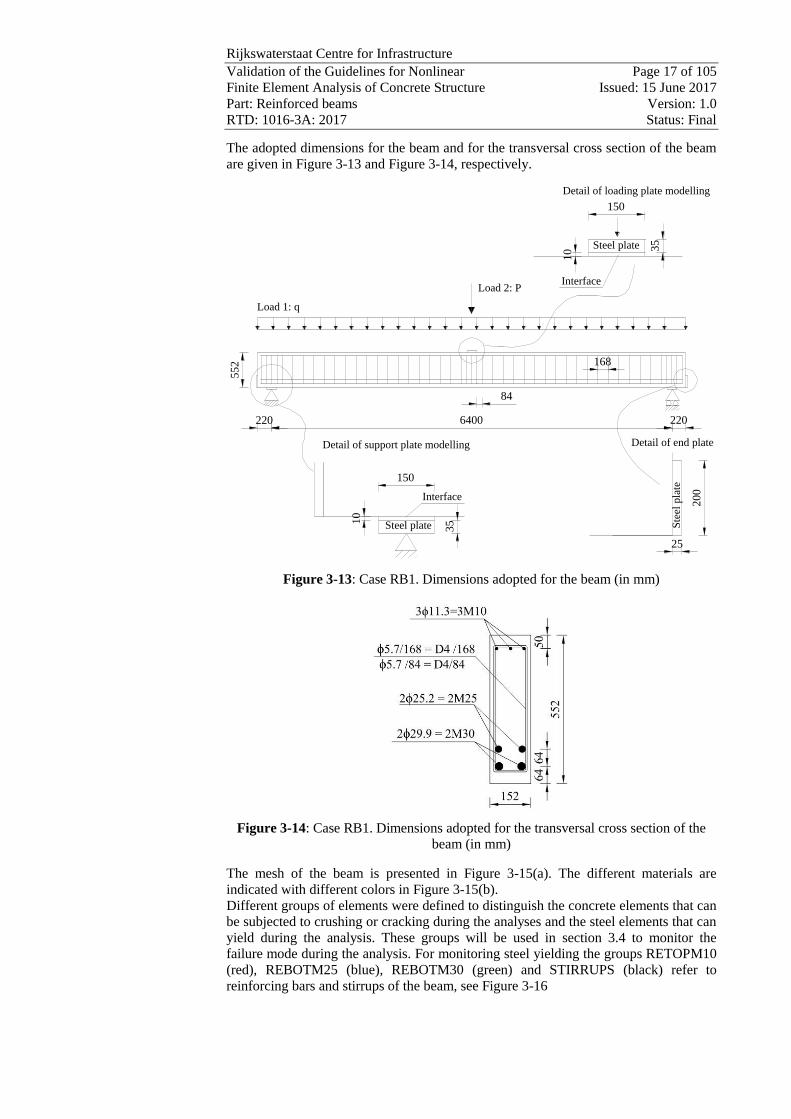
The adopted dimensions for the beam and for the transversal cross section of the beam
are given in Figure 3-13 and Figure 3-14, respectively.
Figure 3-13: Case RB1. Dimensions adopted for the beam (in mm)
Figure 3-14: Case RB1. Dimensions adopted for the transversal cross section of the
beam (in mm)
The mesh of the beam is presented in Figure 3-15(a). The different materials are
indicated with different colors in Figure 3-15(b).
Different groups of elements were defined to distinguish the concrete elements that can
be subjected to crushing or cracking during the analyses and the steel elements that can
yield during the analysis. These groups will be used in section 3.4 to monitor the
failure mode during the analysis. For monitoring steel yielding the groups RETOPM10
(red), REBOTM25 (blue), REBOTM30 (green) and STIRRUPS (black) refer to
reinforcing bars and stirrups of the beam, see Figure 3-16
150
10
35
200
Load 1: q
Load 2: P
6400
35
25
150
10
Steel plate
Interface
Detail of support plate modelling
Detail of loading plate modelling
Steel plate
Interface
Detail of end plate
Ste
el p
late
84
220220
552 168

Rijkswaterstaat Centre for Infrastructure
Validation of the Guidelines for Nonlinear Page 18 of 105
Finite Element Analysis of Concrete Structure Issued: 15 June 2017
Part: Reinforced beams Version: 1.0
RTD: 1016-3A: 2017 Status: Final
(a)
(b)
Figure 3-15: Case RB1. (a) Mesh and (b) material sets.
Figure 3-16: Case RB1. Groups of steel elements monitoring yielding
Figure 3-17 shows the group of elements named CRUSHING, used for monitoring the
inelastic behavior of concrete in compression. This group of elements has a length
equal to 5 times the length of the loading steel plate and a depth equal to the length of
the loading steel plate, Figure 3-17.
Figure 3-17: Case RB1. Group of concrete elements monitoring crushing due to
bending
Figure 3-18 shows the group of elements named SHEAR, where the inelastic behavior
of concrete due to shear was monitored. The group SHEAR has a length equal to the
space between the end of the loading plate and the end of the support plate and a depth
equal to the space between upper and lower reinforcement.
Group shear is lying between the RETOPM10 and the group REBOTM25 and between
the edges of the load and support steel plate.
Figure 3-18: Case RB1. Group of concrete elements monitoring inelastic behavior due
to shear
Boundary conditions and loading The translations along x and y axes at a single node of the left steel plate (support 1) are
constrained as well as the translation along y axis at a single node of the right steel
plate (support 2), Figure 3-19.
Dead load is applied in load case 1; load P as a unit load of N3101 is added at the
load case 2 as a concentrated load applied at the mid node of the loading plate, Figure
3-19.
X
Y
Z
Model: RB1_NL
20 NOV 2009 17:38:56 meshiDIANA 9.3-01 : TU Delft
X
Y
Z
Model: RB1_NL
20 NOV 2009 17:40:29 meshmatiDIANA 9.3-01 : TU Delft
RETOPM10
REBOTM25
REBOTM30
STIRRUPS
CRUSHING
P
SHEAR

Rijkswaterstaat Centre for Infrastructure
Validation of the Guidelines for Nonlinear Page 19 of 105
Finite Element Analysis of Concrete Structure Issued: 15 June 2017
Part: Reinforced beams Version: 1.0
RTD: 1016-3A: 2017 Status: Final
Figure 3-19: Case RB1. Boundary conditions and load case 2
Load increments and convergence criteria Load case 1 is applied in a single step. The regular Newton-Raphson method with a
maximum of 25 iterations is used. The selected convergence norms are according to
both force and energy norms. The analysis continues even if the convergence criteria
are not satisfied. The convergence tolerance is equal to 5×10⁻²
for the force norm and
1×10⁻²
for the energy norm. A Line Search algorithm is used to improve the
convergence performance.
Figure 3-20: Case RB1. `Indirect Displacement control' technique applied referring to
node 5514
Load case 2 is applied with automatic adaptive load increments based on energy. The
initial load factor equals 5, the upper limit of the incremental load factor equals 10 and
the lower limit of the incremental load factor equals 5. The maximum number of steps
is 150. Arc-length control was applied based on translation along y axis of node 5514
at mid-span (“indirect displacement control”), Figure 3-20. The analysis continues
even if the convergence criteria are not satisfied. The convergence tolerances are equal
to 1×10⁻³
and 1×10⁻²
for energy and forces, respectively. A maximum of 25 iterations is
used. A line search algorithm is used to improve the convergence performance.
3.4 Nonlinear finite element analysis
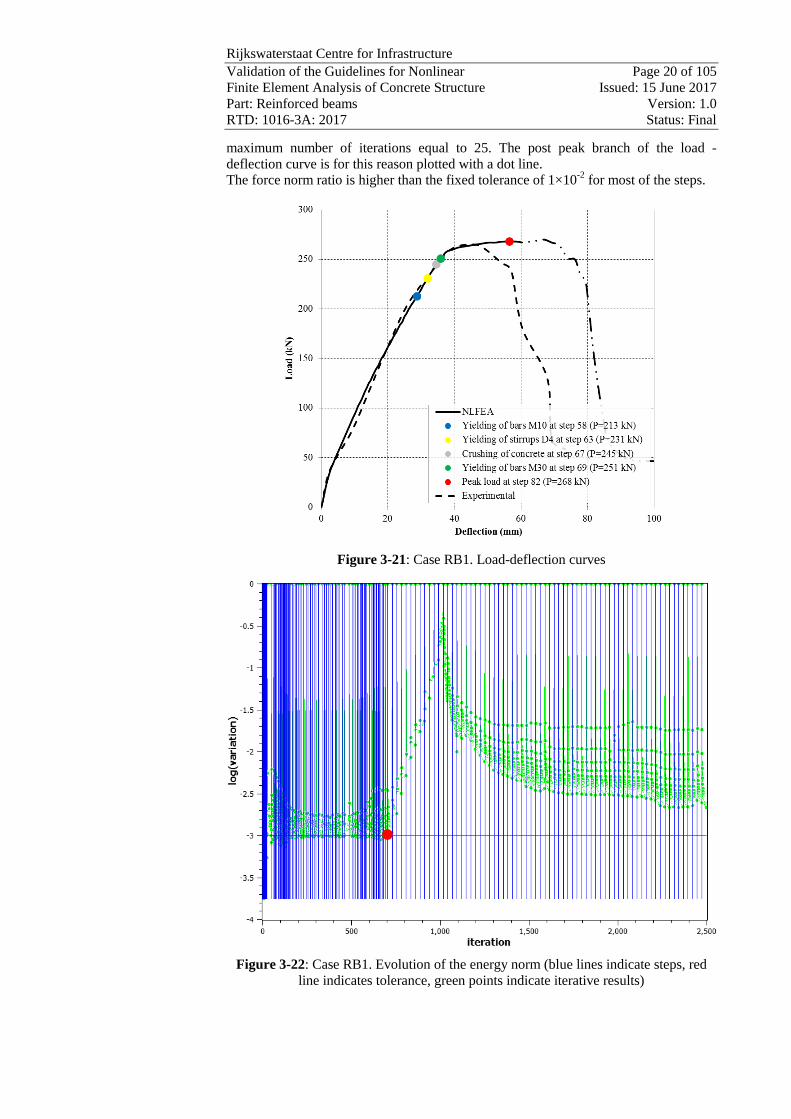
Load deflection The load-deflection curve is presented in Figure 3-21 where the applied load values
corresponding to the onset of yielding of the M30 and M25 longitudinal bars, yielding
of the M10 longitudinal bars, yielding of the stirrups D4 are indicated. The step in
which the first integration point reaches a minimum principal strain value lower than -
3.5×10⁻³
is defined crushing of concrete.
Convergence behavior For most steps convergence is achieved on the basis of the energy criterion, Figure
3-22 and Figure 3-23.
For load case 2 the peak load is defined as the highest load step for which the energy
norm ratio satisfies the fixed tolerance of 1×10⁻³
and it is marked in Figure 3-22 and
Figure 3-23 with a red dot.
The convergence behavior is quite poor after reaching the peak load. After step 82, the
analysis continues even if the energy convergence criteria are not satisfied within the
X
Y
Z
Model: RB1_NL
20 NOV 2009 17:38:56 meshiDIANA 9.3-01 : TU Delft
X
Y
Z
Model: RB1_NL
20 NOV 2009 17:38:56 meshiDIANA 9.3-01 : TU Delft
Support 1 Support 2
5514
x
P
y Support 1 Support 2
Rijkswaterstaat Centre for Infrastructure
Validation of the Guidelines for Nonlinear Page 20 of 105
Finite Element Analysis of Concrete Structure Issued: 15 June 2017
Part: Reinforced beams Version: 1.0
RTD: 1016-3A: 2017 Status: Final
maximum number of iterations equal to 25. The post peak branch of the load -
deflection curve is for this reason plotted with a dot line.
The force norm ratio is higher than the fixed tolerance of 1×10⁻²
for most of the steps.
Figure 3-21: Case RB1. Load-deflection curves
Figure 3-22: Case RB1. Evolution of the energy norm (blue lines indicate steps, red
line indicates tolerance, green points indicate iterative results)

Rijkswaterstaat Centre for Infrastructure
Validation of the Guidelines for Nonlinear Page 21 of 105
Finite Element Analysis of Concrete Structure Issued: 15 June 2017
Part: Reinforced beams Version: 1.0
RTD: 1016-3A: 2017 Status: Final
Figure 3-23: Case RB1. Evolution of the force norm (blue lines indicate steps, red line
indicates tolerance, green points indicate iterative results)
Strains Figure 3-24 shows the crack strain values (which are the plastic part of the maximum
principal strain values) at step 65 (load kNP 238 ). The first crack strain value plotted
in Figure 3-24, equal to 7.86×10⁻⁴
, corresponds to the ultimate crack strain value
calculated as ctm
Fut
fh
G
, , while the third crack strain value, equal to 3.62×10
-3, is the
crack strain value corresponding to a stress value equal to 1% of fctm. An intermediate
crack strain value was added in the contour plot.
The crack pattern, which can be derived from the contour of the principal strain value,
shows that the failure is mainly due to bending.
Figure 3-24: Case RB1. Crack strain values at step 65 ( kNP 238 )
0
0.5
1
1.5
2
2.5
3
3.5
0.0E+0 1.0E-3 2.0E-3 3.0E-3 4.0E-3
s(N
/mm
2)
(-)

Rijkswaterstaat Centre for Infrastructure
Validation of the Guidelines for Nonlinear Page 22 of 105
Finite Element Analysis of Concrete Structure Issued: 15 June 2017
Part: Reinforced beams Version: 1.0
RTD: 1016-3A: 2017 Status: Final
(a)
(b)
Figure 3-25: Case RB1. Experimental crack pattern at failure (load kNPExp 277 )
(Vecchio & Shim 2004): a) north side, (b) south side
The yielding strain for the M10 reinforcing bars is equal to 31057.1200
315 GPa
MPa. The
M10 reinforcing bars start to yield in compression at the load equal to 213kN (step 58).
Figure 3-26 shows yielding of M10 reinforcing bars at step 70 (load kNP 254 ).
Figure 3-26: Case RB1. Yielding of reinforcing bars M10 at step 70 (load kNP 254 )
The yielding strain of stirrups is equal to 3100.3200
600 GPa
MPa. Stirrups start to yield at
the load equal to 231kN (step 63). Figure 3-27 shows yielding of stirrups at step 80
(load kNP 267 ).

Rijkswaterstaat Centre for Infrastructure
Validation of the Guidelines for Nonlinear Page 23 of 105
Finite Element Analysis of Concrete Structure Issued: 15 June 2017
Part: Reinforced beams Version: 1.0
RTD: 1016-3A: 2017 Status: Final
Figure 3-27: Case RB1. Yielding of stirrups at step 80 (load kNP 267 )
The yielding strain of the M30 reinforcing bars is equal to 31018.2200
436 GPa
MPa. The
longitudinal M30 reinforcing bars start to yield in tension at the load equal to 251 kN
(step 69). Figure 3-28 shows yielding of M30 reinforcing bars at step 75 (load
kNP 263 ).
Figure 3-28: Case RB1. Yielding of reinforcing bars M30 at step 75 (load kNP 263 )
The yielding strain of the M25 reinforcing bars is equal to 31002.2220
445 GPa
MPa. The
longitudinal M25 reinforcing bars start to yield at a load equal to 257 kN (step 71).
Figure 3-29 shows yielding of M25 reinforcing bars at step 75 (load kNP 263 ).
Figure 3-29: Case RB1. Yielding of M25 reinforcing bars at step 75 (load kNP 263 )
Figure 3-30shows principal strain state at the step 82 (peak load). The values of the
minimum principal strain at the location of applied load are lower than -3.5×10⁻³
which

Rijkswaterstaat Centre for Infrastructure
Validation of the Guidelines for Nonlinear Page 24 of 105
Finite Element Analysis of Concrete Structure Issued: 15 June 2017
Part: Reinforced beams Version: 1.0
RTD: 1016-3A: 2017 Status: Final
indicates crushing of concrete in this area. The peak value of applied load obtained
from the NLFEA is equal to kNPu 268 .
Figure 3-30: Case RB1. Minimum principal strain at step 82 (load kNPu 268 )
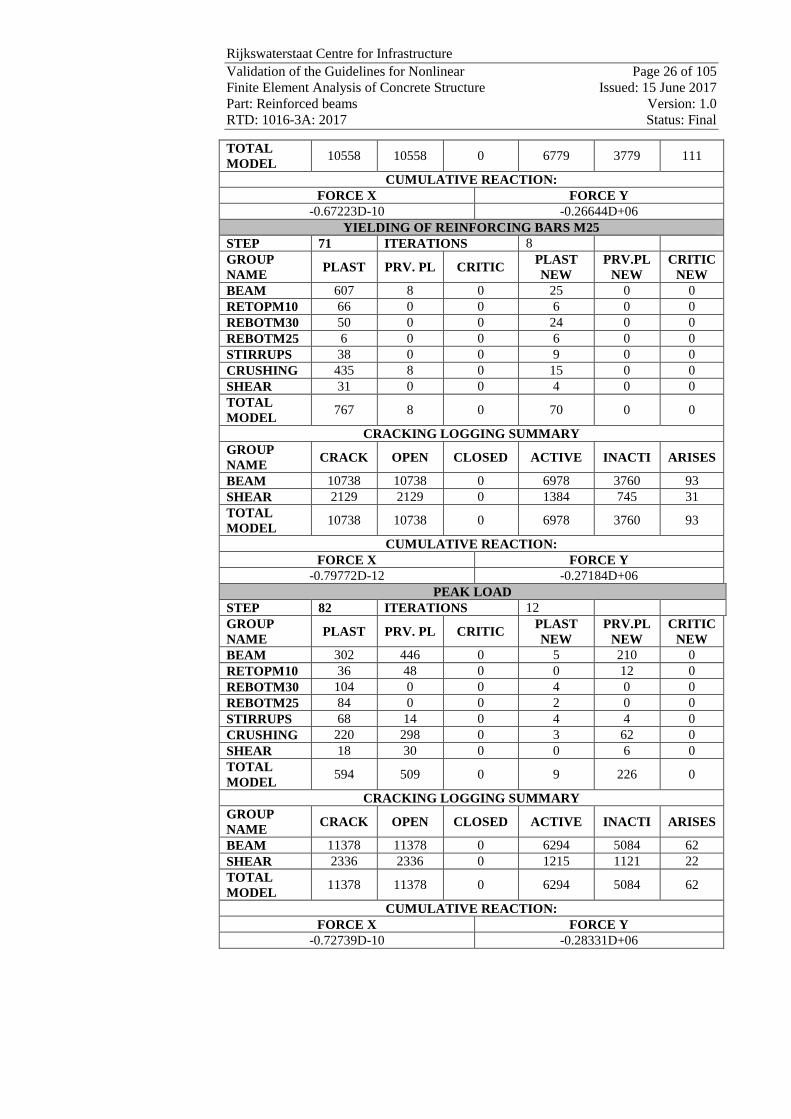
Gauss point statistics In Table 3-6 lists the number of cracking points, crushing points and yield points at
step 58 (beginning of yielding of M10 reinforcing bars), at step 63 (beginning of
yielding of stirrups), at step 67 (when the first element reaches minimum principal
strains lower than -3.5×10⁻³
), at step 69 (beginning of yielding of M30 reinforcing
bars), at step 71 (beginning of yielding of M25 reinforcing bars) and at step 82 (peak
load). Crushing is defined as soon as the softening branch in compression is reached. In
the current case, it is at the minimum principal strain of -2.1×10⁻³
.
Table 3-6: Case RB1; number of cracking points, crushing points, and yield points
YIELDING OF REINFORCING BARS M10
STEP 58 ITERATIONS 17
GROUP
NAME PLAST PRV. PL CRITIC
PLAST
NEW
PRV.PL
NEW
CRITIC
NEW
BEAM 278 2 0 22 0 0
RETOPM10 18 0 0 18 0 0
CRUSHING 252 2 0 16 0 0
TOTAL
MODEL 296 2 0 40 0 0
CRACKING LOGGING SUMMARY
GROUP
NAME CRACK OPEN CLOSED ACTIVE INACTI ARISES
BEAM 9725 9725 0 5725 4000 93
SHEAR 1799 1799 0 1031 768 34
TOTAL
MODEL 9725 9725 0 5725 4000 93
CUMULATIVE REACTION:
FORCE X FORCE Y
-0.24945D-09 -0.22759D+06
YIELDING OF STIRRUPS
STEP 63 ITERATIONS 12
GROUP
NAME PLAST PRV. PL CRITIC
PLAST
NEW
PRV.PL
NEW
CRITIC
NEW

Rijkswaterstaat Centre for Infrastructure
Validation of the Guidelines for Nonlinear Page 25 of 105
Finite Element Analysis of Concrete Structure Issued: 15 June 2017
Part: Reinforced beams Version: 1.0
RTD: 1016-3A: 2017 Status: Final
BEAM 338 0 0 28 0 0
RETOPM10 27 0 0 12 0 0
STIRRUPS 2 2
CRUSHING 280 0 0 18 0 0
SHEAR 3 0 0 3 0 0
TOTAL
MODEL 367 0 0 42 0 0
CRACKING LOGGING SUMMARY
GROUP
NAME CRACK OPEN CLOSED ACTIVE INACTI ARISES
BEAM 9774 9768 6 6184 3590 93
SHEAR 1731 1791 0 1059 732 39
TOTAL
MODEL 9774 9768 6 6184 3590 93
CUMULATIVE REACTION:
FORCE X FORCE Y
-0.63461D-09 -0.24465D+06
CRUSHING OF CONCRETE
STEP 67 ITERATIONS 7
GROUP
NAME PLAST PRV. PL CRITIC
PLAST
NEW
PRV.PL
NEW
CRITIC
NEW
BEAM 505 8 0 25 0 0
RETOPM10 54 0 0 6 0 0
STIRRUPS 20 0 0 4 0 0
CRUSHING 379 8 0 11 0 0
SHEAR 16 0 0 1 0 0
TOTAL
MODEL 579 8 0 35 0 0
CRACKING LOGGING SUMMARY
GROUP
NAME CRACK OPEN CLOSED ACTIVE INACTI ARISES
BEAM 10368 10368 0 7047 3321 86
SHEAR 2007 2007 0 1351 656 31
TOTAL
MODEL 10368 10368 0 7047 3321 86
CUMULATIVE REACTION:
FORCE X FORCE Y
-0.16393D-08 -0.26027D+06
YIELDING OF REINFORCING BARS M30
STEP 69 ITERATIONS 13
GROUP
NAME PLAST PRV. PL CRITIC
PLAST
NEW
PRV.PL
NEW
CRITIC
NEW
BEAM 555 10 0 21 0 0
RETOPM10 60 0 0 0 0 0
RETOPM30 14 0 0 14 0 0
STIRRUPS 26 0 0 4 0 0
CRUSHING 407 10 0 13 2 0
SHEAR 23 0 0 2 0 0
TOTAL
MODEL 655 10 0 39 2 0
CRACKING LOGGING SUMMARY
GROUP
NAME CRACK OPEN CLOSED ACTIVE INACTI ARISES
BEAM 10558 10558 0 6779 3779 111
SHEAR 2067 2067 0 1321 746 35
Rijkswaterstaat Centre for Infrastructure
Validation of the Guidelines for Nonlinear Page 26 of 105
Finite Element Analysis of Concrete Structure Issued: 15 June 2017
Part: Reinforced beams Version: 1.0
RTD: 1016-3A: 2017 Status: Final
TOTAL
MODEL 10558 10558 0 6779 3779 111
CUMULATIVE REACTION:
FORCE X FORCE Y
-0.67223D-10 -0.26644D+06
YIELDING OF REINFORCING BARS M25
STEP 71 ITERATIONS 8
GROUP
NAME PLAST PRV. PL CRITIC
PLAST
NEW
PRV.PL
NEW
CRITIC
NEW
BEAM 607 8 0 25 0 0
RETOPM10 66 0 0 6 0 0
REBOTM30 50 0 0 24 0 0
REBOTM25 6 0 0 6 0 0
STIRRUPS 38 0 0 9 0 0
CRUSHING 435 8 0 15 0 0
SHEAR 31 0 0 4 0 0
TOTAL
MODEL 767 8 0 70 0 0
CRACKING LOGGING SUMMARY
GROUP
NAME CRACK OPEN CLOSED ACTIVE INACTI ARISES
BEAM 10738 10738 0 6978 3760 93
SHEAR 2129 2129 0 1384 745 31
TOTAL
MODEL 10738 10738 0 6978 3760 93
CUMULATIVE REACTION:
FORCE X FORCE Y
-0.79772D-12 -0.27184D+06
PEAK LOAD
STEP 82 ITERATIONS 12
GROUP
NAME PLAST PRV. PL CRITIC
PLAST
NEW
PRV.PL
NEW
CRITIC
NEW
BEAM 302 446 0 5 210 0
RETOPM10 36 48 0 0 12 0
REBOTM30 104 0 0 4 0 0
REBOTM25 84 0 0 2 0 0
STIRRUPS 68 14 0 4 4 0
CRUSHING 220 298 0 3 62 0
SHEAR 18 30 0 0 6 0
TOTAL
MODEL 594 509 0 9 226 0
CRACKING LOGGING SUMMARY
GROUP
NAME CRACK OPEN CLOSED ACTIVE INACTI ARISES
BEAM 11378 11378 0 6294 5084 62
SHEAR 2336 2336 0 1215 1121 22
TOTAL
MODEL 11378 11378 0 6294 5084 62
CUMULATIVE REACTION:
FORCE X FORCE Y
-0.72739D-10 -0.28331D+06
Rijkswaterstaat Centre for Infrastructure
Validation of the Guidelines for Nonlinear Page 27 of 105
Finite Element Analysis of Concrete Structure Issued: 15 June 2017
Part: Reinforced beams Version: 1.0
RTD: 1016-3A: 2017 Status: Final
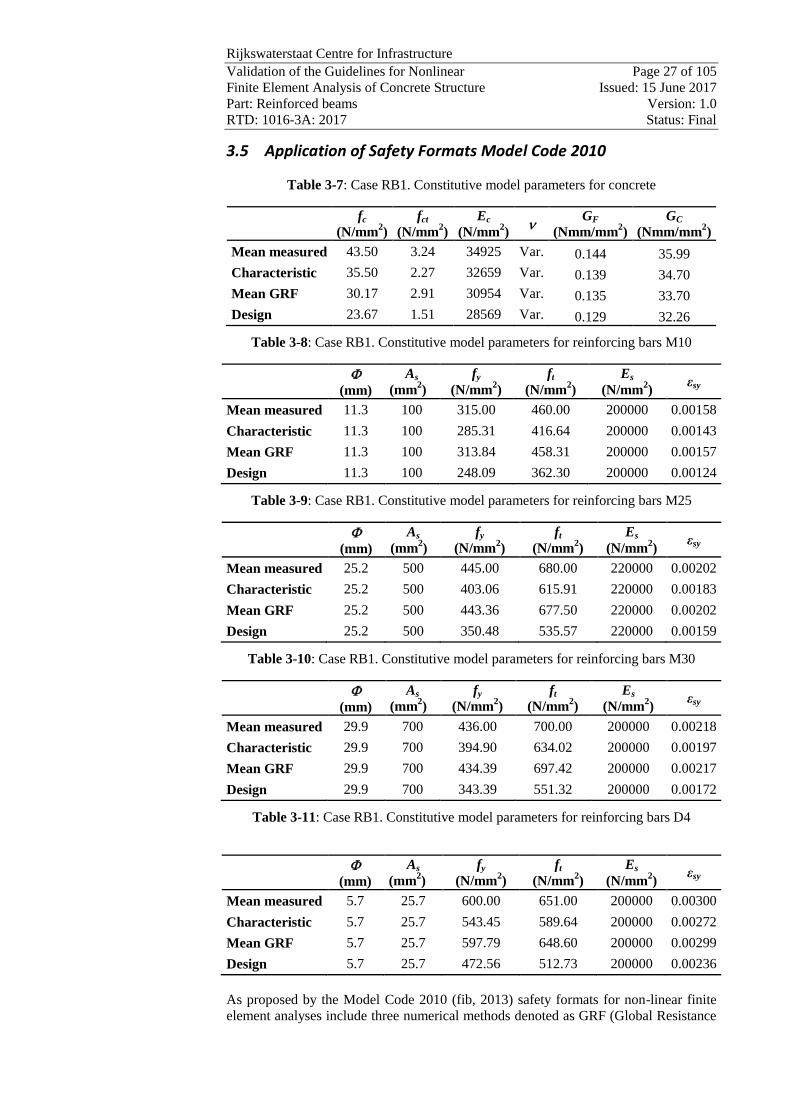
3.5 Application of Safety Formats Model Code 2010
Table 3-7: Case RB1. Constitutive model parameters for concrete
fc
(N/mm2)
fct
(N/mm2)
Ec
(N/mm2)
GF
(Nmm/mm2)
GC
(Nmm/mm2)
Mean measured 43.50 3.24 34925 Var. 0.144 35.99
Characteristic 35.50 2.27 32659 Var. 0.139 34.70
Mean GRF 30.17 2.91 30954 Var. 0.135 33.70
Design 23.67 1.51 28569 Var. 0.129 32.26
Table 3-8: Case RB1. Constitutive model parameters for reinforcing bars M10
(mm)
As
(mm2)
fy
(N/mm2)
ft
(N/mm2)
Es
(N/mm2)
εsy
Mean measured 11.3 100 315.00 460.00 200000 0.00158
Characteristic 11.3 100 285.31 416.64 200000 0.00143
Mean GRF 11.3 100 313.84 458.31 200000 0.00157
Design 11.3 100 248.09 362.30 200000 0.00124
Table 3-9: Case RB1. Constitutive model parameters for reinforcing bars M25
(mm)
As
(mm2)
fy
(N/mm2)
ft
(N/mm2)
Es
(N/mm2)
εsy
Mean measured 25.2 500 445.00 680.00 220000 0.00202
Characteristic 25.2 500 403.06 615.91 220000 0.00183
Mean GRF 25.2 500 443.36 677.50 220000 0.00202
Design 25.2 500 350.48 535.57 220000 0.00159
Table 3-10: Case RB1. Constitutive model parameters for reinforcing bars M30
(mm)
As
(mm2)
fy
(N/mm2)
ft
(N/mm2)
Es
(N/mm2)
εsy
Mean measured 29.9 700 436.00 700.00 200000 0.00218
Characteristic 29.9 700 394.90 634.02 200000 0.00197
Mean GRF 29.9 700 434.39 697.42 200000 0.00217
Design 29.9 700 343.39 551.32 200000 0.00172
Table 3-11: Case RB1. Constitutive model parameters for reinforcing bars D4
(mm)
As
(mm2)
fy
(N/mm2)
ft
(N/mm2)
Es
(N/mm2)
εsy
Mean measured 5.7 25.7 600.00 651.00 200000 0.00300
Characteristic 5.7 25.7 543.45 589.64 200000 0.00272
Mean GRF 5.7 25.7 597.79 648.60 200000 0.00299
Design 5.7 25.7 472.56 512.73 200000 0.00236
As proposed by the Model Code 2010 (fib, 2013) safety formats for non-linear finite
element analyses include three numerical methods denoted as GRF (Global Resistance

Rijkswaterstaat Centre for Infrastructure
Validation of the Guidelines for Nonlinear Page 28 of 105
Finite Element Analysis of Concrete Structure Issued: 15 June 2017
Part: Reinforced beams Version: 1.0
RTD: 1016-3A: 2017 Status: Final
Factor method), PF (Partial Factor method) and ECOV (Method of Estimation of a
Coefficient of Variation of resistance). Application of the safety formats requires in
total 4 non-linear analyses. In Table 3-7 - Table 3-11 the mechanical properties used in
the non-linear analyses are summarized.
In Figure 3-31 the load-deflection curves obtained with mean measured, characteristic,
mean GRF and design values of material strengths, calculated according to the Model
Code 2010 (fib, 2013) are shown. In Figure 3-31 the peak loads of the analyses are
presented. The aforementioned loads were defined as the highest load step which
satisfied the imposed energy convergence tolerance of 1×10⁻³
or as the highest load
value when the energy convergence norm was met in the subsequent steps. The peak
loads are indicated with dots in Figure 3-31.
Figure 3-31: Case RB1. Load-deflection curves obtained with mean measured,
characteristic, mean (GRF) and design values of material strengths calculated
according to Model Code 2010 (fib, 2013)
The beam RB1 was analyzed with the analytical procedures proposed for sectional
analysis an as well as numerically, with application of the safety formats for NLFEA as
proposed by the Model Code 2010. Figure 3-32 shows the comparison of the analytical
and numerical design values of the beam resistance expressed in terms of a percentage
of the experimental ultimate value of applied load.

Rijkswaterstaat Centre for Infrastructure
Validation of the Guidelines for Nonlinear Page 29 of 105
Finite Element Analysis of Concrete Structure Issued: 15 June 2017
Part: Reinforced beams Version: 1.0
RTD: 1016-3A: 2017 Status: Final
Figure 3-32: Case RB1. Analytical and numerical design values of beam resistance
expressed in terms of a percentage of the experimental ultimate value of applied load,
kNPExp 265
In Table 3-12 the design values of beam resistances, expressed in terms of applied load
PRd, obtained from numerical and analytical procedures are reported. The analytical
beam resistance was obtained in section 3.2 with application of the sectional analysis
according to Eurocode 2 (CEN, 2005) and Model Code 2010 (fib, 2013).
Table 3-12: Case RB1. Values of beam resistances, expressed in terms of applied load
PRd
Experimental EC2,MC2010 GRF PF ECOV No Safety
Formats
(kN) (kN) (kN) (kN) (kN) (kN)
265 181 190 193 203 268
3.6 Parametric study on crack models
A parametric study was carried out by varying sensitive input parameters of the
concrete constitutive model, such as the crack model and the fracture energy of
concrete in tension.
In Table 3-13 the material parameters applied in NLFE analyses performed in the
parametric study are reported. Analysis 1 to Analysis 3 refer to the three analyses
carried out by varying the aforementioned material parameters. All the analyses were
performed considering mean measured values of material strengths. Parabolic law in
compression and exponential law in tension were used for concrete, while an elasto-
plastic law with hardening was adopted for steel. The analyses were carried out in load-
control with arc-length control. A variable Poisson ratio was adopted for all analyses.
For all analyses a limit value of the reduction of the compressive strength of concrete
due to lateral cracking was adopted:
0
10
20
30
40
50
60
70
80
90
100
110
PR
d/P
EX
P(%
)

Rijkswaterstaat Centre for Infrastructure
Validation of the Guidelines for Nonlinear Page 30 of 105
Finite Element Analysis of Concrete Structure Issued: 15 June 2017
Part: Reinforced beams Version: 1.0
RTD: 1016-3A: 2017 Status: Final
6.0,
min, cm
redc
f
fs
The effect of the used values of the fracture energy of concrete in tension on the beam
response was investigated by adopting the formulation proposed by Model Code 1990
(CEB-FIP, 1993) and the formulation proposed by Model Code 2010 (fib, 2013). The
fracture energy of concrete in compression was considered for all analyses equal to
250GF (Nakamura et al. 2001).
Within the fixed crack model a variable shear retention factor, which depends on the
mean aggregate size daggr, the crack normal strain n and the crack bandwidth value h is
adopted:
hεd
β n
aggr
21
In Figure 3-33 the load-deflection curves obtained from the parametric study are
plotted and the peak load of each analysis is indicated with a circular indicator. The
peak load is defined as the highest load step where the energy norm ratio satisfies the
fixed tolerance of 1×10⁻³
.
The peak load values are reported in Table 3-13.
Table 3-13: Case RB1. Data used for the parametric study
Analysis Total strain
crack model Limit to s GF GC
Peak load value
(kN)
Analysis 1 rotating 0.6 MC2010 250 GF 268
Analysis 2 rotating 0.6 MC1990 250 GF 264
Analysis 3 fixed 0.6 MC2010 250 GF 289
In Figure 3-33 the load-deflection curves resulting from the parametric study are
plotted.
Figure 3-33: Case RB1. Load-deflection curves (Analysis 1 to 3)
The crack model and mechanical properties used in Analysis 1 were the same as those
used to predict the design value of beam resistance from NLFE analyses.
0
50
100
150
200
250
300
0 20 40 60 80 100
Lo
ad
(k
N)
Deflection (mm)
Analysis 1
Analysis 2
Analysis 3
Experimental

Rijkswaterstaat Centre for Infrastructure
Validation of the Guidelines for Nonlinear Page 31 of 105
Finite Element Analysis of Concrete Structure Issued: 15 June 2017
Part: Reinforced beams Version: 1.0
RTD: 1016-3A: 2017 Status: Final
From the comparison of analyses 1 and 2, the influence of the adapted values of the
fracture energy of the concrete in tension ( mmNG MCF 106.01990, and
mmNG MCF 144.02010, ) and corresponding compressive fracture energy
( mmNG MCC 58.261990, and mmNG MCC 99.352010, ) can be observed. Because of the
fact that the beam failed in bending with crushing of concrete, the fracture energy of
concrete in compression plays an important role on the ductility of the beam –
especially on the peak and post-peak deformation.
Comparing analyses 1 till 3, it is clear that for beam RB1, the adopted crack model
(total strain rotating or fixed crack model) has a moderate influence on the beam
response, both in terms of peak load and in terms of peak deformation.
3.7 Parametric study on crack bandwidth
This section reports on (i) the sensitivity of analyses results on h, or actually hGF ,
and (ii) on post-analysis checks on the correctness of the a priori estimates for h.
Material models and parameters, element types and finite element mesh, boundary
conditions and loading, load increments and convergence criteria are the same as those
used for the analysis carried out with mean measured material strength (please refer to
section 3.1.3).
Table 3-14 lists the a priori estimates for the crack bandwidth that are used in this
study. Note that the compressive bandwidths hC are unaltered. For practical reasons the
variations of the crack bandwidths h were applied in the finite element models by
variations of GF. The exponential softening adopted for total strain crack models and
exercised in the analysis can be formulated as given below:
u
ctε
εfσ exp
The fracture energy of concrete in tension GF divided by the crack bandwidth h is:
ut
u
ctuF εf|ε
εfεhG
0exp
The ultimate crack strain results to be evaluated with:
ct
Fu
fh
G
The maximum crack strain value max,knn is defined as the crack strain corresponding to
a residual stress equal to 1% of ft:
uuknn 6.4001.0lnmax,
The values of fracture energy of concrete in tension used as input data for the analyses
and maximum crack strain values used in the contour plot are reported in Table 3-14.
Table 3-15 gives an overview of the obtained peak loads Pu.
Table 3-14: Case RB1. Estimates for the crack bandwidth h for quadratic plane stress
quadrilaterals with 3×3 Gaussian integration
Tension
(mm)
Compression
(mm)
GF
(Nmm/mm2)
GC
(Nmm/mm2)
knn,max
Short-width h = ½√A√2 = 20√2 hc = √A = 40 0.144 35.99 7.24×10⁻²
Default h = √A√2 = 40√2 hc = √A = 40 0.144 35.99 3.62×10⁻³
Long-width h = 2√A√2 = 80√2 hc = √A = 40 0.144 35.99 1.81×10⁻³

Rijkswaterstaat Centre for Infrastructure
Validation of the Guidelines for Nonlinear Page 32 of 105
Finite Element Analysis of Concrete Structure Issued: 15 June 2017
Part: Reinforced beams Version: 1.0
RTD: 1016-3A: 2017 Status: Final
Figure 3-34: Case RB1. a) Load-deflection curves obtained with different crack
bandwidth values
Table 3-15: Case RB1. Case studies and modifications
PExp (kN) Pu (kN)
0.5h h 2h
265 271 268 255.98
Figure 3-34 shows the load-deflection curves for case RB1 obtained with different
crack bandwidth values. The three ascending branches of the load-deflection graphs in
show a comprehensible trend, with the “0.5h” branch above the “h” branch, and with
the “h” branch above the “2h” branch. This does not hold true for the three descending
branches in the Figure 3-32. A possible explanation is the sensitivity of the descending
branches with respect to convergence criteria, especially for load controlled analysis
with arc-length, see Section 3.8. A main observation is that the peak loads are hardly
influenced by the choice of the crack bandwidth.
Figure 3-35 shows contour plots of the crack strain values for the corresponding peak
values of the applied loads, obtained with different crack bandwidth values. In the
contour plots the color ranges are adjusted to the (tensile) stress-strain relations: red
denotes strains beyond the ultimate crack strain of the softening stress-strain diagram.
For a better assessment of the strain localization, mesh extractions from the marked
regions in Figure 3-35 with indicated a priori estimates of h are illustrated in Figure
3-36.
0
50
100
150
200
250
300
0 20 40 60 80 100
Lo
ad
P (
kN
)
Deflection (mm)
h
0.5h
2h

Rijkswaterstaat Centre for Infrastructure
Validation of the Guidelines for Nonlinear Page 33 of 105
Finite Element Analysis of Concrete Structure Issued: 15 June 2017
Part: Reinforced beams Version: 1.0
RTD: 1016-3A: 2017 Status: Final
0.5h
h
2h
Figure 3-35: Case RB1. Maximum principal strain values obtained with different crack
bandwidth values
0
0.5
1
1.5
2
2.5
3
3.5
0.0E+0 2.0E-3 4.0E-3 6.0E-3 8.0E-3 1.0E-2
s(N
/mm
2)
(-)
0
0.5
1
1.5
2
2.5
3
3.5
0.0E+0 1.0E-3 2.0E-3 3.0E-3 4.0E-3
s(N
/mm
2)
(-)
0
0.5
1
1.5
2
2.5
3
3.5
0.0E+0 2.0E-3 4.0E-3 6.0E-3 8.0E-3 1.0E-2
s(N
/mm
2)
(-)

Rijkswaterstaat Centre for Infrastructure
Validation of the Guidelines for Nonlinear Page 34 of 105
Finite Element Analysis of Concrete Structure Issued: 15 June 2017
Part: Reinforced beams Version: 1.0
RTD: 1016-3A: 2017 Status: Final
0.5h h 2h
(a)
(b)
(c)
Figure 3-36: Case RB1. (a) Maximum principal strains for the area indicated in Figure
3-35. (b) Maximum principal strain-distance between integration points along the lines
indicated above. The ultimate strain values are indicated by a red dashed line. (c)
fracture energy over crack bandwidth-distance between integration points.
The dissipated fracture energy divided by the crack bandwidth (gFp) is plotted versus
the distance between different integration points along a line considered perpendicular
to the crack. In all graphs 9 integration points, as shown in Figure 3-37, are taken into
account.
0.0E+00
2.0E-03
4.0E-03
6.0E-03
8.0E-03
1.0E-02
1.2E-02
0 50 100 150
kn
n1
distance (mm)
0.5 h
knn,max=7.24E-3
0.0E+00
2.0E-03
4.0E-03
6.0E-03
8.0E-03
1.0E-02
1.2E-02
0 50 100 150
kn
n1
distance (mm)
h
knn,max=3.62E-3knn,max=3.62E-3
0.0E+00
1.0E-03
2.0E-03
3.0E-03
4.0E-03
5.0E-03
6.0E-03
7.0E-03
8.0E-03
9.0E-03
1.0E-02
0 50 100 150
kn
n1
distance (mm)
2h
knn,max=1.81E-3
0.00E+00
1.00E-03
2.00E-03
3.00E-03
4.00E-03
5.00E-03
6.00E-03
0 20 40 60 80 100 120 140 160
gF
p(N
/mm
2)
distance (mm)
0.00E+00
5.00E-04
1.00E-03
1.50E-03
2.00E-03
2.50E-03
3.00E-03
0 20 40 60 80 100 120 140 160
gF
p(N
/mm
2)
distance (mm)
0.00E+00
1.00E-03
2.00E-03
3.00E-03
4.00E-03
5.00E-03
6.00E-03
0 20 40 60 80 100 120 140 160
gF
p(N
/mm
2)
distance (mm)
0.5h
h 2h

Rijkswaterstaat Centre for Infrastructure
Validation of the Guidelines for Nonlinear Page 35 of 105
Finite Element Analysis of Concrete Structure Issued: 15 June 2017
Part: Reinforced beams Version: 1.0
RTD: 1016-3A: 2017 Status: Final
Figure 3-37: Case RB1. Example of integration points considered
The total dissipated fracture energy can be calculated with:
ii
u
i
ctuctuFp ffg s
2
1exp
The total dissipated fracture energy in the i-th integration point is illustrated in Figure
3-38, while the values of dissipated fracture energy in tension are calculated for
different values of crack bandwidth in Figure 3-36 (c).
Figure 3-38: Fracture energy dissipated in the i- th integration point
From Figure 3-36 (c) the a posteriori crack bandwidths can be evaluated as the length
characterized by maximum dissipated fracture energy of concrete in tension; this
means the length characterized by principal strains higher than the ultimate crack strain
in tension, knn,max.
Remarkably, Figure 3-36 shows that by comparing the a priori crack bandwidths with
the obtained a posteriori crack bandwidths, the results are quite close. None of the
crack
ii =1...9
s(N
/mm
2)
knn1 (-)
gFp
Rijkswaterstaat Centre for Infrastructure
Validation of the Guidelines for Nonlinear Page 36 of 105
Finite Element Analysis of Concrete Structure Issued: 15 June 2017
Part: Reinforced beams Version: 1.0
RTD: 1016-3A: 2017 Status: Final
three a priori crack bandwidths is clearly superior to the two remaining crack
bandwidths.
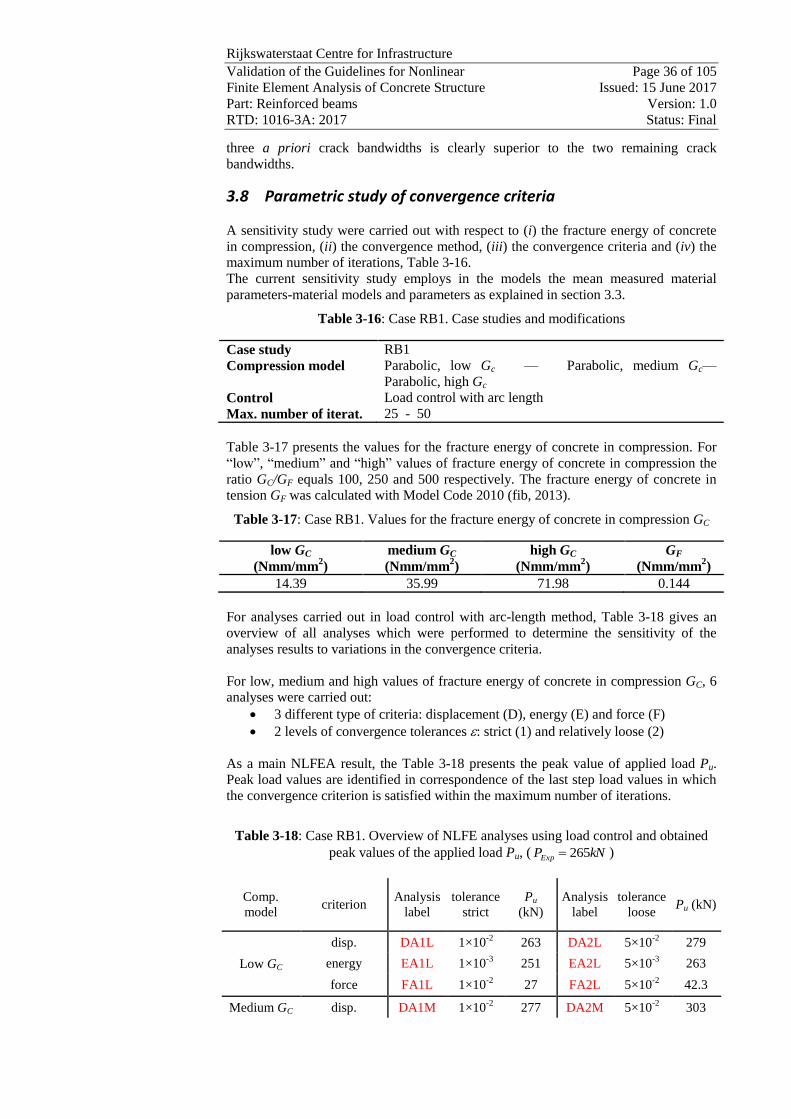
3.8 Parametric study of convergence criteria
A sensitivity study were carried out with respect to (i) the fracture energy of concrete
in compression, (ii) the convergence method, (iii) the convergence criteria and (iv) the
maximum number of iterations, Table 3-16.
The current sensitivity study employs in the models the mean measured material
parameters-material models and parameters as explained in section 3.3.
Table 3-16: Case RB1. Case studies and modifications
Case study RB1
Compression model Parabolic, low Gc — Parabolic, medium Gc—
Parabolic, high Gc
Control Load control with arc length
Max. number of iterat. 25 - 50
Table 3-17 presents the values for the fracture energy of concrete in compression. For
“low”, “medium” and “high” values of fracture energy of concrete in compression the
ratio GC/GF equals 100, 250 and 500 respectively. The fracture energy of concrete in
tension GF was calculated with Model Code 2010 (fib, 2013).
Table 3-17: Case RB1. Values for the fracture energy of concrete in compression GC
low GC
(Nmm/mm2)
medium GC
(Nmm/mm2)
high GC
(Nmm/mm2)
GF
(Nmm/mm2)
14.39 35.99 71.98 0.144
For analyses carried out in load control with arc-length method, Table 3-18 gives an
overview of all analyses which were performed to determine the sensitivity of the
analyses results to variations in the convergence criteria.
For low, medium and high values of fracture energy of concrete in compression GC, 6
analyses were carried out:
3 different type of criteria: displacement (D), energy (E) and force (F)
2 levels of convergence tolerances : strict (1) and relatively loose (2)
As a main NLFEA result, the Table 3-18 presents the peak value of applied load Pu.
Peak load values are identified in correspondence of the last step load values in which
the convergence criterion is satisfied within the maximum number of iterations.
Table 3-18: Case RB1. Overview of NLFE analyses using load control and obtained
peak values of the applied load Pu, ( kNPExp 265 )
Comp.
model criterion
Analysis
label
tolerance
strict
Pu
(kN)
Analysis
label
tolerance
loose Pu (kN)
Low GC
disp. DA1L 1×10⁻²
263 DA2L 5×10⁻²
279
energy EA1L 1×10⁻³
251 EA2L 5×10⁻³
263
force FA1L 1×10⁻²
27 FA2L 5×10⁻²
42.3
Medium GC disp. DA1M 1×10⁻²
277 DA2M 5×10⁻²
303
Rijkswaterstaat Centre for Infrastructure
Validation of the Guidelines for Nonlinear Page 37 of 105
Finite Element Analysis of Concrete Structure Issued: 15 June 2017
Part: Reinforced beams Version: 1.0
RTD: 1016-3A: 2017 Status: Final
energy EA1M 1×10⁻³
268 EA2M 5×10⁻³
276
energy (50 ite) EA1M50 1×10⁻³
267
force FA1M 1×10⁻²
27 FA2M 5×10⁻²
39.4
High GC
disp. DA1H 1×10⁻²
279 DA2H 5×10⁻²
320
energy EA1H 1×10⁻³
280 EA2H 5×10⁻³
294
force FA1H 1×10⁻²
268 FA2H 5×10⁻²
259
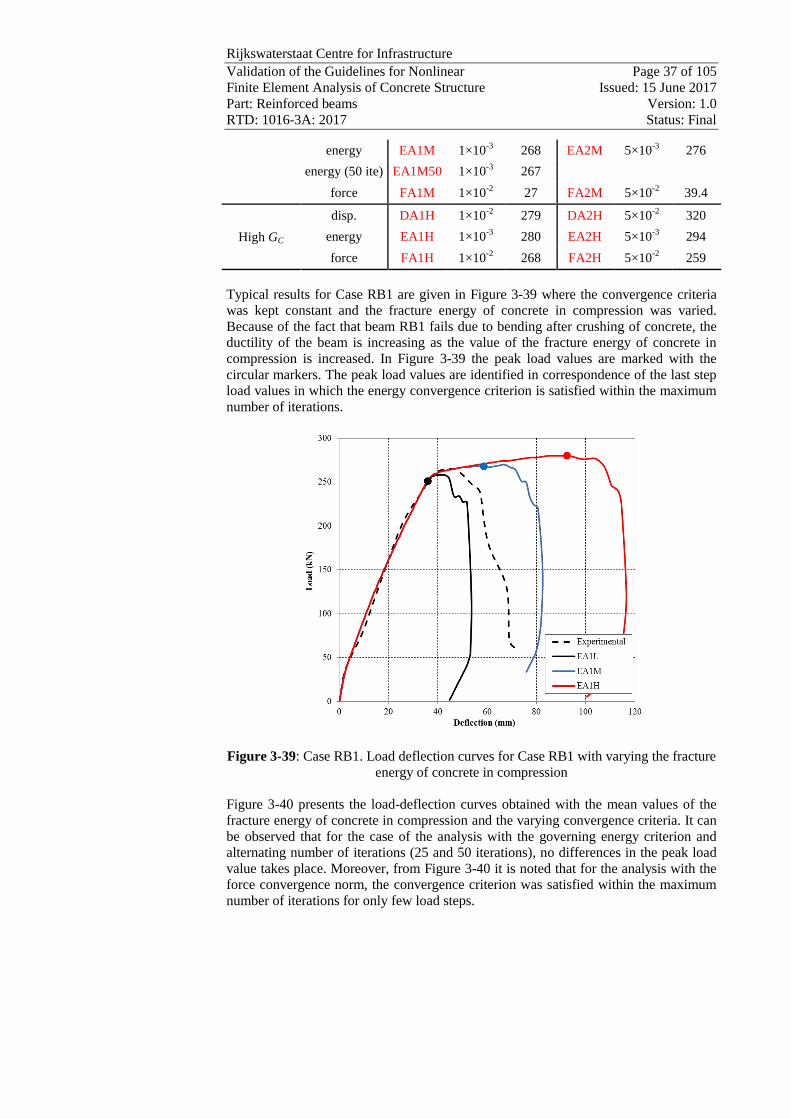
Typical results for Case RB1 are given in Figure 3-39 where the convergence criteria
was kept constant and the fracture energy of concrete in compression was varied.
Because of the fact that beam RB1 fails due to bending after crushing of concrete, the
ductility of the beam is increasing as the value of the fracture energy of concrete in
compression is increased. In Figure 3-39 the peak load values are marked with the
circular markers. The peak load values are identified in correspondence of the last step
load values in which the energy convergence criterion is satisfied within the maximum
number of iterations.
Figure 3-39: Case RB1. Load deflection curves for Case RB1 with varying the fracture
energy of concrete in compression
Figure 3-40 presents the load-deflection curves obtained with the mean values of the
fracture energy of concrete in compression and the varying convergence criteria. It can
be observed that for the case of the analysis with the governing energy criterion and
alternating number of iterations (25 and 50 iterations), no differences in the peak load
value takes place. Moreover, from Figure 3-40 it is noted that for the analysis with the
force convergence norm, the convergence criterion was satisfied within the maximum
number of iterations for only few load steps.

Rijkswaterstaat Centre for Infrastructure
Validation of the Guidelines for Nonlinear Page 38 of 105
Finite Element Analysis of Concrete Structure Issued: 15 June 2017
Part: Reinforced beams Version: 1.0
RTD: 1016-3A: 2017 Status: Final
Figure 3-40: Case RB1. Load-deflection curves with varying the convergence criteria
Based on the recorded results in Table 3-18, a number of conclusions can be drawn.
The “loose” displacement norm is inappropriate for the estimation of load carrying
capacity for the case under consideration. All analyses with the displacement criterion
and the convergence tolerance of 510-2
resulted in the overestimated peak value when
compared to the experimental failure load.
Good and consistent results were obtained by the “strict” energy norm. Based on the
results of the analysis with an increased number of iterations per step as well as
interpretations of the convergence graphs, a “strict” energy tolerance of 10-3
is
recommended.
3.9 Estimating crack widths
In the current section, a way to estimate the crack width from the nonlinear finite
element analyses results is proposed. The crack width was estimated from NLFE
results in combination with the Model Code 2010 (fib, 2013).
The crack width is calculated at the Serviceability Limit State. The load at the
Serviceability Limit State (PSLS) was defined as:
7.1
uSLS
PP
where Pu is the peak value of applied load obtained from NLFEA. In this way the step
corresponding to the Serviceability Limit State is identified.
In the following, the procedure for the determination of the crack width in case of
development of bending and shear cracks is explained.
Bending cracks In order to better evaluate the crack width of beam RB1, an equivalent tie with the
same ratio of longitudinal reinforcement and the same effective area in tension as RB1
was modeled. Crack opening width values and crack spacing were evaluated both for
the equivalent tie and for beam RB1 in correspondence of the same load level, equal to
268kN/1.7=157 kN.
In Figure 3-41(a) the cross section of the tie compared with the cross section of RB1
and the mechanical model of the equivalent tie (b) is shown.

Rijkswaterstaat Centre for Infrastructure
Validation of the Guidelines for Nonlinear Page 39 of 105
Finite Element Analysis of Concrete Structure Issued: 15 June 2017
Part: Reinforced beams Version: 1.0
RTD: 1016-3A: 2017 Status: Final
(a)
(b)
Figure 3-41: Case RB1. (a) Cross section and of the equivalent tie (b) Mechanical
model of the tie
The characteristic crack width wk was calculated according to the Model Code 2010
(fib, 2013) as follows:
)(2 max cmsmrsk lw (3-1)
where:
maxs,l length over which slip between concrete and steel occurs,
sm average steel strain over the length ls,max,
cm average concrete strain over the length ls,max,
The relative mean strain in equation (3-1) follows from:
s
srscmsm
E
ss
(3-2)
Where:
ss the steel stress in a crack,
srs maximum the steel stress in a crack in the crack formation stage,
which for pure tension is efse
efs
ctmsr
f,
,
1
s
Where:
c
s
E
E ,
3
)();(5.2min,
xhdhh efc
, efcflc bhA ,, , efc
seffs
A
A
,
, and srs can be
easily calculated from sectional analysis for bending.
For the length ls,max the following expression applies:
s,ef
eq
bms
ctms,
ρ
φ
τ
fckl
4
1max (3-3)
1k
2211
2
22
2
11
nn
nneq
For a stabilized cracking stage and long term loading: ctmbms f 8.1 , 4.0

Rijkswaterstaat Centre for Infrastructure
Validation of the Guidelines for Nonlinear Page 40 of 105
Finite Element Analysis of Concrete Structure Issued: 15 June 2017
Part: Reinforced beams Version: 1.0
RTD: 1016-3A: 2017 Status: Final
Because of beam RB1 fails due to bending, the crack opening width values obtained
from NLFE analyses were calculated from the average value of strain of reinforcing
steel M30, s , over the length max2 s,l at midspan. The average value of strain of
reinforcing steel M30 obtained from the NLFEA was multiplied by the crack spacing
max2 s,l obtained through Model Code 2010 (fib, 2013) formulation, equation.(3-3).
ssd lw max, (3-4)
In Figure 3-42 the crack strain values of RB1 beam at the SLS (step 43, kNP 157 )
are shown.
Figure 3-42: Case RB1. Crack strain values at step 43 ( kNP 157 )
In Table 3-19 the crack spacing obtained from equation (3-3) and the crack width
obtained from Model Code 2010 (fib, 2013) (equation (3-1)) and equation (3-4) are
summarized.It can be noted that the crack opening width values mainly due to bending
are well predicted with equation. (3-4) and on the safe side.
Table 3-19: Case RB1. Crack width according to Model Code 2010 (fib, 2013)
formulation and equation (3-4))
2ls,max
(mm)
wd
(mm)
wd
(mm)
236 0.297 0.318
3.10 Concluding remarks
The benchmark beam RB1 tested in the experimental program of Vecchio & Shim
(2004) exhibited a flexural-compressive failure mode at a load equal to kNP 265 .
The analytical calculation based on sectional analysis demonstrated that beam RB1
fails due to bending. The shear force corresponding to the design value of moment
resistance is lower than the design value of shear resistance. The design beam
resistance evaluated with sectional analysis equals to kNPRd 176 .
The behavior of the beam is highly influenced by crushing of concrete beneath and
adjacent to the loading plates. The disturbances around the loading plates introduce
complex three-dimensional effects, making the modelling of interface elements placed
between loading or supporting steel plates and the RC beam a fundamental aspect to be
considered.
A flexural-compressive failure mode was achieved from NLFEA carried out with mean
measured value of material strengths. The peak value of applied load obtained from
0
0.5
1
1.5
2
2.5
3
3.5
0.0E+0 1.0E-3 2.0E-3 3.0E-3 4.0E-3
s(N
/mm
2)
(-)
Rijkswaterstaat Centre for Infrastructure
Validation of the Guidelines for Nonlinear Page 41 of 105
Finite Element Analysis of Concrete Structure Issued: 15 June 2017
Part: Reinforced beams Version: 1.0
RTD: 1016-3A: 2017 Status: Final
NLFEA is equal to 268 kN and the failure mode is characterized by crushing of
concrete, yielding of M10 top bars, yielding of M30 and M25 bottom bars and yielding
of stirrups.
Safety formats for non-linear finite element analyses as proposed by the Model Code
2010 (fib, 2013), were used to derive the design value of beam resistance.
The design value of beam resistance obtained from application of safety formats is
higher than the design value of beam resistance obtained from analytical methods
based on the sectional analysis. The maximum value was obtained with ECOV method
and equals to kNPRd 203 .
Since the beam fails in bending, the failure mode is not heavily dependent on the crack
model and tensile strengths adopted for concrete in tension, whereas the post-peak
behavior appears to be sensitive to the stress-strain relation adopted for concrete in
compression.
The first sensitivity study investigated the influence of the varying crack bandwidth
(0.5h, h, 2h). A priori crack bandwidths (based on integration schemes) were compared
with a posteriori crack bandwidths derived on the calculation of the dissipated fracture
energy of concrete in tension. It was concluded that none of the three a priori crack
bandwidths is clearly superior to the two remaining crack bandwidths
The second sensitivity study was carried out by varying the compression model for
concrete, the convergence method, the convergence criteria and the maximum number
of iterations. From the results, it was concluded that good and consistent results are
obtained with the “strict” force and the “strict” energy convergence norms. Moreover,
based on the above conclusions an energy norm with a tolerance of 10-3
is
recommended.
Finally, the method to estimate the crack width from the results of nonlinear finite
element analyses is proposed to satisfy performance requirements of serviceability
limit states (SLS). It was shown that for beam RB1 the crack width values, mainly due
to bending, can be evaluated with good accuracy by multiplying the average value of
strain of reinforcing steel by the crack spacing ls,max calculated with expressions of the
MC2010.

Rijkswaterstaat Centre for Infrastructure
Validation of the Guidelines for Nonlinear Page 42 of 105
Finite Element Analysis of Concrete Structure Issued: 15 June 2017
Part: Reinforced beams Version: 1.0
RTD: 1016-3A: 2017 Status: Final
4 Case RB2: Collins and Kuchma (1999)
Case RB2 considers beam SE-50A-45 of the experimental program of Collins and
Kuchma (Collins & Kuchma, 1999) and was reported in CEB bulletin 237 (CEB-FIB,
1997). In an international workshop on shear force held in Rotterdam, the Netherlands
in 2007 this beam was used as a benchmark. It was then named “beam 8”. The outline
of the case is shown in Figure 4-1. The selection of the beam was made based on the
failure mechanism which the beam had undergone. The failure was characterized as the
diagonal-tension shear failure.
Figure 4-1: Case RB2. Dimensions (in mm), reinforcements and loading
4.1 Experimental setup and results
Geometry The geometry of the beam and reinforcement is shown in Figure 4-2 and Figure 4-3.
The beam has the total length of 5.0 m, depth of 0.5 m and width of 0.169 m.
Figure 4-2: Case RB2. Dimensions (in mm), reinforcements layout and loading
The dimensions of the loading and support plates are not fully specified; it is assumed
that the dimensions are 76×169×25 mm3. Four #15 bars are placed as tensile and
compressive reinforcement along the entire length of the beam. Additional four #15
bars are placed as tensile reinforcement over a length of 1 m in the region characterized
by the maximum value of the applied bending moment. The sections corresponding to
these regions are Section B-B and Section C-C in Figure 4-2.
50
0
1000
1000
Load: PLoad: 2P
200 1150 2300 1150 200
50
0
1000
1000
Load: P Load: 2P
200 1150 2300 1150 200
B
B
A
A
C
C

Rijkswaterstaat Centre for Infrastructure
Validation of the Guidelines for Nonlinear Page 43 of 105
Finite Element Analysis of Concrete Structure Issued: 15 June 2017
Part: Reinforced beams Version: 1.0
RTD: 1016-3A: 2017 Status: Final
Figure 4-3: Case RB2. Cross section details (dimensions in mm)
Material Properties The concrete and reinforcement properties, given in Collins & Kuchma (1999), are
listed in Table 4-1.
Table 4-1: Case RB2. Concrete and reinforcement properties
Concrete properties
fcm
(N/mm2)
dmax
(mm)
53 10
Reinforcement properties
(mm)
As
(mm2)
Es
(N/mm2)
fym
(N/mm2)
ftm
(N/mm2)
16.0 200 200000 400 600
Loading and Boundary Conditions The loading and boundary conditions in the experimental setup are shown in Figure 4-4
and Figure 4-2. The beam is loaded by two concentrated loads: one load equal to P at
the top left, and one load equal to 2P at the middle right loading point, Figure 4-2.
Figure 4-4: Case RB2. Experimental setup
45
9169
33 49
50
0
Section A-A Section B-B Section C-C

Rijkswaterstaat Centre for Infrastructure
Validation of the Guidelines for Nonlinear Page 44 of 105
Finite Element Analysis of Concrete Structure Issued: 15 June 2017
Part: Reinforced beams Version: 1.0
RTD: 1016-3A: 2017 Status: Final
Experimental Results
Figure 4-5: Case RB2. Failure mechanisms
The beam exhibited a typical brittle diagonal-tension failure mode, shown in Figure
4-5. The load-deflection curve is not given in the references; the experimental ultimate
value of the applied load was equal to kNPExp 69 . In the second series of test on the
same beam after strengthening failed at the applied load equal to kNPExp 81 .
4.2 Analytical analysis
In Figure 4-6 the load configuration at failure is shown. The distributed load
representing the beam weight is equal to kN/m.m
kNm.m.q 113225501690
3 .
Figure 4-6: Case RB2. Load configuration (dimensions in m)
Load case 1
Figure 4-7 shows the value of applied moment and shear force due to load case 1.
Load 1: q = 2.113 kN/m
A B
2,30 0,20
Load 2: P Load 2: 2P
0,20 1,15 1,15

Rijkswaterstaat Centre for Infrastructure
Validation of the Guidelines for Nonlinear Page 45 of 105
Finite Element Analysis of Concrete Structure Issued: 15 June 2017
Part: Reinforced beams Version: 1.0
RTD: 1016-3A: 2017 Status: Final
Figure 4-7: Case RB2. Load 1: Internal forces (dimensions in m)
Load case 2
The experimental ultimate value of the applied load is equal to kNPExp 691, . Figure
4-8 shows the maximum value of applied moment and shear force for load case 2.
Figure 4-8: Case RB2. Load 2: Internal forces (dimensions in m)
Load 1 + Load 2 At failure the maximum value of the applied moment is
kNmkNmkNmM AE 28.8135.79925.1min,,
and the maximum value of applied shear force is equal to:
kNkNkNVEd 2.73692.4max,
Load 1: q = 2.113 kN/m
-2.852 kN
4.202 kN
-3.08 kN
0.4225 kN
-1.925 kNm
2.152 kNm
-0.0423 kNm
A B
1,35 3,45 0,20
-69 kN
Load 2: P Load 2: 2P
-79.35 kNm
79.35 kNm
69 kN
A B
2,30 0,200,20 1,15 1,15

Rijkswaterstaat Centre for Infrastructure
Validation of the Guidelines for Nonlinear Page 46 of 105
Finite Element Analysis of Concrete Structure Issued: 15 June 2017
Part: Reinforced beams Version: 1.0
RTD: 1016-3A: 2017 Status: Final
The design value of moment resistance is evaluated with sectional analysis by
assuming:
the tensile strength of concrete is ignored,
the compressive stresses in concrete are derived from parabola-rectangle
relation,
the stresses in reinforcing steel are derived from elastic-plastic stress-strain
relation with hardening,
the partial safety factor for the mechanical properties of reinforcing steel
equals s=1.15, the factor for concrete material properties equals c=1.5.
Figure 4-9: Case RB2. Stress block for determination of the design moment resistance
From the calculations with initially assumed yielding in both top and bottom
reinforcement, it was concluded that the aforementioned assumption is not fulfilled for
the compressive reinforcement. Consequently, the below presented computation of the
moment resistance already includes the adjustment for the magnitude of the force
below the yielding threshold.
The provided reinforcement yields when strains reach the value: 310741 .E
fε
s
yd
s
For the horizontal force equilibrium:
mmxxbf.Eεx
axAfA cdscusyds 740809502
221
Verification of the assumption for the calculated value of x:
yieldssteel.mm
mm)mm(.
x
x)(dεε cu
s
018074
7445900350121
yieldnotdoessteel.mm
mm)mm(.
x
)a(xεε cu
s
3222 105611
74
417400350
thus the assumptions are fulfilled.
The design value of the moment resistance in calculated around the centre of the
compression zone x.4160 :
kNm.)ax.(EεAx).(dfAM sssydsRd 7623541604160 22211
A value of applied moment equal to
kNm .m.Pm).(
qM E,A, 762351512
351 2
min
Which results in the applied load:
kN.m).(
qkNm.m.
PRd 3352032
35176235
151
12
.
Rijkswaterstaat Centre for Infrastructure
Validation of the Guidelines for Nonlinear Page 47 of 105
Finite Element Analysis of Concrete Structure Issued: 15 June 2017
Part: Reinforced beams Version: 1.0
RTD: 1016-3A: 2017 Status: Final
The design value of shear resistance can be evaluated for an element without shear
reinforcement with Eurocode 2 (CEN, 2005) as follows:
kN.
MPa...
.mmmmfρkCdbV ckRcdWRdc
0354
450095010066151
180169459100 3
13
1
The design value of shear resistance can be evaluated for an element without shear
reinforcement with two levels of approximation as proposed in Model Code 2010 (fib,
2013).
Level I Approximation
The design shear resistance of members without shear reinforcement is given by:
kN.mmmm..
.zbγ
fkV w
c
ck
vRdc 0637169141351
451190
Where:
119014132511000
180
2511000
180.
mm..z.kv
Level II Approximation
The state of strain required for the analysis is considered at the critical section located d
from the edge of the support. In order to obtain a value of x corresponding to the
design shear resistance, an iterative procedure must be applied. After a number of
iterations, the procedure results in:
NV i
Ed 610191
NmmmmNdVM i
Ed
i
Ed 4216448345911506101911
00050610191413
42164483
800102002
1
2
1223
11
1 .Nmm.
Nmm
mmN/mmV
z
M
AEε i
Ed
i
Ed
ss
i
x
75023111016
32
16
32..
dk
g
dg
1950141323111000
1300
0005015001
40
1000
1300
15001
401
.mm...
.
zkε
.k
dgi
x
i
v
kN.Nmmmm..
.zbγ
fkV w
c
cki
v
i
Rd 996060998169441351
451950
Concluding from the results of sectional analysis, it can be shown that the governing
failure mode is caused by shear.
In Table 4-2 the design value of beam resistances expressed in terms of applied load
PRd obtained with the Eurocode 2 (CEN, 2005) and the Model Code 2010 (fib, 2013)
are summarized. These values are obtained by subtracting from the design shear
resistance the shear force due to self-weight equal to 1.9 kN.
Table 4-2: Case RB2. Design value of beam resistance expressed in terms of applied
load PRd
PRd (EC2) PRd (MC2010 - Level I) PRd (MC2010 - Level II)
(kN) (kN) (kN)
52 35.2 59

Rijkswaterstaat Centre for Infrastructure
Validation of the Guidelines for Nonlinear Page 48 of 105
Finite Element Analysis of Concrete Structure Issued: 15 June 2017
Part: Reinforced beams Version: 1.0
RTD: 1016-3A: 2017 Status: Final
4.3 Finite element model
Units Units are N, m.
Material models and parameters The concrete model is based on a total strain rotating crack model with
exponential softening in tension and parabolic behavior in compression,
variable Poisson’s ratio of concrete dependent on crack strain values,
reduction of compressive strength of concrete due to lateral cracking with a
lower limit 0.6 according to (Vecchio, 1986),
increase in compressive strength due to lateral confinement according to the
model proposed by Selby and Vecchio (Selby and Vecchio, 1993).
The mechanical properties for concrete are summarized in Table 4-4. The uniaxial
stress-strain curve is shown in Figure 4-10. In the input file of the analysis, the GF
value has been decreased with a factor 2 in order to compensate for an
underestimation of the crack band width for cracks with an inclination angle of 45
degrees 105.02/149.0, reducedFG .
Table 4-3: Case RB2. Constitutive model parameters for concrete
fcm
(N/mm2)
fctm
(N/mm2)
Ec
(N/mm2)
ν GF
(Nmm/mm2)
GC
(Nmm/mm2)
Mean
measured
values
53.0 3.80* 37485
* 0.2 0.149
* 37.29
*
* Not specified in reference; estimated according to MC2010 (fib, 2013).
The model for the reinforcement bars is based on hardening plasticity. Geometrical and
mechanical features of reinforcing bars are summarized in Table 4-4. The stress- strain
curve for steel of the reinforcing bars is plotted in Figure 4-11.
Figure 4-10: Case RB2. Stress-strain curve for concrete

Rijkswaterstaat Centre for Infrastructure
Validation of the Guidelines for Nonlinear Page 49 of 105
Finite Element Analysis of Concrete Structure Issued: 15 June 2017
Part: Reinforced beams Version: 1.0
RTD: 1016-3A: 2017 Status: Final
Figure 4-11: Case RB2. Stress-strain curve adopted for steel of reinforcing bars
For the steel plates a linear elastic behavior is assumed, see Table 4-4.
Table 4-4: Case RB2. Steel plates properties
E
(N/mm2)
200000 0.3
Interface elements were used between the steel plates and the concrete beam at the
supports and loading positions. The thickness of interface elements equals 10 mm.
Stress-strain relation in compression was derived by assuming a stiffness equivalent to
the stiffness of a layer of mortar 1 mm thick having a Young modulus derived from the
mean measured compressive strength of concrete, Table 4-3. A bilinear behavior is
assumed in the normal direction (see Figure 4-12) and a linear elastic relation is
assumed in the shear direction. The normal stiffness in tension and the stiffness in
shear direction were assumed almost equal to zero. For stableness of the analysis,
horizontal displacements of one pair of nodes across the interface elements of support
plates and loading plate were tied. The mechanical properties of the interface elements
are summarized in Table 4-5.
Table 4-5: Case RB2. Interface properties
Knn in tension
(N/mm3)
Knn in compression
(N/mm3)
Kt
(N/mm3)
3.63×10⁻⁸
3.63×10+4
3.63×10⁻⁸

Rijkswaterstaat Centre for Infrastructure
Validation of the Guidelines for Nonlinear Page 50 of 105
Finite Element Analysis of Concrete Structure Issued: 15 June 2017
Part: Reinforced beams Version: 1.0
RTD: 1016-3A: 2017 Status: Final
Figure 4-12: Case RB2. Traction-displacement diagram in normal direction for
interfaces
Element types and finite element mesh For the concrete 8-node membrane elements (CQ16M) are used for meshing the beam
with a full Gauss integration scheme (3×3). The average element size is 25×30 mm2.
The reinforcement bars are modelled with embedded truss elements with two Gauss
integration points along the axis of the element. Perfect bond is assumed.
For the steel plates 8-node membrane elements (CQ16M) with a full Gauss integration
scheme (3×3) are used.
The 6-node interfaces elements have three Lobatto integration points.
The adopted dimensions for the beam and for the transversal cross section of the beam
are given in Figure 4-14 and Figure 4-3, respectively.
Figure 4-13: Case RB2. Dimensions adopted for the beam (in mm)
Load: P Load: 2P
200 1150 2300 1150 200
500
1000
1000
76
25 1
0
Steel plate
Interface
Detail of support plate modelling Detail of loading plate modelling
Steel plate
Interface
76
10 2
5

Rijkswaterstaat Centre for Infrastructure
Validation of the Guidelines for Nonlinear Page 51 of 105
Finite Element Analysis of Concrete Structure Issued: 15 June 2017
Part: Reinforced beams Version: 1.0
RTD: 1016-3A: 2017 Status: Final
The mesh of the beam is presented in Figure 4-14(a). The different materials are
indicated with different colors in Figure 4-14(b).
(a)
(b)
Figure 4-14: Case RB2. (a) Mesh and (b) material sets
Different groups of elements were defined to distinguish the concrete elements that can
be subjected to cracking during the analysis and the steel elements that can yield during
the analysis, Figure 4-15. These groups will be used in section 4.4 to monitor the
failure mode during the analysis.
Figure 4-15: Case RB2. Groups of steel elements monitoring yielding
The internal stresses diagram, illustrated inFigure 4-8, shows that the entire beam is
subjected to the maximum value of shear force, for this reason a group of concrete
elements called SHEAR is used to monitor all the concrete elements of the beam which
can be subjected to cracking, Figure 4-16.
Figure 4-16: Case RB2. Groups of steel elements monitoring shear cracks
Boundary conditions and loading The translations along x and y axes at a single node of the left steel plate (support 1)
are constrained and the translation along y axis at a single node of the right steel plate
(support 2) is constrained, Figure 4-17.
Dead load is applied in load case 1; load P and load 2P as a unit load of 1 × 10³ N are
added at load case 2 as concentrated loads applied at the middle node of the loading
plates.
X
Y
Z
Model: NL
23 NOV 2009 11:47:52 meshmatiDIANA 9.3-01 : TU Delft
REAAUP
REAAD
REBBUP
RECCD
SHEAR
P2P

Rijkswaterstaat Centre for Infrastructure
Validation of the Guidelines for Nonlinear Page 52 of 105
Finite Element Analysis of Concrete Structure Issued: 15 June 2017
Part: Reinforced beams Version: 1.0
RTD: 1016-3A: 2017 Status: Final
Figure 4-17: Case RB2. Boundary conditions and load case 2
Load increments and convergence criteria Load case 1 is applied in a single step. The regular Newton-Raphson method with a
maximum of 25 iterations is used. As convergence criteria, the norms of force and
energy are selected. The analysis continues even if the convergence criteria are not
satisfied. The convergence tolerance is equal to 5×10⁻²
for the case of force norm and
1×10⁻²
for the energy norm. A Line Search algorithm is used to improve the
convergence performance.
Figure 4-18: Case RB2. `Indirect Displacement control' technique applied referring to
nodes 21 and 11700
Load case 2 is applied with automatic adaptive load increments based on energy. The
initial load factor equals 5. The upper limit of the incremental load factor was set as 10
while the lower limit of the incremental load factor is equal to 0.5. The maximum
number of steps is 150. The arc-length control was applied based on translation along y
axis of nodes 21 and 11700 (“indirect displacement control”), Figure 4-18. The
analysis continues even if the convergence criteria are not satisfied. The convergence
tolerances are equal to 1×10⁻³
and 1×10⁻²
for energy and force, respectively. A
maximum of 50 iterations is used. A Line Search algorithm is used to improve the
convergence performance.
4.4 Nonlinear finite element analysis
Load deflection The load-deflection curve is presented in Figure 4-19. The value of the peak load (step
74) is indicated with a marker. The deflection was measured for node 11700, Figure
4-18. From the outcome of the analysis, it is concluded that the beam failed in diagonal
tension. This failure mechanism is typical for beams containing no shear
reinforcement, is abrupt and follows shortly after formation of the major critical crack.
After its formation, the crack propagates rapidly from the bottom to the top of the
beams and continues as a large horizontal crack to the end of the beam. Due to a
sudden and brittle nature of the shear failure, the beam displayed no ductility after the
peak value

Rijkswaterstaat Centre for Infrastructure
Validation of the Guidelines for Nonlinear Page 53 of 105
Finite Element Analysis of Concrete Structure Issued: 15 June 2017
Part: Reinforced beams Version: 1.0
RTD: 1016-3A: 2017 Status: Final
Figure 4-19: Case RB2. Load-deflection curves
Convergence behavior For most steps convergence is achieved on the basis of the energy criterion, Figure
4-20 and Figure 4-21. For load case 2, the fixed convergence tolerances of energy
norm is satisfied for the majority of the steps of the analysis preceding the peak
load.The peak load is defined as the highest load step for which the energy norm ratio
satisfies the fixed tolerance of 1×10⁻³
and it is marked Figure 4-20 and Figure 4-21
with a red dot. After step 74, for most of the steps, the analysis continues even if the
energy and force convergence criteria are not satisfied within the maximum number of
iterations equal to 50. The force norm ratio is higher than the fixed tolerance of 1×10⁻²
for most of the steps.
0
10
20
30
40
50
60
70
80
90
0 0.2 0.4 0.6 0.8 1 1.2 1.4
Load
(k
N)
Deflection (mm)
NLFEA
PEXP,2= 81 kN
PEXP,1= 69 kN

Rijkswaterstaat Centre for Infrastructure
Validation of the Guidelines for Nonlinear Page 54 of 105
Finite Element Analysis of Concrete Structure Issued: 15 June 2017
Part: Reinforced beams Version: 1.0
RTD: 1016-3A: 2017 Status: Final
Figure 4-20: Case RB2. Evolution of the energy norm (blue lines indicate steps, red
line indicates tolerance, green points indicate iterative results)
Figure 4-21: Case RB2. Evolution of the force norm (blue lines indicate steps, red line
indicates tolerance, green points indicate iterative results)
Strains

Rijkswaterstaat Centre for Infrastructure
Validation of the Guidelines for Nonlinear Page 55 of 105
Finite Element Analysis of Concrete Structure Issued: 15 June 2017
Part: Reinforced beams Version: 1.0
RTD: 1016-3A: 2017 Status: Final
Figure 4-22 shows the minimum principal strain values at the peak load (step 74, P =
74.5 kN). The minimum values of principal strain are higher than -3.5×10⁻³
because the
shear failure was not accompanied by crushing of concrete in any element.
Figure 4-22: Case RB2. Minimum principal strain values at step 74 (P=73.5 kN)
Due to the fact that flexural failure is not the governing mechanism, strain values of
reinforcing bars below 2.0×10⁻³
were noted, Figure 4-23.
Figure 4-23: Case RB2. Strain values of reinforcing bars at step 74 (P=73.5 kN)
Figure 4-24 shows the crack strain values at the peak load. The crack strain values,
reported in Figure 4-24, can be compared with the experimental crack pattern
illustrated in Figure 4-5.
The first crack strain value plotted in Figure 4-24, equal to 9.9×10⁻⁴
, corresponds to the
ultimate crack strain value calculated as ctm
Ft,u
fh
Gε
, while the third crack strain
value, equal to 4.56×10⁻³
, is the crack strain value corresponding to a stress value equal
to 1% of fctm. An intermediate crack strain value was added in the contour plot.
After the peak load the critical crack propagates rapidly and continues as a large
horizontal crack towards the end of the beam, Figure 4-25.
-60
-50
-40
-30
-20
-10
0
-4.00E-02 -2.00E-02 0.00E+00
(-
)
s (N/mm2)
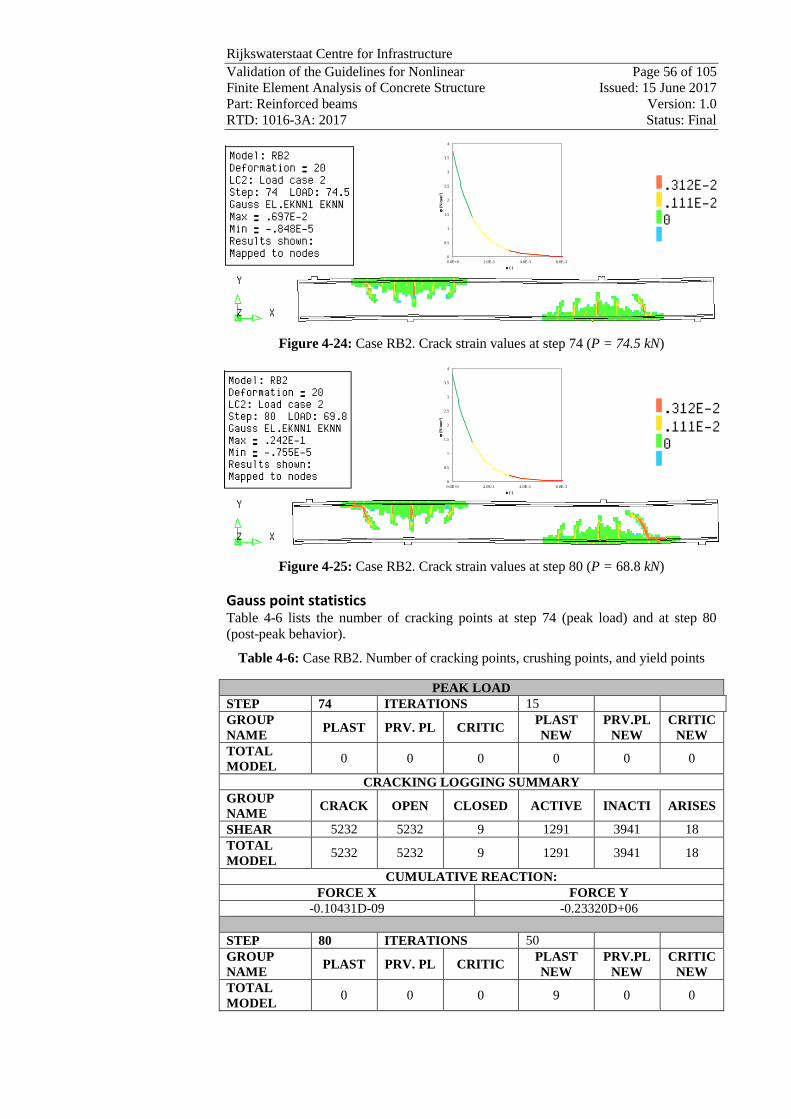
Rijkswaterstaat Centre for Infrastructure
Validation of the Guidelines for Nonlinear Page 56 of 105
Finite Element Analysis of Concrete Structure Issued: 15 June 2017
Part: Reinforced beams Version: 1.0
RTD: 1016-3A: 2017 Status: Final
Figure 4-24: Case RB2. Crack strain values at step 74 (P = 74.5 kN)
Figure 4-25: Case RB2. Crack strain values at step 80 (P = 68.8 kN)
Gauss point statistics Table 4-6 lists the number of cracking points at step 74 (peak load) and at step 80
(post-peak behavior).
Table 4-6: Case RB2. Number of cracking points, crushing points, and yield points
PEAK LOAD
STEP 74 ITERATIONS 15
GROUP
NAME PLAST PRV. PL CRITIC
PLAST
NEW
PRV.PL
NEW
CRITIC
NEW
TOTAL
MODEL 0 0 0 0 0 0
CRACKING LOGGING SUMMARY
GROUP
NAME CRACK OPEN CLOSED ACTIVE INACTI ARISES
SHEAR 5232 5232 9 1291 3941 18
TOTAL
MODEL 5232 5232 9 1291 3941 18
CUMULATIVE REACTION:
FORCE X FORCE Y
-0.10431D-09 -0.23320D+06
STEP 80 ITERATIONS 50
GROUP
NAME PLAST PRV. PL CRITIC
PLAST
NEW
PRV.PL
NEW
CRITIC
NEW
TOTAL
MODEL 0 0 0 9 0 0
0
0.5
1
1.5
2
2.5
3
3.5
4
0.0E+0 2.0E-3 4.0E-3 6.0E-3
s(N
/mm
2)
(-)
0
0.5
1
1.5
2
2.5
3
3.5
4
0.0E+0 2.0E-3 4.0E-3 6.0E-3
s(N
/mm
2)
(-)
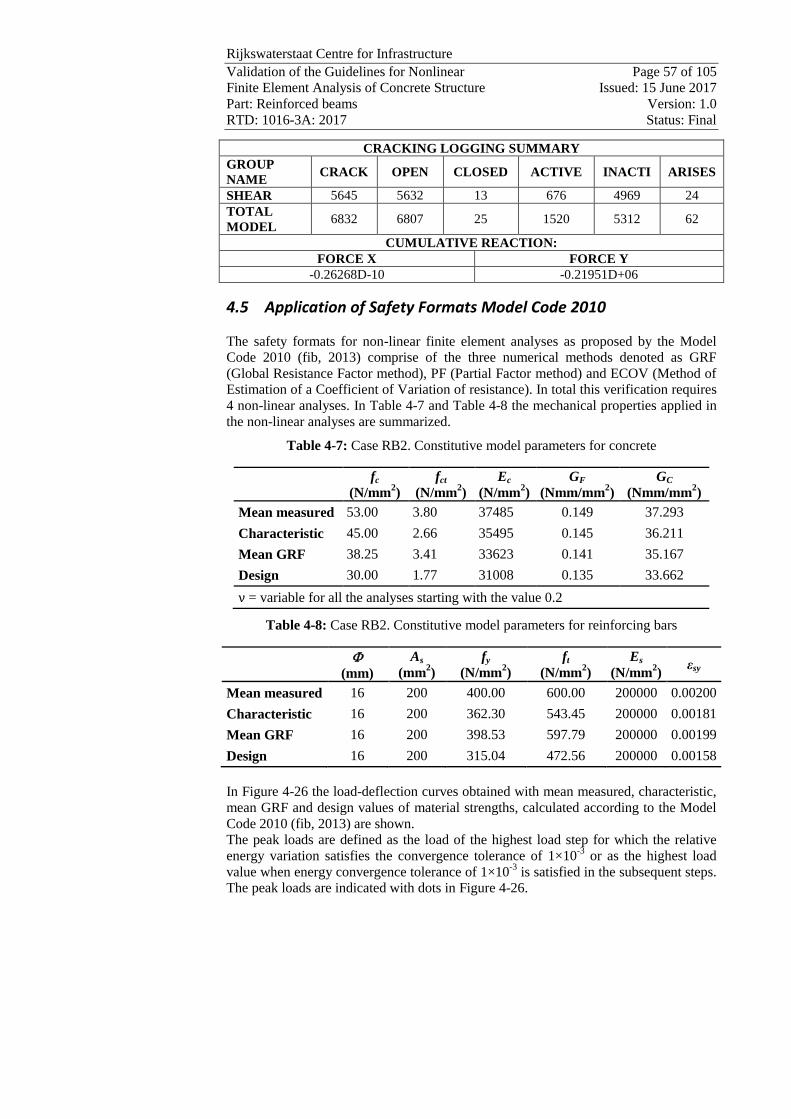
Rijkswaterstaat Centre for Infrastructure
Validation of the Guidelines for Nonlinear Page 57 of 105
Finite Element Analysis of Concrete Structure Issued: 15 June 2017
Part: Reinforced beams Version: 1.0
RTD: 1016-3A: 2017 Status: Final
CRACKING LOGGING SUMMARY
GROUP
NAME CRACK OPEN CLOSED ACTIVE INACTI ARISES
SHEAR 5645 5632 13 676 4969 24
TOTAL
MODEL 6832 6807 25 1520 5312 62
CUMULATIVE REACTION:
FORCE X FORCE Y
-0.26268D-10 -0.21951D+06
4.5 Application of Safety Formats Model Code 2010
The safety formats for non-linear finite element analyses as proposed by the Model
Code 2010 (fib, 2013) comprise of the three numerical methods denoted as GRF
(Global Resistance Factor method), PF (Partial Factor method) and ECOV (Method of
Estimation of a Coefficient of Variation of resistance). In total this verification requires
4 non-linear analyses. In Table 4-7 and Table 4-8 the mechanical properties applied in
the non-linear analyses are summarized.
Table 4-7: Case RB2. Constitutive model parameters for concrete
fc
(N/mm2)
fct
(N/mm2)
Ec
(N/mm2)
GF
(Nmm/mm2)
GC
(Nmm/mm2)
Mean measured 53.00 3.80 37485 0.149 37.293
Characteristic 45.00 2.66 35495 0.145 36.211
Mean GRF 38.25 3.41 33623 0.141 35.167
Design 30.00 1.77 31008 0.135 33.662
ν = variable for all the analyses starting with the value 0.2
Table 4-8: Case RB2. Constitutive model parameters for reinforcing bars
(mm)
As
(mm2)
fy
(N/mm2)
ft
(N/mm2)
Es
(N/mm2)
εsy
Mean measured 16 200 400.00 600.00 200000 0.00200
Characteristic 16 200 362.30 543.45 200000 0.00181
Mean GRF 16 200 398.53 597.79 200000 0.00199
Design 16 200 315.04 472.56 200000 0.00158
In Figure 4-26 the load-deflection curves obtained with mean measured, characteristic,
mean GRF and design values of material strengths, calculated according to the Model
Code 2010 (fib, 2013) are shown.
The peak loads are defined as the load of the highest load step for which the relative
energy variation satisfies the convergence tolerance of 1×10⁻³
or as the highest load
value when energy convergence tolerance of 1×10⁻³
is satisfied in the subsequent steps.
The peak loads are indicated with dots in Figure 4-26.
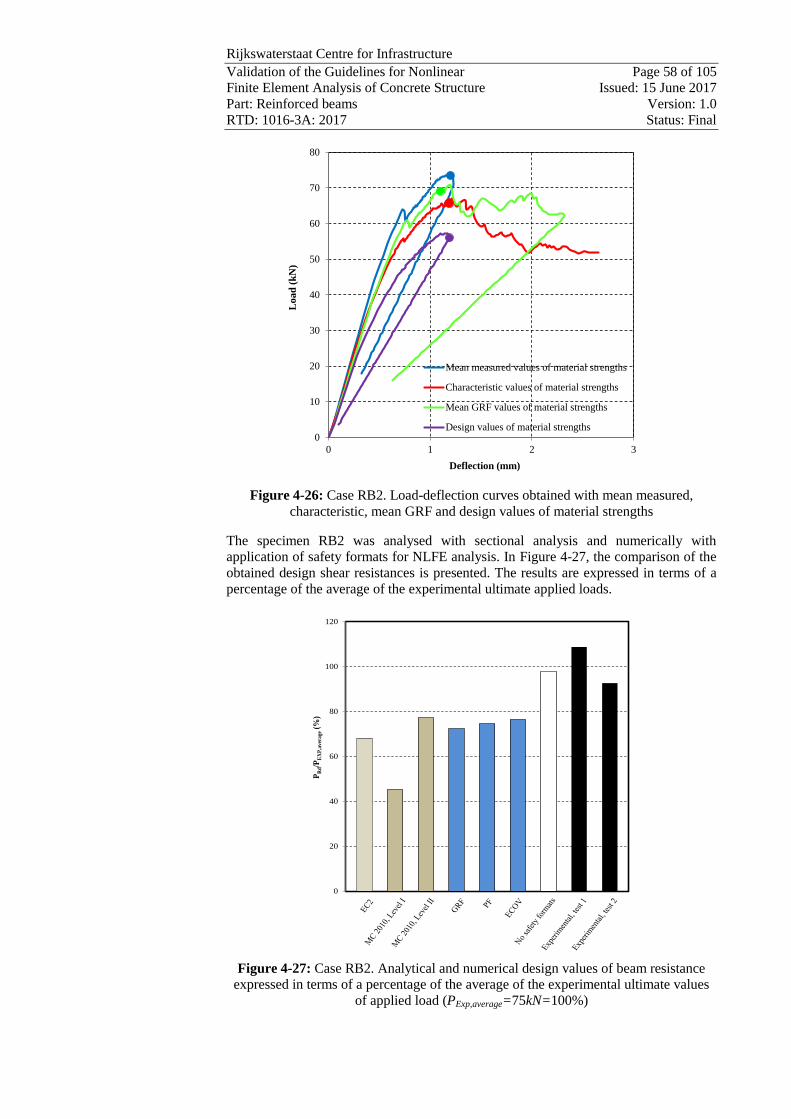
Rijkswaterstaat Centre for Infrastructure
Validation of the Guidelines for Nonlinear Page 58 of 105
Finite Element Analysis of Concrete Structure Issued: 15 June 2017
Part: Reinforced beams Version: 1.0
RTD: 1016-3A: 2017 Status: Final
Figure 4-26: Case RB2. Load-deflection curves obtained with mean measured,
characteristic, mean GRF and design values of material strengths
The specimen RB2 was analysed with sectional analysis and numerically with
application of safety formats for NLFE analysis. In Figure 4-27, the comparison of the
obtained design shear resistances is presented. The results are expressed in terms of a
percentage of the average of the experimental ultimate applied loads.
Figure 4-27: Case RB2. Analytical and numerical design values of beam resistance
expressed in terms of a percentage of the average of the experimental ultimate values
of applied load (PExp,average=75kN=100%)
0
10
20
30
40
50
60
70
80
0 1 2 3
Loa
d (
kN
)
Deflection (mm)
Mean measured values of material strengths
Characteristic values of material strengths
Mean GRF values of material strengths
Design values of material strengths
0
20
40
60
80
100
120
PR
d/P
EX
P,a
ver
age
(%)

Rijkswaterstaat Centre for Infrastructure
Validation of the Guidelines for Nonlinear Page 59 of 105
Finite Element Analysis of Concrete Structure Issued: 15 June 2017
Part: Reinforced beams Version: 1.0
RTD: 1016-3A: 2017 Status: Final
In Table 4-9 the design values of beam resistances, expressed in terms of applied load
PRd, obtained from numerical and analytical methods are reported. The analytical beam
resistances were calculated with sectional analysis (see section 4.2) according to the
Eurocode 2 (CEN, 2005) and the Model Code 2010 (fib, 2013).
From the comparison of the results it can be observed that the design values of beam
resistance obtained with safety formats are higher than the values of shear resistance
from sectional analysis. The exception constitutes the value of shear resistance
calculated with the expressions of Level II Approximation. The reason for this
discrepancy could be the particular layout of the rebars. Indeed, in the calculation of
axial strain at mid-depth, as required by the procedure of Level II Approximation, the
strain disturbance due to the additional four bars ϕ15, placed as the tensile
reinforcement over the length of 1 m in the proximity of the section Sections B-B and
C-C, cannot be considered. The crack patter shown in Figure 4-25 illustrates that
NLFEA results are strongly dependent on the reinforcement layout. Consequently, it
can be recognized as the reason why results of the NLFE analyses provide lower
design values of the beam’s shear resistance.
Table 4-9: Case RB2. Shear resistances expressed in terms of applied load PRd
PExp,1 PExp,2 Level I
MC2010
Level II
MC2010 EC2 GRF PF ECOV
No Safety
Formats
(kN) (kN) (kN) (kN) (kN) (kN) (kN) (kN) (kN)
69 81 35.2 59 52 54 56 57 73
4.6 Parametric study on crack models
A parametric study was carried out by varying input parameters of the constitutive
model, such as the crack model and the fracture energy of concrete in tension.
In Table 4-10 the material parameters used as the input in NLFE analyses carried out
for the parametric study are tabularized. Analyses 1 to 3 refer to the three analyses
carried out by varying the aforementioned material parameters. All the analyses were
carried out considering mean measured values of material strengths. Parabolic law in
compression and exponential law in tension were used for concrete, while an elasto-
plastic law with hardening was adopted for steel. The analyses were carried out in load-
control with the arc-length control. A variable Poisson ratio, reduced relative to the
increasing crack strain, was adopted for all analyses.
For all analyses a limit value of the reduction of the compressive strength of concrete
due to lateral cracking, equal to 0.6, was used.
The effects of the input value of the fracture energy of concrete in tension on the beam
response was investigated by adopting the formulation of Model Code 1990 (CEB-FIP,
1993) and the formulation of Model Code 2010 (fib, 2013). The fracture energy of
concrete in compression was considered for all analyses equal to 250GF (Nakamura et
al. 2001).
For the Total Strain fixed crack model, the aggregate size based shear retention was
defined. According to this model, the shear stiffness of a crack diminishes together
with opening of the crack until the value of the normal crack strain reaches the size of
half the mean aggregate size. This implies loss of contact between crack planes. The
linear decay of shear stiffness further depends on the crack bandwidth value h. The
complete formulation is:
hεd
β n
aggr
21

Rijkswaterstaat Centre for Infrastructure
Validation of the Guidelines for Nonlinear Page 60 of 105
Finite Element Analysis of Concrete Structure Issued: 15 June 2017
Part: Reinforced beams Version: 1.0
RTD: 1016-3A: 2017 Status: Final
In Table 6-2 the load-deflection curves obtained from the parametric study are plotted
and the peak load of each analysis is indicated with a circular marker. The peak load is
defined as the highest load step for which the relative energy variation satisfies the
convergence tolerance of 1×10⁻³
. The peak load values are reported in Table 4-10.
Table 4-10: Case RB2. Data used for the parametric study
Analysis Total strain
crack model Limit to s GF GC
Peak load value
(kN)
Analysis 1 rotating 0.6 MC2010 250 GF 73
Analysis 2 rotating 0.6 MC1990 250 GF 57
Analysis 3 fixed 0.6 MC2010 250 GF 104
Figure 4-28: Case RB2 Load-deflection curves (Analysis 1 to 3)
The crack model and mechanical properties used in Analysis 1 were the same as those
used to predict the design value of beam resistance from NLFE analyses. As expected,
since the beam fails due to diagonal-tension, the results of NLFE analyses are
considerably dependent on the crack model and the value of the fracture energy of
concrete in tension.
4.7 Parametric study on crack bandwidth
This section reports on (i) the sensitivity of analyses results on h, or actually GF /h and
(ii) on post-analysis checks on the correctness of the a priori estimates for h.
Material models and parameters, element types and finite element mesh, boundary
conditions and loading, load increments and convergence criteria are the same as those
used for the analysis carried out with mean measured material strength (please refer to
paragraphs 4.3).
Table 4-11 lists the a priori estimates for the crack bandwidth that are used in this
study. Note that the compressive bandwidths hC are unaltered. For practical reasons the
variations of the crack bandwidths h were implemented in the finite element models as
0
20
40
60
80
100
120
0 0.5 1 1.5 2
Loa
d (
kN
)
Deflection (mm)
Analysis 1
Analysis 2
Analysis 3
PEXP,2= 81 kN
PEXP,1= 69 kN

Rijkswaterstaat Centre for Infrastructure
Validation of the Guidelines for Nonlinear Page 61 of 105
Finite Element Analysis of Concrete Structure Issued: 15 June 2017
Part: Reinforced beams Version: 1.0
RTD: 1016-3A: 2017 Status: Final
variations of GF. The exponential softening employed in the total strain crack models is
formulated as explained in Chapter 3 – Case RB1. In Table 4-11, the values of fracture
energy of concrete in tension used as the input data for the analyses and maximum
crack strain values used in the contour plot are depicted. The following Table 4-12
gives an overview of the obtained peak loads Pu.
Table 4-11: Case RB2. Estimates for the crack bandwidth h for quadratic plane stress
quadrilaterals with 3×3 Gaussian integration
Tension
(mm)
Compression
(mm)
GF
(Nmm/mm2)
GC
(Nmm/mm2)
knn,max
Short-width h = ½√A√2 = 13√2 hc = √A = 28 0.149 37.29 9.12×10⁻³
Default h = √A√2 = 26√2 hc = √A = 28 0.149 37.29 4.56×10⁻³
Long-width h = 2√A√2 = 80√2 hc = √A =28 0.149 37.29 2.28×10⁻³
Table 4-12: Case RB2. Case studies and modifications
PExp,1 (kN) PExp,2 (kN) Pu (kN)
0.5h h 2h
69 81 93 73 55
Figure 4-29: Case RB2. Load-deflection curves obtained with different crack
bandwidth values
Figure 4-29 shows the load-deflection curves for case RB2 obtained with different
crack bandwidth values. In contrast to Case RB1, the three peak values obtained from
load-deflection curves in Figure 3-34 are clearly different. The three peak values show
a comprehensible trend, with the “0.5h” peak load above the “h” peak load, and with
the “h” peak load above the “2h” peak load. Again, the differences in the post peak
ehavior are hard to explain, but might be related to the control procedure and the
convergence behavior.
0
10
20
30
40
50
60
70
80
90
100
0 0.5 1 1.5 2
Load
(k
N)
Deflection (mm)
h
0.5 h
2 h
PEXP,2= 81 kN
PEXP,1= 69 kN

Rijkswaterstaat Centre for Infrastructure
Validation of the Guidelines for Nonlinear Page 62 of 105
Finite Element Analysis of Concrete Structure Issued: 15 June 2017
Part: Reinforced beams Version: 1.0
RTD: 1016-3A: 2017 Status: Final
0.5 h
h
2h
Figure 4-30: Case RB2. Maximum principal strain values obtained with varying crack
bandwidth values
0
0.5
1
1.5
2
2.5
3
3.5
4
0.0E+0 2.0E-3 4.0E-3 6.0E-3 8.0E-3 1.0E-2
s(N
/mm
2)
(-)
0
0.5
1
1.5
2
2.5
3
3.5
4
0.0E+0 2.0E-3 4.0E-3 6.0E-3 8.0E-3 1.0E-2
s(N
/mm
2)
(-)
0
0.5
1
1.5
2
2.5
3
3.5
4
0.0E+0 2.0E-3 4.0E-3 6.0E-3 8.0E-3 1.0E-2
s(N
/mm
2)
(-)

Rijkswaterstaat Centre for Infrastructure
Validation of the Guidelines for Nonlinear Page 63 of 105
Finite Element Analysis of Concrete Structure Issued: 15 June 2017
Part: Reinforced beams Version: 1.0
RTD: 1016-3A: 2017 Status: Final
0.5h h 2h
(a)
(b)
(c)
Figure 4-31: Case RB2. (a) Maximum principal strains (b) Maximum principal strain-
distance between integration points along the lines indicated above. The ultimate strain
value (red dashed line) (c) Fracture energy over crack bandwidth-distance between
integration points
Figure 4-30 shows contour plots of the crack strain values some steps after the
corresponding peak values of the applied loads, obtained with different crack
bandwidth values. In the contour plots the color ranges are adjusted to the (tensile)
stress-strain relations: red denotes strains beyond the ultimate crack strain of the
softening stress-strain diagram. For a better assessment of the strain localization,
Figure 4-31 magnifies the regions in the proximity of the location of the critical cracks
depicted in Figure 4-30 to indicate the mesh and the a priori estimates for h. The dissipated fracture energy divided by the crack bandwidth (gF) is plotted against the
distance between the subsequent integration points along the line perpendicular to the crack
plane. In all graphs, 9 integration points are taken into account.
The values of dissipated fracture energy in tension are calculated for different values of
crack bandwidth in Figure 4-31(c). From Figure 4-31(c) the a posteriori crack
bandwidths can be evaluated as the length characterized by the maximum dissipated
fracture energy of concrete in tension, that means the length characterized by principal
strains higher than the ultimate crack strain in tension, knn,max.
0.0E+00
2.0E-03
4.0E-03
6.0E-03
8.0E-03
1.0E-02
1.2E-02
1.4E-02
1.6E-02
0 20 40 60 80 100
kn
n1
distance (mm)
0.5 h
knn,max=9.12E-3
0.0E+00
1.0E-03
2.0E-03
3.0E-03
4.0E-03
5.0E-03
6.0E-03
7.0E-03
8.0E-03
9.0E-03
0 20 40 60 80 100
kn
n1
distance (mm)
h
knn,max=4.56E-3
0.0E+00
1.0E-03
2.0E-03
3.0E-03
4.0E-03
5.0E-03
6.0E-03
0 20 40 60 80 100
kn
n1
distance (mm)
2h
knn,max=2.28E-3
0.00E+00
1.00E-03
2.00E-03
3.00E-03
4.00E-03
5.00E-03
6.00E-03
7.00E-03
8.00E-03
0 20 40 60 80 100
gF
p(N
/mm
2)
distance (mm)
0.5 h
0.00E+00
1.00E-03
2.00E-03
3.00E-03
4.00E-03
5.00E-03
6.00E-03
0 20 40 60 80 100
gF
p(N
/mm
2)
distance (mm)
h
0.00E+00
1.00E-03
2.00E-03
3.00E-03
4.00E-03
5.00E-03
6.00E-03
0 20 40 60 80 100 120 140 160
gF
p(N
/mm
2)
distance (mm)
2 h
0.5h
h
2h
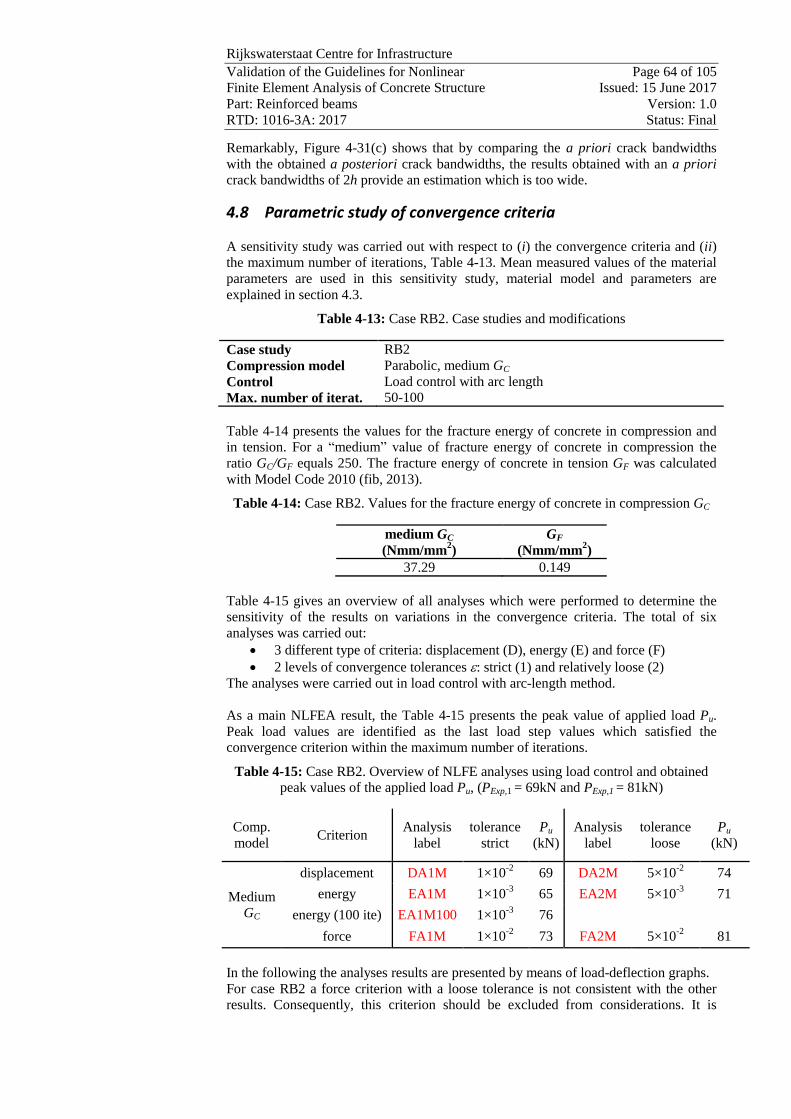
Rijkswaterstaat Centre for Infrastructure
Validation of the Guidelines for Nonlinear Page 64 of 105
Finite Element Analysis of Concrete Structure Issued: 15 June 2017
Part: Reinforced beams Version: 1.0
RTD: 1016-3A: 2017 Status: Final
Remarkably, Figure 4-31(c) shows that by comparing the a priori crack bandwidths
with the obtained a posteriori crack bandwidths, the results obtained with an a priori crack bandwidths of 2h provide an estimation which is too wide.
4.8 Parametric study of convergence criteria
A sensitivity study was carried out with respect to (i) the convergence criteria and (ii) the maximum number of iterations, Table 4-13. Mean measured values of the material
parameters are used in this sensitivity study, material model and parameters are
explained in section 4.3.
Table 4-13: Case RB2. Case studies and modifications
Case study RB2
Compression model Parabolic, medium GC
Control Load control with arc length
Max. number of iterat. 50-100
Table 4-14 presents the values for the fracture energy of concrete in compression and
in tension. For a “medium” value of fracture energy of concrete in compression the
ratio GC/GF equals 250. The fracture energy of concrete in tension GF was calculated
with Model Code 2010 (fib, 2013).
Table 4-14: Case RB2. Values for the fracture energy of concrete in compression GC
medium GC
(Nmm/mm2)
GF
(Nmm/mm2)
37.29 0.149
Table 4-15 gives an overview of all analyses which were performed to determine the
sensitivity of the results on variations in the convergence criteria. The total of six
analyses was carried out:
3 different type of criteria: displacement (D), energy (E) and force (F)
2 levels of convergence tolerances : strict (1) and relatively loose (2)
The analyses were carried out in load control with arc-length method.
As a main NLFEA result, the Table 4-15 presents the peak value of applied load Pu.
Peak load values are identified as the last load step values which satisfied the
convergence criterion within the maximum number of iterations.
Table 4-15: Case RB2. Overview of NLFE analyses using load control and obtained
peak values of the applied load Pu, (PExp,1 = 69kN and PExp,1 = 81kN)
Comp.
model Criterion
Analysis
label
tolerance
strict
Pu
(kN)
Analysis
label
tolerance
loose
Pu
(kN)
Medium
GC
displacement DA1M 1×10⁻²
69 DA2M 5×10⁻²
74
energy EA1M 1×10⁻³
65 EA2M 5×10⁻³
71
energy (100 ite) EA1M100 1×10⁻³
76
force FA1M 1×10⁻²
73 FA2M 5×10⁻²
81
In the following the analyses results are presented by means of load-deflection graphs.
For case RB2 a force criterion with a loose tolerance is not consistent with the other
results. Consequently, this criterion should be excluded from considerations. It is

Rijkswaterstaat Centre for Infrastructure
Validation of the Guidelines for Nonlinear Page 65 of 105
Finite Element Analysis of Concrete Structure Issued: 15 June 2017
Part: Reinforced beams Version: 1.0
RTD: 1016-3A: 2017 Status: Final
important to take into account that beam RB2 is a particular case because of its special
reinforcement layout and the associated failure mode.
Figure 4-32: Case RB2. Load deflection curves with varying the convergence criteria
4.9 Concluding remarks
Beam RB2, tested by Collins and Kuchma (Collins & Kuchma, 1999), simulates the
loading condition of continuous beams thus with regions influenced by high shear
force in combination with substantial bending moment. The beam does not contain
stirrups and fails due to shear in a brittle manner.
From the analytical calculations based on sectional analysis it was demonstrated that
shear failure is the governing mechanism. The value of shear force corresponding to
the design value of moment resistance is higher than the design value of resistance to
shear force. The design shear resistance evaluated with the Eurocode 2 (CEN, 2005) is
equal to PRd =51 kN, whereas the design shear resistances calculated with the Model
Code 2010 (fib, 2013) are PRd=34 kN and PRd=58 kN for levels of approximation I and
II respectively.
The beam was modeled with 8-node membrane elements for the concrete and
embedded truss elements for the reinforcement. Perfect bond was assumed. The
concrete model was based on a total strain rotating crack model with exponential
softening in tension and parabolic behavior in compression. Moreover, a variable
Poisson’s ratio of concrete and reduction of compressive strength of concrete due to
lateral cracking with a lower limit of 0.6 were adopted. The fracture energy of concrete
in tension, calculated according to the Model Code 2010 (fib, 2013), was reduced by a
factor equal to √2 to take into account the effect of crack orientation. The model for the
reinforcement bars was based on hardening plasticity.
The governing failure mechanism resulting from NLFEA is diagonal-tension shear.
This type of failure mode is typical for beams with no shear reinforcement, is abrupt,
and occurs shortly after the formation of a “critical diagonal-tension crack”.
Safety formats for non-linear finite element analyses as introduced by the Model Code
2010 (fib, 2013) were used in order to compute the design value of beam shear
0
10
20
30
40
50
60
70
80
90
0 0.5 1 1.5 2 2.5
Lo
ad
(k
N)
Deflection (mm)
DA1M
EA1M
EA1M100
FA1M
PEXP,2= 81 kN
PEXP,1= 69 kN

Rijkswaterstaat Centre for Infrastructure
Validation of the Guidelines for Nonlinear Page 66 of 105
Finite Element Analysis of Concrete Structure Issued: 15 June 2017
Part: Reinforced beams Version: 1.0
RTD: 1016-3A: 2017 Status: Final
resistance. The resulting resistances were expressed in terms of applied load and
compared with experimental values and the analytical solution. The maximum design
values of beam resistance obtained from safety formats equals to 57 kN. This value is
higher than the design value of beam resistance obtained from Eurocode 2 and Level I
of Approximation. The design shear resistance obtained with Level II Approximation
is slightly higher than the values obtained with safety formats.
Since the beam failed due to diagonal tension, failure mode and ultimate shear
resistance are heavily dependent on the crack model, concrete tensile strength and
tensile fracture energy. At the same time, it can be concluded that the reduction of
compressive strength of concrete due to lateral cracking and the Poisson’s ratio are not
very impactful on the results of NLFE analyses – both in terms of peak value of
applied load as well as the obtained failure mode.
In the current study, two sensitivity studies were conducted. In the first study the
varying parameter was the crack bandwidth. The values of the crack bandwidth ranged:
0.5h, h, 2h. From the resulting load-deflection curves it was deduced that the peak
values decrease as the crack bandwidth values increase. By comparing the a priori
crack bandwidths (based on integration schemes) with the obtained a posteriori crack
bandwidths, is possible to conclude that a crack bandwidth value equal to 2h is
excessive.
Another sensitivity study was carried out with respect to (i) the control procedure and
(ii) the maximum number of iterations. The performance of the model of RB2 with a
force convergence norm including a loose convergence tolerance is not consistent with
the other results therefore this criterion should be disregarded. It is important to take
into account that beam RB2 is a particular case due to its special reinforcement layout
and the way it fails.

Rijkswaterstaat Centre for Infrastructure
Validation of the Guidelines for Nonlinear Page 67 of 105
Finite Element Analysis of Concrete Structure Issued: 15 June 2017
Part: Reinforced beams Version: 1.0
RTD: 1016-3A: 2017 Status: Final
5 Case RB3: Grace (2001)
The experimental program of Grace (Grace, 2001) studied the effect of strengthening
using fiber-reinforced polymer strips. The control beam of the so-called category II
beams from this program is used as a case study.
5.1 Experimental setup and results
Geometry The geometry of the beam and reinforcement is shown Figure 5-1and Figure 5-2. The
beam has a total length of 8.230 m, a depth of 0.457 m, and a width of 0.250 m. The
dimensions of the loading and support plates are not given; it is assumed that the
dimensions are 0.22×0.10×0.25 m3.
Figure 5-1: Case RB3. Cross section details (dimensions in mm)
The beam is reinforced with three #8 bars (=25.4 mm) at the top and the bottom and
#3 (=9.525 mm) stirrups with a spacing of 152 mm. The concrete cover equals to 51
mm and the effective depth to main tension reinforcement equals to 406 mm.
Material Properties The concrete and reinforcement properties, given in (Grace, 2001), are listed in Table
5-1.
Table 5-1: Case RB3. Concrete and reinforcement properties
Concrete properties
fcm
(N/mm2)
dmax
(mm)
31.2 19.0
Reinforcement properties
Bar
(mm)
As
(mm2)
Es
(N/mm2)
fym
(N/mm2)
ftm
(N/mm2)
#3 9.525 71.25 200000 414 -
#8 25.4 506.70 200000 414 -

Rijkswaterstaat Centre for Infrastructure
Validation of the Guidelines for Nonlinear Page 68 of 105
Finite Element Analysis of Concrete Structure Issued: 15 June 2017
Part: Reinforced beams Version: 1.0
RTD: 1016-3A: 2017 Status: Final
Loading and Boundary Conditions The loading and boundary conditions in the experimental setup are show in Figure 5-2.
It is not clear from the reference how the end support was constructed. It is assumed
that the top and bottom of the beam is supported at the right-hand-side.
Figure 5-2: Case RB3. Loading and boundary conditions (dimensions in mm)
Experimental Results The beam exhibited a flexural failure mode, Figure 5-3. The experimental ultimate
value of applied load was equal to PExp = 141.9 kN.
Figure 5-3: Case RB3. Failure mechanisms at experimental ultimate value of applied
load (Grace 2001)
5.2 Analytical analysis
In Figure 5-4 the load configuration at failure is shown. The distributed load
representing the beam weight is equal to kN/m.mkNm.m.q 8562254570250 3 .
Figure 5-4: Case RB3. Load configuration (dimension in m)
Load case 1
Figure 5-5 shows that the maximum negative value of applied moment at the support A
is equal to:
kNm.m).(
kN/m.M E,A 74102
74328562
2
and the value of applied shear force at support A is equal to:
kNqm
mq
mV dxAE 794.9
487.5
1
2
)743.2(
2
487.52
,,
kNmmkNV sxAE 83.7743.2856.2,,

Rijkswaterstaat Centre for Infrastructure
Validation of the Guidelines for Nonlinear Page 69 of 105
Finite Element Analysis of Concrete Structure Issued: 15 June 2017
Part: Reinforced beams Version: 1.0
RTD: 1016-3A: 2017 Status: Final
The value of shear force at support B equals
kN.qm.
m).(q
m.VE,B 8775
4875
1
2
7432
2
48752
Figure 5-5: Case RB3. Load 1: Internal forces
Load case 2
The experimental ultimate value of applied load is equal to kNPExp 9.141 . Figure 5-6
shows that the minimum value of applied moment at the support A is equal to
kNm.m.kN.M E,A 525982919141 and the values of applied shear force at
supports A and B are equal to kN.VE,A,sx 9141 and kN.VE,B 347 , respectively.
Figure 5-6: Case RB3. Load 2: Internal forces
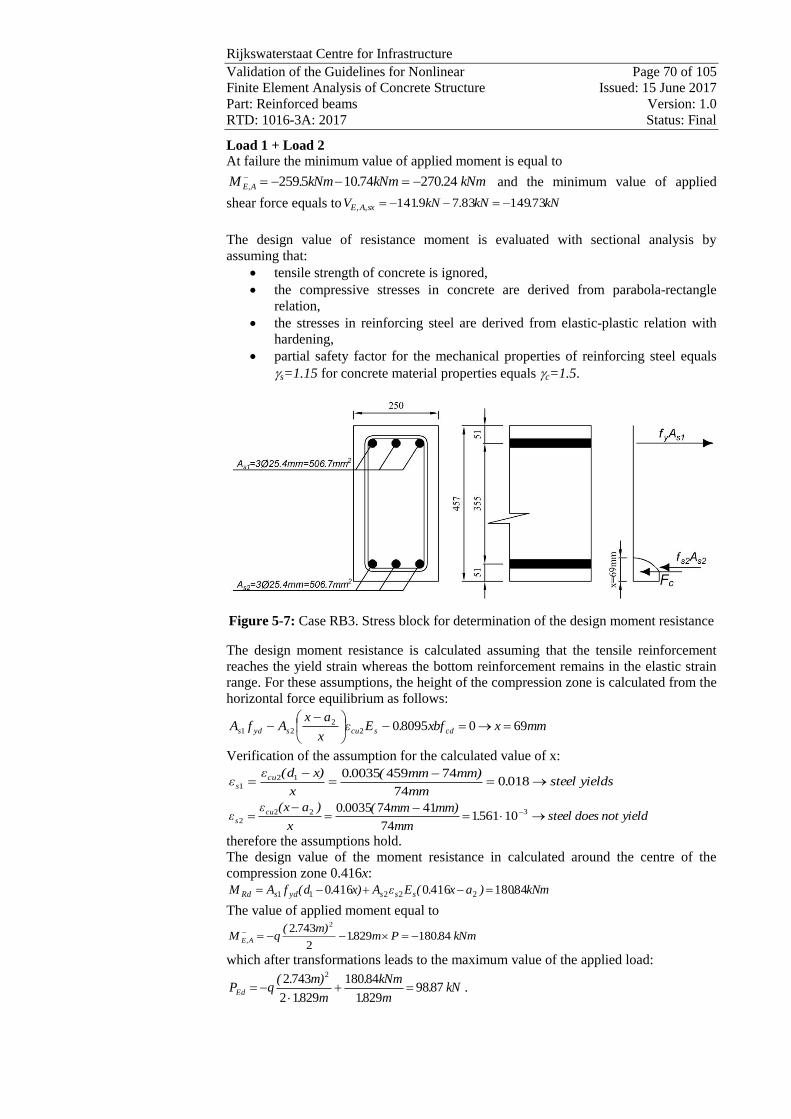
Rijkswaterstaat Centre for Infrastructure
Validation of the Guidelines for Nonlinear Page 70 of 105
Finite Element Analysis of Concrete Structure Issued: 15 June 2017
Part: Reinforced beams Version: 1.0
RTD: 1016-3A: 2017 Status: Final
Load 1 + Load 2 At failure the minimum value of applied moment is equal to
kNm.kNm.kNm.M E,A 2427074105259 and the minimum value of applied
shear force equals to kNkNkNV sxAE 73.14983.79.141,,
The design value of resistance moment is evaluated with sectional analysis by
assuming that:
tensile strength of concrete is ignored,
the compressive stresses in concrete are derived from parabola-rectangle
relation,
the stresses in reinforcing steel are derived from elastic-plastic relation with
hardening,
partial safety factor for the mechanical properties of reinforcing steel equals
s=1.15 for concrete material properties equals c=1.5.
Figure 5-7: Case RB3. Stress block for determination of the design moment resistance
The design moment resistance is calculated assuming that the tensile reinforcement
reaches the yield strain whereas the bottom reinforcement remains in the elastic strain
range. For these assumptions, the height of the compression zone is calculated from the
horizontal force equilibrium as follows:
mmxxbf.Eεx
axAfA cdscusyds 690809502
221
Verification of the assumption for the calculated value of x:
yieldssteel.mm
mm)mm(.
x
x)(dεε cu
s
018074
7445900350121
yieldnotdoessteel.mm
mm)mm(.
x
)a(xεε cu
s
3222 105611
74
417400350
therefore the assumptions hold.
The design value of the moment resistance in calculated around the centre of the
compression zone 0.416x:
kNm.)ax.(EεAx).(dfAM sssydsRd 8418041604160 22211
The value of applied moment equal to
kNm.Pm.m).(
qM E,A 8418082912
7432 2
which after transformations leads to the maximum value of the applied load:
kN.m.
kNm.
m.
m).(qPEd 8798
8291
84180
82912
7432 2
.

Rijkswaterstaat Centre for Infrastructure
Validation of the Guidelines for Nonlinear Page 71 of 105
Finite Element Analysis of Concrete Structure Issued: 15 June 2017
Part: Reinforced beams Version: 1.0
RTD: 1016-3A: 2017 Status: Final
The shear force resistance attributed to steel and crushing of concrete for the permitted
range of the angle of inclination of compressive struts is presented in Figure 5-8.
The design value of shear resistance is equal to
kNVRd 57.270 .
The design shear resistance attributed to concrete is evaluated as follows:
kN.
.
.MPa.
..mmmm.
θ
θαfναdb.V cdcwRd,c
572704321
43204715
250
223160125040690
cot1
cotcot90
2
21
while the design shear resistance provided by stirrups is:
kN..MPa.mm
mmmm.
αθαfs
Ad.V yd
swRds
572701432007326152
14240690
sincotcot90
2
Figure 5-8: Case RB3. Shear resistance
The value of applied shear force corresponding to the bending capacity (equal to 98.87
kN) is lower than the design value of shear resistance (equal to 270.57 – 7.835 =
262.73 kN). As a result, according to the sectional analysis, the beam fails in bending.
In Table 5-2 the design value of beam resistance expressed in terms of applied load PRd
obtained with Eurocode 2 (CEN, 2005) is highlighted.
Table 5-2: Case RB3. Design value of beam resistance expressed in terms of applied
load PRd
PRd (EC2)
(kN)
98.87

Rijkswaterstaat Centre for Infrastructure
Validation of the Guidelines for Nonlinear Page 72 of 105
Finite Element Analysis of Concrete Structure Issued: 15 June 2017
Part: Reinforced beams Version: 1.0
RTD: 1016-3A: 2017 Status: Final
5.3 Finite element model
Units Units are N, m.
Material models and parameters The concrete model is based on a total strain rotating crack model with
exponential softening in tension and parabolic behavior in compression,
variable Poisson’s ratio of concrete dependent on crack strain values,
reduction of compressive strength of concrete due to lateral cracking with a
lower limit of 0.6 according to (Vecchio, 1986),
increase in compressive strength due to lateral confinement according to the
model proposed by Selby and Vecchio (Selby and Vecchio 1993).
The mechanical properties of concrete are summarized in Table 5-3. The uniaxial stress
- strain curve is shown in Figure 5-9. In the input file of the analysis, the GF value has
been decreased with a factor 2 in order to compensate for an underestimation of the
crack band width for cracks with an inclination angle of 45 degrees
096.02/136.0, reducedFG .
Table 5-3: Case RB3. Constitutive model parameters for concrete
fcm
(N/mm2)
fctm
(N/mm2)
Ec
(N/mm2)
ν GF
(Nmm/mm2)
GC
(Nmm/mm2)
Mean
measured
values
31.20 2.44* 31297
* Var
** 0.136
* 33.90
*
* Not specified in reference; estimated according to MC2010 (fib, 2013)
** Variable –reduced with the initial value of 0.15
The model for the reinforcement bars and stirrups is based on hardening plasticity.
Geometrical and mechanical features of reinforcement are summarized in Table 5-1.
The stress-strain curve of the #8 bars is plotted in Figure 5-10.
Figure 5-9: Case RB3. Stress-strain curve for concrete

Rijkswaterstaat Centre for Infrastructure
Validation of the Guidelines for Nonlinear Page 73 of 105
Finite Element Analysis of Concrete Structure Issued: 15 June 2017
Part: Reinforced beams Version: 1.0
RTD: 1016-3A: 2017 Status: Final
Figure 5-10: Case RB3. Stress-strain curve adopted for #8 bars
Table 5-4: Case RB3. Steel plates properties
E
(N/mm2)
200000 0.3
For the steel plates a linear elastic behavior is assumed, see Table 5-4.
Interface elements were used between the steel plates and the concrete beam at the
supports and the location of applied loading.
The thickness of interface elements equals 10 mm. Stress-strain relation in
compression was determined by assuming stiffness equivalent to the stiffness of a layer
of mortar 1 mm thick having a Young’s modulus derived from the mean measured
compressive strength of concrete as shown in Table 5-3. A bilinear behavior is
assumed in the normal direction (see Figure 5-11) whereas for the shear direction the
relation is linear elastic. The normal stiffness in tension and the stiffness in shear
direction were assumed almost equal to zero. For stableness of the analysis, horizontal
displacements of one pair of nodes across the interface elements of support plates and
loading plate were tied. The mechanical characteristics of the interface elements are
summarized in Table 5-5.
Table 5-5: Case RB3. Interface properties
Knn in tension
(N/mm3)
Knn in compression
(N/mm3)
Kt
(N/mm3)
3.13×10⁻⁸
3.13×10+4
3.13×10⁻⁸

Rijkswaterstaat Centre for Infrastructure
Validation of the Guidelines for Nonlinear Page 74 of 105
Finite Element Analysis of Concrete Structure Issued: 15 June 2017
Part: Reinforced beams Version: 1.0
RTD: 1016-3A: 2017 Status: Final
Figure 5-11: Case RB3. Traction-displacement diagram in normal direction for
interfaces
Element types and finite element mesh For meshing the concrete, 8-node membrane elements (CQ16M) with a full Gauss
integration scheme (3×3) are used. The average element size is 50 mm. The
reinforcement bars and stirrups are modelled with embedded truss elements with two
Gauss integration points along the axis of the element. Perfect bond is assumed.
For the steel plates 8-node membrane elements (CQ16M) with a full Gauss integration
scheme (3×3) are used. The 6-node interfaces element have three Lobatto integration
points. The adopted dimensions for the beam and for the transversal cross section of
the beam are given in Figure 5-12 and Figure 5-1, respectively.
Figure 5-12: Case RB3. Dimensions adopted for the beam (in m)
The mesh of the beam is presented in Figure 5-13(a). Different materials are indicated
with varying colors in Figure 5-13(b).

Rijkswaterstaat Centre for Infrastructure
Validation of the Guidelines for Nonlinear Page 75 of 105
Finite Element Analysis of Concrete Structure Issued: 15 June 2017
Part: Reinforced beams Version: 1.0
RTD: 1016-3A: 2017 Status: Final
(a)
(b)
Figure 5-13: Case RB3. (a) Mesh and (b) material sets
Different groups of elements were defined to distinguish the concrete elements that can
be subjected to crushing or cracking and reinforcement that can yield. These groups of
elements will be used in section 5.4 to monitor the failure mode during the analysis.
For monitoring steel yielding, the group REBAR (red) and STIRRUPS (black) refer to
3#8 reinforcing bars and #3 stirrups of the beam, see Figure 5-14.
Figure 5-14: Case RB3. Groups of steel elements monitoring yielding
Figure 5-15 shows the groups of elements named CRUSHING, used for monitoring the
inelastic behavior of concrete in compression due to bending near the support A. This
group of elements has the length equal to 5 times the length of the supporting steel
plate and the depth equal to the length of the supporting steel plate.
Figure 5-15: Case RB3. Group of concrete elements monitoring crushing due to
bending
Figure 5-16 shows the group of elements named SHEAR where the inelastic behavior
of concrete due to shear was monitored. Group SHEAR is lying between the REBAR
group and the edges of the loading and the support steel plate.
Figure 5-16: Case RB3. Group of concrete elements monitoring inelastic behavior due
to shear
Boundary conditions and loading The translations along x and y axes at a single node of the left steel plate (support A) is
constrained as well as the translation along y axis at a single node of the bottom and the
top right steel plates (support B), Figure 5-17.
Dead load is applied in load case 1. Load P as a unit load of 1×10³ N is added in load
case 2 as a concentrated load applied at the mid node of the loading plate, Figure 5-17.
REBAR
STIRRUPS
CRUSHING
SHEAR

Rijkswaterstaat Centre for Infrastructure
Validation of the Guidelines for Nonlinear Page 76 of 105
Finite Element Analysis of Concrete Structure Issued: 15 June 2017
Part: Reinforced beams Version: 1.0
RTD: 1016-3A: 2017 Status: Final
Figure 5-17: Case RB3. Boundary conditions and load case 2
Load increments and convergence criteria Load case 1 is applied in a single step. The regular Newton-Raphson method with a
maximum of 25 iterations is used. As convergence criteria, the norms of the force and
energy are selected. The analysis continues even if the convergence criteria are not
satisfied. The convergence tolerance is equal to 1×10⁻²
for the energy and force norms.
A maximum number of iterations equal to 25 was chosen. A Line Search algorithm is
used to improve the convergence performance.
Figure 5-18: Case RB3. `Indirect Displacement control' technique applied referring to
node 1
Load case 2 is applied with automatic adaptive load increments based on energy. The
initial load factor equals 5, the upper limit of the incremental load factor equals 10 and
the lower limit of the incremental load factor equals 2. The maximum number of steps
is 140. Arc-length control was applied based on translation along y axis of node 1 (line
search- ‘inddisp’), Figure 5-18. The analysis continues even if the convergence criteria
are not satisfied. The convergence tolerances are equal to 1×10⁻³
and 1×10⁻²
for energy
and force norms, respectively. A maximum number of iterations equal to 25 was
selected. A Line Search algorithm is used to improve the convergence performance.
5.4 Nonlinear finite element analysis
Load deflection The load-deflection curve is presented in Figure 5-19 together with the applied load
values corresponding to the beginning of yielding of #8 longitudinal bars and yielding
of the stirrups. The step at which the first integration point reaches a minimum
principal strain value lower than -3.5×10⁻³
is defined crushing of concrete. The peak
load is defined as the highest load step where the energy norm ratio satisfies the fixed
tolerance of 1×10⁻³
. At the peak loads the ultimate strain of #8 rebars, assumed equal to
of 5×10⁻²
, is achieved.
x
P
y Support A Support B
1

Rijkswaterstaat Centre for Infrastructure
Validation of the Guidelines for Nonlinear Page 77 of 105
Finite Element Analysis of Concrete Structure Issued: 15 June 2017
Part: Reinforced beams Version: 1.0
RTD: 1016-3A: 2017 Status: Final
Figure 5-19: Case RB3. Load-deflection curves
Convergence behavior For most steps convergence is achieved on the basis of the energy criterion, Figure
5-20 and Figure 5-21. For load case 2 the peak load is defined as the highest load step
where the energy norm ratio satisfies the fixed tolerance of 1×10⁻³
and it is marked
with a red marker.

Rijkswaterstaat Centre for Infrastructure
Validation of the Guidelines for Nonlinear Page 78 of 105
Finite Element Analysis of Concrete Structure Issued: 15 June 2017
Part: Reinforced beams Version: 1.0
RTD: 1016-3A: 2017 Status: Final
Figure 5-20: Case RB3. Evolution of the energy norm (blue lines indicate steps, red
line indicates tolerance, green points indicate iterative results)
Figure 5-21: Case RB3. Evolution of the force norm (blue lines indicate steps, red line
indicates tolerance, green points indicate iterative results)
Strains Figure 5-22 shows the crack strain values at the peak value of applied load (step 102, P
= 142 kN).
The first crack strain value plotted in Figure 5-22 equals to 7.86×10⁻⁴
, corresponds to
the ultimate crack strain value calculated as ctm
Ft,u
fh
Gε
. The third crack strain value,
equal to 3.62×10⁻³
, is the crack strain value corresponding to a stress value equal to 1%
of fctm. An intermediate crack strain value was added in the contour plot.
The vertical crack pattern, which can be observed in the contour of the crack strain,
shows that the failure is due to bending and can be compared with the experimental
crack pattern illustrated in Figure 5-3.
0
0.5
1
1.5
2
2.5
0.0E+0 2.0E-3 4.0E-3 6.0E-3
s(N
/mm
2)
(-)
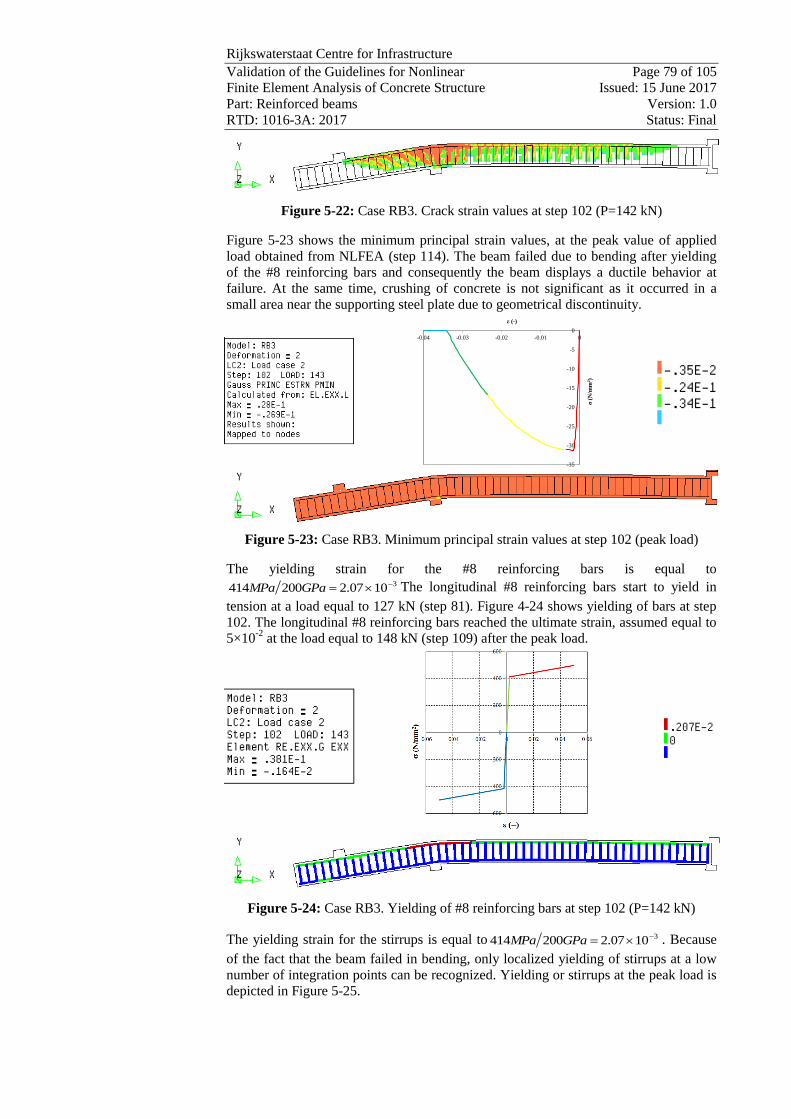
Rijkswaterstaat Centre for Infrastructure
Validation of the Guidelines for Nonlinear Page 79 of 105
Finite Element Analysis of Concrete Structure Issued: 15 June 2017
Part: Reinforced beams Version: 1.0
RTD: 1016-3A: 2017 Status: Final
Figure 5-22: Case RB3. Crack strain values at step 102 (P=142 kN)
Figure 5-23 shows the minimum principal strain values, at the peak value of applied
load obtained from NLFEA (step 114). The beam failed due to bending after yielding
of the #8 reinforcing bars and consequently the beam displays a ductile behavior at
failure. At the same time, crushing of concrete is not significant as it occurred in a
small area near the supporting steel plate due to geometrical discontinuity.
Figure 5-23: Case RB3. Minimum principal strain values at step 102 (peak load)
The yielding strain for the #8 reinforcing bars is equal to31007.2200414 GPaMPa The longitudinal #8 reinforcing bars start to yield in
tension at a load equal to 127 kN (step 81). Figure 4-24 shows yielding of bars at step
102. The longitudinal #8 reinforcing bars reached the ultimate strain, assumed equal to
5×10⁻²
at the load equal to 148 kN (step 109) after the peak load.
Figure 5-24: Case RB3. Yielding of #8 reinforcing bars at step 102 (P=142 kN)
The yielding strain for the stirrups is equal to 31007.2200414 GPaMPa . Because
of the fact that the beam failed in bending, only localized yielding of stirrups at a low
number of integration points can be recognized. Yielding or stirrups at the peak load is
depicted in Figure 5-25.
-35
-30
-25
-20
-15
-10
-5
0
-0.04 -0.03 -0.02 -0.01 0
σ(N
/mm
2)
ε (-)

Rijkswaterstaat Centre for Infrastructure
Validation of the Guidelines for Nonlinear Page 80 of 105
Finite Element Analysis of Concrete Structure Issued: 15 June 2017
Part: Reinforced beams Version: 1.0
RTD: 1016-3A: 2017 Status: Final
Figure 5-25: Case RB3. Yielding of the stirrups at the peak load (peak load P=142 kN)
Gauss point statistics Table 5-6 lists the number of cracking points, crushing points, and yield points at step
81 (the beginning of yielding of #8 reinforcing bar), at step 90 (when the first element
reaches minimum principal strains lower than -3.5×10⁻³
and yielding of stirrups) and at
step 102 (the peak value of applied load obtained from NLFEA). Crushing is defined as
soon as the softening branch in compression is reached. In the current, it is at the
minimum principal strain of -1.7×10⁻³
.
Table 5-6: Case RB3. Number of cracking points, crushing points, and yield points
YIELDING OF #8 BARS
STEP 81 ITERATIONS 5
GROUP
NAME PLAST PRV. PL CRITIC
PLAST
NEW
PRV.PL
NEW
CRITIC
NEW
BEAM 31 0 0 1 0 0
REBAR 7 0 0 0 0 0
CRUSHING 31 0 0 1 0 0
TOTAL
MODEL 38 0 0 1 0 0
CRACKING LOGGING SUMMARY
GROUP
NAME CRACK OPEN CLOSED ACTIVE INACTI ARISES
BEAM 4559 4556 3 2742 1817 27
CRUSHING 198 198 0 133 65 6
SHEAR 681 681 0 432 249 5
TOTAL
MODEL 4559 4556 3 2742 1817 27
CUMULATIVE REACTION:
FORCE X FORCE Y
-0.56954D-09 -0.15049D+06
CRUSHING OF CONCRETE AND YIELDING OF #3 STIRRUPS
STEP 90 ITERATIONS 1
GROUP
NAME PLAST PRV. PL CRITIC
PLAST
NEW
PRV.PL
NEW
CRITIC
NEW
BEAM 79 0 0 11 0 0
REBAR 33 0 0 0 0 0
STIRRUPS 3 0 0 2 0 0
CRUSHING 78 0 0 10 0 0
TOTAL
MODEL 115 0 0 13 0 0

Rijkswaterstaat Centre for Infrastructure
Validation of the Guidelines for Nonlinear Page 81 of 105
Finite Element Analysis of Concrete Structure Issued: 15 June 2017
Part: Reinforced beams Version: 1.0
RTD: 1016-3A: 2017 Status: Final
CRACKING LOGGING SUMMARY
GROUP
NAME CRACK OPEN CLOSED ACTIVE INACTI ARISES
BEAM 4851 4848 3 3405 1446 37
CRUSHING 313 313 0 260 53 19
SHEAR 715 715 0 474 241 5
TOTAL
MODEL 4851 4848 3 3405 1446 37
CUMULATIVE REACTION:
FORCE X FORCE Y
-0.76775D-09 -0.15774D+06
PEAK LOAD
STEP 102 ITERATIONS 12
GROUP
NAME PLAST PRV. PL CRITIC
PLAST
NEW
PRV.PL
NEW
CRITIC
NEW
BEAM 91 34 0 3 18 0
REBAR 44 1 0 0 1 0
STIRRUPS 27 0 0 4 0 0
CRUSHING 79 33 0 3 18 0
TOTAL
MODEL 162 35 0 7 19 0
CRACKING LOGGING SUMMARY
GROUP
NAME CRACK OPEN CLOSED ACTIVE INACTI ARISES
BEAM 5355 5352 3 3405 1950 54
CRUSHING 447 447 0 339 108 17
SHEAR 788 788 0 520 268 5
TOTAL
MODEL 5355 5352 3 3405 1950 54
CUMULATIVE REACTION:
FORCE X FORCE Y
-0.29341D-12 -0.16507D+06
5.5 Application of safety formats Model Code 2010 (fib, 2013)
As proposed by the Model Code 2010 (fib, 2013),the safety formats for non-linear
finite element analyses are three numerical methods denoted as GRF (Global
Resistance Factor method), PF (Partial Factor method) and ECOV (Method of
Estimation of a Coefficient of Variation of resistance). Application of the safety
formats requires in total 4 non-linear analyses. In Table 5-7 - Table 5-9 the mechanical
properties applied in the non-linear analyses are summarized.
Table 5-7: Case RB3. Constitutive model parameters for concrete
fc
(N/mm2)
fct
(N/mm2)
Ec
(N/mm2)
GF
(Nmm/mm2)
GC
(Nmm/mm2)
Mean measured 31.20 2.44 31297 Var. 0.136 33.901
Characteristic 23.20 1.71 28382 Var. 0.129 32.140
Mean GRF 19.72 2.19 26900 Var. 0.125 31.214
Design 15.47 1.14 26602 Var. 0.120 29.878
Table 5-8: Case RB3. Constitutive model parameters for reinforcing bars #8
(mm)
As
(mm2)
fy
(N/mm2)
ft
(N/mm2)
Es
(N/mm2)
εsy
Mean measured 25.4 471 414.00 500.00 200000 0.00207
Characteristic 25.4 471 374.98 452.87 200000 0.00187

Rijkswaterstaat Centre for Infrastructure
Validation of the Guidelines for Nonlinear Page 82 of 105
Finite Element Analysis of Concrete Structure Issued: 15 June 2017
Part: Reinforced beams Version: 1.0
RTD: 1016-3A: 2017 Status: Final
Mean GRF 25.4 471 412.48 498.16 200000 0.00206
Design 25.4 471 326.07 393.80 200000 0.00163
Table 5-9: Case RB3. Constitutive model parameters for reinforcing bars #3
(mm)
As
(mm2)
fy
(N/mm2)
ft
(N/mm2)
Es
(N/mm2)
εsy
Mean measured 9.5 71 414.00 500.00 200000 0.00207
Characteristic 9.5 71 374.98 452.87 200000 0.00187
Mean GRF 9.5 71 412.48 498.16 200000 0.00206
Design 9.5 71 326.07 393.80 200000 0.00163
In Figure 5-26 the load-deflection curves obtained with mean measured, characteristic,
mean (GRF) and design values of material strengths, calculated according to Model
Code 2010 (fib, 2013) are shown. The peak loads are defined as the load values for
which the ultimate strain of #8 rebars, assumed to be 5×10⁻²
,is reached
Figure 5-26: Case RB3. Load-deflection curves obtained with mean measured,
characteristic, mean (GRF) and design values of material strengths
The RB3 beam was analyzed with analytical expressions for sectional analysis and
numerical procedures proposed for NLFE analysis. Figure 5-27 shows the comparison
of analytical and numerical design values of the beam resistance expressed in terms of
a percentage of the experimental ultimate value of applied load.
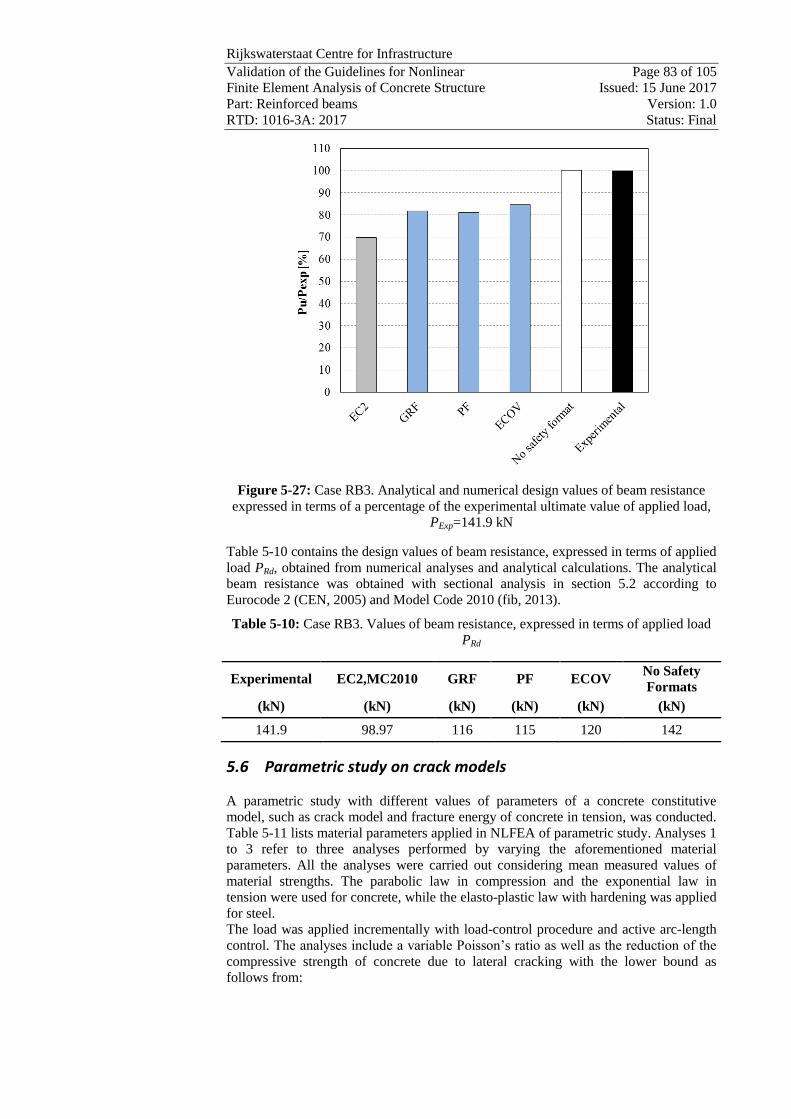
Rijkswaterstaat Centre for Infrastructure
Validation of the Guidelines for Nonlinear Page 83 of 105
Finite Element Analysis of Concrete Structure Issued: 15 June 2017
Part: Reinforced beams Version: 1.0
RTD: 1016-3A: 2017 Status: Final
Figure 5-27: Case RB3. Analytical and numerical design values of beam resistance
expressed in terms of a percentage of the experimental ultimate value of applied load,
PExp=141.9 kN
Table 5-10 contains the design values of beam resistance, expressed in terms of applied
load PRd, obtained from numerical analyses and analytical calculations. The analytical
beam resistance was obtained with sectional analysis in section 5.2 according to
Eurocode 2 (CEN, 2005) and Model Code 2010 (fib, 2013).
Table 5-10: Case RB3. Values of beam resistance, expressed in terms of applied load
PRd
Experimental EC2,MC2010 GRF PF ECOV No Safety
Formats
(kN) (kN) (kN) (kN) (kN) (kN)
141.9 98.97 116 115 120 142
5.6 Parametric study on crack models
A parametric study with different values of parameters of a concrete constitutive
model, such as crack model and fracture energy of concrete in tension, was conducted.
Table 5-11 lists material parameters applied in NLFEA of parametric study. Analyses 1
to 3 refer to three analyses performed by varying the aforementioned material
parameters. All the analyses were carried out considering mean measured values of
material strengths. The parabolic law in compression and the exponential law in
tension were used for concrete, while the elasto-plastic law with hardening was applied
for steel.
The load was applied incrementally with load-control procedure and active arc-length
control. The analyses include a variable Poisson’s ratio as well as the reduction of the
compressive strength of concrete due to lateral cracking with the lower bound as
follows from:

Rijkswaterstaat Centre for Infrastructure
Validation of the Guidelines for Nonlinear Page 84 of 105
Finite Element Analysis of Concrete Structure Issued: 15 June 2017
Part: Reinforced beams Version: 1.0
RTD: 1016-3A: 2017 Status: Final
6.0,
min, cm
redc
f
fs
The effect of the applied value of the fracture energy of concrete in tension on the
beam’s response was investigated by adopting the formulation proposed by Model
Code 1990 (CEB-FIP, 1993) and the formulation proposed by Model Code 2010 (fib,
2013). The fracture energy of concrete in compression was considered for all analyses
equal to 250GF (Nakamura et al. 2001). For the Total Strain fixed crack model, the aggregate size based shear retention was
defined. According to this model, the shear stiffness of a crack diminishes together with
opening of the crack until the value of the normal crack strain reaches the size of half the
mean aggregate size. This implies loss of contact between crack planes. The linear decay of
shear stiffness further depends on the crack bandwidth value h. The complete formulation
is:
hd
n
aggr
21
In Figure 5-28 the load-deflection curves resulting from the parametric study are plotted.
The peak load values are given in Table 5-11.
Table 5-11: Case RB3. Data used for the parametric study
Analysis Total strain
crack model Limit to s GF GC
Peak load value
(kN)
Analysis 1 rotating 0.6 MC2010 250 GF 148
Analysis 2 rotating 0.6 MC1990 250 GF 147
Analysis 3 fixed 0.6 MC2010 250 GF 151
Figure 5-28: Case RB3. Load-deflection curves (Analyses 1 to 3)
0
20
40
60
80
100
120
140
160
0 50 100 150 200 250 300 350 400
Lo
ad
(k
N)
Deflection (mm)
Analysis 1
Analysis 2
Analysis 3
Experimental

Rijkswaterstaat Centre for Infrastructure
Validation of the Guidelines for Nonlinear Page 85 of 105
Finite Element Analysis of Concrete Structure Issued: 15 June 2017
Part: Reinforced beams Version: 1.0
RTD: 1016-3A: 2017 Status: Final
The crack model and mechanical properties used in Analysis 1 were selected as for the
safety formats for NLFEA to predict the design resistance. The peak loads are defined
as the load values for which the ultimate strain of #8 rebars, assumed to be 5×10⁻²
, is
reached.
As expected, since the beam fails in bending, the peak loads and the failure modes
observed from NLFE analyses are not heavily dependent on the values of the fracture
energy of concrete in tension. The fixed crack model provides a stiffer response after
yielding of the #8 bars as well as after the crushing of concrete than the analyses with
the applied rotating crack orientation.
5.7 Concluding remarks
The beam RB3 tested by Grace consists of an overhang at one end and a support
constraining vertical translation at the other. The beam was loaded at the loose end and
exhibited a ductile flexural failure. The ultimate value of the applied load in
experiments was kNPExp 9.141 .
From the analytical calculation, based on sectional analysis, it was demonstrated that
beam RB3 fails due to bending. This conclusion was drawn as the shear force
corresponding to the design value of moment resistance is lower than the design value
of shear resistance. The design beam resistance evaluated with the sectional analysis
equals to kNPExp 95 .
The peak value of the applied load obtained from NLFEA, performed with the mean
measured values of material strength, is equal to 142 kN. The displayed flexural failure
mode is characterized by extensive yielding accompanied with high strain values in #8
top reinforcing bars and localized crushing of concrete and yielding of stirrups.
The peak loads are defined as the load magnitude for which the ultimate strain of #8
rebars – assumed to be 5×10⁻²
is reached.
In order to compute the design values of beam resistance, safety formats for non-linear
finite element analyses, as introduced by the Model Code 2010 were used. The design
values of beam resistance obtained from safety formats is higher than the design
resistance estimated by means of an analytical approach. The maximum value resulting
from the analyses with application of safety formats was obtained with ECOV
approach which yields the resistance equal to kNPRd 120 .
Since the beam fails in bending, the failure mode is not heavily dependent on the crack
model and tensile strengths of concrete in tension.

Rijkswaterstaat Centre for Infrastructure
Validation of the Guidelines for Nonlinear Page 86 of 105
Finite Element Analysis of Concrete Structure Issued: 15 June 2017
Part: Reinforced beams Version: 1.0
RTD: 1016-3A: 2017 Status: Final
6 Case RB3A: Grace (2001)
The experimental program of Grace (Grace, 2001) studied the effect of strengthening
using fiber-reinforced polymer strips. The control beam of the category I beams from
this program is used as a case study.
6.1 Experimental setup and results
Geometry The only difference between RB3 and RB3A is that the stirrups have a spacing of
0.457 m instead of 0.152 m. All the other dimensions and parameters remain the same.
Experimental Results The beam exhibited a shear failure mode, Figure 6-1. The experimental ultimate value
of applied load was equal to kNPExp 7.155 .
Figure 6-1: Case RB3A. Failure mechanisms at experimental ultimate value of applied
load (Grace 2001)
6.2 Analytical analysis
In Figure 6-2, the load configuration at failure is depicted. The distributed load
representing the beam weight is equal to kNm...q 8562254570250 .
Figure 6-2: Case RB3A. Load configuration (dimension in m)
Load case 1
Figure 6-3 shows that the maximum negative value of applied moment at the support A
is equal to:
kNm.m).(
kN/m.M E,A 74102
74328562
2
and the value of applied shear force at support A is equal to:
kN.m.mkN.VE,A,sx 83774328562
The value of shear force at support B equals:

Rijkswaterstaat Centre for Infrastructure
Validation of the Guidelines for Nonlinear Page 87 of 105
Finite Element Analysis of Concrete Structure Issued: 15 June 2017
Part: Reinforced beams Version: 1.0
RTD: 1016-3A: 2017 Status: Final
kN.qm.
m).(q
m.VE,B 8775
4875
1
2
7432
2
4875 2
Figure 6-3: Case RB3. Load 1: Internal forces
Load case 2
The experimental ultimate value of applied load is equal to kNPExp 7.155 .
Figure 6-4 shows that the minimum value of applied moment at the support A is equal
to:
kNm.m.kN.M E,A 7828482917155
and the values of applied shear force at supports A and B are equal to:
kN.VE,A,sx 7155 and kN.VE,B 951 .
Figure 6-4: Case RB3. Load 2: Internal forces

Rijkswaterstaat Centre for Infrastructure
Validation of the Guidelines for Nonlinear Page 88 of 105
Finite Element Analysis of Concrete Structure Issued: 15 June 2017
Part: Reinforced beams Version: 1.0
RTD: 1016-3A: 2017 Status: Final
Load 1 + Load 2
At failure the minimum value of applied moment is equal to:
kNm.kNm.kNm.M E,A 52295741078284
and the minimum value of applied shear force: kNkN.kN.VE,A,sx 3.1638377155
The design value of resistance moment is evaluated with sectional analysis by
assuming that:
tensile strength of concrete is ignored,
the compressive stresses in concrete are derived from parabola-rectangle
relation,
the stresses in the reinforcing steel are derived from elastic-plastic relation
with hardening,
the partial safety factor for the mechanical properties of reinforcing steel
equals 15.1s , the factor for concrete material properties equals 5.1c .
Figure 6-5: Case RB3A. Stress block for determination of the design moment
resistance
The design moment resistance for the case study RB3A is not influenced by reduced
spacing of stirrups. Under these circumstances, the procedure for computing bending
capacity is the same as in the previous section. The cross-section of the beam is
calculated assuming that the tensile reinforcement reaches the yield strain whereas the
bottom reinforcement remains in the elastic strain range. For these assumptions, the
height of the compression zone is calculated from the horizontal force equilibrium as
follows:
mmxxbf.Eεx
axAfA cdscusyds 690809502
221
Verification of the assumption for the calculated value of x:
yieldssteel.mm
mm)mm(.
x
x)(dεε cu
s
018074
7445900350121
yieldnotdoessteel.mm
mm)mm(.
x
)a(xεε cu
s
3222 105611
74
417400350
therefore the assumptions hold.
The design value of the moment resistance in calculated around the centre of the
compression zone x.4160 :
kNm.)ax.(EεAx).(dfAM sssydsRd 8418041604160 22211
The value of applied moment equal to

Rijkswaterstaat Centre for Infrastructure
Validation of the Guidelines for Nonlinear Page 89 of 105
Finite Element Analysis of Concrete Structure Issued: 15 June 2017
Part: Reinforced beams Version: 1.0
RTD: 1016-3A: 2017 Status: Final
kNm.Pm.m).(
qM E,A 8418082912
7432 2
which after transformations leads to the maximum value of the applied load:
kN.m.
kNm.
m.
m).(qPEd 8798
8291
84180
82912
7432 2
.
The design shear resistance provided by stirrups is evaluated with the expression 6.8
from the EC2 as follows:
kN..N/mm.mm
mmmm.θf
s
Ad.V yd
swRds 55925207326
457
14240690cot90 2
2
The governing shear resistance is the minimum shear resistance restricted by yielding
of stirrups and crushing of concrete. From Figure 6-6, it can be seen that the design
shear resistance dictated by crushing of concrete is much higher than the design shear
resistance attributed to stirrups. Consequently, the governing shear resistance is: kNVVV RdsRdcRd 55.92,min
and follows from yielding of shear reinforcement.
Figure 6-6: Case RB3A. Shear resistance
From the comparison of the values of applied load corresponding to shear resistance,
kN.kN.kN.PE, 8758567565592max and bending moment resistance kNPBM 97.98 ,
it can be concluded that because BME, PP max , the beam fails due to shear. It is thus in
agreement with the observation from the experiments. Besides the calculations according to the EC2, the design value of shear resistance for
an element containing shear reinforcement was evaluated with three levels of
approximation as given in the Model Code 2010 (fib, 2013).
Level I Approximation
The design shear resistance of members with shear reinforcement is given by:
max,, RdsRdRd VVV
For reinforced concrete members 30min , 732.1)cot( .
kN..N/mmmm.mm
mm.θzf
s
AV ywd
w
swRd,s 346473213264365
457
26712cot 2
2

Rijkswaterstaat Centre for Infrastructure
Validation of the Guidelines for Nonlinear Page 90 of 105
Finite Element Analysis of Concrete Structure Issued: 15 June 2017
Part: Reinforced beams Version: 1.0
RTD: 1016-3A: 2017 Status: Final
kN.mm.mm.
N/mm..θθzb
γ
fkV w
c
ck
cRd, 533630cos30sin436525051
223550cossin
2
max
where: mm.mm.d.z 43654069090
5501550 ..ηkk fcεc
550.kε
1130
31
fc
/
ck
fc ηf
η
Level II Approximation To calculate the design value of shear resistance, it is required to determine the state of
stress x. The strain parameter x is calculated iteratively at the critical section located d
from the edge of the support. After a number of iterations, calculations result in:
kN.V i
Ed 82751
kNm.m.m.kN.mm-d)(VM i
Ed
i
Ed 890107406082918275182911
4
2
11
1 10103682754365
890107
15202002
1
2
1
.kN.
mm.
kNm.
mmGPaV
z
M
AEε i
Ed
iEd
ss
ix
1032610000201 .εθ x
i
011480cot0020 121111 .θ.εεε ii
xix
i
5460
5521
1
1
1 .ε.
k i
ε
1130
31
fc
/
ck
fc ηf
η
546011 .ηkk fc
i
ε
i
c
kN..N/mmmm.mm
mm.θzf
s
AV i
ywd
w
swi
Rd,s 827503323264365457
26712cot 2
21
kN.
..N/mm.mm.
N/mm..θθzb
γ
fkV ii
w
c
ckic
iRd,
8304
900440436525051
2235460cossin 2
2111
max
Level III Approximation
A similar procedure to that of LoA II was adopted. In LoA III, the contribution of
concrete can be accounted for when max,RdEd VV . After a number of iterations it results
in:
kN.V i
Ed 321041
kNm.m.m..d)mm(VM i
Ed
i
Ed 451484060829132104182911
0008401043214365
45148
15202002
1
2
1
2
11
1
.Nmm.
kNm.
mmGPa
Vz
M
AEε i
Ed
i
Ed
ss
i
x
40281000020 11
min .εθ i
x
i
01060cot0020 12111
1 .θ.εεε ii
x
i
x
i
2560
5521
1
1
1 .ε.
k i
ε

Rijkswaterstaat Centre for Infrastructure
Validation of the Guidelines for Nonlinear Page 91 of 105
Finite Element Analysis of Concrete Structure Issued: 15 June 2017
Part: Reinforced beams Version: 1.0
RTD: 1016-3A: 2017 Status: Final
1130
31
fc
/
ck
fc ηf
η
562011 .ηkk fciε
ic
kN..N/mmmm.mm
mm.θzf
s
AV i
ywd
w
swi
Rd,s 71688313264365457
26712cot 2
21
min
kN.
..mm.mm.
N/mm..θθzb
γ
fkV ii
w
c
ckic
iRd,
97331
8804760436525051
2235620cossin
21
min1
min1
max
1210
87331
3211041
00084015001
401
15001
401
minmax1
1 ..
.
.
.
θV
V
ε
.k
iRd,
Ed
ix
iv
kN.mm.mm.
..zb
γ
fkV w
c
cki
v
i
Rd,c 6135436525051
22312101
kN.kN.kN.VVV iRd,c
iRd,s
iRd 3210461357168
Shear resistance obtained with LoA III after extraction of the self-weight (equal to
6.675kN at location d from the support) is 97.65kN. This value is marginally lower
than the maximum load kNPRd 78.98 which, according to the above calculations,
would lead to failure in flexure.
Consequently, it can be stated that from the consideration of both methods i.e.
Eurocode 2 (CEN, 2005) and Model Code 2010 (fib, 2013) shear failure is predicted to
be the governing mechanism. The results of the analytical solution are summarized in
Table 6-1.
Table 6-1: Case RB3A. Design value of beam resistance expressed in terms of applied
load PRd
PRd (EC2) PRd (MC2010 - Level I) PRd (MC2010 - Level II) PRd (MC2010 - Level II)
(kN) (kN) (kN) (kN)
85.88 57.67 69.15 97.65
6.3 Finite element model
A similar model to the finite element model of RB3 was used for RB3A. The only
modification comprised of a different spacing of the stirrups.
Material models and parameters The concrete model is based on a total strain rotating crack model with
exponential softening in tension and parabolic behavior in compression,
variable Poisson’s ratio of concrete dependent on crack strain values,
reduction of compressive strength of concrete due to lateral cracking with a
lower limit of 0.6 according to (Vecchio, 1986),
increase in compressive strength due to lateral confinement according to the
model proposed by Selby and Vecchio (Selby and Vecchio, 1993).
The mechanical properties for concrete are summarized in Table 6-2. In the input file
of the analysis, the GF value has been decreased with a factor 2 in order to

Rijkswaterstaat Centre for Infrastructure
Validation of the Guidelines for Nonlinear Page 92 of 105
Finite Element Analysis of Concrete Structure Issued: 15 June 2017
Part: Reinforced beams Version: 1.0
RTD: 1016-3A: 2017 Status: Final
compensate for an underestimation of the crack band width for cracks with an
inclination angle of 45 degrees 096.02/136.0, reducedFG .
Table 6-2: Case RB3A. Constitutive model parameters for concrete
fcm
(N/mm2)
fctm
(N/mm2)
Ec
(N/mm2)
ν GF
(Nmm/mm2)
GC
(Nmm/mm2)
Mean
measured
values
31.20 2.44* 31297
* Var.
** 0.136
* 33.90
*
* Not specified in reference; estimated according to MC2010 (fib, 2013)
** Variable –reduced with the initial value of 0.15
Element types and finite element mesh The specified dimensions of the beam and for the transversal cross section of the beam
are given in Figure 6-7 and Figure 6-8, respectively.
Figure 6-7: Case RB3A. Dimensions adopted for the beam (in m)
Figure 6-8: Case RB3A. Dimensions adopted for the transversal cross section of the
beam (in mm)
The mesh of the beam is presented in Figure 6-9 (a). Different materials are indicated
in colors in Figure 6-9(b).

Rijkswaterstaat Centre for Infrastructure
Validation of the Guidelines for Nonlinear Page 93 of 105
Finite Element Analysis of Concrete Structure Issued: 15 June 2017
Part: Reinforced beams Version: 1.0
RTD: 1016-3A: 2017 Status: Final
(a)
(b)
Figure 6-9: Case RB3A. (a) Mesh and (b) material sets
Different groups of elements were defined to distinguish the concrete elements that can
be subjected to crushing, cracking or yielding in case of reinforcement. These groups
of elements will be used in section 6.4 to monitor the failure mode during the analyses.
For monitoring yielding of reinforcement, the groups REBAR and STIRRUPS
referring to #8 reinforcing bars and #3 stirrups are used, see Figure 6-10.
Figure 6-10: Case RB3A. Groups of steel elements monitoring yielding
Figure 6-11 shows the groups of elements called CRUSHING used for monitoring the
inelastic behavior of concrete in compression due to bending near the support A. This
group of elements has a length equal to 5 times the length of the supporting steel plate
and the depth equal to the length of the supporting steel plate.
Figure 6-11: Case RB3A. Group of concrete elements monitoring crushing due to
bending
Figure 6-11 shows the group of elements named SHEAR where the inelastic behavior
of concrete due to shear was monitored. The group SHEAR is lying between the
REBAR group and between the edges of the load and support steel plate.
Figure 6-12: Case RB3A. Group of concrete elements monitoring inelastic behavior
due to shear
Boundary conditions and loading Constraint translations, Figure 6-13:
along x and y axes at a single node of the left steel plate (support A)
along y axis at a single node of the bottom and top right steel plates (support
B).
Dead load is applied in load case 1. Load P as a unit load of 1×10³ N is added in load
case 2 as a concentrated load applied at the mid node of the loading plate,
REBAR
STIRRUPS
CRUSHING
SHEAR

Rijkswaterstaat Centre for Infrastructure
Validation of the Guidelines for Nonlinear Page 94 of 105
Finite Element Analysis of Concrete Structure Issued: 15 June 2017
Part: Reinforced beams Version: 1.0
RTD: 1016-3A: 2017 Status: Final
Figure 6-13.
Figure 6-13: Case RB3. Boundary conditions and load case 2
Load increments and convergence criteria Load case 1 is applied in a single step. The regular Newton-Raphson method with a
maximum of 25 iterations is used. As convergence criteria, the norms of the force and
energy are selected. The analysis continues even if the convergence criteria are not
satisfied. The convergence tolerance is equal to 1×10⁻²
for the energy and force norms.
A maximum number of iterations equal to 25 was selected. A Line Search algorithm is
used to improve the convergence performance.
Figure 6-14: Case RB3. `Indirect Displacement control' technique applied referring to
node 1
Load case 2 is applied with automatic adaptive load increments based on energy. The
initial load factor equals 5, the upper limit of the incremental load factor is 10 and the
lower limit of the incremental load factor equals 2. The maximum number of steps is
140. Arc-length control was applied based on translation along y axis of node 1 (line
search- ‘inddisp’), Figure 6-14. The analysis continues even if the convergence criteria
are not satisfied. The convergence tolerances are equal to 1×10⁻³
and 1×10⁻²
for energy
and force norms respectively. A maximum number of iterations equal to 50 was
selected. A Line Search algorithm is used to improve the convergence performance.
6.4 Nonlinear finite element analysis
Load deflection The load-deflection curve is presented in Figure 6-15. The applied load values
corresponding to the beginning of yielding of the #8 longitudinal bars, yielding of the
stirrups and crushing of concrete are indicated. The peak load was defined in as the
highest load step (step 98) for which the energy norm ratio satisfies the fixed tolerance
of 1×10⁻³
. After step 98 the ultimate strain of #8 bars, assumed to be equal to of 5×10⁻²
,
was reached. The beam failed in a mix mode due to shear and bending after the
yielding of the #8 reinforcing bars and stirrups.
x
P
y Support A Support B
1

Rijkswaterstaat Centre for Infrastructure
Validation of the Guidelines for Nonlinear Page 95 of 105
Finite Element Analysis of Concrete Structure Issued: 15 June 2017
Part: Reinforced beams Version: 1.0
RTD: 1016-3A: 2017 Status: Final
Figure 6-15: Case RB3A. Load-deflection curves
Convergence behavior For most steps convergence was reached on the basis of the energy criterion, Figure
6-16 and Figure 6-17. For the load case 2, the peak load was defined as the highest load
step where the energy norm ratio satisfied the fixed tolerance of 1×10⁻³
(step 98) and it
is marked with a red dot. After the step 98, there were other steps where the energy
norm ratio satisfied the fixed tolerance of 1×10⁻³
. These step however were not
considered because the ultimate strain of #8 bars, assumed equal to of 5×10⁻²
, was
already reached.
Figure 6-16: Case RB3A. Evolution of the energy norm (blue lines indicate steps, red
line indicates tolerance, green points indicate iterative results)
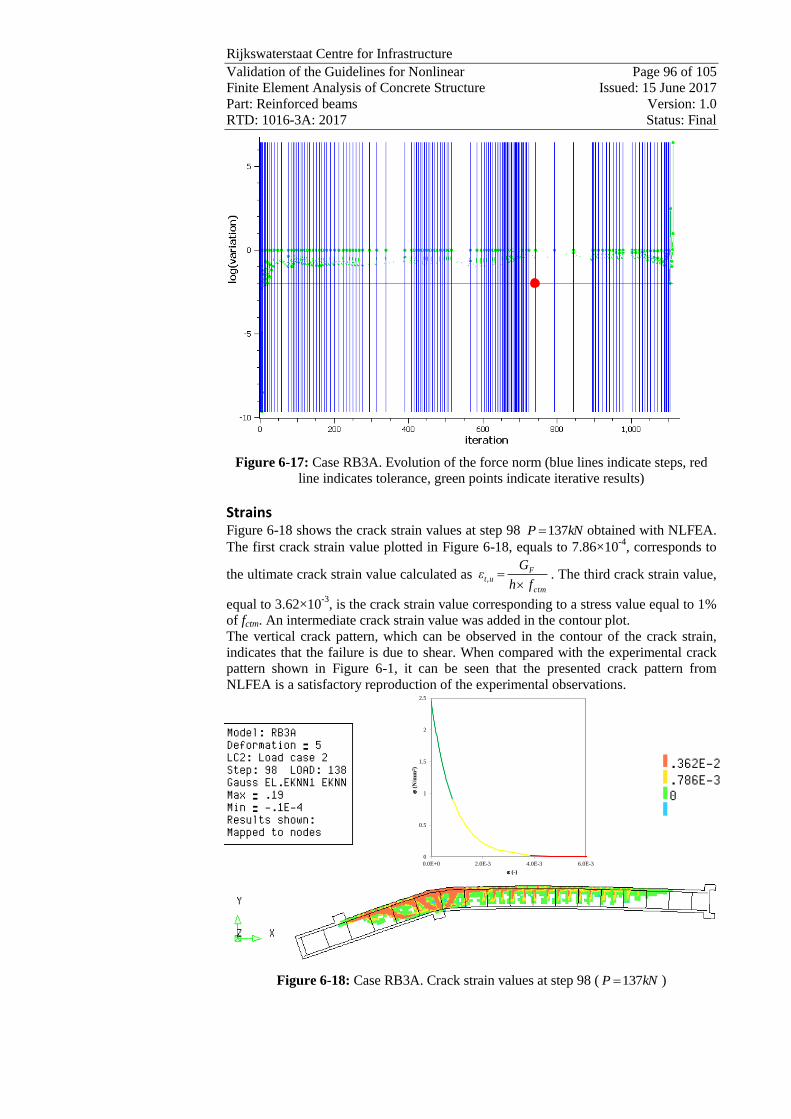
Rijkswaterstaat Centre for Infrastructure
Validation of the Guidelines for Nonlinear Page 96 of 105
Finite Element Analysis of Concrete Structure Issued: 15 June 2017
Part: Reinforced beams Version: 1.0
RTD: 1016-3A: 2017 Status: Final
Figure 6-17: Case RB3A. Evolution of the force norm (blue lines indicate steps, red
line indicates tolerance, green points indicate iterative results)
Strains Figure 6-18 shows the crack strain values at step 98 kNP 137 obtained with NLFEA.
The first crack strain value plotted in Figure 6-18, equals to 7.86×10⁻⁴
, corresponds to
the ultimate crack strain value calculated as ctm
Ft,u
fh
Gε
. The third crack strain value,
equal to 3.62×10⁻³
, is the crack strain value corresponding to a stress value equal to 1%
of fctm. An intermediate crack strain value was added in the contour plot.
The vertical crack pattern, which can be observed in the contour of the crack strain,
indicates that the failure is due to shear. When compared with the experimental crack
pattern shown in Figure 6-1, it can be seen that the presented crack pattern from
NLFEA is a satisfactory reproduction of the experimental observations.
Figure 6-18: Case RB3A. Crack strain values at step 98 ( kNP 137 )
0
0.5
1
1.5
2
2.5
0.0E+0 2.0E-3 4.0E-3 6.0E-3
s(N
/mm
2)
(-)
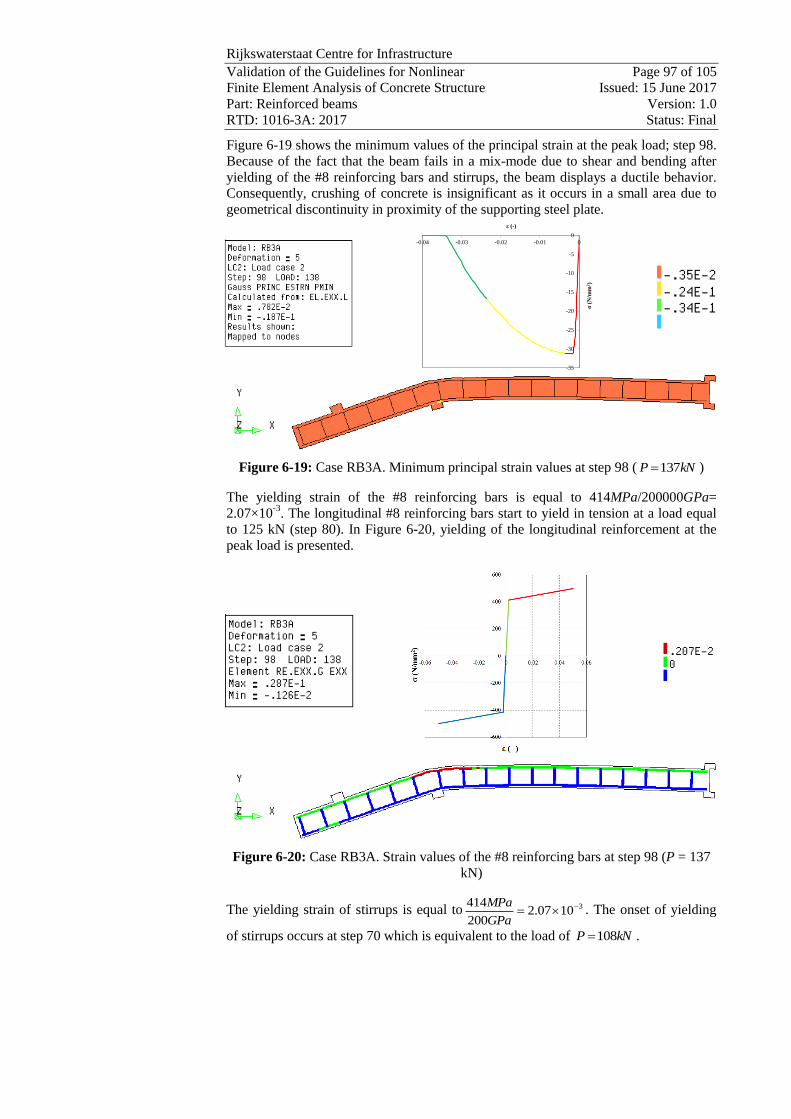
Rijkswaterstaat Centre for Infrastructure
Validation of the Guidelines for Nonlinear Page 97 of 105
Finite Element Analysis of Concrete Structure Issued: 15 June 2017
Part: Reinforced beams Version: 1.0
RTD: 1016-3A: 2017 Status: Final
Figure 6-19 shows the minimum values of the principal strain at the peak load; step 98.
Because of the fact that the beam fails in a mix-mode due to shear and bending after
yielding of the #8 reinforcing bars and stirrups, the beam displays a ductile behavior.
Consequently, crushing of concrete is insignificant as it occurs in a small area due to
geometrical discontinuity in proximity of the supporting steel plate.
Figure 6-19: Case RB3A. Minimum principal strain values at step 98 ( kNP 137 )
The yielding strain of the #8 reinforcing bars is equal to 414MPa/200000GPa=
2.07×10⁻³
. The longitudinal #8 reinforcing bars start to yield in tension at a load equal
to 125 kN (step 80). In Figure 6-20, yielding of the longitudinal reinforcement at the
peak load is presented.
Figure 6-20: Case RB3A. Strain values of the #8 reinforcing bars at step 98 (P = 137
kN)
The yielding strain of stirrups is equal to 31007.2200
414 GPa
MPa. The onset of yielding
of stirrups occurs at step 70 which is equivalent to the load of kNP 108 .
-35
-30
-25
-20
-15
-10
-5
0
-0.04 -0.03 -0.02 -0.01 0
σ(N
/mm
2)
ε (-)

Rijkswaterstaat Centre for Infrastructure
Validation of the Guidelines for Nonlinear Page 98 of 105
Finite Element Analysis of Concrete Structure Issued: 15 June 2017
Part: Reinforced beams Version: 1.0
RTD: 1016-3A: 2017 Status: Final
Figure 6-21: Case RB3A. Strain values of the stirrups at the peak load ( kNP 137 )
Gauss point statistics Table 6-3 lists the number of cracking points, crushing points and yield points at step
70 (beginning of yielding of #3 stirrups), at step 80 (beginning of yielding of #8
reinforcing bars), at step 88 (when the first element reaches minimum principal strains
lower than -3.5×10⁻³
) and at step 88 5 (the peak value of applied load).
Table 6-3: Case RB3. Number of cracking points, crushing points, and yield points
YIELDING OF #3 STIRRUPS
STEP 70 ITERATIONS 5
GROUP
NAME PLAST PRV. PL CRITIC
PLAST
NEW
PRV.PL
NEW
CRITIC
NEW
BEAM 16 0 0 5 0 0
STIRRUPS 2 0 0 2 0 0
CRUSHING 12 0 0 4 0 0
TOTAL
MODEL 18 0 0 7 0 0
CRACKING LOGGING SUMMARY
GROUP
NAME CRACK OPEN CLOSED ACTIVE INACTI ARISES
BEAM 4060 4058 2 2576 1484 30
CRUSHING 165 165 0 128 37 0
SHEAR 561 561 0 344 217 5
TOTAL
MODEL 4060 4058 2 2576 1484 30
CUMULATIVE REACTION:
FORCE X FORCE Y
-0.47414D-09 -0.13111D+06
STARTING OF YIELDING OF #8 REINFORCING BARS
STEP 80 ITERATIONS 1
GROUP
NAME PLAST PRV. PL CRITIC
PLAST
NEW
PRV.PL
NEW
CRITIC
NEW
BEAM 43 0 0 4 0 0
REBAR 5 0 0 5 0 0
STIRRUPS 8 0 0 0 0 0
CRUSHING 36 0 0 3 0 0
TOTAL
MODEL 56 0 0 9 0 0

Rijkswaterstaat Centre for Infrastructure
Validation of the Guidelines for Nonlinear Page 99 of 105
Finite Element Analysis of Concrete Structure Issued: 15 June 2017
Part: Reinforced beams Version: 1.0
RTD: 1016-3A: 2017 Status: Final
CRACKING LOGGING SUMMARY
GROUP
NAME CRACK OPEN CLOSED ACTIVE INACTI ARISES
BEAM 4308 4306 2 2957 1351 19
CRUSHING 182 182 0 153 29 1
SHEAR 610 610 0 420 190 4
TOTAL
MODEL 4308 4306 2 2957 1351 19
CUMULATIVE REACTION:
FORCE X FORCE Y
0.39439D-09 -0.14844D+06
CRUSHING OF CONCRETE
STEP 88 ITERATIONS 1
GROUP
NAME PLAST PRV. PL CRITIC
PLAST
NEW
PRV.PL
NEW
CRITIC
NEW
BEAM 84 0 0 6 0 0
REBAR 34 0 0 1 0 0
STIRRUPS 11 0 0 0 0 0
CRUSHING 74 0 0 6 0 0
TOTAL
MODEL 129 0 0 7 0 0
CRACKING LOGGING SUMMARY
GROUP
NAME CRACK OPEN CLOSED ACTIVE INACTI ARISES
BEAM 4572 4570 2 3037 1535 42
CRUSHING 266 266 0 210 56 15
SHEAR 642 642 0 394 248 3
TOTAL
MODEL 4572 4570 2 3037 1535 42
CUMULATIVE REACTION:
FORCE X FORCE Y
-0.91938D-09 -0.15468D+06
PEAK LOAD
STEP 98 ITERATIONS 17
GROUP
NAME PLAST PRV. PL CRITIC
PLAST
NEW
PRV.PL
NEW
CRITIC
NEW
BEAM 59 60 0 2 46 0
REBAR 40 1 0 1 1 0
STIRRUPS 16 3 0 0 3 0
CRUSHING 43 59 0 0 46 0
TOTAL
MODEL 115 64 0 3 50 0
CRACKING LOGGING SUMMARY
GROUP
NAME CRACK OPEN CLOSED ACTIVE INACTI ARISES
BEAM 5051 5048 3 2923 2128 72
CRUSHING 428 427 1 302 126 23
SHEAR 708 708 3 399 309 8
TOTAL
MODEL 5051 5048 3 2923 2128 72
CUMULATIVE REACTION:
FORCE X FORCE Y
0.43315D-09 -0.16023D+06
6.5 Application of safety formats Model Code 2010 (fib, 2013)
As proposed by the Model Code 2010 (fib, 2013), safety formats for non-linear finite
element analyses include three numerical methods denoted as GRF (Global Resistance
Factor method), PF (Partial Factor method) and ECOV (Method of Estimation of a

Rijkswaterstaat Centre for Infrastructure
Validation of the Guidelines for Nonlinear Page 100 of 105
Finite Element Analysis of Concrete Structure Issued: 15 June 2017
Part: Reinforced beams Version: 1.0
RTD: 1016-3A: 2017 Status: Final
Coefficient of Variation of resistance). Application of safety formats requires a total of
4 non-linear analyses. In Table 6-4 till Table 6-6 mechanical properties applied in the
non-linear analyses are summarized.
Table 6-4: Case RB3A. Constitutive model parameters for concrete
fc
(N/mm2)
fct
(N/mm2)
Ec
(N/mm2)
GF
(Nmm/mm2)
GC
(Nmm/mm2)
Mean measured 31.20 2.44 31297.49 Var. 0.095 33.901
Characteristic 23.20 1.71 28382.42 Var. 0.090 32.140
Mean GRF 19.72 2.19 26900.34 Var. 0.088 31.214
Design 15.47 1.14 26602.86 Var. 0.084 29.878
Table 6-5: Case RB3A. Constitutive model parameters for reinforcing bars #8
(mm)
As
(mm2)
fy
(N/mm2)
ft
(N/mm2)
Es
(N/mm2)
εsy
Mean measured 25.4 471 414.00 500.00 200000 0.00207
Characteristic 25.4 471 374.98 452.87 200000 0.00187
Mean GRF 25.4 471 412.48 498.16 200000 0.00206
Design 25.4 471 326.07 393.80 200000 0.00163
Table 6-6: Case RB3A. Constitutive model parameters for reinforcing bars #3
(mm)
As
(mm2)
fy
(N/mm2)
ft
(N/mm2)
Es
(N/mm2)
εsy
Mean measured 9.5 71 414.00 500.00 200000 0.00207
Characteristic 9.5 71 374.98 452.87 200000 0.00187
Mean GRF 9.5 71 412.48 498.16 200000 0.00206
Design 9.5 71 326.07 393.80 200000 0.00163
In Figure 6-22 the load-deflection curves obtained with the mean measured,
characteristic, mean (GRF) and design values of material strengths, calculated
according to Model Code 2010 (fib, 2013) are shown. The peak loads are defined as
the load values for which the ultimate strain of #8 rebars, assumed to be 5×10⁻²
, is
reached.

Rijkswaterstaat Centre for Infrastructure
Validation of the Guidelines for Nonlinear Page 101 of 105
Finite Element Analysis of Concrete Structure Issued: 15 June 2017
Part: Reinforced beams Version: 1.0
RTD: 1016-3A: 2017 Status: Final
Figure 6-22: Case RB3A. Load-deflection curves obtained with mean measured,
characteristic, mean (GRF) and design values of material strengths
The RB3A beam was analyzed with a use of the analytical methods for sectional
analysis and numerical procedures proposed for NLFE analysis. The results of the
analyses are shown in Figure 6-23. In this comparison, the design values of the beam
resistance are expressed in terms of a percentage of the experimental ultimate value of
applied load.
Figure 6-23: Case RB3A. Analytical and numerical design values of beam resistance
expressed in terms of a percentage of the experimental ultimate value of applied load,
kNPExp 7.155
0
10
20
30
40
50
60
70
80
90
100
PR
d/P
EX
P(%
)

Rijkswaterstaat Centre for Infrastructure
Validation of the Guidelines for Nonlinear Page 102 of 105
Finite Element Analysis of Concrete Structure Issued: 15 June 2017
Part: Reinforced beams Version: 1.0
RTD: 1016-3A: 2017 Status: Final
In Table 6-7, the design values of beam resistance, expressed in terms of applied load
PRd, obtained from numerical and analytical procedures are summarized.
Table 6-7: Case RB3A. Values of design beam resistance, expressed in terms of
applied load PRd
Exp. PRd (EC2)
PRd
(MC2010 -
LoA I)
PRd
(MC2010 -
LoA II)
PRd
(MC2010 -
LoA III)
PRd
GRF
PRd
PF
PRd
ECOV
No
Safety
Formats
(kN) (kN) (kN) (kN) (kN) (kN) (kN) (kN) (kN)
155 85.88 57.67 69.15 97.65 110 114 119 137
6.6 Parametric study on crack models
A parametric study, with different values of parameters of the concrete constitutive
model, such as the crack model and fracture energy of concrete in tension, was
conducted. In Table 6-8 the material parameters used in NLFE analyses performed for
the parametric study are listed. Analyses 1 to 3 refer to the analyses with varying
values of material parameters. All the analyses were carried out with the mean
measured values of material strengths. Parabolic law in compression and exponential
law in tension were used for concrete, whereas steel was modelled with the elasto-
plastic law with hardening.
The analyses were carried out in load-control with arc-length control. A variable
Poisson ratio was adopted for all analyses.
For all analyses a limit value of the reduction of the compressive strength of concrete
due to lateral cracking was adopted as:
6.0,
min, cm
redc
f
fs
The effect of the applied values of the fracture energy of concrete in tension on the
beam response was investigated by considering the formulation proposed by Model
Code 1990 (CEB-FIP, 1993) and the Model Code 2010 (fib, 2013).The fracture energy
of concrete in compression was considered for all analyses equal to 250GF (Nakamura
et al. 2001).
For the Total Strain fixed crack model, the aggregate size based shear retention was
defined. According to this model, the shear stiffness of a crack diminishes together
with opening of the crack until the value of the normal crack strain reaches the size of
half the mean aggregate size. This implies loss of contact between crack planes. The
linear decay of shear stiffness further depends on the crack bandwidth value h. The
complete formulation is:
hd
n
aggr
21
In Figure 6-24 the load-deflection curves resulting from the parametric study are
plotted. The peak load values are reported in Table 6-8.
Table 6-8: Case RB3A. Data used for the parametric study
Analysis Total strain
crack model Limit to s GF GC
Peak load value
(kN)
Analysis 1 rotating 0.6 MC2010 250 GF 137
Analysis 2 rotating 0.6 MC1990 250 GF 133
Analysis 3 fixed 0.6 MC2010 250 GF 151

Rijkswaterstaat Centre for Infrastructure
Validation of the Guidelines for Nonlinear Page 103 of 105
Finite Element Analysis of Concrete Structure Issued: 15 June 2017
Part: Reinforced beams Version: 1.0
RTD: 1016-3A: 2017 Status: Final
Figure 6-24: Case RB3A. Load-deflection curves (Analysis 1 to 3)
The crack model and the mechanical properties used in Analysis 1 were chosen for the
safety formats to predict the design value of beam resistance from NLFE analyses.
As expected, since the beam fails in a mix mode due to shear and bending after the
yielding of the #8 reinforcing bars and stirrups, the peak loads and the failure modes
observed from NLFE analyses are not heavily dependent on the values of the fracture
energy of concrete in tension. The fixed crack model provide a stiffer response after the
yielding of #8 bars as well as after the crushing of concrete than the analyses with the
applied rotating crack orientation.
6.7 Concluding remarks
The beam RB3A tested by Grace has the same overall dimensions as the previous
beam RB3. The only difference consists of wider spacing of stirrups of 457mm in the
present case. The beam was also subjected to the same loading scheme. The tested
beam exhibited a shear failure mode with the experimental ultimate value of applied
load equal to kNPExp 7.155 .
Experimental ultimate value of beam RB3A, having a lower ratio of transversal
reinforcement than beam RB3, is higher than the experimental ultimate value of beam
RB3. It is in conflict with the results of NLFEA and seems to be physically unrealistic
because the material properties of concrete and steel as given in the reference (Grace,
2001) are the same for both beams.
From the analytical calculations based on sectional analysis it was concluded that beam
RB3A fails due to shear after yielding of stirrups. The design resistance of the beam is
evaluated using expression from Eurocode 2 (CEN, 2005) and the Model Code 2010
through the Levels of approximation approach (fib, 2013). The highest value of design
shear resistance from the analytical solution is computed with the most refined level III
of approximation and equals to kNPRd 65.97 . The design value of shear resistance
calculated with LoA III is close, yet marginally lower than the load the would have
otherwise led to failure in flexure.
The peak value of the applied load obtained with NLFEA, carried out with the mean
measured value of material strengths, is equal to 137 kN. The beam failed in a mix
0
20
40
60
80
100
120
140
160
180
0 50 100 150 200 250 300
Load
(k
N)
Deflection (mm)
Analysis 1
Analysis 2
Analysis 3
Pexp=155.7 kN

Rijkswaterstaat Centre for Infrastructure
Validation of the Guidelines for Nonlinear Page 104 of 105
Finite Element Analysis of Concrete Structure Issued: 15 June 2017
Part: Reinforced beams Version: 1.0
RTD: 1016-3A: 2017 Status: Final
failure mode due to shear and bending after yielding of the #8 reinforcing bars and
stirrup. The peak loads are defined as the load values for which the ultimate strain of
#8 rebars, assumed to be 5×10⁻²
,is reached.
The Model Code 2010 (fib, 2013) safety formats for non-linear finite element analyses
were employed to determine the design value of the beam resistance. The design value
of the beam resistance obtained with the safety formats methods is higher than the
design value of the beam resistance calculated with analytical approach. The maximum
value resulting from the ECOV method equals to kNPRd 119 .
Because of the fact that the beam failed after yielding of #8 bars and stirrups, the
failure mode is not highly dependent on the crack model, the concrete tensile strength
and the fracture energy of concrete in tension.

Rijkswaterstaat Centre for Infrastructure
Validation of the Guidelines for Nonlinear Page 105 of 105
Finite Element Analysis of Concrete Structure Issued: 15 June 2017
Part: Reinforced beams Version: 1.0
RTD: 1016-3A: 2017 Status: Final
References
Bresler, B. & Scordelis, A.C. (1963), "Shear strength of reinforced concrete beams", J. Am. Concr. Inst. 60(1), 51–72.
CEB-FIP Model Code 1990. (1993), Bullettin d’Information n° 213/214. Thomas
Telford.
CEB Bulletin No. 237 (1997), "Concrete Tension and Size Effects - Utilisation of
concrete tension in structural concrete design and relevance of size effect -
Contributions from CEB Task Group 2.7", Comite Euro-International du Beton (CEB),
Lausanne, Switzerland.
CEN (2005), Eurocode 2 - Design of concrete structures - Part 1-1: General rules and
rules for buildings, EN 1992-1-1, Brussels: CEN.
Collins, M.P. & Kuchma D. (1999), "How Safe Are Our Large, Lightly Reinforced
Concrete Beams, Slabs, and Footings?" ACI Struct. Journal 96(4), 482-490.
fib (2013), fib Model Code for Concrete Structures 2010, Ernst & Sohn.
Grace, N.F. (2001), "Strengthening of Negative Moment Region of Reinforced
Concrete Beams Using Carbon Fiber-Reinforced Polymer Strips", ACI Struct. Journal
98(3), 347-358.
Muttoni, A. & Ruiz, M.F. (2012), "Levels-of-Approximation Approach in Codes of
Practice", Structural Engineering International, 22, 190-194.
Nakamura, H. & Higai T. (2001), "Compressive Fracture Energy and Fracture Zone
Length of Concrete" in "Modeling of Inelastic Behavior of RC Structures under
Seismic Loads", Benson P. Shing (editor), ASCE J. Str. Eng., 471-487, Benson P.
Shing.
Oliver, J. (1989), "A consistent characteristic length for smeared cracking models",
International Journal for numerical Methods in Engineering, 28, 461- 474
Selby R.G., Vecchio F.J. (1993). “Three-dimensional Constitutive Relations for
Reinforced Concrete”, Tech. Rep. 93-02, Univ. Toronto, dept. Civil Eng., Toronto,
Canada.
Vecchio, F.J. & Shim W. (2004), "Experimental and Analytical Reexamination of
Classic Concrete Beam Tests", J. Struct. Engrg. ASCE 130(3), 460-469.
Vecchio F. J. & Collins M. P. (1986), "The modified compression-field theory for
reinforced concrete elements subjected to shear", ACI Journal 83, 219-231
Vervuurt, A.H.J.M. & Leegwater, G.A. (2008), “Workshop on the assessment of the
shear strength of concrete structures”, TNO report 2008-D-R0010.