Validation of Origin-Destination Data from Bluetooth Re ...
17
Chitturi, Shaw, Campbell and Noyce Paper No: 14 - 0223 Validation of Origin-Destination Data from Bluetooth Re-Identification and Aerial Observation Madhav V. Chitturi* Associate Researcher University of Wisconsin Traffic Operations & Safety Laboratory B243 Engineering Hall, 1415 Engineering Drive, Madison, WI 53706 Phone: (608) 890-2439, Fax: (608) 262-5199 Email: [email protected] John W. Shaw Researcher University of Wisconsin Traffic Operations & Safety Laboratory B243 Engineering Hall, 1415 Engineering Drive, Madison, WI 53706 Phone: (414) 227-2150 Email: [email protected] John R. Campbell IV Traffic Analysis and Design, Inc. N36 W7505 Buchanan Court, Cedarburg, WI 53012 Phone: (414) 350-3256, Fax: (262) 377-1845 Email: [email protected] David A. Noyce Professor 1204 Engineering Hall, 1415 Engineering Drive, Madison, WI 53706 Phone: (608)265-1882, Fax: (608)262-5199 Email: [email protected] Word Count (4837+ 1 Figure×250 +7 Tables×250) = 6837 words * Corresponding Author TRB 2014 Annual Meeting Paper revised from original submittal.
Transcript of Validation of Origin-Destination Data from Bluetooth Re ...

Chitturi, Shaw, Campbell and Noyce Paper No: 14 - 0223
1
Validation of Origin-Destination Data from Bluetooth Re-Identification and Aerial Observation
Madhav V. Chitturi* Associate Researcher
University of Wisconsin Traffic Operations & Safety Laboratory B243 Engineering Hall, 1415 Engineering Drive, Madison, WI 53706
Phone: (608) 890-2439, Fax: (608) 262-5199 Email: [email protected]
John W. Shaw Researcher
University of Wisconsin Traffic Operations & Safety Laboratory B243 Engineering Hall, 1415 Engineering Drive, Madison, WI 53706
Phone: (414) 227-2150 Email: [email protected]
John R. Campbell IV Traffic Analysis and Design, Inc.
N36 W7505 Buchanan Court, Cedarburg, WI 53012 Phone: (414) 350-3256, Fax: (262) 377-1845
Email: [email protected]
David A. Noyce Professor
1204 Engineering Hall, 1415 Engineering Drive, Madison, WI 53706 Phone: (608)265-1882, Fax: (608)262-5199
Email: [email protected]
Word Count (4837+ 1 Figure×250 +7 Tables×250) = 6837 words
* Corresponding Author
TRB 2014 Annual Meeting Paper revised from original submittal.

Chitturi, Shaw, Campbell and Noyce Paper No: 14 - 0223
2
ABSTRACT
Vehicle re-identification using Bluetooth (BT) signal data has emerged as an effective and economical means for collecting traffic data including Origin Destination (OD) information which is crucial for transportation planning. Direct vehicle tracking based on Time-Lapse Aerial Photography (TLAP) is also increasingly used for OD studies. Neither technique has previously been validated, so the objective of this study was to validate ODs generated using both techniques against a “ground-truth” OD. Traffic volume, Bluetooth- and TLAP-based OD data collected at an interchange in Madison, Wisconsin were used in this study. Significant variability (2.3% to 7.2%) in Bluetooth match rates were observed for the 12 OD pairs of the interchange. Uniproportional scaling of the sample Bluetooth OD (using average detection rate) resulted in poor fit to the true OD, but biproportional factoring (Fratar/Furness procedure) resulted in about 85% of the movements having GEH less than 5. Combining Bluetooth data from multiple days resulted in a better fit than using a single day’s data. The analysis showed that Bluetooth can be used to obtain representative OD of an access-controlled network for planning applications. TLAP sample OD data was scaled using an origin-specific factor and resulted in reasonable fit to the true OD. Biproportional factoring resulted in a better fit with 100% of the movements having a GEH less than 5. Therefore, biproportional factoring is also recommended for TLAP data.
TRB 2014 Annual Meeting Paper revised from original submittal.

Chitturi, Shaw, Campbell and Noyce Paper No: 14 - 0223
3
INTRODUCTION Over the last few years, Bluetooth (BT) signal re-identification has emerged as a popular and economical option for several transportation applications including travel times, route choice, border crossing wait times, and Origin-Destination (OD) studies. In 2008, Wasson, Studevant and Bullock were the first to report using Bluetooth to track vehicles, pedestrians, and wait times at airport security lines (1). The University of Maryland’s Center for Advanced Transportation Technology developed a portable Bluetooth monitoring system in 2008 (2). Although Bluetooth has been used for completing several OD studies, to date no research has validated its use for estimating OD matrices by comparing Bluetooth outputs with a true OD based on counts. Sun et al. presented a video based methodology for validating a Bluetooth based OD (3), but actual validation was not performed. Blogg et al. compared Bluetooth based OD to OD based on manual video tracking of licenses and automatic license plate recognition (ALPR) and found them to be similar (4). Conversely, Corradino Group compared Bluetooth with ALPR for an external OD study and found that Bluetooth OD trip table was not similar to ALPR (5). Vehicle tracking with Time-Lapse Aerial Photography (TLAP) is also increasingly used for performing OD studies, but to the authors’ best knowledge no study has validated its use for OD studies. Therefore, the objective of this research is to validate the Bluetooth and TLAP methods for performing OD studies. LITERATURE REVIEW Bluetooth is a short range wireless telecommunications technology originally developed in the mid 1990s by Dr. Jaap Haartsen for the Ericsson company. A Bluetooth traffic data collection system consists of multiple Bluetooth readers across a transportation network. Readers scan for Bluetooth devices that are in inquiry mode. When a device is detected the reader records the MAC address and detection timestamp. After adjusting for multiple detections of the same MAC at a single site, addresses presumed to be associated with vehicles are then matched (re-identified) with data from other locations. Matches not relevant to the study (e.g. due to unreasonably long travel times) are then filtered out of the data set. Depending on study objectives and the physical arrangement of field devices, end products include travel times, origin-destination, and route choice data. In principle, similar information can be gleaned from other types of wireless devices (such as WiFi), but as of 2013 most commercially-available detection products are based on Bluetooth. Bluetooth traffic data collection is being used for varied applications including travel time estimation, travel time reliability, OD studies, and route choice. OD is the focus of this paper, therefore literature addressing OD related topics is summarized in this section. Alberta Ministry of Transportation used Bluetooth devices to perform OD studies in Red Deer and Calgary, Canada in 2009 (Steel and Kilburn, 2011) (6). Pennsylvania DOT commissioned one of the largest OD studies to date, with 146 Bluetooth units on 51 miles of I-95 (including 38 interchanges) for a period of 28 days (7). Other OD studies performed using Bluetooth devices include Fort Lauderdale, Florida (8) and Charleston, South Carolina (9). Yucel et al. used Bluetooth technology for estimating OD matrix and corridor travel times in Ankara, Turkey (10). Barcelo et al. studied the use of Bluetooth based data for travel time forecasting and estimating time-dependent OD matrices using Kalman filtering procedures (11). Carpenter et al. (12) described an analytic approach for developing route specific OD tables using Bluetooth data collected from a 15 mile corridor in Jacksonville, Florida. The proposed algorithm not only considered the first and last location of a trip but also the intermediate locations to preserve the route choice information. In order to estimate the travel volumes between each origin and destination all the cells in the OD matrix obtained using Bluetooth data were multiplied by a constant expansion factor (16.29, which is inverse of the average Bluetooth penetration rate of 6.135% in that study). The authors recommended that expansion factor should be researched
TRB 2014 Annual Meeting Paper revised from original submittal.

Chitturi, Shaw, Campbell and Noyce Paper No: 14 - 0223
4
further and possibly different expansion factors should be used to capture the potential variation in Bluetooth penetration rates in the study area. Sun et al. describe a methodology for validation of Bluetooth data for OD studies using non-aggregated video data (3). Human matching of video images using license plate numbers and vehicle features such as make, model and color was used to track approximately 1,000 vehicles at a special event. The focus of the paper was on the validation methodology and not inference; thus no statistical testing was performed to actually perform the validation. Blogg et al. describe the use of Bluetooth detection units for travel time and OD studies in Brisbane, Australia (4). Multiple OD trials were performed and Bluetooth data were found to be comparable to automated license plate recognition (ALPR) and manual video-based OD data. A simple two step methodology was used to expand the sample to volume, but the authors conclude that the expansion methodology can be improved. The Corradino Group performed an external OD study in the Tidewater region for the Virginia Department of Transportation using Bluetooth and ALPR (5). Bluetooth MAC IDs which were observed once were categorized as external-internal or internal-external (E-I/I-E) trips. Furthermore, long external-external trips were split into two E-I/I-E trips. Trip tables were produced for different times of day. The Bluetooth and ALPR OD tables were similar in that the same cells had non-zero values, but the percent mean squared error (PRMSE) was 250%. The Bluetooth OD was biproportionally factored and the resultant table had a PRMSE of 86%. The authors concluded that the Bluetooth OD table for external trips was discouraging, but recommended additional research into using Bluetooth data for OD studies. STUDY DESCRIPTION Site The OD validation study was conducted for the Wisconsin Department of Transportation (WisDOT) at the Park Street interchange with the Beltline freeway (US 12/18) in Madison, Wisconsin (shown in Figure 1). The interchange is a variation of a partial cloverleaf interchange and each exit/entry movement has its own ramp. Consequently, at this location it is possible to determine the OD pattern simply by counting ramp volumes. Redundant directional traffic volume data was also collected on each Park Street approach using portable pneumatic tube counters, and on each freeway approach using Wavetronix radar counters adapted for portable use (both roadways carry high traffic volumes). Volumes were checked and balanced to establish the “ground-truth” OD baseline. Bluetooth and traffic volume counts at the Park St interchange on the Beltline highway were obtained for a one week period in July 2012. Traffic volume data was collected by WisDOT staff. Bluetooth data was collected by Traffic Analysis and Design, Inc. (TADI) using equipment supplied by Traffax, Inc. Aerial imaging using helicopter-mounted high-resolution digital cameras was performed by SkyComp Inc. for the Tuesday PM peak (4 PM – 5 PM) of the same week. Configuration The type of OD information that can be obtained from a Bluetooth study is dependent on the physical configuration of the roadway system, the number of Bluetooth readers that are deployed, and their physical placement. In this document we use the term “open system” to refer to a Bluetooth deployment on a facility where one or more roadway access points have significant traffic volumes that are unmonitored (lacking Bluetooth data, traffic volume data, or both). Conversely, a “closed” system is one where a Bluetooth detector and a traffic counter are functional at every access point (excepting access points with negligible volume). OD estimates from open
TRB 2014 Annual Meeting Paper revised from original submittal.

Chitturi, Shaw, Campbell and Noyce Paper No: 14 - 0223
5
systems carry more uncertainty than those collected in closed systems, but collecting closed-system data usually requires more field equipment.
(a) Locations of Bluetooth Detectors
(b) Locations of Volume Counts
FIGURE 1 Locations of Bluetooth Detectors and Volume Counts Base images: Google Earth
Tube counters
Wavetronix
TRB 2014 Annual Meeting Paper revised from original submittal.

Chitturi, Shaw, Campbell and Noyce Paper No: 14 - 0223
6
Detector Locations Bluetooth observations were processed to obtain trips between each origin and destination using Traffax BluSTATS software. Figure 1a shows the locations of the Bluetooth units. Ovals identify two locations where detectors were placed close together to evaluate the ability of a highway-shoulder- mounted unit to observe both travel directions. During processing, data from these pairs were combined and any overlapping detections were filtered using BlueSTATS. Three “exclusion units” (identified by triangles) were fitted with low-power receivers to isolate side-road traffic from vehicles on the freeway mainline. In Figure 1b, black and yellow lines indicate approximate locations of tube counters and Wavetronix units, respectively. High-resolution aerial images were collected from a helicopter at the rate of 1 frame per second. The vendor (SkyComp) then manually tracked vehicles frame-by-frame to develop the OD sample. METHODOLOGY The objective of this research is to validate the Bluetooth and TLAP methods for performing OD studies. In order to compare the OD matrices obtained from different methods, the OD samples need to be scaled (“grossed up”) to the population before they can be compared. Uniproportional Scaling (using a single scaling factor for all OD pairs) and Biproportional Matrix Balancing were two approaches that were used to scale the sample to the population. The GEH formula was used to perform the comparison between the matrices. This section describes biproportional matrix balancing and the GEH formula. Biproportional Matrix Balancing Biproportional Matrix Balancing (often referred to as the Fratar or Furness procedure) is a well-established method for factoring-up an OD matrix (13). In the biproportional method each row and column of the OD matrix is assigned a scaling factor. Each “sample” entry in the OD matrix is then multiplied by the corresponding row (origin) and column (destination) scaling factors to produce the “population” estimate. Scaling factors are adjusted iteratively until the total number of trips associated with each origin and each destination matches the total observed traffic volumes to and from that zone as closely as possible. In order to perform biproportional matrix balancing, total entering and exiting volumes need to be observed in the field at the zone boundaries. Because the procedure is multiplicative, its main limitation is that any OD pair that has zero trips in the sample will remain zero after expansion (unless the analyst manually overrides a zero with a different number based on judgment). We implemented the biproportional matrix balancing process in a spreadsheet and used the Excel Solver engine to adjust the row and column scaling factors, with an objective of minimizing the sum of the squared difference between the factored row and column totals and the corresponding observed directional traffic volumes. Interchange approach volumes were used as the volume targets.
(1)
min( ∑ ∑
+ ∑
∑ ) subject to: Fi, Fj > 0 (2)
Where:
= Sampled trips from origin i to destination j
= Grossed-up trips from origin i to destination j
= Total volume observed exiting origin i = Total volume observed entering destination j
TRB 2014 Annual Meeting Paper revised from original submittal.

Chitturi, Shaw, Campbell and Noyce Paper No: 14 - 0223
7
= Fratar factor for origin i = Fratar factor for destination j
The GEH Formula The authors selected the GEH formula to compare the “ground-truth” OD matrix with the ODs produced from Bluetooth and aerial observation data. Whilst Root-Mean-Square Error (RMSE) is frequently used to compare traffic volumes in travel demand models, RMSE can be problematic when applied to corresponding OD pairs from two different matrices. This is because of the wide range of values typically encountered in highway volumes. For example, if the traffic volume on a minor ramp is 40 veh/hr in one OD matrix and its counterpart is 50 veh/hr in the other matrix, this will have the same effect on RMSE as a mainline external-station volume that is 4000 veh/hr in one matrix and 5000 veh/hr in the other, even though the importance to the system as a whole is clearly quite different. To address this issue, Geoff E. Havers of the Greater London Council (14) proposed a heuristic measure of volume difference now known as the GEH formula. The British Highways Agency Design Manual for Roads & Bridges (DMRB) describes it as “a form of Chi-squared statistic that incorporates both relative and absolute errors [and] can be calculated for individual links or groups of links.” (15). In the United Kingdom it is accepted as “a standard measure of the ‘goodness of fit’ between [two sets of traffic] flows. Unlike comparing flows using percentage difference, the GEH statistic places more emphasis on larger flows than on smaller flows.”(16)
The GEH formula for hourly traffic flows is:
√
Where: = GEH for hourly volume = “Ground-Truth” OD volume = Estimated OD volume based on
the Bluetooth or Aerial sample
(3)
Low GEH values indicate similarity between the values, while high GEH indicates greater difference. Table 2 shows the rule-of-thumb GEH interpretations often used for comparing observed and modeled values in travel demand foresting models; we applied similar interpretations to the differences between the “ground truth” OD and the ODs generated by Bluetooth and TLAP data (GEH was also used by Blogg et al. to compare Bluetooth-based ODs with ALPR and video matching). In travel demand models, DMRB requires the GEH to be less than 5 for at least 85% of the observations.
TABLE 1 Interpretations of GEH values from the Saturn travel demand forecasting software user’s manual (14).
Value GEH = 1.0 GEH = 2.0 GEH = 5.0 GEH =10.0
Comment “Excellent” “Good” “Acceptable” “Rubbish!”
Example 1 ±65 in 4,000 ±130 in 4,000 ±325 in 4,000 ±650 in 4,000
Example 2 ±25 in 500 ±45 in 500 ±120 in 500 ±250 in 500
To preserve the typical GEH acceptance thresholds (“5 is OK”, “10 is not”) when grossing-up daily traffic volumes (e.g. AADT), we used the approximation that peak hourly volume is on the order of 10% of the daily volume. In this case the “Daily GEH” formula becomes:
TRB 2014 Annual Meeting Paper revised from original submittal.

Chitturi, Shaw, Campbell and Noyce Paper No: 14 - 0223
8
√
Where: = GEH for daily volume = “Ground-Truth” OD volume = Estimated OD volume based on
the Bluetooth or Aerial sample
(4)
In the text that follows we use GH and GD to refer to the hourly and daily computations, respectively.
GEH refers to the formulas and thresholds generally.
RESULTS COMPARISON Bluetooth and Volume Counts Table 2 compares the volume-based OD for the Tuesday PM peak (4 – 5 PM) with the Bluetooth (Bluetooth) sample data and Bluetooth capture rates for each OD pair. Significantly, Bluetooth
TABLE 2 OD Matrix from Volume Counts, Bluetooth Sample and Bluetooth Capture Rates (Tue PM)
OD Matrix (Volume Count
Data)
Destination
To N To S To E To W To All
Ori
gin
From N 761 513 667 1941
From S 176 246 247 669
From E 364 509 4580 5453
From W 370 888 4755 6013
From All 910 2158 5514 5494 14076
Bluetooth OD Sample
Destination
To N To S To E To W To All
Ori
gin
From N 20 37 33 90
From S 4 16 16 36
From E 18 15 204 237
From W 21 29 210 260
From All 43 64 263 253 623
Bluetooth Capture Rate
Destination
To N To S To E To W To All
Ori
gin
From N 2.6% 7.2% 4.9% 4.6%
From S 2.3% 6.5% 6.5% 5.4%
From E 4.9% 2.9% 4.5% 4.3%
From W 5.7% 3.3% 4.4% 4.3%
From All 4.7% 3.0% 4.8% 4.6% 4.4%
TRB 2014 Annual Meeting Paper revised from original submittal.

Chitturi, Shaw, Campbell and Noyce Paper No: 14 - 0223
9
capture rates varied from 2.3% to 7.2% (average 4.4%). Capture-rate variability was observed even for related OD pairs, for instance E to S was 2.9% and S to E was 6.5%. Several previous published studies have attempted to apply a uniform scaling factor to the OD sample, but the wide range of capture rates encountered in this compact study area casts doubt on that practice.
TABLE 3 Uniformly-Scaled Bluetooth OD and Comparison with Volume Counts (Tue PM)
Uniformly Scaled Bluetooth OD
Destination
To N To S To E To W To All
Ori
gin
From N
452 836 746 2033
From S 90
362 362 813
From E 407 339
4609 5355
From W 474 655 4745
5874
From All 972 1446 5942 5716 14076
GH of Uniformly Scaled Bluetooth vs Volume Count
Destination
To N To S To E To W Total
Ori
gin
From N 12.6 12.4 3.0 27.9
From S 7.4 6.6 6.6 20.6
From E 2.2 8.3 0.4 10.9
From W 5.1 8.4 0.1 13.6
Total 14.7 29.2 19.2 10.0 73.0
Note: Above and subsequent tables, the “Total” rows and columns indicate the sum of the individual GH observations, not the GH of the volume totals.
Uniproportional Scaling and Biproportional Matrix Balancing The Park Street interchange was chosen so that volume-based OD could be treated as “ground truth” and various approaches for grossing-up the Bluetooth sample could be tested. Table 3 shows the uniformly scaled Bluetooth OD (for Tuesday PM Peak) using the inverse of average Bluetooth detection rate (4.4%). GEH values comparing the two results are shown in the lower part of the table:
GH values range from 0.1 (a nearly perfect match) to 12.6 (a poor match) with an average of 6.1.
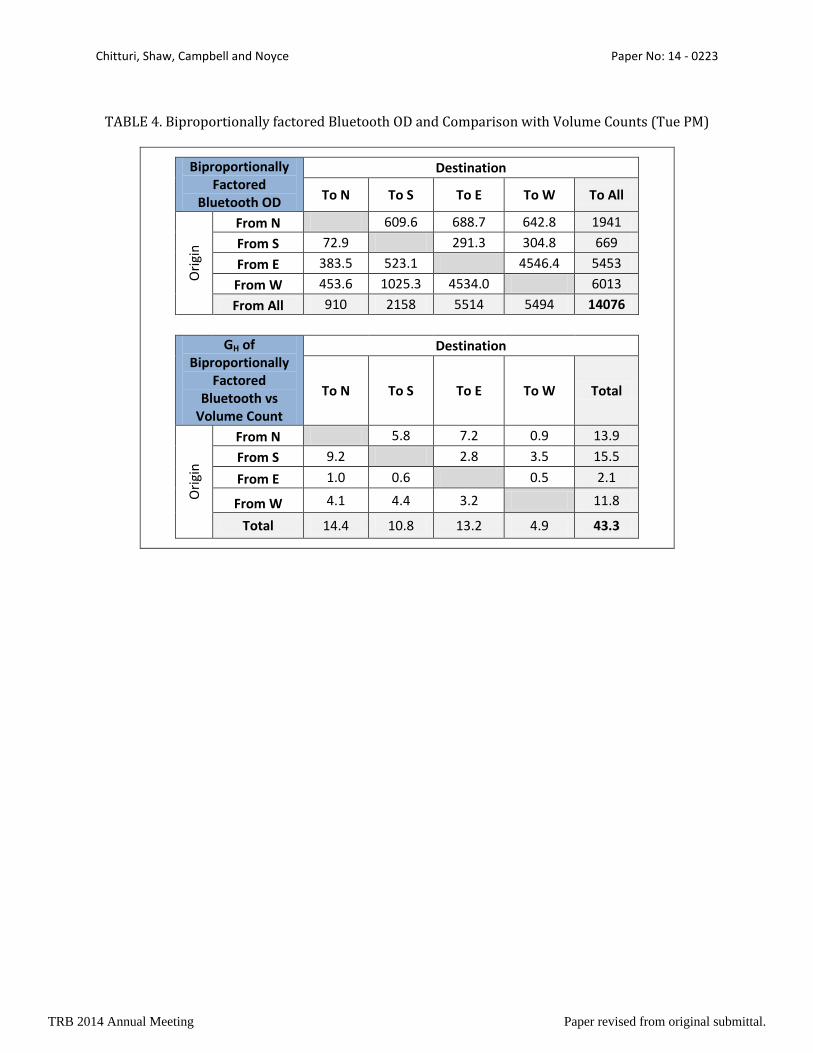
Amongst the 12 OD movements, eight have GH exceeding 5 and two have GH exceeding 10. Overall results of uniproportional scaling were unsatisfactory: only 33% of observations have GH less than 5. Moreover, since the uniformly-scaled Bluetooth OD did not match the true OD well at a single interchange, it is doubtful that uniform scaling would produce realistic OD tables for a larger geographical area. Therefore, uniproportional scaling is not recommended and an alternative method was sought. Biproportional factoring results are shown in Table 4:
The average GH is 3.6 with a minimum of 0.5 and a maximum of 7.2.
TRB 2014 Annual Meeting Paper revised from original submittal.

Chitturi, Shaw, Campbell and Noyce Paper No: 14 - 0223
10
Three of the twelve movements have GH exceeding 5. None exceed 10. Results from biproportional matrix balancing were considerably better than the uniproportional procedure. The number of movements with GH less than 5 increased from 33% to 75% and the average GH dropped from 6.1 to 3.6. Bluetooth Observation Duration When OD data is collected using methods such as driver intercept surveys or license plate matching, study costs increase in proportion to the duration of observation. This is not the case with Bluetooth data: once Bluetooth field sensors are installed the study duration can be extended at relatively low cost. Therefore, the effect of grouping multiple days of data was also explored. Data for Tuesday, Wednesday and Thursday PM peak (4 PM-5 PM) were combined. Bluetooth detections were summed and traffic volumes were averaged. Results are summarized in Table 5:
The average GH is 3.0 with a minimum of 1.2 and a maximum of 7.5. Eleven of the twelve movements had GH less than 5.
When the grouped data (Tue-Thur PM) is compared to Tuesday-only PM, the average GH reduced from 3.6 to 3.0 and the number of movements with GH less than 5 increased from 75% to 92%. Other Time Periods Similar analysis was performed for AM peak hours and for a 24-hour period. Using the Tuesday-Thursday combined data, AM peak GH averaged 2.5 with a minimum of 0.01 and a maximum of 6.0 (GH <5 for 83% of the movements). Using the Tuesday-Thursday combined data, 24-hour GD averaged 2.5 with a minimum of 0.9 and a maximum of 6.3 (GD< 5 for 92% of movements). Bluetooth Validation The evaluation indicates that the most reliable OD estimates can be obtained by combining data from several similar days and applying the biproportional procedure to expand the sample (which requires traffic counts at the zone boundaries). Barring equipment failure, when this method is used the results can be considered representative of true OD, with an expected GEH less than 5 on approximately 85% of movements. Under these conditions the use of Bluetooth to collect OD patterns can be considered valid for closed networks.
TRB 2014 Annual Meeting Paper revised from original submittal.
Chitturi, Shaw, Campbell and Noyce Paper No: 14 - 0223
11
TABLE 4. Biproportionally factored Bluetooth OD and Comparison with Volume Counts (Tue PM)
Biproportionally Factored
Bluetooth OD
Destination
To N To S To E To W To All O
rigi
n
From N 609.6 688.7 642.8 1941
From S 72.9 291.3 304.8 669
From E 383.5 523.1 4546.4 5453
From W 453.6 1025.3 4534.0 6013
From All 910 2158 5514 5494 14076
GH of Biproportionally
Factored Bluetooth vs
Volume Count
Destination
To N To S To E To W Total
Ori
gin
From N 5.8 7.2 0.9 13.9
From S 9.2 2.8 3.5 15.5
From E 1.0 0.6 0.5 2.1
From W 4.1 4.4 3.2 11.8
Total 14.4 10.8 13.2 4.9 43.3
TRB 2014 Annual Meeting Paper revised from original submittal.

Chitturi, Shaw, Campbell and Noyce Paper No: 14 - 0223
12
TABLE 5 OD Matrix from Volume Counts, Bluetooth Sample, Birpoportionally-factored Bluetooth OD and Comparison with Volume Counts (Tue-Thu PM)
OD Matrix (Volume Count
Data)
Destination
To N To S To E To W To All O
rigi
n
From N
794.3 586.3 701.7 2082
From S 213.0
256.7 281.7 751
From E 377.0 531.0
4570.3 5478
From W 367.0 838.7 4803.0
6009
From All 957 2164 5646 5554 14321
Bluetooth OD
Sample
Destination
To N To S To E To W To All
Ori
gin
From N
68 89 93 250
From S 18
41 36 95
From E 71 64
588 723
From W 63 84 557
704
From All 152 216 687 717 1772
Biproportionally
Factored Bluetooth OD
Destination
To N To S To E To W To All
Ori
gin
From N
662.1 663.5 756.7 2082
From S 116.8
324.0 310.5 751
From E 407.6 584.3
4486.4 5478
From W 432.6 917.6 4658.5
6009
From All 957 2164 5646 5554 14321
GH of
Biproportionally Factored
Bluetooth vs Volume Count
Destination
To N To S To E To W Total
Ori
gin
From N
4.9 3.1 2.0 10.0
From S 7.5
4.0 1.7 13.1
From E 1.5 2.3
1.2 5.0
From W 3.3 2.7 2.1
8.0
Total 12.3 9.8 9.1 5.0 36.2
TRB 2014 Annual Meeting Paper revised from original submittal.

Chitturi, Shaw, Campbell and Noyce Paper No: 14 - 0223
13
Aerial Photography and Volume Counts An OD sample based on tracking vehicles through Time-Lapse Aerial Photography (TLAP) was developed for Tuesday PM peak hour (4 PM-5 PM). In accordance with their previously-established procedures, a minimum of 150 vehicles from each origin were tracked to their destination by the TLAP vendor. Table 6 shows the volume-based “ground truth” OD matrix, TLAP sample and capture rates for each OD pair.
TABLE 6 OD Matrix from Volume Counts, TLAP Sample and Capture Rates (Tue PM)
OD Matrix (Volume Count Data)
Destination
To N To S To E To W To All
Ori
gin
From N
761 513 667 1941
From S 176
246 247 669
From E 364 509
4580 5453
From W 370 888 4755
6013
From All 910 2158 5514 5494 14076
TLAP OD Sample Destination
To N To S To E To W To All
Ori
gin
From N
58 55 39 152
From S 46
65 56 167
From E 19 15
134 168
From W 10 26 124
160
From All 75 99 244 229 647
TLAP Capture Rate Destination
To N To S To E To W To All
Ori
gin
From N
7.6% 10.7% 5.8% 7.8%
From S 26.1%
26.4% 22.7% 25.0%
From E 5.2% 2.9%
2.9% 3.1%
From W 2.7% 2.9% 2.6%
2.7%
From All 8.2% 4.6% 4.4% 4.2% 4.6%
Capture rates for each origin were computed using the total entering volume at each origin and the number of vehicles traced from each origin. Conceivably the sample OD can then be scaled-up using the inverse of sample rates for each of the origins. Using this approach, the TLAP sample OD was scaled and compared to the “ground truth” as shown in Table 7:
GH averaged 3.2 with a minimum of 0.3 and maximum of 11.4. Nine of twelve (75%) movements have GH <5. GH of two movements exceeds 5 and one exceeds 10.
Although the results were somewhat satisfactory, some GEH values are out of desirable bounds, so biproportonal factoring was explored to further improve the fit.
TRB 2014 Annual Meeting Paper revised from original submittal.

Chitturi, Shaw, Campbell and Noyce Paper No: 14 - 0223
14
TABLE 7 Origin Based Scaling of TLAP OD and Comparison with Volume Counts, Biproportionally Factored TLAP OD and Comparison with Volume Counts (Tue PM)
Origin-based Scaling of TLAP OD
Destination
To N To S To E To W To All O
rigi
n
From N 741 702 498 1941
From S 184 260 224 669
From E 617 487 4349 5453
From W 376 977 4660 6013
From All 1177 2205 5623 5072 14076
GH of Origin-based Scaling of TLAP Vs.
Volume Count
Destination
To N To S To E To W Total
Ori
gin
From N 0.7 7.7 7.0 15.4
From S 0.6 0.9 1.5 3.0
From E 11.4 1.0 3.5 15.9
From W 0.3 2.9 1.4 4.6
Total 12.3 4.7 10.0 11.9 38.9
Biproportionally Factored TLAP OD
Destination
To N To S To E To W To All
Ori
gin
From N 709.3 630.3 601.4 1941
From S 150.1 240.3 278.6 669
From E 429.3 409.7 4614.1 5453
From W 330.6 1039.0 4643.4 6013
From All 910 2158 5514 5494 14076
GH of Biproportionally
Factored TLAP Vs. Volume Count
Destination
To N To S To E To W Total
Ori
gin
From N 1.9 4.9 2.6 9.4
From S 2.0 0.4 1.9 4.3
From E 3.3 4.6 0.5 8.4
From W 2.1 4.9 1.6 8.6
Total 7.4 11.4 6.9 5.1 30.8
TRB 2014 Annual Meeting Paper revised from original submittal.

Chitturi, Shaw, Campbell and Noyce Paper No: 14 - 0223
15
Using observed entering and exiting volumes, biproportional factoring was applied to the TLAP sample matrix; results are shown in Table 7. When compared to the “one scaling factor per origin” procedure, average GH reduced from 3.2 to 2.6 and the maximum reduced from 11.4 to 4.9. The number of GH <5 was 100%. Therefore, biproportional factoring of the TLAP sample to population resulted in a very close match to the observed volume counts. The analysis validated using TLAP for performing the subject OD study.
CONCLUSIONS AND RECOMMENDATIONS The objective of this research was to validate the use of Bluetooth and aerial photography to perform OD studies. Traffic volume, Bluetooth detections and aerial photography data collected at an interchange in Madison, WI were used in this study. The configuration of the subject interchange is such that true OD can be obtained from volume counts alone. Significant variability in Bluetooth detection rates was observed for the 12 OD pairs at the interchange. The detection rates ranged from 2.3% to 7.2% with an average of 4.4% (for a PM peak hour). Several Bluetooth OD studies in the past have used a uniform scaling factor to estimate the population OD. When the average detection rate was used to perform uniform scaling of the sample OD to population and the GEH statistic was used to compare the scaled OD to volume counts, the resultant average GEH was 6.1 and number of movements with GEH less than 5 was only 33%, indicating a poor fit with the observed volumes. Considering that uniform scaling resulted in such a poor fit at one interchange, use of a uniform scaling factor is not recommended for Bluetooth OD studies. Biproportional factoring was explored as an alternative to scale the Bluetooth sample to population. The resultant OD (for the PM peak hour) had an average GEH of 3.6 and 75% of the movements had GEH less than 5, none had GEH greater than 10. Multiple days (Tue-Thu) of data were added for the PM peak hour and biproportionally factored. The resultant OD from multiple days of data had a GEH of 3.0 and 92% of the movements had GEH less than 5, none had GEH exceeding 10. Biproportional factoring was performed for AM peaks and 24 hr periods with resultant average GEH of 2.5 in both cases and 83% and 92% of movements had GEH less than 5 respectively. Therefore, it is recommended that for closed networks, entering and exiting volumes should be collected concurrently with the Bluetooth study and biproportional factoring should be performed on data from multiple days to obtain a population OD representative of the true OD. The above analysis shows that Bluetooth can be used for performing OD studies in closed networks. Given the observed variability in Bluetooth data, it is suggested that further research be performed to study the characteristics of Bluetooth data and how the sampling rate of individual OD pairs, or groups of similar OD pairs are influenced by site characteristics, traffic characteristics, and detector placement . Such relationships have the potential to be useful in methodologies for estimating volumes from raw Bluetooth data. About 150 vehicles were manually tracked from each origin to obtain aerial photography sample OD. Scaling the TLAP OD based on capture rate for each origin was evaluated using GEH. The average GEH was found to be 3.2 and 75% of the movements had GEH less than 5. Two exceeded GEH of 5 and one exceeded GEH of 10. Biproportionally factored TLAP OD had an average GEH of 2.6 and 100% of the movements had GEH less than 5. Therefore, biproportional factoring of TLAP sample OD is recommended to obtain an OD representative of the true OD. A biproportionally factored sample of 150 vehicles resulted in a representative OD for the subject interchange. Alternatively, the expansion process for TLAP data could be simplified by tracking a random sample
TRB 2014 Annual Meeting Paper revised from original submittal.

Chitturi, Shaw, Campbell and Noyce Paper No: 14 - 0223
16
of vehicles from each origin and holding the sampling rate constant for each origin (for example, tracking 10% of all vehicles). The Park Street pilot study findings indicate that for a closed network, after biproportional factoring the Time Lapse Aerial Photography (TLAP) sample had a better overall match to the "ground-truth" OD than the Bluetooth sample. This was mainly attributable to the relatively low penetration of discoverable Bluetooth devices in the study area, resulting in a higher sampling rate for the TLAP method. Nevertheless, the Bluetooth accuracy was satisfactory and factors such as study cost and feasibility also need to be considered. The physical area that can be covered using TLAP is limited by the number of aircraft (and high-resolution cameras) that can be deployed simultaneously, making it a viable option at the corridor level but probably infeasible at the regional level. TLAP data collection requires considerable logistical planning and favorable weather. In northern latitudes, winter light levels may be a limiting factor if local peak periods begin before sunrise or end after sunset. While TLAP provides an "audit trail" in the sense that the aerial images could be re-evaluated if the OD study findings are questioned, the tracking process currently involves a considerable amount of labor. Consequently TLAP studies generally must be limited to a relatively short time window, such as the peak hours of a pre-selected day. Bluetooth data collection is more flexible and the data collection cost can be expected to have a more-or-less linear relationship to the number of zones. BT detection is insensitive to weather and lighting, and it is relatively inexpensive to extend the study duration, reducing the risk of unintentionally using data from an "atypical" day. Bluetooth detectors deployed for a general study could also be left in place to collect data during a period with a special OD pattern, such as a major sporting event. In addition, Bluetooth data can be collected at all hours of the night and day to facilitate the development of off-peak and true full-day OD matrices, as well as hour-by-hour data to support Dynamic Traffic Assignment (DTA) models.
ACKNOWLEDGEMENTS This research was supported by the Wisconsin Department of Transportation and supervised by Larry Barta and Michael Hoelker of the Planning Division of Wisconsin Department of Transportation Southwest region. The authors also extend their thanks to Dr. Alan Horowitz of the University of Wisconsin-Milwaukee and Greg Jordan of SkyComp Inc. REFERENCES 1. Wasson J., J. Sturdevant & D. M. Bullock. Real-time travel time estimates using media access
control address matching. ITE Journal, 2008, June, p. 20–23. 2. Young S. Bluetooth traffic monitoring technology: Concept of operation & deployment
guidelines. University of Maryland Center for Advanced Transportation Technology, 2008. 3. Sun C., R.A. Rescot and S. Shrock. Use of Non-Aggregated Video Data for Bluetooth Validation.
Transportation Research Board 91st Annual Meeting, 2012. 4. Blogg M., C. Semler, M. Hingorani and R. Troutbeck. Travel time and origin-destination data
collection using Bluetooth MAC address readers. 33rd Australasian Transport Research Forum, Canberra, ACT, Australia, 2010.
5. Corradino Group. Tidewater Region External Origin and Destination Study. Prepared for Virginia Department of Transportation. 2011.
6. Steel P. and P. Kilburn. Using Bluetooth Technology to Monitor Traffic Patterns around Urban Centers in Alberta. 18th ITS World Congress, 2011.
7. Traffax. I-95 Pennsylvania Origin-Destination Study. http://www.traffaxinc.com/sites/default/files/I-95%20OD%20Study%20July%202011.pdf. Accessed August 1, 2013.
TRB 2014 Annual Meeting Paper revised from original submittal.

Chitturi, Shaw, Campbell and Noyce Paper No: 14 - 0223
17
8. RSG Inc. I‐75 & Palmetto Expressway Origin‐Destination Study. 2012. 9. Reiff R.M. Determination of Origin-Destination Using Bluetooth Technology. ITE Annual
Meeting, 2012 10. Yucel S., H. Tuydes-Yaman, O. Altintasi, M. Ozen. Determination of Vehicular Travel Patterns In
An Urban Location Using Bluetooth Technology. ITS America Annual Meeting and Expo, Nashville, 2013.
11. Barcelo 12. Carpenter C., M. Fowler and T.J. Adler. Generating Route-Specific Origin-Destination Tables
Using Bluetooth Technology. Transportation Research Record: Journal of the Transportation Research Board, 2308, Pages 96-102, 2012.
13. Fratar, T J, Voorhees, A M and Raff, M (1954). “Forecasting Distribution Of Interzonal Vehicular Trips By Successive Tl approximations,” Highway Research Board Proceedings Vol 33, pp 376-384.
14. Van Vliet, D (2013). “Saturn Software User’s Manual (v11.2)”, Chapter 15, pp 15-13. Epsom, Surrey, UK.
15. Highways Agency (1996), Design Manual for Roads & Bridges, Volume 12, Section 2, Chapter 4.4.42, pp 4/28 “Traffic Appraisal of Roads Schemes: Traffic Appraisal Advice: Validation Acceptability Guidelines.” Crown copyright.
16. Transport for London (2010), “Traffic Modelling Guidelines Version 3.0” Appendix III, pp 179. London, UK.
17. Guy, B & Fricker, J (2005). “Guidelines for Data Collection Techniques and Methods for Roadside Station Origin-Destination Studies,” pp 114-119. Publication FHWA/IN/JTRP-2005/27. Joint Transportation Research Program, Indiana Department of Transportation and Purdue University, West Lafayette, IN.
TRB 2014 Annual Meeting Paper revised from original submittal.