V9 Topological Analysis of Powertrains for Refuse ... · Technical University of Catalonia....
14
TOPOLOGICAL ANALYSIS OF POWERTRAINS FOR REFUSE- COLLECTING VEHICLES BASED ON REAL ROUTES PART II: HYBRID ELECTRIC POWERTRAIN F. SORIANO 1) * , M. MORENO-EGUILAZ 2) , J. ALVAREZ 3) and J. RIERA 4) 1) R&D Department of the Ros Roca Group, Av Cervera s/n, Tàrrega (Lleida) 25300, Spain 2) Center Innovation Electronics. Motion Control and Industrial Applications (MCIA). Technical University of Catalonia. Barcelona Tech., Rambla de Sant Nebridi 22, Terrassa 08222, Spain 3) Center for Engines and Heat Installation Research (CREMIT). Technical University of Catalonia. Barcelona Tech., Av. Diagonal 647, Barcelona 08028, Spain 4) Robotics and Industrial Informatics Institute (IRI). Technical University of Catalonia. Spanish National Research Council (CSIC), Llorens i Artigas 4-6, Barcelona 08028, Spain (Received date ; Revised date ;Accepted date ) * Please leave blank ABSTRACT— In this two-part paper, a topological analysis of powertrains for refuse-collecting vehicles (RCVs) based on simulation of different architectures (internal combustion engine, hybrid electric, and hybrid hydraulic) on real routes is proposed. In this second part, three different hybrid electric powertrain architectures are proposed and modeled. These architectures are based on the use of fuel cells, ultracapacitors, and batteries. A calculation engine, which is specifically designed to estimate energy consumption, respecting the original performance as the original internal combustion engine (ICE), is presented and used for simulations and component sizing. Finally, the overall performance of the different architectures (hybrid hydraulic, taken from the first paper part, and hybrid electric, estimated in this second part) and control strategies are summarized in a fuel and energy consumption table. Based on this table, an analysis of the different architecture performance results is carried out. From this analysis, a technological evolution of these vehicles in the medium- and long terms is proposed. KEY WORDS : Engines, Hybrid power systems, Energy management optimization, Drive cycle prediction, Refuse- collecting vehicles, Powertrain 1. INTRODUCTION Different factors, such as decline of fossil fuel reserves, high oil prices, energy security concerns, and climatic change, indicate that a progressive reduction in the use of ICEs in the transport sector is necessary. One of the most interesting alternatives is the introduction of devices that could use energy in a more rational way by storing energy during regenerative braking or when the ICE is working at high efficiency points. And assisting it when high power demands are required or when the ICE is working at low efficiency points. *Corresponding author. e-mail: [email protected] Considering these kinds of devices, several studies can be found in the literature. Different alternatives are described, with electric hybridization (Feroldi et al. 2009, Bauman et al. 2008, Khaligh et Zhihao 2010, Garcia et al. 2004, Araujo et al. 2014, Thoungtong et al. 2009, Camara et al. 2008, Li et al. 2012, M. Esfahanian et al. 2013, D.Chindamo et al. 2013) and hydraulic hybridization (Baseley et al. 2007, Filipi and Kim 2010, Kim and Filipi 2007, Wu et al. 2002, Wohlgemuth 2013, Surampudi 2009) being the most typical ones. The main goal of this paper is to perform a comparative study of different electric-based powertrain architectures in a refuse-collecting vehicle (RCV) for a real drive cycle. As the goal of the study is to contrast the efficiency of these hardware topologies and not to optimize the corresponding control strategies for each
Transcript of V9 Topological Analysis of Powertrains for Refuse ... · Technical University of Catalonia....

TOPOLOGICAL ANALYSIS OF POWERTRAINS FOR REFUSE-COLLECTING VEHICLES BASED ON REAL ROUTES
PART II: HYBRID ELECTRIC POWERTRAIN
F. SORIANO1) *, M. MORENO-EGUILAZ2), J. ALVAREZ3) and J. RIERA4)
1)R&D Department of the Ros Roca Group, Av Cervera s/n, Tàrrega (Lleida) 25300, Spain2)Center Innovation Electronics. Motion Control and Industrial Applications (MCIA). Technical University of
Catalonia. Barcelona Tech., Rambla de Sant Nebridi 22, Terrassa 08222, Spain 3)Center for Engines and Heat Installation Research (CREMIT). Technical University of Catalonia. Barcelona Tech.,
Av. Diagonal 647, Barcelona 08028, Spain 4)Robotics and Industrial Informatics Institute (IRI). Technical University of Catalonia. Spanish National Research
Council (CSIC), Llorens i Artigas 4-6, Barcelona 08028, Spain
(Received date ; Revised date ;Accepted date ) * Please leave blank
ABSTRACT— In this two-part paper, a topological analysis of powertrains for refuse-collecting vehicles (RCVs) based on simulation of different architectures (internal combustion engine, hybrid electric, and hybrid hydraulic) on real routes is proposed. In this second part, three different hybrid electric powertrain architectures are proposed and modeled. These architectures are based on the use of fuel cells, ultracapacitors, and batteries. A calculation engine, which is specifically designed to estimate energy consumption, respecting the original performance as the original internal combustion engine (ICE), is presented and used for simulations and component sizing. Finally, the overall performance of the different architectures (hybrid hydraulic, taken from the first paper part, and hybrid electric, estimated in this second part) and control strategies are summarized in a fuel and energy consumption table. Based on this table, an analysis of the different architecture performance results is carried out. From this analysis, a technological evolution of these vehicles in the medium- and long terms is proposed.
KEY WORDS : Engines, Hybrid power systems, Energy management optimization, Drive cycle prediction, Refuse-collecting vehicles, Powertrain
1. INTRODUCTION
Different factors, such as decline of fossil fuelreserves, high oil prices, energy security concerns, and climatic change, indicate that a progressive reduction in the use of ICEs in the transport sector is necessary.
One of the most interesting alternatives is the introduction of devices that could use energy in a more rational way by storing energy during regenerative braking or when the ICE is working at high efficiency points. And assisting it when high power demands are required or when the ICE is working at low efficiency points.
*Corresponding author. e-mail: [email protected]
Considering these kinds of devices, several studies can be found in the literature. Different alternatives are described, with electric hybridization (Feroldi et al. 2009, Bauman et al. 2008, Khaligh et Zhihao 2010, Garcia et al. 2004, Araujo et al. 2014, Thoungtong et al. 2009, Camara et al. 2008, Li et al. 2012, M. Esfahanian et al. 2013, D.Chindamo et al. 2013) and hydraulic hybridization (Baseley et al. 2007, Filipi and Kim 2010, Kim and Filipi 2007, Wu et al. 2002, Wohlgemuth 2013, Surampudi 2009) being the most typical ones.
The main goal of this paper is to perform a comparative study of different electric-based powertrain architectures in a refuse-collecting vehicle (RCV) for a real drive cycle. As the goal of the study is to contrast the efficiency of these hardware topologies and not to optimize the corresponding control strategies for each
Topological Analysis of Powertrains for Refuse-Collecting Vehicles Based on Real Routes, Part II: Hybrid Electric Powertrain powertrain configuration, the implemented control strategy is quite simple and the same for all the evaluated powertrains.
Most of the reviewed studies are based on standard cycle simulation (Federal USD, ECE, etc.) (Bauman et al. 2008, Li et al. 2012), or on simulations of a part of real cycles (Garcia et al. 2004). As this paper is the basis for hardware topology selection of a real vehicle, all the powertrains have been tested by simulation on a set of real drive cycles of an RCV.
In this work, a hydraulic powertrain architecture is compared to three electric architectures. This comparison is based on energy flow simulation of simplified models of hardware elements, which allows analysis of the energy flows in the powertrain; however, this high-level simulation does not reflect the detail of the components or the control strategies.
This work is part of a more ambitious research project whose fundamentals have already been published (Soriano et al. 2014). As the final goal of the project is to build a prototype, the characteristics of each component are selected to be representative of a real component and be suitable for a real vehicle. The mass and volume occupied by the necessary elements are considered as constraints.
The present work is organized as follows: First, a reference to the data logging system, which is
used to register the real routes and the drive cycles in which the powertrains models will be tested, is mentioned. As this information has already been presented in the first part of this paper, it is not deeply explained here.
Second, three electric powertrain models are analyzed, and their components are defined one by one. Third, an artificial intelligence system, which estimates in which driving mode the powertrain is operating, is presented, despite the fact that it is not developed in the present work but in a previous one (Soriano et al. 2014).
Fourth, the control strategies for both fuel cells and battery are explained. Fifth, the calculus engine (an algorithm that runs the vehicle models on real routes) specifically developed for this work is introduced, and its estimation details are discussed.
The method for sizing fuel cells (FCs), batteries, and ultracapacitors (UCs) is then defined. And finally, using
the previously presented routes, the proposed powertrain models and the calculus engine are utilized, and simulation tests are performed. The results are discussed, and the conclusions are then presented.
2. DATA LOGGING KIT, POST-PROCESSING METHOD, AND CHOSEN DRIVE CYCLES
The data logging kit and the post-processing method are the same as those used in the first part of this paper. Additional details about this technology can be found in (Soriano et al. 2014). The chosen drive cycles are also the same as those used in the first part of this paper.
3. HYBRID ELECTRIC POWERTRAIN HARDWARE MODELS
All the powertrain architectures proposed in this work consist of four elements: an energy storage system (ESS), an energy generation system (EGS), an energy consumption system (ECS), and the DC bus. Each element interacting with the DC bus has its own power converter to get the maximum possible control of the energy flow.
Different works that enhance these topologies and reduce the number of inverters needed are available in the literature (Bauman et al. 2008), but these kinds of studies have been considered out of the scope of this paper.
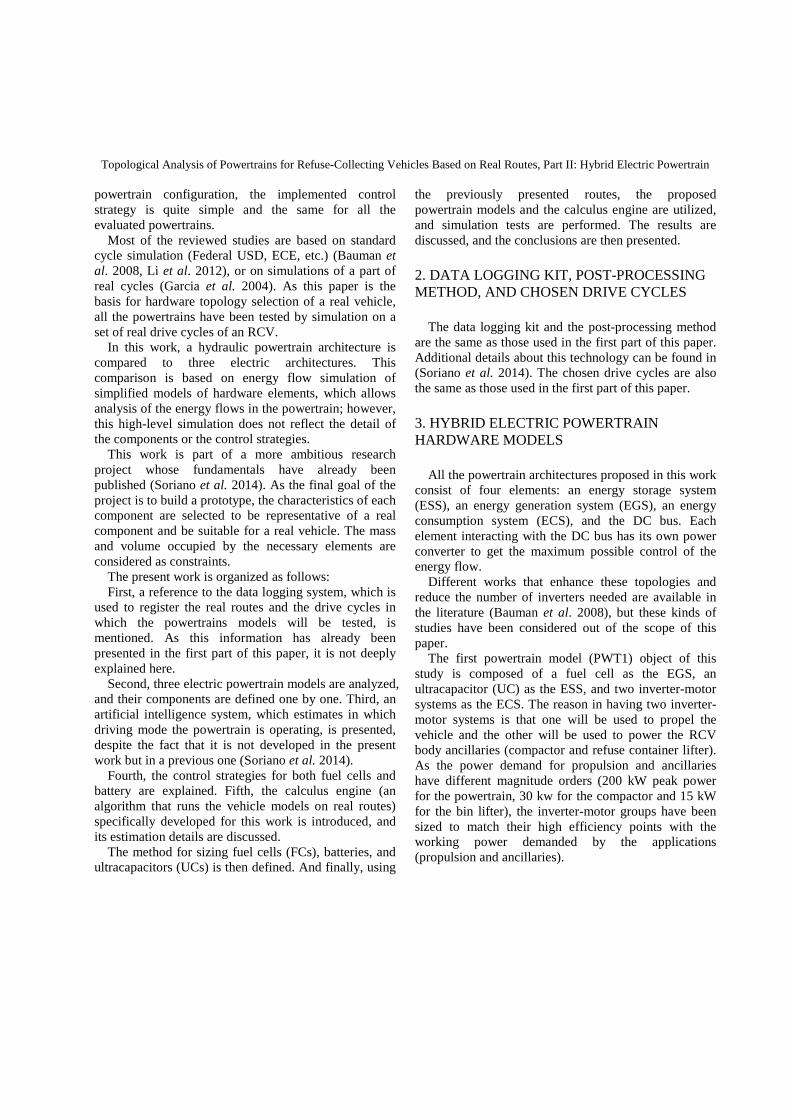
The first powertrain model (PWT1) object of this study is composed of a fuel cell as the EGS, an ultracapacitor (UC) as the ESS, and two inverter-motor systems as the ECS. The reason in having two inverter-motor systems is that one will be used to propel the vehicle and the other will be used to power the RCV body ancillaries (compactor and refuse container lifter). As the power demand for propulsion and ancillaries have different magnitude orders (200 kW peak power for the powertrain, 30 kw for the compactor and 15 kW for the bin lifter), the inverter-motor groups have been sized to match their high efficiency points with the working power demanded by the applications (propulsion and ancillaries).
F. SORIANO, M. MORENO-EGUILAZ, J. ÁLVAREZ and J. RIERA
Figure 1. Details of the powertrain 1 configuration PWT1.
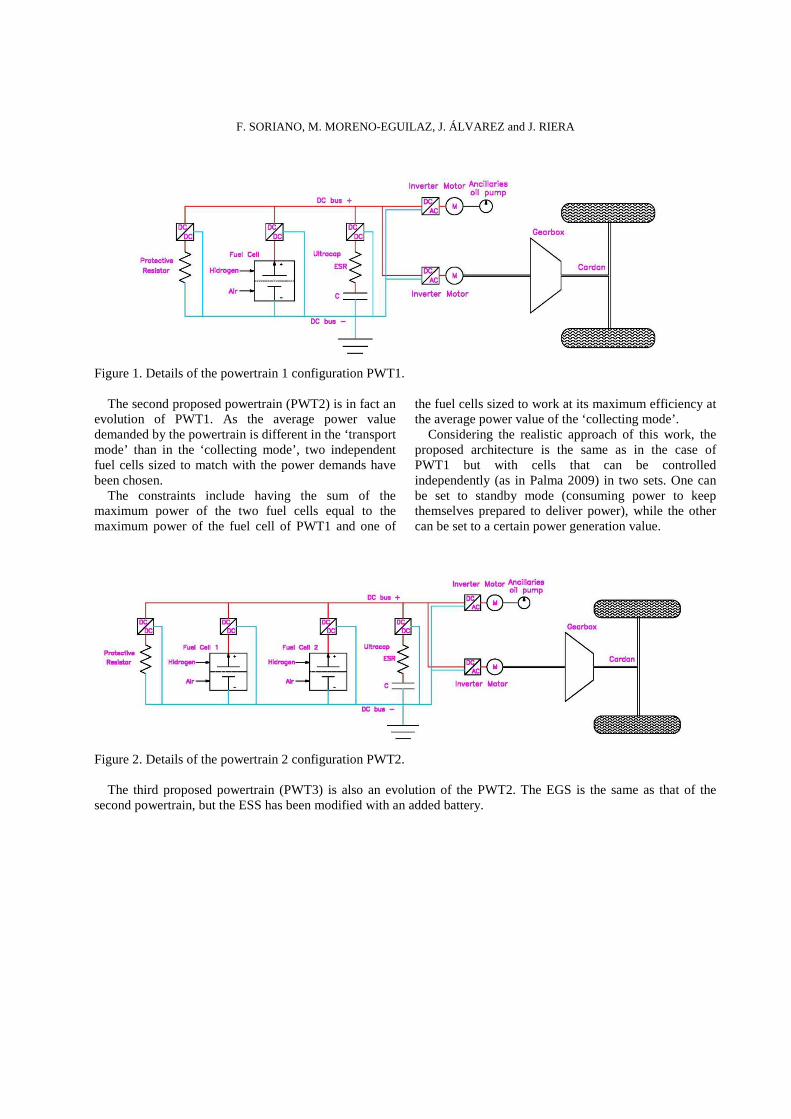
The second proposed powertrain (PWT2) is in fact an evolution of PWT1. As the average power value demanded by the powertrain is different in the ‘transport mode’ than in the ‘collecting mode’, two independent fuel cells sized to match with the power demands have been chosen.
The constraints include having the sum of the maximum power of the two fuel cells equal to the maximum power of the fuel cell of PWT1 and one of
the fuel cells sized to work at its maximum efficiency at the average power value of the ‘collecting mode’.
Considering the realistic approach of this work, the proposed architecture is the same as in the case of PWT1 but with cells that can be controlled independently (as in Palma 2009) in two sets. One can be set to standby mode (consuming power to keep themselves prepared to deliver power), while the other can be set to a certain power generation value.
Figure 2. Details of the powertrain 2 configuration PWT2.
The third proposed powertrain (PWT3) is also an evolution of the PWT2. The EGS is the same as that of the second powertrain, but the ESS has been modified with an added battery.

Topological Analysis of Powertrains for Refuse-Collecting Vehicles Based on Real Routes, Part II: Hybrid Electric Powertrain
Figure 3. Details of the powertrain 3 configuration PWT3.
Several authors have proposed the use of a combination of batteries, fuel cells, and ultracapacitors for vehicular powertrains (Araujo et al. 2014, Thoungtong et al. 2009, Camara et al. 2008, Li et al. 2012). From a conceptual point of view, this is very interesting because the physical principles of each element (ultracapacitors, battery, and fuel cells) have different power dynamics. Additionally, the correct energy management system (EMS) can obtain the highest performance working with most adequate elements for each energy flow.
3.1. Fuel Cell Models
It is assumed that the fuel cells can be modularly assembled based on individual cells that can be stacked getting fuel cell packs (Palma 2009).
The efficiency maps of the fuel cell stack are based on the efficiency of the individual fuel cell efficiency maps (taken from Feroldi et al. 2009). In this work, the fuel cell power axes (ordinates in Figure 4) in these maps have been changed and maintain the same specific consumption (g/kWh) and efficiency. This is representative of a modular fuel cell system (Palma 2009) built with individual cells.
Figure 4. Efficiency and consumption map for a 80 kW fuel cell.
While the fuel cells are generating power, their
hydrogen consumption for a certain power is taken from the right abscises axis of Figure 4 (for an 80 kW fuel cell). While they are not generating power, it is assumed that they are at standby mode, which means the fuel cell ancillaries are consuming parasitic power (humidifier
and compressor) to keep the fuel cell ready to deliver power despite the fact that no power is demanded from the fuel cell by external load.
The power that can be demanded from the fuel cell is limited to the maximum slope for transients, which guarantees long lifecycle of the fuel cell. In this work,

F. SORIANO, M. MORENO-EGUILAZ, J. ÁLVAREZ and J. RIERA
this slope is defined as 100% power transitory in 100s, which is quite a conservative value.
3.2. Battery Models
The batteries are based on commercial information of individual cell models (Valence 2014). These individual cells are characterized as: Table 1. Individual battery cells.
Composition Lithium Iron Magnesium
Phosphate (LiFeMgPO4) Voltage 3.2 VDC
Useful energy 0.008 kWh Max continuous charging
current 6.25 A
Max continuous discharging current
25 A
Weight 0.04 kg Volume 0.0218 l
According to (Khang et al. 2012) the standard
efficiency values for both charge and discharge of LiFeMgPO4 batteries are compressed in the 0.90-1.00 range. In this work 0.95 is selected as efficiency value.
The battery pack model is characterized by two architecture parameters (rows and columns), which define how many cells are mounted in series and in parallel.
The battery pack model (energy, charge power, and discharge power) is defined from the row number (Nr), column number (Na), and individual cell parameters as follows:
(kWh) 8Nr·Na·0.00=E(kWh) (1)
(kW) )10
6.25·3.2Nr·Na·(=W)Power_ch(k
3 (2)
(kW) )10
25·3.2Nr·Na·(=kW)Power_dch(
3 (3)
3.3.Ultracapacitor Model
As in the battery models, the ultracapacitor pack model is based on individual cell characteristics, with values taken from commercial UC (Maxwell 2014). Table 2. Individual ultracapacitors.
Nominal voltage 48.6 VDC
Usable power 45000 W Dimensions 416.2 x 210.8 x 178 mm ESR, DC 0.0063 Ω
C 165 F Weight 13.64 kg Volume 15.75 l (0.179 x 0.418 x 0.211 m)
As the efficiency of the UC is much higher than the converter efficiency (over 99% according to Maxwell 2014), it has been neglected for the calculus.
The characteristics of the ultracapacitor pack can be estimated based on Na and Nr, and the equations are equivalent to (1, 2, 3) as in the battery pack.
The ultracapacitor pack equations for estimations are based on (Feroldi et al. 2009), where the maximum available power can be estimated from the available energy as follows:
(t) ·C·V2
1=(t) E_SC 2
SC (4)
ESR
(t) ·Vk=(t) P
2SCSC
DSCH (5)
(t) ·EESR·C
·2k=(t) P SC
SCDSCH
(6)
As the term
ESR·C
·2kSC is a constant of the
ultracapacitors, the available discharge power (PDSCH) at a certain instant (t) is proportional to the energy stored at the same time:
MAX_S
SC
MAX
DSCHE
(t) E=
P
(t) P (7)
The available charge power is equal to the maximum power minus the discharge power:
(t) P-P=(t) P DSCHMAXCH (8)
The power transients of the ultracapacitors have not been limited at all.
3.4.Electric Motor and Generator Models
The electric motor (which works also as a generator) model is developed from commercial standard motors (the manufacturer wants to remain confidential), and is based on its maximum torque and its efficiency at each working point. It is an AC motor with permanent magnets, segmented laminations, three poles and liquid cooled stator.
In Figure 5, two different types of lines can be observed. The wide red line identifies the limit at which the motor can operate under steady-state conditions. The narrower lines identify the iso-efficiency contours. They are also coloured from blue (low efficiency areas) to red (high efficiency areas).
To integrate this map into the simulation software, a function has been generated which estimates the power demanded from the current motor Torque, the RPM, and its efficiency (Eff), which is extracted from Figure 5.
RPM)f(Torque,=Eff
60·1000
2·RPM·Eff·Torque=P(kW)
π

Topological Analysis of Powertrains for Refuse
Figure 5. Efficiency and maximum torque of the motor.
The efficiency map for the generator has a profile. However, its efficiency values are slightly lower (the map has not been included in this work because of it does not add significant value). The efficiency map is supposed to correspond to the motor working from 300 VDC to 350 VDC.
3.5. Inverter and Converter Models
The inverter and converter models used are both based on commercial IGBT based solutions. In these commercial equipment (Brusa 2014, Flexiva 2014), the inverters and converters efficiencies varies from 89% to 98%, depending basically on voltage. In this work, a 6% power loss in the inverters and converters is taken into account each time power flows through it (so 94% efficiency), which is a conservative value if compared to (Brusa 2014), working from 300 VDC to 350 VDC.
4. DRIVING MODE IDENTIFIC
Detailed information about the drive cycles iRCV can be found in (Soriano et alartificial intelligence-based algorithm, it is possible to identify the driving mode in real time, that is, if the RCV is working in either ‘Collecting mode’ or ‘Transport mode’. In the present work, this information is assumed to be available.
5. PROPOSED FUEL CELL CONTROL STRATEGY
of Powertrains for Refuse-Collecting Vehicles Based on Real Routes, Part II: Hybrid Electric Powertrain
5. Efficiency and maximum torque of the motor.
The efficiency map for the generator has a similar profile. However, its efficiency values are slightly lower (the map has not been included in this work because of it does not add significant value). The efficiency map is supposed to correspond to the motor working from 300
Models
The inverter and converter models used are both based on commercial IGBT based solutions. In these commercial equipment (Brusa 2014, Flexiva 2014), the inverters and converters efficiencies varies from 89% to
sically on voltage. In this work, a 6% power loss in the inverters and converters is taken into account each time power flows through it (so 94% efficiency), which is a conservative value if compared to (Brusa 2014), working from 300 VDC to 350 VDC.
IVING MODE IDENTIFICATION
Detailed information about the drive cycles in an et al. 2014). Using an
based algorithm, it is possible to identify the driving mode in real time, that is, if the
g in either ‘Collecting mode’ or ‘Transport mode’. In the present work, this information
CONTROL
As the main goal of this paper is to compare the three different hardware architectures, the controlselected for each one of the proposed powertrains is the same. In this way, the impact of the control strategy is minimized, and the differences found in the simulation results will be considered the result of the hardware differences.
The power generated by the fuel cells, based on (Kim and Filipi 2007), is a function of the state of energy of the ESS (SOEESS). The SOEamount of energy in the ESS. Detailed information on how the SOEESS of each powertrain is estimated canfound at the end of this section (16, 18).
f(SOE=(kW) PFUELCELL
Figure 6. Control strategy of the fuel cell.
In Figure 6, the abscissa corresponds to the while the ordinate is the demandecell.
The fuel cell has two operating modes: enabled mode and standby mode. When the is set to standby mode, and it will be set again to enabled mode only if the SOE
Collecting Vehicles Based on Real Routes, Part II: Hybrid Electric Powertrain
As the main goal of this paper is to compare the three different hardware architectures, the control strategy selected for each one of the proposed powertrains is the same. In this way, the impact of the control strategy is minimized, and the differences found in the simulation results will be considered the result of the hardware
ed by the fuel cells, based on (Kim , is a function of the state of energy of
SOEESS indicates the relative amount of energy in the ESS. Detailed information on
of each powertrain is estimated can be found at the end of this section (16, 18).
)f(SOEESS (9)
6. Control strategy of the fuel cell.
6, the abscissa corresponds to the SOEESS, while the ordinate is the demanded power from the fuel
The fuel cell has two operating modes: enabled mode and standby mode. When the SOEESS reaches 100%, it is set to standby mode, and it will be set again to
SOEESS falls below SOE100.

F. SORIANO, M. MORENO-EGUILAZ, J. ÁLVAREZ and J. RIERA
When the fuel cell is set to standby mode, the consumption of the fuel cell is the standby power, but it does not deliver energy to the powertrain. This power is necessary to keep the fuel cell ancillaries (humidifier, compressors, membrane stack, etc.) in the operative conditions and to avoid the start and stop processes of the fuel cell.
When the fuel cell is set to the enabled mode, it follows the following rules:
If the SOEESS is between two values (SOE100 and SOELimit), the power demanded from the fuel cell is the average power of the driving mode (Pmean).
If the SOEESS is below SOE100, the power demanded from the fuel cell will proportionally increase to the distance from SOE100 and will reach the maximum nominal power (Pmax) of the fuel cell when the SOE is zero.If the SOEESS is over the SOELimit, the power demanded from the fuel cell is proportionally decreased to the distance from the SOELimit and reaches the standby power of the fuel cell (Pstand_by) when the SOEESS is 100. When the SOEESS is 100, the standby power is used to estimate the hydrogen consumption, but no power is delivered by the fuel cell.
The following equations summarize the control algorithm used in the control of the fuel cell:
( )EnabledCellFuelif =_
( )100SOESOEif ESS ≤ , ( )( ) 100100max /)( SOESOESOEPPPkWP meanmean −−+= (10)
( )LimitESS SOESOESOEif <<100 , meanPkWP =)( (11)
( )100≤≤ ESSLimit SOESOEif , ( )
−−−−=
Limit
LimitStabymeanmean
SOE
SOESOEPPPkWP
100)( (12)
( )100=ESSSOEif , StabyPkWP =)( AND DisabledCellFuel =_ (13)
( )DisabledCellFuelelseif =_
( )100SOESOEif ESS ≤ , 0)( =kWP AND EnabledCellFuel =_ (14)
( )100SOCSOCif > , 0)( =kWP AND DisabledCellFuel =_ (15)
In the PWT1 and PWT2, the ESS is an ultracapacitor pack, and the ESSSOE is the state of energy of the
ultracapacitors ( UCSOE ), which is defined as in (Feroldi
et al. 2009) and uses the notation introduced in (4) and (7):
MAX_SC
SCUCESS E
(t) E=(t) SOE=(t) SOE (16)
where ESC(t) is the energy stored in the ultracapacitor at an instant t, and EMAX_SC is the maximum energy that can be stored in the ultracapacitor.
In the PWT3, the ESS is a combination of ultracapacitors and batteries. To have available power on both subsystems, the SOEESS is the minimum of the SOEUC (16) and an energy based weighted average of the energy of both systems SOEUC+BAT (17, 18).
The fuel cell control cannot be implemented by just using SOEUC+BAT because in the weighted average, the battery is heavier than the UC and it could happen that with no energy available on the UC, the fuel cell would not deliver power because of high SOEUC+BAT values. Under these conditions all the transients would be 100% supported by the battery.
) SOE;MIN(SOE=SOE UCBAT+UCESS (17)
MAX_SCMAX_BAT
MAX_SCUCMAX_BATBAT
BAT+UC
EE
(t)·E SOE+(t)·E SOE
=SOE
+ (18)
where EMAX_BAT is the maximum energy that can be stored in the battery, and the SOEBAT(t) is the expression equivalent to (16), but using the battery parameters EBAT(t) and EMAX_BAT , instead of the ultracapacitor parameters.
SOELimit and SOE100 are control parameters of the fuel cell. Their values are fixed in this work to 30% and 70%, respectively, for the three powertrains. The Pmax and Pmean values will be defined in chapter 8.
6. PROPOSED BATTERY CONTROL STRATEGY
The battery control strategy is characterized by two control parameters ‘Battery Low Control Point’ and ‘Battery High Control Point’.
When the SOEESS , as defined in (17), is below the ‘Battery Low Control Point’, the energy demanded by

Topological Analysis of Powertrains for Refuse-Collecting Vehicles Based on Real Routes, Part II: Hybrid Electric Powertrain the ESS is consumed from the battery. If the battery cannot deliver this power because of the mentioned limitations, then, it is assisted by the ultracapacitor pack. The battery is never charged for these SOE values of the ESS, and the excess power is always stored in the ultracapacitors.
When the SOEESS is over the ‘Battery High Control Point’, the energy supplied to the ESS is stored into the battery. If the battery cannot receive this power because
of the above-mentioned limitations, then it is assisted by the ultracapacitors.
When the SOEESS is between the ‘High’ and ‘Low Control Points’, the battery is not used, and all the power flows are managed from the ultracapacitor pack. In this work, the values for the ‘Low’ and ‘High Control Points’ are set to 35% and 50% respectively. These values have been adjusted experimentally based on simulations of the drive cycles 1 to 4.
POINTCONTROLLOWBATTERYSOE ___<
0=P P;=P ); P<(P if 0>P if SCBATMAX_BAT (19)
MAX_BATSCMAX_BATBAT P-P=P ;P=P else (20)
0=P ; P=P 0P if BATSC< (21)
POINTCONTROLHIGHBATTERYSOE ___>
P=P 0;=P 0>P if SCBAT (22)
0=P P;=P );P<(P if 0P if SCBATMAX_BAT< (23)
MAX_BATSCMAX_BATBAT P-P=P ;P=P else (24)
_POINTGH_CONTROLBATTERY_HI<SOE < POINTW_CONTROL_BATTERY_LO if
0=P P;=P BATSC
where P is the power consumed from the ESS (if P>0,
the ESS is delivering power; if P<0, the SOE is storing power), PBAT is the power consumed from the battery, PMAX_BAT is the maximum power the battery can charge/discharge, and PSC is the power consumed from the ultracapacitors.
7. CALCULATION ENGINE
The calculation engine for this paper has been developed in Matlab.
With the data logging kit mentioned in chapter 2, a significant number of real drive cycles have been logged, and using the techniques proposed in (Soriano et al. 2014), the useful power has been estimated. As a result, two vectors (RPM and Power) containing samples at 0.1Hz during the whole collecting work (from about 7 to 8 hours) have been generated daily in 15 days.
In the calculation engine, the engine RPM value is extracted from the logged data, and the power demand is estimated by post-processing the logged data.
At each sample time (at 0.1Hz), the algorithm estimates the instantaneous power consumption of the
motors (propulsion or ancillaries) based on the logged data.
The instantaneous power generated by the fuel cell pack is based on the SOEESS of the previous instant.
If the addition of the two previous values is negative, the power consumption is supplied by the ESS. If it is positive, the power excess is stored on the ESS.
Using this method, a total of 15 routes are simulated, and the instantaneous SOE of the system is evaluated during all simulations. If at any moment the SOEESS is lower than zero, it is understood as the powertrain not being able to supply the demanded power. As a result, the hardware combination is not viable. This method is useful in estimating if the proposed powertrain can provide exactly the same performance as that of the original powertrain in which the routes were registered.
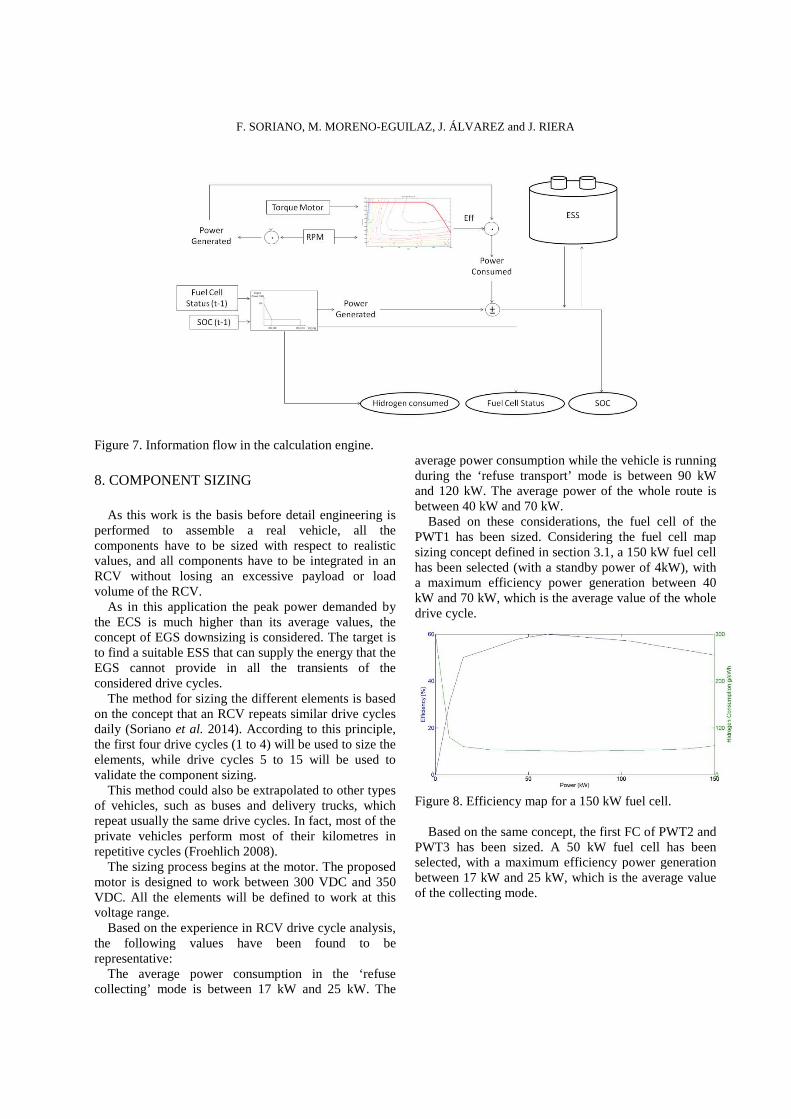
In the flow chart shown in Figure 7, the input data are in square boxes, while the output data are in balloons. The SOC and fuel cell status, which are outputs for a certain instant ‘t’, are used as inputs for the next instant ‘t+1’. The consumed hydrogen will be useful in estimating the fuel consumption of the powertrain and the route combination.
F. SORIANO, M. MORENO
Figure 7. Information flow in the calculation engine.
8. COMPONENT SIZING
As this work is the basis before detail engineering is performed to assemble a real vehicle, components have to be sized with respect to realistic values, and all components have to be integrated in an RCV without losing an excessive payload or load volume of the RCV.
As in this application the peak power demanded by the ECS is much higher than its average values, the concept of EGS downsizing is considered. The target is to find a suitable ESS that can supply the energy that the EGS cannot provide in all the transients of the considered drive cycles.
The method for sizing the different eleon the concept that an RCV repeatsdaily (Soriano et al. 2014). According to this principle, the first four drive cycles (1 to 4) will be used to size the elements, while drive cycles 5 to 15 will be used to validate the component sizing.
This method could also be extrapolated to other types of vehicles, such as buses and delivery trucks, which repeat usually the same drive cycles. In fact, most of the private vehicles perform most of their kilometres in repetitive cycles (Froehlich 2008).
The sizing process begins at the motor. The proposed motor is designed to work between 300 VDC and 350 VDC. All the elements will be defined to work at this voltage range.
Based on the experience in RCV drive cycle analysis, the following values have been found to be representative:
The average power consumption in the ‘refuse collecting’ mode is between 17 kW and 25 kW. The
F. SORIANO, M. MORENO-EGUILAZ, J. ÁLVAREZ and J. RIERA
7. Information flow in the calculation engine.
As this work is the basis before detail engineering is performed to assemble a real vehicle, all the components have to be sized with respect to realistic values, and all components have to be integrated in an RCV without losing an excessive payload or load
As in this application the peak power demanded by than its average values, the
concept of EGS downsizing is considered. The target is to find a suitable ESS that can supply the energy that the EGS cannot provide in all the transients of the
The method for sizing the different elements is based on the concept that an RCV repeats similar drive cycles
. According to this principle, the first four drive cycles (1 to 4) will be used to size the elements, while drive cycles 5 to 15 will be used to
This method could also be extrapolated to other types of vehicles, such as buses and delivery trucks, which repeat usually the same drive cycles. In fact, most of the private vehicles perform most of their kilometres in
The sizing process begins at the motor. The proposed motor is designed to work between 300 VDC and 350 VDC. All the elements will be defined to work at this
Based on the experience in RCV drive cycle analysis, g values have been found to be
The average power consumption in the ‘refuse collecting’ mode is between 17 kW and 25 kW. The
average power consumption while the vehicle is running during the ‘refuse transport’ mode is between 90 kW and 120 kW. The average power of the whole route is between 40 kW and 70 kW.
Based on these considerations, the fuel cell of the PWT1 has been sized. Considering the fuel cell map sizing concept defined in section has been selected (with a standby power of 4kW), with a maximum efficiency power generation between 40 kW and 70 kW, which is the average value of the whole drive cycle.
Figure 8. Efficiency map for a 150 kW fuel cell. Based on the same concept, the first FC of PWT2 and
PWT3 has been sized. A 50 kW fuel cell has been selected, with a maximum efficiency power generation between 17 kW and 25 kW, which is the average value of the collecting mode.
EGUILAZ, J. ÁLVAREZ and J. RIERA
average power consumption while the vehicle is running during the ‘refuse transport’ mode is between 90 kW
kW. The average power of the whole route is
Based on these considerations, the fuel cell of the PWT1 has been sized. Considering the fuel cell map sizing concept defined in section 3.1, a 150 kW fuel cell
standby power of 4kW), with a maximum efficiency power generation between 40 kW and 70 kW, which is the average value of the whole
8. Efficiency map for a 150 kW fuel cell.
Based on the same concept, the first FC of PWT2 and been sized. A 50 kW fuel cell has been
selected, with a maximum efficiency power generation between 17 kW and 25 kW, which is the average value
Topological Analysis of Powertrains for Refuse-Collecting Vehicles Based on Real Routes, Part II: Hybrid Electric Powertrain
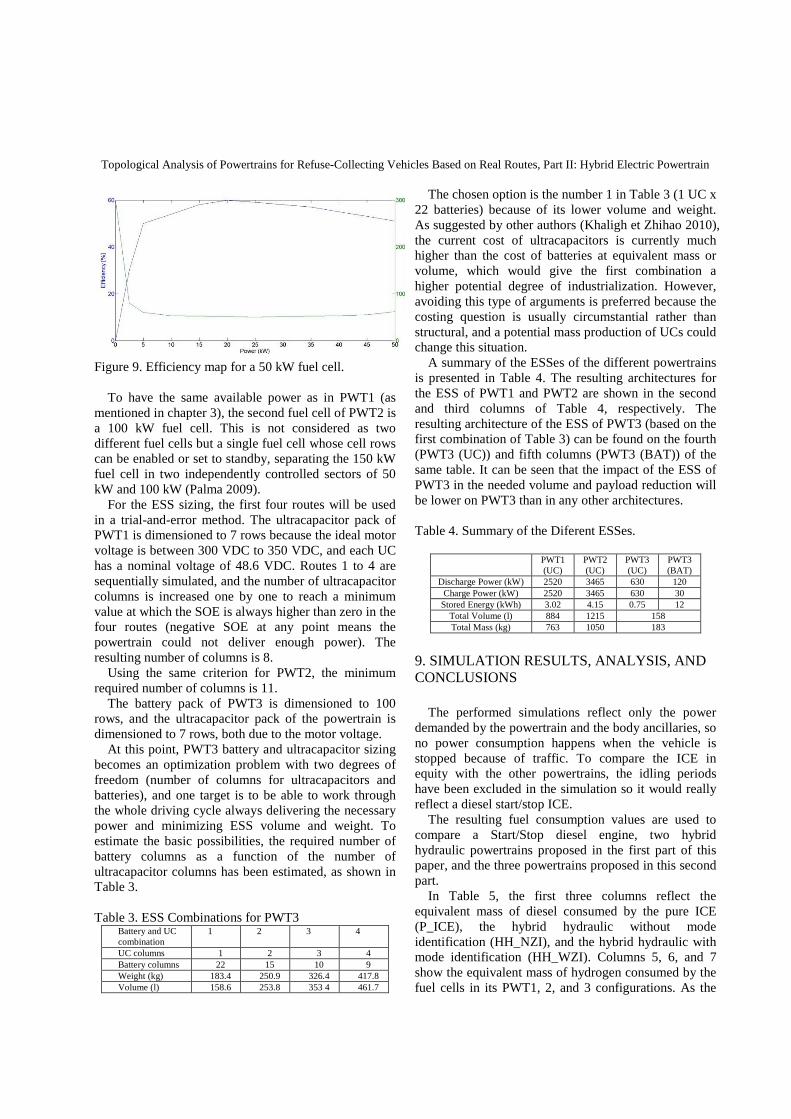
Figure 9. Efficiency map for a 50 kW fuel cell.
To have the same available power as in PWT1 (as mentioned in chapter 3), the second fuel cell of PWT2 is a 100 kW fuel cell. This is not considered as two different fuel cells but a single fuel cell whose cell rows can be enabled or set to standby, separating the 150 kW fuel cell in two independently controlled sectors of 50 kW and 100 kW (Palma 2009).
For the ESS sizing, the first four routes will be used in a trial-and-error method. The ultracapacitor pack of PWT1 is dimensioned to 7 rows because the ideal motor voltage is between 300 VDC to 350 VDC, and each UC has a nominal voltage of 48.6 VDC. Routes 1 to 4 are sequentially simulated, and the number of ultracapacitor columns is increased one by one to reach a minimum value at which the SOE is always higher than zero in the four routes (negative SOE at any point means the powertrain could not deliver enough power). The resulting number of columns is 8.
Using the same criterion for PWT2, the minimum required number of columns is 11.
The battery pack of PWT3 is dimensioned to 100 rows, and the ultracapacitor pack of the powertrain is dimensioned to 7 rows, both due to the motor voltage.
At this point, PWT3 battery and ultracapacitor sizing becomes an optimization problem with two degrees of freedom (number of columns for ultracapacitors and batteries), and one target is to be able to work through the whole driving cycle always delivering the necessary power and minimizing ESS volume and weight. To estimate the basic possibilities, the required number of battery columns as a function of the number of ultracapacitor columns has been estimated, as shown in Table 3.
Table 3. ESS Combinations for PWT3
Battery and UC combination
1 2 3 4
UC columns 1 2 3 4 Battery columns 22 15 10 9 Weight (kg) 183.4 250.9 326.4 417.8 Volume (l) 158.6 253.8 353 4 461.7
The chosen option is the number 1 in Table 3 (1 UC x 22 batteries) because of its lower volume and weight. As suggested by other authors (Khaligh et Zhihao 2010), the current cost of ultracapacitors is currently much higher than the cost of batteries at equivalent mass or volume, which would give the first combination a higher potential degree of industrialization. However, avoiding this type of arguments is preferred because the costing question is usually circumstantial rather than structural, and a potential mass production of UCs could change this situation.
A summary of the ESSes of the different powertrains is presented in Table 4. The resulting architectures for the ESS of PWT1 and PWT2 are shown in the second and third columns of Table 4, respectively. The resulting architecture of the ESS of PWT3 (based on the first combination of Table 3) can be found on the fourth (PWT3 (UC)) and fifth columns (PWT3 (BAT)) of the same table. It can be seen that the impact of the ESS of PWT3 in the needed volume and payload reduction will be lower on PWT3 than in any other architectures. Table 4. Summary of the Diferent ESSes.
PWT1
(UC) PWT2 (UC)
PWT3 (UC)
PWT3 (BAT)
Discharge Power (kW) 2520 3465 630 120 Charge Power (kW) 2520 3465 630 30 Stored Energy (kWh) 3.02 4.15 0.75 12
Total Volume (l) 884 1215 158 Total Mass (kg) 763 1050 183
9. SIMULATION RESULTS, ANALYSIS, AND CONCLUSIONS
The performed simulations reflect only the power demanded by the powertrain and the body ancillaries, so no power consumption happens when the vehicle is stopped because of traffic. To compare the ICE in equity with the other powertrains, the idling periods have been excluded in the simulation so it would really reflect a diesel start/stop ICE.
The resulting fuel consumption values are used to compare a Start/Stop diesel engine, two hybrid hydraulic powertrains proposed in the first part of this paper, and the three powertrains proposed in this second part.
In Table 5, the first three columns reflect the equivalent mass of diesel consumed by the pure ICE (P_ICE), the hybrid hydraulic without mode identification (HH_NZI), and the hybrid hydraulic with mode identification (HH_WZI). Columns 5, 6, and 7 show the equivalent mass of hydrogen consumed by the fuel cells in its PWT1, 2, and 3 configurations. As the

F. SORIANO, M. MORENO-EGUILAZ, J. ÁLVAREZ and J. RIERA
mode identification demonstrated to improve vehicle efficiency in part I of this paper, all the hybrid electric
controls are based on this concept.
Table 5. Summary of fuel consumptions for each powertrain and route.
Route Pure ICE
(kg of diesel)
Hybrid Hydraulic Without Zone Identification
(kJ Diesel)
Hybrid Hydraulic With Zone Identification
(kJ Diesel) PWT1
(kg of H2) PWT2
(kg of H2) PWT3
(kg of H2)
1 34.51 30.86 29.59 9.40 8.07 8,49
2 33.05 29.93 28.76 9.46 8.05 8,40
3 33.08 31.37 30.40 9.37 8.46 8,39
4 29.49 26.16 25.06 8.63 7.32 7,79
5 29.53 27.13 25.85 8.58 7.38 7,69
6 31.25 28.45 27.30 9.21 7.99 8,16
7 30.98 25.80 25.15 9.21 7.58 8,06
8 31.67 26.59 25.52 9.44 7.95 8,32
9 30.76 27.38 26.37 9.03 7.71 8,01
10 30.81 27.62 26.54 9.01 7.72 7,93
11 34.76 32.21 30.99 10.38 9.35 9,42
12 31.13 28.00 26.96 9.58 8.56 8,68
13 33.15 31.05 29.71 10.23 8.99 9,19
14 32.1 28.20 27.18 10.26 8.97 8,80
15 39.24 32.39 31.10 11.83 10.79 10,98
As the values of Table 5 are expressed in two different magnitudes (kg of diesel and kg of hydrogen), it is quite
difficult to compare them. To establish a direct comparison, the values in Table 5 have been reduced to the same physical magnitude (kJ) based on the lower heating values (LHV) found in (Guibet J.C. 2000). The results are presented in Table 6.
Table 6. Summary of energy consumptions in (kJ) for each powertrain and route.
Route P_ICE
(kg Diesel) HH_NZI
(kJ Diesel) HH_WZI (kJ Diesel)
PWT1 (kJ H2)
PWT2 (kJ H2)
PWT3 (kJ H2)
1 1,470,126 1,314,636 1,260,534 1,136,885 976,357 1,027,044
2 1,407,930 1,275,018 1,225,176 1,144,023 973,333 1,016,156
3 1,409,208 1,336,362 1,295,040 1,133,377 1,023,173 1,014,947
4 1,256,274 1,114,416 1,067,513 1,043,859 884,903 942,364
5 1,257,978 1,155,738 1,101,210 1,038,173 892,524 930,267
6 1,331,250 1,211,970 1,162,980 1,113,901 966,195 987,123
7 1,319,748 1,099,080 1,071,518 1,114,264 916,960 975,026
8 1,349,142 1,132,734 1,087,152 1,142,208 961,961 1,006,479
9 1,310,376 1,166,388 1,123,362 1,092,368 933,049 968,978
10 1,312,506 1,176,612 1,130,604 1,090,433 933,291 959,300
11 1,480,776 1,372,146 1,320,174 1,255,679 1,131,079 1,139,547
12 1,326,138 1,192,800 1,148,496 1,158,902 1,035,512 1,050,028
13 1,412,190 1,322,730 1,265,646 1,237,533 1,087,529 1,111,723
14 1,367,460 1,201,320 1,157,868 1,241,162 1,085,110 1,064,545
15 1,671,624 1,379,814 1,324,860 1,431,087 1,305,277 1,328,262

Topological Analysis of Powertrains for Refuse-Collecting Vehicles Based on Real Routes, Part II: Hybrid Electric Powertrain
There is part of the consumed energy in the route that is not included in the fuel consumption presented in Table 6, as the ESSSOE is at 100% at the beginning of the route and it is not necessarily 100% at the end of the route. After estimations these values have demonstrated to be clearly three to five orders of magnitude lower than the values of Table 6, these energies have been considered negligible.
To get an easier comparison, Table 7 is presented, where the diesel consumption in kJ of pure ICE (P_ICE) has been considered to be the reference value (1). And the rest of the columns indicate the fuel consumption referred to this base value (from 0 to 1). The last row of this table indicates the average values of each powertrain result over the whole set of routes.
Table 7. Summary of energy consumptions compared to the ICE for each powertrain and route.
Route P_ICE
HH_NZI
(%) HH_WZI
(%) PWT1
(%) PWT2
(%) PWT3
(%)
1 1.000 0.894 0.857 0.773 0.664 0,699
2 1.000 0.906 0.870 0.813 0.691 0,722
3 1.000 0.948 0.919 0.804 0.726 0,720
4 1.000 0.887 0.850 0.831 0.704 0,750
5 1.000 0.919 0.875 0.825 0.709 0,739
6 1.000 0.910 0.874 0.837 0.726 0,742
7 1.000 0.833 0.812 0.844 0.695 0,739
8 1.000 0.840 0.806 0.847 0.713 0,746
9 1.000 0.890 0.857 0.834 0.712 0,739
10 1.000 0.896 0.861 0.831 0.711 0,731
11 1.000 0.927 0.892 0.848 0.764 0,770
12 1.000 0.899 0.866 0.874 0.781 0,792
13 1.000 0.937 0.896 0.876 0.770 0,787
14 1.000 0.879 0.847 0.908 0.794 0,778
15 1.000 0.825 0.793 0.856 0.781 0,795
Average Value 1.000 0.893 0.858 0.840 0.729 0,750
Several conclusions can be drawn from the results shown in Table 7.
Comparing columns 2 (P_ICE) and 3 (HH_NZI), it can be concluded that the fact of keeping the ICE working at high efficiency points and recuperating the braking energy by hydraulic devices can decrease energy consumption by about 11%.
Comparing columns 3 (HH_NZI) and 4 (HH_WZI), it can be seen that the adaptive control strategy with zone identification adds a substantial value (about 3.5%) of savings because the number of ICE start/stops and the ESS load/unload cycles are reduced.
Analyzing the values in columns 6 (PWT2) and 7 (PWT3), it can be seen that from energy point of view, both PWT2 and PWT3 are the best candidates, especially PWT2 that shows the lowest consumption of all. Nevertheless, from industrialization point of view, PWT2 represents an option that would be difficult to implement in a real vehicle nowadays because of size
and weight constraints (Table 4) and the excessive cost in the current ultracapacitor prices (Khaligh et Zhihao 2010).
Comparing the values in columns 5 (PWT1), 6 (PWT2), and 7 (PWT3), it can be appreciated that a combination of ultracapacitors and batteries and a suitable control strategy, which can take advantage of the properties of each one, can provide an efficient solution with a significant reduction in the required hardware and can also get very good efficiency results that are very close to the optimal powertrain (PWT2), despite the fact of not being optimal. The fuel consumption difference between PWT2 and PWT3 is 2.5%.
Comparing the PWT2 and 3 it can be observed that under certain conditions when the SOC of the UC of the PWT3 is high, the battery cannot absorb all the power flow of the vehicle braking/deceleration and this energy flow is sent to the resistors. This also happens in the
F. SORIANO, M. MORENO-EGUILAZ, J. ÁLVAREZ and J. RIERA
PWT2 but as its available power flow is higher, the situation is less frequent.
This effect is not usual in PWT3, but enough often so as to make a difference with PWT2 which can be observed in the results of table 8.
Comparing the best hybrid hydraulic architecture (HH_WZI) to the best hybrid electric architecture (PWT2), it can be concluded that the electric architecture has greater potential for savings.
Nevertheless, we consider that this straight comparison is unfair in some point because a lot of important information is missing. The industry of mobile hydraulics is a very mature one and is already installed in mass production systems, which offers a lot of advantages. Due to a higher production volume, this industry offers lower prices, better availability, and higher reliability.
Skilled technicians are also easier to find, and after-sales services are widely available. Hydraulic powertrains do not need to prepare facilities, such as battery chargers, which usually require modifying the electrical installations of the facilities.
On the other hand, by its physical nature, electric systems will always be more efficient. Therefore, electric powertrains are considered the best long-term solution.
From our point of view, we can conclude that hydraulic powertrain can be considered a very good option in the short and medium term, and the electric powertrain will be the best option in the long term.
ACKOWLEDGEMENTS
Authors would like to thank the Spanish Science and Innovation Ministry which partially funded this project through the project DPI2011-25649.
REFERENCES
Araujo, E., de Castro, R., Pinto, R., Melo, R., Freitas, P. (2014). Combined Sizing and Energy Management in EVs With Batteries and Supercapacitors. in Vehicular Technology, IEEE Transactions on , 63, 7, 3062-3076.
Baseley, S., Ehret, C., Greif, E., and Kliffken (2007), M., Hydraulic Hybrid Systems for Commercial Vehicles. SAE Technical Paper 2007-01-4150.
Bauman, J. and Kazerani, M. (2008). An improved powertrain topology for fuel cell-battery-ultracapacitor vehicles. Industrial Electronics, 2008. ISIE 2008. IEEE International Symposium on , 1483-1488.
Brusa Elektronik A. G.
http://www.brusa.eu/fileadmin/Diverses/Download/Datenblaetter/BRUSA_DB_EN_BDC546.pdf.
Camara, M.B., Gualous, H., Gustin, F., Berthon. A. (2008). Design and New Control of DC/DC Converters to Share Energy Between Supercapacitors and Batteries in Hybrid Vehicles. in Vehicular Technology, IEEE Transactions on, 57, 5, 2721-2735.
Chindamo, D., Gadola, M. and Romano M. (2103). Simulation tool for optimization and performance prediction of a generic hybrid electric series powertrain, Int. J. Automotive Technology 15, 1, 135-144.
Esfahanian, M., Safaei, A. , Nehzati, H., Esfahanian, V., Tehrani, M. M. (2014). Matlab-based modeling, simulation and design package for Eletric, Hydraulic and Flywheel hybrid powertrains of a city bus, Int. J. Automotive Technology 15, 6, 1001-1013.
Feroldi D., Serra M. and Riera J. (2009). Energy management strategies based on efficiency map for fuel cell hybrid vehicles. Journal of Power Sources, 190, 2, 387-401.
Feroldi, D., Serra, M. and Riera, J. (2009). Design and Analysis of Fuel-Cell Hybrid Systems Oriented to Automotive Applications. Vehicular Technology, IEEE Transactions on , 58, 9, 4720-4729.
Filipi Z. and Kim, Y. J. (2010). Hydraulic Hybrid Propulsion for Heavy Vehicles: Combining the Simulation and Engine-In-the-Loop Techniques to Maximize the Fuel Economy and Emission Benefits. Oil & Gas Science and Technology - Rev. IFP, 65, 1, 155-178.
Flexiva automation & Robotik GmbH http://www.flexiva.eu/en/alternative-energy-systems/products/bidirectional-converter-modules.html.
Froehlich, J. and Krumm, J. (2008). Route Prediction from Trip Observations. SAE Technical Paper 2008-01-0201.
García, P., Fernández, L.M., Torreglosa, J. P., Jurado, P. (2013). Operation mode control of a hybrid power system based on fuel cell/battery/ultracapacitor for an electric tramway. Computers & Electrical Engineering, 39, 7, 1993-2004, 0045-7906.
Guibet, J. C. (2000). Les carburants et la combustion. . BM2-520. Les techiniques de l’ingenieur. Saint-Denis Cedex.
Kang, J., Yan, F., Zhang, P., Changqing, D. (2012) , A novel way to calculate energy efficiency for rechargeable batteries, Journal of Power Sources, 206, 310-314.
Khaligh, A. and Zhihao, Li. (2010). Battery, Ultracapacitor, Fuel Cell, and Hybrid Energy Storage Systems for Electric, Hybrid Electric, Fuel Cell, and Plug-In Hybrid Electric Vehicles: State of the Art. in
Topological Analysis of Powertrains for Refuse-Collecting Vehicles Based on Real Routes, Part II: Hybrid Electric Powertrain
Vehicular Technology, IEEE Transactions on, 59, 6, 2806-2814.
Kim, Y. and Filipi, Z. (2007). Simulation Study of a Series Hydraulic Hybrid Propulsion System for a Light Truck. SAE Technical Paper 2007-01-4151.
Li, Q., Chen, W., Li, Y., Liu, S. and Huang, J. (2012). Energy management strategy for fuel cell/battery/ultracapacitor hybrid vehicle based on fuzzy logic. International Journal of Electrical Power & Energy Systems, 43, 1, 514-525, 0142-0615.
Maxwell Technologies BMO D0165. http://www.maxwell.com/.
Palma, L., Enjeti , P.N. (2009). A Modular Fuel Cell, Modular DC–DC Converter Concept for High Performance and Enhanced Reliability. Power Electronics, IEEE Transactions on , 24, 6,1437-1443.
Soriano, F., Alvarez-Florez, J., and Moreno-Eguilaz, M. (2014). Experimentally Compared Fuel Consumption Modelling of Refuse Collecting Vehicles for Energy Optimization Purposes. SAE Int. J. Commer. Veh. 7(1):324-336.
Soriano, F., Moreno Eguilaz, M. and Alvarez-Florez, J. (2015). Drive cycle identification and energy demand estimation for refuse-collecting vehicles. Vehicular
Technology, IEEE Transactions on, 64, 11, 4965-4973.
Surampudi, B., Nedungadi, A., Ostrowski, G., Montemayor, A. et al. (2009) Design and Control Considerations for a Series Heavy Duty Hybrid Hydraulic Vehicle. SAE Technical Paper 2009-01-2717.
Thounthong, P., Chunkag, V., Sethakul, P., Davat, B., Hinaje, M. (2009). Comparative Study of Fuel-Cell Vehicle Hybridization with Battery or Supercapacitor Storage Device. Vehicular Technology, IEEE Transactions on , 58, 8, 3892-3904.
Valence 26650 Power Cell IFR 26650PC. https://www.valence.com/
Wohlgemuth, S., Wachtmeister, G., and Kloft, P. (2013). Development of a Hydraulic Hybrid System for Urban Traffic. SAE Technical Paper 2013-01-1479.
Wu., B, Lin, Ch., Filipi, Z., Peng, H., Assanis, D. (2002). Optimization of Power Management Strategies for a Hydraulic Hybrid Medium Truck. Proceedings of the 2002 Advanced Vehicle Control Conference, Hiroshima, Japan, September.