
V Healthcar G Servic: A Systema Rvie M‑Analy WTA‑WTP Disparity · V Healthcar G Servic: A...
16
Vol.:(0123456789) PharmacoEconomics https://doi.org/10.1007/s40273-020-00890-x SYSTEMATIC REVIEW Valuing Healthcare Goods and Services: A Systematic Review and Meta‑Analysis on the WTA‑WTP Disparity Adriënne H. Rotteveel 1,2,3 · Mattijs S. Lambooij 1 · Nicolaas P. A. Zuithoff 2 · Job van Exel 3,4 · Karel G. M. Moons 2,5 · G. Ardine de Wit 1,2 © The Author(s) 2020 Abstract Objective The objective of this systematic review was to review the available evidence on the disparity between willingness to accept (WTA) and willingness to pay (WTP) for healthcare goods and services. Methods A tiered approach consisting of (1) a systematic review, (2) an aggregate data meta-analysis, and (3) an individual partici- pant data meta-analysis was used. MEDLINE, EMBASE, Scopus, Scisearch, and Econlit were searched for articles reporting both WTA and WTP for healthcare goods and services. Individual participant data were requested from the authors of the included studies. Results Thirteen papers, reporting WTA and WTP from 19 experiments/subgroups, were included in the review. The WTA/ WTP ratios reported in these papers, varied from 0.60 to 4.01, with means of 1.73 (median 1.31) for 15 estimates of the mean and 1.58 (median 1.00) for nine estimates of the median. Individual data obtained from six papers, covering 71.2% of the subjects included in the review, yielded an unadjusted WTA/WTP ratio of 1.86 (95% confidence interval 1.52–2.28) and a WTA/WTP ratio adjusted for age, sex, and income of 1.70 (95% confidence interval 1.42–2.02). Income category and age had a statistically significant effect on the WTA/WTP ratio. The approach to handling zero WTA and WTP values has a considerable impact on the WTA/WTP ratio found. Conclusions and Implications The results of this study imply that losses in healthcare goods and services are valued dif- ferently from gains (ratio > 1), but that the degree of disparity found depends on the method used to obtain the WTA/WTP ratio, including the approach to zero responses. Irrespective of the method used, the ratios found in our meta-analysis are smaller than the ratios found in previous meta-analyses. 1 Introduction The healthcare market is characterized by many imperfec- tions, such as asymmetric information between patients and physicians, third-party payers, and uncertainty in demand and supply. Because of these market imperfections and government regulations, the price people pay for goods and services in the healthcare market does not necessarily reflect their value to them. Therefore, unlike the market for con- sumer goods, it is difficult to use revealed preferences to determine the value of healthcare goods and services [1]. To circumvent this problem, health economists have regularly resorted to using stated preferences methods, such as con- tingent valuation, to estimate the value of healthcare [2, 3]. An important application of stated preferences for health- care is the cost-benefit analysis [4–6]. In this context, two measures have been used for valuing healthcare: willingness to pay (WTP) and willingness to accept (WTA). Willing- ness to pay measures the amount of money an individual Electronic supplementary material The online version of this article (https://doi.org/10.1007/s40273-020-00890-x) contains supplementary material, which is available to authorized users. * Adriënne H. Rotteveel [email protected] 1 Centre for Nutrition, Prevention and Health Services, National Institute for Public Health and the Environment (RIVM), PO Box 1, 3720 BA Bilthoven, The Netherlands 2 Julius Center for Health Sciences and Primary Care, University Medical Center Utrecht, Utrecht University, Utrecht, the Netherlands 3 Erasmus School of Health Policy & Management, Erasmus University Rotterdam, Rotterdam, The Netherlands 4 Erasmus School of Economics, Erasmus University Rotterdam, Rotterdam, The Netherlands 5 Cochrane Netherlands, University Medical Center Utrecht, Utrecht, The Netherlands
Transcript of V Healthcar G Servic: A Systema Rvie M‑Analy WTA‑WTP Disparity · V Healthcar G Servic: A...

Vol.:(0123456789)
PharmacoEconomics https://doi.org/10.1007/s40273-020-00890-x
SYSTEMATIC REVIEW
Valuing Healthcare Goods and Services: A Systematic Review and Meta‑Analysis on the WTA‑WTP Disparity
Adriënne H. Rotteveel1,2,3 · Mattijs S. Lambooij1 · Nicolaas P. A. Zuithoff2 · Job van Exel3,4 · Karel G. M. Moons2,5 · G. Ardine de Wit1,2
© The Author(s) 2020
AbstractObjective The objective of this systematic review was to review the available evidence on the disparity between willingness to accept (WTA) and willingness to pay (WTP) for healthcare goods and services.Methods A tiered approach consisting of (1) a systematic review, (2) an aggregate data meta-analysis, and (3) an individual partici-pant data meta-analysis was used. MEDLINE, EMBASE, Scopus, Scisearch, and Econlit were searched for articles reporting both WTA and WTP for healthcare goods and services. Individual participant data were requested from the authors of the included studies.Results Thirteen papers, reporting WTA and WTP from 19 experiments/subgroups, were included in the review. The WTA/WTP ratios reported in these papers, varied from 0.60 to 4.01, with means of 1.73 (median 1.31) for 15 estimates of the mean and 1.58 (median 1.00) for nine estimates of the median. Individual data obtained from six papers, covering 71.2% of the subjects included in the review, yielded an unadjusted WTA/WTP ratio of 1.86 (95% confidence interval 1.52–2.28) and a WTA/WTP ratio adjusted for age, sex, and income of 1.70 (95% confidence interval 1.42–2.02). Income category and age had a statistically significant effect on the WTA/WTP ratio. The approach to handling zero WTA and WTP values has a considerable impact on the WTA/WTP ratio found.Conclusions and Implications The results of this study imply that losses in healthcare goods and services are valued dif-ferently from gains (ratio > 1), but that the degree of disparity found depends on the method used to obtain the WTA/WTP ratio, including the approach to zero responses. Irrespective of the method used, the ratios found in our meta-analysis are smaller than the ratios found in previous meta-analyses.
1 Introduction
The healthcare market is characterized by many imperfec-tions, such as asymmetric information between patients and physicians, third-party payers, and uncertainty in demand and supply. Because of these market imperfections and government regulations, the price people pay for goods and services in the healthcare market does not necessarily reflect their value to them. Therefore, unlike the market for con-sumer goods, it is difficult to use revealed preferences to determine the value of healthcare goods and services [1]. To circumvent this problem, health economists have regularly resorted to using stated preferences methods, such as con-tingent valuation, to estimate the value of healthcare [2, 3].
An important application of stated preferences for health-care is the cost-benefit analysis [4–6]. In this context, two measures have been used for valuing healthcare: willingness to pay (WTP) and willingness to accept (WTA). Willing-ness to pay measures the amount of money an individual
Electronic supplementary material The online version of this article (https ://doi.org/10.1007/s4027 3-020-00890 -x) contains supplementary material, which is available to authorized users.
* Adriënne H. Rotteveel [email protected]
1 Centre for Nutrition, Prevention and Health Services, National Institute for Public Health and the Environment (RIVM), PO Box 1, 3720 BA Bilthoven, The Netherlands
2 Julius Center for Health Sciences and Primary Care, University Medical Center Utrecht, Utrecht University, Utrecht, the Netherlands
3 Erasmus School of Health Policy & Management, Erasmus University Rotterdam, Rotterdam, The Netherlands
4 Erasmus School of Economics, Erasmus University Rotterdam, Rotterdam, The Netherlands
5 Cochrane Netherlands, University Medical Center Utrecht, Utrecht, The Netherlands
A. H. Rotteveel et al.
is willing to pay for obtaining a certain healthcare good or service. Willingness to accept measures the amount of mon-etary compensation an individual wants to receive for giving up a certain healthcare good or service. The relevant meas-ure to use, thus, depends on the decision context, with WTP being used when people stand to gain something and WTA being used when people stand to lose something [4, 7, 8].
Previous studies have reported substantial differences between the WTP and WTA for the same good or service, both in hypothetical studies as well as in studies involving real transactions [9–11]. An aggregate data meta-analysis by Tunçel and Hammitt summarized the studies compar-ing WTP and WTA across different economic sectors. They reported an overall WTA/WTP ratio of 3.28, indicating that people, on average, want to receive a 3.28 times larger amount to give up a good or service than they are willing to pay to obtain this good or service. The size of the WTA/WTP ratio differed for the type of good valued, with studies on environmental goods reporting the largest WTA/WTP ratio of 6.23 on average [10]. A recent estimate of the WTA/WTP ratio for healthcare goods and services is lacking, indicating a knowledge gap on the WTA-WTP disparity for the healthcare sector. The only review reporting a separate WTA/WTP ratio for healthcare [12] dates back to 2002 and included only two studies reporting ratios of 1.9 and 6.4 [13, 14]. The more recent meta-analysis of Tunçel and Ham-mitt [10] did not look at healthcare separately, but reported a mean ratio of 5.09 for health and safety goods together. Moreover, the search for this meta-analysis dates back to early 2012 and only covered one database (i.e., Econlit), indicating that the search could be updated and expanded to more databases to identify further relevant studies in the healthcare context.
In the literature, many different explanations for a dispar-ity between WTA and WTP have been described. Accord-ing to standard economic theory, WTA and WTP should be
similar when the good valued is divisible and exchanged at zero transaction costs on an infinitely large market. If these conditions do not hold, WTA and WTP may be different. The size of this difference depends on income, the propor-tion of income that is spent on the good, and the income elasticity [5, 6]. Furthermore, the inability to substitute money for a (public) good, either because of perfect com-plementarity or because of asymptotic boundedness of the utility curve, may also be a reason for WTA to exceed WTP [15–17]. Moreover, according to several alternative eco-nomic theories, such as prospect theory, (1) people value a change from a reference point, instead of the final state after a change, and (2) the value function for losses is steeper than the value function for gains. For these reasons, WTA values are expected to be larger than WTP values [18–20].
It is important to obtain more insight into the WTA/WTP ratio for healthcare goods and services, as a dispar-ity between WTA and WTP has important implications for healthcare decision making, for example for reimbursement decision making. If WTA is larger than WTP, a higher cost-effectiveness threshold may be used for decisions on stop-ping reimbursement of healthcare interventions as compared to decisions on starting reimbursement, in other words, the cost-effectiveness ratio should probably be significantly less favorable for disinvestment to be welfare improving. In line with this, insight into the WTA/WTP ratio for healthcare goods and services may be helpful to better understand reim-bursement decision making as policy makers seem to find it more difficult to discontinue reimbursement than not to start reimbursement in the first place [21]. It may, therefore, also be important for researchers in the field of cost-benefit analysis of healthcare interventions and preference elicita-tion to obtain more insight into the WTA/WTP ratio for healthcare goods and services, as insight into this issue pro-vides guidance on choosing the appropriate measure of the value of healthcare interventions given the decision context at hand, i.e., investment vs disinvestment of healthcare goods and services. Furthermore, insight into the WTA/WTP ratio for healthcare goods and services may be helpful in under-standing the general reluctance of patients to change treat-ment despite potential advantages [22, 23], indicating that for a new treatment to be welfare improving, it should offer substantially higher benefits to the patient than the current treatment.
The aim of this study is to review the available evidence on the disparity between WTA and WTP for healthcare goods and services to obtain an aggregated estimate of the WTA/WTP ratio for healthcare goods and services. To this end, we used a comprehensive tiered approach consisting of (1) a systematic review, (2) an aggregate data meta-analysis (AD-MA), and (3) an individual participant data meta-analysis (IPD-MA). First, the systematic review pro-vides an overview of published studies that compared WTP
Key Points
This study summarizes the evidence on the monetary valuation of losses in healthcare goods and services as compared to equally sized gains. It shows that people, generally, value losses 1.58–1.86 times higher than equally sized gains.
The results of this study provide more evidence to explain the observed difficulty of disinvesting healthcare goods and services.
The results of this study may imply the possibility of using different cost-effectiveness thresholds for decisions on starting vs stopping the reimbursement of healthcare.
Systematic Review and Meta-Analysis on the WTA-WTP Disparity for Healthcare Goods and Services
and WTA for healthcare goods and services. Second, the AD-MA combines the estimates as reported in these studies. Finally, the IPD-MA enables us to calculate one overall esti-mate of the WTA-WTP disparity, to obtain more insight into the statistical and methodological uncertainty surrounding this estimate, and to correct the estimate for subject charac-teristics. The IPD-MA approach has not been applied before to estimate the WTA/WTP ratio. Hence, this study adds a new level of information to the previous literature.
2 Methods
2.1 Systematic Review
The databases MEDLINE, EMBASE, Scopus, Scisearch, and Econlit were searched from inception to the search date (i.e., 9 or 13 February, 2017) using WTP and WTA (and varia-tions thereof) in the title, abstract, or as keywords. For the databases that do not solely focus on health (i.e., Scopus, Sci-search, and Econlit), the search strategy was extended with health-related search terms. The full search strategies are displayed in Electronic supplementary material: Appendix A.
After deduplication, titles and abstracts were screened for eligibility by two reviewers using the eligibility criteria in Table 1. If eligibility was not clear from the title and abstract, the article was included in full-text screening to ensure that no eligible papers would be missed. Differences between reviewers were resolved by discussion. If a con-sensus was not reached, a third reviewer was consulted. Full-text articles of all included abstracts were retrieved and screened for eligibility by one reviewer. If the reviewer was unsure about eligibility, the other reviewers were consulted.
For each included article, the estimate of the WTA/WTP ratio was extracted. If several estimates for different sub-groups or experiments were provided, all these estimates were extracted. Next to the WTA/WTP ratio, the following (study) characteristics were extracted: first author, year, country, good/service valued, number of study subjects (N), subject sample type, within- vs between-subject design, elicitation method, administration method, payment vehicle, and payment fre-quency (see Electronic supplementary material: Appendix B).
2.2 Aggregate Data Meta‑Analysis
From the WTA/WTP estimates extracted in the systematic review, an overall WTA/WTP ratio was calculated. This was calculated by taking the mean and median from the WTA/WTP estimates as reported by the studies. If studies only reported mean/median WTA and WTP at the study level (i.e., not a ratio), the WTA/WTP ratio at the study level was calculated by dividing WTA by WTP. Next to the mean and median, a weighted average WTA/WTP ratio was calculated to take account of large differences in the number of subjects and number of estimates retrieved from stud-ies [10, 11]. The estimates from the studies were weighted using this formula:
where N is the sample size of estimate k from study i and K is the number of estimates provided by study i. As the aggre-gate WTA/WTP estimates were reported in different formats (i.e., mean, median, or regression model estimate), overall WTA/WTP ratios were calculated for each format separately.
2.3 Individual Participant Data Meta‑Analysis
Individual participant data (IPD) on WTP, WTA, age, sex, and income were requested by sending an e-mail to the cor-responding authors of the papers included in the AD-MA. If it was not possible to contact the corresponding author, other authors were e-mailed. If necessary, the authors were reminded twice. The retrieved IPD were analyzed using three approaches increasing in complexity, which are described in the subsequent three paragraphs.
2.3.1 Descriptive Analyses
Received datasets were merged and harmonized into one dataset for analysis. To facilitate comparison and analysis, all WTP and WTA values were converted to the same base year and currency unit (i.e., 2017 Euros, Dutch price level) using the OECD purchasing power parities [24] and the consumer price index from Statistics Netherlands [25]. To test whether the studies included in the IPD-MA were dif-ferent from the studies included in the AD-MA, an overall WTA/WTP ratio was calculated in a similar manner to the AD-MA. To this end, study-level WTA/WTP ratios were calculated by dividing mean/median WTA at the study level by mean/median WTP at the study level. From these study-level WTA/WTP ratios, overall estimates were calculated by taking the mean, median, and weighted average from these estimates.
√
Nik
√
Ki
,
Table 1 Eligibility criteria for the systematic review
Empirical studies (stated preferences)Providing both willingness-to-pay and willingness-to-accept esti-
mates: for a comparable change in healthcare goods or services elicited in (1) the same subject or (2) two randomly allocated groups
from the same samplePublished in English or DutchFull text available

A. H. Rotteveel et al.
2.3.2 Mixed‑Model Analysis
Of the 4213 subjects included in the IPD dataset, 302 sub-jects (7%) had a missing value on WTP, 218 subjects (5%) had a missing value on WTA, 1107 subjects (26%) had a missing value on both WTP and WTA, and 435 subjects (10%) had a missing value on income. As a complete case analysis, i.e., exclusion of respondents with missing values, may introduce bias, multiple imputation of WTA, WTP, and income was used. The imputation model used data on age, sex, income, country of study, and converted WTA and WTP. We used a fully conditional specification with predic-tive mean matching to impute WTP and WTA when one was available and one was missing. The 1107 subjects with both WTP and WTA missing were excluded because they missed both parameters of interest for this study. Data were imputed ten times. All analyses were performed on each dataset sepa-rately and, subsequently, the results were pooled according to Rubin’s rule [26]. As WTP, WTA, and the WTA/WTP ratio were not normally distributed, the data were then log-transformed. As a result, respondents with WTA or WTP of zero were excluded from the analysis. As income was measured on different scales in different studies, income was dichotomized, based on median income (category) at the study level as a cut-off point. Subsequently, the log of WTA/WTP ratio was estimated with a linear mixed model. A ran-dom intercept was included to reflect any heterogeneity over studies in this outcome. The analysis was performed once without correction for covariates and once with correction for age, sex, and income. All analyses were performed with SAS 9.4 software (SAS Institute Inc., Cary, NC, USA).
2.3.3 Sensitivity Analyses: Zero Willingness to Pay and/or Willingness to Accept
In the AD-MA and the descriptive analysis of IPD, data of subjects with zero WTP and/or WTA were included in the analysis. In the mixed-model analysis of IPD, subjects with zero responses were excluded from the analysis because log-transformation of zero WTP and/or WTA is not possible. The best approach to dealing with zero responses in this context depends on the reasons behind zero responses (e.g., protest responses, not understanding the task, or an actual very low/zero valuation [27–29]). In this meta-analysis, we were not able to determine the reason behind zero responses. There-fore, to assess the potential impact of our main approach to zero responses on the WTA/WTP ratios, we conducted two sensitivity analyses. The first sensitivity analysis is the same as the descriptive analysis of IPD as described in Sect. 2.3.1; however, excluding subjects reporting zero WTP and/or WTA. The second sensitivity analysis is the same as the mixed-model analysis, described in Sect. 2.3.2; how-ever, including subjects reporting zero WTP and/or WTA,
by replacing their zero value by one-half, one-third, or one-quarter of the smallest value reported in the study concerned. This approach especially makes sense if subjects reported zero values because their WTP or WTA was too small to be picked up by the elicitation procedure used.
3 Results
3.1 Systematic Review
Databases were searched on the 9 February, 2017 (MED-LINE and EMBASE) and 13 Feburary, 2017 (Scopus, Sci-search, and Econlit). In total, 396 records were identified of which, after removal of 231 duplicates, 165 remained for title and abstract screening. Of the 31 articles that were included in full-text screening, 13 were included in the review (see Electronic supplementary material: Appendix C). Figure 1 displays the PRISMA (Preferred Reporting Items for Systematic Reviews and Meta-Analyses) flow diagram.
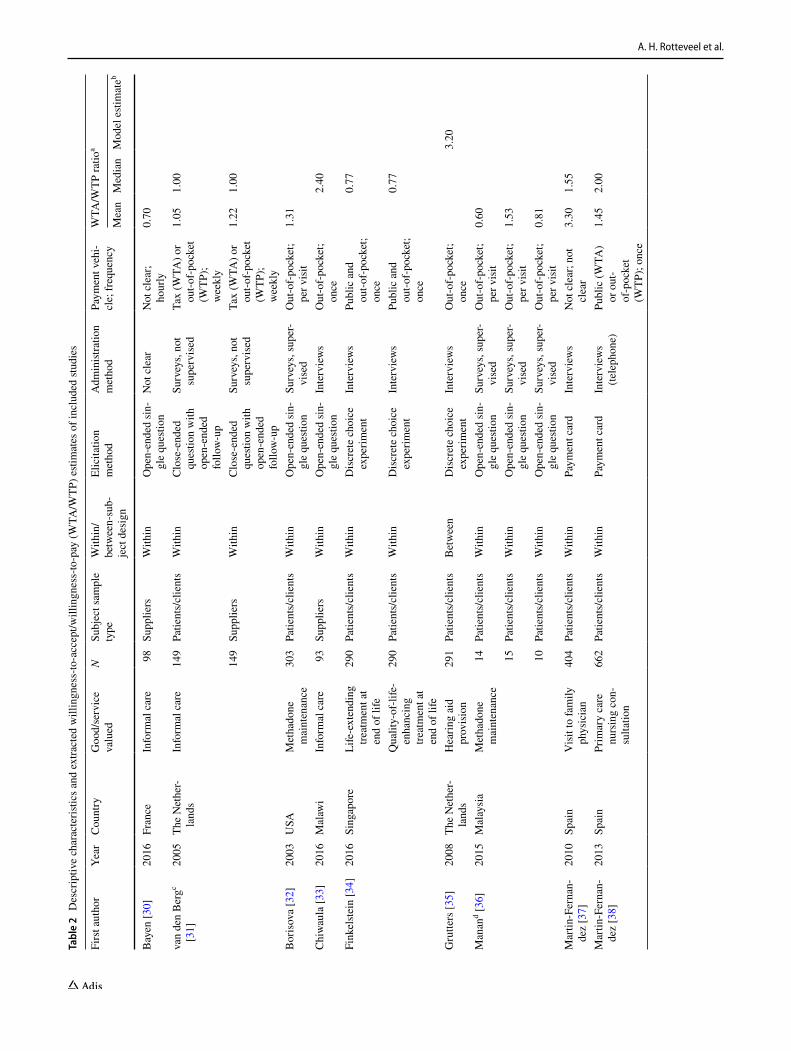
Table 2 displays the descriptive characteristics and the extracted WTA/WTP ratios of the studies included in the systematic review. The 13 included studies provided esti-mates for 19 different experiments or subgroups.
3.2 Aggregate Data Meta‑Analysis
The WTA/WTP ratios calculated from the extracted WTA/WTP estimates are displayed in Table 3. A mean WTA/WTP ratio of 1.73 for 15 mean estimates and a mean ratio of 1.58 for nine median estimates were found. The weighted average was 1.87 for mean estimates and 1.55 for median estimates. The small differences between the crude and weighted aver-ages indicate that the estimates provided by studies with more subjects and/or more experiments/subgroups were not very different from other studies. One study [35] did not report mean or median, but reported a regression model esti-mate of the WTA/WTP ratio instead. This estimate of 3.20 was relatively high compared with the mean WTA/WTP ratio for mean and median estimates.
3.3 Individual Participant Data Meta‑Analysis
From the 13 studies included in the AD-MA, six datasets were obtained for inclusion in the IPD-MA (see Fig. 1). For the remaining seven studies, the data could not be included because of non-response (n = 3) or because the authors were not able to send the data (n = 4). The six datasets received covered 71.2% of the subjects who were included in the AD-MA, implying that the samples we could not include were relatively small compared with the samples we were able to obtain.

Systematic Review and Meta-Analysis on the WTA-WTP Disparity for Healthcare Goods and Services
3.3.1 Descriptive Analyses
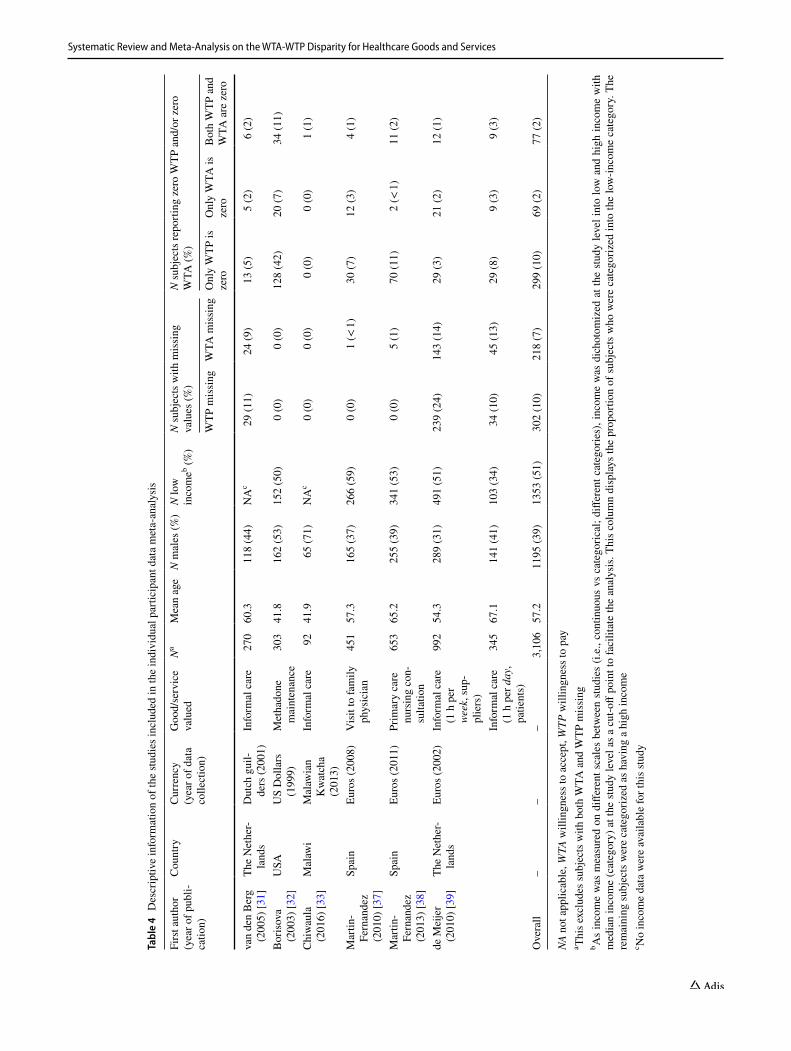
Descriptive information of the six datasets received is dis-played in Table 4. Of the 4213 subjects included in the six datasets, 1107 subjects were excluded from the analy-sis because they had both WTP and WTA missing. Of the remaining 3106 subjects, 299 subjects (10%) reported a WTP of zero, 69 subjects (2%) a WTA of zero, and 77
subjects (2%) both a WTP and a WTA of zero. This left 2661 subjects for the mixed-model analyses.
Table 5 displays the WTP and WTA per study after conversion to 2017 Euros (for raw data, see Electronic supplementary material: Appendix D) and the results of the descriptive analysis. The study-level estimates of the WTA/WTP ratios were similar to the estimates found in the AD-MA. This indicates that the subsample of studies
Records identified through database searching
Medline (n = 63)Scopus (n = 131)Embase (n = 67)
SciSearch (n = 86)Econlit (n=49)
Screen
ing
Includ
edEligibility
Iden
tification
Additional records identified through other sources
(n = 0)
Records after duplicates removed(n = 165)
Records screened(n = 165)
Records excluded, with reasons:No WTA and/or WTP (n = 28)
Not a health good (n = 36)Not an empirical study (n = 65)
WTA and WTP elicited in different samples (n = 4)
Duplicate (n = 1)
Full-text articles assessed for eligibility
(n = 31)
Full-text articles excluded, with reasons:
No WTA and/or WTP (n = 9)Not a health good (n = 4)
Not an empirical study (n = 2)WTA and WTP elicited in different
samples (n = 2)WTA and WTP scenario not
comparable (n = 1)
Studies included in systematic review
(n = 13)
Studies included in AD meta-analysis
(n = 13)
Not included in IPD meta-analysis, with reasons:
No response (n=3)Not possible to send data (n=4)
Studies included in IPDmeta-analysis
(n = 6)
SRAD
-MA
IPD-MA
Fig. 1 PRISMA (Preferred Reporting Items for Systematic Reviews and Meta-Analyses) flow diagram. AD aggregate data, IPD individual par-ticipant data, MA meta-analysis, SR systematic review, WTA willingness to accept, WTP willingness to pay
A. H. Rotteveel et al.
Tabl
e 2
Des
crip
tive
char
acte
ristic
s and
ext
ract
ed w
illin
gnes
s-to
-acc
ept/w
illin
gnes
s-to
-pay
(WTA
/WTP
) esti
mat
es o
f inc
lude
d stu
dies
Firs
t aut
hor
Year
Cou
ntry
Goo
d/se
rvic
e va
lued
NSu
bjec
t sam
ple
type
With
in/
betw
een-
sub-
ject
des
ign
Elic
itatio
n m
etho
dA
dmin
istra
tion
met
hod
Paym
ent v
ehi-
cle;
freq
uenc
yW
TA/W
TP ra
tioa
Mea
nM
edia
nM
odel
esti
mat
eb
Bay
en [3
0]20
16Fr
ance
Info
rmal
car
e98
Supp
liers
With
inO
pen-
ende
d si
n-gl
e qu
estio
nN
ot c
lear
Not
cle
ar;
hour
ly0.
70
van
den
Ber
gc [3
1]20
05Th
e N
ethe
r-la
nds
Info
rmal
car
e14
9Pa
tient
s/cl
ient
sW
ithin
Clo
se-e
nded
qu
estio
n w
ith
open
-end
ed
follo
w-u
p
Surv
eys,
not
supe
rvis
edTa
x (W
TA) o
r ou
t-of-
pock
et
(WTP
); w
eekl
y
1.05
1.00
149
Supp
liers
With
inC
lose
-end
ed
ques
tion
with
op
en-e
nded
fo
llow
-up
Surv
eys,
not
supe
rvis
edTa
x (W
TA) o
r ou
t-of-
pock
et
(WTP
); w
eekl
y
1.22
1.00
Bor
isov
a [3
2]20
03U
SAM
etha
done
m
aint
enan
ce30
3Pa
tient
s/cl
ient
sW
ithin
Ope
n-en
ded
sin-
gle
ques
tion
Surv
eys,
supe
r-vi
sed
Out
-of-
pock
et;
per v
isit
1.31
Chi
wau
la [3
3]20
16M
alaw
iIn
form
al c
are
93Su
pplie
rsW
ithin
Ope
n-en
ded
sin-
gle
ques
tion
Inte
rvie
ws
Out
-of-
pock
et;
once
2.40
Fink
elste
in [3
4]20
16Si
ngap
ore
Life
-ext
endi
ng
treat
men
t at
end
of li
fe
290
Patie
nts/
clie
nts
With
inD
iscr
ete
choi
ce
expe
rimen
tIn
terv
iew
sPu
blic
and
ou
t-of-
pock
et;
once
0.77
Qua
lity-
of-li
fe-
enha
ncin
g tre
atm
ent a
t en
d of
life
290
Patie
nts/
clie
nts
With
inD
iscr
ete
choi
ce
expe
rimen
tIn
terv
iew
sPu
blic
and
ou
t-of-
pock
et;
once
0.77
Gru
tters
[35]
2008
The
Net
her-
land
sH
earin
g ai
d pr
ovis
ion
291
Patie
nts/
clie
nts
Bet
wee
nD
iscr
ete
choi
ce
expe
rimen
tIn
terv
iew
sO
ut-o
f-po
cket
; on
ce3.
20
Man
and [3
6]20
15M
alay
sia
Met
hado
ne
mai
nten
ance
14Pa
tient
s/cl
ient
sW
ithin
Ope
n-en
ded
sin-
gle
ques
tion
Surv
eys,
supe
r-vi
sed
Out
-of-
pock
et;
per v
isit
0.60
15Pa
tient
s/cl
ient
sW
ithin
Ope
n-en
ded
sin-
gle
ques
tion
Surv
eys,
supe
r-vi
sed
Out
-of-
pock
et;
per v
isit
1.53
10Pa
tient
s/cl
ient
sW
ithin
Ope
n-en
ded
sin-
gle
ques
tion
Surv
eys,
supe
r-vi
sed
Out
-of-
pock
et;
per v
isit
0.81
Mar
tin-F
erna
n-de
z [3
7]20
10Sp
ain
Vis
it to
fam
ily
phys
icia
n40
4Pa
tient
s/cl
ient
sW
ithin
Paym
ent c
ard
Inte
rvie
ws
Not
cle
ar; n
ot
clea
r3.
301.
55
Mar
tin-F
erna
n-de
z [3
8]20
13Sp
ain
Prim
ary
care
nu
rsin
g co
n-su
ltatio
n
662
Patie
nts/
clie
nts
With
inPa
ymen
t car
dIn
terv
iew
s (te
leph
one)
Publ
ic (W
TA)
or o
ut-
of-p
ocke
t (W
TP);
once
1.45
2.00

Systematic Review and Meta-Analysis on the WTA-WTP Disparity for Healthcare Goods and Services
NH
S N
atio
nal H
ealth
Ser
vice
a Alm
ost a
ll es
timat
es a
re ra
tios o
f mea
n/m
edia
n W
TA a
nd W
TP. O
nly
Mar
tin-F
erna
ndez
et a
l. re
porte
d m
ean
and
med
ian
of in
divi
dual
WTA
/WTP
ratio
sb R
esul
t esti
mat
ed w
ith a
regr
essi
on m
odel
for a
per
son
with
med
ian
patie
nt c
hara
cter
istic
sc Th
is s
tudy
repo
rted
four
esti
mat
es fo
r tw
o di
ffere
nt e
xper
imen
ts c
onta
inin
g tw
o su
bgro
ups
each
. The
dat
a of
the
subj
ects
incl
uded
in th
e se
cond
exp
erim
ent (
amon
g in
form
al c
areg
iver
s an
d th
eir c
are
reci
pien
ts) w
ere
also
fully
incl
uded
in th
e stu
dy o
f de
Mei
jer e
t al.
and
wer
e, th
eref
ore,
not
ext
ract
edd Ex
perim
ents
diff
ered
in h
ouse
hold
inco
me
of th
e su
bjec
ts (i
.e.,
low
, med
ium
, and
hig
h)e Ex
perim
ents
diff
ered
in th
e ba
selin
e ca
ncer
risk
(i.e
., 1/
100
or 1
/200
in th
e ne
xt 5
yea
rs).
Med
ian
WTP
for t
he fi
rst e
xper
imen
t is z
ero.
Hen
ce, t
he ra
tio c
ould
not
be
calc
ulat
edf Th
is ra
tio c
ould
not
be
calc
ulat
ed a
s med
ian
WTP
is z
ero
Tabl
e 2
(con
tinue
d)
Firs
t aut
hor
Year
Cou
ntry
Goo
d/se
rvic
e va
lued
NSu
bjec
t sam
ple
type
With
in/
betw
een-
sub-
ject
des
ign
Elic
itatio
n m
etho
dA
dmin
istra
tion
met
hod
Paym
ent v
ehi-
cle;
freq
uenc
yW
TA/W
TP ra
tioa
Mea
nM
edia
nM
odel
esti
mat
eb
de M
eije
r [39
]20
10Th
e N
ethe
r-la
nds
Info
rmal
car
e28
9Pa
tient
s/cl
ient
sW
ithin
Ope
n-en
ded
sin-
gle
ques
tion
Surv
eys,
not
supe
rvis
edPu
blic
(WTA
) or
out
-of
-poc
ket
(WTP
); w
eekl
y
1.30
983
Supp
liers
With
inO
pen-
ende
d si
n-gl
e qu
estio
nSu
rvey
s, no
t su
perv
ised
Publ
ic (W
TA)
or o
ut-
of-p
ocke
t (W
TP);
wee
kly
1.15
O’B
riene [1
3]19
98U
SAFi
lgra
stim
(can
-ce
r dru
g)10
7G
ener
al p
ublic
With
inD
iscr
ete
choi
ce
expe
rimen
tIn
terv
iew
sIn
sura
nce
prem
ium
, m
onth
ly
2.38
NA
f
109
Gen
eral
pub
licW
ithin
Dis
cret
e ch
oice
ex
perim
ent
Inte
rvie
ws
Insu
ranc
e pr
emiu
m,
mon
thly
1.61
3.75
Tsuj
i [40
]20
04Ja
pan
Tele
heal
th23
0Pa
tient
s/cl
ient
sW
ithin
Paym
ent c
ard
Surv
eys,
not
supe
rvis
edO
ut-o
f-po
cket
, m
onth
ly3.
601.
00
Why
nes [
41]
2007
UK
Pedi
atric
coc
h-le
ar im
plan
ta-
tion
(hea
ring
devi
ce)
64Pa
rent
s/gu
ard-
ians
With
inIte
rate
d cl
ose-
ende
d qu
es-
tion/
bid
ding
ga
me
Inte
rvie
ws
Publ
ic (N
HS)
; m
onth
ly4.
01

A. H. Rotteveel et al.
included in the IPD-MA was not that different from all stud-ies included in the AD-MA. Electronic supplementary mate-rial: Appendix E shows the WTA/WTP ratio for different levels of age, sex, and income. As expected, the ratio was higher in people with a lower income compared with people with a higher income. Furthermore, the two intermediate age groups reported lower WTA/WTP ratios compared with the youngest and the oldest age category.
3.3.2 Mixed‑Model Analysis
Table 6 displays the results of the mixed-model analysis. The unadjusted WTA/WTP ratio was 1.86 (95% confidence interval 1.52–2.28). Age and income category both had a statistically significant effect on the WTA/WTP ratio found. The Table in Electronic supplementary material: Appendix F displays the ln(WTA/WTP ratio) and the WTA/WTP ratio for different groups of subjects. The figures in Electronic supplementary material: Appendix F display the trend of the WTA/WTP ratio for different types of subjects, based on the ln(WTA/WTP) slope estimates. The largest difference in the WTA/WTP ratio of 0.45 was found between high-income 30-year-old individuals and low-income 65-year-old indi-viduals. Furthermore, the difference between the low- and high-income groups increased with increasing WTA and WTP values.
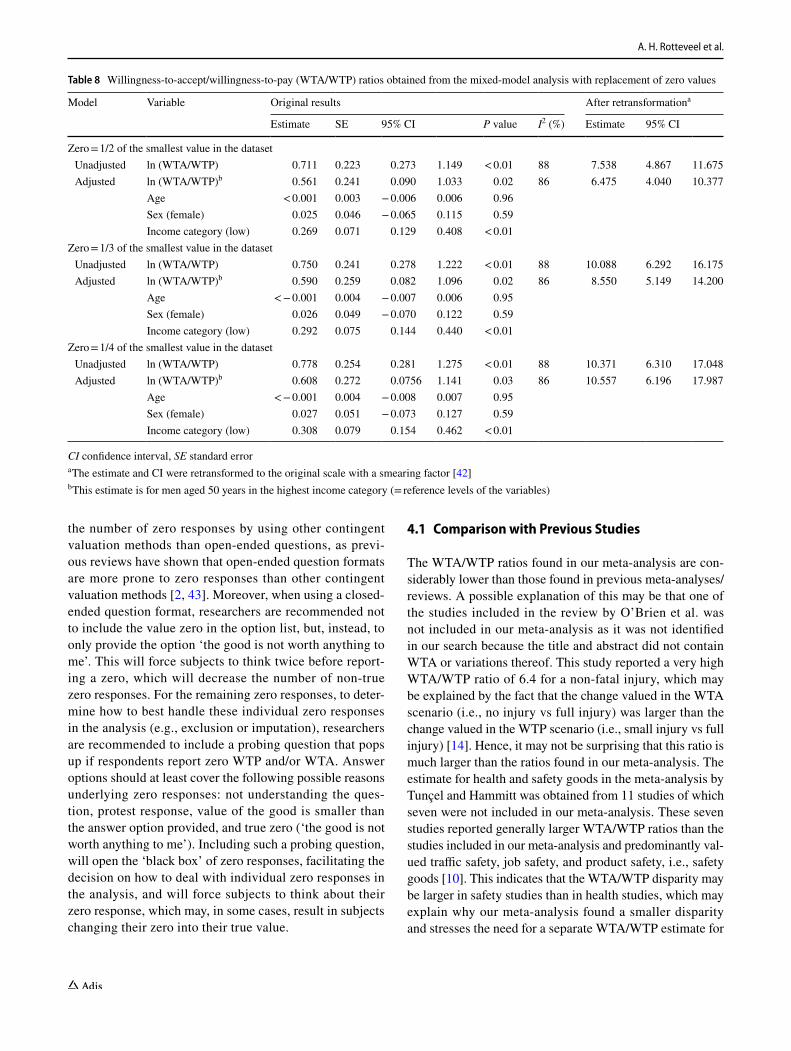
3.3.3 Sensitivity Analysis: Zero Willingness‑to‑Pay and/or Willingness‑to‑Accept Values
The merged dataset contained 445 subjects (14%) with a WTA, WTP, or both WTA and WTP of zero (Table 4). Table 7 displays the results of the first sensitivity analysis. These results have been obtained in the same manner as the results in Table 5, only with exclusion of the 445 subjects reporting zero WTA and/or WTP. This analysis shows that the exclusion of zero WTA and/or WTP generally resulted in lower WTA/WTP ratios, with this effect being most pronounced for the mean and median WTA/WTP ratios
obtained from average WTA and WTP at the study level compared with those obtained from median WTA and WTP at the study level. Furthermore, unsurprisingly, the impact was largest in the studies with more subjects reporting zero WTP.
Table 8 displays the results of the second sensitivity analysis, the mixed-model analysis with replacement of zero values with either one-half, one-third, or one-quarter of the smallest value reported in the study from which the subjects reporting zero WTA and/or WTP originated from. These results have been obtained in a similar manner to the results in Table 6. The estimated WTA/WTP ratios were much larger when zeroes were replaced by a small value compared with when zeroes were excluded from the analysis. This may partly be caused by the large smearing factors in the sensitiv-ity analyses (3.7–5.7 in the sensitivity analyses vs 1.3 in the original analysis) caused by the artificial “spike” at the lower end of the distribution because of the imputation of zeroes with small values. The estimated WTA/WTP ratios were larger when the replacement values were smaller.
4 Discussion
The aim of this study was to review the available evidence on the disparity between WTA and WTP for healthcare goods and services using a comprehensive tiered approach consisting of (1) a systematic review, (2) an AD-MA, and (3) an individual participant data meta-analysis. In the AD-MA, we found an average WTA/WTP ratio of 1.73 (median 1.31) for mean estimates and of 1.58 (median 1.00) for median estimates. In the IPD-MA, we found an uncorrected WTA/WTP ratio of 1.86 (95% confidence interval 1.52–2.28) and a WTA/WTP ratio adjusted for age, sex, and income of 1.70 (95% confidence interval 1.42–2.02). The approach to deal with zero WTP and/or WTA values considerably impacted the WTA/WTP ratio found.
This study found a significant effect of income category and age on the WTA/WTP ratio. No effect of sex was found. As previous meta-analyses on WTA and WTP have not tested the effect of age, sex, and income on the WTA/WTP ratio, it is not possible to compare these findings with other studies. However, these findings seem to correspond with the well-known income effect, which says that because WTP is constrained by income while WTA is not, there may be a substantial disparity between WTA and WTP when (1) the change concerned is large, (2) the value of the good concerned is high, or (3) the income elasticity for the good concerned is high and increasing with income [5, 15]. The reason for this is that when the value of the good increases, the WTP will increase until the income constraint is reached, while WTA would become infinite. As people with lower incomes have a lower income constraint than people with
Table 3 Willingness-to-accept/willingness-to-pay estimates obtained from aggregate data
NA not applicable as it concerns one estimate
Mean estimates Median estimates
Regression model esti-mates
Mean 1.73 1.58 3.20Weighted average 1.87 1.55 NAMedian 1.31 1.00 3.20Number of estimates
(from number of studies)
15 (10) 9 (7) 1 (1)
Systematic Review and Meta-Analysis on the WTA-WTP Disparity for Healthcare Goods and Services
Tabl
e 4
Des
crip
tive
info
rmat
ion
of th
e stu
dies
incl
uded
in th
e in
divi
dual
par
ticip
ant d
ata
met
a-an
alys
is
NA n
ot a
pplic
able
, WTA
will
ingn
ess t
o ac
cept
, WTP
will
ingn
ess t
o pa
ya Th
is e
xclu
des s
ubje
cts w
ith b
oth
WTA
and
WTP
mis
sing
b As
inco
me
was
mea
sure
d on
diff
eren
t sca
les
betw
een
studi
es (i
.e.,
cont
inuo
us v
s ca
tego
rical
; diff
eren
t cat
egor
ies)
, inc
ome
was
dic
hoto
miz
ed a
t the
stu
dy le
vel i
nto
low
and
hig
h in
com
e w
ith
med
ian
inco
me
(cat
egor
y) a
t the
stud
y le
vel a
s a c
ut-o
ff po
int t
o fa
cilit
ate
the
anal
ysis
. Thi
s col
umn
disp
lays
the
prop
ortio
n of
subj
ects
who
wer
e ca
tego
rized
into
the
low
-inco
me
cate
gory
. The
re
mai
ning
subj
ects
wer
e ca
tego
rized
as h
avin
g a
high
inco
me
c No
inco
me
data
wer
e av
aila
ble
for t
his s
tudy
Firs
t aut
hor
(yea
r of p
ubli-
catio
n)
Cou
ntry
Cur
renc
y (y
ear o
f dat
a co
llect
ion)
Goo
d/se
rvic
e va
lued
Na
Mea
n ag
eN
mal
es (%
)N
low
in
com
eb (%)
N su
bjec
ts w
ith m
issi
ng
valu
es (%
)N
subj
ects
repo
rting
zer
o W
TP a
nd/o
r zer
o W
TA (%
)
WTP
mis
sing
WTA
mis
sing
Onl
y W
TP is
ze
roO
nly
WTA
is
zero
Bot
h W
TP a
nd
WTA
are
zer
o
van
den
Ber
g (2
005)
[31]
The
Net
her-
land
sD
utch
gui
l-de
rs (2
001)
Info
rmal
car
e27
060
.311
8 (4
4)N
Ac
29 (1
1)24
(9)
13 (5
)5
(2)
6 (2
)
Bor
isov
a (2
003)
[32]
USA
US
Dol
lars
(1
999)
Met
hado
ne
mai
nten
ance
303
41.8
162
(53)
152
(50)
0 (0
)0
(0)
128
(42)
20 (7
)34
(11)
Chi
wau
la
(201
6) [3
3]M
alaw
iM
alaw
ian
Kw
atch
a (2
013)
Info
rmal
car
e92
41.9
65 (7
1)N
Ac
0 (0
)0
(0)
0 (0
)0
(0)
1 (1
)
Mar
tin-
Fern
ande
z (2
010)
[37]
Spai
nEu
ros (
2008
)V
isit
to fa
mily
ph
ysic
ian
451
57.3
165
(37)
266
(59)
0 (0
)1
(< 1)
30 (7
)12
(3)
4 (1
)
Mar
tin-
Fern
ande
z (2
013)
[38]
Spai
nEu
ros (
2011
)Pr
imar
y ca
re
nurs
ing
con-
sulta
tion
653
65.2
255
(39)
341
(53)
0 (0
)5
(1)
70 (1
1)2
(< 1)
11 (2
)
de M
eije
r (2
010)
[39]
The
Net
her-
land
sEu
ros (
2002
)In
form
al c
are
(1 h
per
we
ek, s
up-
plie
rs)
992
54.3
289
(31)
491
(51)
239
(24)
143
(14)
29 (3
)21
(2)
12 (1
)
Info
rmal
car
e (1
h p
er d
ay,
patie
nts)
345
67.1
141
(41)
103
(34)
34 (1
0)45
(13)
29 (8
)9
(3)
9 (3
)
Ove
rall
––
–3,
106
57.2
1195
(39)
1353
(51)
302
(10)
218
(7)
299
(10)
69 (2
)77
(2)
A. H. Rotteveel et al.
higher incomes, the WTA-WTP disparity should be larger for people with lower incomes than for people with higher incomes, as was indeed was found in this study.
To obtain an impression of the impact of our approach to zero WTP and/or WTA responses in our main analyses, we have conducted two sensitivity analyses. The results of these sensitivity analyses indicate that the approach to dealing with subjects reporting zero WTP and/or WTA may considerably affect the WTA/WTP ratio. To our knowledge, the issue on how to deal with zero WTP and WTA has not received much attention in the scientific liter-ature so far. To determine the best approach to dealing with zero responses, it is important to know the rationale behind reporting zeroes in stated preference studies. Qualitative
inquiry during or directly after the administration of the WTP and WTA task may provide more insight into the reasons behind zero responses and subsequently provide guidance on the most valid approach of dealing with zero responses (which may be another approach than was used in this meta-analysis). Some studies already included follow-up questions when eliciting WTP and found that zero responses may be protest responses as well as real zeroes [27–29]. However, more research on the rationale behind zero responses and the best approach to deal with these zero responses in the analysis is warranted. Further-more, to prevent analysis and interpretation problems with regard to zero WTP and/or WTA such as encountered in our review, we recommend future research to decrease
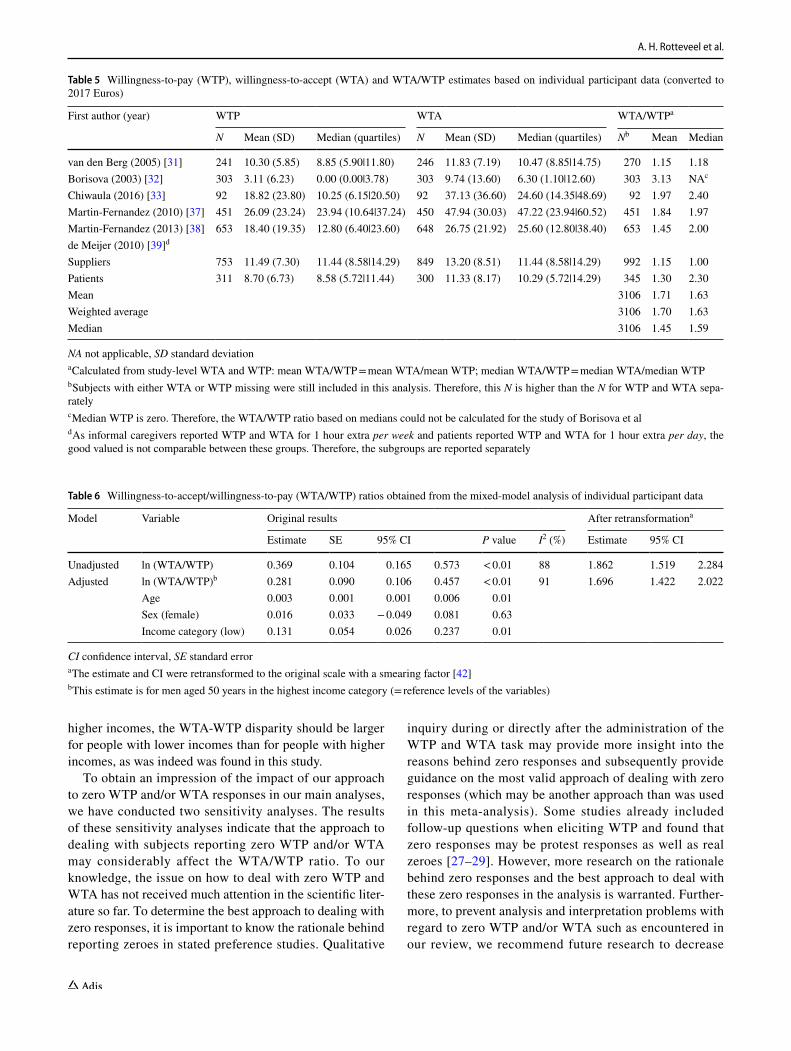
Table 5 Willingness-to-pay (WTP), willingness-to-accept (WTA) and WTA/WTP estimates based on individual participant data (converted to 2017 Euros)
NA not applicable, SD standard deviationa Calculated from study-level WTA and WTP: mean WTA/WTP = mean WTA/mean WTP; median WTA/WTP = median WTA/median WTPb Subjects with either WTA or WTP missing were still included in this analysis. Therefore, this N is higher than the N for WTP and WTA sepa-ratelyc Median WTP is zero. Therefore, the WTA/WTP ratio based on medians could not be calculated for the study of Borisova et ald As informal caregivers reported WTP and WTA for 1 hour extra per week and patients reported WTP and WTA for 1 hour extra per day, the good valued is not comparable between these groups. Therefore, the subgroups are reported separately
First author (year) WTP WTA WTA/WTPa
N Mean (SD) Median (quartiles) N Mean (SD) Median (quartiles) Nb Mean Median
van den Berg (2005) [31] 241 10.30 (5.85) 8.85 (5.90|11.80) 246 11.83 (7.19) 10.47 (8.85|14.75) 270 1.15 1.18Borisova (2003) [32] 303 3.11 (6.23) 0.00 (0.00|3.78) 303 9.74 (13.60) 6.30 (1.10|12.60) 303 3.13 NAc
Chiwaula (2016) [33] 92 18.82 (23.80) 10.25 (6.15|20.50) 92 37.13 (36.60) 24.60 (14.35|48.69) 92 1.97 2.40Martin-Fernandez (2010) [37] 451 26.09 (23.24) 23.94 (10.64|37.24) 450 47.94 (30.03) 47.22 (23.94|60.52) 451 1.84 1.97Martin-Fernandez (2013) [38] 653 18.40 (19.35) 12.80 (6.40|23.60) 648 26.75 (21.92) 25.60 (12.80|38.40) 653 1.45 2.00de Meijer (2010) [39]d
Suppliers 753 11.49 (7.30) 11.44 (8.58|14.29) 849 13.20 (8.51) 11.44 (8.58|14.29) 992 1.15 1.00Patients 311 8.70 (6.73) 8.58 (5.72|11.44) 300 11.33 (8.17) 10.29 (5.72|14.29) 345 1.30 2.30Mean 3106 1.71 1.63Weighted average 3106 1.70 1.63Median 3106 1.45 1.59
Table 6 Willingness-to-accept/willingness-to-pay (WTA/WTP) ratios obtained from the mixed-model analysis of individual participant data
CI confidence interval, SE standard errora The estimate and CI were retransformed to the original scale with a smearing factor [42]b This estimate is for men aged 50 years in the highest income category (= reference levels of the variables)
Model Variable Original results After retransformationa
Estimate SE 95% CI P value I2 (%) Estimate 95% CI
Unadjusted ln (WTA/WTP) 0.369 0.104 0.165 0.573 < 0.01 88 1.862 1.519 2.284Adjusted ln (WTA/WTP)b 0.281 0.090 0.106 0.457 < 0.01 91 1.696 1.422 2.022
Age 0.003 0.001 0.001 0.006 0.01Sex (female) 0.016 0.033 − 0.049 0.081 0.63Income category (low) 0.131 0.054 0.026 0.237 0.01

Systematic Review and Meta-Analysis on the WTA-WTP Disparity for Healthcare Goods and Services
Tabl
e 7
Will
ingn
ess-
to-p
ay (W
TP),
will
ingn
ess-
to-a
ccep
t (W
TA) a
nd W
TA/W
TP e
stim
ates
bas
ed o
n in
divi
dual
par
ticip
ant d
ata
(con
verte
d to
201
7 Eu
ros)
, with
exc
lusi
on o
f sub
ject
s rep
ortin
g ze
ro W
TA a
nd/o
r WTP
SD st
anda
rd d
evia
tion
a Thes
e su
bjec
ts w
ere
excl
uded
from
this
ana
lysi
s. A
part
from
this
, the
resu
lts in
this
tabl
e ha
ve b
een
obta
ined
in th
e sa
me
man
ner a
s the
resu
lts in
Tab
le 5
. See
Sec
t. 2.
3.3
for m
ore
info
rmat
ion
b Cal
cula
ted
from
stud
y-le
vel W
TA a
nd W
TP: m
ean
WTA
/WTP
= m
ean
WTA
/mea
n W
TP; m
edia
n W
TA/W
TP =
med
ian
WTA
/med
ian
WTP
c Subj
ects
with
eith
er W
TA o
r WTP
mis
sing
wer
e sti
ll in
clud
ed in
this
ana
lysi
s. Th
eref
ore,
this
N is
hig
her t
han
the
N fo
r WTP
and
WTA
sepa
rate
lyd A
s in
form
al c
areg
iver
s re
porte
d W
TP a
nd W
TA fo
r 1 h
our e
xtra
per
wee
k an
d pa
tient
s re
porte
d W
TP a
nd W
TA fo
r 1 h
our e
xtra
per
day
, the
goo
d va
lued
is n
ot c
ompa
rabl
e be
twee
n th
ese
grou
ps. T
here
fore
, the
subg
roup
s are
repo
rted
sepa
rate
ly
Firs
t aut
hor (
year
)N
o. o
f sub
ject
s rep
ort-
ing
zero
val
ues (
%)a
WTP
WTA
W
TA/W
TPb
NM
ean
(SD
)M
edia
n (q
uarti
les)
NM
ean
(SD
)M
edia
n (q
uarti
les)
Nc
Mea
nM
edia
n
van
den
Ber
g (2
005)
[31]
24 (9
)21
911
.17
(5.2
3)10
.33
(8.8
5|11
.80)
226
12.3
0 (6
.84)
11.8
0 (8
.85|
14.7
5)24
61.
101.
14B
oris
ova
(200
3) [3
2]18
2 (6
0)12
16.
41 (7
.96)
3.78
(1.6
3|7.
98)
121
8.30
(8.1
1)6.
30 (2
.21|
12.6
0)12
11.
301.
67C
hiw
aula
(201
6) [3
3]1
(1)
9119
.03
(23.
85)
10.2
5 (6
.15|
20.5
0)91
37.5
3 (3
6.59
)24
.60
(14.
35|5
1.25
)91
1.97
2.40
Mar
tin-F
erna
ndez
(201
0) [3
7]45
(10)
405
28.2
4 (2
2.94
)23
.94
(10.
64|3
7.24
)40
449
.50
(29.
14)
47.2
2 (3
0.59
|60.
52)
405
1.75
1.97
Mar
tin-F
erna
ndez
(201
3) [3
8]83
(13)
570
21.0
6 (1
9.33
)12
.80
(6.4
0|25
.60)
568
27.3
1 (2
1.83
)25
.60
(12.
80|3
8.40
)57
01.
302.
00de
Mei
jer (
2010
) [39
]d
Supp
liers
62 (6
)69
812
.13
(7.0
0)11
.44
(8.5
8|14
.29)
794
13.6
8 (8
.15)
11.4
4 (8
.58|
14.2
9)93
01.
131.
00Pa
tient
s47
(14)
266
10.0
0 (6
.33)
8.58
(5.7
2|11
.44)
260
12.0
7 (8
.03)
11.4
4 (5
.72|
14.2
9)29
81.
211.
33M
ean
2661
1.39
1.64
Wei
ghte
d av
erag
e26
611.
371.
64M
edia
n26
611.
301.
65
A. H. Rotteveel et al.
the number of zero responses by using other contingent valuation methods than open-ended questions, as previ-ous reviews have shown that open-ended question formats are more prone to zero responses than other contingent valuation methods [2, 43]. Moreover, when using a closed-ended question format, researchers are recommended not to include the value zero in the option list, but, instead, to only provide the option ‘the good is not worth anything to me’. This will force subjects to think twice before report-ing a zero, which will decrease the number of non-true zero responses. For the remaining zero responses, to deter-mine how to best handle these individual zero responses in the analysis (e.g., exclusion or imputation), researchers are recommended to include a probing question that pops up if respondents report zero WTP and/or WTA. Answer options should at least cover the following possible reasons underlying zero responses: not understanding the ques-tion, protest response, value of the good is smaller than the answer option provided, and true zero (‘the good is not worth anything to me’). Including such a probing question, will open the ‘black box’ of zero responses, facilitating the decision on how to deal with individual zero responses in the analysis, and will force subjects to think about their zero response, which may, in some cases, result in subjects changing their zero into their true value.
4.1 Comparison with Previous Studies
The WTA/WTP ratios found in our meta-analysis are con-siderably lower than those found in previous meta-analyses/reviews. A possible explanation of this may be that one of the studies included in the review by O’Brien et al. was not included in our meta-analysis as it was not identified in our search because the title and abstract did not contain WTA or variations thereof. This study reported a very high WTA/WTP ratio of 6.4 for a non-fatal injury, which may be explained by the fact that the change valued in the WTA scenario (i.e., no injury vs full injury) was larger than the change valued in the WTP scenario (i.e., small injury vs full injury) [14]. Hence, it may not be surprising that this ratio is much larger than the ratios found in our meta-analysis. The estimate for health and safety goods in the meta-analysis by Tunçel and Hammitt was obtained from 11 studies of which seven were not included in our meta-analysis. These seven studies reported generally larger WTA/WTP ratios than the studies included in our meta-analysis and predominantly val-ued traffic safety, job safety, and product safety, i.e., safety goods [10]. This indicates that the WTA/WTP disparity may be larger in safety studies than in health studies, which may explain why our meta-analysis found a smaller disparity and stresses the need for a separate WTA/WTP estimate for
Table 8 Willingness-to-accept/willingness-to-pay (WTA/WTP) ratios obtained from the mixed-model analysis with replacement of zero values
CI confidence interval, SE standard errora The estimate and CI were retransformed to the original scale with a smearing factor [42]b This estimate is for men aged 50 years in the highest income category (= reference levels of the variables)
Model Variable Original results After retransformationa
Estimate SE 95% CI P value I2 (%) Estimate 95% CI
Zero = 1/2 of the smallest value in the dataset Unadjusted ln (WTA/WTP) 0.711 0.223 0.273 1.149 < 0.01 88 7.538 4.867 11.675 Adjusted ln (WTA/WTP)b 0.561 0.241 0.090 1.033 0.02 86 6.475 4.040 10.377
Age < 0.001 0.003 − 0.006 0.006 0.96Sex (female) 0.025 0.046 − 0.065 0.115 0.59Income category (low) 0.269 0.071 0.129 0.408 < 0.01
Zero = 1/3 of the smallest value in the dataset Unadjusted ln (WTA/WTP) 0.750 0.241 0.278 1.222 < 0.01 88 10.088 6.292 16.175 Adjusted ln (WTA/WTP)b 0.590 0.259 0.082 1.096 0.02 86 8.550 5.149 14.200
Age < − 0.001 0.004 − 0.007 0.006 0.95Sex (female) 0.026 0.049 − 0.070 0.122 0.59Income category (low) 0.292 0.075 0.144 0.440 < 0.01
Zero = 1/4 of the smallest value in the dataset Unadjusted ln (WTA/WTP) 0.778 0.254 0.281 1.275 < 0.01 88 10.371 6.310 17.048 Adjusted ln (WTA/WTP)b 0.608 0.272 0.0756 1.141 0.03 86 10.557 6.196 17.987
Age < − 0.001 0.004 − 0.008 0.007 0.95Sex (female) 0.027 0.051 − 0.073 0.127 0.59Income category (low) 0.308 0.079 0.154 0.462 < 0.01

Systematic Review and Meta-Analysis on the WTA-WTP Disparity for Healthcare Goods and Services
healthcare goods and services, as has been obtained in our meta-analysis.
Another possible explanation for the relatively small WTA-WTP disparity found in our review may be that the studies included in our review valued relatively small changes in healthcare goods and services, such as 1 hour of informal care or one general practitioner consultation. According to standard economic theory, owing to declin-ing marginal utility, the WTA/WTP ratio is an increasing function of the size of the change valued [44]. As a conse-quence, the WTA/WTP ratio is anticipated to be larger when the changes in healthcare goods and services to be valued are truly substantive, such as a year of informal care or an orphan drug. To assess the degree to which the WTA/WTP ratio for healthcare goods and services is an increasing func-tion of the size of the change valued, we recommend future research to estimate the WTA/WTP ratio for differently sized changes in the healthcare good or service concerned.
Furthermore, another possible explanation for the rela-tively low WTA/WTP ratio found in our review may be that subjects were quite familiar with the goods being valued. Three studies asked informal caregivers and/or informal care recipients to value informal care. Furthermore, two studies valued primary care (general practitioner or nurse), which is a type of care many people are familiar with. If people are more familiar with the goods they value, they are more certain about their preferences and therefore report WTA and WTP values that are closer together [45]. Furthermore, many studies in this meta-analysis elicited WTA and WTP in the same questionnaire. Therefore, subjects could have used one of the measures as a reference for the other.
4.2 Implications of our Findings
The results of this study imply that losses in healthcare goods or services are valued somewhat differently from similarly sized gains in healthcare goods and services. This may have implications for cost-benefit analyses of healthcare interven-tions. In cost-benefit analyses, the welfare effect of health-care interventions is transformed into monetary units using the WTP for gains in healthcare and the WTA for losses in healthcare. However, as shown, losses in healthcare have a different weight than gains in healthcare. There has been con-siderable debate across different economic sectors on whether WTA or WTP should be used in the context of losses. Some authors, such as those from the National Oceanic and Atmos-pheric Administration Panel on Contingent Valuation, argue that WTP should always be used because WTA is biased and WTP constitutes a more conservative estimate of welfare change [46]. Others argue that WTA is valid and, hence, that the most accurate measure of welfare change depends on the direction of the change from the reference point [47, 48].
This debate is still ongoing and our study does not provide any conclusive answers to resolve this issue.
Furthermore, our findings may have implications for reimbursement decision making based on cost-effective-ness/cost-utility analyses. Although the effects of healthcare goods and services are expressed in health units in cost-effectiveness analyses and in quality-adjusted life-years in cost-utility analyses, WTA and WTP still need to be used to make reimbursement decisions based on these analyses. In many countries, implicit or explicit thresholds for the WTP for additional health outcomes have been used in reimburse-ment decision making. For instance, the National Institute for Health and Care Excellence in England and Wales uses a threshold of £20,000–£30,000 per quality-adjusted life-year gained [49, 50], and the National Health Care Institute in the Netherlands uses a threshold of €20,000–€80,000 per quality-adjusted life-year gained, depending on disease severity [51]. However, a threshold for the WTA for a loss in health does not exist. Therefore, the WTP threshold has often been used for such decisions [52]. However, as our study shows, the WTA for healthcare goods and services is somewhat higher than WTP. Therefore, to align policy with societal preferences, one might argue to use a somewhat higher threshold in the domain of losses compared to the domain of gains.
To this end, Severens et al. suggested to use a modified cost-effectiveness acceptability curve approach to provide insight into the impact of the WTA-WTP disparity on the probability of an intervention being cost effective. This information could then be incorporated in reimbursement decision making, facilitating a societal debate on this issue [53]. However, others have suggested that the same thresh-old should be used for decisions in the context of gains and losses, as using different thresholds may introduce substan-tial inefficiencies in the allocation of the healthcare budget [54–56]. Hence, whether the WTA-WTP disparity should be incorporated in healthcare policy making is a political trade-off between aligning policy with societal preferences on the one hand, and stimulating efficiency in the allocation of healthcare budgets on the other hand.
Furthermore, the results of this study can also be used to better understand problems with disinvestment, which is the full/partial withdrawal of the reimbursement of healthcare interventions [57]. Decisions on disinvestment have often been perceived to be much more difficult than decisions on (not) starting reimbursement of healthcare [58, 59], a phenomenon that has also been observed in the context of conditional reimbursement [21]. In this study, we found a small disparity between WTA and WTP, implying that, in the healthcare context, people attach more value to losses than to gains. This may also partly explain the perceived difficulty of disinvestment compared to investment as the
A. H. Rotteveel et al.
former is in the domain of losses and the latter is in the domain of gains.
4.3 Strengths and Limitations
In this study, we used a systematic approach to estimate the WTA/WTP ratio for healthcare goods and services. The eligibility criteria were strictly applied to derive WTA and WTP estimates that were based on a similar change and elic-ited in the same manner. In this approach, we ensured that the WTA/WTP ratios derived were not biased by incompa-rable WTA and WTP scenarios. Furthermore, by combining data from different studies in our meta-analysis, we were able to obtain a higher level of evidence and more insight into the uncertainty surrounding the disparity between WTA and WTP than previous studies did.
Our study, however, also has some limitations. First, the studies included in our meta-analysis were quite het-erogeneous as different (changes in) healthcare goods and services were valued by different subject groups using dif-ferent elicitation and administration methods. Furthermore, studies were conducted in different settings. Because of the small number of studies available, we were not able to test the effect of these different settings and methods on the WTA/WTP ratio for healthcare goods and services. There-fore, more studies on the WTA/WTP ratio for healthcare goods and services are needed to obtain more insight into this issue.
Second, as we have not tested the quality of the included studies, we were not able to weight the study estimates based on their quality. However, we are not aware of any quality assessment instrument applicable to WTA/WTP studies, hampering the incorporation of study quality in the analyses.
Third, although we were able to include the largest stud-ies from our review in the IPD-MA, the number of studies included in this meta-analysis is still quite small. Further-more, most studies included in the IPD-MA valued informal care or primary care services. Therefore, our results can-not be generalized to all healthcare goods and services in general. More research is needed to obtain insight into the WTA/WTP ratio for a broader range of healthcare goods and services.
Fourth, in the mixed model, we calculated the WTA/WTP ratio using the mean of ratios approach. We are aware that using the ratio of means approach instead could have resulted in a different estimate of the WTA/WTP ratio [60, 61]. However, because of differences in the goods and ser-vices valued in the included studies, we were not able to use the ratio of means approach and to determine the effect of using one approach over the other on the WTA/WTP ratio.
Fifth, in our analysis, we assumed the association between age and ln(WTA/WTP) to be linear. However, some studies showed small deviations from this assumption. Nonetheless,
as correcting for non-linearity would not result in signifi-cantly improved model fits, we decided not to correct for this, applying the credo: “as simple as possible, as complex as necessary”.
Finally, we have used the median as a cut-off point to transform the income data into two categories. Although there was no better option to combine the income data, this approach may have hampered the interpretation of the effect of income. The reason for this is that the study population may not reflect the general population in terms of income. For instance, in the study on the valuation of methadone maintenance, it is imaginable that the respondents had a relatively low income. The implication of this would be that our income categories based on a median income actually represent a very low vs a quite low income.
5 Conclusions and Recommendations
This study found aggregated WTA/WTP ratios between 1.58 and 1.86 for healthcare goods and services, indicating that losses are weighted somewhat differently from gains. The ratio found depends on the method used to calculate the WTA/WTP ratio and the approach on how to deal with subjects reporting zero WTP and/or WTA. Irrespective of the method used, the ratios found in our meta-analysis were smaller than the ratios found in previous meta-analyses. For this reason, the WTA-WTP disparity in the healthcare sec-tor may be less of a problem than what was thought based on previous studies. However, we cannot exclude the pos-sibility that the relatively small disparity found is related to the fact that the studies in our review valued relatively small gains and losses in healthcare goods and services, with which subjects were quite familiar. Future empirical work may explicitly test the effect of size of the change valued on the WTA/WTP ratio through a within-person assessment of differently sized changes in healthcare goods and services. Furthermore, we recommend future research to pay attention to the reasons behind zero WTA and WTP responses and the best methodological means of dealing with these responses in the analysis.
Acknowledgements The authors thank Natalie Boytsov, Levison Chi-waula, and Jesús Martín Fernández for providing the datasets of their studies for this meta-analysis. Furthermore, the authors thank Arthur Attema and the participants of lolaHESG 2017 for their valuable feed-back on an earlier version of this paper.
Author Contributions All authors contributed to the study concep-tion and design. AHR conducted the literature search. AHR, GAW, and MSL were involved in eligibility assessment, data extraction, and requesting individual participant data. AHR, NPAZ, GAW, and MSL performed the data analysis. All authors were involved in data inter-pretation. The first draft of the manuscript was written by AHR and all authors commented on previous versions of the manuscript. All authors read and approved the final manuscript.
Systematic Review and Meta-Analysis on the WTA-WTP Disparity for Healthcare Goods and Services
Data Availability The dataset analyzed for the systematic review and the AD-MA is included in Electronic supplementary material: Appen-dix G. The dataset used for the IPD-MA analyses is not publicly avail-able because not all responsible authors of the studies included in our analyses have provided us with permission to make their data publicly available.
Compliance with Ethical Standards
Funding This research (including open access publication) was funded by the strategic program RIVM (S/133005), a research fund from the National Institute of Public Health and the Environment, the Nether-lands. The funders had no role in the design of the study, its admin-istration, or the analysis of the results and were not involved in the manuscript preparation or submission.
Conflict of interest Adriënne H. Rotteveel, Mattijs S. Lambooij, Nico-laas P.A. Zuithoff, Job van Exel, Karel G.M. Moons, and G. Ardine de Wit have no conflicts of interest that are directly relevant to the content of this article.
Open Access This article is licensed under a Creative Commons Attri-bution-NonCommercial 4.0 International License, which permits any non-commercial use, sharing, adaptation, distribution and reproduction in any medium or format, as long as you give appropriate credit to the original author(s) and the source, provide a link to the Creative Com-mons licence, and indicate if changes were made. The images or other third party material in this article are included in the article’s Creative Commons licence, unless indicated otherwise in a credit line to the material. If material is not included in the article’s Creative Commons licence and your intended use is not permitted by statutory regula-tion or exceeds the permitted use, you will need to obtain permission directly from the copyright holder.To view a copy of this licence, visit http://creat iveco mmons .org/licen ses/by-nc/4.0/.
References
1. Folland S, Goodman AC, Stano M. The economics of health and health care. Upper Saddle River (NJ): Pearson Education, Inc.; 2013.
2. Ryan M, Watson V, Amaya-Amaya M. Methodological issues in the monetary valuation of benefits in healthcare. Expert Rev Pharmacoecon Outcomes Res. 2003;3(6):717–27. https ://doi.org/10.1586/14737 167.3.6.717.
3. Lancsar E, Louviere J. Conducting discrete choice experiments to inform healthcare decision making: a user’s guide. Pharma-coeconomics. 2008;26(8):661–77. https ://doi.org/10.2165/00019 053-20082 6080-00004 .
4. Diener A, O’Brien B, Gafni A. Health care contingent valua-tion studies: a review and classification of the literature. Health Econ. 1998;7(4):313–26. https ://doi.org/10.1002/(SICI)1099-1050(19980 6)7:4%3c313 :AID-HEC35 0%3e3.0.CO;2-B.
5. Randall A, Stoll JR. Consumer’s surplus in commodity space. Am Econ Rev. 1980;70(3):449–55.
6. Brookshire DS, Coursey DL. Measuring the value of a public good: an empirical comparison of elicitation procedures. Am Econ Rev. 1987;77(4):554–66.
7. Henderson A. Consumer’s surplus and the compensating variation. Rev Econ Stud. 1941;8(2):117–21. https ://doi.org/10.2307/29674 68.
8. van Exel NJA, Brouwer WBF, van den Berg B, Koopmanschap MA. With a little help from an anchor: discussion and evidence
of anchoring effects in contingent valuation. J Socioecon. 2006;35(5):836–53. https ://doi.org/10.1016/j.socec .2005.11.045.
9. Knetsch JL, Sinden JA. Willingness to pay and compensation demanded: experimental evidence of an unexpected disparity in measures of value. Q J Econ. 1984;99(3):507–21. https ://doi.org/10.2307/18859 62.
10. Tunçel T, Hammitt JK. A new meta-analysis on the WTP/WTA disparity. J Environ Econ Manag. 2014;68(1):175–87. https ://doi.org/10.1016/j.jeem.2014.06.001.
11. Horowitz JK, McConnell KE. A review of WTA/WTP stud-ies. J Environ Econ Manag. 2002;44(3):426–47. https ://doi.org/10.1006/jeem.2001.1215.
12. O’Brien BJ, Gertsen K, Willan AR, Faulkner A. Is there a kink in consumers’ threshold value for cost-effectiveness in health care? Health Econ. 2002;11(2):175–80. https ://doi.org/10.1002/hec.655.
13. O’Brien BJ, Goeree R, Gafni A, Torrance GW, Pauly MV, Erder H, et al. Assessing the value of a new pharmaceutical: a feasibil-ity study of contingent valuation in managed care. Med Care. 1998;36(3):370–84.
14. Carthy T, Chilton S, Covey J, Hopkins L, Jones-lee M, Loomes G, et al. On the contingent valuation of safety and the safety of con-tingent valuation: part 2: the CV/SG “chained” approach. J Risk Uncertain. 1998;17(3):187–214. https ://doi.org/10.1023/a:10077 82800 868.
15. Hanemann WM. Willingness to pay and willingness to accept: how much can they differ? Am Econ Rev. 1991;81(3):635–47.
16. Amiran EY, Hagen DA. Willingness to pay and willingness to accept: how much can they differ? Comment. Am Econ Rev. 2003;93(1):458–63. https ://doi.org/10.1257/00028 28033 21455 430.
17. Hanemann WM. Willingness to pay and willingness to accept: how much can they differ? Reply. Am Econ Rev. 2003;93(1):464.
18. Kahneman D, Knetsch JL, Thaler RH. Anomalies: the endow-ment effect, loss aversion, and status quo bias. J Econ Perspect. 1991;5(1):193–206.
19. Kahneman D, Tversky A. Prospect theory: an analysis of deci-sion under risk. Econometrica. 1979;47(2):263–91. https ://doi.org/10.2307/19141 85.
20. Tversky A, Kahneman D. Advances in prospect theory: cumulative representation of uncertainty. J Risk Uncertain. 1992;5(4):297–323. https ://doi.org/10.1007/BF001 22574 .
21. van de Wetering EJ, van Exel NJA, Brouwer WBF. The chal-lenge of conditional reimbursement: stopping reimbursement can be more difficult than not starting in the first place! Value Health. 2017;20(1):118–25. https ://doi.org/10.1016/j.jval.2016.09.001.
22. Morton RL, Tong A, Howard K, Snelling P, Webster AC. The views of patients and carers in treatment decision making for chronic kidney disease: systematic review and thematic syn-thesis of qualitative studies. BMJ. 2010;340:c112. https ://doi.org/10.1136/bmj.c112.
23. Wolfe F, Michaud K. Resistance of rheumatoid arthritis patients to changing therapy: discordance between disease activity and patients’ treatment choices. Arthritis Rheum. 2007;56(7):2135–42. https ://doi.org/10.1002/art.22719 .
24. OECD data: purchasing power parities (PPP). 2018. Available from: https ://data.oecd.org/conve rsion /purch asing -power -parit ies-ppp.htm. Accessed 5 Feb 2020.
25. Statline: Consumer prices; price index 2015 = 100 2018. Available from: https ://opend ata.cbs.nl/statl ine/#/CBS/en/datas et/83131 ENG/table ?ts=15363 17867 277. Accessed 5 Feb 2020.
26. Little RJA, Rubin DB. Statistical analysis with missing data. New York: Wiley; 1987.
27. Söderberg M, Barton DN. Marginal WTP and distance decay: the role of ‘protest’ and ‘true zero’ responses in the economic valuation of recreational water quality. Environ Resour Econ. 2014;59(3):389–405. https ://doi.org/10.1007/s1064 0-013-9735-y.
A. H. Rotteveel et al.
28. Meyerhoff J, Liebe U. Protest beliefs in contingent valuation: explaining their motivation. Ecolog Econ. 2006;57(4):583–94. https ://doi.org/10.1016/j.ecole con.2005.04.021.
29. Bobinac A, Van Exel NJA, Rutten FFH, Brouwer WBF. Valu-ing QALY gains by applying a societal perspective. Health Econ. 2013;22(10):1272–81. https ://doi.org/10.1002/hec.2879.
30. Bayen E, Jourdan C, Ghout I, Darnoux E, Azerad S, Vallat-Azouvi C, et al. Objective and subjective burden of informal caregivers 4 years after a severe traumatic brain injury: results from the Paris-TBI study. J Head Trauma Rehabil. 2016;31(5):E59–67. https ://doi.org/10.1097/HTR.00000 00000 00007 9.
31. van den Berg B, Bleichrodt H, Eeckhoudt L. The economic value of informal care: a study of informal caregivers’ and patients’ willingness to pay and willingness to accept for informal care. Health Econ. 2005;14(4):363–76. https ://doi.org/10.1002/hec.980.
32. Borisova NN, Goodman AC. Measuring the value of time for methadone maintenance clients: willingness to pay, willingness to accept, and the wage rate. Health Econ. 2003;12(4):323–34.
33. Chiwaula LS, Chirwa GC, Caltado F, Kapito-Tembo A, Hossein-ipour MC, van Lettow M, et al. The value of informal care in the context of option B + in Malawi: a contingent valuation approach. BMC Health Serv Res. 2016;16:136. https ://doi.org/10.1186/s1291 3-016-1381-y.
34. Finkelstein E, Malhotra C, Chay J, Ozdemir S, Chopra A, Kanes-varan R. Impact of treatment subsidies and cash payouts on treat-ment choices at the end of life. Value Health. 2016;19(6):788–94. https ://doi.org/10.1016/j.jval.2016.02.015.
35. Grutters JPC, Kessels AGH, Dirksen CD, Van Helvoort-Postu-lart D, Anteunis LJC, Joore MA. Willingness to accept versus willingness to pay in a discrete choice experiment. Value Health. 2008;11(7):1110–9.
36. Manan MM, Ali SM, Khan MA, Jafarian S. Estimation of out-of-pocket costs of patients at the methadone maintenance therapy clinic in Malaysia. Pak J Pharm Sci. 2015;28(5):1705–11.
37. Martín-Fernández J, del Cura-González MI, Gómez-Gascón T, Oliva-Moreno J, Domínguez-Bidagor J, Beamud-Lagos M, et al. Differences between willingness to pay and willing-ness to accept for visits by a family physician: a contingent valuation study. BMC Public Health. 2010;10:236. https ://doi.org/10.1186/1471-2458-10-236.
38. Martín-Fernández J, del Cura-González MI, Rodríguez-Martínez G, Ariza-Cardiel G, Zamora J, Gómez-Gascón T, et al. Economic valu-ation of health care services in public health systems: a study about willingness to pay (WTP) for nursing consultations. PLoS ONE. 2013;8(4):e62840. https ://doi.org/10.1371/journ al.pone.00628 40.
39. de Meijer C, Brouwer W, Koopmanschap M, Van Den Berg B, Van Exel J. The value of informal care: a further investigation of the feasibility of contingent valuation in informal caregivers. Health Econ. 2010;19(7):755–71. https ://doi.org/10.1002/hec.1513.
40. Tsuji M, Suzuki W. The application of CVM for assessing the tele-health system: an analysis of the discrepancy between WTP and WTA based on survey data. Assets, beliefs, and equilibria in economic dynamics: essays in honor of Mordecai Kurz. Aliprantis CD, Yannelis NY, editors. Studies in economic theory. Vol. 18. Heidelberg; New York (NY): Springer; 2004: p. 493–506.
41. Whynes DK, Sach TH. WTP and WTA: do people think differ-ently? Soc Sci Med. 2007;65(5):946–57.
42. Duan N. Smearing estimate: a nonparametric retransformation method. J Am Stat Assoc. 1983;78(383):605–10. https ://doi.org/10.1080/01621 459.1983.10478 017.
43. Ryan M, Scott DA, Reeves C, Bate A, van Teijlingen ER, Russell EM, et al. Eliciting public preferences for healthcare: a systematic review of techniques. Health Technol Assess. 2001;5(5):1–186. https ://doi.org/10.3310/hta50 50.
44. Chilton S, Jones-Lee M, McDonald R, Metcalf H. Does the WTA/WTP ratio diminish as the severity of a health complaint
is reduced? Testing for smoothness of the underlying utility of wealth function. J Risk Uncertain. 2012;45(1):1–24. https ://doi.org/10.1007/s1116 6-012-9145-5.
45. List JA. Does market experience eliminate market anoma-lies? The case of exogenous market experience. Am Econ Rev. 2011;101(3):313–17. https ://doi.org/10.1257/aer.101.3.313.
46. Arrow K, Solow R, Portney PR, Leamer EE, Radner R, Schuman H. Report of the NOAA panel on contingent valuation. United States: Federal Register; 1993.
47. Interis MG. A challenge to three widely held ideas in environmen-tal valuation. J Agric Appl Econ. 2014;46(3):347–56. https ://doi.org/10.1017/S1074 07080 00301 08.
48. Knetsch JL. The curiously continuing saga of choosing the meas-ure of welfare changes. J Benefit Cost Anal. 2015;6(1):217–25. https ://doi.org/10.1017/bca.2015.4.
49. Claxton K, Martin S, Soares M, Rice N, Spackman E, Hinde S, et al. Methods for the estimation of the National Institute for Health and Care Excellence cost-effectiveness threshold. Health Technol Assess. 2015;19(14):1–503, v–vi. https ://doi.org/10.3310/hta19 140.
50. Rawlins MD, Culyer AJ. National Institute for Clinical Excellence and its value judgments. BMJ. 2004;329(7459):224–7. https ://doi.org/10.1136/bmj.329.7459.224.
51. Zwaap J, Knies S, van der Meijden C, Staal P, van der Heiden L. Cost-effectiveness in practice. Diemen (the Netherlands): National Health Care Institute; 2015.
52. Suijkerbuijk AWM, Over EAB, van Aar F, Götz HM, van Ben-them BHB, Lugnér AK. Consequences of restricted STI testing for young heterosexuals in the Netherlands on test costs and QALY losses. Health Policy. 2018;122(2):198–203. https ://doi.org/10.1016/j.healt hpol.2017.12.001.
53. Severens JL, Brunenberg DEM, Fenwick EAL, O’Brien B, Joore MA. Cost-effectiveness acceptability curves and a reluctance to lose. Pharmacoeconomics. 2005;23(12):1207–14. https ://doi.org/10.2165/00019 053-20052 3120-00005 .
54. Dowie J. No room for kinkiness in a public healthcare sys-tem. Pharmacoeconomics. 2005;23(12):1203–5. https ://doi.org/10.2165/00019 053-20052 3120-00004 .
55. Klok RM, Postma MJ. Four quadrants of the cost-effectiveness plane: some considerations on the south-west quadrant. Expert Rev Pharmacoecon Outcomes Res. 2004;4(6):599–601. https ://doi.org/10.1586/14737 167.4.6.599.
56. Guria J, Leung J, Jones-Lee M, Loomes G. The willingness to accept value of statistical life relative to the willingness to pay value: evidence and policy implications. Environ Resour Econ. 2005;32(1):113–27. https ://doi.org/10.1007/s1064 0-005-6030-6.
57. Daniels T, Williams I, Robinson S, Spence K. Tackling disinvest-ment in health care services: the views of resource allocatorsin the English NHS. J Health Organ Manag. 2013;27(6):762–80. https ://doi.org/10.1108/JHOM-11-2012-0225.
58. Haas M, Hall J, Viney R, Gallego G. Breaking up is hard to do: why disinvestment in medical technology is harder than investment. Aust Health Rev. 2012;36(2):148–52. https ://doi.org/10.1071/AH110 32.
59. Kent DM, Fendrick AM, Langa KM. New and dis-improved: on the evaluation and use of less effective, less expensive medical interventions. Med Decis Mak. 2004;24(3):281–6. https ://doi.org/10.1177/02729 89X04 26547 8.
60. Larivière V, Gingras Y. Averages of ratios vs. ratios of averages: an empirical analysis of four levels of aggregation. J Informetr. 2011;5(3):392–9. https ://doi.org/10.1016/j.joi.2011.02.001.
61. Stinnett AA, Paltiel AD. Estimating CE ratios under second-order uncertainty: the mean ratio versus the ratio of means. Med Decis Mak. 1997;17(4):483–9. https ://doi.org/10.1177/02729 89x97 01700 414.


