V. Dilip Ratha - Remittances and Their Costs
27
Outlook for migration and remittances 2012-14 Dilip Ratha World Bank Tenth Coordination Meeting on International Migration New York February 9, 2012
description
remittances
Transcript of V. Dilip Ratha - Remittances and Their Costs
Outlook for migration and remittances 2012-14
Dilip RathaWorld Bank
Tenth Coordination Meeting on International MigrationNew YorkFebruary 9, 2012
0
100
200
300
400
500
600
1990
1992
1994
1996
1998
2000
2002
2004
2006
2008
2010
2012
f20
14f
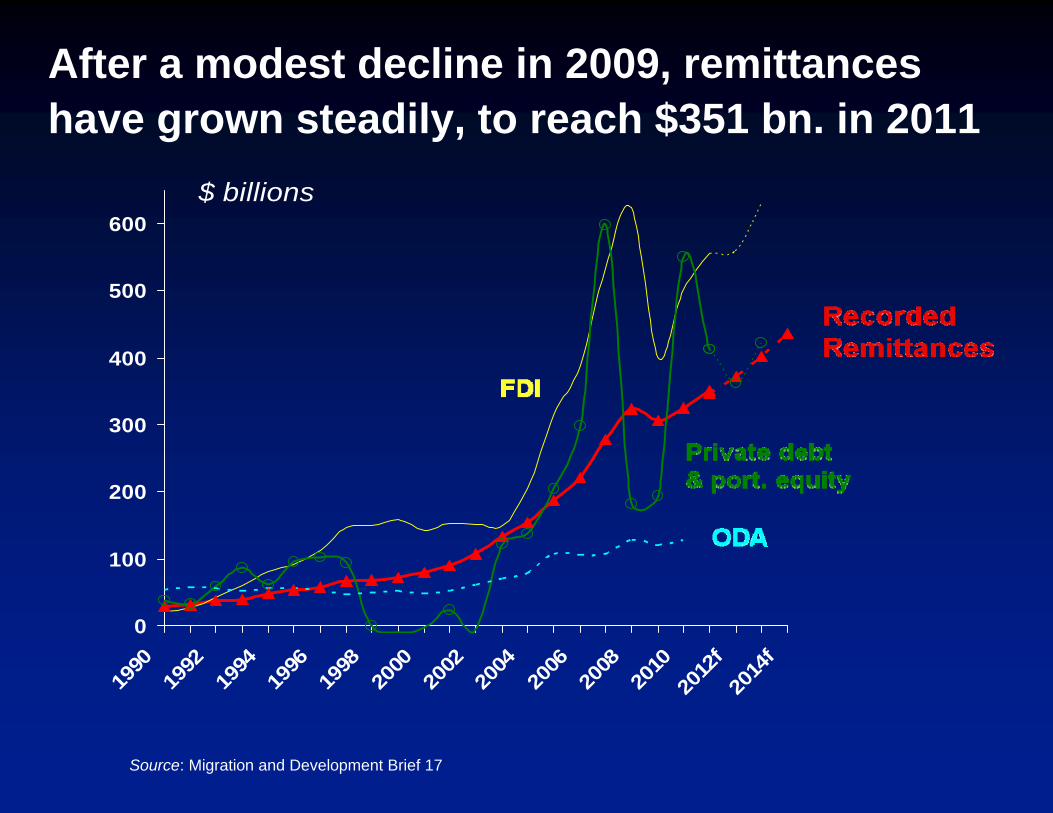
$ billions
After a modest decline in 2009, remittances have grown steadily, to reach $351 bn. in 2011
Source: Migration and Development Brief 17
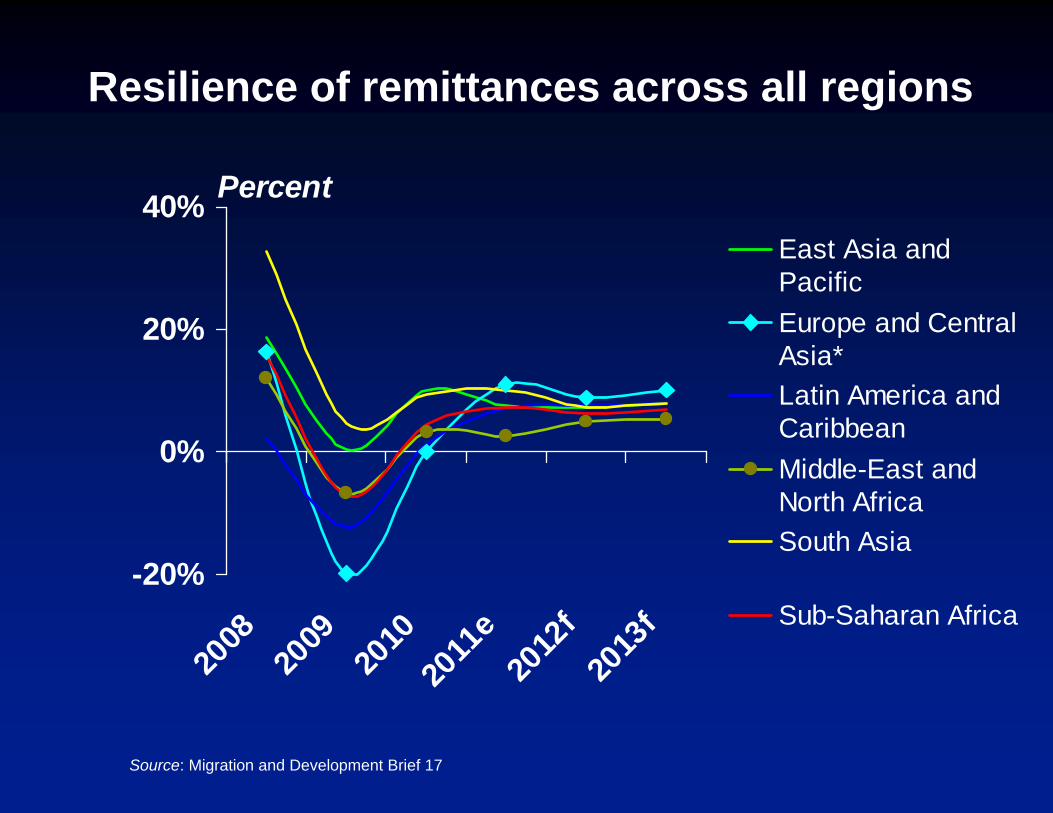
Resilience of remittances across all regions
-20%
0%
20%
40%
2008
2009
2010
2011
e20
12f
2013
f
East Asia andPacificEurope and CentralAsia*Latin America andCaribbeanMiddle-East andNorth AfricaSouth Asia
Sub-Saharan Africa
Percent
Source: Migration and Development Brief 17
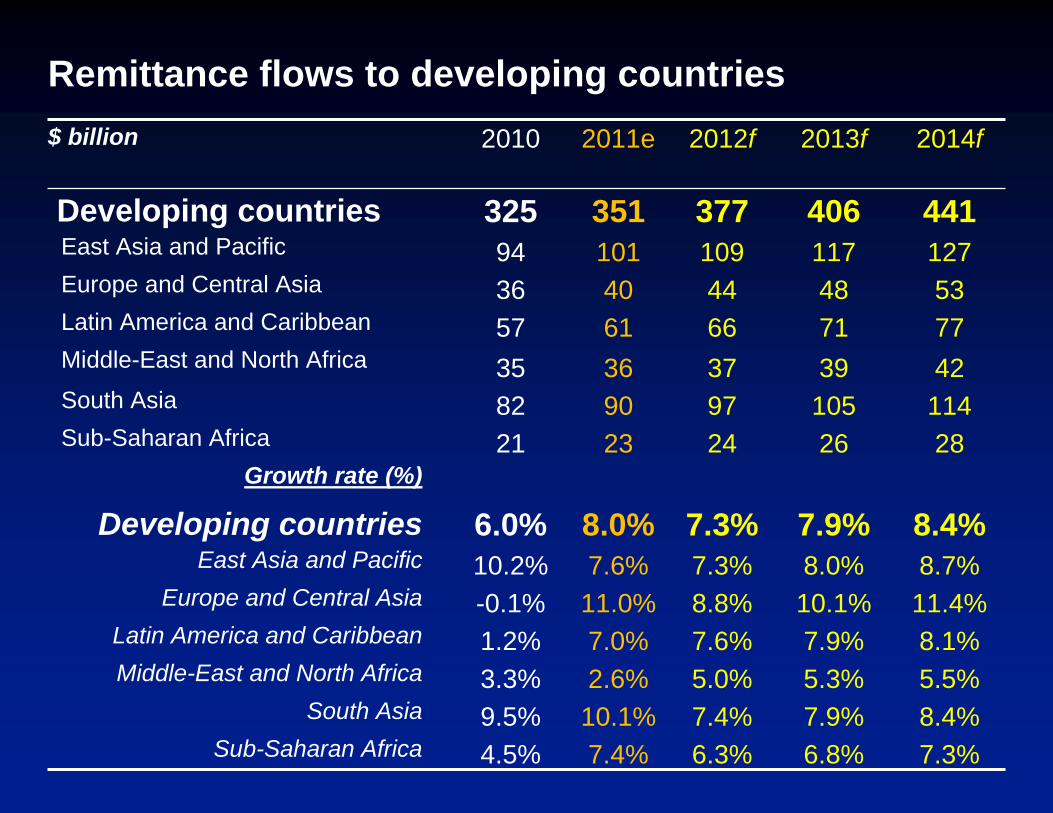
Remittance flows to developing countries$ billion 2010 2011e 2012f 2013f 2014f
Developing countries 325 351 377 406 441East Asia and Pacific 94 101 109 117 127Europe and Central Asia 36 40 44 48 53Latin America and Caribbean 57 61 66 71 77Middle-East and North Africa 35 36 37 39 42South Asia 82 90 97 105 114Sub-Saharan Africa 21 23 24 26 28
Growth rate (%)
Developing countries 6.0% 8.0% 7.3% 7.9% 8.4%East Asia and Pacific 10.2% 7.6% 7.3% 8.0% 8.7%
Europe and Central Asia -0.1% 11.0% 8.8% 10.1% 11.4%Latin America and Caribbean 1.2% 7.0% 7.6% 7.9% 8.1%Middle-East and North Africa 3.3% 2.6% 5.0% 5.3% 5.5%
South Asia 9.5% 10.1% 7.4% 7.9% 8.4%Sub-Saharan Africa 4.5% 7.4% 6.3% 6.8% 7.3%
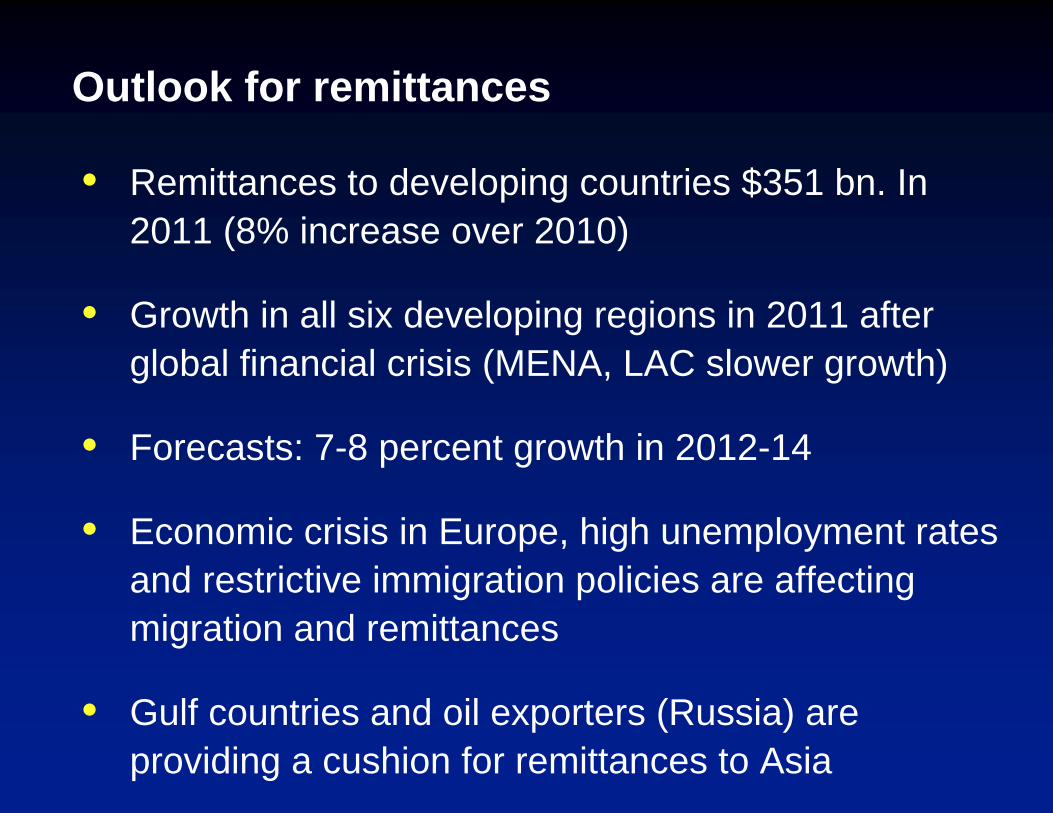
Outlook for remittances
Remittances to developing countries $351 bn. In 2011 (8% increase over 2010)
Growth in all six developing regions in 2011 after global financial crisis (MENA, LAC slower growth)
Forecasts: 7-8 percent growth in 2012-14
Economic crisis in Europe, high unemployment rates and restrictive immigration policies are affecting migration and remittances
Gulf countries and oil exporters (Russia) are providing a cushion for remittances to Asia
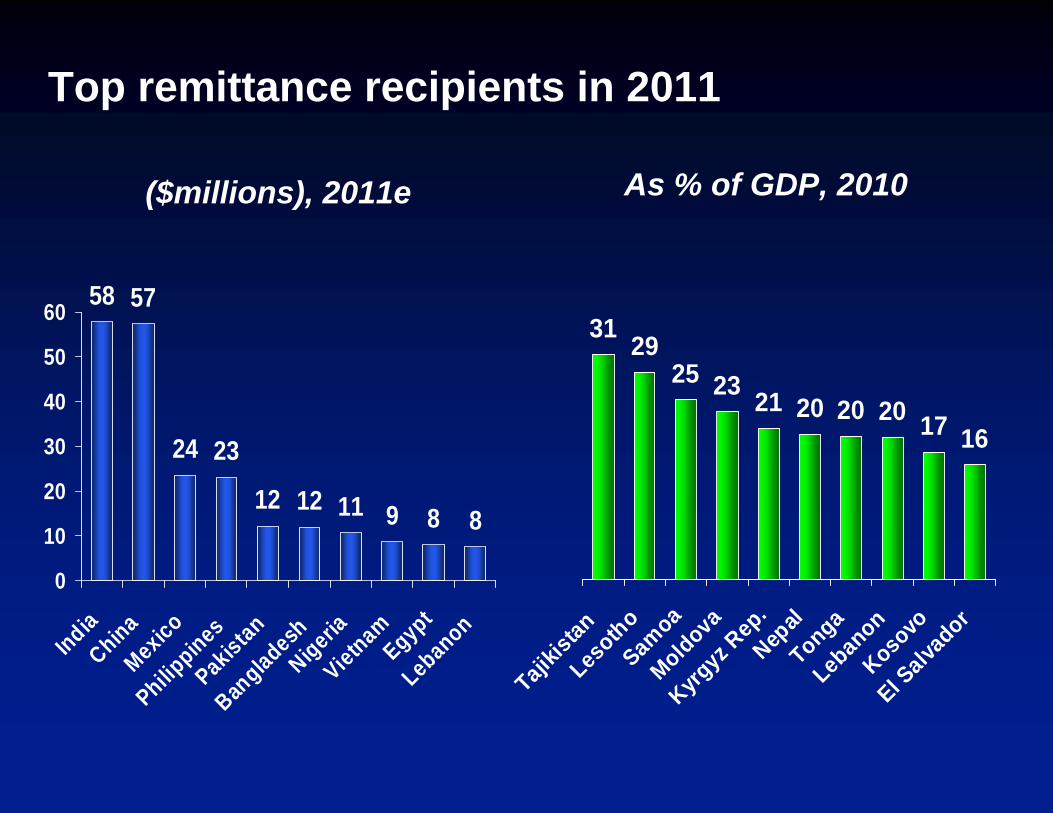
58 57
24 23
12 12 11 9 8 8
0
10
20
30
40
50
60
IndiaChinaMexico
Philippines
PakistanBan
gladeshNigeriaVietnam
EgyptLebanon
Top remittance recipients in 2011
31 2925 23 21 20 20 20 17 16
Tajikis
tanLes
othoSam
oaMoldova
Kyrgyz
Rep.
Nepal
TongaLeb
anon
Kosovo
El Salv
ador
($millions), 2011e As % of GDP, 2010
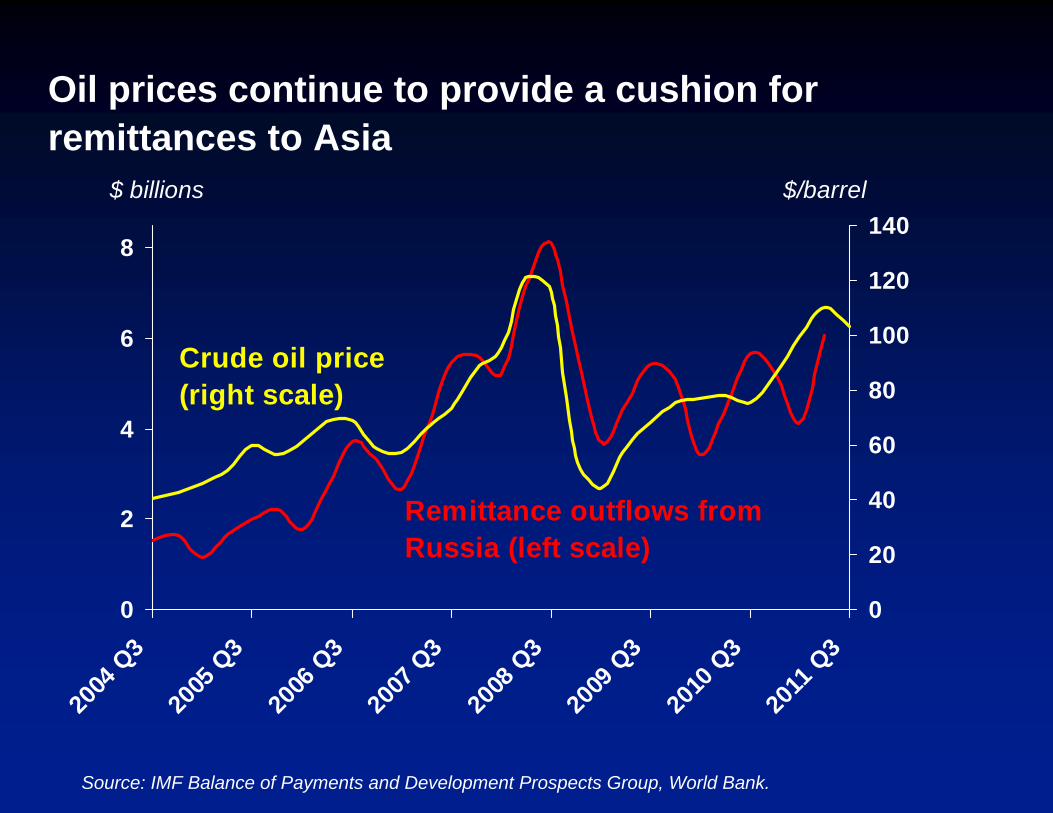
Oil prices continue to provide a cushion for remittances to Asia
0
2
4
6
8
2004
Q3
2005
Q3
2006
Q3
2007
Q3
2008
Q3
2009
Q3
2010
Q3
2011
Q3
0
20
40
60
80
100
120
140$ billions
Remittance outflows from Russia (left scale)
Crude oil price(right scale)
$/barrel
Source: IMF Balance of Payments and Development Prospects Group, World Bank.
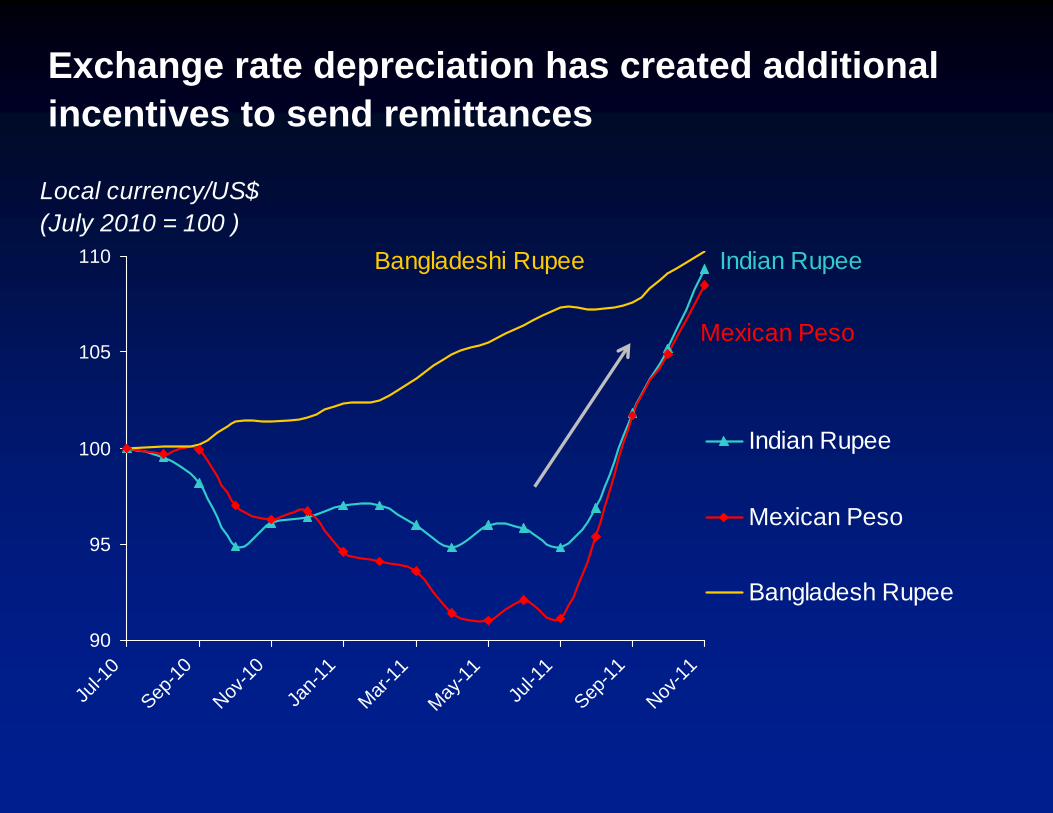
Exchange rate depreciation has created additional incentives to send remittances
90
95
100
105
110
Jul-1
0
Sep-10
Nov-10
Jan-1
1
Mar-11
May-11
Jul-1
1
Sep-11
Nov-11
Indian Rupee
Mexican Peso
Bangladesh Rupee
Mexican Peso
Bangladeshi Rupee
Local currency/US$ (July 2010 = 100 )
Indian Rupee
Risks to the outlook
Global economic crisis in the US and Europe
Anti-immigration policies in other destination countries
Uncertain currency and oil price movements
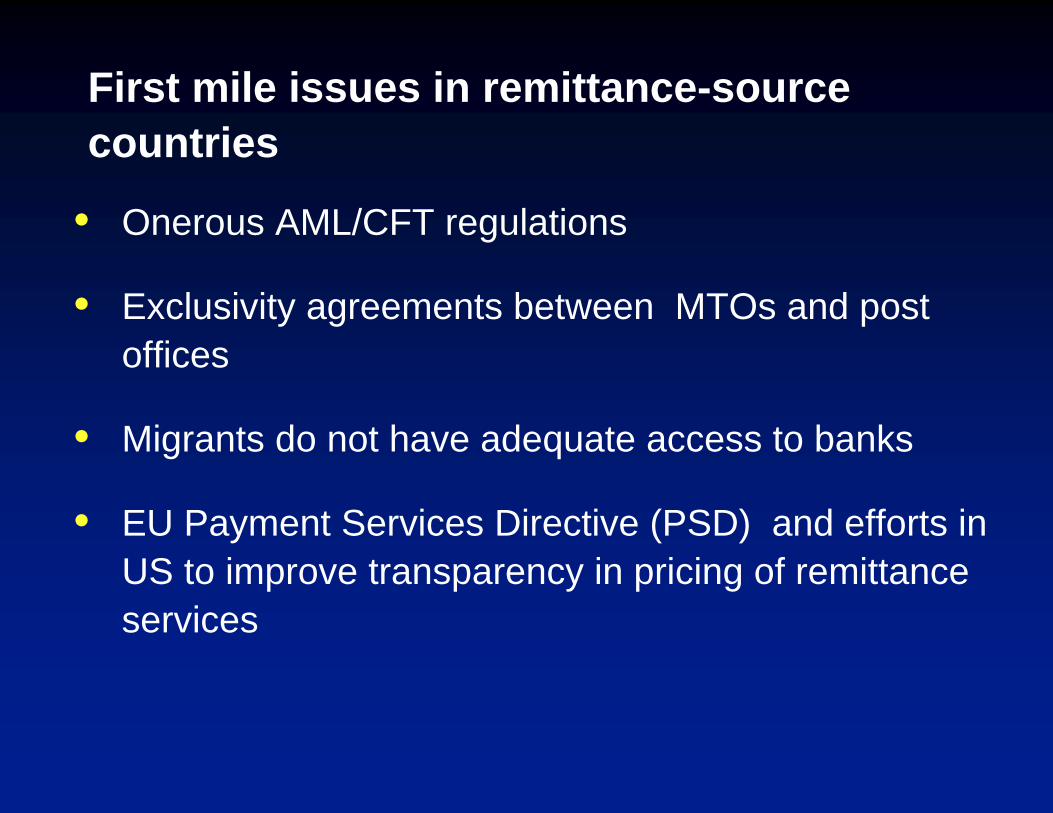
First mile issues in remittance-source countries
Onerous AML/CFT regulations
Exclusivity agreements between MTOs and post offices
Migrants do not have adequate access to banks
EU Payment Services Directive (PSD) and efforts in US to improve transparency in pricing of remittance services
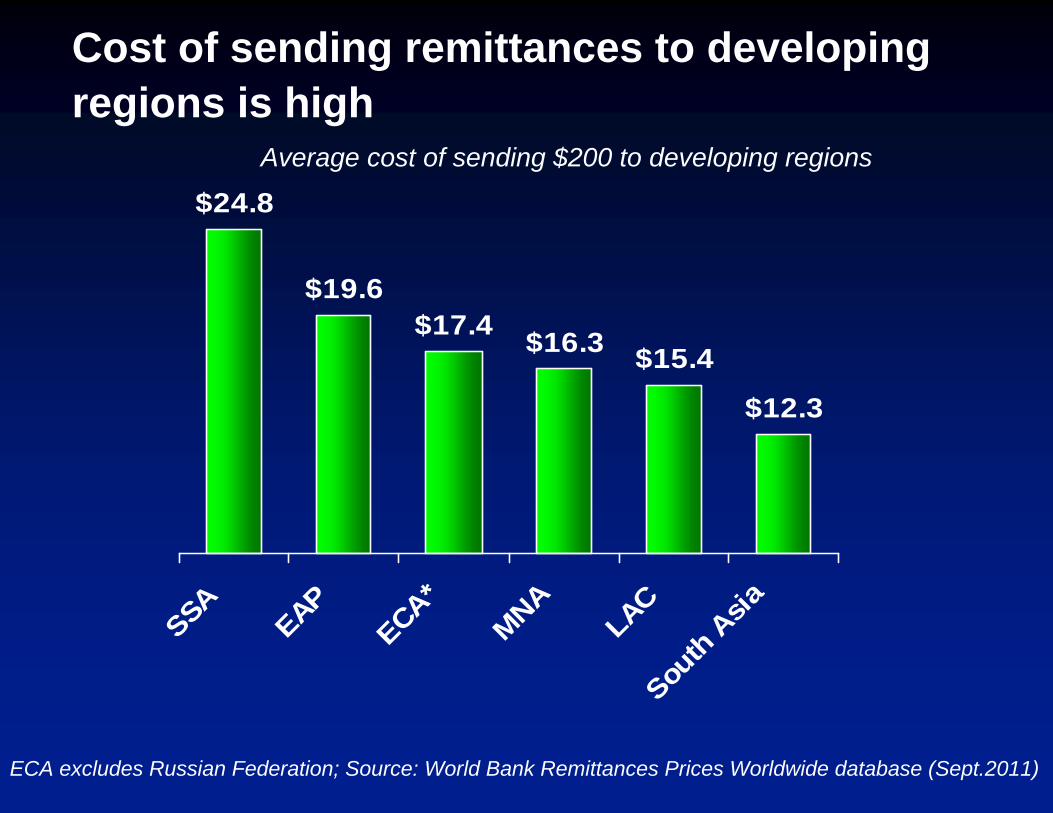
Cost of sending remittances to developing regions is high
$24.8
$19.6$17.4 $16.3 $15.4
$12.3
SSA
EAP
ECA*
MNA
LACSou
th A
sia
ECA excludes Russian Federation; Source: World Bank Remittances Prices Worldwide database (Sept.2011)
Average cost of sending $200 to developing regions
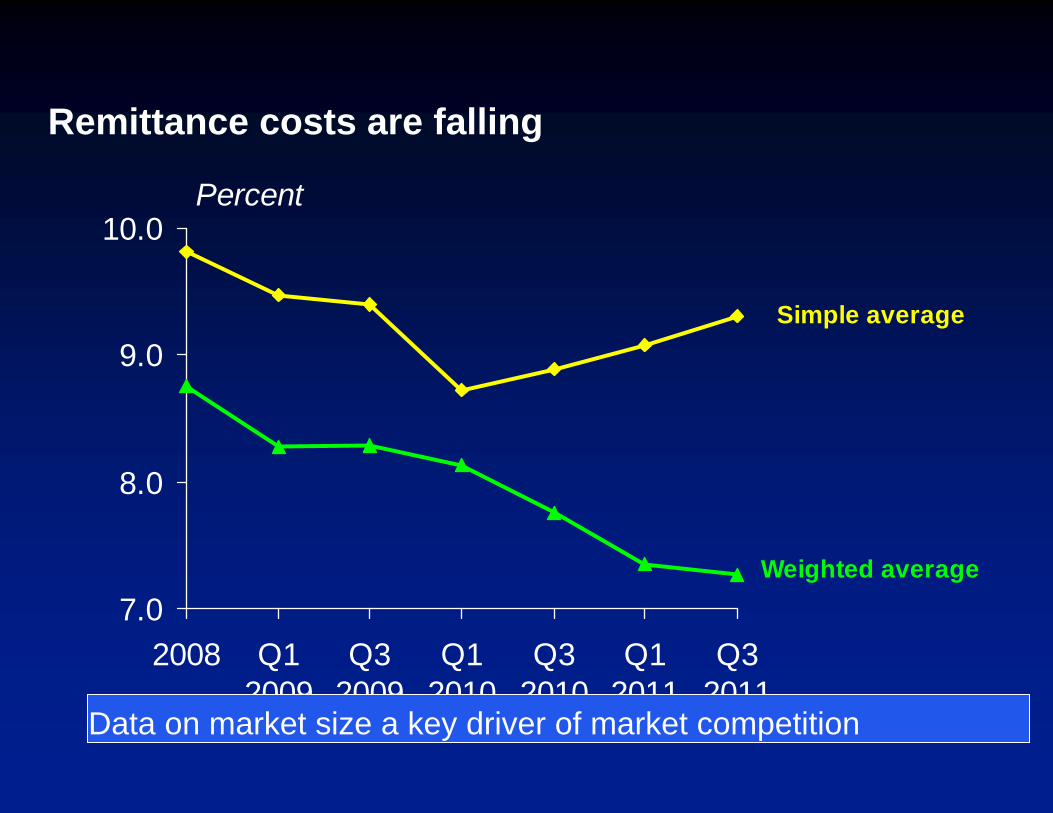
Remittance costs are falling
7.0
8.0
9.0
10.0
2008 Q12009
Q32009
Q12010
Q32010
Q12011
Q32011
Percent
Simple average
Weighted average
Data on market size a key driver of market competition
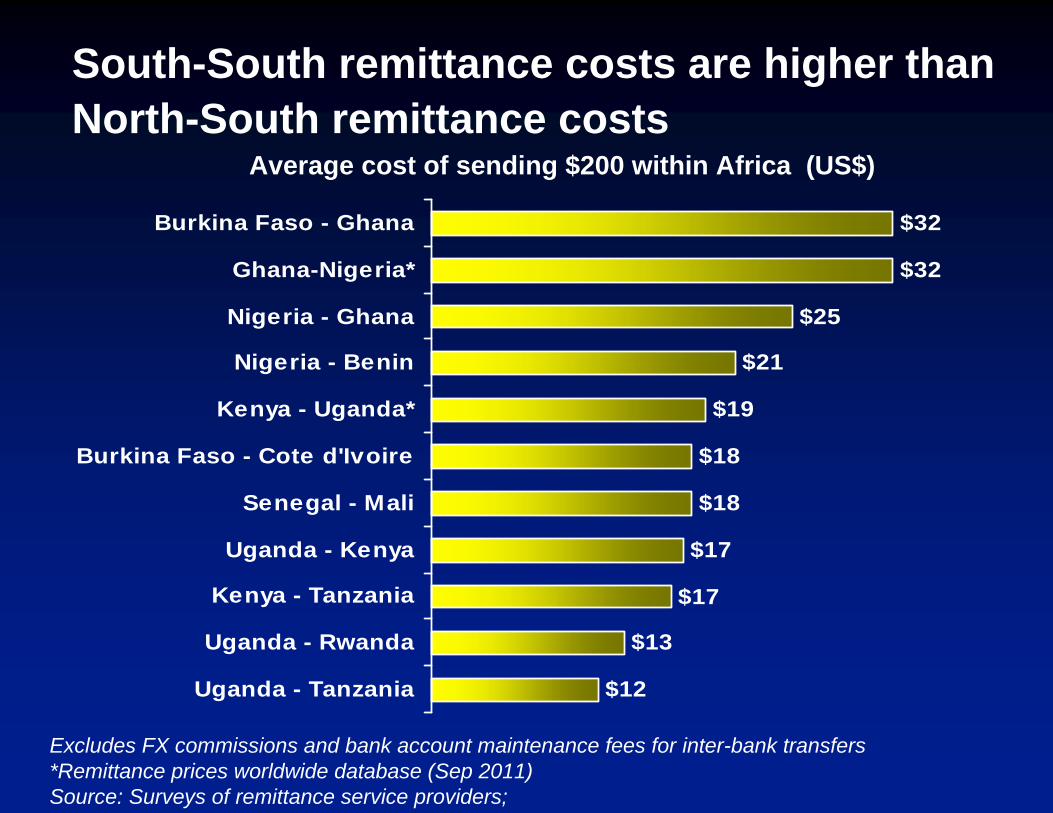
South-South remittance costs are higher than North-South remittance costs
$12
$13
$17
$17
$18
$18
$19
$21
$25
$32
$32
Uganda - Tanzania
Uganda - Rwanda
Kenya - Tanzania
Uganda - Kenya
Senegal - Mali
Burkina Faso - Cote d'Ivoire
Kenya - Uganda*
Nigeria - Benin
Nigeria - Ghana
Ghana-Nigeria*
Burkina Faso - Ghana
Excludes FX commissions and bank account maintenance fees for inter-bank transfers*Remittance prices worldwide database (Sep 2011)Source: Surveys of remittance service providers;
Average cost of sending $200 within Africa (US$)

International Remittances
Agenda
1. Monitoring, analysis, projection- Size, corridors, channels- Counter-cyclicality - Effects on poverty, education, health,
investmen- Policy (costs, competition, exchange
controls)
2. Retail payment systems- Payment platforms/instruments- Regulation (clearing and settlement, capital
adequacy, exchange controls, disclosure, cross-border arbitration)
- Anti-money laundering/Countering financing of terrorism (AML/CFT)
3. Financial access- Deposit and saving products- Loan products (mortgages,
consumer loans, microfinance)
- Credit history for MFI clients- Insurance products
4. Capital market access- Private banks and
corporations (securitization)
- Governments (diaspora bonds)
- Sovereign credit rating
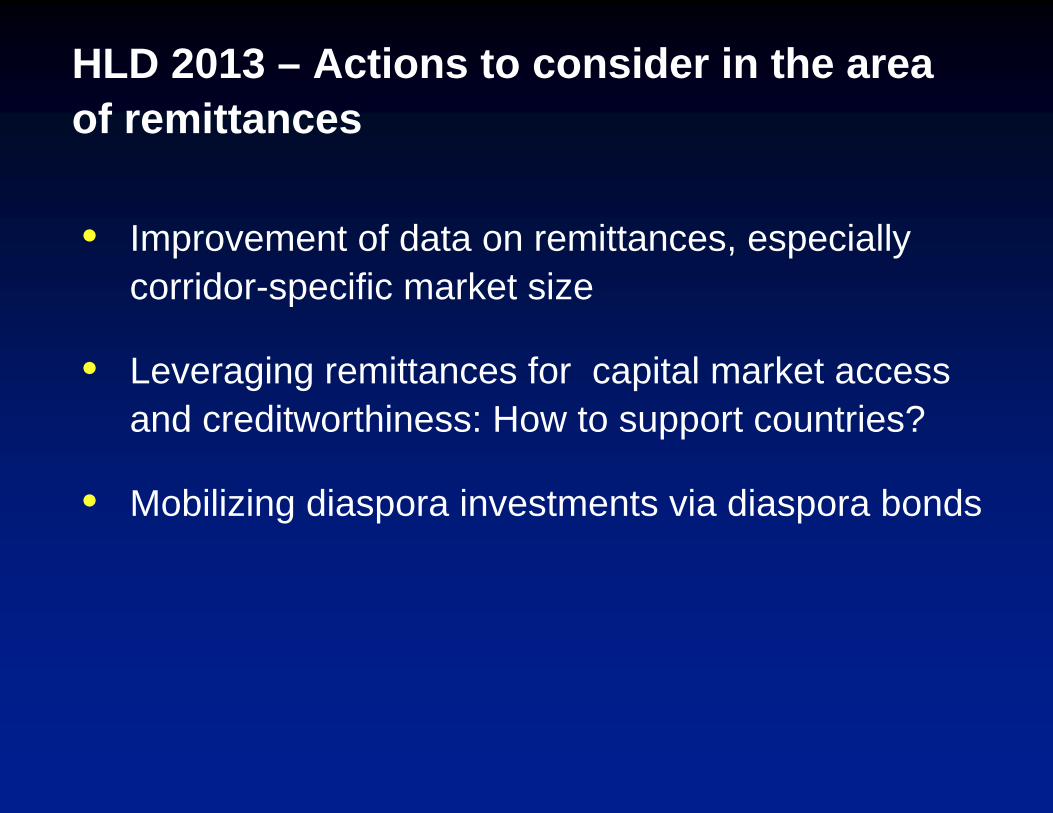
HLD 2013 – Actions to consider in the area of remittances
Improvement of data on remittances, especially corridor-specific market size
Leveraging remittances for capital market access and creditworthiness: How to support countries?
Mobilizing diaspora investments via diaspora bonds
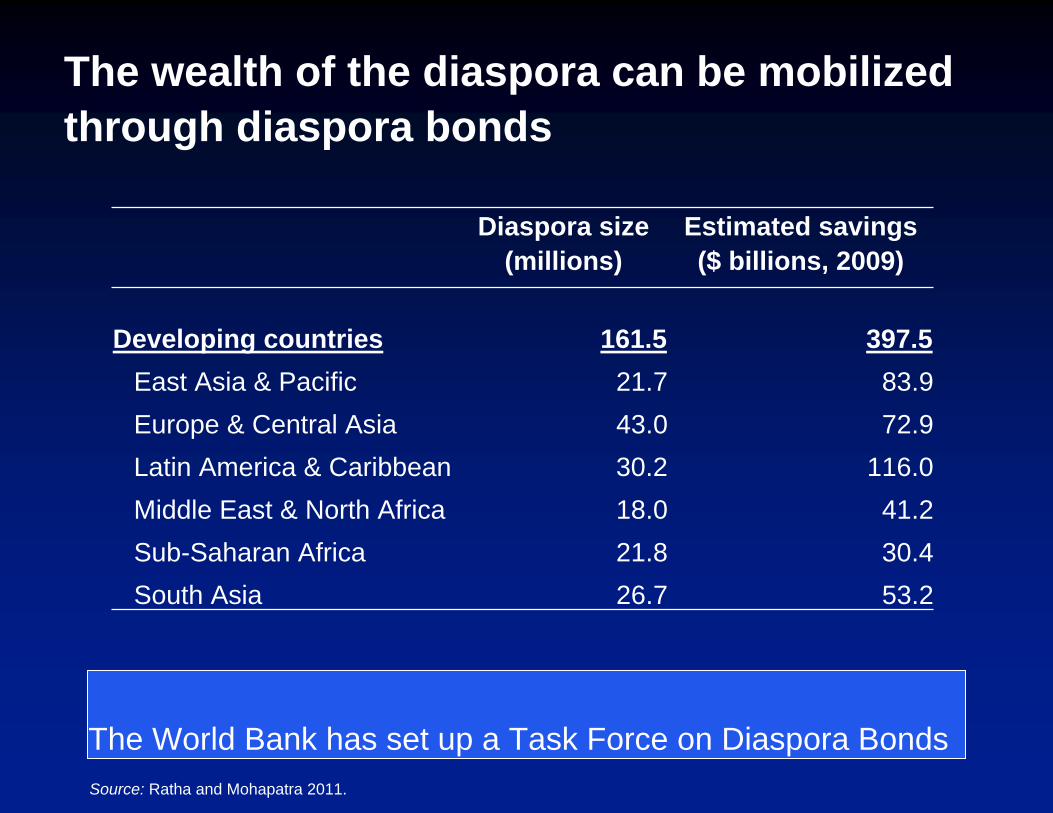
The wealth of the diaspora can be mobilized through diaspora bonds
Diaspora size(millions)
Estimated savings($ billions, 2009)
Developing countries 161.5 397.5East Asia & Pacific 21.7 83.9Europe & Central Asia 43.0 72.9Latin America & Caribbean 30.2 116.0Middle East & North Africa 18.0 41.2Sub-Saharan Africa 21.8 30.4South Asia 26.7 53.2
Source: Ratha and Mohapatra 2011.
The World Bank has set up a Task Force on Diaspora Bonds

Data and other resources are available at
www.worldbank.org/migration
Global Knowledge Partnership on Migration and Development
Objectives
An open, multidisciplinary platform
Generate a menu of policy choices based on evidence and peer-review
Pilot policy operations and capacity building efforts
Thematic areas
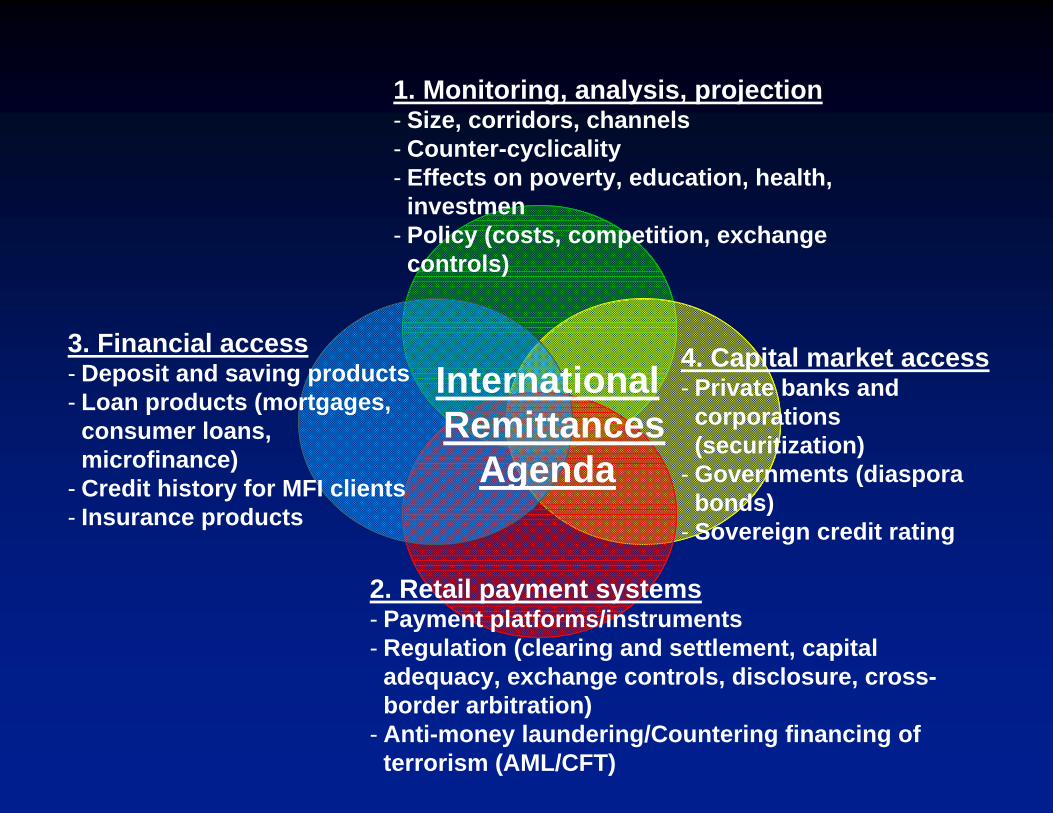
International Remittances
Agenda
1. Monitoring, analysis, projection- Size, corridors, channels- Counter-cyclicality - Effects on poverty, education, health,
investmen- Policy (costs, competition, exchange
controls)
2. Retail payment systems- Payment platforms/instruments- Regulation (clearing and settlement, capital
adequacy, exchange controls, disclosure, cross-border arbitration)
- Anti-money laundering/Countering financing of terrorism (AML/CFT)
3. Financial access- Deposit and saving products- Loan products (mortgages,
consumer loans, microfinance)
- Credit history for MFI clients- Insurance products
4. Capital market access- Private banks and
corporations (securitization)
- Governments (diaspora bonds)
- Sovereign credit rating
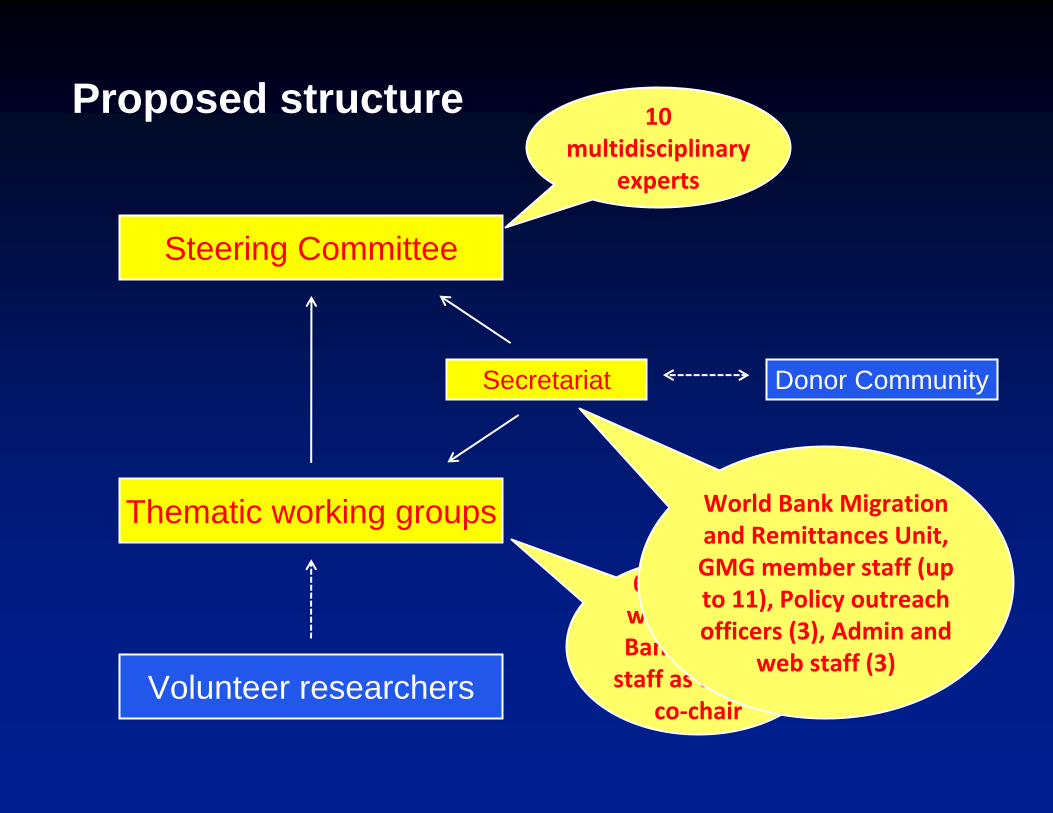
Proposed structure
Steering Committee
Thematic working groups
Volunteer researchers
Secretariat Donor Community
10 multidisciplinary
experts
6‐8 experts, with a World Bank or GMG staff as chair or
co‐chair
World Bank Migration and Remittances Unit, GMG member staff (up to 11), Policy outreach officers (3), Admin and
web staff (3)
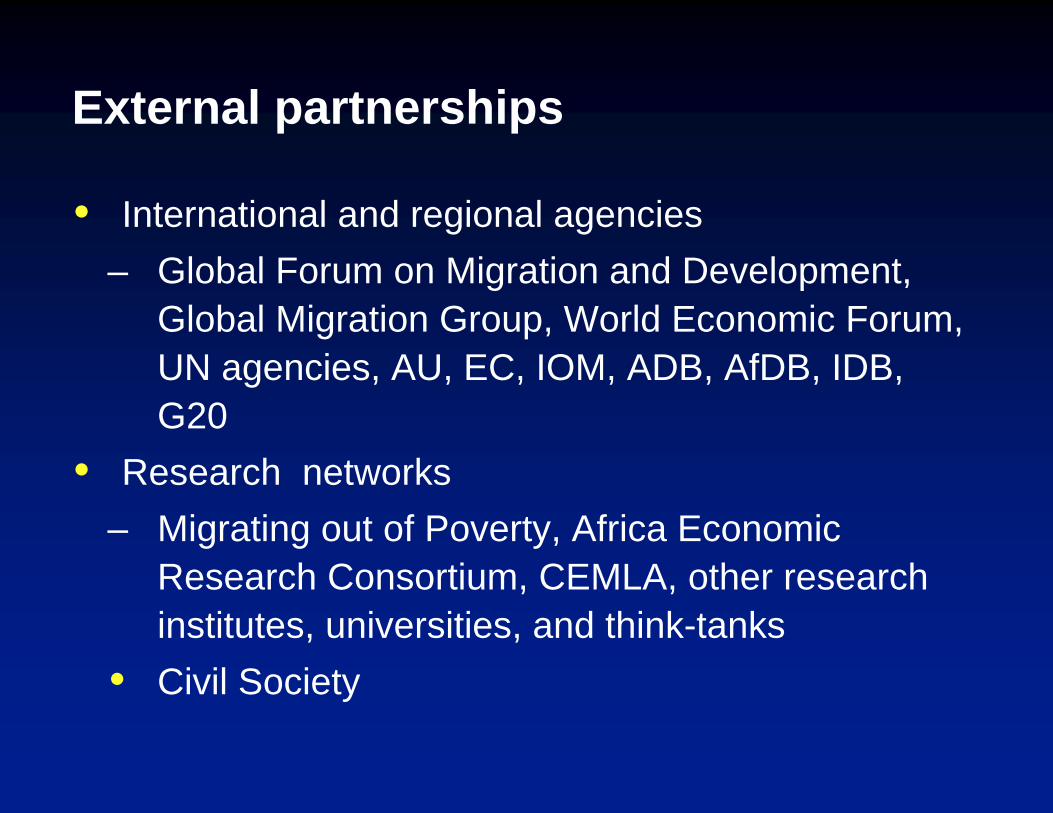
External partnerships
International and regional agencies– Global Forum on Migration and Development,
Global Migration Group, World Economic Forum, UN agencies, AU, EC, IOM, ADB, AfDB, IDB, G20
Research networks– Migrating out of Poverty, Africa Economic
Research Consortium, CEMLA, other research institutes, universities, and think-tanks
Civil Society
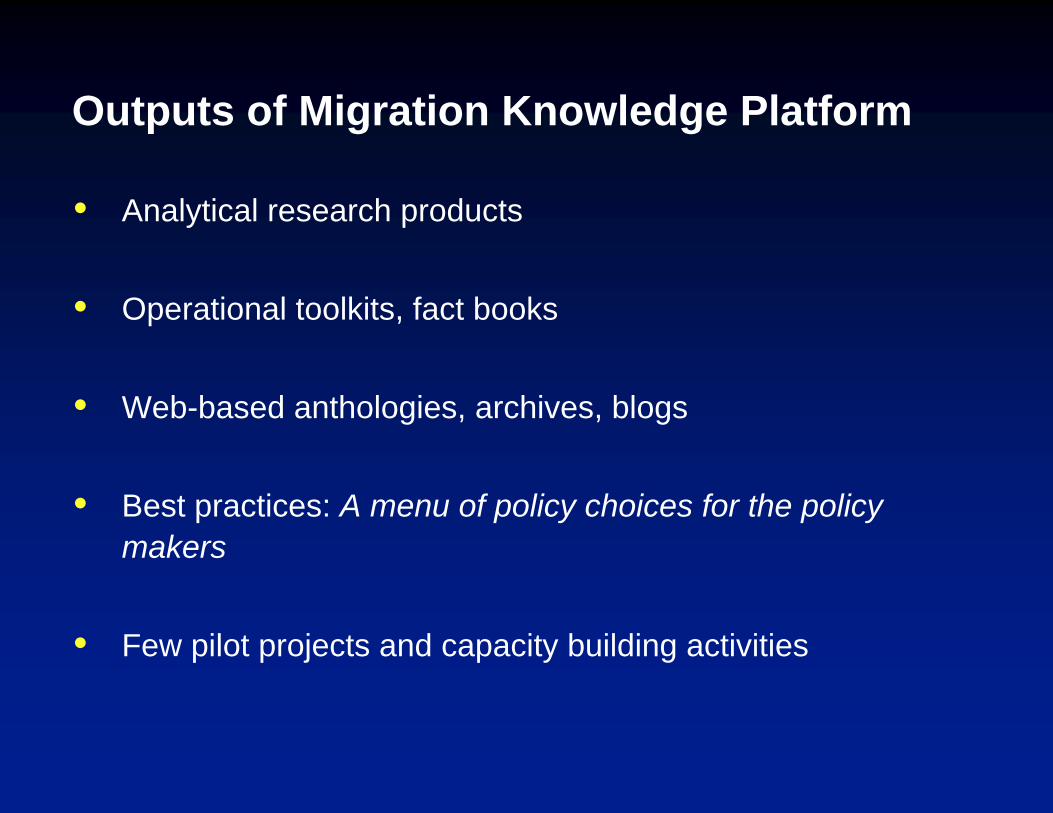
Outputs of Migration Knowledge Platform
Analytical research products
Operational toolkits, fact books
Web-based anthologies, archives, blogs
Best practices: A menu of policy choices for the policy makers
Few pilot projects and capacity building activities
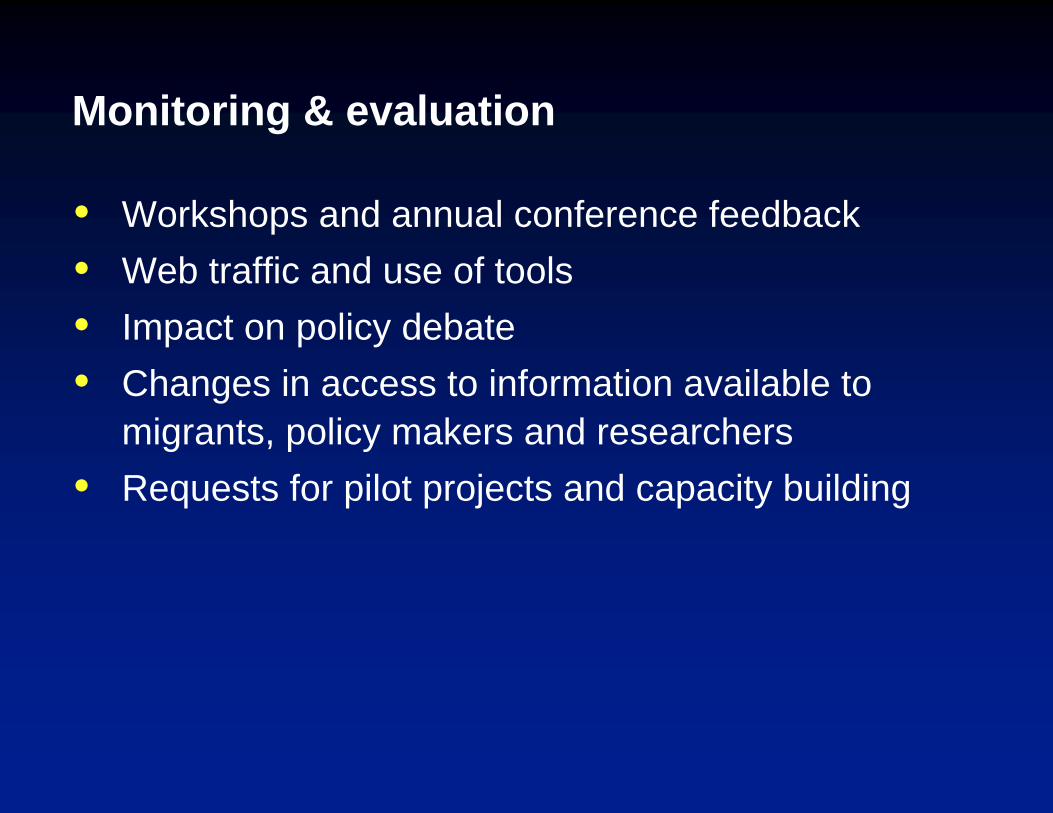
Monitoring & evaluation
Workshops and annual conference feedback Web traffic and use of tools Impact on policy debate Changes in access to information available to
migrants, policy makers and researchers Requests for pilot projects and capacity building
Data and other resources are available at
www.worldbank.org/migration