UvA-DARE (Digital Academic Repository) Eosinophilic ... · In case of a legitimate ... We performed...
17
UvA-DARE is a service provided by the library of the University of Amsterdam (http://dare.uva.nl) UvA-DARE (Digital Academic Repository) Eosinophilic esophagitis: studies on an emerging disease van Rhijn, B.D. Link to publication Citation for published version (APA): van Rhijn, B. D. (2014). Eosinophilic esophagitis: studies on an emerging disease General rights It is not permitted to download or to forward/distribute the text or part of it without the consent of the author(s) and/or copyright holder(s), other than for strictly personal, individual use, unless the work is under an open content license (like Creative Commons). Disclaimer/Complaints regulations If you believe that digital publication of certain material infringes any of your rights or (privacy) interests, please let the Library know, stating your reasons. In case of a legitimate complaint, the Library will make the material inaccessible and/or remove it from the website. Please Ask the Library: http://uba.uva.nl/en/contact, or a letter to: Library of the University of Amsterdam, Secretariat, Singel 425, 1012 WP Amsterdam, The Netherlands. You will be contacted as soon as possible. Download date: 29 Aug 2018
Transcript of UvA-DARE (Digital Academic Repository) Eosinophilic ... · In case of a legitimate ... We performed...

UvA-DARE is a service provided by the library of the University of Amsterdam (http://dare.uva.nl)
UvA-DARE (Digital Academic Repository)
Eosinophilic esophagitis: studies on an emerging disease
van Rhijn, B.D.
Link to publication
Citation for published version (APA):van Rhijn, B. D. (2014). Eosinophilic esophagitis: studies on an emerging disease
General rightsIt is not permitted to download or to forward/distribute the text or part of it without the consent of the author(s) and/or copyright holder(s),other than for strictly personal, individual use, unless the work is under an open content license (like Creative Commons).
Disclaimer/Complaints regulationsIf you believe that digital publication of certain material infringes any of your rights or (privacy) interests, please let the Library know, statingyour reasons. In case of a legitimate complaint, the Library will make the material inaccessible and/or remove it from the website. Please Askthe Library: http://uba.uva.nl/en/contact, or a letter to: Library of the University of Amsterdam, Secretariat, Singel 425, 1012 WP Amsterdam,The Netherlands. You will be contacted as soon as possible.
Download date: 29 Aug 2018

83
Chapter 6
Proton pump inhibitors partially restore
mucosal integrity in patients with proton
pump inhibitor-responsive esophageal
eosinophilia but not eosinophilic esophagitis
Bram D. van Rhijn, Pim W. Weijenborg, Joanne Verheij, Marius A. van den Bergh Weerman,
Caroline Verseijden, René M.J.G.J. van den Wijngaard, Wouter J. de Jonge, Andreas J.P.M.
Smout, A.J. (Arjan) Bredenoord
Clin Gastroenterol Hepatol 2014; doi:10.1016/j.cgh.2014.02.037

84
Abstract
Background & Aims: Histologic analysis is used to distinguish patients with proton pump
inhibitor-responsive eosinophilia (PPI-REE) from those with eosinophilic esophagitis (EoE). It
is not clear whether these entities have different etiologies. Exposure to acid reflux can
impair the integrity of the esophageal mucosal. We proposed that patients with EoE and PPI-
REE might have reflux-induced esophageal mucosal damage that promotes transepithelial
flux of allergens. We therefore assessed the integrity of the esophageal mucosal in these
patients at baseline and after PPI.
Methods: We performed a prospective study of 16 patients with suspected EoE and 11
controls. Patients had dysphagia, endoscopic signs of EoE, and esophageal eosinophilia (>15
eosinophils/high-power field [eos/hpf]). All subjects underwent endoscopy at baseline;
endoscopy was performed again on patients after 8 weeks of treatment with high-dose
esomeprazole. After PPI treatment, patients were diagnosed with EoE (>10 eos/hpf; n=8) or
PPI-REE (≤10 eos/hpf; n=8). We evaluated the structure (intercellular spaces) and function
(electrical tissue impedance, transepithelial electrical resistance, transepithelial molecule
flux) of the esophageal mucosal barrier.
Results: Compared with controls, electrical tissue impedance and transepithelial electrical
resistance were reduced in patients with EoE (P<0.001 and P<0.001, respectively) and PPI-
REE (P=0.01 and P=0.06, respectively), enabling transepithelial small-molecule flux. PPI
therapy partially restored these changes in integrity and inflammation in patients with PPI-
REE, but not in those with EoE.
Conclusions: The integrity of the esophageal mucosa is impaired in patients with EoE and
PPI-REE, allowing transepithelial transport of small molecules. PPI therapy partially restores
mucosal integrity in patients with PPI-REE, but not in those with EoE. Acid reflux might
contribute to transepithelial allergen flux in patients with PPI-REE. Trialregister.nl number:
NTR3480.

85
Introduction
Eosinophilic esophagitis (EoE) is a rapidly emerging disorder clinically characterized by
dysphagia and food impaction.1 The pathophysiology is largely unknown, although genetic
and allergic components seem to play a role.2 More recently, gastroesophageal reflux
disease (GERD) also has been suggested to play a role.3-5
A proton pump inhibitor (PPI) trial
may differentiate between EoE and GERD, however, response to PPIs also has been
observed in patients with typical symptoms and endoscopic and histopathologic signs of
EoE; these patients now are considered to have PPI-responsive eosinophilia (PPI-REE).4 Little
is known about the differences between PPI-REE and EoE.6
PPI-REE patients may have GERD
instead of EoE, however, they cannot be distinguished from EoE patients by clinical features,
endoscopic signs, or histopathologic signs.4,7
In patients with GERD, it has been well documented that acid reflux causes impaired
esophageal mucosal integrity, which has been suggested to decrease esophageal
intraluminal baseline impedance.8,9
Acid suppression with PPIs restores the esophageal
mucosal integrity in GERD.10
In EoE, esophageal baseline impedance values are decreased as
well, and histologic studies also have shown dilation of intercellular spaces – a morphologic
feature of epithelial permeability changes – in EoE.11,12
We hypothesized that acid-induced impairment of esophageal mucosal integrity facilitates
permeation of food allergens, thereby promoting immune activation in patients with PPI-REE
and EoE. If this hypothesis is valid, proton pump inhibition will restore the esophageal
mucosal integrity and thereby reduce the passage of allergens into the epithelium. The aim
of our study was to show an impaired esophageal mucosal integrity in PPI-REE and EoE
patients, and to study the effect of acid suppression on the esophageal mucosal integrity.
Methods
Study subjects
In this prospective study, we included 16 adult patients with suspected EoE (>15
eosinophils/high-power field [eos/hpf], predominant symptoms of dysphagia and/or food
impaction, and endoscopic signs of EoE), and 11 healthy controls. Based on peak eosinophil
counts after PPI, patients were divided into 2 subgroups: responders (PPI-REE, ≤10 eos/hpf)
and nonresponders (EoE, >10 eos/hpf) (Figure 1). Patients were recruited consecutively from
the outpatient clinic of our hospital. Healthy controls were recruited by advertisement in the
hospital and had no dysphagia/reflux symptoms or other gastrointestinal complaints. None
of the study subjects had undergone surgery of the digestive tract. Each study subject
provided written informed consent and the study protocol was approved by the Medical
Ethics Committee of our institution. All authors had access to the study data and reviewed
and approved the final manuscript.

86
Figure 1. Study protocol and patient subgroup selection. The esophageal mucosal integrity of
patients and controls was measured at baseline. In patients, the integrity and inflammation
were measured after PPI treatment. Based on the eosinophil count after PPI treatment,
patients were categorized as PPI-REE (10 eos/hpf) or EoE (>10 eos/hpf).
Study Protocol
In all study subjects, dietary, anti-inflammatory, and acid-suppressive treatments were
discontinued 8 weeks before baseline upper endoscopy. In the 24 hours preceding
endoscopy, smoking and alcohol intake were not allowed. In patients, endoscopy was
repeated after 8 weeks of 40 mg esomeprazole twice-daily treatment, and the frequency
and severity of dysphagia for liquids and solids was assessed using a 6-grade Likert scale, in
which 0 represents no dysphagia and 5 represents daily/severe dysphagia, analogous to the
reflux disease questionnaire.
Upper endoscopy
After routine inspection of the duodenum and stomach, pictures were taken of the
esophagus for assessment of endoscopic signs of EoE. After this, 5 electrical tissue
impedance spectroscopy (ETIS) measurements were performed in the distal esophagus 5 cm
proximal to the Z-line. At the same level, 4 biopsy specimens were obtained with a large
biopsy forceps (diameter, 3.7 mm) for the assessment of functional mucosal integrity in
Ussing chambers. In addition, 2 large biopsy specimens were taken to evaluate dilation of

87
intercellular spaces by transmission electron microscopy. For histopathologic analysis in
patients, 6 biopsy specimens were taken, and 1 biopsy specimen was taken for gene
expression profiling.
To assess endoscopic signs of EoE (white exudates, linear furrows, concentric rings, solitary
ring, crepe paper mucosa, pallor, and narrow-caliber esophagus), a physician blinded to the
patient's status scored the endoscopic pictures.
Esophageal Mucosal Integrity Assessment In Vivo
As a functional measure of esophageal mucosal integrity, we performed ETIS measurements
to measure the extracellular esophageal impedance during endoscopy, as previously
described.13
The extracellular impedance was correlated with structural and functional in
vitro parameters of esophageal mucosal integrity; ETIS is therefore a measure of esophageal
mucosal integrity in vivo.13
Esophageal Mucosal Integrity Assessment In Vitro
Esophageal mucosal integrity was assessed according to previously described methods.13
In
short, 4 esophageal biopsy specimens were mounted in Ussing chambers immediately after
endoscopy. Electrodes were used to measure the transepithelial electrical resistance (TER).
Simultaneously, the transepithelial flux of fluorescent molecules of 2 different sizes
(fluorescein, 332 daltons; rhodamine, 40,000 daltons; size similar to common food allergens)
was measured. After 15 minutes of acclimatization in Meyler buffer, we sampled the serosal
bath and subsequently replaced the luminal buffer with a modified Meyler buffer containing
these fluorescent molecules at a concentration of 0.5 mg/mL. We sampled the serosal bath
every 15 minutes during 1 hour. A fluorescence plate reader (BioTek Synergy; BioTek,
Winooski, VT) measured the concentration of fluorescein and rhodamine molecules using
excitation wavelengths of 485 and 530 nm and emission wavelengths of 528 and 590 nm,
respectively. Rhodamine signal strength was corrected for the presence of fluorescein.
Transmission Electron Microscopy
As a structural marker of esophageal mucosal integrity related to esophageal permeability
changes,8,10
the space between individual esophageal epithelial cells was measured, as
previously described.13
The laboratory technician was blinded to the status of the biopsy and
selected 10 random photographs of each biopsy at the basal prickle layer (magnification,
4600×). Image processing and analysis was performed using Qwin (Leica Microsystems,
Wetzlar, Germany).
Histopathologic analysis
For histopathologic analysis, 2 biopsy specimens were taken at the distal esophagus,
midesophagus (5 cm and 10-15 cm above the gastroesophageal junction), and proximal
esophagus (5 cm below the upper esophageal sphincter). Specimens were stained with H&E

88
and tryptase to determine the eosinophil and mast cell counts. An experienced
gastrointestinal pathologist blinded to biopsy location and the patient's treatment status
analyzed the specimens in random order, using an Olympus BX41 microscope (Olympus
Europe, Hamburg, Germany). In each biopsy specimen, the area of greatest eosinophil
density was detected with a low-power view. By using a magnification of 400× (1 hpf), the
peak eosinophil count was determined. Mast cells were counted identically.
Furthermore, the presence of eosinophilic microabscesses (defined as clusters of ≥4
eosinophils) were analyzed at high-power, and basal hyperplasia and spongiosis were
analyzed at low-power (for both: 0 = absent, 1 = extending to lower third of total epithelial
thickness [mild], 2 = extending to middle third [moderate], 3 = extending to upper third
[severe]), according to the literature.11
Quantitative Real-Time Polymerase Chain Reaction
During endoscopy at baseline and after PPI, 1 mucosal biopsy specimen from each patient
was collected and immersed in RNA stabilization reagent (RNAlater; Qiagen, Hilden,
Germany). Samples were stored overnight at 4°C and subsequently were stored at -80°C
until analysis. Biopsy specimens were homogenized and total RNA was extracted using the
RNeasy Micro Kit (Qiagen) according to the manufacturer's recommendations. The RNA
concentration was assessed using the Nanodrop Spectrophotometer (Nanodrop
Technologies, Wilmington, DE). Complementary DNA was synthesized using a reverse-
transcriptase reaction performed according to the MBI Fermentas complementary DNA
synthesis kit (Fermentas, Vilnius, Lithuania), using both the Oligo(dT)18 and the D(N)6
primers. Quantitative real-time polymerase chain reaction (PCR) was performed on the
LightCycler 480 (Roche Diagnostic, Almere, The Netherlands) using SYBR Green PCR Master
Mix (Roche Diagnostic) and primers from Invitrogen (Life Technologies Corporation,
Carlsbad, CA) (Supplementary Table 1). For quantitative real-time PCR, samples were
normalized for the mean of the 3 most stable housekeeping genes (cyclophilin,
glyceraldehyde-3-phosphate dehydrogenase, and β-actin) as determined by analysis with
geNorm method software (available at: http://medgen.ugent.be/∼jvdesomp/genorm/).
Transcript levels of interleukin (IL)5, IL13, eotaxin-3 (CCL26), periostin (POSTN), filaggrin
(FLG), and thymic stromal lymphopoietin were determined in duplicate.
Statistical analysis
Continuous data were expressed as medians (interquartile range [IQR]). Differences
between 2 or more groups were calculated with the Kruskal-Wallis test, with Bonferroni post
hoc correction for multiple testing. Patient groups were compared using the Mann-Whitney
U test or the Wilcoxon signed rank test where appropriate. Proportions were compared
using the chi-square test, the Fisher exact test, or the McNemar test where appropriate.
Correlations were calculated using the Spearman correlation coefficient. We considered a P
value less than 0.05 to be significant.

89
Results
Patients vs Controls
Subject characteristics
We consecutively included 16 patients (13 men) with suspected EoE, and 11 controls (7
men). No patients were excluded or dropped out after enrolment in the study. The median
age at first endoscopy was 42 years (IQR, 32-46 y) for patients and 35 years (IQR, 29-53 y) for
controls (P=0.6). None of the controls had abnormalities on endoscopy. Based on peak
eosinophil counts after PPI, 8 patients (6 men) were classified as PPI-REE (range, 0-10
eos/hpf), and 8 patients (7 men) were classified as EoE patients (range, 19-100 eos/hpf).
Esophageal mucosal integrity and intercellular spaces
The distributions of the extracellular impedance (P<0.001), TER (P<0.001), fluorescein flux
(P=0.001), and intercellular spaces (P=0.003) were significantly different between PPI-REE
and EoE patients and healthy controls. Post hoc analysis showed that the extracellular
impedance was significantly lower in EoE (2014 Ω•m; 1288-3963 Ω•m; P<0.001) and PPI-REE
patients (3128 Ω•m; 1869-5213 Ω•m; P=0.01) compared with controls (7707 Ω•m; 6146-
10,488 Ω•m; (Figure 2A). TER values also were lower in EoE (31.3 Ω•m; 25.4-41.8 Ω•cm2;
P<0.001) and borderline lower in PPI-REE patients (42.7 Ω•m; 34.1-62.4 Ω•cm2; P=0.06)
than in controls (116.7 Ω•m; 90.3-126.4 Ω•cm2) (Figure 2B). Furthermore, compared with
controls (345 nmol/cm2/h; 0-1451 nmol/cm2/h), the transepithelial flux of fluorescein
molecules in the Ussing chambers was significantly increased in EoE patients (2974
nmol/cm2/h; 2680-3362 nmol/cm2/h; P<0.001), but not in PPI-REE patients (1640
nmol/cm2/h; 1-2424 nmol/cm2/h; P=0.8) (Figure 2C).
Figure 2. A) Extracellular impedance, B) TER, C) fluorescein flux, and D) intercellular space show impaired
mucosal integrity in PPI-REE patients and EoE patients compared with controls. Black bars indicate medians.

90
At baseline, intercellular spaces were evaluated in all EoE patients, in 7 PPI-REE patients, and
in 6 controls. Samples of 1 PPI-REE patient and 5 control subjects unfortunately were lost as
a result of a technical problem during sample processing. The intercellular space was
significantly larger in EoE (0.34; 0.32-0.45; P=0.008) and PPI-REE patients (0.37; 0.33-0.42;
P=0.007) than in controls (0.14; 0.11-0.23) (Figure 2D).
Effect of Proton Pump Inhibitor
Esophageal mucosal integrity and intercellular spaces
In PPI-REE patients (Figure 3), the extracellular impedance increased significantly from 3128
Ω•m (1869-5213 Ω•m) to 6848 Ω•m (5761-9363 Ω•m) (P=0.01) after PPI, and was no longer
different from healthy control values (P=0.6). The TER increased from 42.7 Ω•m (34.1-62.4
Ω•m) to 100.0 Ω•m (68.8-121.9 Ω•m; P=0.004), and was not different from healthy control
values (P = 1.0). The transepithelial flux of the small fluorescein molecules decreased from
1640 nmol/cm2/h (1-2424 nmol/cm2/h) to 255 nmol/cm2/h (39-628 nmol/cm2/h), although
not significantly (P=0.06), and was not different from healthy control values (P = 1.0).
Moreover, the flux of the larger, food allergen-sized rhodamine molecules decreased
significantly from 22 nmol/cm2/h (0-38 nmol/cm2/h) to 0 nmol/cm2/h (0-0 nmol/cm2/h;
P=0.046). The intercellular space remained unchanged, being 0.37 (0.33-0.42) at baseline
and 0.33 (0.27-0.38) after PPI (P=0.1).
Figure 3. A) Extracellular impedance, B) TER, C) fluorescein flux, D) rhodamine flux, and E) intercellular space in
PPI-REE patients after PPI. Black bars indicate medians.
In EoE patients (Figure 4), the extracellular impedance increased significantly from 2014
Ω•m (1288-3963 Ω•m) to 3404 Ω•m (2810-6579 Ω•m; P=0.01) after PPI, however, it was still
significantly lower than in healthy controls (P=0.04). The TER (from 31.3 Ω•m; 25.4-41.8 to

32.4 Ω•m; 27.1
molecules (from 2974 nmol/cm2/h; 2680
3251 nmol/cm2/h after PPI;
7-
space (from 0.34; 0.32
PPI, the TER was significantly lower in EoE patients compared
(P=0.
fluorescein molecules (
rhodamine molecules (
Intercellular spaces were not different between PPI
baseline and after PPI (both P = 1.0)
Figure
specimens
32.4 Ω•m; 27.1
molecules (from 2974 nmol/cm2/h; 2680
3251 nmol/cm2/h after PPI;
38 nmol/cm2/h to 9 nmol/cm2/h; 5
space (from 0.34; 0.32
PPI, the TER was significantly lower in EoE patients compared
P=0.
fluorescein molecules (
rhodamine molecules (
Intercellular spaces were not different between PPI
baseline and after PPI (both P = 1.0)
Figure
Figure 5.
specimens
EoE patients at baseline and
32.4 Ω•m; 27.1
molecules (from 2974 nmol/cm2/h; 2680
3251 nmol/cm2/h after PPI;
38 nmol/cm2/h to 9 nmol/cm2/h; 5
space (from 0.34; 0.32
PPI, the TER was significantly lower in EoE patients compared
P=0.001) and compared with PPI
fluorescein molecules (
rhodamine molecules (
Intercellular spaces were not different between PPI
baseline and after PPI (both P = 1.0)
Figure 4.
Figure 5.
specimens
EoE patients at baseline and
32.4 Ω•m; 27.1
molecules (from 2974 nmol/cm2/h; 2680
3251 nmol/cm2/h after PPI;
38 nmol/cm2/h to 9 nmol/cm2/h; 5
space (from 0.34; 0.32
PPI, the TER was significantly lower in EoE patients compared
001) and compared with PPI
fluorescein molecules (
rhodamine molecules (
Intercellular spaces were not different between PPI
baseline and after PPI (both P = 1.0)
. A) Extracellular impedance, B) TER, C) fluorescein flux, D) rhodami
Figure 5. Transmission electron microscopy images of the basal prickle layer of esophageal mucosal biopsy
specimens
EoE patients at baseline and
32.4 Ω•m; 27.1
molecules (from 2974 nmol/cm2/h; 2680
3251 nmol/cm2/h after PPI;
38 nmol/cm2/h to 9 nmol/cm2/h; 5
space (from 0.34; 0.32
PPI, the TER was significantly lower in EoE patients compared
001) and compared with PPI
fluorescein molecules (
rhodamine molecules (
Intercellular spaces were not different between PPI
baseline and after PPI (both P = 1.0)
A) Extracellular impedance, B) TER, C) fluorescein flux, D) rhodami
Transmission electron microscopy images of the basal prickle layer of esophageal mucosal biopsy
showing dilated intercellular spaces.
EoE patients at baseline and
intercellular spaces were reduced after PPI.
32.4 Ω•m; 27.1-
molecules (from 2974 nmol/cm2/h; 2680
3251 nmol/cm2/h after PPI;
38 nmol/cm2/h to 9 nmol/cm2/h; 5
space (from 0.34; 0.32
PPI, the TER was significantly lower in EoE patients compared
001) and compared with PPI
fluorescein molecules (
rhodamine molecules (
Intercellular spaces were not different between PPI
baseline and after PPI (both P = 1.0)
A) Extracellular impedance, B) TER, C) fluorescein flux, D) rhodami
Transmission electron microscopy images of the basal prickle layer of esophageal mucosal biopsy
showing dilated intercellular spaces.
EoE patients at baseline and
intercellular spaces were reduced after PPI.
-56.5 Ω•cm2 after PPI;
molecules (from 2974 nmol/cm2/h; 2680
3251 nmol/cm2/h after PPI;
38 nmol/cm2/h to 9 nmol/cm2/h; 5
space (from 0.34; 0.32
PPI, the TER was significantly lower in EoE patients compared
001) and compared with PPI
fluorescein molecules (
rhodamine molecules (
Intercellular spaces were not different between PPI
baseline and after PPI (both P = 1.0)
A) Extracellular impedance, B) TER, C) fluorescein flux, D) rhodami
Transmission electron microscopy images of the basal prickle layer of esophageal mucosal biopsy
showing dilated intercellular spaces.
EoE patients at baseline and
intercellular spaces were reduced after PPI.
56.5 Ω•cm2 after PPI;
molecules (from 2974 nmol/cm2/h; 2680
3251 nmol/cm2/h after PPI;
38 nmol/cm2/h to 9 nmol/cm2/h; 5
space (from 0.34; 0.32-0.45 to 0.35; 0.33
PPI, the TER was significantly lower in EoE patients compared
001) and compared with PPI
fluorescein molecules (P=0.
rhodamine molecules (P=0.
Intercellular spaces were not different between PPI
baseline and after PPI (both P = 1.0)
A) Extracellular impedance, B) TER, C) fluorescein flux, D) rhodami
Transmission electron microscopy images of the basal prickle layer of esophageal mucosal biopsy
showing dilated intercellular spaces.
EoE patients at baseline and
intercellular spaces were reduced after PPI.
56.5 Ω•cm2 after PPI;
molecules (from 2974 nmol/cm2/h; 2680
3251 nmol/cm2/h after PPI;
38 nmol/cm2/h to 9 nmol/cm2/h; 5
0.45 to 0.35; 0.33
PPI, the TER was significantly lower in EoE patients compared
001) and compared with PPI
P=0.
P=0.
Intercellular spaces were not different between PPI
baseline and after PPI (both P = 1.0)
A) Extracellular impedance, B) TER, C) fluorescein flux, D) rhodami
Eo
Transmission electron microscopy images of the basal prickle layer of esophageal mucosal biopsy
showing dilated intercellular spaces.
EoE patients at baseline and after PPI. Nevertheless, in some PPI
intercellular spaces were reduced after PPI.
56.5 Ω•cm2 after PPI;
molecules (from 2974 nmol/cm2/h; 2680
3251 nmol/cm2/h after PPI; P=0.
38 nmol/cm2/h to 9 nmol/cm2/h; 5
0.45 to 0.35; 0.33
PPI, the TER was significantly lower in EoE patients compared
001) and compared with PPI
P=0.004 vs controls, and
P=0.002 vs PPI
Intercellular spaces were not different between PPI
baseline and after PPI (both P = 1.0)
A) Extracellular impedance, B) TER, C) fluorescein flux, D) rhodami
oE patients after PPI. Black bars indicate medians.
Transmission electron microscopy images of the basal prickle layer of esophageal mucosal biopsy
showing dilated intercellular spaces.
after PPI. Nevertheless, in some PPI
intercellular spaces were reduced after PPI.
56.5 Ω•cm2 after PPI;
molecules (from 2974 nmol/cm2/h; 2680
P=0.
38 nmol/cm2/h to 9 nmol/cm2/h; 5
0.45 to 0.35; 0.33
PPI, the TER was significantly lower in EoE patients compared
001) and compared with PPI
004 vs controls, and
002 vs PPI
Intercellular spaces were not different between PPI
baseline and after PPI (both P = 1.0)
A) Extracellular impedance, B) TER, C) fluorescein flux, D) rhodami
E patients after PPI. Black bars indicate medians.
Transmission electron microscopy images of the basal prickle layer of esophageal mucosal biopsy
showing dilated intercellular spaces.
after PPI. Nevertheless, in some PPI
intercellular spaces were reduced after PPI.
56.5 Ω•cm2 after PPI;
molecules (from 2974 nmol/cm2/h; 2680
P=0.1), and larger rhodamine molecules (from 20 nmo
38 nmol/cm2/h to 9 nmol/cm2/h; 5
0.45 to 0.35; 0.33
PPI, the TER was significantly lower in EoE patients compared
001) and compared with PPI-REE patients (
004 vs controls, and
002 vs PPI
Intercellular spaces were not different between PPI
baseline and after PPI (both P = 1.0)
A) Extracellular impedance, B) TER, C) fluorescein flux, D) rhodami
E patients after PPI. Black bars indicate medians.
Transmission electron microscopy images of the basal prickle layer of esophageal mucosal biopsy
showing dilated intercellular spaces.
after PPI. Nevertheless, in some PPI
intercellular spaces were reduced after PPI.
56.5 Ω•cm2 after PPI;
molecules (from 2974 nmol/cm2/h; 2680
1), and larger rhodamine molecules (from 20 nmo
38 nmol/cm2/h to 9 nmol/cm2/h; 5-
0.45 to 0.35; 0.33
PPI, the TER was significantly lower in EoE patients compared
REE patients (
004 vs controls, and
002 vs PPI-
Intercellular spaces were not different between PPI
baseline and after PPI (both P = 1.0) (Figure 5).
A) Extracellular impedance, B) TER, C) fluorescein flux, D) rhodami
E patients after PPI. Black bars indicate medians.
Transmission electron microscopy images of the basal prickle layer of esophageal mucosal biopsy
showing dilated intercellular spaces.
after PPI. Nevertheless, in some PPI
intercellular spaces were reduced after PPI.
56.5 Ω•cm2 after PPI; P=0.
molecules (from 2974 nmol/cm2/h; 2680
1), and larger rhodamine molecules (from 20 nmo
-28 nmol/cm2/h after PPI;
0.45 to 0.35; 0.33
PPI, the TER was significantly lower in EoE patients compared
REE patients (
004 vs controls, and
-REE patients)
Intercellular spaces were not different between PPI
Figure 5).
A) Extracellular impedance, B) TER, C) fluorescein flux, D) rhodami
E patients after PPI. Black bars indicate medians.
Transmission electron microscopy images of the basal prickle layer of esophageal mucosal biopsy
showing dilated intercellular spaces.
after PPI. Nevertheless, in some PPI
intercellular spaces were reduced after PPI.
P=0.9), the transepithelial flux of small fluorescein
molecules (from 2974 nmol/cm2/h; 2680-3362 nmol/cm2/h to 2502 nmol/cm2/h; 1404
1), and larger rhodamine molecules (from 20 nmo
28 nmol/cm2/h after PPI;
0.45 to 0.35; 0.33-0.42 after PPI;
PPI, the TER was significantly lower in EoE patients compared
REE patients (
004 vs controls, and
REE patients)
Intercellular spaces were not different between PPI
Figure 5).
A) Extracellular impedance, B) TER, C) fluorescein flux, D) rhodami
E patients after PPI. Black bars indicate medians.
Transmission electron microscopy images of the basal prickle layer of esophageal mucosal biopsy
showing dilated intercellular spaces. Intercellular spaces were not different between PPI
after PPI. Nevertheless, in some PPI
intercellular spaces were reduced after PPI.
9), the transepithelial flux of small fluorescein
3362 nmol/cm2/h to 2502 nmol/cm2/h; 1404
1), and larger rhodamine molecules (from 20 nmo
28 nmol/cm2/h after PPI;
0.42 after PPI;
PPI, the TER was significantly lower in EoE patients compared
REE patients (
004 vs controls, and
REE patients)
Intercellular spaces were not different between PPI
Figure 5).
A) Extracellular impedance, B) TER, C) fluorescein flux, D) rhodami
E patients after PPI. Black bars indicate medians.
Transmission electron microscopy images of the basal prickle layer of esophageal mucosal biopsy
Intercellular spaces were not different between PPI
after PPI. Nevertheless, in some PPI
intercellular spaces were reduced after PPI.
9), the transepithelial flux of small fluorescein
3362 nmol/cm2/h to 2502 nmol/cm2/h; 1404
1), and larger rhodamine molecules (from 20 nmo
28 nmol/cm2/h after PPI;
0.42 after PPI;
PPI, the TER was significantly lower in EoE patients compared
REE patients (P=0.
004 vs controls, and P=0.
REE patients)
Intercellular spaces were not different between PPI
Figure 5).
A) Extracellular impedance, B) TER, C) fluorescein flux, D) rhodami
E patients after PPI. Black bars indicate medians.
Transmission electron microscopy images of the basal prickle layer of esophageal mucosal biopsy
Intercellular spaces were not different between PPI
after PPI. Nevertheless, in some PPI
intercellular spaces were reduced after PPI. Scale bars: 5 mm. pt#, patient number.
9), the transepithelial flux of small fluorescein
3362 nmol/cm2/h to 2502 nmol/cm2/h; 1404
1), and larger rhodamine molecules (from 20 nmo
28 nmol/cm2/h after PPI;
0.42 after PPI;
PPI, the TER was significantly lower in EoE patients compared
P=0.
P=0.
REE patients)
Intercellular spaces were not different between PPI-
A) Extracellular impedance, B) TER, C) fluorescein flux, D) rhodami
E patients after PPI. Black bars indicate medians.
Transmission electron microscopy images of the basal prickle layer of esophageal mucosal biopsy
Intercellular spaces were not different between PPI
after PPI. Nevertheless, in some PPI
Scale bars: 5 mm. pt#, patient number.
9), the transepithelial flux of small fluorescein
3362 nmol/cm2/h to 2502 nmol/cm2/h; 1404
1), and larger rhodamine molecules (from 20 nmo
28 nmol/cm2/h after PPI;
0.42 after PPI;
PPI, the TER was significantly lower in EoE patients compared
P=0.03). In line with this, the flux of small
P=0.003 vs PPI
REE patients) still was high in EoE patients after PPI.
-REE patients and EoE patients at
A) Extracellular impedance, B) TER, C) fluorescein flux, D) rhodami
E patients after PPI. Black bars indicate medians.
Transmission electron microscopy images of the basal prickle layer of esophageal mucosal biopsy
Intercellular spaces were not different between PPI
after PPI. Nevertheless, in some PPI
Scale bars: 5 mm. pt#, patient number.
9), the transepithelial flux of small fluorescein
3362 nmol/cm2/h to 2502 nmol/cm2/h; 1404
1), and larger rhodamine molecules (from 20 nmo
28 nmol/cm2/h after PPI;
0.42 after PPI; P=0.
PPI, the TER was significantly lower in EoE patients compared
03). In line with this, the flux of small
003 vs PPI
still was high in EoE patients after PPI.
REE patients and EoE patients at
A) Extracellular impedance, B) TER, C) fluorescein flux, D) rhodami
E patients after PPI. Black bars indicate medians.
Transmission electron microscopy images of the basal prickle layer of esophageal mucosal biopsy
Intercellular spaces were not different between PPI
after PPI. Nevertheless, in some PPI-REE patients (
Scale bars: 5 mm. pt#, patient number.
9), the transepithelial flux of small fluorescein
3362 nmol/cm2/h to 2502 nmol/cm2/h; 1404
1), and larger rhodamine molecules (from 20 nmo
28 nmol/cm2/h after PPI;
P=0.
PPI, the TER was significantly lower in EoE patients compared
03). In line with this, the flux of small
003 vs PPI
still was high in EoE patients after PPI.
REE patients and EoE patients at
A) Extracellular impedance, B) TER, C) fluorescein flux, D) rhodami
E patients after PPI. Black bars indicate medians.
Transmission electron microscopy images of the basal prickle layer of esophageal mucosal biopsy
Intercellular spaces were not different between PPI
REE patients (
Scale bars: 5 mm. pt#, patient number.
9), the transepithelial flux of small fluorescein
3362 nmol/cm2/h to 2502 nmol/cm2/h; 1404
1), and larger rhodamine molecules (from 20 nmo
28 nmol/cm2/h after PPI;
P=0.4) were unaffected by PPI. After
PPI, the TER was significantly lower in EoE patients compared with healthy controls
03). In line with this, the flux of small
003 vs PPI-
still was high in EoE patients after PPI.
REE patients and EoE patients at
A) Extracellular impedance, B) TER, C) fluorescein flux, D) rhodami
E patients after PPI. Black bars indicate medians.
Transmission electron microscopy images of the basal prickle layer of esophageal mucosal biopsy
Intercellular spaces were not different between PPI
REE patients (
Scale bars: 5 mm. pt#, patient number.
9), the transepithelial flux of small fluorescein
3362 nmol/cm2/h to 2502 nmol/cm2/h; 1404
1), and larger rhodamine molecules (from 20 nmo
28 nmol/cm2/h after PPI; P=0.
4) were unaffected by PPI. After
with healthy controls
03). In line with this, the flux of small
-REE patients) and the larger
still was high in EoE patients after PPI.
REE patients and EoE patients at
A) Extracellular impedance, B) TER, C) fluorescein flux, D) rhodamine flux, and E) intercellular space in
E patients after PPI. Black bars indicate medians.
Transmission electron microscopy images of the basal prickle layer of esophageal mucosal biopsy
Intercellular spaces were not different between PPI
REE patients (
Scale bars: 5 mm. pt#, patient number.
9), the transepithelial flux of small fluorescein
3362 nmol/cm2/h to 2502 nmol/cm2/h; 1404
1), and larger rhodamine molecules (from 20 nmo
P=0.
4) were unaffected by PPI. After
with healthy controls
03). In line with this, the flux of small
REE patients) and the larger
still was high in EoE patients after PPI.
REE patients and EoE patients at
ne flux, and E) intercellular space in
E patients after PPI. Black bars indicate medians.
Transmission electron microscopy images of the basal prickle layer of esophageal mucosal biopsy
Intercellular spaces were not different between PPI
REE patients (e.g.
Scale bars: 5 mm. pt#, patient number.
9), the transepithelial flux of small fluorescein
3362 nmol/cm2/h to 2502 nmol/cm2/h; 1404
1), and larger rhodamine molecules (from 20 nmo
P=0.3), and the intercellular
4) were unaffected by PPI. After
with healthy controls
03). In line with this, the flux of small
REE patients) and the larger
still was high in EoE patients after PPI.
REE patients and EoE patients at
ne flux, and E) intercellular space in
Transmission electron microscopy images of the basal prickle layer of esophageal mucosal biopsy
Intercellular spaces were not different between PPI
e.g.
Scale bars: 5 mm. pt#, patient number.
9), the transepithelial flux of small fluorescein
3362 nmol/cm2/h to 2502 nmol/cm2/h; 1404
1), and larger rhodamine molecules (from 20 nmo
3), and the intercellular
4) were unaffected by PPI. After
with healthy controls
03). In line with this, the flux of small
REE patients) and the larger
still was high in EoE patients after PPI.
REE patients and EoE patients at
ne flux, and E) intercellular space in
Transmission electron microscopy images of the basal prickle layer of esophageal mucosal biopsy
Intercellular spaces were not different between PPI
e.g., PPI
Scale bars: 5 mm. pt#, patient number.
9), the transepithelial flux of small fluorescein
3362 nmol/cm2/h to 2502 nmol/cm2/h; 1404
1), and larger rhodamine molecules (from 20 nmo
3), and the intercellular
4) were unaffected by PPI. After
with healthy controls
03). In line with this, the flux of small
REE patients) and the larger
still was high in EoE patients after PPI.
REE patients and EoE patients at
ne flux, and E) intercellular space in
Transmission electron microscopy images of the basal prickle layer of esophageal mucosal biopsy
Intercellular spaces were not different between PPI
, PPI-REE patient 1), the
Scale bars: 5 mm. pt#, patient number.
9), the transepithelial flux of small fluorescein
3362 nmol/cm2/h to 2502 nmol/cm2/h; 1404
1), and larger rhodamine molecules (from 20 nmo
3), and the intercellular
4) were unaffected by PPI. After
with healthy controls
03). In line with this, the flux of small
REE patients) and the larger
still was high in EoE patients after PPI.
REE patients and EoE patients at
ne flux, and E) intercellular space in
Transmission electron microscopy images of the basal prickle layer of esophageal mucosal biopsy
Intercellular spaces were not different between PPI
REE patient 1), the
Scale bars: 5 mm. pt#, patient number.
9), the transepithelial flux of small fluorescein
3362 nmol/cm2/h to 2502 nmol/cm2/h; 1404
1), and larger rhodamine molecules (from 20 nmol/cm2/h;
3), and the intercellular
4) were unaffected by PPI. After
with healthy controls
03). In line with this, the flux of small
REE patients) and the larger
still was high in EoE patients after PPI.
REE patients and EoE patients at
ne flux, and E) intercellular space in
Transmission electron microscopy images of the basal prickle layer of esophageal mucosal biopsy
Intercellular spaces were not different between PPI-
REE patient 1), the
9), the transepithelial flux of small fluorescein
3362 nmol/cm2/h to 2502 nmol/cm2/h; 1404
l/cm2/h;
3), and the intercellular
4) were unaffected by PPI. After
03). In line with this, the flux of small
REE patients) and the larger
still was high in EoE patients after PPI.
REE patients and EoE patients at
ne flux, and E) intercellular space in
Transmission electron microscopy images of the basal prickle layer of esophageal mucosal biopsy
-REE and
REE patient 1), the
9), the transepithelial flux of small fluorescein
3362 nmol/cm2/h to 2502 nmol/cm2/h; 1404-
l/cm2/h;
3), and the intercellular
4) were unaffected by PPI. After
03). In line with this, the flux of small
REE patients) and the larger
still was high in EoE patients after PPI.
ne flux, and E) intercellular space in
Transmission electron microscopy images of the basal prickle layer of esophageal mucosal biopsy
REE and
REE patient 1), the
91
l/cm2/h;
3), and the intercellular
4) were unaffected by PPI. After
REE patients) and the larger
still was high in EoE patients after PPI.
ne flux, and E) intercellular space in
Transmission electron microscopy images of the basal prickle layer of esophageal mucosal biopsy
REE and
REE patient 1), the
91
4) were unaffected by PPI. After
ne flux, and E) intercellular space in

92
Histopathology
PPI reduced peak eosinophil counts in the distal esophagus, midesophagus, and proximal
esophagus in PPI-REE patients, whereas in EoE patients no effect of PPI on eosinophil counts
was observed (Supplementary Table 2). No differences were found in the baseline eosinophil
counts of the distal esophagus, midesophagus, and proximal esophagus between PPI-REE
and EoE patients (distal esophagus, P=0.1; midesophagus, P=0.4; proximal esophagus,
P=0.1). However, after PPI, eosinophil counts were significantly lower at all esophageal levels
in PPI-REE patients than in EoE patients (distal esophagus, P=0.001; midesophagus, P=0.002;
proximal esophagus, P<0.001).
In PPI-REE patients, the peak mast cell count in the distal esophagus also was decreased
after PPI, although significance was not reached (from 19.5 mast cells per high-power field
[mcs/hpf]; 10.0-36.5 mcs/hpf to 10.5 mcs/hpf; 4.0-20.8 mcs/hpf; P=0.07). Peak mast cell
counts were not affected by PPI in the midesophagus (from 8.5 mcs/hpf; 5.0-28.8 mcs/hpf to
6.5 mcs/hpf; 6.0-11.3 mcs/hpf; P=0.2) and proximal esophagus (from 9.5 mcs/hpf; 3.3-22.3
mcs/hpf to 8.0 mcs/hpf; 4.8-13.5 mcs/hpf; P=0.4) of PPI-REE patients. In EoE patients, PPIs
did not affect peak mast cell counts in the distal esophagus, midesophagus, and proximal
esophagus (distal from 32.5 mcs/hpf; 12.0-48.8 mcs/hpf to 23.0 mcs/hpf; 11.5-29.3 mcs/hpf,
P=0.3; midesophagus from 16.0 mcs/hpf; 4.5-24.3 mcs/hpf to 15.0 mcs/hpf; 2.5-44.5
mcs/hpf; P=0.7; proximal from 21.5 mcs/hpf; 14.3-36.3 mcs/hpf to 23.5 mcs/hpf; 7.8-32.5
mcs/hpf; P=0.6).
At baseline, eosinophilic microabscesses were present in 4 PPI-REE patients and in all EoE
patients (P=0.08). After PPI, eosinophilic microabscesses were not seen in PPI-REE patients,
whereas they were found in 6 EoE patients (P=0.007). In more EoE patients than PPI-REE
patients, moderate to severe basal hyperplasia was observed at baseline (8 vs 5; P=0.2) and
after PPI (6 vs 1; P=0.04). Basal hyperplasia was not altered significantly by PPI treatment in
either PPI-REE patients or EoE patients (P=0.1 and P=0.5, respectively). Spongiosis was
moderate to severe in more EoE patients than PPI-REE patients at baseline (7 vs 3; P=0.1)
and after PPI (7 vs 1; P=0.01). The degree of spongiosis remained unchanged in PPI-REE
patients (P=0.5) and EoE patients (P = 1.0) after PPI.
Cytokine expression
Analyses of the biopsy gene expression patterns (Supplementary Table 3) showed no
differences in baseline allergic cytokine expression between PPI-REE and EoE patients. In PPI-
REE patients, the median expression of IL5, CCL26, and POSTN decreased after PPI. PPI
treatment also caused an increase in the expression of FLG transcript. Esophageal expression
levels of IL13 and thymic stromal lymphopoietin were unaffected by PPI. In EoE patients, FLG
expression increased after PPI, whereas expression of inflammatory genes was not affected
by PPI. After PPI, PPI-REE patients expressed significantly lower levels of CCL26 and POSTN
than EoE patients.

Symptoms
In PPI
(P=0.
contrast, in EoE patients, PPI treatment did not reduce frequency (1.0; 0.0
P=0.
dysphagia frequency and severity scores were not significantly different between PPI
patients and EoE patients at baseline and after PPI.
Endoscopic signs
At baseline, pallor was seen in all EoE and PPI
PPI
EoE and 4 PPI
esophagus in 3 EoE and 2 PPI
none of these signs were significantly different between PPI
In PPI
2.5 (0.5
3.3
signs did not differ between PPI
PPI
furrows were found in more EoE (7 patients) than PPI
patients)
Figure 6.
Symptoms
In PPI
P=0.
contrast, in EoE patients, PPI treatment did not reduce frequency (1.0; 0.0
P=0.1) or severity of dysphagia (2.5; 0.0
dysphagia frequency and severity scores were not significantly different between PPI
patients and EoE patients at baseline and after PPI.
Endoscopic signs
At baseline, pallor was seen in all EoE and PPI
PPI-REE patients, linear furrows in 7 EoE and 6 PPI
EoE and 4 PPI
esophagus in 3 EoE and 2 PPI
none of these signs were significantly different between PPI
In PPI
2.5 (0.5
3.3-5.8 at baseline and 4.0; 3.0
signs did not differ between PPI
PPI-REE patients had significantly fewer endoscopic signs than EoE patients (
furrows were found in more EoE (7 patients) than PPI
patients)
Figure 6.
patients, although after PPI, more EoE than PPI
Symptoms
In PPI-REE patients, the freque
P=0.03) after PPI, and the severity decreased from 3.0 (1.0
contrast, in EoE patients, PPI treatment did not reduce frequency (1.0; 0.0
1) or severity of dysphagia (2.5; 0.0
dysphagia frequency and severity scores were not significantly different between PPI
patients and EoE patients at baseline and after PPI.
Endoscopic signs
At baseline, pallor was seen in all EoE and PPI
REE patients, linear furrows in 7 EoE and 6 PPI
EoE and 4 PPI
esophagus in 3 EoE and 2 PPI
none of these signs were significantly different between PPI
In PPI-REE patients, the number of endoscopic signs decrease
2.5 (0.5
5.8 at baseline and 4.0; 3.0
signs did not differ between PPI
REE patients had significantly fewer endoscopic signs than EoE patients (
furrows were found in more EoE (7 patients) than PPI
patients)
Figure 6.
patients, although after PPI, more EoE than PPI
Symptoms
REE patients, the freque
03) after PPI, and the severity decreased from 3.0 (1.0
contrast, in EoE patients, PPI treatment did not reduce frequency (1.0; 0.0
1) or severity of dysphagia (2.5; 0.0
dysphagia frequency and severity scores were not significantly different between PPI
patients and EoE patients at baseline and after PPI.
Endoscopic signs
At baseline, pallor was seen in all EoE and PPI
REE patients, linear furrows in 7 EoE and 6 PPI
EoE and 4 PPI
esophagus in 3 EoE and 2 PPI
none of these signs were significantly different between PPI
REE patients, the number of endoscopic signs decrease
2.5 (0.5-3.8) (
5.8 at baseline and 4.0; 3.0
signs did not differ between PPI
REE patients had significantly fewer endoscopic signs than EoE patients (
furrows were found in more EoE (7 patients) than PPI
patients) (F
Figure 6. Endoscopic pictures of PPI
patients, although after PPI, more EoE than PPI
Symptoms
REE patients, the freque
03) after PPI, and the severity decreased from 3.0 (1.0
contrast, in EoE patients, PPI treatment did not reduce frequency (1.0; 0.0
1) or severity of dysphagia (2.5; 0.0
dysphagia frequency and severity scores were not significantly different between PPI
patients and EoE patients at baseline and after PPI.
Endoscopic signs
At baseline, pallor was seen in all EoE and PPI
REE patients, linear furrows in 7 EoE and 6 PPI
EoE and 4 PPI
esophagus in 3 EoE and 2 PPI
none of these signs were significantly different between PPI
REE patients, the number of endoscopic signs decrease
3.8) (
5.8 at baseline and 4.0; 3.0
signs did not differ between PPI
REE patients had significantly fewer endoscopic signs than EoE patients (
furrows were found in more EoE (7 patients) than PPI
Figure 6).
Endoscopic pictures of PPI
patients, although after PPI, more EoE than PPI
REE patients, the freque
03) after PPI, and the severity decreased from 3.0 (1.0
contrast, in EoE patients, PPI treatment did not reduce frequency (1.0; 0.0
1) or severity of dysphagia (2.5; 0.0
dysphagia frequency and severity scores were not significantly different between PPI
patients and EoE patients at baseline and after PPI.
Endoscopic signs
At baseline, pallor was seen in all EoE and PPI
REE patients, linear furrows in 7 EoE and 6 PPI
EoE and 4 PPI-REE patients, white exudates in 5 EoE and 6 PPI
esophagus in 3 EoE and 2 PPI
none of these signs were significantly different between PPI
REE patients, the number of endoscopic signs decrease
3.8) (P=0.
5.8 at baseline and 4.0; 3.0
signs did not differ between PPI
REE patients had significantly fewer endoscopic signs than EoE patients (
furrows were found in more EoE (7 patients) than PPI
igure 6).
Endoscopic pictures of PPI
patients, although after PPI, more EoE than PPI
REE patients, the freque
03) after PPI, and the severity decreased from 3.0 (1.0
contrast, in EoE patients, PPI treatment did not reduce frequency (1.0; 0.0
1) or severity of dysphagia (2.5; 0.0
dysphagia frequency and severity scores were not significantly different between PPI
patients and EoE patients at baseline and after PPI.
Endoscopic signs
At baseline, pallor was seen in all EoE and PPI
REE patients, linear furrows in 7 EoE and 6 PPI
REE patients, white exudates in 5 EoE and 6 PPI
esophagus in 3 EoE and 2 PPI
none of these signs were significantly different between PPI
REE patients, the number of endoscopic signs decrease
P=0.02). In EoE patients, the number of endoscopic signs was not affected (5.0;
5.8 at baseline and 4.0; 3.0
signs did not differ between PPI
REE patients had significantly fewer endoscopic signs than EoE patients (
furrows were found in more EoE (7 patients) than PPI
igure 6).
Endoscopic pictures of PPI
patients, although after PPI, more EoE than PPI
REE patients, the freque
03) after PPI, and the severity decreased from 3.0 (1.0
contrast, in EoE patients, PPI treatment did not reduce frequency (1.0; 0.0
1) or severity of dysphagia (2.5; 0.0
dysphagia frequency and severity scores were not significantly different between PPI
patients and EoE patients at baseline and after PPI.
At baseline, pallor was seen in all EoE and PPI
REE patients, linear furrows in 7 EoE and 6 PPI
REE patients, white exudates in 5 EoE and 6 PPI
esophagus in 3 EoE and 2 PPI
none of these signs were significantly different between PPI
REE patients, the number of endoscopic signs decrease
02). In EoE patients, the number of endoscopic signs was not affected (5.0;
5.8 at baseline and 4.0; 3.0
signs did not differ between PPI
REE patients had significantly fewer endoscopic signs than EoE patients (
furrows were found in more EoE (7 patients) than PPI
Endoscopic pictures of PPI
patients, although after PPI, more EoE than PPI
REE patients, the freque
03) after PPI, and the severity decreased from 3.0 (1.0
contrast, in EoE patients, PPI treatment did not reduce frequency (1.0; 0.0
1) or severity of dysphagia (2.5; 0.0
dysphagia frequency and severity scores were not significantly different between PPI
patients and EoE patients at baseline and after PPI.
At baseline, pallor was seen in all EoE and PPI
REE patients, linear furrows in 7 EoE and 6 PPI
REE patients, white exudates in 5 EoE and 6 PPI
esophagus in 3 EoE and 2 PPI-
none of these signs were significantly different between PPI
REE patients, the number of endoscopic signs decrease
02). In EoE patients, the number of endoscopic signs was not affected (5.0;
5.8 at baseline and 4.0; 3.0
signs did not differ between PPI
REE patients had significantly fewer endoscopic signs than EoE patients (
furrows were found in more EoE (7 patients) than PPI
Endoscopic pictures of PPI
patients, although after PPI, more EoE than PPI
REE patients, the frequency of dysphagia decreased from 1.5 (1.0
03) after PPI, and the severity decreased from 3.0 (1.0
contrast, in EoE patients, PPI treatment did not reduce frequency (1.0; 0.0
1) or severity of dysphagia (2.5; 0.0
dysphagia frequency and severity scores were not significantly different between PPI
patients and EoE patients at baseline and after PPI.
At baseline, pallor was seen in all EoE and PPI
REE patients, linear furrows in 7 EoE and 6 PPI
REE patients, white exudates in 5 EoE and 6 PPI
-REE patients, and a solitary ring in 1 EoE patient. At baseline,
none of these signs were significantly different between PPI
REE patients, the number of endoscopic signs decrease
02). In EoE patients, the number of endoscopic signs was not affected (5.0;
5.8 at baseline and 4.0; 3.0-5.0 after PPI;
signs did not differ between PPI-
REE patients had significantly fewer endoscopic signs than EoE patients (
furrows were found in more EoE (7 patients) than PPI
Endoscopic pictures of PPI-REE and EoE patients. Endoscopy could not distinguish PPI
patients, although after PPI, more EoE than PPI
ncy of dysphagia decreased from 1.5 (1.0
03) after PPI, and the severity decreased from 3.0 (1.0
contrast, in EoE patients, PPI treatment did not reduce frequency (1.0; 0.0
1) or severity of dysphagia (2.5; 0.0
dysphagia frequency and severity scores were not significantly different between PPI
patients and EoE patients at baseline and after PPI.
At baseline, pallor was seen in all EoE and PPI
REE patients, linear furrows in 7 EoE and 6 PPI
REE patients, white exudates in 5 EoE and 6 PPI
REE patients, and a solitary ring in 1 EoE patient. At baseline,
none of these signs were significantly different between PPI
REE patients, the number of endoscopic signs decrease
02). In EoE patients, the number of endoscopic signs was not affected (5.0;
5.0 after PPI;
-REE patients and EoE patients (
REE patients had significantly fewer endoscopic signs than EoE patients (
furrows were found in more EoE (7 patients) than PPI
REE and EoE patients. Endoscopy could not distinguish PPI
patients, although after PPI, more EoE than PPI
ncy of dysphagia decreased from 1.5 (1.0
03) after PPI, and the severity decreased from 3.0 (1.0
contrast, in EoE patients, PPI treatment did not reduce frequency (1.0; 0.0
1) or severity of dysphagia (2.5; 0.0
dysphagia frequency and severity scores were not significantly different between PPI
patients and EoE patients at baseline and after PPI.
At baseline, pallor was seen in all EoE and PPI
REE patients, linear furrows in 7 EoE and 6 PPI
REE patients, white exudates in 5 EoE and 6 PPI
REE patients, and a solitary ring in 1 EoE patient. At baseline,
none of these signs were significantly different between PPI
REE patients, the number of endoscopic signs decrease
02). In EoE patients, the number of endoscopic signs was not affected (5.0;
5.0 after PPI;
REE patients and EoE patients (
REE patients had significantly fewer endoscopic signs than EoE patients (
furrows were found in more EoE (7 patients) than PPI
REE and EoE patients. Endoscopy could not distinguish PPI
patients, although after PPI, more EoE than PPI
pt#, patient number.
ncy of dysphagia decreased from 1.5 (1.0
03) after PPI, and the severity decreased from 3.0 (1.0
contrast, in EoE patients, PPI treatment did not reduce frequency (1.0; 0.0
1) or severity of dysphagia (2.5; 0.0-5.8 vs 0.0; 0.0
dysphagia frequency and severity scores were not significantly different between PPI
patients and EoE patients at baseline and after PPI.
At baseline, pallor was seen in all EoE and PPI
REE patients, linear furrows in 7 EoE and 6 PPI
REE patients, white exudates in 5 EoE and 6 PPI
REE patients, and a solitary ring in 1 EoE patient. At baseline,
none of these signs were significantly different between PPI
REE patients, the number of endoscopic signs decrease
02). In EoE patients, the number of endoscopic signs was not affected (5.0;
5.0 after PPI;
REE patients and EoE patients (
REE patients had significantly fewer endoscopic signs than EoE patients (
furrows were found in more EoE (7 patients) than PPI
REE and EoE patients. Endoscopy could not distinguish PPI
patients, although after PPI, more EoE than PPI
pt#, patient number.
ncy of dysphagia decreased from 1.5 (1.0
03) after PPI, and the severity decreased from 3.0 (1.0
contrast, in EoE patients, PPI treatment did not reduce frequency (1.0; 0.0
5.8 vs 0.0; 0.0
dysphagia frequency and severity scores were not significantly different between PPI
patients and EoE patients at baseline and after PPI.
At baseline, pallor was seen in all EoE and PPI-REE patients, esophageal rings in 7 EoE and 7
REE patients, linear furrows in 7 EoE and 6 PPI
REE patients, white exudates in 5 EoE and 6 PPI
REE patients, and a solitary ring in 1 EoE patient. At baseline,
none of these signs were significantly different between PPI
REE patients, the number of endoscopic signs decrease
02). In EoE patients, the number of endoscopic signs was not affected (5.0;
5.0 after PPI; P=0.
REE patients and EoE patients (
REE patients had significantly fewer endoscopic signs than EoE patients (
furrows were found in more EoE (7 patients) than PPI
REE and EoE patients. Endoscopy could not distinguish PPI
patients, although after PPI, more EoE than PPI-REE patients (7 vs 2) showed linear furrows
pt#, patient number.
ncy of dysphagia decreased from 1.5 (1.0
03) after PPI, and the severity decreased from 3.0 (1.0
contrast, in EoE patients, PPI treatment did not reduce frequency (1.0; 0.0
5.8 vs 0.0; 0.0
dysphagia frequency and severity scores were not significantly different between PPI
patients and EoE patients at baseline and after PPI.
REE patients, esophageal rings in 7 EoE and 7
REE patients, linear furrows in 7 EoE and 6 PPI
REE patients, white exudates in 5 EoE and 6 PPI
REE patients, and a solitary ring in 1 EoE patient. At baseline,
none of these signs were significantly different between PPI
REE patients, the number of endoscopic signs decrease
02). In EoE patients, the number of endoscopic signs was not affected (5.0;
P=0.
REE patients and EoE patients (
REE patients had significantly fewer endoscopic signs than EoE patients (
furrows were found in more EoE (7 patients) than PPI
REE and EoE patients. Endoscopy could not distinguish PPI
REE patients (7 vs 2) showed linear furrows
pt#, patient number.
ncy of dysphagia decreased from 1.5 (1.0
03) after PPI, and the severity decreased from 3.0 (1.0
contrast, in EoE patients, PPI treatment did not reduce frequency (1.0; 0.0
5.8 vs 0.0; 0.0
dysphagia frequency and severity scores were not significantly different between PPI
patients and EoE patients at baseline and after PPI.
REE patients, esophageal rings in 7 EoE and 7
REE patients, linear furrows in 7 EoE and 6 PPI-REE patients, crêpe
REE patients, white exudates in 5 EoE and 6 PPI
REE patients, and a solitary ring in 1 EoE patient. At baseline,
none of these signs were significantly different between PPI
REE patients, the number of endoscopic signs decrease
02). In EoE patients, the number of endoscopic signs was not affected (5.0;
P=0.2). At baseline, the number of endoscopic
REE patients and EoE patients (
REE patients had significantly fewer endoscopic signs than EoE patients (
furrows were found in more EoE (7 patients) than PPI
REE and EoE patients. Endoscopy could not distinguish PPI
REE patients (7 vs 2) showed linear furrows
pt#, patient number.
ncy of dysphagia decreased from 1.5 (1.0
03) after PPI, and the severity decreased from 3.0 (1.0
contrast, in EoE patients, PPI treatment did not reduce frequency (1.0; 0.0
5.8 vs 0.0; 0.0-
dysphagia frequency and severity scores were not significantly different between PPI
REE patients, esophageal rings in 7 EoE and 7
REE patients, crêpe
REE patients, white exudates in 5 EoE and 6 PPI
REE patients, and a solitary ring in 1 EoE patient. At baseline,
none of these signs were significantly different between PPI
REE patients, the number of endoscopic signs decrease
02). In EoE patients, the number of endoscopic signs was not affected (5.0;
2). At baseline, the number of endoscopic
REE patients and EoE patients (
REE patients had significantly fewer endoscopic signs than EoE patients (
furrows were found in more EoE (7 patients) than PPI-REE (2 patients) patients after PPI (2
REE and EoE patients. Endoscopy could not distinguish PPI
REE patients (7 vs 2) showed linear furrows
pt#, patient number.
ncy of dysphagia decreased from 1.5 (1.0
03) after PPI, and the severity decreased from 3.0 (1.0
contrast, in EoE patients, PPI treatment did not reduce frequency (1.0; 0.0
-3.5;
dysphagia frequency and severity scores were not significantly different between PPI
REE patients, esophageal rings in 7 EoE and 7
REE patients, crêpe
REE patients, white exudates in 5 EoE and 6 PPI
REE patients, and a solitary ring in 1 EoE patient. At baseline,
none of these signs were significantly different between PPI
REE patients, the number of endoscopic signs decrease
02). In EoE patients, the number of endoscopic signs was not affected (5.0;
2). At baseline, the number of endoscopic
REE patients and EoE patients (
REE patients had significantly fewer endoscopic signs than EoE patients (
REE (2 patients) patients after PPI (2
REE and EoE patients. Endoscopy could not distinguish PPI
REE patients (7 vs 2) showed linear furrows
pt#, patient number.
ncy of dysphagia decreased from 1.5 (1.0
03) after PPI, and the severity decreased from 3.0 (1.0-6.5) to 0.0 (0.0
contrast, in EoE patients, PPI treatment did not reduce frequency (1.0; 0.0
3.5; P=0.
dysphagia frequency and severity scores were not significantly different between PPI
REE patients, esophageal rings in 7 EoE and 7
REE patients, crêpe
REE patients, white exudates in 5 EoE and 6 PPI
REE patients, and a solitary ring in 1 EoE patient. At baseline,
none of these signs were significantly different between PPI-
REE patients, the number of endoscopic signs decrease
02). In EoE patients, the number of endoscopic signs was not affected (5.0;
2). At baseline, the number of endoscopic
REE patients and EoE patients (
REE patients had significantly fewer endoscopic signs than EoE patients (
REE (2 patients) patients after PPI (2
REE and EoE patients. Endoscopy could not distinguish PPI
REE patients (7 vs 2) showed linear furrows
ncy of dysphagia decreased from 1.5 (1.0
6.5) to 0.0 (0.0
contrast, in EoE patients, PPI treatment did not reduce frequency (1.0; 0.0
P=0.
dysphagia frequency and severity scores were not significantly different between PPI
REE patients, esophageal rings in 7 EoE and 7
REE patients, crêpe
REE patients, white exudates in 5 EoE and 6 PPI-REE patien
REE patients, and a solitary ring in 1 EoE patient. At baseline,
-REE and EoE patients.
REE patients, the number of endoscopic signs decreased after PPI from 4.0 (3.3
02). In EoE patients, the number of endoscopic signs was not affected (5.0;
2). At baseline, the number of endoscopic
REE patients and EoE patients (
REE patients had significantly fewer endoscopic signs than EoE patients (
REE (2 patients) patients after PPI (2
REE and EoE patients. Endoscopy could not distinguish PPI
REE patients (7 vs 2) showed linear furrows
ncy of dysphagia decreased from 1.5 (1.0
6.5) to 0.0 (0.0
contrast, in EoE patients, PPI treatment did not reduce frequency (1.0; 0.0
P=0.2). Despite this difference,
dysphagia frequency and severity scores were not significantly different between PPI
REE patients, esophageal rings in 7 EoE and 7
REE patients, crêpe
REE patien
REE patients, and a solitary ring in 1 EoE patient. At baseline,
REE and EoE patients.
d after PPI from 4.0 (3.3
02). In EoE patients, the number of endoscopic signs was not affected (5.0;
2). At baseline, the number of endoscopic
REE patients and EoE patients (P=0.
REE patients had significantly fewer endoscopic signs than EoE patients (
REE (2 patients) patients after PPI (2
REE and EoE patients. Endoscopy could not distinguish PPI
REE patients (7 vs 2) showed linear furrows
ncy of dysphagia decreased from 1.5 (1.0
6.5) to 0.0 (0.0
contrast, in EoE patients, PPI treatment did not reduce frequency (1.0; 0.0
2). Despite this difference,
dysphagia frequency and severity scores were not significantly different between PPI
REE patients, esophageal rings in 7 EoE and 7
REE patients, crêpe
REE patien
REE patients, and a solitary ring in 1 EoE patient. At baseline,
REE and EoE patients.
d after PPI from 4.0 (3.3
02). In EoE patients, the number of endoscopic signs was not affected (5.0;
2). At baseline, the number of endoscopic
P=0.3), however, after PPI,
REE patients had significantly fewer endoscopic signs than EoE patients (
REE (2 patients) patients after PPI (2
REE and EoE patients. Endoscopy could not distinguish PPI
REE patients (7 vs 2) showed linear furrows
ncy of dysphagia decreased from 1.5 (1.0
6.5) to 0.0 (0.0
contrast, in EoE patients, PPI treatment did not reduce frequency (1.0; 0.0
2). Despite this difference,
dysphagia frequency and severity scores were not significantly different between PPI
REE patients, esophageal rings in 7 EoE and 7
REE patients, crêpe-paper mucosa in 7
REE patien
REE patients, and a solitary ring in 1 EoE patient. At baseline,
REE and EoE patients.
d after PPI from 4.0 (3.3
02). In EoE patients, the number of endoscopic signs was not affected (5.0;
2). At baseline, the number of endoscopic
3), however, after PPI,
REE patients had significantly fewer endoscopic signs than EoE patients (
REE (2 patients) patients after PPI (2
REE and EoE patients. Endoscopy could not distinguish PPI
REE patients (7 vs 2) showed linear furrows
ncy of dysphagia decreased from 1.5 (1.0-8.5) to 0.0 (0.0
6.5) to 0.0 (0.0
contrast, in EoE patients, PPI treatment did not reduce frequency (1.0; 0.0
2). Despite this difference,
dysphagia frequency and severity scores were not significantly different between PPI
REE patients, esophageal rings in 7 EoE and 7
paper mucosa in 7
REE patients, narrow
REE patients, and a solitary ring in 1 EoE patient. At baseline,
REE and EoE patients.
d after PPI from 4.0 (3.3
02). In EoE patients, the number of endoscopic signs was not affected (5.0;
2). At baseline, the number of endoscopic
3), however, after PPI,
REE patients had significantly fewer endoscopic signs than EoE patients (
REE (2 patients) patients after PPI (2
REE and EoE patients. Endoscopy could not distinguish PPI
REE patients (7 vs 2) showed linear furrows
8.5) to 0.0 (0.0
6.5) to 0.0 (0.0-1.8) (
contrast, in EoE patients, PPI treatment did not reduce frequency (1.0; 0.0-8.5 vs 0.0; 0.0
2). Despite this difference,
dysphagia frequency and severity scores were not significantly different between PPI
REE patients, esophageal rings in 7 EoE and 7
paper mucosa in 7
ts, narrow
REE patients, and a solitary ring in 1 EoE patient. At baseline,
REE and EoE patients.
d after PPI from 4.0 (3.3
02). In EoE patients, the number of endoscopic signs was not affected (5.0;
2). At baseline, the number of endoscopic
3), however, after PPI,
REE patients had significantly fewer endoscopic signs than EoE patients (P=0.
REE (2 patients) patients after PPI (2
REE and EoE patients. Endoscopy could not distinguish PPI
REE patients (7 vs 2) showed linear furrows
8.5) to 0.0 (0.0
1.8) (
8.5 vs 0.0; 0.0
2). Despite this difference,
dysphagia frequency and severity scores were not significantly different between PPI
REE patients, esophageal rings in 7 EoE and 7
paper mucosa in 7
ts, narrow
REE patients, and a solitary ring in 1 EoE patient. At baseline,
REE and EoE patients.
d after PPI from 4.0 (3.3
02). In EoE patients, the number of endoscopic signs was not affected (5.0;
2). At baseline, the number of endoscopic
3), however, after PPI,
P=0.
REE (2 patients) patients after PPI (2
REE and EoE patients. Endoscopy could not distinguish PPI
REE patients (7 vs 2) showed linear furrows
8.5) to 0.0 (0.0
1.8) (P=0.
8.5 vs 0.0; 0.0
2). Despite this difference,
dysphagia frequency and severity scores were not significantly different between PPI
REE patients, esophageal rings in 7 EoE and 7
paper mucosa in 7
ts, narrow
REE patients, and a solitary ring in 1 EoE patient. At baseline,
REE and EoE patients.
d after PPI from 4.0 (3.3
02). In EoE patients, the number of endoscopic signs was not affected (5.0;
2). At baseline, the number of endoscopic
3), however, after PPI,
P=0.04). Linear
REE (2 patients) patients after PPI (2
REE and EoE patients. Endoscopy could not distinguish PPI-REE from EoE
REE patients (7 vs 2) showed linear furrows (P<0
8.5) to 0.0 (0.0
P=0.
8.5 vs 0.0; 0.0
2). Despite this difference,
dysphagia frequency and severity scores were not significantly different between PPI
REE patients, esophageal rings in 7 EoE and 7
paper mucosa in 7
ts, narrow-caliber
REE patients, and a solitary ring in 1 EoE patient. At baseline,
REE and EoE patients.
d after PPI from 4.0 (3.3
02). In EoE patients, the number of endoscopic signs was not affected (5.0;
2). At baseline, the number of endoscopic
3), however, after PPI,
04). Linear
REE (2 patients) patients after PPI (2
REE from EoE
(P<0.04).
8.5) to 0.0 (0.0-
P=0.03). In
8.5 vs 0.0; 0.0
2). Despite this difference,
dysphagia frequency and severity scores were not significantly different between PPI-REE
REE patients, esophageal rings in 7 EoE and 7
paper mucosa in 7
caliber
REE patients, and a solitary ring in 1 EoE patient. At baseline,
d after PPI from 4.0 (3.3-4.8) to
02). In EoE patients, the number of endoscopic signs was not affected (5.0;
2). At baseline, the number of endoscopic
3), however, after PPI,
04). Linear
REE (2 patients) patients after PPI (2
REE from EoE
.04).
-1.0)
03). In
8.5 vs 0.0; 0.0-2.0;
2). Despite this difference,
REE
REE patients, esophageal rings in 7 EoE and 7
paper mucosa in 7
caliber
REE patients, and a solitary ring in 1 EoE patient. At baseline,
4.8) to
02). In EoE patients, the number of endoscopic signs was not affected (5.0;
2). At baseline, the number of endoscopic
3), however, after PPI,
04). Linear
REE (2 patients) patients after PPI (2
REE from EoE
.04).
93
1.0)
03). In
2.0;
2). Despite this difference,
REE patients, esophageal rings in 7 EoE and 7
caliber
REE patients, and a solitary ring in 1 EoE patient. At baseline,
4.8) to
02). In EoE patients, the number of endoscopic signs was not affected (5.0;
2). At baseline, the number of endoscopic
3), however, after PPI,
04). Linear
REE (2 patients) patients after PPI (2
REE from EoE
93
2.0;
4.8) to
02). In EoE patients, the number of endoscopic signs was not affected (5.0;

94
Histologic response to treatment correlates with esophageal integrity
Peak eosinophil counts after PPI therapy correlated with the extracellular impedance
(r=-0.54; P=0.03), the TER (r=-0.68; P=0.004) the flux of fluorescein molecules (r=0.79;
P<0.001), and the flux of rhodamine molecules (r=0.736; P=0.001). Accordingly, peak mast
cell counts after PPI therapy correlated with the extracellular impedance (r=-0.82; P<0.001),
the flux of fluorescein molecules (r=0.61; P=0.01), and the flux of rhodamine molecules
(r=0.62; P=0.01). In vivo and in vitro esophageal mucosal integrity measurements thus were
correlated moderately to strongly with esophageal inflammation. Furthermore, the
expression of FLG correlated with the TER (r=0.78; P<0.001), the flux of fluorescein
molecules (r=-0.75; P<0.001), and rhodamine molecules (r=-0.58; P=0.02).
Discussion
This study investigated the esophageal mucosal integrity in patients with PPI-REE and EoE.
By using structural and functional measurements we found that the esophageal mucosal
integrity was impaired, to a similar extent, in patients with PPI-REE and EoE. Furthermore,
acid suppression with PPIs partially restored mucosal integrity parameters and decreased
inflammation in patients with PPI-REE, but not in patients with EoE.
In this study, we showed passage of molecules that were 40,000 daltons through the mucosa
in EoE and PPI-REE patients. This size is similar to the size of most plant and animal food
allergens to which EoE patients are sensitized.14,15
Our observations suggest that increased
permeability of the esophageal mucosa could play an important role in the presentation of
allergens to the immune system in EoE and PPI-REE.
Of importance for this study is the distinction between EoE and PPI-REE. Current guideline
recommendations state that the diagnosis of EoE should be reserved for patients with
symptoms related to esophageal dysfunction, with esophageal eosinophilia, who have an
inadequate response to PPIs.5 Patients with suspected EoE who do respond to PPIs are
diagnosed with PPI-REE, a condition that is considered distinct from EoE.4 In concordance
with EoE guidelines, a threshold of 15 eos/hpf after PPI is used to distinguish both entities.4,5
In our study, we set the threshold at 10 eos/hpf after PPI, although no patients were in the
range of 10 to 15 eos/hpf.
It is unknown why PPI-REE patients do and EoE patients do not respond to PPI.6 We found
that allergic inflammatory cytokines were expressed to the same extent in EoE and PPI-REE
patients, suggesting that these entities reflect one and the same disease. Symptoms,
endoscopic signs, peak eosinophil counts, and mast cell counts were not different between
EoE and PPI-REE patients, and the esophageal mucosal integrity was impaired to a similar
extent. It has been suggested that patients with PPI-REE have a less severe variant of EoE. In
support of this, more EoE patients than PPI-REE patients had eosinophilic microabscesses,
severe basal hyperplasia, and severe spongiosis at baseline in our study. However, as stated,
no differences were found in clinical characteristics. The different response to PPI between
EoE and PPI-REE patients thus might be explained by other factors than disease severity.

95
Recently, it also has been suggested that gastroesophageal reflux contributes to PPI-REE by
causing esophageal integrity changes and that this is why PPI-REE patients respond to PPI.6
Indeed, in our study, we showed that in PPI-REE patients the esophageal mucosal integrity
was impaired and that the integrity partially was restored with PPI. The restored integrity
may provide an effective barrier against the permeation of allergens and subsequently may
block allergen exposure to antigen-presenting cells, thereby prohibiting immune activation.
The observed effect of acid suppression with high-dose PPIs on the mucosal integrity in PPI-
REE patients supports the hypothesis that acid reflux contributes to the impaired epithelial
barrier function in PPI-REE. Alternatively, it also is possible that restoration of the mucosal
integrity is the result of a direct anti-inflammatory effect of PPIs on the esophageal
epithelium. Unfortunately, pretreatment predictive factors for PPI response have not been
identified yet, either in in vitro studies or in pH-monitoring studies.
An alternative cause of impaired mucosal integrity could be that the intrinsic inflammatory
cytokines and cytotoxic eosinophil and mast cell secretory products that are present in the
esophagus of EoE and PPI-REE patients impair the mucosal integrity, similar to mechanisms
in asthma and atopic dermatitis.16,17
The loss of desmoglein-1, an intercellular adhesion
molecule that is altered in various skin disorders, may potentiate this allergic inflammation
through the induction of proinflammatory mediators such as POSTN.18
The observation that
EoE patients did not respond to a PPI suggests that gastroesophageal reflux does not play a
role in EoE patients, and favors this second explanation for the impaired mucosal integrity in
EoE. Furthermore, the strongly decreased expression of FLG, previously described in EoE,
increased after PPI in PPI-REE but not in EoE patients.19
The finding that FLG expression also
correlated inversely with the permeability to allergen-sized molecules suggests that down-
regulation of FLG also may contribute to the observed epithelial barrier dysfunction.
In conclusion, the esophageal mucosal integrity is severely impaired in patients with PPI-REE
and in patients with EoE. This finding could be of pathophysiological importance because
increased permeability may facilitate transepithelial food allergen flux. Furthermore, the
finding that histologic response correlates with improved esophageal barrier integrity
suggests that barrier integrity is a potential therapeutic target. The observation that PPI
partially improves the esophageal mucosal integrity in PPI-REE patients but not in EoE
patients may indicate a role for acid reflux in PPI-REE but not in EoE.
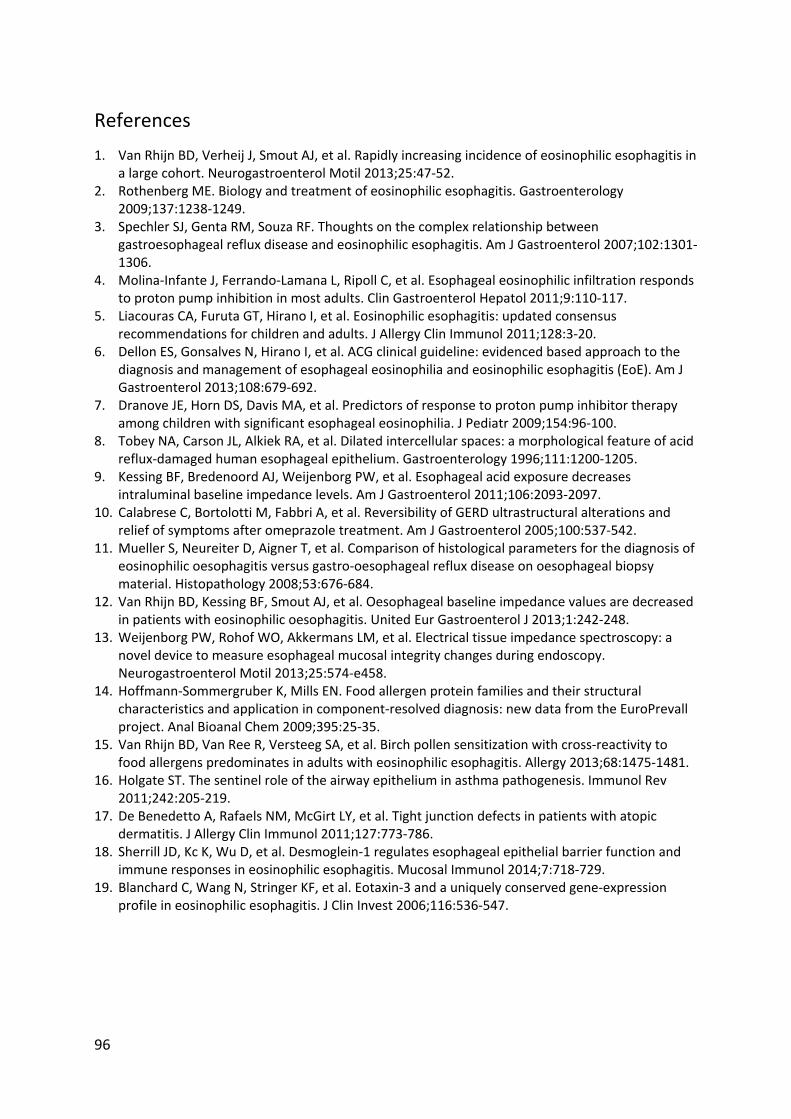
96
References
1. Van Rhijn BD, Verheij J, Smout AJ, et al. Rapidly increasing incidence of eosinophilic esophagitis in
a large cohort. Neurogastroenterol Motil 2013;25:47-52.
2. Rothenberg ME. Biology and treatment of eosinophilic esophagitis. Gastroenterology
2009;137:1238-1249.
3. Spechler SJ, Genta RM, Souza RF. Thoughts on the complex relationship between
gastroesophageal reflux disease and eosinophilic esophagitis. Am J Gastroenterol 2007;102:1301-
1306.
4. Molina-Infante J, Ferrando-Lamana L, Ripoll C, et al. Esophageal eosinophilic infiltration responds
to proton pump inhibition in most adults. Clin Gastroenterol Hepatol 2011;9:110-117.
5. Liacouras CA, Furuta GT, Hirano I, et al. Eosinophilic esophagitis: updated consensus
recommendations for children and adults. J Allergy Clin Immunol 2011;128:3-20.
6. Dellon ES, Gonsalves N, Hirano I, et al. ACG clinical guideline: evidenced based approach to the
diagnosis and management of esophageal eosinophilia and eosinophilic esophagitis (EoE). Am J
Gastroenterol 2013;108:679-692.
7. Dranove JE, Horn DS, Davis MA, et al. Predictors of response to proton pump inhibitor therapy
among children with significant esophageal eosinophilia. J Pediatr 2009;154:96-100.
8. Tobey NA, Carson JL, Alkiek RA, et al. Dilated intercellular spaces: a morphological feature of acid
reflux-damaged human esophageal epithelium. Gastroenterology 1996;111:1200-1205.
9. Kessing BF, Bredenoord AJ, Weijenborg PW, et al. Esophageal acid exposure decreases
intraluminal baseline impedance levels. Am J Gastroenterol 2011;106:2093-2097.
10. Calabrese C, Bortolotti M, Fabbri A, et al. Reversibility of GERD ultrastructural alterations and
relief of symptoms after omeprazole treatment. Am J Gastroenterol 2005;100:537-542.
11. Mueller S, Neureiter D, Aigner T, et al. Comparison of histological parameters for the diagnosis of
eosinophilic oesophagitis versus gastro-oesophageal reflux disease on oesophageal biopsy
material. Histopathology 2008;53:676-684.
12. Van Rhijn BD, Kessing BF, Smout AJ, et al. Oesophageal baseline impedance values are decreased
in patients with eosinophilic oesophagitis. United Eur Gastroenterol J 2013;1:242-248.
13. Weijenborg PW, Rohof WO, Akkermans LM, et al. Electrical tissue impedance spectroscopy: a
novel device to measure esophageal mucosal integrity changes during endoscopy.
Neurogastroenterol Motil 2013;25:574-e458.
14. Hoffmann-Sommergruber K, Mills EN. Food allergen protein families and their structural
characteristics and application in component-resolved diagnosis: new data from the EuroPrevall
project. Anal Bioanal Chem 2009;395:25-35.
15. Van Rhijn BD, Van Ree R, Versteeg SA, et al. Birch pollen sensitization with cross-reactivity to
food allergens predominates in adults with eosinophilic esophagitis. Allergy 2013;68:1475-1481.
16. Holgate ST. The sentinel role of the airway epithelium in asthma pathogenesis. Immunol Rev
2011;242:205-219.
17. De Benedetto A, Rafaels NM, McGirt LY, et al. Tight junction defects in patients with atopic
dermatitis. J Allergy Clin Immunol 2011;127:773-786.
18. Sherrill JD, Kc K, Wu D, et al. Desmoglein-1 regulates esophageal epithelial barrier function and
immune responses in eosinophilic esophagitis. Mucosal Immunol 2014;7:718-729.
19. Blanchard C, Wang N, Stringer KF, et al. Eotaxin-3 and a uniquely conserved gene-expression
profile in eosinophilic esophagitis. J Clin Invest 2006;116:536-547.

97
Supplementary Table 1. Gene function and gene-specific primers for RTPCR
Gene Primer Sequence Protein
encoded Protein role in EoE
2
IL5
forward 5´-cgaactctgctgatagccaa-3’
IL-5
Attracts eosinophils
reverse 5´-cagtacccccttgcacagtt-3’ Regulates response of eosinophils
to eotaxin-3
IL13
forward 5’-ggtcaacatcacccagaacc-3’
IL-13
Induces eotaxin-3 production by
epithelial cells
reverse 5’-gattccagggctgcacagta-3’ Downregulates filaggrin expression
Upregulates periostin expression
CCL26 forward 5’-aactccgaaacaattgtactcagctg-3’
Eotaxin-3 Attracts and activates eosinophils reverse 5’-gtaactctgggaggaaacaccctctcc-3’
POSTN forward 5’-ttcaacagattttgggcacc-3’
Periostin
Involved in eosinophil
accumulation and cell adhesion
reverse 5’-cagcctttcattccttccat-3’ Induced in remodeling
FLG forward 5’-accatcttggatctgcttgg-3’
Filaggrin Important for epithelial barrier
function reverse 5’-ctgtgtgacgagtgcctgat-3’
TSLP forward 5’-tcgccatgaaaactaaggct-3’
TSLP Induces TH2-inflammation and
allergic diseases reverse 5’-tctcctcttcttcattgcctg-3’
HKG Primer sequence
Cyclophilin forward 5’-gccgaggaaaaccgtgtact-3’
reverse 5’-acttcttggtatccaggccc-3’
GAPDH forward 5’-gagtcaacggatttggtcgt-3’
reverse 5’-ttgattttggagggatctcg-3’
β-actin forward 5′-gtcagaaggattcctatgtgg-3’
reverse 5′-gctcattgccaatggtgatg-3’
HKG: housekeeping gene; RTPCR: real-time polymerase chain reaction; TSLP: thymic stromal lymphopoietin.
Supplementary Table 2. Eosinophil counts in PPI-REE patients and EoE patients
Patient group Localization
Peak eosinophil count, eos/hpf
p-value Baseline After PPI
PPI-REE, median (IQR) Proximal 17.5 (0.5-71.3) 1.0 (0.3-3.0) 0.03
Mid 31.0 (1.0-80.0) 1.0 (0.0-1.8) 0.03
Distal 30.0 (3.0-68.8) 1.0 (0.0-1.8) 0.04
EoE, median (IQR) Proximal 47.5 (25.8-107.5) 36.0 (6.8-57.5) 0.2
Mid 60.0 (42.5-70.0) 52.5 (35.8-68.8) 0.4
Distal 55.0 (41.3-92.5) 52.5 (23.3-83.8) 0.4

98
Supplementary Table 3. Gene expression at baseline and after PPI in PPI-REE patients and
EoE patients
Patient group Gene Baseline After PPI p-value
PPI-REE,
median (IQR)
IL5 1.0*10-2
(6.6*10-3
-1.4*10-2
) 6.4*10-3
(0.0*100-1.5*10
-2) 0.03
IL13 2.5*10-3
(1.2*10-3
-3.8*10-3
) 6.3*10-4
(0.0*100-3.4*10
-3) 0.07
CCL26 1.0*102 (5.5*10
1-1.8*10
2) 1.2*10
2 (2.8*10
1-1.8*10
2) 0.03
POSTN 3.8*10-1
(2.8*10-1
-2.3*100) 4.8*10
-1 (8.6*10
-2-1.1*10
0) 0.04
FLG 1.1*10-2
(4.8*10-3
-3.8*10-2
) 1.1*10-1
(2.7*10-2
-1.9*10-1
) 0.04
TSLP 6.1*10-2
(4.9*10-2
-1.3*10-1
) 6.8*10-2
(3.3*10-2
-8.3*10-2
) 0.4
EoE,
median (IQR)
IL5 5.3*10-3
(6.4*10-4
-2.1*10-2
) 0.0*100 (0.0*10
0-8.9*10
-4) 0.5
IL13 3.7*10-4
(0.0*100-2.1*10
-3) 0.0*10
0 (0.0*10
0-7.7*10
-4) 0.2
CCL26 1.2*102 (1.0*10
1-2.9*10
2) 1.0*10
1 (5.4*10
0-2.2*10
1) 1.0
POSTN 2.8*10-1
(2.3*10-2
-1.2*100) 6.2*10
-2 (7.5*10
-3-1.4*10
-1) 0.3
FLG 2.1*10-2
(1.6*10-2
-3.0*10-1
) 4.6*10-1
(1.1*10-1
-9.3*10-1
) 0.02
TSLP 6.4*10-2
(4.2*10-2
-8.3*10-2
) 9.0*10-2
(3.6*10-2
-1.2*10-1
) 0.8
Baseline cytokine expression levels were not significantly different between PPI-REE and EoE patients. After
PPI, PPI-REE patients had significantly lower levels of CCL26 (p=0.01) and POSTN (p=0.03).