UV-VIS Spectroscopy and Fluorescence …accurately analyze light in both the visible and ultraviolet...
12
UV-VIS Spectroscopy and Fluorescence Spectroscopy (Part 1 of 2) ------- 02 Applications: Spectrofluorophotometers Used in a Variety of Fields ------- 06 Q&A: Is there a way to avoid detecting scattered light and higher-order light in an emission spectrum? ------- 10 Vol. 17 TALK LETTER C101-E145
Transcript of UV-VIS Spectroscopy and Fluorescence …accurately analyze light in both the visible and ultraviolet...
UV-VIS Spectroscopy and Fluorescence Spectroscopy (Part 1 of 2) ------- 02
Applications: Spectrofluorophotometers Used in a Variety of Fields ------- 06
Q&A: Is there a way to avoid detecting scattered light and higher-order light in an emission spectrum? ------- 10
Vol. 17
TALK LETTER
C101-E145
2
UV Talk Letter
1. IntroductionAll the various things we see with our eyes either generate or absorb light. The range of light detectable to the human eye is called visible light. Using our eyes as detectors, we routinely perform quantitative and qualitative analyses based on the colors we observe in our daily lives. Similarly, UV-VIS spectroscopy and fluorescence spectroscopy are used to accurately analyze light in both the visible and ultraviolet light ranges. Both photometric methods measure the same wavelength range, but they differ in the type of samples they
UV-VIS Spectroscopy and Fluorescence Spectroscopy (Part 1 of 2)
Fig. 1 Examples of Common Light Emission
can measure and their detection sensitivity, due to differences in instrument design. In this two-part series, we will describe both UV-VIS and fluorescence spectroscopy by comparing their characteristics, such as their operating principle, system composition, and advantages and disadvantages. In this first part, we will discuss the relationship between light absorption and fluorescence, the principle of fluorescence, and advantages of measuring fluorescence over absorption.
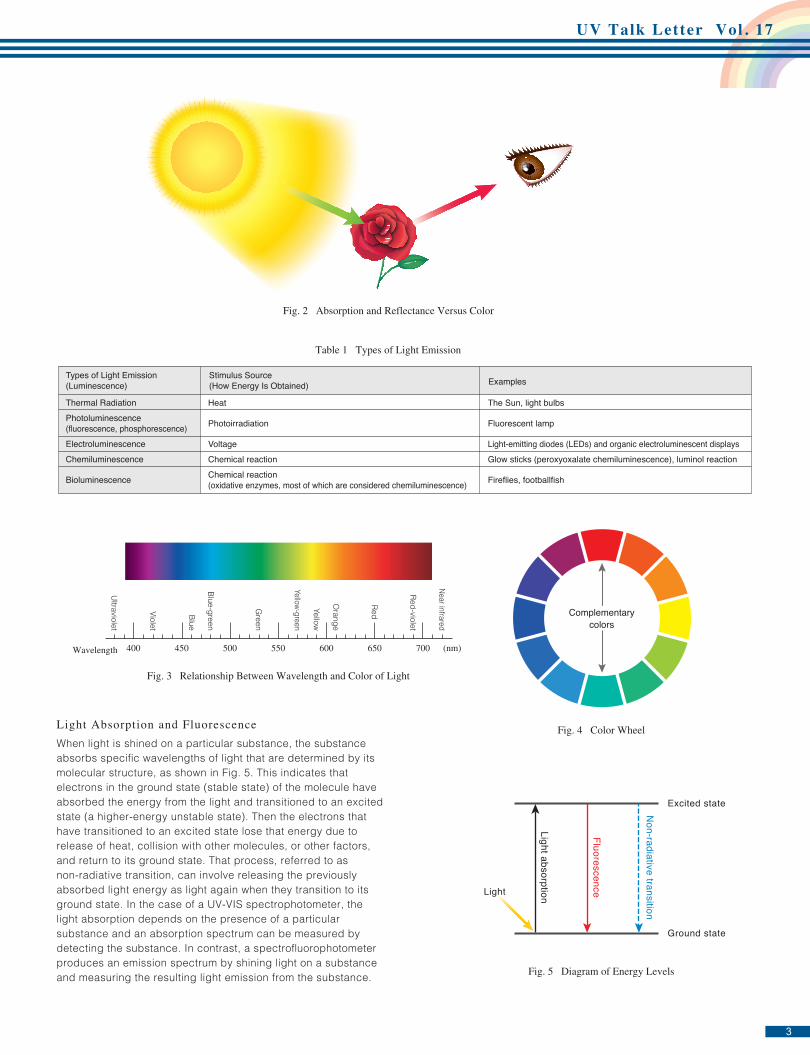
2. Light Absorption and FluorescenceLight Emission and Absorption Versus ColorThings we can see are either things that emit light, such as the Sun, fluorescent lamps, and light-emitting diodes (LEDs), as illustrated in Fig. 1, or things that absorb or reflect a certain portion of the light, giving them the appearance of having a particular color, as illustrated in Fig. 2.There are a variety of mechanisms for emitting light. For example, the Sun emits light due to heat, whereas fluorescent lamps emit visible light when a fluorescent coating inside the lamp is exposed to UV rays. An LED emits light when electricity is applied. Each involves a different method of obtaining energy (stimulus source), which determines the type of emitted light. Table 1 lists some examples of different types of emitted light.Some light emitting items emit a particular color, such as blue LEDs and glow sticks. The color we perceive from emitted light depends on the wavelength of light emitted from the emission light source. For example, a blue LED emits light near 450 nm, which corresponds to the blue color in Fig. 3. A spectrofluorophotometer is designed to measure the
photoluminescence generated from irradiating a sample with light, but some models can also measure other types of luminescence, such as electroluminescence or chemiluminescence.The color we perceive from the absorption, transmission, and reflection of light is related by the color wheel and complementary colors shown in Fig. 4. Objects that appear red absorb light with a wavelength corresponding to the complementary color green, which is shown on the opposite side of the color wheel as red in Fig. 4, so that only light with the wavelength for red is reflected or transmitted through the object and recognized by our eyes as being red. When a red substance is measured using a UV-VIS spectrophotometer, an absorption peak appears near 530 nm, which corresponds to the wavelength for green in Fig. 3. The colors that can be discriminated in emitted light depends on the wavelengths emitted from the light source, but absorption, transmission, and reflection require considering complementary colors.
Sun Fluorescent lamp LED
3
UV Talk Letter Vol . 17
Light Absorption and FluorescenceWhen light is shined on a particular substance, the substance absorbs specific wavelengths of light that are determined by its molecular structure, as shown in Fig. 5. This indicates that electrons in the ground state (stable state) of the molecule have absorbed the energy from the light and transitioned to an excited state (a higher-energy unstable state). Then the electrons that have transitioned to an excited state lose that energy due to release of heat, collision with other molecules, or other factors, and return to its ground state. That process, referred to as non-radiative transition, can involve releasing the previously absorbed light energy as light again when they transition to its ground state. In the case of a UV-VIS spectrophotometer, the light absorption depends on the presence of a particular substance and an absorption spectrum can be measured by detecting the substance. In contrast, a spectrofluorophotometer produces an emission spectrum by shining light on a substance and measuring the resulting light emission from the substance.
Fig. 2 Absorption and Reflectance Versus Color
Table 1 Types of Light Emission
Types of Light Emission(Luminescence)
Thermal RadiationPhotoluminescence (fluorescence, phosphorescence)ElectroluminescenceChemiluminescence
Bioluminescence
Stimulus Source(How Energy Is Obtained)
Heat
Photoirradiation
VoltageChemical reactionChemical reaction (oxidative enzymes, most of which are considered chemiluminescence)
Examples
The Sun, light bulbs
Fluorescent lamp
Light-emitting diodes (LEDs) and organic electroluminescent displaysGlow sticks (peroxyoxalate chemiluminescence), luminol reaction
Fireflies, footballfish
Ultraviolet
Violet
Blue
Blue-green
Green
Yellow-green
Yellow
Orange
Red
Red-violet
Near infrared
Wavelength 400 450 500 550 600 650 700 (nm)
Fig. 3 Relationship Between Wavelength and Color of Light
Complementarycolors
Fig. 4 Color Wheel
Light absorption
Fluorescence
Non-radiative transition
Excited state
Ground state
Light
Fig. 5 Diagram of Energy Levels
4
UV-VIS Spectroscopy and Fluorescence Spectroscopy (Part 1 of 2)
(1) Light absorption (excitation)
(3) Fluorescence
(2) Non-radiative transitionV1 = 4
V1 = 3
V1 = 2
V1 = 1
V1 = 0
V0 = 4
V0 = 3
V0 = 2
V0 = 1
V0 = 0
Electron excited state S1
Electron ground state S0
Distance between atoms
Ener
gy
Fig. 6 Absorption, Fluorescence, and Energy Level
Wavelength (nm)
Fluo
resc
ence
inte
nsity
0 – 0
0 4
0 3
0 2
0 1 1 0
2 0
3 0
Excitationspectrum
Emissionspectrum
280.00.0
10000.0
20000.0
30000.0
40000.0
300.0 350.0 400.0 450.0 480.0
Fig. 7 Excitation and Emission Spectra of Anthracene in Cyclohexane
Fig. 8 Absorption Spectrum of Anthracene in Cyclohexane Measured Using a UV-VIS Spectrophotometer
Abs
Wavelength (nm)
0.000280.00 300.00 350.00 400.00
0.200
0.400
0.600
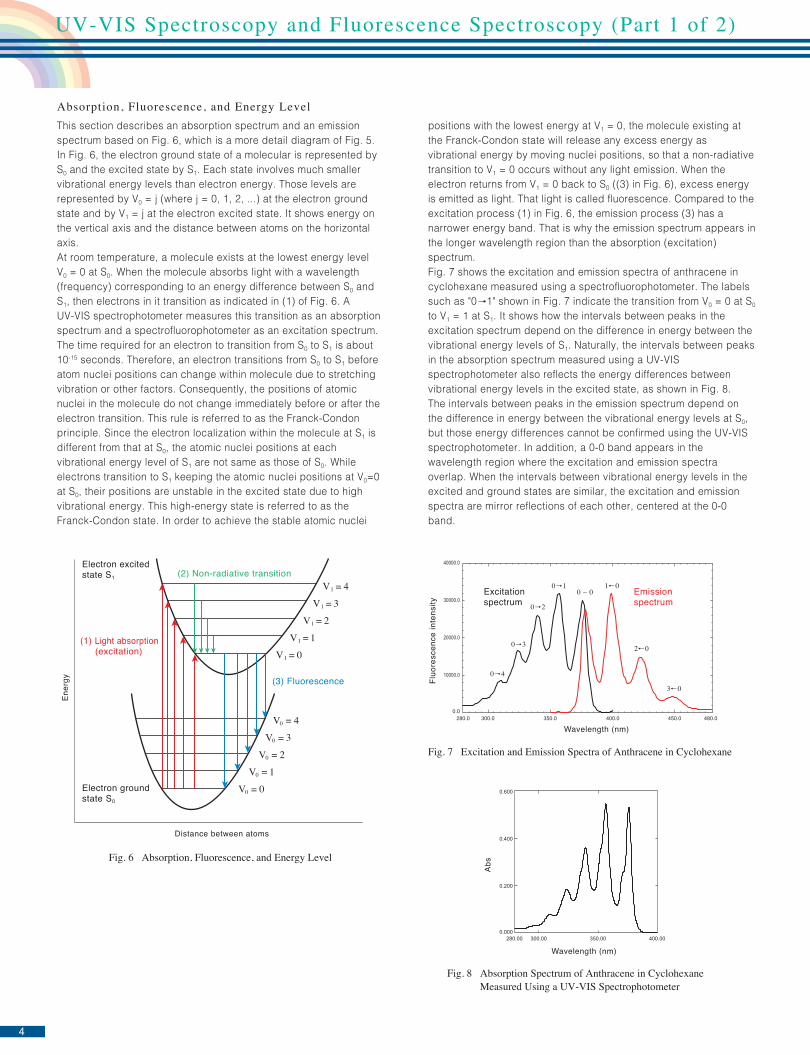
Absorption, Fluorescence, and Energy LevelThis section describes an absorption spectrum and an emission spectrum based on Fig. 6, which is a more detail diagram of Fig. 5. In Fig. 6, the electron ground state of a molecular is represented by S0 and the excited state by S1. Each state involves much smaller vibrational energy levels than electron energy. Those levels are represented by V0 = j (where j = 0, 1, 2, ...) at the electron ground state and by V1 = j at the electron excited state. It shows energy on the vertical axis and the distance between atoms on the horizontal axis. At room temperature, a molecule exists at the lowest energy level V0 = 0 at S0. When the molecule absorbs light with a wavelength (frequency) corresponding to an energy difference between S0 and S1, then electrons in it transition as indicated in (1) of Fig. 6. A UV-VIS spectrophotometer measures this transition as an absorption spectrum and a spectrofluorophotometer as an excitation spectrum.The time required for an electron to transition from S0 to S1 is about 10-15 seconds. Therefore, an electron transitions from S0 to S1 before atom nuclei positions can change within molecule due to stretching vibration or other factors. Consequently, the positions of atomic nuclei in the molecule do not change immediately before or after the electron transition. This rule is referred to as the Franck-Condon principle. Since the electron localization within the molecule at S1 is different from that at S0, the atomic nuclei positions at each vibrational energy level of S1 are not same as those of S0. While electrons transition to S1 keeping the atomic nuclei positions at V0=0 at S0, their positions are unstable in the excited state due to high vibrational energy. This high-energy state is referred to as the Franck-Condon state. In order to achieve the stable atomic nuclei
positions with the lowest energy at V1 = 0, the molecule existing at the Franck-Condon state will release any excess energy as vibrational energy by moving nuclei positions, so that a non-radiative transition to V1 = 0 occurs without any light emission. When the electron returns from V1 = 0 back to S0 ((3) in Fig. 6), excess energy is emitted as light. That light is called fluorescence. Compared to the excitation process (1) in Fig. 6, the emission process (3) has a narrower energy band. That is why the emission spectrum appears in the longer wavelength region than the absorption (excitation) spectrum.Fig. 7 shows the excitation and emission spectra of anthracene in cyclohexane measured using a spectrofluorophotometer. The labels such as "0 1" shown in Fig. 7 indicate the transition from V0 = 0 at S0 to V1 = 1 at S1. It shows how the intervals between peaks in the excitation spectrum depend on the difference in energy between the vibrational energy levels of S1. Naturally, the intervals between peaks in the absorption spectrum measured using a UV-VIS spectrophotometer also reflects the energy differences between vibrational energy levels in the excited state, as shown in Fig. 8.The intervals between peaks in the emission spectrum depend on the difference in energy between the vibrational energy levels at S0, but those energy differences cannot be confirmed using the UV-VIS spectrophotometer. In addition, a 0-0 band appears in the wavelength region where the excitation and emission spectra overlap. When the intervals between vibrational energy levels in the excited and ground states are similar, the excitation and emission spectra are mirror reflections of each other, centered at the 0-0 band.
5
UV Talk Letter Vol . 17
Global Application Development Center, Analytical & Measuring Instruments DivisionTakahiro Tajima
Kazuki Sobue
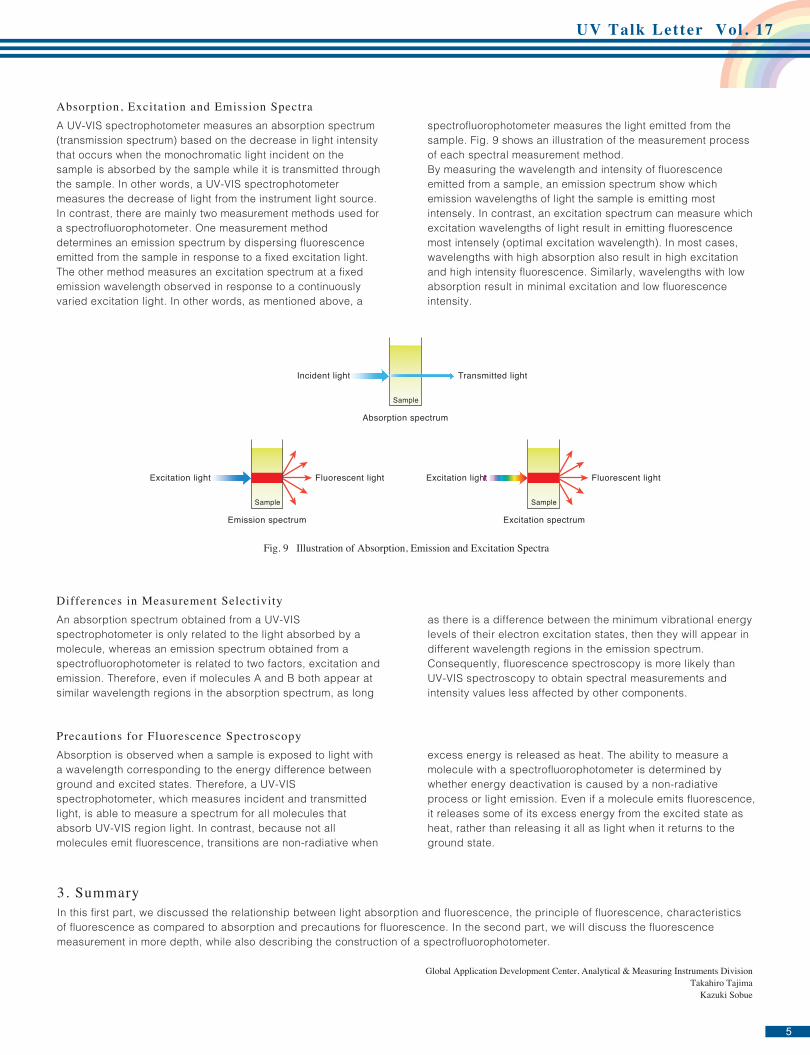
Absorption, Excitation and Emission SpectraA UV-VIS spectrophotometer measures an absorption spectrum (transmission spectrum) based on the decrease in light intensity that occurs when the monochromatic light incident on the sample is absorbed by the sample while it is transmitted through the sample. In other words, a UV-VIS spectrophotometer measures the decrease of light from the instrument light source. In contrast, there are mainly two measurement methods used for a spectrofluorophotometer. One measurement method determines an emission spectrum by dispersing fluorescence emitted from the sample in response to a fixed excitation light. The other method measures an excitation spectrum at a fixed emission wavelength observed in response to a continuously varied excitation light. In other words, as mentioned above, a
spectrofluorophotometer measures the light emitted from the sample. Fig. 9 shows an illustration of the measurement process of each spectral measurement method.By measuring the wavelength and intensity of fluorescence emitted from a sample, an emission spectrum show which emission wavelengths of light the sample is emitting most intensely. In contrast, an excitation spectrum can measure which excitation wavelengths of light result in emitting fluorescence most intensely (optimal excitation wavelength). In most cases, wavelengths with high absorption also result in high excitation and high intensity fluorescence. Similarly, wavelengths with low absorption result in minimal excitation and low fluorescence intensity.
Differences in Measurement SelectivityAn absorption spectrum obtained from a UV-VIS spectrophotometer is only related to the light absorbed by a molecule, whereas an emission spectrum obtained from a spectrofluorophotometer is related to two factors, excitation and emission. Therefore, even if molecules A and B both appear at similar wavelength regions in the absorption spectrum, as long
as there is a difference between the minimum vibrational energy levels of their electron excitation states, then they will appear in different wavelength regions in the emission spectrum. Consequently, fluorescence spectroscopy is more likely than UV-VIS spectroscopy to obtain spectral measurements and intensity values less affected by other components.
Precautions for Fluorescence SpectroscopyAbsorption is observed when a sample is exposed to light with a wavelength corresponding to the energy difference between ground and excited states. Therefore, a UV-VIS spectrophotometer, which measures incident and transmitted light, is able to measure a spectrum for all molecules that absorb UV-VIS region light. In contrast, because not all molecules emit fluorescence, transitions are non-radiative when
excess energy is released as heat. The ability to measure a molecule with a spectrofluorophotometer is determined by whether energy deactivation is caused by a non-radiative process or light emission. Even if a molecule emits fluorescence, it releases some of its excess energy from the excited state as heat, rather than releasing it all as light when it returns to the ground state.
Incident light Transmitted light
Sample
Absorption spectrum
Excitation light Fluorescent light
Sample
Emission spectrum
Excitation light Fluorescent light
Sample
Excitation spectrum
Fig. 9 Illustration of Absorption, Emission and Excitation Spectra
3. SummaryIn this first part, we discussed the relationship between light absorption and fluorescence, the principle of fluorescence, characteristics of fluorescence as compared to absorption and precautions for fluorescence. In the second part, we will discuss the fluorescence measurement in more depth, while also describing the construction of a spectrofluorophotometer.
6
UV Talk Letter Application
A spectrofluorophotometer can be used to analyze samples in a wide variety of fields. This article gives various
examples of using the RF-6000 spectrofluorophotometer for analysis in a variety of fields.
1. Chemistry[Analysis of Coumarin in Diesel Oil]
Spectrofluorophotometers Used in a Variety of Fields
0.0
50000.0
100000.0
150000.0
390.0 450.0 500.0nm
550.0 600.0 630.0
Fluo
resc
ence
inte
nsity
Fig. 1 Emission Spectra for Different Concentrations of Standard Coumarin Solutions
Fig. 2 Calibration Curve for Standard Coumarin Solutions
Fig. 3 Three-Dimensional Fluorescence Spectra of Commercial Non-Fat, Low-Fat, and High-Fat Milk
Fluo
resc
ence
inte
nsity
Concentration (mg/L)
Calibration curve
0.00.0 0.5 1.0 1.2
50000.0
100000.0
150000.0
y = 1.10881e + 005x + 0.000000r2 = 0.99965
Non-fat milk Low-fat milk High-fat milk
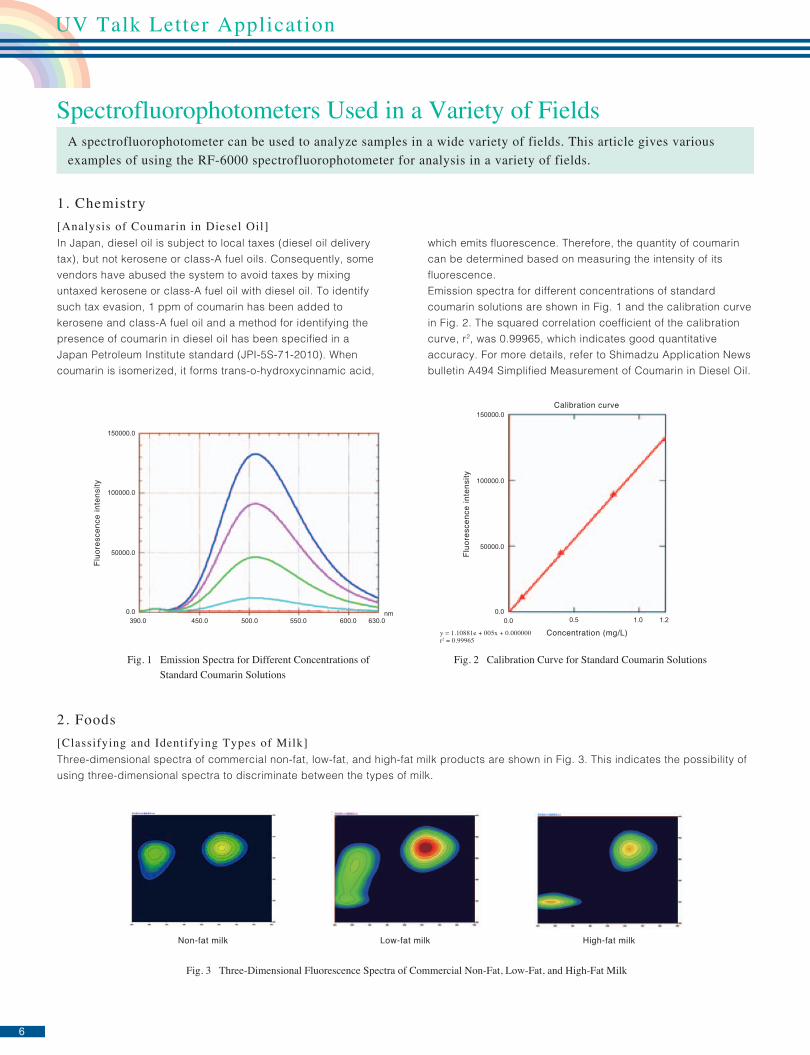
In Japan, diesel oil is subject to local taxes (diesel oil delivery tax), but not kerosene or class-A fuel oils. Consequently, some vendors have abused the system to avoid taxes by mixing untaxed kerosene or class-A fuel oil with diesel oil. To identify such tax evasion, 1 ppm of coumarin has been added to kerosene and class-A fuel oil and a method for identifying the presence of coumarin in diesel oil has been specified in a Japan Petroleum Institute standard (JPI-5S-71-2010). When coumarin is isomerized, it forms trans-o-hydroxycinnamic acid,
which emits fluorescence. Therefore, the quantity of coumarin can be determined based on measuring the intensity of its fluorescence.Emission spectra for different concentrations of standard coumarin solutions are shown in Fig. 1 and the calibration curve in Fig. 2. The squared correlation coefficient of the calibration curve, r2, was 0.99965, which indicates good quantitative accuracy. For more details, refer to Shimadzu Application News bulletin A494 Simplified Measurement of Coumarin in Diesel Oil.
2. Foods[Classifying and Identifying Types of Milk]Three-dimensional spectra of commercial non-fat, low-fat, and high-fat milk products are shown in Fig. 3. This indicates the possibility of using three-dimensional spectra to discriminate between the types of milk.
7
UV Talk Letter Vol . 17
Fig. 4 Fluorescence Quantum Efficiency of Solid-State Semiconductor Material
Fig. 5 Emission Spectrum from Mixture of Five Polycyclic Aromatic Hydrocarbons (Ex. 300 nm)
Fluo
resc
ence
inte
nsity
0.0
40.0
80.0
350.0 400.0 450.0nm
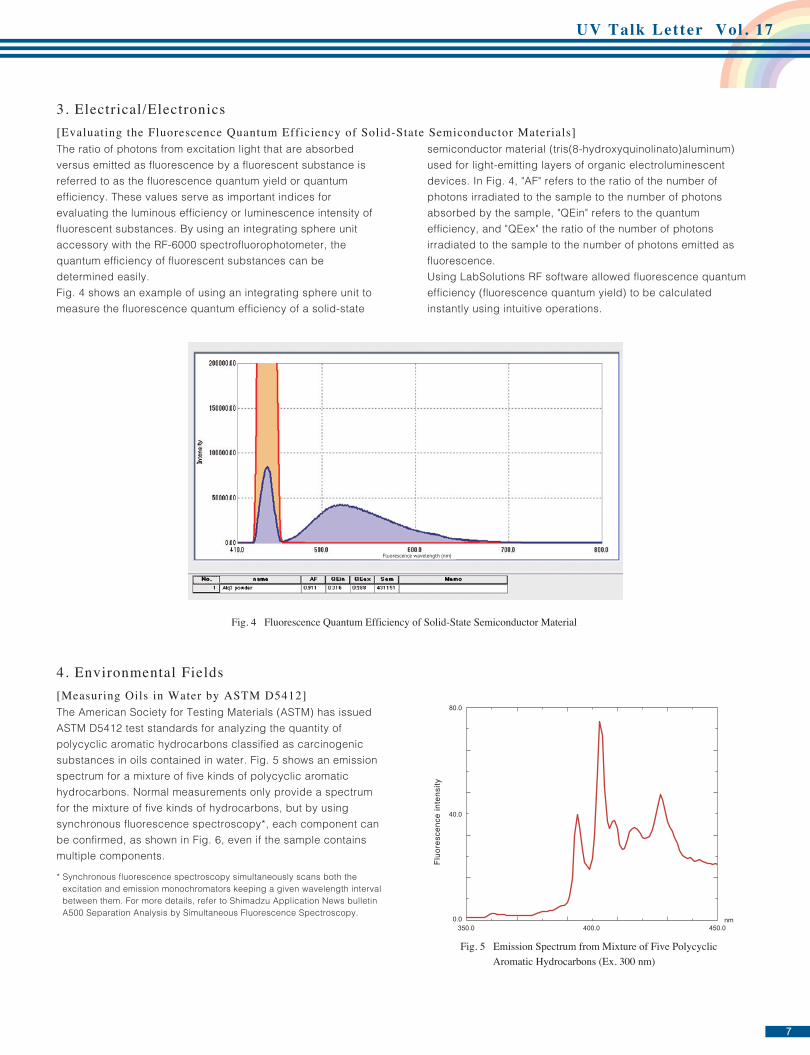
3. Electrical/Electronics[Evaluating the Fluorescence Quantum Efficiency of Solid-State Semiconductor Materials]The ratio of photons from excitation light that are absorbed versus emitted as fluorescence by a fluorescent substance is referred to as the fluorescence quantum yield or quantum efficiency. These values serve as important indices for evaluating the luminous efficiency or luminescence intensity of fluorescent substances. By using an integrating sphere unit accessory with the RF-6000 spectrofluorophotometer, the quantum efficiency of fluorescent substances can be determined easily.Fig. 4 shows an example of using an integrating sphere unit to measure the fluorescence quantum efficiency of a solid-state
semiconductor material (tris(8-hydroxyquinolinato)aluminum) used for light-emitting layers of organic electroluminescent devices. In Fig. 4, "AF" refers to the ratio of the number of photons irradiated to the sample to the number of photons absorbed by the sample, "QEin" refers to the quantum efficiency, and "QEex" the ratio of the number of photons irradiated to the sample to the number of photons emitted as fluorescence.Using LabSolutions RF software allowed fluorescence quantum efficiency (fluorescence quantum yield) to be calculated instantly using intuitive operations.
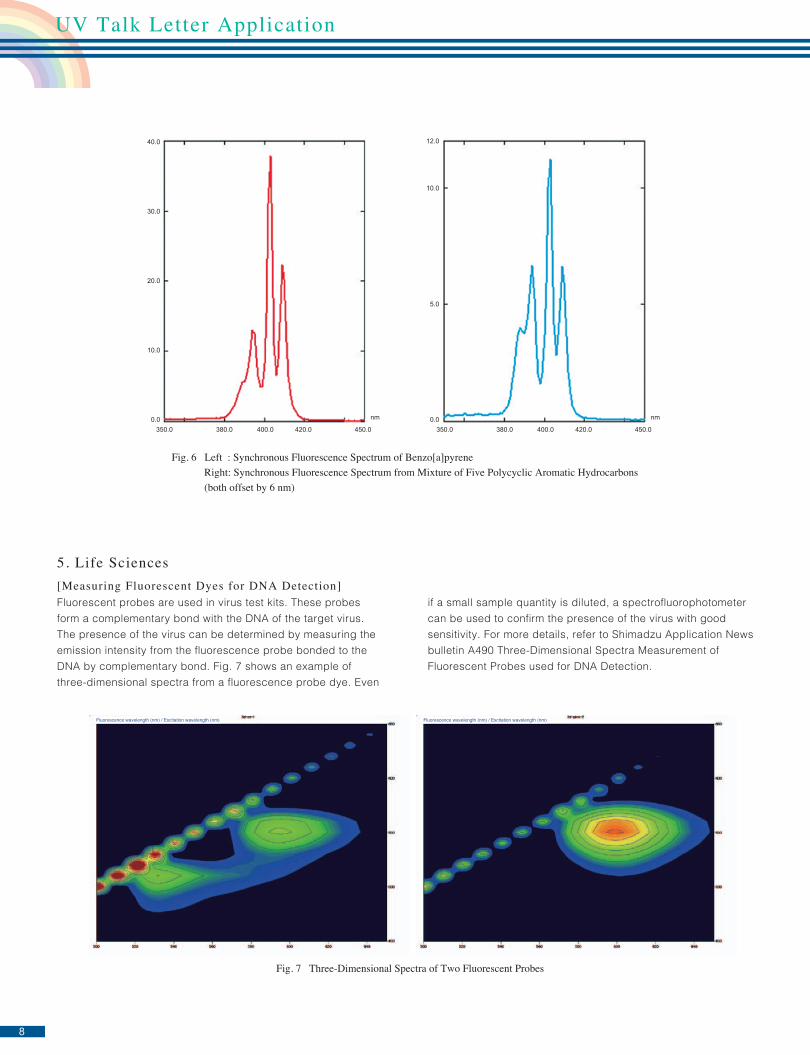
4. Environmental Fields[Measuring Oils in Water by ASTM D5412]The American Society for Testing Materials (ASTM) has issued ASTM D5412 test standards for analyzing the quantity of polycyclic aromatic hydrocarbons classified as carcinogenic substances in oils contained in water. Fig. 5 shows an emission spectrum for a mixture of five kinds of polycyclic aromatic hydrocarbons. Normal measurements only provide a spectrum for the mixture of five kinds of hydrocarbons, but by using synchronous fluorescence spectroscopy*, each component can be confirmed, as shown in Fig. 6, even if the sample contains multiple components.
* Synchronous fluorescence spectroscopy simultaneously scans both the excitation and emission monochromators keeping a given wavelength interval between them. For more details, refer to Shimadzu Application News bulletin A500 Separation Analysis by Simultaneous Fluorescence Spectroscopy.
8
UV Talk Letter Application
Fig. 6 Left : Synchronous Fluorescence Spectrum of Benzo[a]pyrene Right: Synchronous Fluorescence Spectrum from Mixture of Five Polycyclic Aromatic Hydrocarbons (both offset by 6 nm)
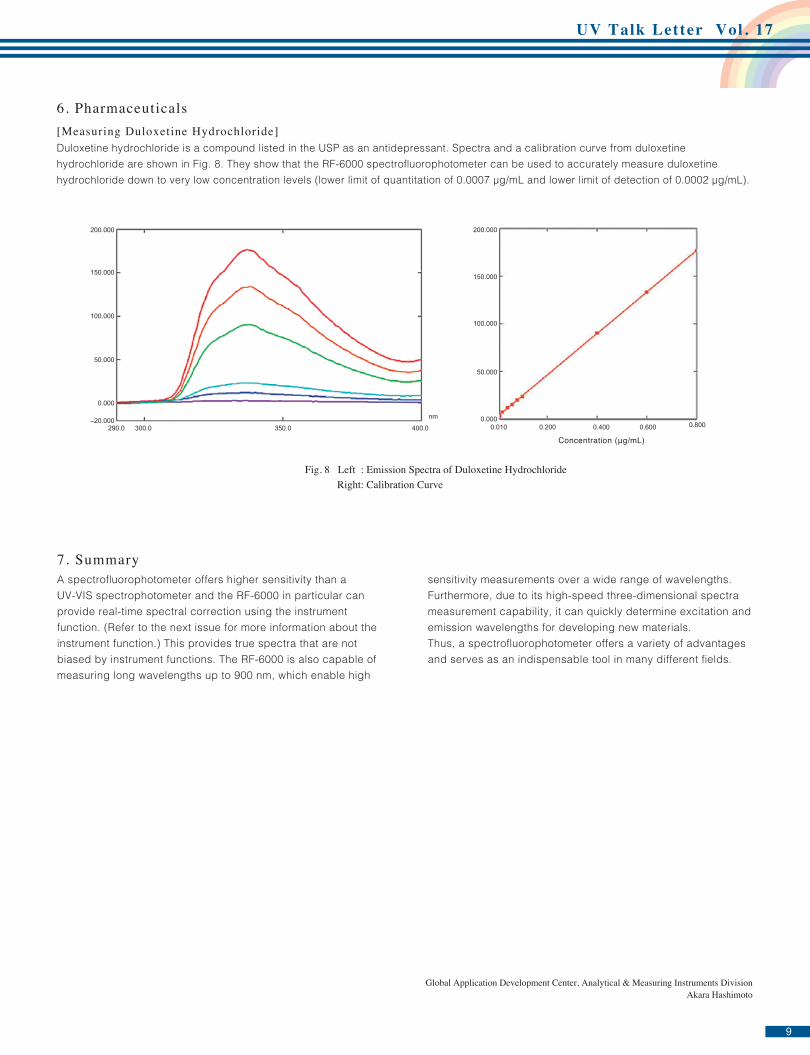
5. Life Sciences[Measuring Fluorescent Dyes for DNA Detection]Fluorescent probes are used in virus test kits. These probes form a complementary bond with the DNA of the target virus. The presence of the virus can be determined by measuring the emission intensity from the fluorescence probe bonded to the DNA by complementary bond. Fig. 7 shows an example of three-dimensional spectra from a fluorescence probe dye. Even
if a small sample quantity is diluted, a spectrofluorophotometer can be used to confirm the presence of the virus with good sensitivity. For more details, refer to Shimadzu Application News bulletin A490 Three-Dimensional Spectra Measurement of Fluorescent Probes used for DNA Detection.
0.0 0.0
5.0
10.0
12.0
350.0 380.0 400.0 420.0 450.0
10.0
20.0
30.0
40.0
nm
350.0 380.0 400.0 420.0 450.0
nm
Fig. 7 Three-Dimensional Spectra of Two Fluorescent Probes
Fluorescence wavelength (nm) / Excitation wavelength (nm) Fluorescence wavelength (nm) / Excitation wavelength (nm)
9
UV Talk Letter Vol . 17
Fig. 8 Left : Emission Spectra of Duloxetine Hydrochloride Right: Calibration Curve
6. Pharmaceuticals[Measuring Duloxetine Hydrochloride]Duloxetine hydrochloride is a compound listed in the USP as an antidepressant. Spectra and a calibration curve from duloxetine hydrochloride are shown in Fig. 8. They show that the RF-6000 spectrofluorophotometer can be used to accurately measure duloxetine hydrochloride down to very low concentration levels (lower limit of quantitation of 0.0007 μg/mL and lower limit of detection of 0.0002 μg/mL).
–20.000
0.000
290.00.000
50.000
100.000
150.000
200.000
0.010 0.200 0.400 0.600 0.800300.0 350.0 400.0
50.000
100.000
150.000
200.000
nm
Concentration (μg/mL)
Global Application Development Center, Analytical & Measuring Instruments DivisionAkara Hashimoto
7. SummaryA spectrofluorophotometer offers higher sensitivity than a UV-VIS spectrophotometer and the RF-6000 in particular can provide real-time spectral correction using the instrument function. (Refer to the next issue for more information about the instrument function.) This provides true spectra that are not biased by instrument functions. The RF-6000 is also capable of measuring long wavelengths up to 900 nm, which enable high
sensitivity measurements over a wide range of wavelengths. Furthermore, due to its high-speed three-dimensional spectra measurement capability, it can quickly determine excitation and emission wavelengths for developing new materials.Thus, a spectrofluorophotometer offers a variety of advantages and serves as an indispensable tool in many different fields.
10
Is there a way to avoid detecting scattered light and higher-order light in an emission spectrum?
800
700
600
500
400
300
300 400 500 600 700 800
300 400 500 600 700 800
300
400
500
600
700
800
520 540 560 580 600 620 640
350
400
450
500
Exci
tatio
nw
avel
engt
h (n
m)
Emissionwavelength (nm)Fig. 1 Three-dimensional Spectra of Rhodamine B in Ethanol
Fig. 2 Using Y-50 Filter Fig. 3 Smaller Measurement Area
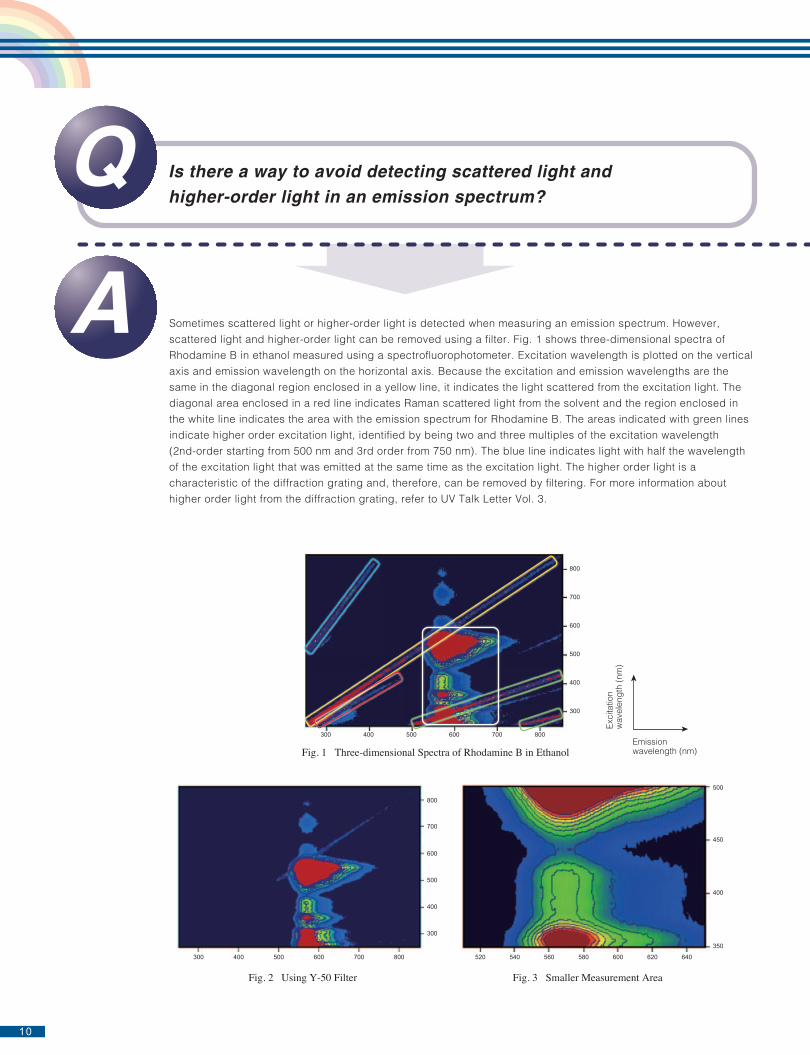
Sometimes scattered light or higher-order light is detected when measuring an emission spectrum. However, scattered light and higher-order light can be removed using a filter. Fig. 1 shows three-dimensional spectra of Rhodamine B in ethanol measured using a spectrofluorophotometer. Excitation wavelength is plotted on the vertical axis and emission wavelength on the horizontal axis. Because the excitation and emission wavelengths are the same in the diagonal region enclosed in a yellow line, it indicates the light scattered from the excitation light. The diagonal area enclosed in a red line indicates Raman scattered light from the solvent and the region enclosed in the white line indicates the area with the emission spectrum for Rhodamine B. The areas indicated with green lines indicate higher order excitation light, identified by being two and three multiples of the excitation wavelength (2nd-order starting from 500 nm and 3rd order from 750 nm). The blue line indicates light with half the wavelength of the excitation light that was emitted at the same time as the excitation light. The higher order light is a characteristic of the diffraction grating and, therefore, can be removed by filtering. For more information about higher order light from the diffraction grating, refer to UV Talk Letter Vol. 3.
11
UV Talk Letter Vol . 17
IHU-310L -42Y-50O-56R-60
200 to 310 nm200 to 420 nm200 to 500 nm200 to 560 nm200 to 600 nm
Filter Excitation Wavelengths Filtered
Over 310 nmOver 420 nmOver 500 nmOver 560 nmOver 600 nm
Emission Wavelength Passed
Table 1 Filters and Corresponding Wavelengths
0.0200.0 400.0 600.0 800.0 900.0
nm
T%
20.0
40.0
60.0
80.0
100.0
Fig. 4 Wavelength Properties for Y-50 Filter
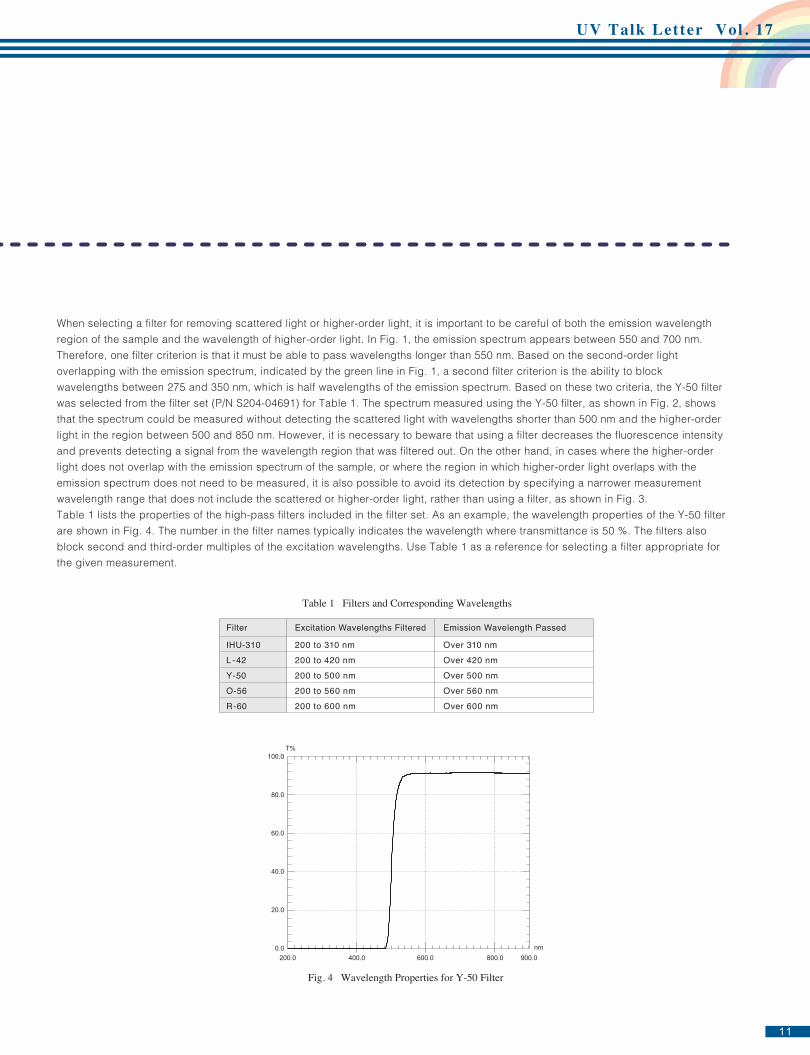
When selecting a filter for removing scattered light or higher-order light, it is important to be careful of both the emission wavelength region of the sample and the wavelength of higher-order light. In Fig. 1, the emission spectrum appears between 550 and 700 nm. Therefore, one filter criterion is that it must be able to pass wavelengths longer than 550 nm. Based on the second-order light overlapping with the emission spectrum, indicated by the green line in Fig. 1, a second filter criterion is the ability to block wavelengths between 275 and 350 nm, which is half wavelengths of the emission spectrum. Based on these two criteria, the Y-50 filter was selected from the filter set (P/N S204-04691) for Table 1. The spectrum measured using the Y-50 filter, as shown in Fig. 2, shows that the spectrum could be measured without detecting the scattered light with wavelengths shorter than 500 nm and the higher-order light in the region between 500 and 850 nm. However, it is necessary to beware that using a filter decreases the fluorescence intensity and prevents detecting a signal from the wavelength region that was filtered out. On the other hand, in cases where the higher-order light does not overlap with the emission spectrum of the sample, or where the region in which higher-order light overlaps with the emission spectrum does not need to be measured, it is also possible to avoid its detection by specifying a narrower measurement wavelength range that does not include the scattered or higher-order light, rather than using a filter, as shown in Fig. 3.Table 1 lists the properties of the high-pass filters included in the filter set. As an example, the wavelength properties of the Y-50 filter are shown in Fig. 4. The number in the filter names typically indicates the wavelength where transmittance is 50 %. The filters also block second and third-order multiples of the excitation wavelengths. Use Table 1 as a reference for selecting a filter appropriate for the given measurement.

© Shimadzu Corporation, 2016
www.shimadzu.com/an/
For Research Use Only. Not for use in diagnostic procedures. This publication may contain references to products that are not available in your country. Please contact us to check the availability of these products in your country.Company names, products/service names and logos used in this publication are trademarks and trade names of Shimadzu Corporation, its subsidiaries or its affiliates, whether or not they are used with trademark symbol “TM” or “®”.Third-party trademarks and trade names may be used in this publication to refer to either the entities or their products/services, whether or not they are used with trademark symbol “TM” or “®”.Shimadzu disclaims any proprietary interest in trademarks and trade names other than its own.
The contents of this publication are provided to you “as is” without warranty of any kind, and are subject to change without notice. Shimadzu does not assume any responsibility or liability for any damage, whether direct or indirect, relating to the use of this publication.


![Median Photometric Stereo as Applied to the Segonko ...miyazaki/publication/paper/Miyazaki-IJCV2010PS.pdfTherefore, we use so-called “four-light photometric stereo [10,56,4,9].”](https://static.fdocuments.net/doc/165x107/5e7838fc764b185a9535da92/median-photometric-stereo-as-applied-to-the-segonko-miyazakipublicationpapermiyazaki-.jpg)