UTTARAKHAND AT A GLANCE - Home: Uttarakhand Government … · UTTARAKHAND : at a Glance (2013-14 )...
20
U U T T T T A A R R A A K K H H A A N N D D A A T T A A G G L L A A N N C C E E (2013-14) Govt. of Uttarakhand DIRECTORATE OF ECONOMICS & STATISTICS 100/6, NESHVILLA ROAD, DEHRADUN.
Transcript of UTTARAKHAND AT A GLANCE - Home: Uttarakhand Government … · UTTARAKHAND : at a Glance (2013-14 )...

UUTTTTAARRAAKKHHAANNDD AATT AA GGLLAANNCCEE ((22001133--1144))
Govt. of Uttarakhand
DIRECTORATE OF ECONOMICS & STATISTICS 100/6, NESHVILLA ROAD,
DEHRADUN.

FOREWORD
I am pleased to note that the Directorate of Economics & Statistics (DES)
has come out with the twelfth edition of its valuable publication,
“Uttarakhand at a Glance (2013-14)”. This is a compilation of key statistics-
from general information to the latest data available on various socio-
economic indicators, which will be useful for making development plans for
different sectors of the economy.
I hope that data incorporated in this publication would be
helpful for policy makers, and decision making in authorities to quickly
examine the project they may be entertaining in their respective spheres.
I request all readers to give us suggestions for the improvement of this
publication which will be welcome.
I place on record my appreciation of the officers and staff of the
Directorate of Economics and Statistics, Uttarakhand, who have been involved
in this publication. Last but not the least, I place on record my appreciation of
all departments who cooperated and made this a success.
Dehradun (S.Ramaswamy) Dated: 28 February, 2014 Principal Secretary (Planning)
Govt. of Uttarakhand.

Acknowledgement
“Uttarakhand at a Glance (2013-14)” is our twelfth publication in this
series. It provides socio–economic statistics, and portrays the economic
potential, socio fabric and natural and human resource available in the State.
This publication would have not been possible without the support of
various departments in supplying the data related to them. DES is indebted to
them for their co-operation and help. Without their supports it was not possible
to come out with the publication in time.
“Uttarakhand at a Glance (2013-14)” is prepared by a team of
proficient and committed economists and statisticians. I am happy to
acknowledge the efforts and the hard work by Dr. Manoj Kumar Pant,
Joint Director, Shri M.S. Bisht, Chief Cartographer, Shri Abbal Singh Bisht,
Economics & Statistics Officer, Shri Satender Kumar, Additional Statistical
Officer, Shri Brijesh Kumar, Assistant Statistical Officer, Shri Anil Kotiyal,
Data Entry Operator.
Please feel free to give your valuable comments and suggestions to
improve this publication.
We sincerely hope that this publication shall serve as a ready reckoner
for all those who require the facts and figures for administrative and
development planning.
Dehradun (Y.S. Pangtey) Dated: 28 February 2014 Director,
Economics and Statistics Uttarakhand, Dehradun

RESEARCH TEAM
Shri Yatendra Singh Pangtey Director
Dr. Manoj Kumar Pant Joint Director
Shri Mahendra Singh Bisht
Shri Abbal Singh Bisht
Chief Cartographer
Economic & Statistics Officer
Shri. Brijesh Kumar Assistant Statistical Officer
Shri Anil Kotiyal Data Entry Operator

CCOONNTTEENNTTSS
S.NO. ITEMS PAGE NO. 1. GENERAL INFORMATION 1 2. DEMOGRAPHY 2-3 3. AGRICULTURE 4-5 4. IRRIGATION 5 5. LIVESTOCK AND POULTRY 6 6. FISHERIES 6 7. HORTICULTURE 6 8. SERICULTURE 7 9. INDUSTRY 7 10. EDUCATION 7-8 11. PUBLIC HEALTH AND FAMILY WELFARE 8 12. ELECTRICITY AND WATER SUPPLY 8-9 13. TRANSPORT AND COMMUNICATION 9-10 14. FOREST AND WILD LIFE 10-11 15. TOURISM 11 16. EMPLOYMENT 11 17. BANKING 11-12 18. STATE DOMESTIC PRODUCT 12 19. FIFTH ECONOMIC CENSUS 12-13 20. EXCISE 13 21. TRADE AND COMMERCE 13 22. SAINIK KALYAN AND PUNARWAS 13 23. INTEGRATED CHILD DEVELOPMENT
SCHEME 13-14
24. FOOD AND CIVIL SUPPLY 14 25. UTTARAKHAND RENEWABLE ENERGY
DEVELOPMENT AGENCY (UREDA) 14
26. YOUTH WELFARE AND PRANTIYA RAKSHAK DAL
14
27. RURAL DEVELOPMENT 14 28. SOCIAL WELFARE 15
¤¤¤¤¤¤¤¤¤

1 of 15
UUTTTTAARRAAKKHHAANNDD :: aatt aa GGllaannccee
((22001133--1144 )) DDiirreeccttoorraattee ooff EEccoonnoommiiccss aanndd SSttaattiissttiiccss
110000//66,, NNeesshhvviillllaa RRooaadd,, DDeehhrraadduunn ((UUttttaarraakkhhaanndd)) -- 224488 000011
PPhhoonnee:: 00113355--22771122660044 FFaaxx:: 00113355--22771122660044
SS.. NNoo.. IItteemmss YYeeaarr// PPeerriioodd
UUnniitt SSttaattiissttiiccss
1. GENERAL INFORMATION (A) Geographical Data 1. Latitude 28°43' N to 31°27' N 2. Longitude 77°34' E to 81°02' E 3. Geographical Area
(i)Hill (ii)Plain
2013 2013 2013
Sq. Km. Sq. Km. Sq. Km.
53483 46035 7448
4. Forest Area 2013 Sq. Km. 34651 (B) Meteorological Data 1. Rainfall
(i) Average Rainfall (ii) Actual Rainfall
2012 2012
m. ms. m. ms
1631 1400
2. Temperature (i) Minimum (Mukteshwar) 2012 ° C -4.6 (ii) Maximum (Dehradun) 2012 ° C 43.1
(C) Administrative Units 1. Divisions 2013 No. 02 2. Districts 2013 No. 13 3. Tehsils 2013 No. 82 4. Development Blocks 2013 No. 95 5. Nyaya Panchayats 2013 No. 670 6. Gram Panchayats 2013 No. 7555 7. (a) Census Villages (As per 2011 census) 2011 No. 16793 (i) Inhabited Villages
(Including Forest Settlements) 2011 No. 15745
(ii) Un-inhabited Villages 2011 No. 1048 8. Town/ Urban Agglomeration (i) Municipal Corporation 2013 No. 06 (ii) Nagar Palika Parishads 2013 No. 28 (iii) Nagar Panchayats 2013 No. 38 (iv) Cantonment Boards 2013 No. 09
(v) Census Towns 2011 No. 41 (vi) Industrial Townships 2011 No. 02
9. Development Authority 2013 No. 06 10. Lok Sabha Constituency 2013 No. 05 11. Rajya Sabha Constituency 2013 No. 03 12. Vidhan Sabha Constituency 2013 No. 70

2 of 15
13.
Police Stations
2013
No.
124
a. (i) Rural 2013 No. 68 (ii Urban 2013 No. 56 b. (i) G.R.P. 2. DEMOGRAPHY
2013 No. 4
(A) Sex-wise, Area-wise distribution, Sex-Ratio,
Child Sex-Ratio and Density of Population
1. Total Population 2011 Lakh 100.86 (i) Male 2011 Lakh 51.38 (ii) Female 2011 Lakh 49.48 (iii) Decennial Growth Rate 2001-11 Percentage 18.80 2 Rural Population Total 2011 Lakh 70.37 (i) Male 2011 Lakh 35.19 (ii) Female 2011 Lakh 35.18 3 Urban Population Total 2011 Lakh 30.50 (i) Male 2011 Lakh 16.19 (ii) Female 2011 Lakh 14.31 4 Sex Ratio 2011 Females/’000
males 963
5 Child Sex Ratio (Population 0-6 age group) 2011 Females/’000 males
890
6 Density of population 2011 Per sq. k.m 189 (B) Scheduled Castes 1. Total Population 2011 Lakh 18.93 (i) Male 2011 Lakh 9.69 (ii) Female 2011 Lakh 9.24
2. Rural Population 2011 Lakh 14.97 (i) Male 2011 Lakh 7.61 (ii) Female 2011 Lakh 7.36
(C) Scheduled Tribes 1. Total Population 2011 Lakh 2.92 (i) Male 2011 Lakh 1.49 (ii) Female 2011 Lakh 1.43
2. Rural Population 2011 Lakh 2.65 (i) Male 2011 Lakh 1.35 (ii) Female 2011 Lakh 1.30
(D) Religion wise breakup
1. Hindus 2001 Lakh 72.12 2. Muslims 2001 Lakh 10.12 3. Christians 2001 Lakh 0.27 4. Sikhs 2001 Lakh 2.12 5. Buddhists 2001 Lakh 0.13 6. Jains 2001 Lakh 0.09 7. Others & Religion not stated 2001 Lakh 0.04

3 of 15
(E) Literates (Age above 6 Years) 1. Total 2011 Lakh 68.81 (i) Male 2011 Lakh 38.64 (ii) Female 2011 Lakh 30.17
(F) Literacy Rate 1. Total 2011 Percentage 78.80 (i) Male 2011 Percentage 87.40 (ii) Female 2011 Percentage 70.00
2. Scheduled Castes Total 2011 Percentage 74.41 (i) Male 2011 Percentage 84.34
(ii) Female 2011 Percentage 64.05
3. Scheduled Tribes Total 2011 Percentage 73.88 (i) Male 2011 Percentage 83.56 (ii) Female 2011 Percentage 63.89
(G) Sex-wise Labour Force (Total Workers) 1. Total 2011 Lakh 38.72 (i) Male 2011 Lakh 25.52 (ii) Female 2011 Lakh 13.20
2. Rural 2011 Lakh 28.86 (i) Male 2011 Lakh 17.27 (ii) Female 2011 Lakh 11.59
(H) Category-wise Labour Force 1. Main Workers 2011 Lakh 28.71 (i) Cultivators 2011 Lakh 10.46 (ii) Agricultural Labourers 2011 Lakh 2.47 (iii) Household Industry Workers 2011 Lakh 0.77 (iv) Other Workers 2011 Lakh 15.01
2. Marginal Workers 2011 Lakh 10.01 (i) Cultivators 2011 Lakh 5.35 (ii) Agricultural Labourers 2011 Lakh 1.56 (iii) Household Industry Workers 2011 Lakh 0.37 (iv) Other Workers 2011 Lakh 2.73
(I) Disability (i) No. of disabled persons 2001 Lakh 1.95 (ii) Percentage of disability 2001 Percentage 2.29
(J) CBR, CDR and IMR (S.R.S. Data) 1. Crude Birth Rate 2012 Per '000 of Popu. 18.5 (i) Rural 2012 Per '000 of Popu. 19.1 (ii) Urban 2012 Per '000 of Popu. 15.9
2. Crude Death Rate 2012 Per '000 of Popu. 6.1 (i) Rural 2012 Per '000 of Popu. 6.5 (ii) Urban 2012 Per '000 of Popu. 4.8
3. Infant Mortality Rate 2012 Per '000 of Live Births
34
(i) Rural 2012 Per '000 of Live Births
36
(ii) Urban 2012 Per '000 of Live Births
23

4 of 15
3. AGRICULTURE (A) Land-use 1. Total Reported Area 2011-12 Hectare 5672636 2. Forest Area 2011-12 Hectare 3484803 3. Culturable Waste Land 2011-12 Hectare 311124 4. Fallow Land 2011-12 Hectare 135412 (i) Current Fallow 2011-12 Hectare 48444 (ii) Fallow Land other than Current Fallow 2011-12 Hectare 86968
5. Barren & Unculturable Land 2011-12 Hectare 224851 6. Land under Non-agricultural Uses 2011-12 Hectare 218034 7. Permanent Pasture & Other Grazing Land 2011-12 Hectare 198524 8. Land under Misc., Tree Crops and Groves not
included in Net Area Sown 2011-12 Hectare 385699
9. Net Area Sown 2011-12 Hectare 714189 (B) Area Under Principal Crops (Provisional) 1. Cereals 2012-13 Hectare 870622 (i) Rice 2012-13 Hectare 262796 (ii) Wheat 2012-13 Hectare 358132 (iii) Barley 2012-13 Hectare 22393 (iv) Maize 2012-13 Hectare 27944 (v) Manduwa 2012-13 Hectare 124618 (vi) Sanwan 2012-13 Hectare 66929 (vii) other 2012-13 Hectare 7810
2. Pulses 2012-13 Hectare 61027 (i) Urad 2012-13 Hectare 15016 (ii) Masoor 2012-13 Hectare 11794 (iii) Peas (Mattar) 2012-13 Hectare 4892 (iv) Gahat (Kulthi) 2012-13 Hectare 13294 (v) Rajma 2012-13 Hectare 5224 (vi) Gram 2012-13 Hectare 532 (vii) Bhatt (Black Soyabean) 2012-13 Hectare 5980 (viii) Other pulses 2012-13 Hectare 4295
3. Oil Seeds 2012-13 Hectare 31693 (i) Rape and Mustard 2012-13 Hectare 18079 (ii) Seasmum (Til) 2012-13 Hectare 2059 (iii) Groundnut 2012-13 Hectare 1042 (iv) Soyabean 2012-13 Hectare 10513
4. Other Crops (i) Sugarcane 2012-13 Hectare 109897 (iii) Onion 2012-13 Hectare 2378
(C) Agriculture Productivity (Provisional) 1. Cereals 2012-13 Qtl./ Hectare 20.40 (i) Rice 2012-13 Qtl./ Hectare 22.06 (ii) Wheat 2012-13 Qtl./ Hectare 23.96 (iii) Barley 2012-13 Qtl./ Hectare 13.72 (iv) Maize 2012-13 Qtl./ Hectare 14.37 (v) Manduwa 2012-13 Qtl./ Hectare 13.92 (vi) Sanwan 2012-13 Qtl./ Hectare 13.37
5 of 15
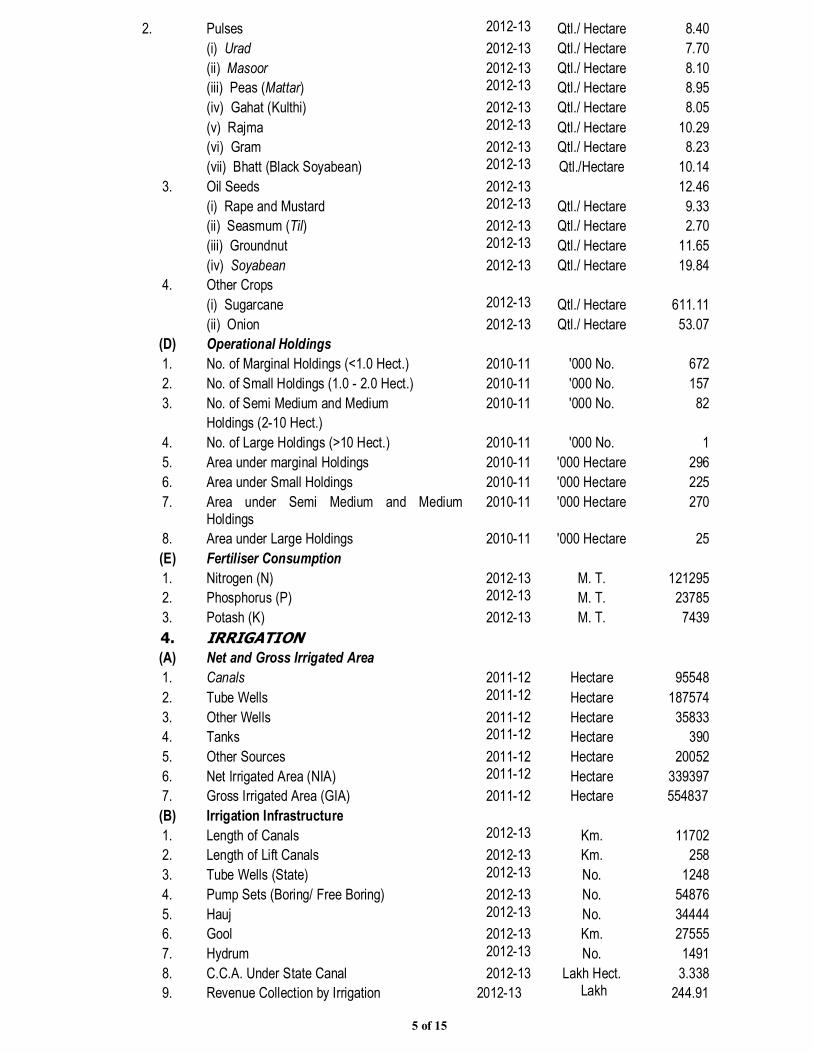
2. Pulses 2012-13 Qtl./ Hectare 8.40 (i) Urad 2012-13 Qtl./ Hectare 7.70 (ii) Masoor 2012-13 Qtl./ Hectare 8.10 (iii) Peas (Mattar) 2012-13 Qtl./ Hectare 8.95 (iv) Gahat (Kulthi) 2012-13 Qtl./ Hectare 8.05 (v) Rajma 2012-13 Qtl./ Hectare 10.29 (vi) Gram 2012-13 Qtl./ Hectare 8.23 (vii) Bhatt (Black Soyabean) 2012-13 Qtl./Hectare 10.14
3. Oil Seeds 2012-13 12.46 (i) Rape and Mustard 2012-13 Qtl./ Hectare 9.33 (ii) Seasmum (Til) 2012-13 Qtl./ Hectare 2.70 (iii) Groundnut 2012-13 Qtl./ Hectare 11.65 (iv) Soyabean 2012-13 Qtl./ Hectare 19.84
4. Other Crops (i) Sugarcane 2012-13 Qtl./ Hectare 611.11 (ii) Onion 2012-13 Qtl./ Hectare 53.07
(D) Operational Holdings 1. No. of Marginal Holdings (<1.0 Hect.) 2010-11 '000 No. 672 2. No. of Small Holdings (1.0 - 2.0 Hect.) 2010-11 '000 No. 157 3. No. of Semi Medium and Medium
Holdings (2-10 Hect.) 2010-11 '000 No. 82
4. No. of Large Holdings (>10 Hect.) 2010-11 '000 No. 1 5. Area under marginal Holdings 2010-11 '000 Hectare 296 6. Area under Small Holdings 2010-11 '000 Hectare 225 7. Area under Semi Medium and Medium
Holdings 2010-11 '000 Hectare 270
8. Area under Large Holdings 2010-11 '000 Hectare 25 (E) Fertiliser Consumption 1. Nitrogen (N) 2012-13 M. T. 121295 2. Phosphorus (P) 2012-13 M. T. 23785 3. Potash (K) 2012-13 M. T. 7439 4. IRRIGATION (A) Net and Gross Irrigated Area 1. Canals 2011-12 Hectare 95548 2. Tube Wells 2011-12 Hectare 187574 3. Other Wells 2011-12 Hectare 35833 4. Tanks 2011-12 Hectare 390 5. Other Sources 2011-12 Hectare 20052 6. Net Irrigated Area (NIA) 2011-12 Hectare 339397 7. Gross Irrigated Area (GIA) 2011-12 Hectare 554837 (B) Irrigation Infrastructure 1. Length of Canals 2012-13 Km. 11702 2. Length of Lift Canals 2012-13 Km. 258 3. Tube Wells (State) 2012-13 No. 1248 4. Pump Sets (Boring/ Free Boring) 2012-13 No. 54876 5. Hauj 2012-13 No. 34444 6. Gool 2012-13 Km. 27555 7. Hydrum 2012-13 No. 1491 8. C.C.A. Under State Canal 2012-13 Lakh Hect. 3.338 9. Revenue Collection by Irrigation 2012-13 Lakh 244.91

6 of 15
5. LIVESTOCK AND POULTRY
(A) Veterinary Services 1. Infrastructure (i) Veterinary Hospitals 2012-13 No. 308 (ii) 'D' Category Veterinary Hospitals 2012-13 No. 12 (iii) Livestock Centres 2012-13 No. 744 (iv) A. I. Centres/Sub Centres 2012-13 No. 658
(B) Livestock 1. ¼A½ Cattle 2007 No. 2235116 (i) Indigenous 2007 No. 1895689 (ii) Exotic and crossbreed 2007 No. 339427 (B) Buffalo 2007 No. 1219518
2. Yak 2007 No. 50 3. Other Livestock (i) Sheep (Desi & Cross Breed ) 2007 290411 (ii) Goats 2007 No. 1335306 (iii) Horses, Mules, Ponnies, Donkeys and
camel 2007 No. 40788
(iv) Pig (Desi & Cross Breed ) 2007 No. 19822 (v) Other Animals (Dogs & Rabbits) 2007 No. 256958
4. Total Livestock [Excluding cat. 3 (v)] 2007 No. 5141011 (C) Poultry 2007 2601852 1. Hen/ Cock/ Chicks 2007 No. 643430 2. Other Birds 2007 No. 1958422 6. FISHERIES
1. Departmental Fish Farms 2012-13 No. 10 2. (i) Fish Production 2012-13 '000 M.T. 3.889 (ii) Value of Production 2012-13 ` Lakh 3950.29
3. Production of Fish Seed 2012-13 ` Lakh 428.31 7. HORTICULTURE
(A) Horticulture Services 1. Infrastructure (i) Horticulture Mobile Teams 2012-13 No. 285 (ii) Fruit Preservation Centres 2012-13 No. 49 (iii) State Nurseries/Orchards 2012-13 No. 95
(B) Coverage and Production 1. Fruits (i) Area 2012-13 Hectare 200851 (ii) Production 2012-13 M.T. 805668
2. Vegetables (i) Area 2012-13 Hectare 62993 (ii) Production 2012-13 M.T. 625127
3. Potato (i) Area 2012-13 Hectare 25040 (ii) Production 2012-13 M.T. 434444 (iii) Productivity 2012-13 M.T./Hectare 17.35

7 of 15
8.
SERI CULTURE
1. Government Sericulture Farms (i) Farms 2012-13 No. 72 (ii) Area 2012-13 Acre. 502
2. Mulberry Plantation (i) In Government Farms 2012-13 Thousand 36.45 (ii) In private Farms 2012-13 Thousand 37.95
3. Cocoon Production 2012-13 Kg. 129966
9. INDUSTRY (A) Rural and Small Scale Industries 1. Khadi Udhyog/Gramodhyog Units 2012-13 No. 447 2. Small Scale Industries (SSIs) 2012-13 No. 42340 3. Total Employees of Khadi Units 2012-13 No. 3853 4. Total Employees of SSIs 2012-13 No. 196004 (B) Factories[Regd. under Factories Act, 1948-
Section 2M(I) and 2M( II)] (Provisnal)
1. No. of Factories 2012-13 No. 2843 2. No of Workers 2012-13 No. 273464 3. Total Persons Engaged 2012-13 No. 342385 4. Value of Product & by Product 2012-13 ` Lakh 13604253 5. Net Value Added 2012-13 ` Lakh 3064360 6. Value of Output 2012-13 ` Lakh 14474752 7. Gross Fixed Capital Formation 2012-13 ` Lakh 1015110 8. Profits 2012-13 ` Lakh 2187389
10. EDUCATION (A) Basic/ Secondary Education 1. No. of Schools/ Colleges 2012-13 No. 23713 (i) Junior Basic 2012-13 No. 15945 (ii) Senior Basic 2012-13 No. 4546 (iii) High School/ Intermediate 2012-13 No. 3222
2. No. of Students 2012-13 No. 2326547 (i) Junior Basic 2012-13 No. 822344 (ii) Senior Basic 2012-13 No. 353813 (iii) High School/ Intermediate 2012-13 No. 1150390
3. No. of Teachers 2012-13 No. 90311 (i) Junior Basic 2012-13 No. 39823 (ii) Senior Basic 2012-13 No. 19148 (iii) High School/ Intermediate 2012-13 No. 31340
(B) Higher Education 1. No. of Institutions 2012-13 No. 129 (i) Degree/Post Degree Colleges 2012-13 No. 107 (ii) Central Universities 2012-13 No. 01 (iii) State Universities 2012-13 No. 09 (iv) Private Universities 2012-13 No. 06 (v) Deemed Universities 2012-13 No. 04 (vi) Indian Institute of Technology (Central
University) 2012-13 No. 01
(vii) Agriculture & Technology Univ. 2012-13 No. 01
8 of 15
2.
No. of Students
2012-13
No.
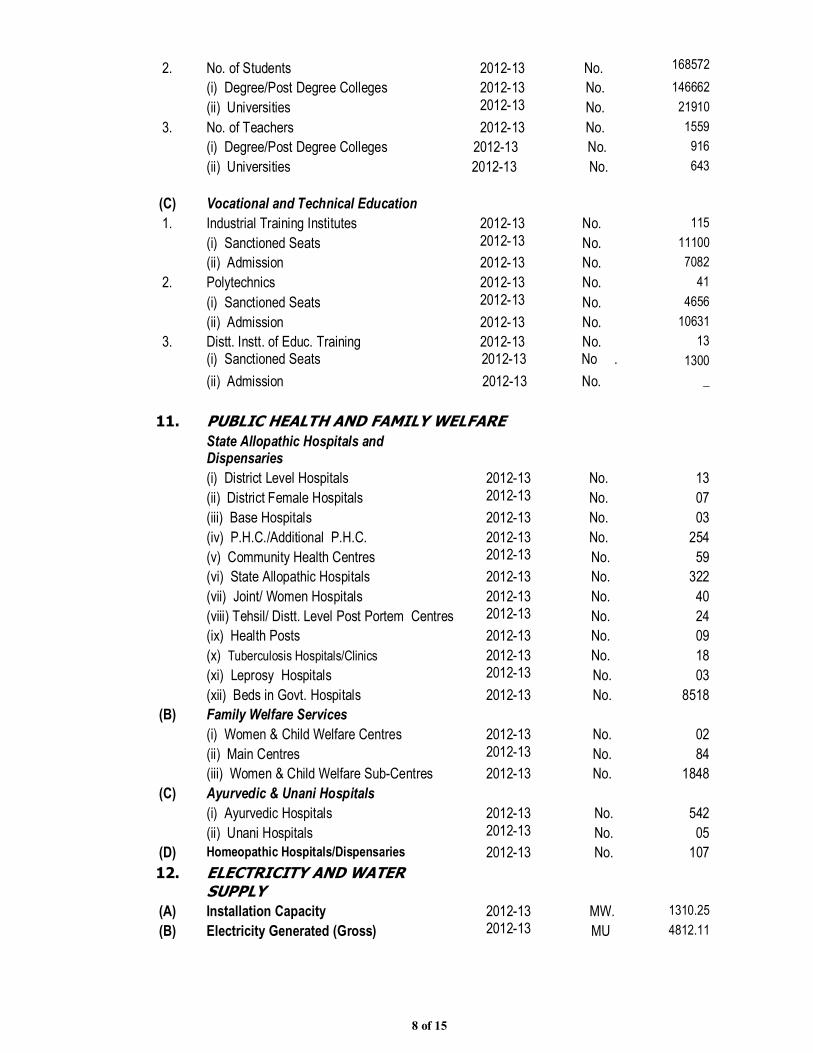
168572 (i) Degree/Post Degree Colleges 2012-13 No. 146662 (ii) Universities 2012-13 No. 21910
3. No. of Teachers 2012-13 No. 1559 (i) Degree/Post Degree Colleges 2012-13 No. 916 (ii) Universities 2012-13
No. 643
(C) Vocational and Technical Education 1. Industrial Training Institutes 2012-13 No. 115 (i) Sanctioned Seats 2012-13 No. 11100 (ii) Admission 2012-13 No. 7082
2. Polytechnics 2012-13 No. 41 (i) Sanctioned Seats 2012-13 No. 4656 (ii) Admission 2012-13 No. 10631
3. Distt. Instt. of Educ. Training 2012-13 No. 13 (i) Sanctioned Seats 2012-13 No . 1300 (ii) Admission 2012-13 No.
_
11. PUBLIC HEALTH AND FAMILY WELFARE State Allopathic Hospitals and Dispensaries
(i) District Level Hospitals 2012-13 No. 13 (ii) District Female Hospitals 2012-13 No. 07 (iii) Base Hospitals 2012-13 No. 03 (iv) P.H.C./Additional P.H.C. 2012-13 No. 254 (v) Community Health Centres 2012-13 No. 59 (vi) State Allopathic Hospitals 2012-13 No. 322 (vii) Joint/ Women Hospitals 2012-13 No. 40 (viii) Tehsil/ Distt. Level Post Portem Centres 2012-13 No. 24 (ix) Health Posts 2012-13 No. 09 (x) Tuberculosis Hospitals/Clinics 2012-13 No. 18 (xi) Leprosy Hospitals 2012-13 No. 03 (xii) Beds in Govt. Hospitals 2012-13 No. 8518
(B) Family Welfare Services (i) Women & Child Welfare Centres 2012-13 No. 02 (ii) Main Centres 2012-13 No. 84 (iii) Women & Child Welfare Sub-Centres 2012-13 No. 1848
(C) Ayurvedic & Unani Hospitals (i) Ayurvedic Hospitals 2012-13 No. 542 (ii) Unani Hospitals 2012-13 No. 05
(D) Homeopathic Hospitals/Dispensaries 2012-13 No. 107 12. ELECTRICITY AND WATER
SUPPLY
(A) Installation Capacity 2012-13 MW. 1310.25 (B) Electricity Generated (Gross) 2012-13 MU 4812.11

9 of 15
(C)
Length of Lines
(i) 400 KV 2012-13 Km. 388 (ii) 220 KV 2012-13 Km. 769 (iii) 132 KV 2012-13 Km. 1803 (iv) 33 KV 2012-13 Km. 4199.35 (v) 11 KV 2012-13 Km. 36191.77 (vi) LT 2012-13 Km. 51741.99
(D) Electricity Consumption (i) Domestic 2012-13 M.U.Watt. 1967.11 (ii) Commercial 2012-13 M.U.Watt. 953.94 (iii) Industrial 2012-13 M.U.Watt. 4884.88 (iv) Street Lighting 2012-13 M.U.Watt. 69.83 (v) Agriculture 2012-13 M.U.Watt. 257.63 (vi) Water Works/Waste Disposal 2012-13 M.U.Watt. 442.83
(E) Rural Electrification 1. Electrified Inhabited Revenue Villages (i) Uttarakhand Power Corporation 2012-13 No. 15293 (ii) UREDA 2012-13 No. 341
2. Energised Pump Sets/ Tube Wells 2012-13 No. 25319 3. Kuteer Jyoti Connections 2012-13 No. 281954 (F) Drinking Water Supply 1. Inhabited Revenue Villages Covered 2012-13 No. 15544 2. Population Covered 2012-13 No. Lakh 63.24 (i) Fully Covered 2012-13 No. Lakh 54.35 (ii) Partially Covered 2012-13 No. Lakh 8.89
3. Scarcity Villages 2012-13 No. 2 4. Scarcity Hamlets (i) Not Covered (N.C.) 2012-13 No. 1750 (ii) Partially Covered (P.C.) 2012-13 No. 5995
5. Hand Pump Installed by (i) Jal Nigam 2012-13 No. 29062 (ii) Jal Sansthan 2012-13 No. 8896
6. “Uttarakhand Koop” installed by 2012-13 Jal Sansthan
No. 1792
13. TRANSPORT AND COMMUNICATION (A) Motor Roads Maintained by PWD
(i) National Highways 2012-13 Km. 1375.76 (ii) State Highways 2012-13 Km. 3788.20 (iii) Major District Roads 2012-13 Km. 3289.74 (iv) Other District Roads 2012-13 Km. 2945.04 (v) Rural Roads 2012-13 Km. 15436.89 (vi) L.V. Roads 2012-13 Km. 858.23
(B) Motor Roads Maintained by BRTF (i) Total Length of roads 2012-13 Km. 1281.32

10 of 15
(C)
Motor Roads Maintained by Local Bodies
(i) District Panchayats (ii) Urban Local Bodies & Others
2012-13 2012-13
Km. 862.45 Km. 2040.23
(D) Roads Maintained by Other Departments (i) Irrigation 2012-13 Km. 741 (ii) Cane Development 2012-13 Km. 899.61 (iii) Forest 2012-13 Km. 3257 (iv) Others (U.M.P & P.M.G.S.Y) 2012-13
Km. 1906.31
(E) Postal and Communication Services (i) Post Offices 2012-13 No. 2719 (ii) Telephone Exchanges 2012-13 No. 476 (iii) Telegraph Offices 2012-13 No. 2
(iv) PCOs 2012-13 No. 7052 (v) Telephone Connections
(Including WLL) by BSNL 2012-13 No. 245265
(vi) Mobile phone by BSNL 2012-13 No. 1326391 14. FOREST AND WILDLIFE (A) Classification of Forest Area According to
Legal Status
1. Reserved Forests 2012-13 Sq. Km. 24643 (a) Reserved Forests under the Control/
Management of Forest Department 2012-13 Sq. Km. 24261
(b) Reserved Forests which is Completely Recorded in Van Panchayats
2012-13 Sq. Km. 348
(c) Reserved Forests under the Control/ Management of other Government Agencies
2012-13 Sq.Km. 34
2. Protected Forests 2012-13 Sq. Km. 9885 (a) Protected Forests Under the Control/
Management of Forest Department 2012-13 Sq.Km 99
(b Unclassified and Vasted Forests under the control/Management of Forest Department, which have Legal Status of Protected Forest
2012-13 Sq.Km 55
(c) Civil and Soyam Forests Under the Control of Revenue Department
2012-13 Sq.km 4769
(d) Under the Control of Forest 2012-13 Panchayats as Village Forests
Sq.Km 4962
3. Private Forest (Municipal & Cantonment etc.) 2012-13
Sq. Km. 124
(B) Growing Stock & Forest Produce Statistics 1. Estimated Growing Stock 2012-13 ‘000 Cu. m. 206192 2. Timber Production 2012-13 Cu. m. Round 116532 3. Fire Wood Production 2012-13 Cu. m. Stack 17667 4. Resin (NTFP) Production 2012-13 Quintals 146734 (C) Wildlife 1. National Park (i) Number 2012-13 No. 6 (ii) Area 2012-13 Sq. Km. 4915

11 of 15
2.
Wildlife Sanctuary
(i) Number 2012-13 No. 7 (ii) Area 2012-13 Sq. Km. 2690
3. Important Wild Animals (i) Tiger 2008 No. 178 (ii) leopard 2008 No. 2335 (iii) Elephant 2008 No. 1346 (iv) Musk Deer 2008 No. 376 (v) Black Bear 2008 No. 1935 (vi) Sloth Bear 2008 No. 172 ¼vii) Brown Bear 2008 No. 14
15. TOURISM (A) Infrastructure
1. Tourist Places 2012-13 No. 278
2. Tourist Rest Houses 2012-13 No. 185 3. Raien Basera (Night Shelters) 2012-13 No. 36
4. Beds in T.R.H. 2012-13 No. 6857 5. Beds in Raien Basera 2012-13 No. 1960
6. Hotels & paying guest Houses (as on 31-12-2012)
2012-13 No. 3676
7. Dhramshala (as on 31-12-2012) 2012-13 No. 864 (B) Tourist Arrival
1. In Tourist Places (including Pilgrims) 2013 No. Lakh 201.15 (i) Indian Tourist 2013 No. Lakh 200.25 (ii) Foreign Tourist 2013 No. Lakh 0.90
2. In Important National Parks and Wild Life Sanctuaries
2012-13 No. 292501
(i) Indian Tourist 2012-13 No. 281232 (ii) Foreign Tourist 2012-13 No. 11269
16. EMPLOYMENT (A) Employment Statistics 1. Employment Exchanges 2012-13 No. 24 2. Registrations during the Year 2012-13 No. 161046 3. Employed during the Year 2012-13 No. 1219 4. No. of Unemployed Persons Registered in Live
Register as on 31.03.2012 2012-13 No. 710837
5. Total State Govt. Employees 2012-13 No. 145630 17. BANKING
(A) Number of Bank Branches 2012-13 No. 1783 1. Nationalised Bank 2012-13 No. 1175 2. Regional Rural Bank 2012-13 No. 238 3. Other Private Banks 2012-13 No. 135 4. Distt. Co-operative Bank 2012-13 No. 10 5. Branches of Co-operative Bank 2012-13 No. 225 (B) Credit-Deposit & C:D Ratio of all Banks 1. Deposits 2012-13 `Crore 62714 2. Advances 2012-13 `Crore 34089

12 of 15
3.
C.D. Ratio
2012-13
Percentage
54 4. Loan Disbursement in Priority Sector 2012-13 ` Crore 11387 (i) Agri. and Allied Services 2012-13 ` Crore 5489 (ii) Small Scale Industries & Others 2012-13 ` Crore 5898
5. Advances to Weaker Section 2012-13 ` Crore 7146 18. STATE DOMESTIC PRODUCT (A) Gross State Domestic Product (Quick) 1. At Current Prices 2012-13 `Lakh 11395790 (i) Primary Sector 2012-13 ` Lakh 1634148 (ii) Secondary Sector 2012-13 ` Lakh 4054290 (iii) Tertiary Sector 2012-13 ` Lakh 5707352
2. Per Capita GSDP 2012-13 ` 112086 (B) Net State Domestic Product (Quick) 1. At Current Prices 2012-13 ` Lakh 9915688 (i) Primary Sector 2012-13 ` Lakh 1473140 (ii) Secondary Sector 2012-13 `Lakh 3106660 (iii) Tertiary Sector 2012-13 `Lakh 5335888
2. Per Capita NSDP 2012-13 ` 97528 (C) Gross State Domestic Product at Constant
Prices (2004-05) 2010-11 ` Lakh 5566689
(provisional)) 2011-12 `Lakh 6086991
(Quick)
2012-13 ` Lakh 6635599
(D) Annual Growth Rate 2010-11 Percentage 10.02 (Provisional) 2011-12 Percentage 9.35 (Quick) 2012-13 Percentage 9.01
19. FIFTH ECONOMIC CENSUS (A) Establishments
Total 2005 No. 325157 (i) Rural 2005 No. 198736 (ii) Urban 2005 No. 126421
(B) Own Account Establishments Total 2005 No. 220729 (i) Agriculture 2005 No. 28585 (ii) Non-Agriculture 2005 No. 192144
(C) Establishments at Least One Hired Worker Total 2005 No. 104428 (i) Agriculture 2005 No. 3295 (ii) Non-Agriculture 2005 No. 101133
(D) (1) Agricultural Establishments Total 2005 No. 31880 (i) Rural 2005 No. 30001 (ii) Urban 2005 No. 1879 (2) Non-Agricultural Establishments Total 2005 No. 293277 (i) Rural 2005 No. 168735 (ii) Urban 2005 No. 124542
13 of 15
(E)
PersonsUsually Working in Establishments
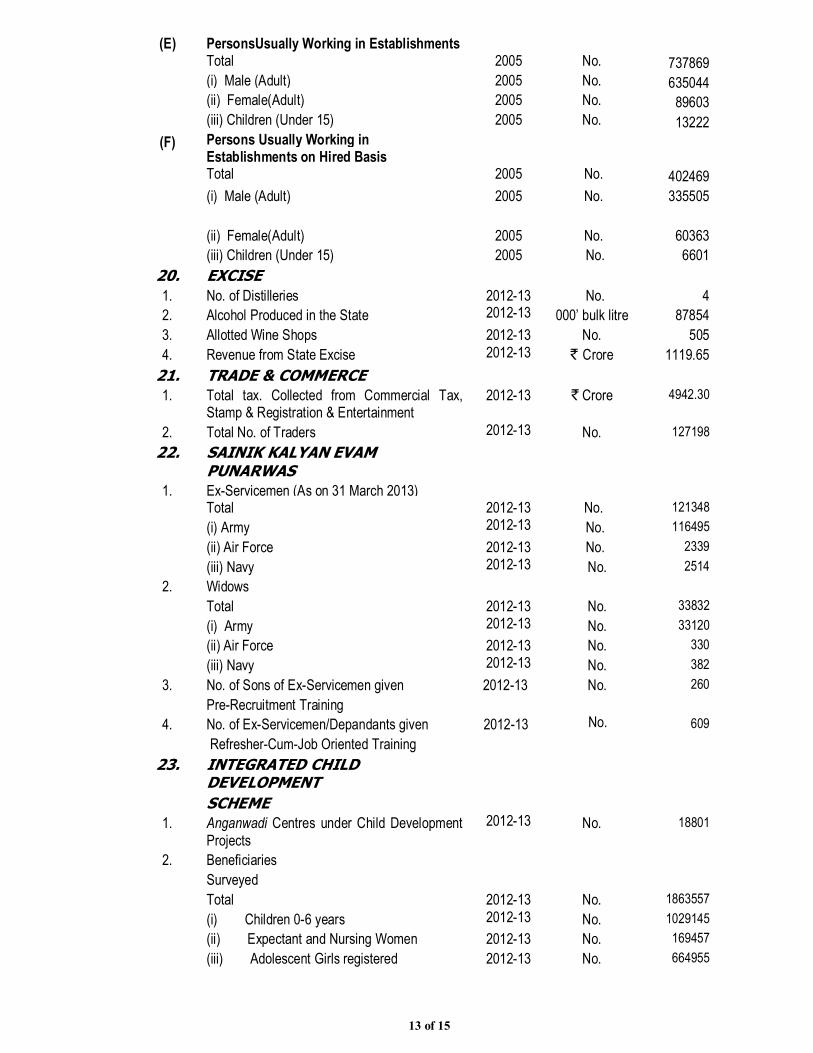
Total 2005 No. 737869 (i) Male (Adult) 2005 No. 635044 (ii) Female(Adult) 2005 No. 89603 (iii) Children (Under 15) 2005 No. 13222
(F) Persons Usually Working in Establishments on Hired Basis
Total 2005 No. 402469 (i) Male (Adult) 2005 No. 335505
(ii) Female(Adult) 2005 No. 60363 (iii) Children (Under 15) 2005 No. 6601
20. EXCISE 1. No. of Distilleries 2012-13 No. 4 2. Alcohol Produced in the State 2012-13 000’ bulk litre 87854 3. Allotted Wine Shops 2012-13 No. 505 4. Revenue from State Excise 2012-13 ` Crore 1119.65
21. TRADE & COMMERCE 1. Total tax. Collected from Commercial Tax,
Stamp & Registration & Entertainment 2012-13 ` Crore 4942.30
2. Total No. of Traders 2012-13 No. 127198 22. SAINIK KALYAN EVAM
PUNARWAS
1. Ex-Servicemen (As on 31 March 2013) Total 2012-13 No. 121348 (i) Army 2012-13 No. 116495 (ii) Air Force 2012-13 No. 2339 (iii) Navy 2012-13 No. 2514
2. Widows Total 2012-13 No. 33832 (i) Army 2012-13 No. 33120 (ii) Air Force 2012-13 No. 330 (iii) Navy 2012-13 No. 382
3. No. of Sons of Ex-Servicemen given 2012-13 Pre-Recruitment Training
No. 260
4. No. of Ex-Servicemen/Depandants given 2012-13 Refresher-Cum-Job Oriented Training
No. 609
23. INTEGRATED CHILD DEVELOPMENT SCHEME
1. Anganwadi Centres under Child Development Projects
2012-13 No. 18801
2. Beneficiaries Surveyed Total 2012-13 No. 1863557 (i) Children 0-6 years 2012-13 No. 1029145 (ii) Expectant and Nursing Women 2012-13 No. 169457 (iii) Adolescent Girls registered 2012-13 No. 664955

14 of 15
Registered Total 2012-13 No. 1122974 (i) Children 0-6 years 2012-13 No. 856142 (ii) Expectant and Nursing Women 2012-13 No. 168968 (iii) Adolescent Girls registered 2012-13 No. 97864
24. FOOD AND CIVIL SUPPLY 1. Distribution of Essential Commodities (i) Petrol 2012-13 Kilo lts. 271884.53 (ii) Diesel 2012-13 Kilo lts. 621623.77 (iii) Kerosene Oil 2012-13 Kilo lts. 32594.81 (iv) LPG Gas 2012-13 M.T. 378214.45 (v) Levy Sugar 2012-13 M.T. 63001.77
25. UTTARAKHAND RENEWABLE
ENERGY DEVELOPMENT AGENCY (UREDA)
1. Community Solar Cooker 2012-13 No. 600 2. Improved Gharat 2012-13 No. 300 3. Solar Photo Programme (i) Solar Lantern 2012-13 No. 360 (ii) Solar Light-Street 2012-13 No. 465 (iii) Solar Power Plant 2012-13 No. 514
26. YOUTH WELFARE AND PRANTIYA RAKSHAK DAL
1. Mahila Mangal Dal (Operational) 2012-13 No. 4631 2. Yuvak Mangal Dal (Operational) 2012-13 No. 5083 3. Vyayamshalas 2012-13 No. 34 4. Youth Hostels 2012-13 No. 3
27. RURAL DEVELOPMENT A Rural Poverty (BPL Census 2002)
(I) Families Below Poverty Line 2002 No. 620608 (II) Percentage Of Families Below Poverty
Line 2002 Percentage
43.86 B Swarn Jayanti Gram Swarojgar Yojna
(i) Self Help Groups Formed (As on 31-03-2013)
2012-13 No. 42396
(iii) Self Help Groups Financed by the Banks Since the Inception of the Scheme
2012-13 No. 18259
C Indira Awas Yojna (i) Construction of Houses During the Year 2012-13 No. 13802
D Mahatma Gandhi Rural Employment Guarantee Scheme (i) Employment Generation since the
inception of the scheme
2012-13
Lakh Man Days.
1011.87

15 of 15
¤¤¤¤¤¤¤
28.
SOCIAL WELFARE
A Distribution of Scholarships 1. Scheduled Castes (i) Students 2012-13 No. 498128
(ii) Amount 2012-13 ` Lakh 9438.06 2.
Scheduled Tribes (i) Students (ii) Amount
2012-13 2012-13
No.
` Lakh
80302
2811.56 3. Other Backward Classes
(i) Students 2012-13 No. 67721 (ii) Amount 2012-13 ` Lakh 1562.34
4. Handicapped (i) Students 2012-13 No. 3767 (ii) Amount 2012-13 ` Lakh 35.32
B Distribution of Pension 1. Old Age (i) Pensioners 2012-13 No. 325365 (ii) Amount 2012-13 ` Lakh 15970.75 2 Handicapped (i) Pensioners 2012-13 No. 52417 (ii) Amount 2012-13 ` Lakh 3823.01
3. Widows (i) Pensioners 2012-13 No. 107690 (ii) Amount 2012-13 ` Lakh 5041.56