Utilizzo delle immagini satellitari a supporto delle ... · Utilizzo delle immagini satellitari a...
9
Utilizzo delle immagini satellitari a supporto delle attività di gestione degli incendi boschivi Prof. Giovanni Laneve, Lorenzo Fusilli, Pablo Marzialetti, Roberto Luciani [email protected] [email protected] Workshop del Tavolo Copernicus Agricoltura e Foreste Il satellite a servizio delle foreste Servizi di monitoraggio satellitare per la tutela e la valorizzazione delle risorse forestali Sala Polifunzionale – Presidenza del Consiglio dei Ministri Via di Santa Maria in Via, 37b - Roma Roma 28/02/2018
Transcript of Utilizzo delle immagini satellitari a supporto delle ... · Utilizzo delle immagini satellitari a...
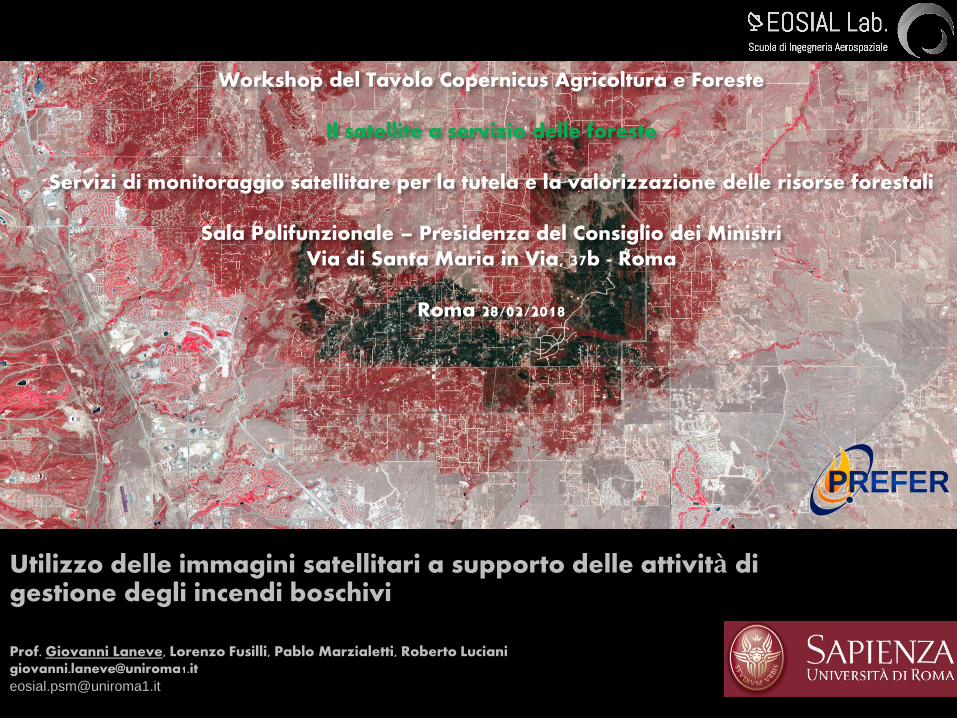
Utilizzo delle immagini satellitari a supporto delle attività di gestione degli incendi boschivi
Prof. Giovanni Laneve, Lorenzo Fusilli, Pablo Marzialetti, Roberto Luciani [email protected]
Workshop del Tavolo Copernicus Agricoltura e Foreste
Il satellite a servizio delle foreste
Servizi di monitoraggio satellitare per la tutela e la valorizzazione delle risorse forestali
Sala Polifunzionale – Presidenza del Consiglio dei MinistriVia di Santa Maria in Via, 37b - Roma
Roma 28/02/2018
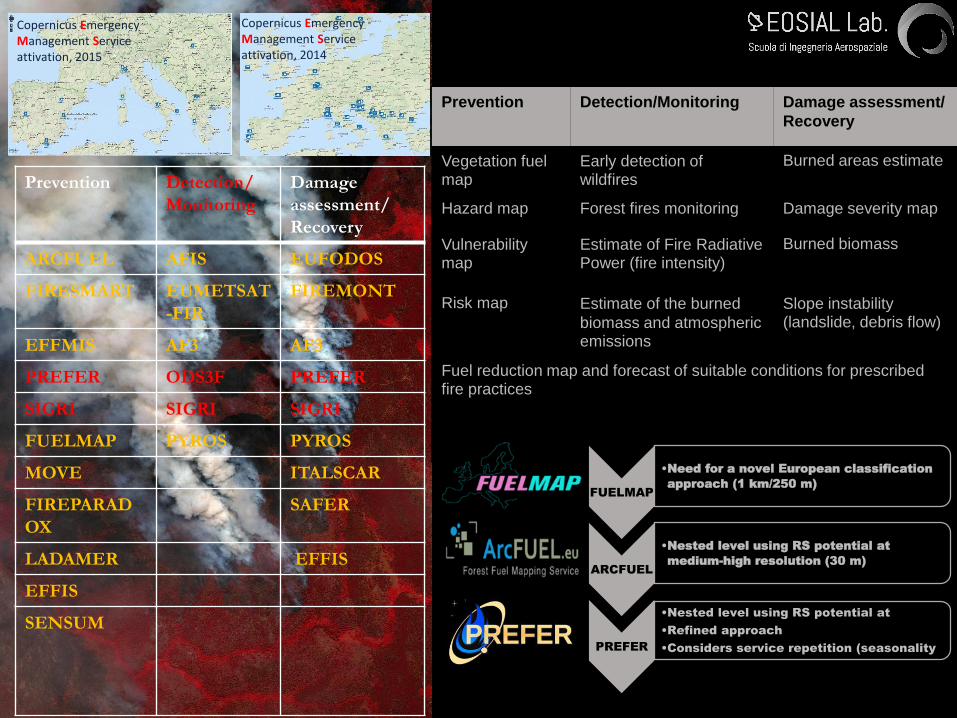
Prevention Detection/Monitoring Damage assessment/
Recovery
Vegetation fuel map
Early detection of wildfires
Burned areas estimate
Hazard map Forest fires monitoring Damage severity map
Vulnerability map
Estimate of Fire RadiativePower (fire intensity)
Burned biomass
Risk map Estimate of the burned
biomass and atmospheric emissions
Slope instability (landslide, debris flow)
Fuel reduction map and forecast of suitable conditions for prescribed fire practices
FUELMAP
•Need for a novel European classification
approach (1 km/250 m)
ARCFUEL
•Nested level using RS potential at
medium-high resolution (30 m)
PREFER
•Nested level using RS potential at
•Refined approach
•Considers service repetition (seasonality)
Prevention Detection/
Monitoring
Damage
assessment/
Recovery
ARCFUEL AFIS EUFODOS
FIRESMART EUMETSAT
-FIR
FIREMONT
EFFMIS AF3 AF3
PREFER ODS3F PREFER
SIGRI SIGRI SIGRI
FUELMAP PYROS PYROS
MOVE ITALSCAR
FIREPARAD
OX
SAFER
LADAMER EFFIS
EFFIS
SENSUM
Copernicus Emergency Management Service attivation, 2015
Copernicus Emergency Management Service attivation, 2014
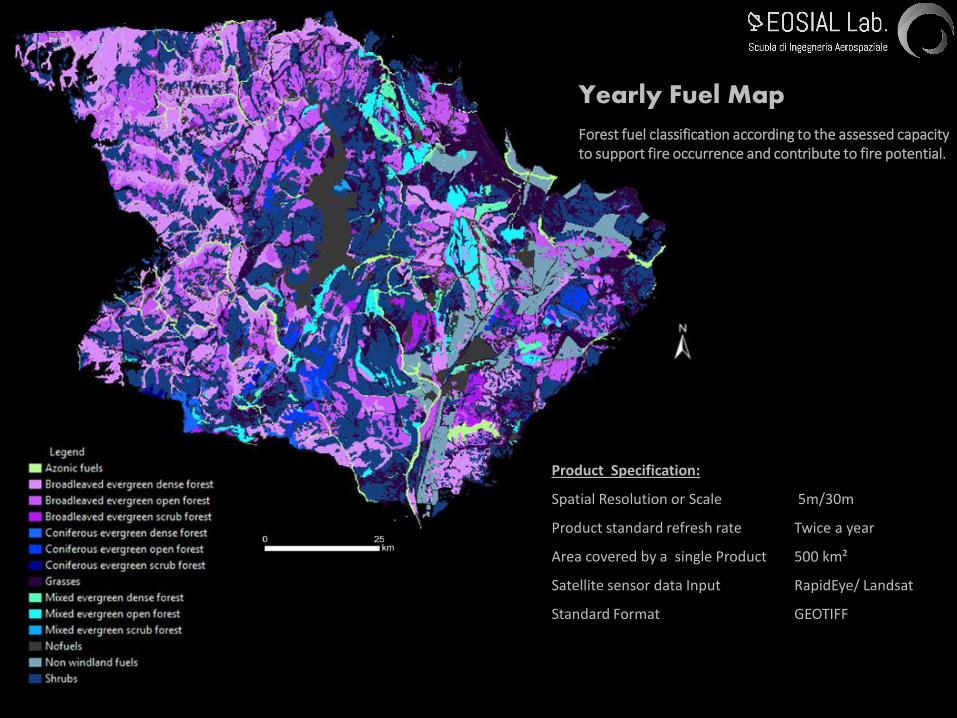
Forest fuel classification according to the assessed capacity to support fire occurrence and contribute to fire potential.
Product Specification:
Spatial Resolution or Scale 5m/30m
Product standard refresh rate Twice a year
Area covered by a single Product 500 km²
Satellite sensor data Input RapidEye/ Landsat
Standard Format GEOTIFF
Yearly Fuel Map
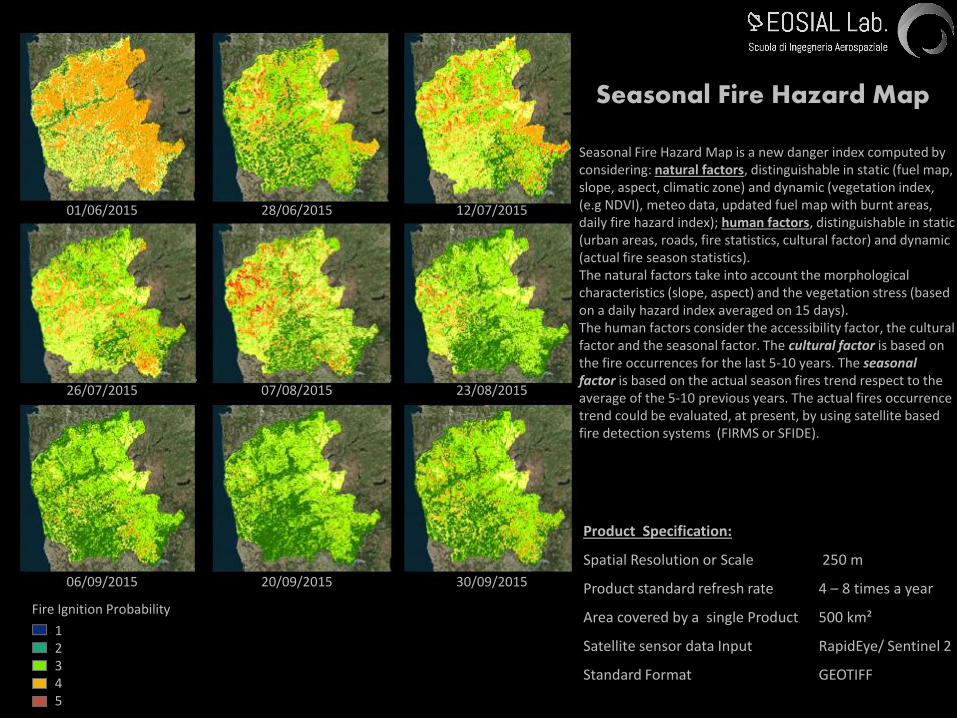
Seasonal Fire Hazard Map
Seasonal Fire Hazard Map is a new danger index computed by considering: natural factors, distinguishable in static (fuel map, slope, aspect, climatic zone) and dynamic (vegetation index, (e.g NDVI), meteo data, updated fuel map with burnt areas, daily fire hazard index); human factors, distinguishable in static (urban areas, roads, fire statistics, cultural factor) and dynamic (actual fire season statistics).The natural factors take into account the morphological characteristics (slope, aspect) and the vegetation stress (based on a daily hazard index averaged on 15 days). The human factors consider the accessibility factor, the cultural factor and the seasonal factor. The cultural factor is based on the fire occurrences for the last 5-10 years. The seasonal factor is based on the actual season fires trend respect to the average of the 5-10 previous years. The actual fires occurrence trend could be evaluated, at present, by using satellite based fire detection systems (FIRMS or SFIDE).
Product Specification:
Spatial Resolution or Scale 250 m
Product standard refresh rate 4 – 8 times a year
Area covered by a single Product 500 km²
Satellite sensor data Input RapidEye/ Sentinel 2
Standard Format GEOTIFF
01/06/2015 28/06/2015 12/07/2015
26/07/2015 07/08/2015 23/08/2015
20/09/2015 30/09/2015
12345
Fire Ignition Probability
06/09/2015
Daily Fire Hazard Map provides a medium spatial
resolution fire danger index for the present day and
the following two. The index is based on MODIS
images, and meteorological data acquired daily and
on another PREFER product (fuel map).
Product Specification:
Spatial Resolution or Scale 250 m
Product standard refresh rate Daily
Area covered single Product Regional scale
Satellite sensor data Input MODIS
Standard Format GEOTIFF
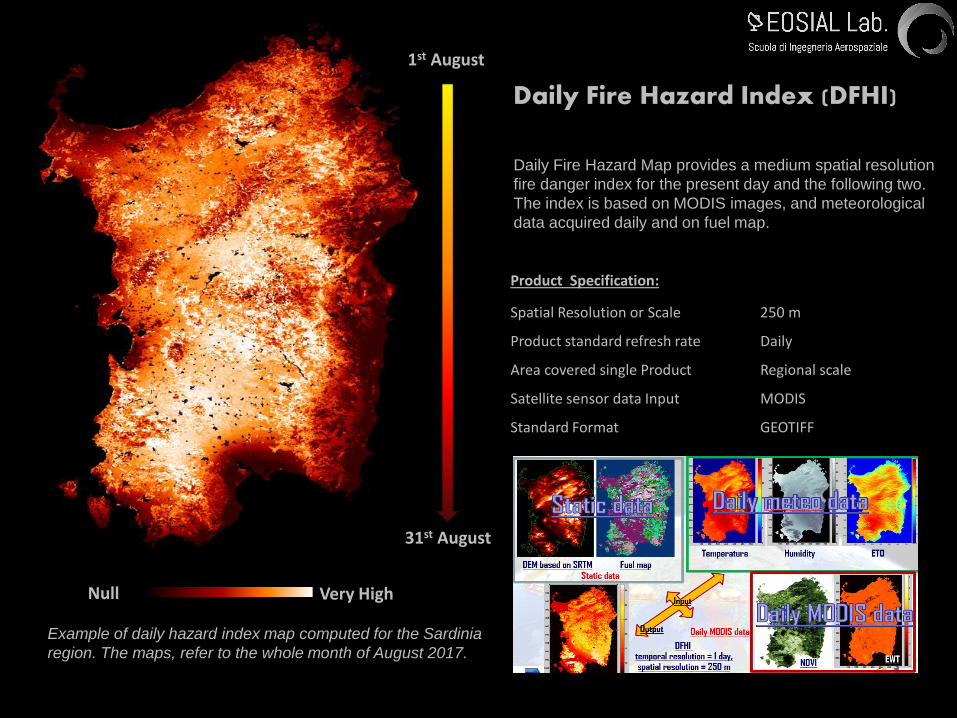
Example of daily hazard index map computed for the Sardinia
region. The maps, refer to the whole month of August 2017.
Very High
1st August
31st August
Null
Daily Fire Hazard Map provides a medium spatial resolution
fire danger index for the present day and the following two.
The index is based on MODIS images, and meteorological
data acquired daily and on fuel map.
Daily Fire Hazard Index (DFHI)
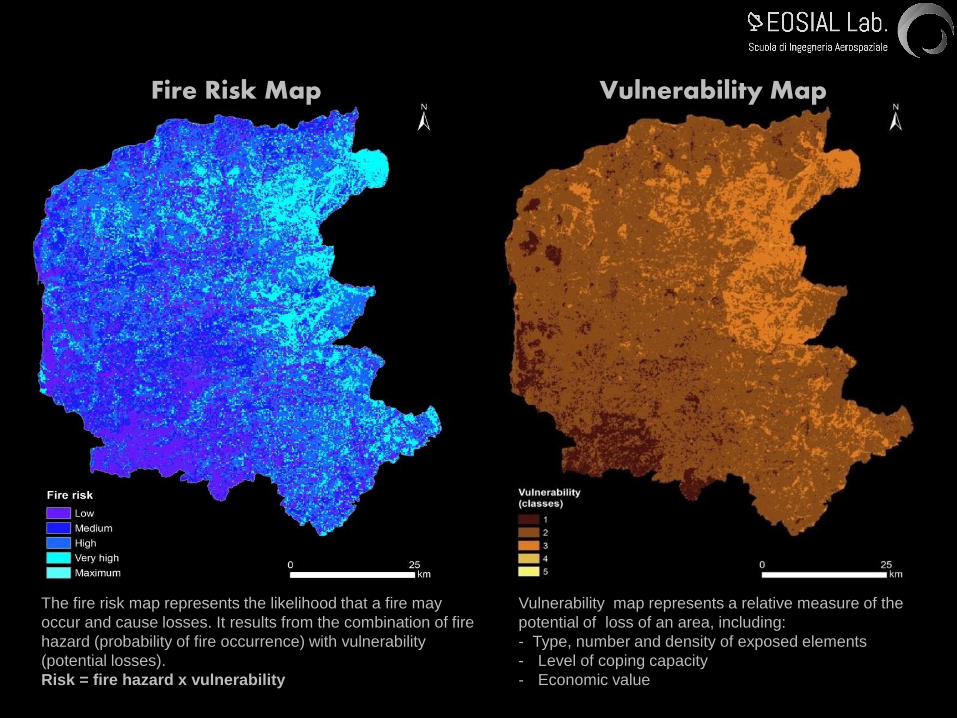
Vulnerability MapFire Risk Map
The fire risk map represents the likelihood that a fire may
occur and cause losses. It results from the combination of fire
hazard (probability of fire occurrence) with vulnerability
(potential losses).
Risk = fire hazard x vulnerability
Vulnerability map represents a relative measure of the
potential of loss of an area, including:
- Type, number and density of exposed elements
- Level of coping capacity
- Economic value
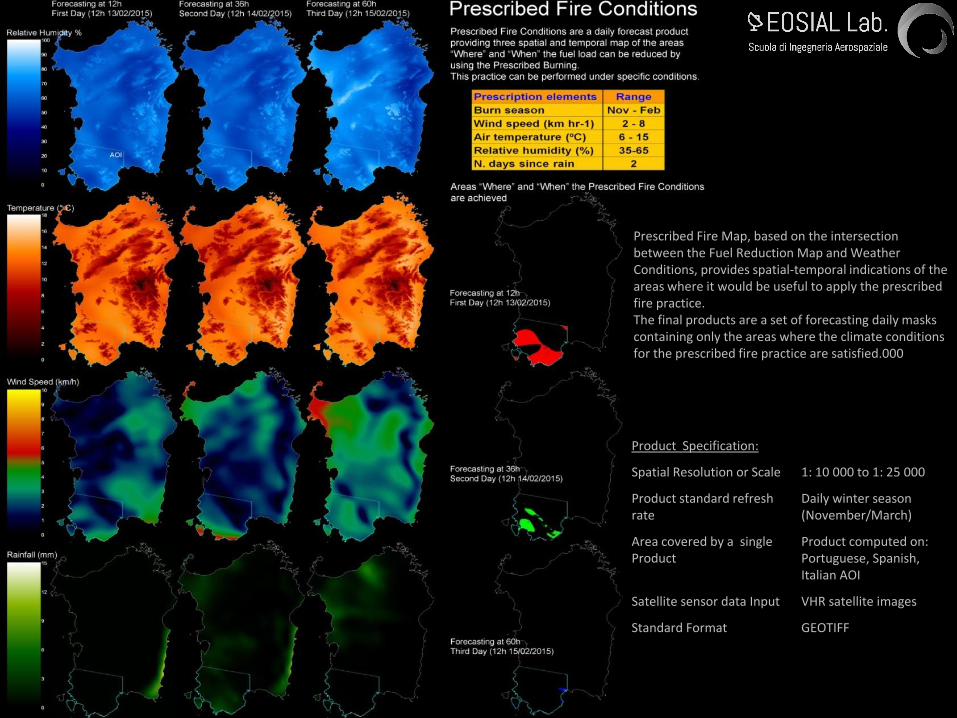
Prescribed Fire Map, based on the intersection between the Fuel Reduction Map and Weather Conditions, provides spatial-temporal indications of the areas where it would be useful to apply the prescribed fire practice.The final products are a set of forecasting daily masks containing only the areas where the climate conditions for the prescribed fire practice are satisfied.000
Product Specification:
Spatial Resolution or Scale 1: 10 000 to 1: 25 000
Product standard refresh rate
Daily winter season (November/March)
Area covered by a single Product
Product computed on:Portuguese, Spanish, Italian AOI
Satellite sensor data Input VHR satellite images
Standard Format GEOTIFF
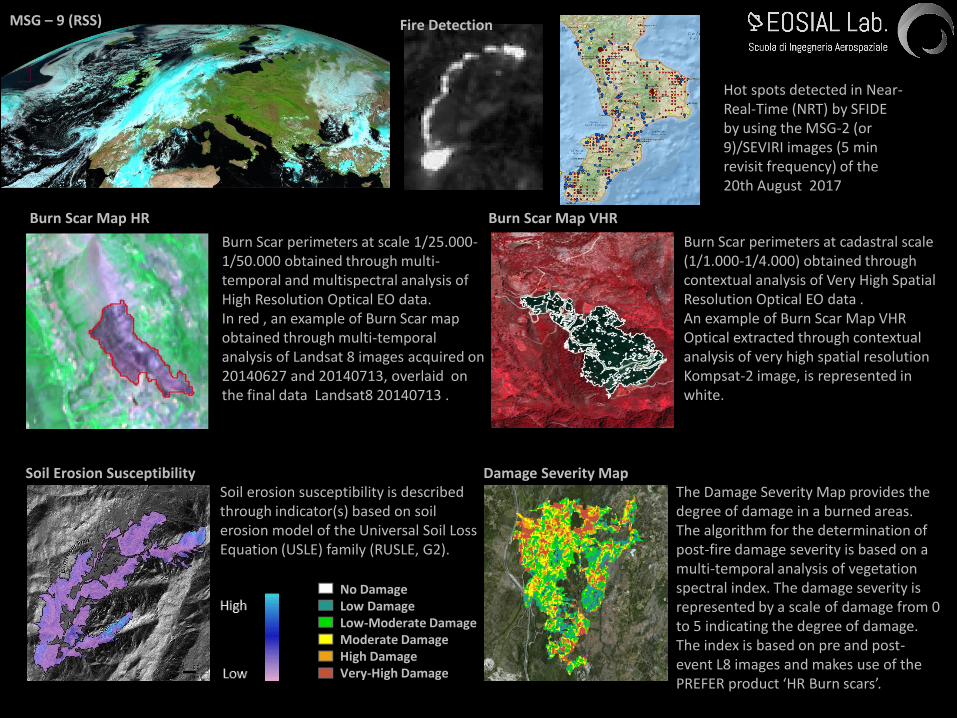
Burn Scar Map VHR
Soil Erosion Susceptibility Damage Severity Map
No DamageLow DamageLow-Moderate DamageModerate DamageHigh DamageVery-High Damage
Burn Scar perimeters at cadastral scale (1/1.000-1/4.000) obtained through contextual analysis of Very High Spatial Resolution Optical EO data .An example of Burn Scar Map VHR Optical extracted through contextual analysis of very high spatial resolution Kompsat-2 image, is represented in white.
Burn Scar perimeters at scale 1/25.000-1/50.000 obtained through multi-temporal and multispectral analysis of High Resolution Optical EO data.In red , an example of Burn Scar map obtained through multi-temporal analysis of Landsat 8 images acquired on 20140627 and 20140713, overlaid on the final data Landsat8 20140713 .
Soil erosion susceptibility is described through indicator(s) based on soil erosion model of the Universal Soil Loss Equation (USLE) family (RUSLE, G2).
The Damage Severity Map provides the degree of damage in a burned areas. The algorithm for the determination of post-fire damage severity is based on a multi-temporal analysis of vegetation spectral index. The damage severity is represented by a scale of damage from 0 to 5 indicating the degree of damage. The index is based on pre and post-event L8 images and makes use of the PREFER product ‘HR Burn scars’.
Fire Detection
Hot spots detected in Near-Real-Time (NRT) by SFIDE by using the MSG-2 (or 9)/SEVIRI images (5 min revisit frequency) of the 20th August 2017
MSG – 9 (RSS)
Burn Scar Map HR
Thank you for your attention!
EOSIAL Earth Observation
Satellite Images Application Lab.
eosial.psm.uniroma1.it
S2IGI: Sistema satellitare integrato gestione incendiNurjana Technologies, CNR IBIMET, SIA Università La SapienzaPOR FESR Sardegna 2014-2020Asse I – Ricerca Scientifica, Sviluppo Tecnologico e InnovazioneAzione 1.2.2 – Supporto alla realizzazione di progetti complessi di attività di ricerca e sviluppo.