Utilizing NASA Earth Observations to Map Temporal and ... · Cheatgrass (Bromus tectorum) and...
7
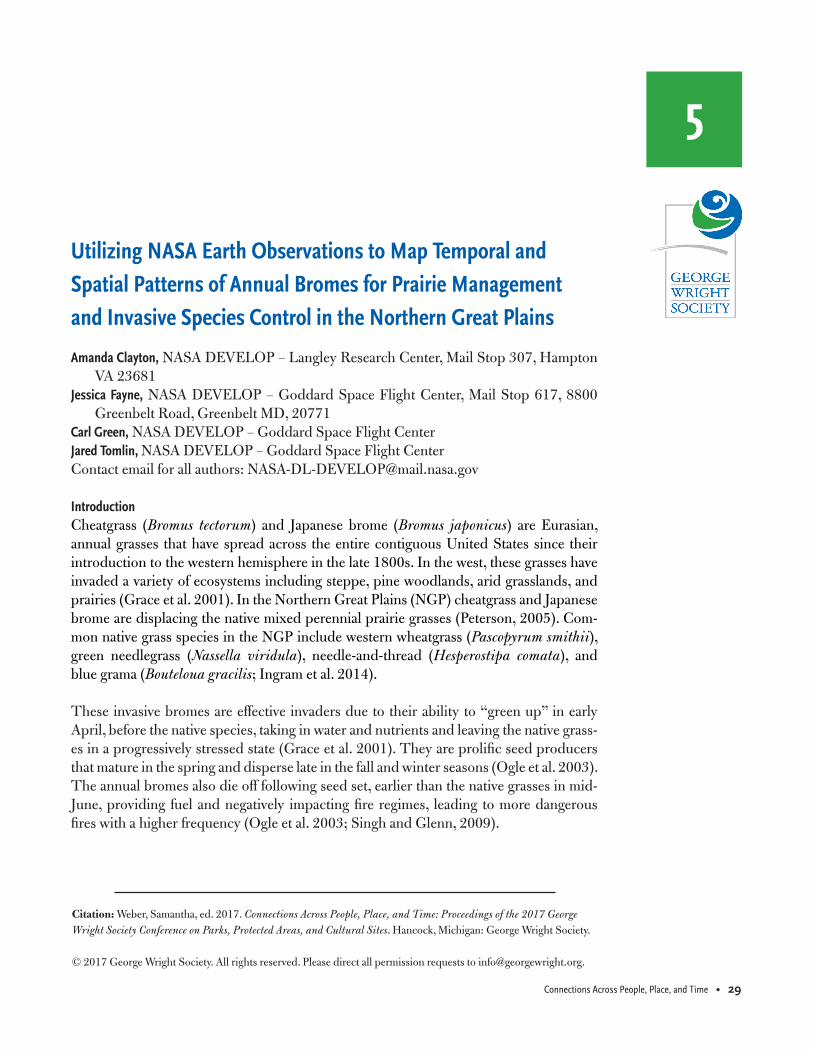
Connections Across People, Place, and Time • 29 Utilizing NASA Earth Observations to Map Temporal and Spatial Patterns of Annual Bromes for Prairie Management and Invasive Species Control in the Northern Great Plains Amanda Clayton, NASA DEVELOP – Langley Research Center, Mail Stop 307, Hampton VA 23681 Jessica Fayne, NASA DEVELOP – Goddard Space Flight Center, Mail Stop 617, 8800 Greenbelt Road, Greenbelt MD, 20771 Carl Green, NASA DEVELOP – Goddard Space Flight Center Jared Tomlin, NASA DEVELOP – Goddard Space Flight Center Contact email for all authors: [email protected] Introduction Cheatgrass (Bromus tectorum) and Japanese brome (Bromus japonicus) are Eurasian, annual grasses that have spread across the entire contiguous United States since their introduction to the western hemisphere in the late 1800s. In the west, these grasses have invaded a variety of ecosystems including steppe, pine woodlands, arid grasslands, and prairies (Grace et al. 2001). In the Northern Great Plains (NGP) cheatgrass and Japanese brome are displacing the native mixed perennial prairie grasses (Peterson, 2005). Com- mon native grass species in the NGP include western wheatgrass (Pascopyrum smithii), green needlegrass (Nassella viridula), needle-and-thread (Hesperostipa comata), and blue grama (Bouteloua gracilis; Ingram et al. 2014). These invasive bromes are effective invaders due to their ability to “green up” in early April, before the native species, taking in water and nutrients and leaving the native grass- es in a progressively stressed state (Grace et al. 2001). They are prolific seed producers that mature in the spring and disperse late in the fall and winter seasons (Ogle et al. 2003). The annual bromes also die off following seed set, earlier than the native grasses in mid- June, providing fuel and negatively impacting fire regimes, leading to more dangerous fires with a higher frequency (Ogle et al. 2003; Singh and Glenn, 2009). Citation: Weber, Samantha, ed. 2017. Connections Across People, Place, and Time: Proceedings of the 2017 George Wright Society Conference on Parks, Protected Areas, and Cultural Sites. Hancock, Michigan: George Wright Society. © 2017 George Wright Society. All rights reserved. Please direct all permission requests to [email protected]. 5
-
Upload
trinhtuyen -
Category
Documents
-
view
218 -
download
4
Transcript of Utilizing NASA Earth Observations to Map Temporal and ... · Cheatgrass (Bromus tectorum) and...
Connections Across People, Place, and Time • 29
Utilizing NASA Earth Observations to Map Temporal and Spatial Patterns of Annual Bromes for Prairie Management and Invasive Species Control in the Northern Great Plains
Amanda Clayton, NASA DEVELOP – Langley Research Center, Mail Stop 307, Hampton VA 23681
Jessica Fayne, NASA DEVELOP – Goddard Space Flight Center, Mail Stop 617, 8800 Greenbelt Road, Greenbelt MD, 20771
Carl Green, NASA DEVELOP – Goddard Space Flight CenterJared Tomlin, NASA DEVELOP – Goddard Space Flight CenterContact email for all authors: [email protected]
IntroductionCheatgrass (Bromus tectorum) and Japanese brome (Bromus japonicus) are Eurasian, annual grasses that have spread across the entire contiguous United States since their introduction to the western hemisphere in the late 1800s. In the west, these grasses have invaded a variety of ecosystems including steppe, pine woodlands, arid grasslands, and prairies (Grace et al. 2001). In the Northern Great Plains (NGP) cheatgrass and Japanese brome are displacing the native mixed perennial prairie grasses (Peterson, 2005). Com-mon native grass species in the NGP include western wheatgrass (Pascopyrum smithii), green needlegrass (Nassella viridula), needle-and-thread (Hesperostipa comata), and blue grama (Bouteloua gracilis; Ingram et al. 2014).
These invasive bromes are effective invaders due to their ability to “green up” in early April, before the native species, taking in water and nutrients and leaving the native grass-es in a progressively stressed state (Grace et al. 2001). They are prolific seed producers that mature in the spring and disperse late in the fall and winter seasons (Ogle et al. 2003). The annual bromes also die off following seed set, earlier than the native grasses in mid-June, providing fuel and negatively impacting fire regimes, leading to more dangerous fires with a higher frequency (Ogle et al. 2003; Singh and Glenn, 2009).
Citation: Weber, Samantha, ed. 2017. Connections Across People, Place, and Time: Proceedings of the 2017 George Wright Society Conference on Parks, Protected Areas, and Cultural Sites. Hancock, Michigan: George Wright Society.
© 2017 George Wright Society. All rights reserved. Please direct all permission requests to [email protected].
5

30 • Connections Across People, Place, and Time
The Northern Great Plains Network (NGPN) is one of thirty-two NPS Inventory & Mon-itoring (I&M) Networks within the United States. The network is tasked with acquiring baseline inventories for a wide range of natural resources including air and water quality, geologic and soil resources, and plant and animal species occurrence and distribution. These inventories provide park managers the information necessary to effectively manage 13 park units throughout Wyoming, Nebraska, and South Dakota. The primary objec-tive of this project was to create accurate distribution maps for cheatgrass and Japanese brome in Badlands (1030 km2) and Wind Cave (140 km2) national parks and Jewel Cave (5 km2) National Monument (NM) in South Dakota (Figure 1). Understanding the be-havior of these invasive species through space and time will aid managers in developing a successful annual brome adaptive management strategy for park units, and identify areas for targeted management efforts. Therefore, the goal of this feasibility project was to ex-amine potential methods to regionally monitor invasive grasses by leveraging their unique phenology, in situ data, and satellite observations. The Moderate Resolution Imaging Spectroradiometer (MODIS) on NASA’s Terra satellite, along with Landsat 8 Operation-al Land Imager (OLI), Landsat 5 Thematic Mapper (TM), and Sentinel-2 Multispectral instrument (MSI) provided the project with the spatial and temporal resolution necessary to create phenology-based maps of brome distribution.
NGPN in situ monitoring dataIn situ vegetation monitoring data for Northern Great Plains (NGP) park units were col-
Figure 1. From left to right: Jewel Cave National Monu-ment, Wind Cave National Park, and Badlands National Park (SD) within Landsat 8 OLI WRS-2 path 33 row 30.
Connections Across People, Place, and Time • 31
lected by the NGPN and the Northern Great Plains Fire Effects program (NG-FEP) from 1998–2016. Vegetation sampling took place between May and August each year. The vegetation data contained 703 monitoring occurrences over 256 unique study plots for Badlands and Wind Cave NPs and Jewel Cave NM. Each data point contains measure-ments for absolute and relative percent of plant cover below 2 m, exotic species, and an-nual invasive brome grasses estimated for a 0.1 hectare (20 x 50 m) sample plot. These in situ data were used to validate the NDVI difference images and land cover classification.
Phenology estimationVegetation phenology data products were acquired through the United States Depart-ment of Agriculture (USDA) Forest Service’s ForWarn System. These parameters, ob-tained from 2000-2014, are derived from Terra MODIS data at 250 m spatial resolution. Vegetation phenology was analyzed using a 15-year time series provided by the MODIS 8-day Normalized Difference Vegetation Index (NDVI) product. Utilizing this 8-day product, the team was able to take the average dates of green-up, maximum production, and senescence over the study area and calculate an average phenology for each year.
To identify the effect of cheatgrass and Japanese brome on local NDVI, NDVI values were extracted at each pixel containing an in situ data sample. Because bromes green up early in the growing season before the surrounding native vegetation, areas with higher rela-tive abundance of brome grasses have high NDVI values. By July when bromes begin to senesce, an inverse relationship between brome grass abundance and NDVI is expected. Midseason, both native vegetation and invasive bromes have similar NDVI values. The expected local effects of bromes on greenness cannot be captured by the 250 m spatial resolution of Terra MODIS. However, 30 m Landsat data are able to identify the pheno-logical differences between invasive bromes and the native vegetation.
NDVI differencingLandsat 5 Thematic Mapper (TM) imagery from 2008-2011 and Landsat 8 Operational Land Imager (OLI) imagery from 2013–2016 were downloaded from the United States Geological Survey (USGS) EarthExplorer. Scenes from the months of March through August were chosen based on the examination of ForWarn phenological parameters to correspond with the brome growing season.
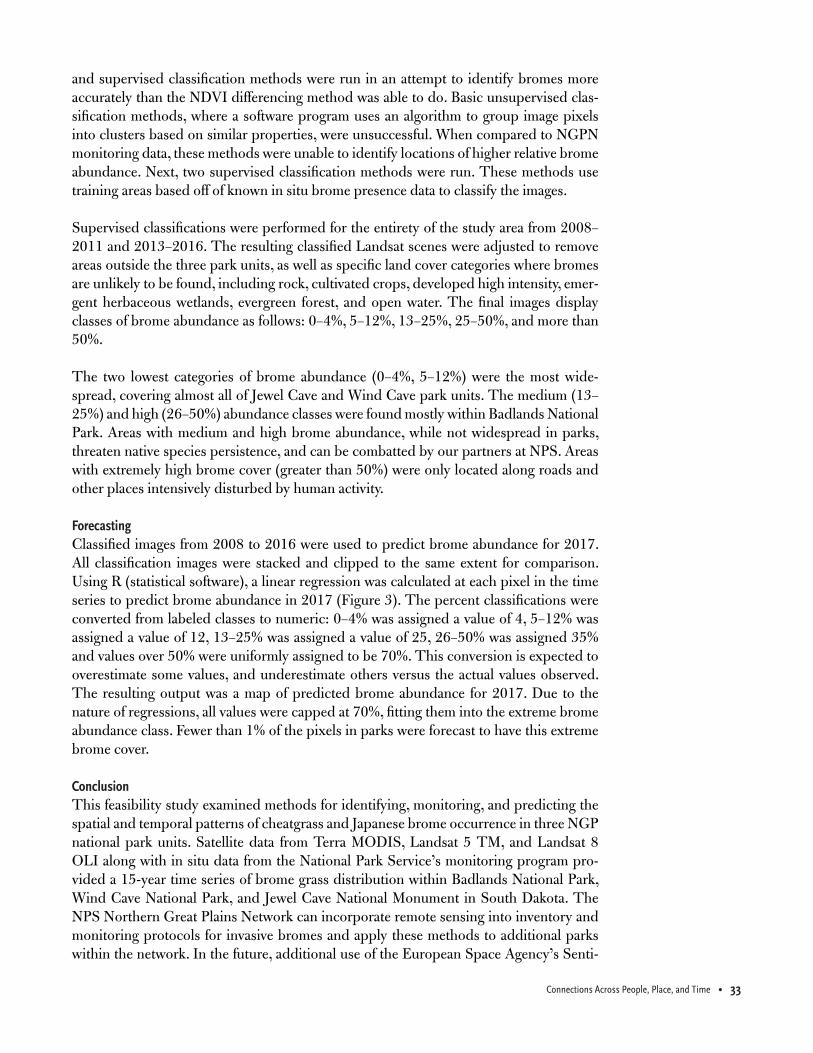
Utilizing the higher spatial resolution of the Landsat satellite (30 m, 98 ft), NDVI was cal-culated for all Landsat scenes with sufficient visibility of each park unit during the grow-ing season. This provided a higher resolution reference to compare with ForWarn and MODIS data. The availability of cloud-free imagery limited number of scenes that could be used. The two scenes that were identified to be the most representative of the brome grass green-up and brown-down periods were compared to calculate the change in NDVI from early to late season in 2015. The result was visually analyzed in order to determine the validity of the output. Once this method was established, Google Earth Engine (GEE) was used to automate the calculation for each year from 2008 to 2016, excluding 2012. Classification for 2012 was excluded because of extreme drought (affecting vegetation regionally) and the lack of adequate Landsat data. For easy visualization, an orange-red color ramp displays only the NDVI difference above 0 (places greening up and senescing earlier than average), indicating where brome grass might be present (Figure 2).

32 • Connections Across People, Place, and Time
The NDVI difference maps from 2008 to 2016 showed annual variation in early phe-nological events which is characteristic of brome presence and abundance. When used alone, without the inclusion of other environmental factors, NDVI differencing was not capable of consistently and accurately identifying brome populations when compared to in situ measurements. For example, the difference image for 2010 showed high NDVI values in areas of all three park units. While 2010 had the highest relative percent of brome abundance measured by the NGPN, this was mostly attributed to measurements from Badlands NP. High NDVI difference values were unexpected in Jewel Cave NM and Wind Cave NP, where field measurements reported low brome abundance. In other years NDVI difference images identified areas of early phenology in both Jewel Cave NM and Wind Cave NP, where the actual ground data measured low or no brome abundance.
Generally, NDVI differencing for predicting potential areas for brome presence was more successful for Badlands NP than for the smaller Jewel Cave and Wind Cave park units. The level of accuracy of NDVI differencing between the three parks could be attributed to differing environmental conditions, such as variations in elevation or slight differences brome phenology. Additionally, while brome abundance has increased since monitoring began in 1998, the sample plots with the highest relative percent of brome abundance were recorded at less than 20% of the total vegetation. The 30 m spatial resolution of the Landsat imagery might not be able to detect areas where brome are present at low relative percentage.
Brome classificationMultiple different classification methods combined Landsat 5 TM, Landsat 8 OLI, in situ vegetation monitoring data as another technique to identify areas of brome grass abun-dance within the Badlands, Wind Cave, and Jewel cave park units. Both unsupervised
Figure 2. The difference between Landsat derived NDVI values between April 2016 and July 2016 within Badlands National Park; positive differences, shown in orange, represent areas with earlier vegetation phenology.
Connections Across People, Place, and Time • 33
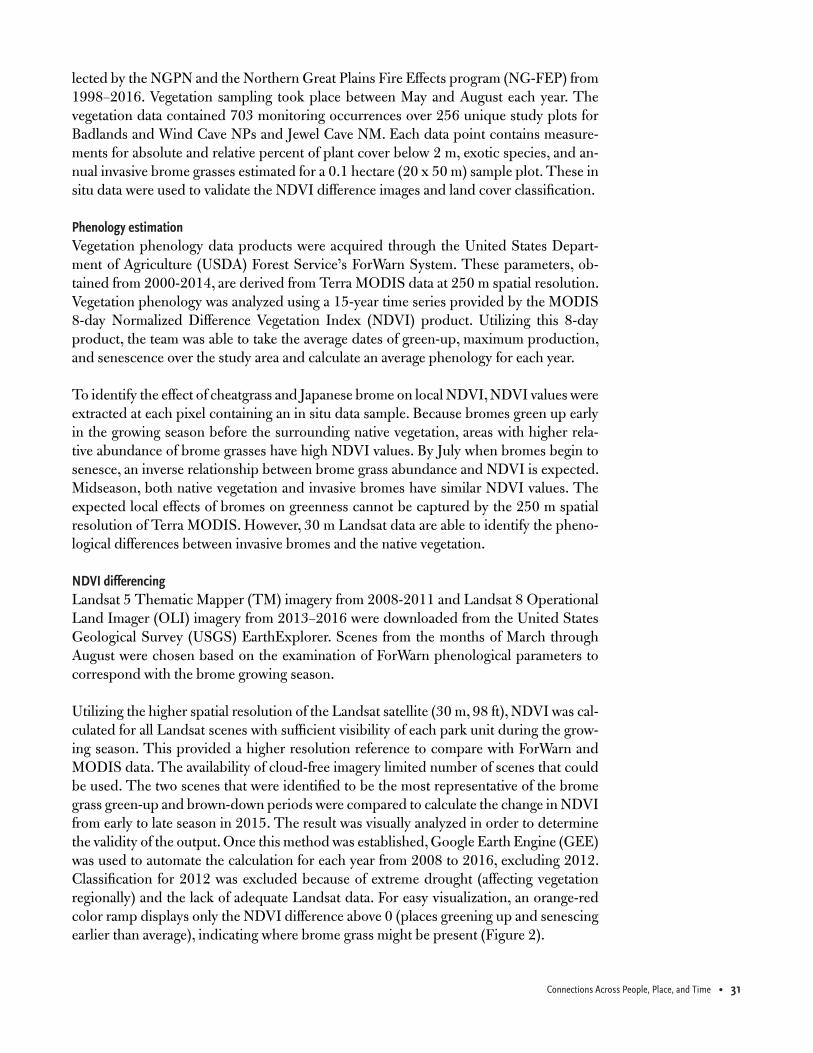
and supervised classification methods were run in an attempt to identify bromes more accurately than the NDVI differencing method was able to do. Basic unsupervised clas-sification methods, where a software program uses an algorithm to group image pixels into clusters based on similar properties, were unsuccessful. When compared to NGPN monitoring data, these methods were unable to identify locations of higher relative brome abundance. Next, two supervised classification methods were run. These methods use training areas based off of known in situ brome presence data to classify the images.
Supervised classifications were performed for the entirety of the study area from 2008–2011 and 2013–2016. The resulting classified Landsat scenes were adjusted to remove areas outside the three park units, as well as specific land cover categories where bromes are unlikely to be found, including rock, cultivated crops, developed high intensity, emer-gent herbaceous wetlands, evergreen forest, and open water. The final images display classes of brome abundance as follows: 0–4%, 5–12%, 13–25%, 25–50%, and more than 50%.
The two lowest categories of brome abundance (0–4%, 5–12%) were the most wide-spread, covering almost all of Jewel Cave and Wind Cave park units. The medium (13–25%) and high (26–50%) abundance classes were found mostly within Badlands National Park. Areas with medium and high brome abundance, while not widespread in parks, threaten native species persistence, and can be combatted by our partners at NPS. Areas with extremely high brome cover (greater than 50%) were only located along roads and other places intensively disturbed by human activity.
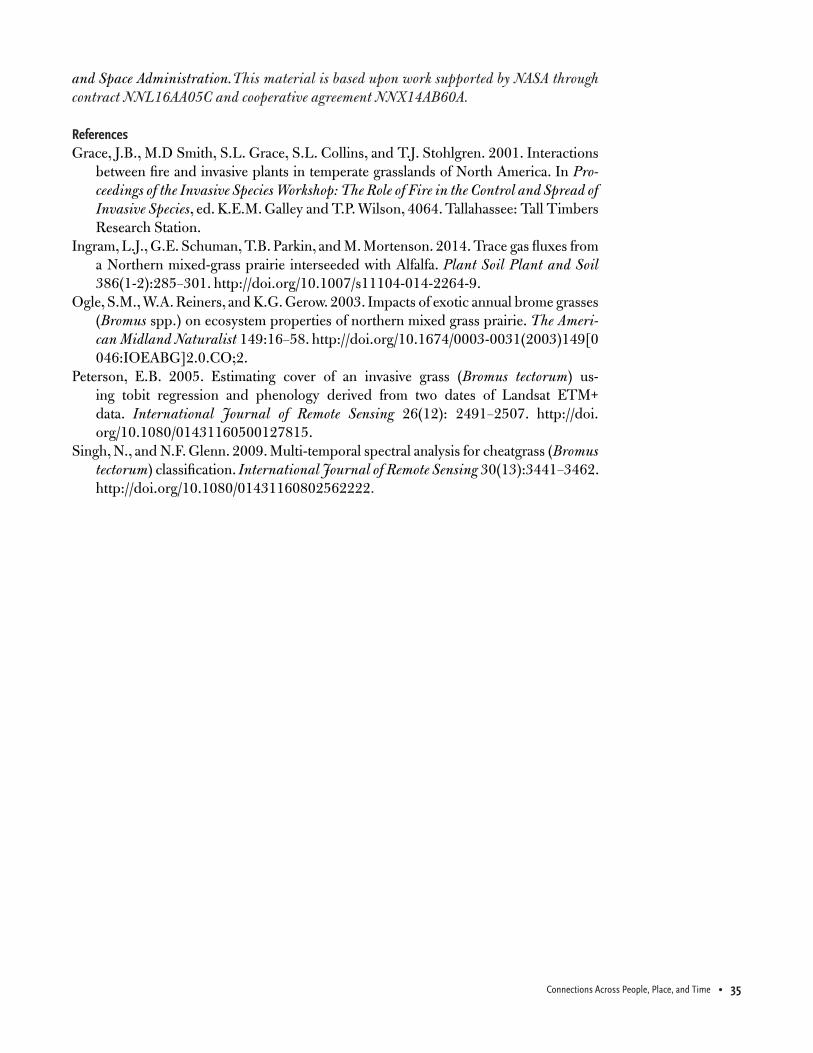
ForecastingClassified images from 2008 to 2016 were used to predict brome abundance for 2017. All classification images were stacked and clipped to the same extent for comparison. Using R (statistical software), a linear regression was calculated at each pixel in the time series to predict brome abundance in 2017 (Figure 3). The percent classifications were converted from labeled classes to numeric: 0–4% was assigned a value of 4, 5–12% was assigned a value of 12, 13–25% was assigned a value of 25, 26–50% was assigned 35% and values over 50% were uniformly assigned to be 70%. This conversion is expected to overestimate some values, and underestimate others versus the actual values observed. The resulting output was a map of predicted brome abundance for 2017. Due to the nature of regressions, all values were capped at 70%, fitting them into the extreme brome abundance class. Fewer than 1% of the pixels in parks were forecast to have this extreme brome cover.
ConclusionThis feasibility study examined methods for identifying, monitoring, and predicting the spatial and temporal patterns of cheatgrass and Japanese brome occurrence in three NGP national park units. Satellite data from Terra MODIS, Landsat 5 TM, and Landsat 8 OLI along with in situ data from the National Park Service’s monitoring program pro-vided a 15-year time series of brome grass distribution within Badlands National Park, Wind Cave National Park, and Jewel Cave National Monument in South Dakota. The NPS Northern Great Plains Network can incorporate remote sensing into inventory and monitoring protocols for invasive bromes and apply these methods to additional parks within the network. In the future, additional use of the European Space Agency’s Senti-

34 • Connections Across People, Place, and Time
nel-2’s higher resolution imagery, Sentinel-2’s red edge bands, and other ancillary data including slope and aspect, and bioclimatic variables including, annual temperature and precipitation could be added to improve the result of brome classification. The highest amounts of brome were only marked in places along spots of human disturbance making distance from roads and buildings another point to be examined.
The NPS Northern Great Plains Network can incorporate remote sensing into invento-ry and monitoring protocols for invasive bromes and apply these methods to additional parks within the network. While in situ field measurements are necessary create accurate classification maps from remotely sensed satellite data, the addition of NASA Earth ob-servations to the network’s current methods can contribute to timely regional monitoring efforts, potentially directing or limiting the need for time-intensive field work campaigns. Remotely-sensed classification methods provide an estimate of the current distribution of invasive annual bromes, which is needed to develop an adaptive management plan for invasive species control in the NGP.
Any opinions, findings, and conclusions or recommendations expressed in this material are those of the author(s) and do not necessarily reflect the views of the National Aeronautics
Figure 3. Pixel-based linear regression of classified Landsat imagery to estimate brome abundance in 2017.
Connections Across People, Place, and Time • 35
and Space Administration.This material is based upon work supported by NASA through contract NNL16AA05C and cooperative agreement NNX14AB60A.
ReferencesGrace, J.B., M.D Smith, S.L. Grace, S.L. Collins, and T.J. Stohlgren. 2001. Interactions
between fire and invasive plants in temperate grasslands of North America. In Pro-ceedings of the Invasive Species Workshop: The Role of Fire in the Control and Spread of Invasive Species, ed. K.E.M. Galley and T.P. Wilson, 4064. Tallahassee: Tall Timbers Research Station.
Ingram, L.J., G.E. Schuman, T.B. Parkin, and M. Mortenson. 2014. Trace gas fluxes from a Northern mixed-grass prairie interseeded with Alfalfa. Plant Soil Plant and Soil 386(1-2):285–301. http://doi.org/10.1007/s11104-014-2264-9.
Ogle, S.M., W.A. Reiners, and K.G. Gerow. 2003. Impacts of exotic annual brome grasses (Bromus spp.) on ecosystem properties of northern mixed grass prairie. The Ameri-can Midland Naturalist 149:16–58. http://doi.org/10.1674/0003-0031(2003)149[0046:IOEABG]2.0.CO;2.
Peterson, E.B. 2005. Estimating cover of an invasive grass (Bromus tectorum) us-ing tobit regression and phenology derived from two dates of Landsat ETM+ data. International Journal of Remote Sensing 26(12): 2491–2507. http://doi.org/10.1080/01431160500127815.
Singh, N., and N.F. Glenn. 2009. Multi-temporal spectral analysis for cheatgrass (Bromus tectorum) classification. International Journal of Remote Sensing 30(13):3441–3462. http://doi.org/10.1080/01431160802562222.