
Utilizing CASPER Home Health Reports to Assist in...
49
©Pathway Health 2013 Utilizing CASPER Home Health Reports to Assist in Operational Efficiency and Documenting Quality for Your Agency Lisa Abicht-Swensen, M.H.A. Director of Home Health and Hospice Services Susan Kirby RN, BSN, PHN, Nurse Consultant
-
Upload
phungkhanh -
Category
Documents
-
view
214 -
download
0
Transcript of Utilizing CASPER Home Health Reports to Assist in...
©Pathway Health 2013
Utilizing CASPER Home
Health Reports to Assist in
Operational Efficiency and
Documenting Quality for Your
Agency
Lisa Abicht-Swensen, M.H.A.
Director of Home Health and Hospice Services
Susan Kirby RN, BSN, PHN, Nurse Consultant
©Pathway Health 2013
• Be able to read and understand:
– Agency Patient Related Characteristics
– All Patient’s Risk Adjusted Outcome Report
– Potentially Avoidable Event Report – Tabular
– Potentially Avoidable Event Report -- Patient
• Determine your agency’s areas of concern based
on your CASPER Reports
• Better prepare for your State Survey by utilizing
your CASPER Report
• Understand the basics of implementing CASPER
Reports into your Quality Improvement Plan
Objectives

©Pathway Health 2013
• Cost-effective Quality Care
• Preparation for State Survey
• Agency Characteristics
• Evaluate Process Measures
• CMS’s intent
Why use the CASPER Reports?

©Pathway Health 2013
©Pathway Health 2013
Outcome-Based Quality Improvement Manual (OBQI) https://www.cms.gov/Medicare/Quality-Initiatives-Patient-Assessment-Instruments/HomeHealthQualityInits/HHQIOASISOBQI.html
Outcome-Based Quality Monitoring Manual (OBQM)https://www.cms.gov/Medicare/Quality-Initiatives-Patient-Assessment-Instruments/HomeHealthQualityInits/HHQIOASISOBQM.html
Process-Based Quality Improvement Manual (PBQI)https://www.cms.gov/Medicare/Quality-Initiatives-Patient-Assessment-Instruments/HomeHealthQualityInits/PBQIProcessMeasures.html
Resources

©Pathway Health 2013
Educational Resources

©Pathway Health 2013
• Access and review CASPER reports each month
• Understand what the reports are telling you
• Analyze the information
• Study HHA practices that are affecting your data
• Make changes to your HHA practices
• Observe differences in the reports
Big Picture

©Pathway Health 2013
• The challenge in outcome analysis is to attempt to somehow separate changes due to care from those due to natural progression.
• This is achieved through risk adjustment.
Risk Adjustment
©Pathway Health 2013
• Ensures fair comparison – “apples to apples”
• Analyzes an outcome and its multiple risk factors
• A different formula is developed for each Outcome to predict the expected value
• Agency’s actual outcome is then compared to the National Reference which is Risk Adjusted
Risk Adjustment

©Pathway Health 2013
OBQI(Outcome-Based Quality Improvement)
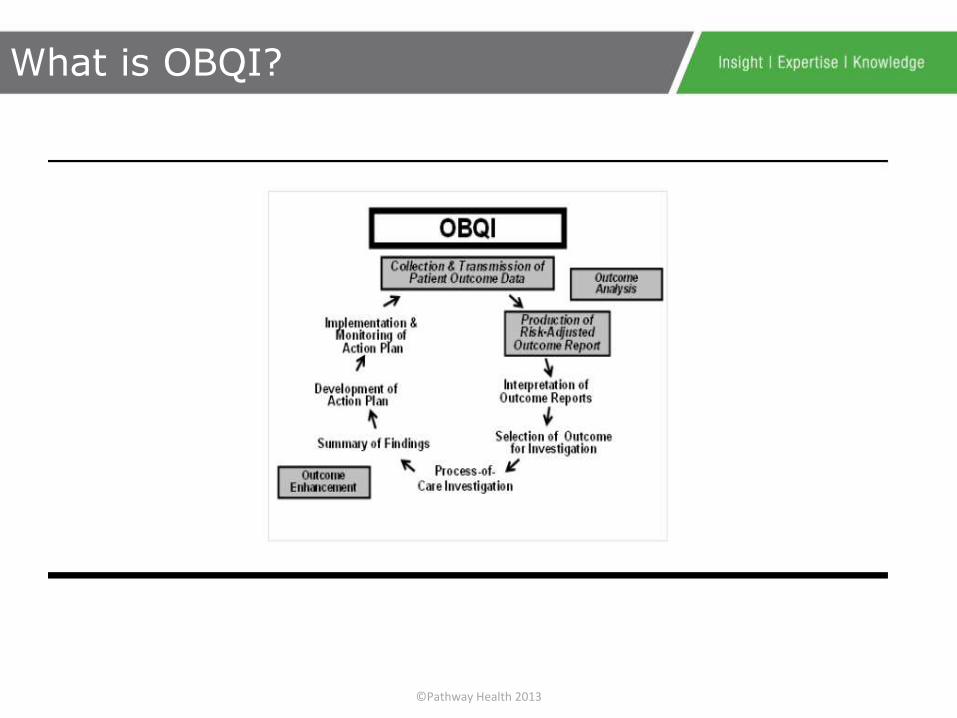
©Pathway Health 2013
What is OBQI?
©Pathway Health 2013
• OBQI Outcome Report
• Agency Patient-Related Characteristics Report (Formerly the Case Mix Report)
• Patient Tally Reports
Primary OBQI Reports

©Pathway Health 2013
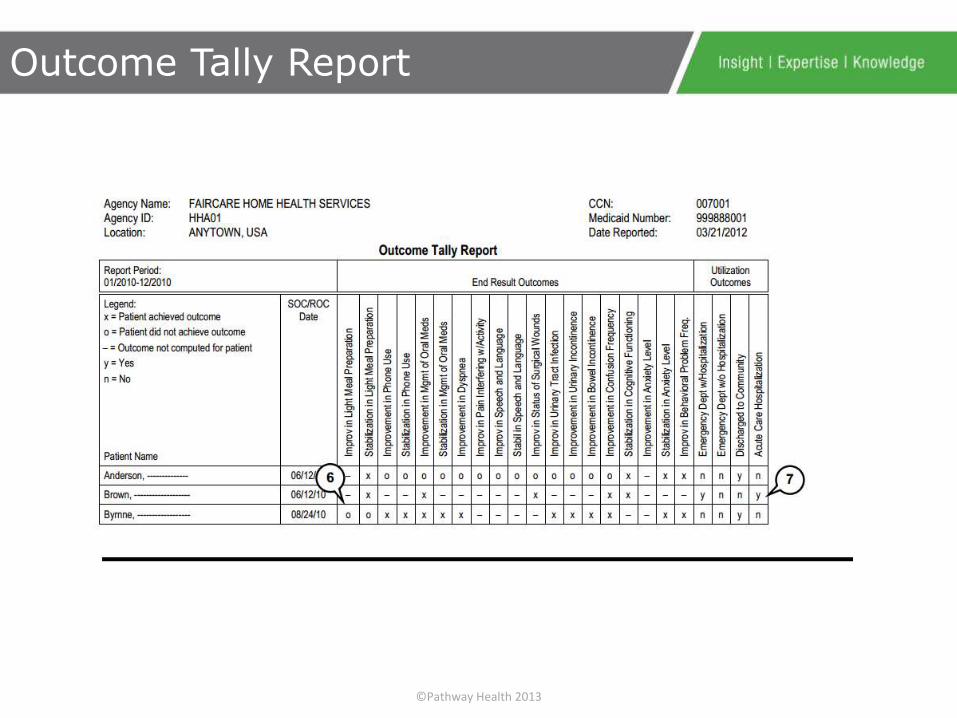
• 39 risk-adjusted outcome measures, derived from OASIS data, which measure changes in a patient’s health status between two or more time points
– 33 end-result (reflecting changes in health status)
– 4 utilization outcomes based on OASIS data
– 2 utilization outcomes based on Medicare claims
OBQI Outcome Report

©Pathway Health 2013

©Pathway Health 2013
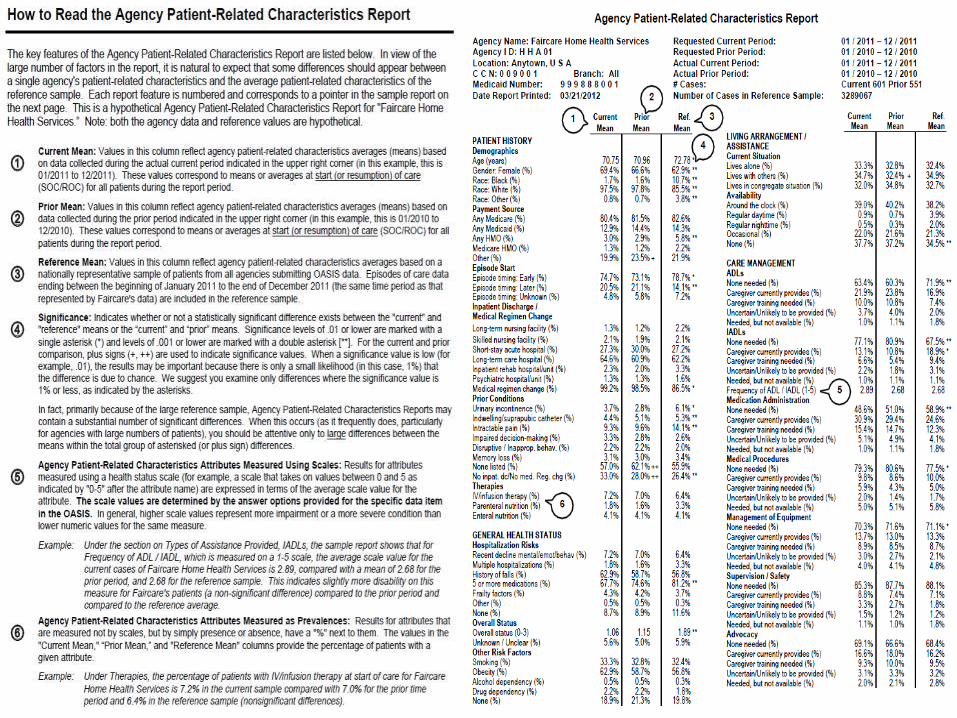
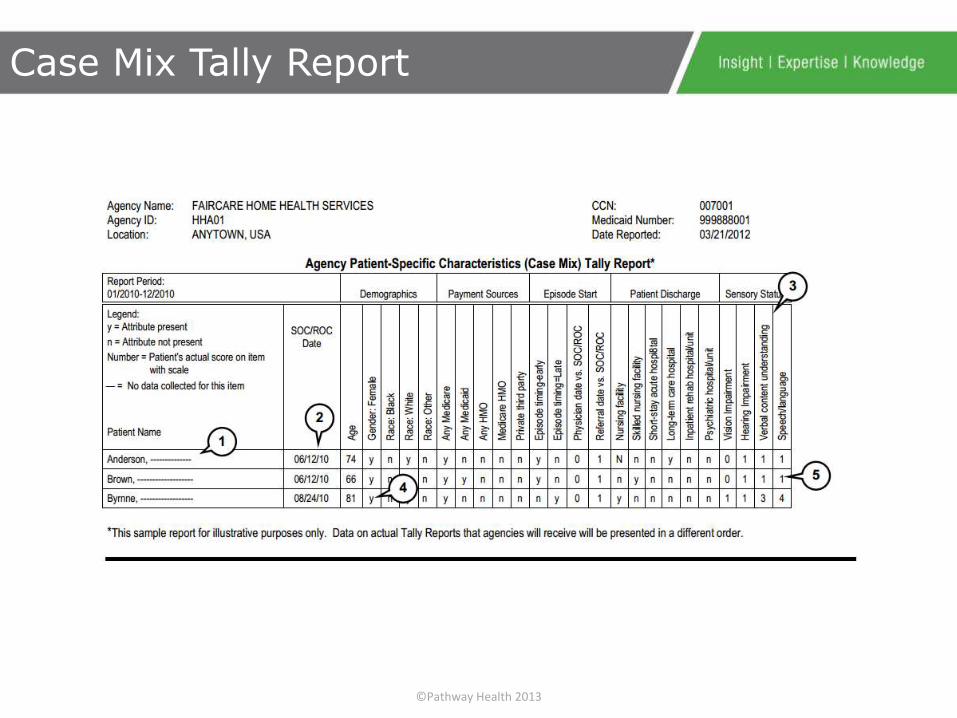
Formerly the “Case Mix Report”
• Can be found in OBQI and OBQM Manual
• A snapshot of HHA patient characteristics at the start or resumption of care, and discharge information including home health length of stay and need for emergency or hospital care.
– Patient attributes or circumstances likely to impact health status
– Allows the HHA to compare the characteristics of their patients to both a national reference sample and to their patients during a prior time period
Agency Patient-Related Characteristics
©Pathway Health 2013
©Pathway Health 2013
• Characteristics of Patients cared for affects decisions of the HHA regarding:
– The need to develop or modify policies, procedures or protocols
– Possible care path development or disease management approaches
– Decisions about obtaining or developing patient education materials; and
– Examining potential areas where increased care coordination may be indicated
Utilization of Patient-Related Report

©Pathway Health 2013
• Review current staffing
• Agency Strategic Planning and Program Development
– Resource allocation
– Budget development
• Verify “hunches” about changes in patient characteristics over time
Utilization of Patient-Related Report
©Pathway Health 2013
• There are 2 separate tally reports available:
– Individual patient’s characteristics data at SOC or ROC
– Outcome information for each patient case included in the Outcome Report and the Process Quality Measure Report
Patient Tally Reports
©Pathway Health 2013
Case Mix Tally Report
©Pathway Health 2013
Outcome Tally Report

©Pathway Health 2013
CMS Recommended Improvement Plan:
• Review report
• Select Outcome
• Investigate
• Develop a Plan of Action
• Develop Action Strategies
• Monitor the Plan of Action
• Expect Improvement
Outcome Base Quality Indicators
©Pathway Health 2013
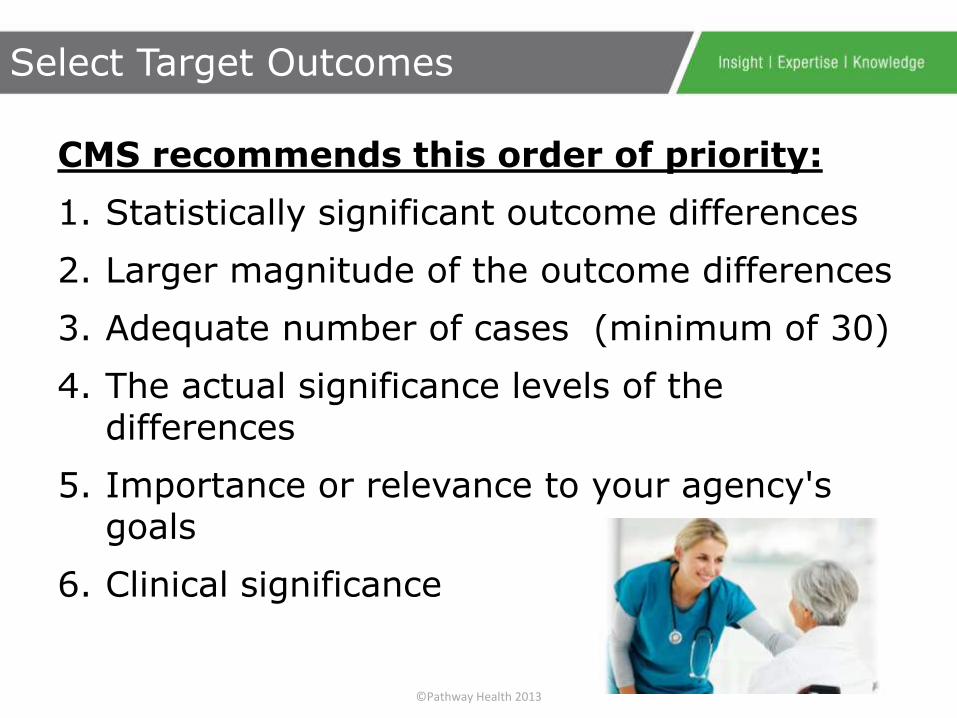
CMS recommends this order of priority:
1. Statistically significant outcome differences
2. Larger magnitude of the outcome differences
3. Adequate number of cases (minimum of 30)
4. The actual significance levels of the differences
5. Importance or relevance to your agency's goals
6. Clinical significance
Select Target Outcomes
©Pathway Health 2013
12-15 months!
When to expect improvement
©Pathway Health 2013
OBQM(Outcome-Based Quality Monitoring)

©Pathway Health 2013
• Agency Patient-Related Characteristics Report (Formerly the Case Mix Report)
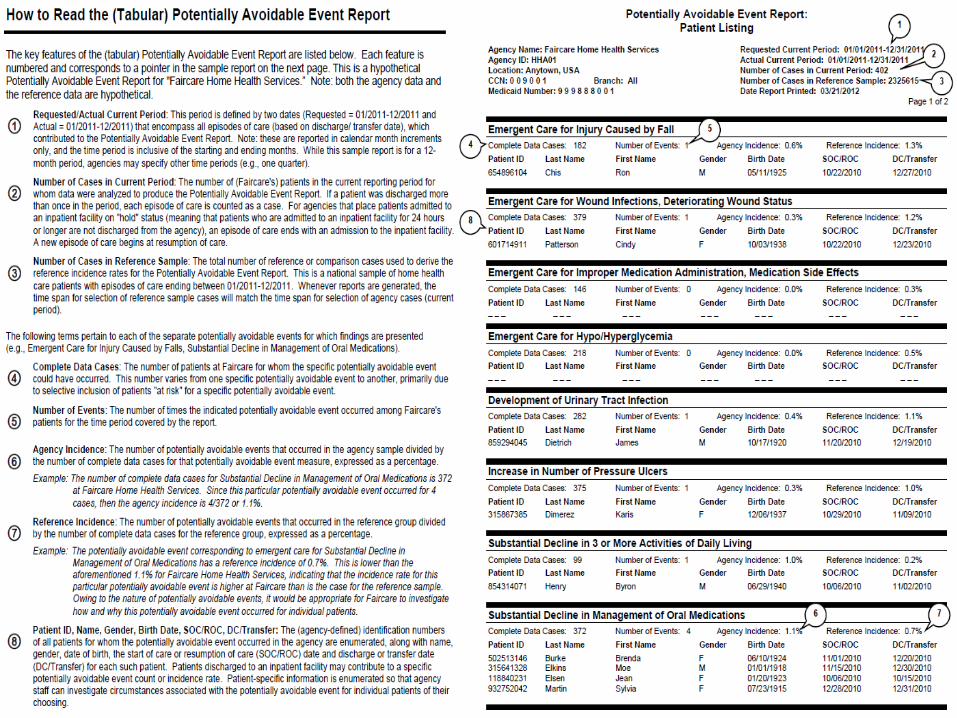
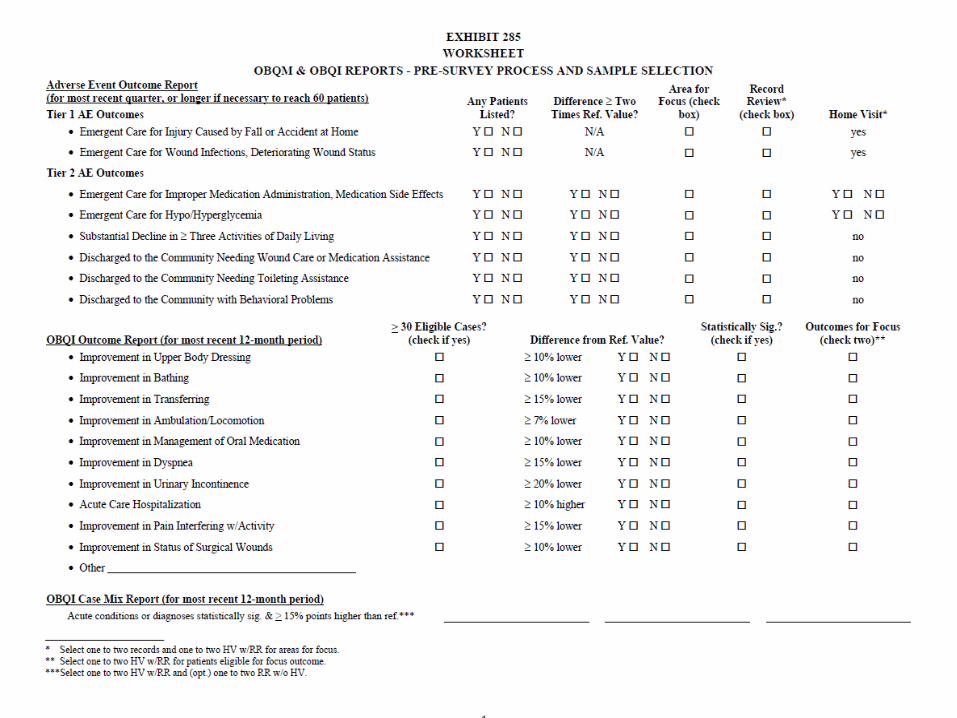
• Potentially Avoidable Event Report (Formerly the Adverse Event Report)
– Graphical Report
– Tabular Report
Primary OBQM Reports

©Pathway Health 2013
• Potentially avoidable events serve as markers for potential problems because of their negative nature and relatively low frequency
• They are outcome measures
– Represent a change in health status between SOC or ROC and discharge or transfer
Potentially Avoidable Events Report

©Pathway Health 2013
©Pathway Health 2013
©Pathway Health 2013
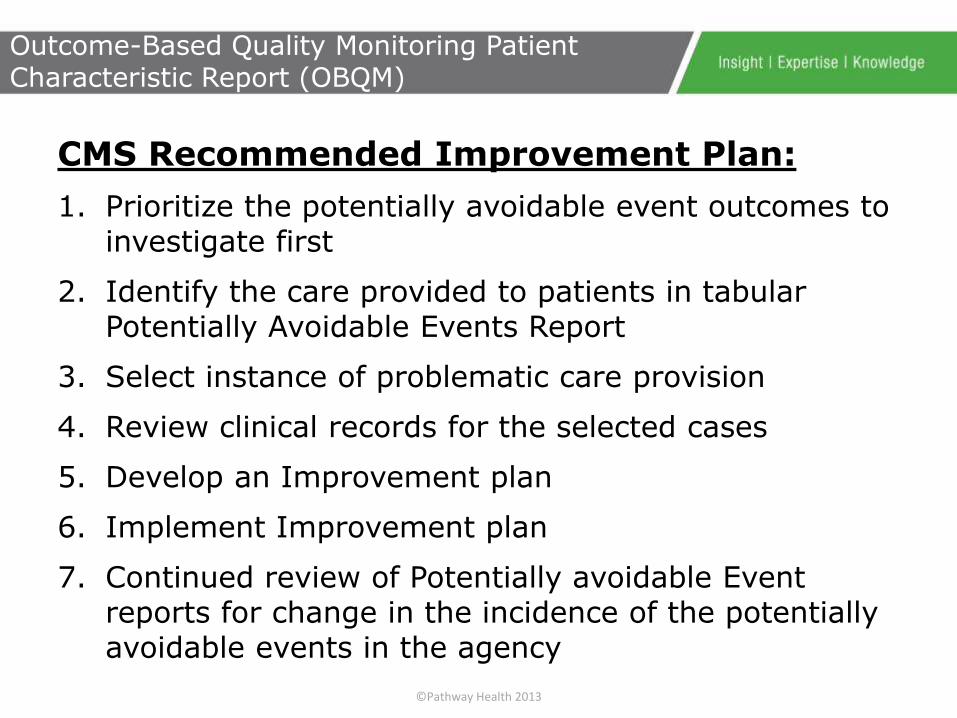
CMS Recommended Improvement Plan:
1. Prioritize the potentially avoidable event outcomes to investigate first
2. Identify the care provided to patients in tabular Potentially Avoidable Events Report
3. Select instance of problematic care provision
4. Review clinical records for the selected cases
5. Develop an Improvement plan
6. Implement Improvement plan
7. Continued review of Potentially avoidable Event reports for change in the incidence of the potentially avoidable events in the agency
Outcome-Based Quality Monitoring Patient Characteristic Report (OBQM)

©Pathway Health 2013
5-6 months!
When to expect improvement

©Pathway Health 2013
PBQI(Process-Based Quality Improvement)
©Pathway Health 2013
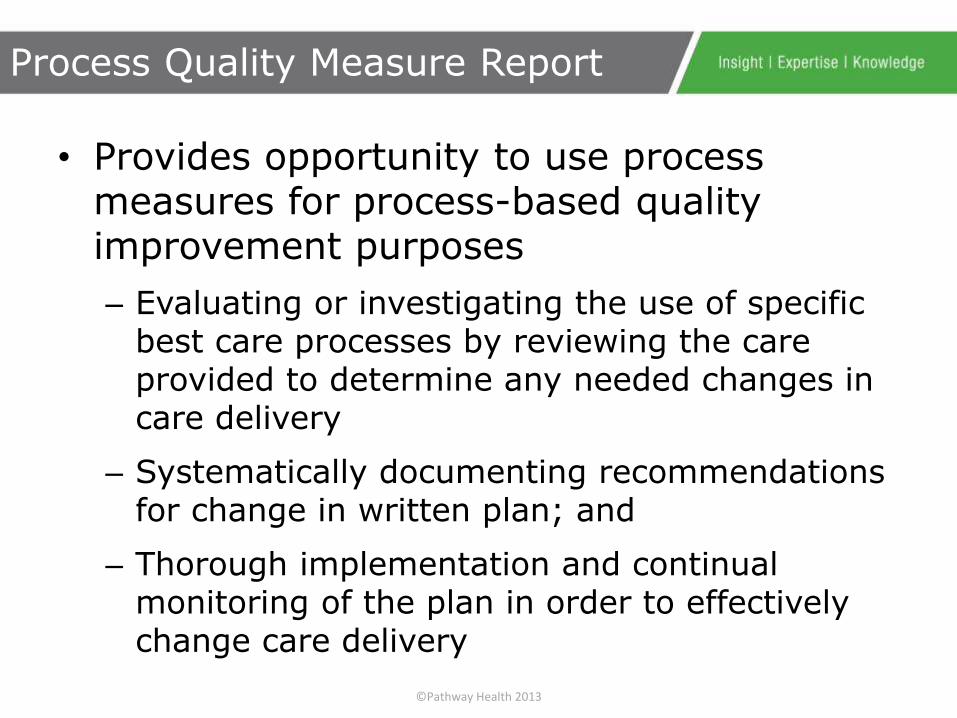
• Provides opportunity to use process measures for process-based quality improvement purposes
– Evaluating or investigating the use of specific best care processes by reviewing the care provided to determine any needed changes in care delivery
– Systematically documenting recommendations for change in written plan; and
– Thorough implementation and continual monitoring of the plan in order to effectively change care delivery
Process Quality Measure Report
©Pathway Health 2013
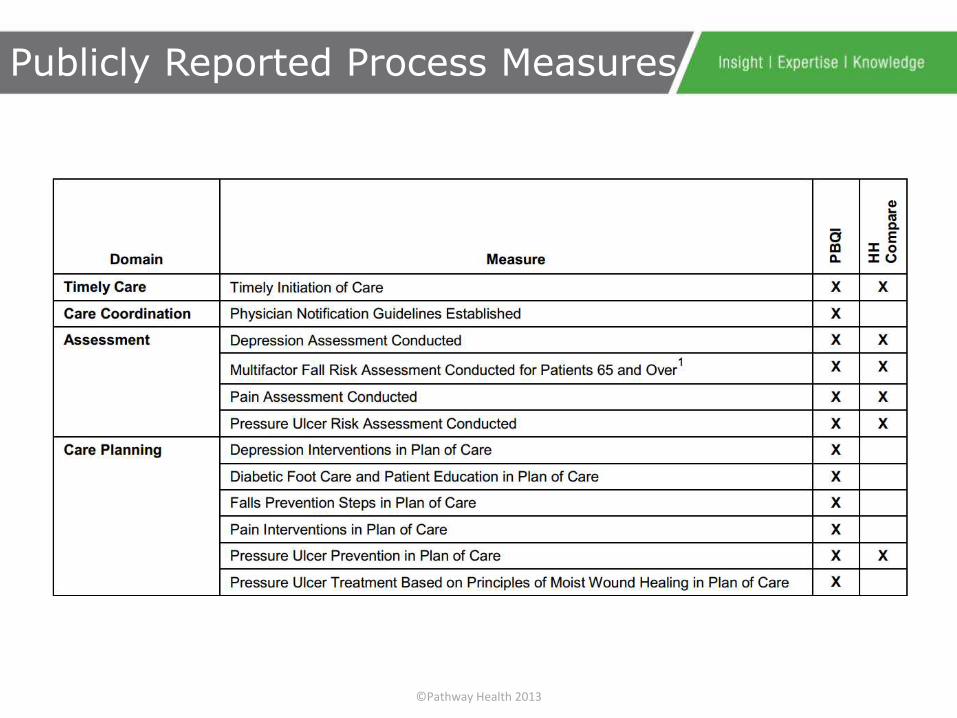
Publicly Reported Process Measures
©Pathway Health 2013
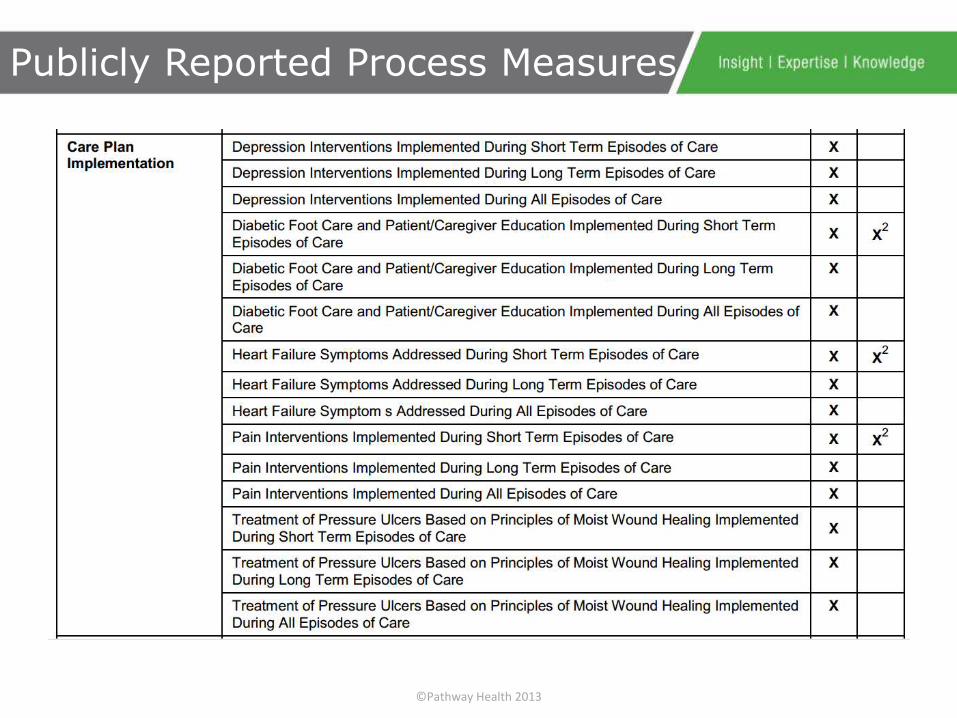
Publicly Reported Process Measures
©Pathway Health 2013
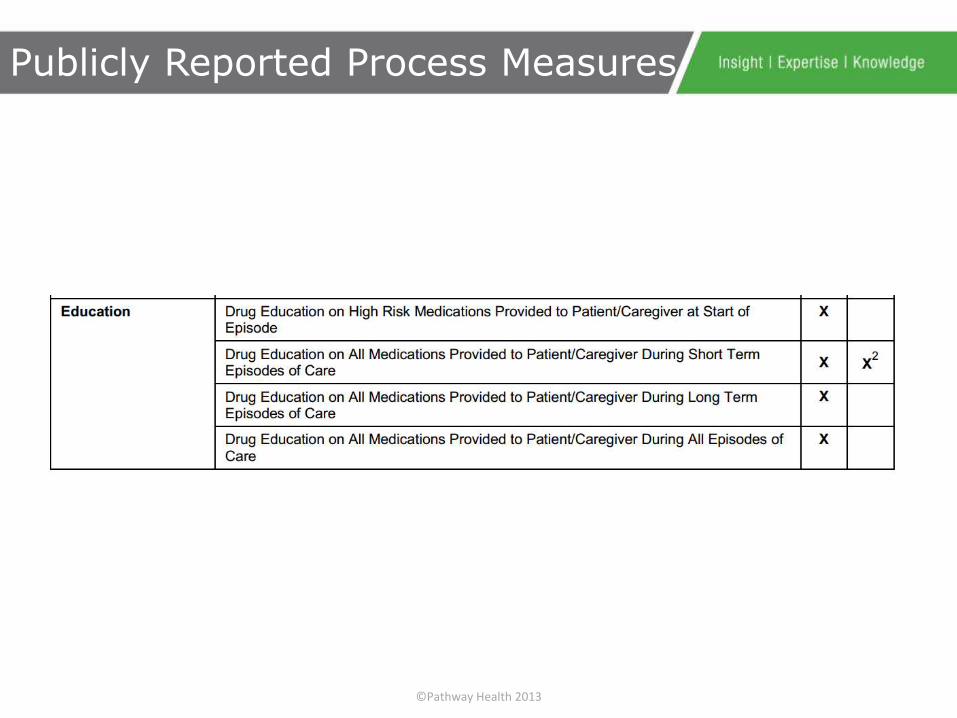
Publicly Reported Process Measures

©Pathway Health 2013
Publicly Reported Process Measures
©Pathway Health 2013
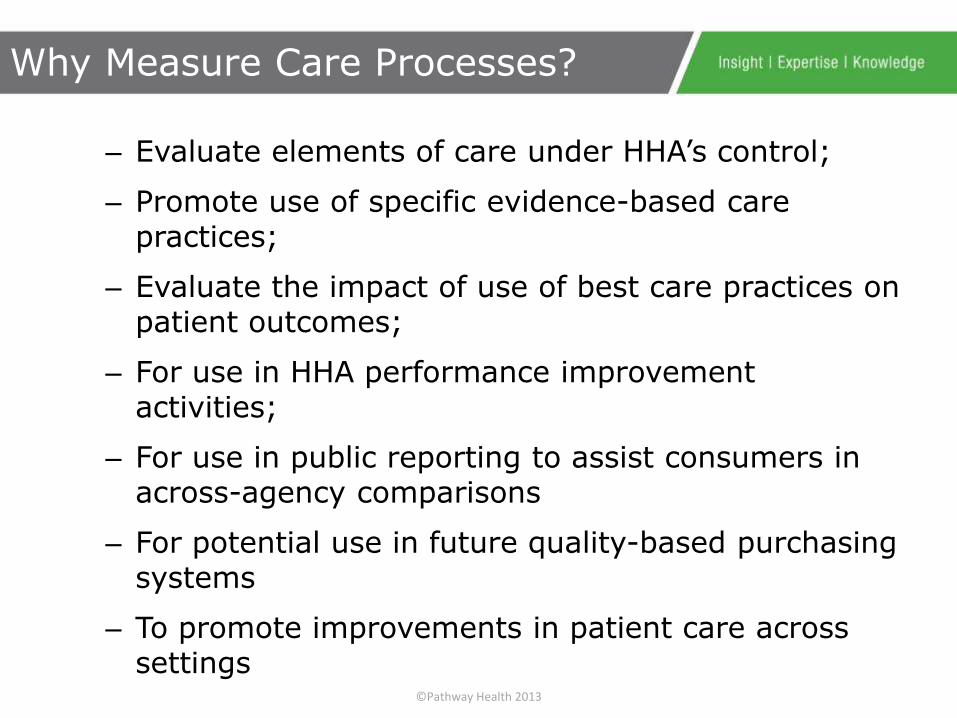
– Evaluate elements of care under HHA’s control;
– Promote use of specific evidence-based care practices;
– Evaluate the impact of use of best care practices on patient outcomes;
– For use in HHA performance improvement activities;
– For use in public reporting to assist consumers in across-agency comparisons
– For potential use in future quality-based purchasing systems
– To promote improvements in patient care across settings
Why Measure Care Processes?

©Pathway Health 2013
Process Quality Measure Report
©Pathway Health 2013
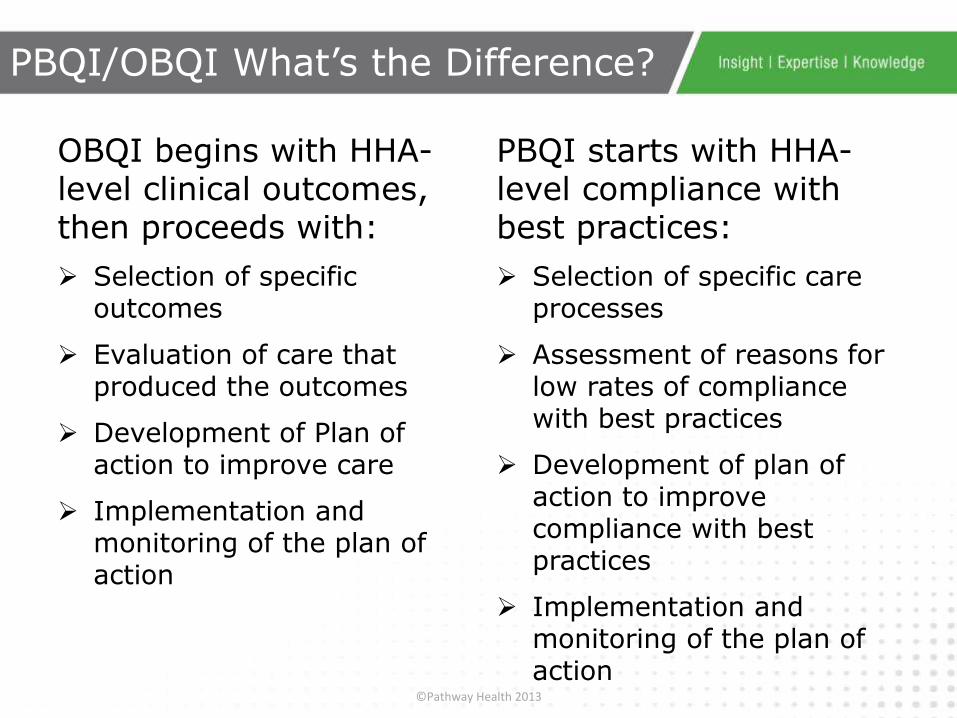
OBQI begins with HHA-level clinical outcomes, then proceeds with:
Selection of specific outcomes
Evaluation of care that produced the outcomes
Development of Plan of action to improve care
Implementation and monitoring of the plan of action
PBQI starts with HHA-level compliance with best practices:
Selection of specific care processes
Assessment of reasons for low rates of compliance with best practices
Development of plan of action to improve compliance with best practices
Implementation and monitoring of the plan of action
PBQI/OBQI What’s the Difference?

©Pathway Health 2013
The Role of OBQI, OBQM and PBQI in the Agency’s Overall Quality Program
©Pathway Health 2013
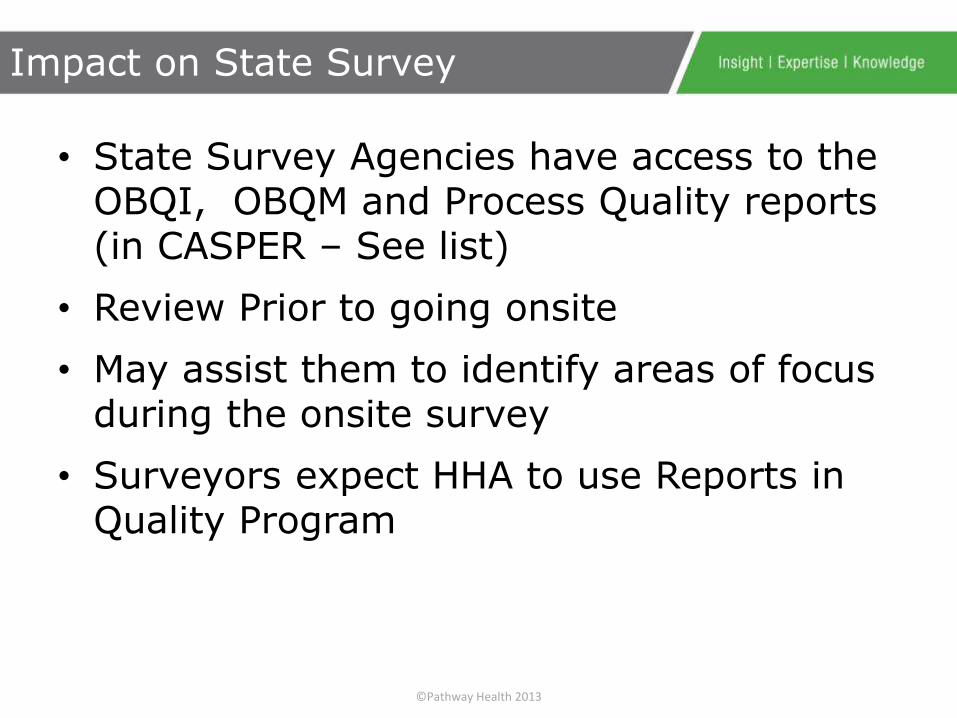
• State Survey Agencies have access to the OBQI, OBQM and Process Quality reports (in CASPER – See list)
• Review Prior to going onsite
• May assist them to identify areas of focus during the onsite survey
• Surveyors expect HHA to use Reports in Quality Program
Impact on State Survey
©Pathway Health 2013
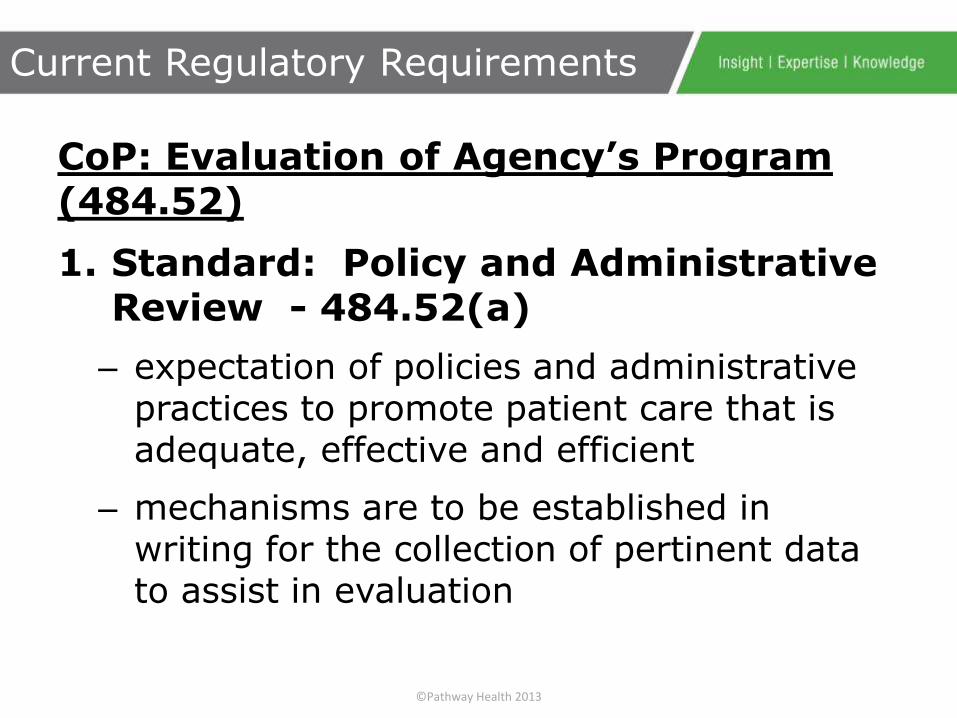
CoP: Evaluation of Agency’s Program (484.52)
1. Standard: Policy and Administrative Review - 484.52(a)
– expectation of policies and administrative practices to promote patient care that is adequate, effective and efficient
– mechanisms are to be established in writing for the collection of pertinent data to assist in evaluation
Current Regulatory Requirements
©Pathway Health 2013
CoP: Evaluation of Agency’s Program (484.52)
2. Standard: Clinical Record Review -484.52(b)
– Quarterly record review is required to determine whether established agency policies are being followed in the provision of care
– investigations are part of the agency’s overall quality monitoring and improvement plan
Impact on State Survey
©Pathway Health 2013

©Pathway Health 2013
• Access and review CASPER reports each month
• Understand what the reports are telling you
• Analyze the information
• Study HHA practices that are affecting your data
• Make changes to your HHA practices
• Observe differences in the reports
Big Picture

Questions?
Thank You!
Pathway Health Services is a phone call away.
We are able to provide assistance onsite or from
afar!
1-651-407-8699www.pathwayhealth.com
©Pathway Health 2015
This presentation is copyrighted information of Pathway Health. This presentation is not to be sold or reused without written authorization of Pathway Health.
49


