Utilising the Jordan Simple - UNRWA
23
microfinance baseline poverty study unrwa microfinance clients in jordan may 2013 www.unrwa.org
Transcript of Utilising the Jordan Simple - UNRWA

microfinance
baseline poverty study unrwa microfinance clients in jordan may 2013
www.unrwa.org
1
Table of Contents
Executive Summary 2 Introduction 4 Methodology 6 Poverty measures 7 Sample distribution 7 Results of the Jordan simple poverty scorecard 9 General poverty results 9 Region and poverty 9 Household size and poverty 10 Loan products and poverty 12 Gender and poverty 13 Client poverty and the ultra poor 14 Poverty and low income 15 Policy implications 19

2
Executive Summary UNRWA’s Microfinance Department (MD) developed three standard simple poverty scorecards (SPS) to enable it to determine the probability of clients being poor, i.e. based on those falling below the national poverty lines in Palestine, Jordan and Syria. The scorecards were derived from expenditure and consumption or income and expenditure survey databases of the government statistical bureaus in Palestine, Jordan and Syria. In Jordan, the SPS was constructed from the 2006 Household Income and Expenditure Survey (HIES). The SPS is a standardised methodology identical to the Grameen Foundation’s progress-out-of-poverty index (PPItm), which is now used in 46 countries to measure the probability of microfinance clients being poor based on national and other standard poverty lines. The SPS developed for Jordan was completed in late 2010 and this report is the first test of its implementation on UNRWA’s microfinance clients. The department’s Social Performance Management Unit (SPMU) conducted a sample survey using the Jordan SPS to develop its first baseline of the poverty rates of its clients in Jordan. With this baseline, in future the department will monitor the probability of poverty of every client in the programme through enumerating a scorecard questionnaire for each client every time they obtain a loan. This will enable the department to determine the ratio of poor clients at different periods and eventually to trace individual client movement in and out of poverty overtime. In addition to identifying poor clients’ households, the scorecard also provides data on client households living on a per person income at double and one-and-half times the national poverty level. This information is important since those managing to live marginally above the poverty line can easily fall below this measure due to business troubles, economic shocks, health emergencies or unemployment. Such information is also important for targeting low-income clients, as a high percentage of poor and low-income clients is a positive indicator of just how far downstream UNRWA’s microfinance outreach is able to flow. The more downstream its focus to poorer and low-income clients, then the better it is able to ensure its social mission is achieved. The initial SPS questionnaire for Jordan was implemented through a randomized sample survey of 568 clients from the 5,772 active clients from the programme in Jordan. The summary results of the initial survey with the nine poverty indicator questions showed that:
59.4 per cent of the department’s clients and their families live below 200 per cent of the Jordan national poverty line of JD 3.04 per person per day
36.8 per cent of clients and their families live below 150 per cent of the Jordan national poverty line of JD 2.28 per person per day
12.4 per cent of the department’s clients and their families exist under the Jordan national poverty line of JD 1.52 per person per day
6.2 per cent of clients and their families survive under the USAID extreme poverty line of JD 1.23 per person per day
48.2 per cent of clients and their families fell below an income of the USD 5/day at 2005 purchasing power parity (PPP)
26.8 per cent of clients and their families fell below an income of the USD 3.75/day at 2005 purchasing power parity (PPP)
7.9 per cent of clients and their families fell below an income of the USD 2.50/day at 2005 purchasing power parity (PPP)
0.3 per cent of clients and their families fell below an income of the USD 1.25/day at 2005 purchasing power parity (PPP)

3
These figures show that 12.4 per cent of UNRWA’s microfinance client households in Jordan are poor, with just 6.2 per cent living below the USAID extreme poverty line. 1 More than half of client households are low-income with 59.4 per cent of clients living on an income below double the national poverty line, and 36.8 per cent, live with an income of no more than one-and-a-half times the national poverty line.
4
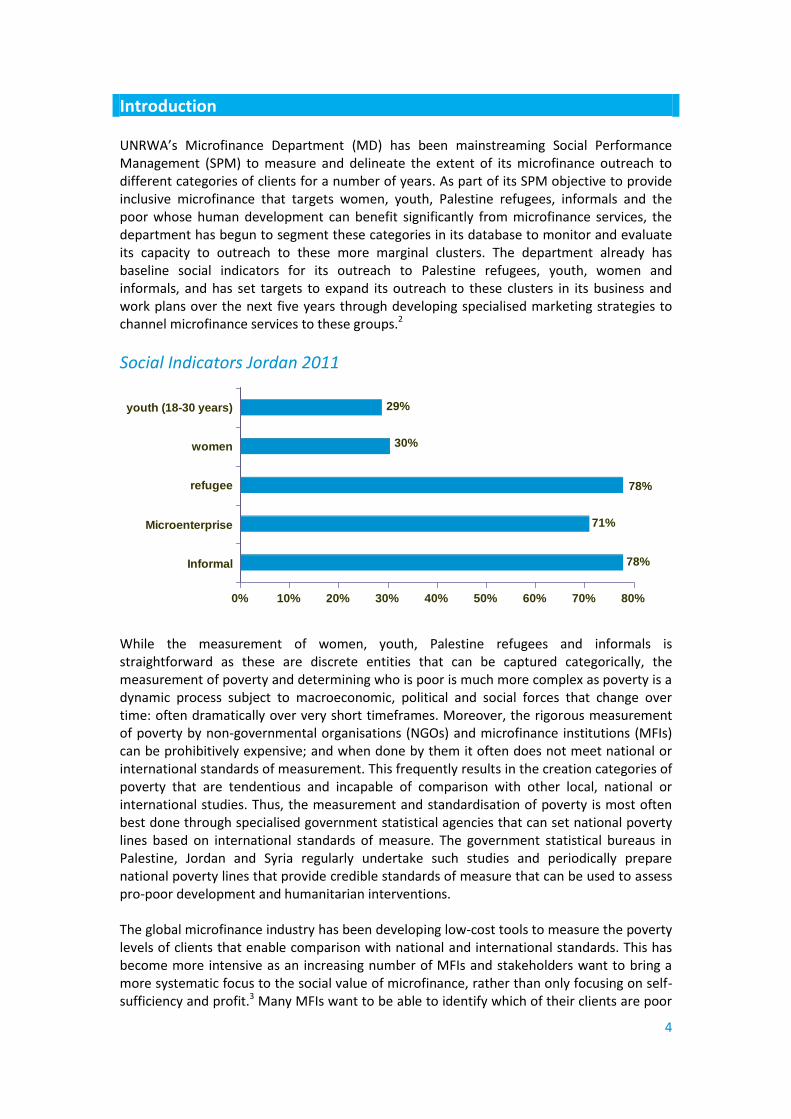
Introduction UNRWA’s Microfinance Department (MD) has been mainstreaming Social Performance Management (SPM) to measure and delineate the extent of its microfinance outreach to different categories of clients for a number of years. As part of its SPM objective to provide inclusive microfinance that targets women, youth, Palestine refugees, informals and the poor whose human development can benefit significantly from microfinance services, the department has begun to segment these categories in its database to monitor and evaluate its capacity to outreach to these more marginal clusters. The department already has baseline social indicators for its outreach to Palestine refugees, youth, women and informals, and has set targets to expand its outreach to these clusters in its business and work plans over the next five years through developing specialised marketing strategies to channel microfinance services to these groups.2
Social Indicators Jordan 2011
78%
71%
78%
30%
29%
0% 10% 20% 30% 40% 50% 60% 70% 80%
Informal
Microenterprise
refugee
women
youth (18-30 years)
While the measurement of women, youth, Palestine refugees and informals is straightforward as these are discrete entities that can be captured categorically, the measurement of poverty and determining who is poor is much more complex as poverty is a dynamic process subject to macroeconomic, political and social forces that change over time: often dramatically over very short timeframes. Moreover, the rigorous measurement of poverty by non-governmental organisations (NGOs) and microfinance institutions (MFIs) can be prohibitively expensive; and when done by them it often does not meet national or international standards of measurement. This frequently results in the creation categories of poverty that are tendentious and incapable of comparison with other local, national or international studies. Thus, the measurement and standardisation of poverty is most often best done through specialised government statistical agencies that can set national poverty lines based on international standards of measure. The government statistical bureaus in Palestine, Jordan and Syria regularly undertake such studies and periodically prepare national poverty lines that provide credible standards of measure that can be used to assess pro-poor development and humanitarian interventions. The global microfinance industry has been developing low-cost tools to measure the poverty levels of clients that enable comparison with national and international standards. This has become more intensive as an increasing number of MFIs and stakeholders want to bring a more systematic focus to the social value of microfinance, rather than only focusing on self-sufficiency and profit.3 Many MFIs want to be able to identify which of their clients are poor

5
and trace their poverty levels through various lending cycles to help design products and financial services that are more attuned to their needs. In this context, the department has looked at a number of these tools, and undertook a contract to develop three separate Simple Poverty Scorecards (SPS) for Palestine, Jordan and Syria. The SPS is a standardised methodology that is identical to the Grameen Foundation progress out of poverty index (PPITM)4, which is now used in 46 countries. These SPS or PPI are developed from national expenditure and consumption survey databases, or other similar surveys, through statistical modelling and regression on the national database to develop a scorecard of ten questions that can be administered within a few minutes, which will determine the statistical likelihood of a client and his/her family falling below or above the national poverty line, and other poverty lines. Each answer in the questionnaire has a weighted score, with the total scores for each question calculated at the end of each poverty scorecard to provide the results and the probability of clients falling below different poverty lines. These totals are then compared against poverty line tables to determine the probable likelihood of clusters of clients falling below the various poverty lines, including national and extreme poverty lines. To achieve this, UNRWA and its contractor have worked together with the Palestinian, Jordanian and Syrian statistical bureaus to develop an SPS for each country.5 Thus, the development of the SPS now fills a gap in the department’s SPM by augmenting its reporting and developing its monitoring and evaluation capability. With poverty alleviation and outreach to the poor a significant component of the department’s mission, the concentration on developing poverty indicators that measure outreach to poor and low-income clients is a crucial step towards achieving this objective and translating a mission goal into practice. By utilising the poverty scorecard the department is able to engage more directly with poor clients through focus group discussions and satisfaction surveys and other tools to develop and design products and loan-terms that better cater to their needs and capacities. As the new tool identifies which clients are poor, it will bring better poverty focus to each field, each product and each branch office, which will allow the field office and branch management teams to centre their own roles and responsibilities in developing pro-poor portfolios and identifying which products best serve this purpose. As it develops its capacity with the scorecard, the department will begin to monitor progress out of poverty by tracking the poverty status of each client at their entry point into the programme and to re-gauge their progress with ongoing participation at each new loan cycle.
6
Methodology This report provides the results of the department’s first random sample survey utilising the Jordan Simple Poverty Scorecard (SPS) to determine the likelihood of poverty among its microfinance clients in Jordan. The SPS or scorecard questionnaire consists of two sections:6 General (identifying) information for each client, such as: client name, gender, client
number, loan type, initial participation date (date of joining MD), loan officer’s name, loan officer number, the date, branch name and the household size.
Ten short poverty indicator questions7, all with answer options that are pre-coded, close-ended and restricted to No/Yes or multiple-choice.
The target population used to develop the initial baseline was all those MD clients in Jordan with active loans valid at the end of March 2011. This sampling frame consisted of 5,772 clients, distributed amongst the department’s branch network in Jordan; including Wehdat, Al-Balad, Al-Bayader and the Zarqa branch offices. These four branches provide microfinance outreach to areas within the Amman and Zarqa governorates.
The sample size and sample design was based on a calculated sample size of 568 clients, which produced a ±4 per cent precision level (margin error), with a confidence level of 95 per cent, and P (percentage picking a choice) = 0.5. The sample was designed as a stratified random sample to produce reliable poverty statistics on the target population according to: Branch office (Wehdat, Al-Balad, Bayader and Zarqa) to provide results by the region
where the loans were financed; Loan type (MEC, CLP, WHC) to provide results by the different kinds of loans products; 8
and Gender to provide results by men and women.
Data enumeration and collection was conducted by 36 loan officers from the department in Jordan through face-to-face interviews with all randomly selected clients at their businesses or homes. This fieldwork lasted for 44 working days and was conducted during 30 July through 30 September 2011. The data processing, verification and cleansing were done by the SPM Unit, where data entry and tabulation were performed using SPSS and EXCEL. Data entry was organised in one file, with a data entry template designed to reflect an exact image of the questionnaire, and including logical checks, range checks, consistency checks and cross-validation. During the data analysis one question was removed from the questionnaire, and the questionnaires and data were analysed based on nine questions. Question number nine, which collected data about the number of land lines/mobiles owned by household members, was out of date as access to mobiles and ownership of mobiles in Jordan is very common even amongst the poorest households.
7
Poverty Measures With the Jordan SPS a number of different poverty metrics were developed as part of the scorecard to allow for comparison locally, regionally and globally. 9 These metrics include: The Jordan national poverty line (2006), which measures poverty according to the per
capita total expenditure on a basket of food and non-food goods and services with an average of JD 1.52 per person per day;
The USAID extreme poverty line, which is the median expenditure of people (not households) below the national line, calculated by governorate and averages of JD 1.23 per person per day;
200 per cent of the national poverty line is JD 3.04 per person per day; 150 per cent of the national poverty line is JD 2.28 per person per day; The USD 1.25/day at PPP for 2005 which is JD 0.66 in 2006; The USD 2.50/day at PPP for 2005 which is JD 1.32 in 2006; The USD 3.75/day at PPP for 2005 which is JD 1.98 in 2006; and The USD 5.00/day at PPP for 2005 which is JD 2.64 in 2006.
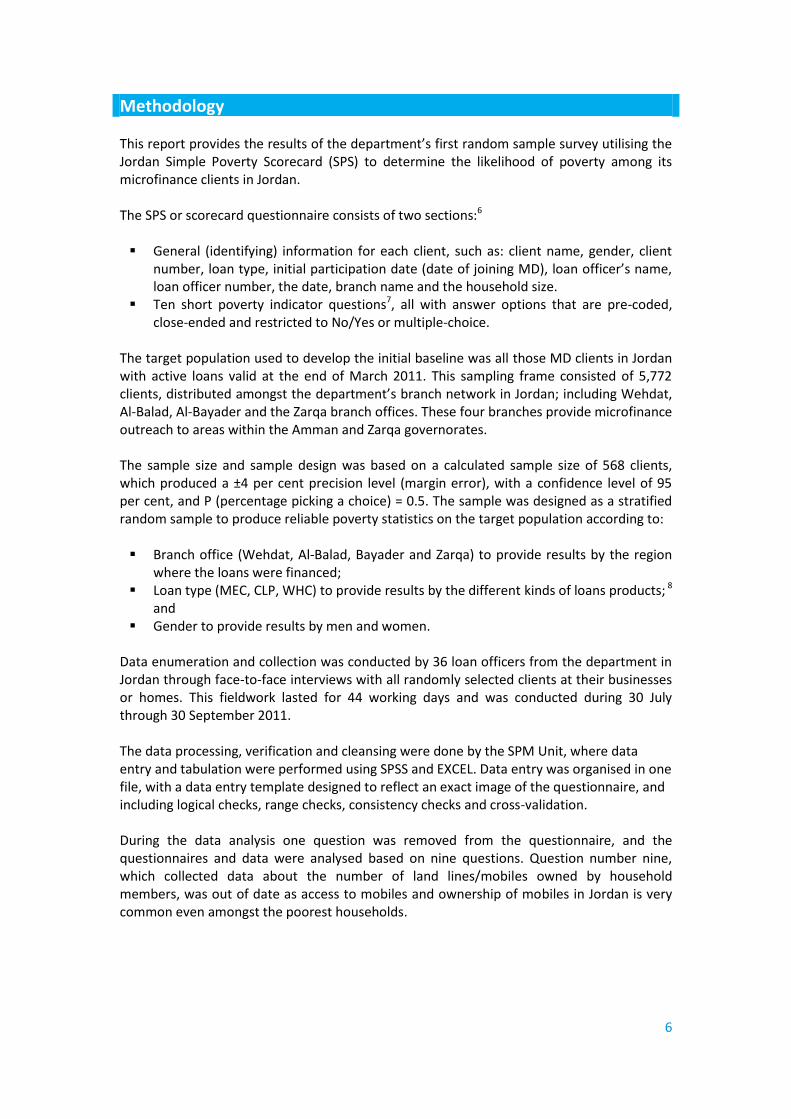
Sample Distribution The random survey was stratified in order to provide reliable statistical data according to gender, loan product and branch office. In terms of household demographics, the average household size was five members per household among clients of the Jordan branch offices.
Gender Distribution of Sample Survey
77.50%
22.50%
0.00% 20.00% 40.00% 60.00% 80.00% 100.00%
Male
Female
The gender distribution of the sample is depicted in the chart above, indicating that male clients accounted for 77.5 per cent of this sample in line with their share of the active loan portfolio, while female clients accounted for 22.5 per cent.

8
Product distribution of sample survey
59.90%
32.60%
7.50%
0.00% 10.00% 20.00% 30.00% 40.00% 50.00% 60.00% 70.00%
MEC
CLP
WHC
The distribution of the clients sampled according to the product distribution of the active loans is depicted in the graph above. The department’s core microenterprise credit (MEC) product accounted for the most significant share of the sample at 59.90 per cent. This was followed by the consumer loan product (CLP), which accounted for 32.60 per cent, followed by the women household credit product (WHC), which accounted for 7.50 per cent of the sample.
Branch office share of sample survey
25%
25%
25%
25%
0% 5% 10% 15% 20% 25% 30%
Zarqa
Al-Bayader
Al-Balad
Wehdat
The distribution of the sample according to branch office share is shown in the chart above. Each branch in Jordan shared 25 per cent from the sample.

9
Results of the Jordan simple poverty scorecard General Poverty Results The findings from the poverty scorecard show that 12.4 per cent of UNRWA’s microfinance programme clients and their families live below the Jordanian national poverty line of JD 1.52 per person per day, with 6.2 per cent of clients and their families surviving under the USAID extreme poverty line of JD 1.23 per person per day. A similar pattern emerges when we use the income-based indicator of purchasing power parity (PPP), which shows that 48.2 per cent of client households fell below an income of USD 5.00 per person per day at 2005 PPP and 26.8 per cent of client households lived on an income of less than USD 3.75 per person per day. While 7.9 per cent of clients in Jordan lived on an income of less than USD 2.50 per day per person, ultra poor clients were extremely rare with just 0.3 per cent of clients and their households having an income of less than USD 1.25 per person per day. Clients from the Zarqa branch were poorer than others, with over 14 per cent living under the national poverty line compared to 13 per cent for clients of the Wehdat and Al-Balad branches respectively, with clients in the Al-Bayader area of Amman less poor than elsewhere with just 10 per cent of clients falling below the national poverty line. In addition, there were similar variations in the different urban districts in terms of those living below the USAID extreme poverty line, with seven per cent of clients in Zarqa, six per cent of clients in Al-Balad area and Wehdat, and five per cent of clients in the Al-Bayader area of Amman surviving below this measure. Female clients were marginally poorer than male clients with 13 per cent falling below the national poverty line compared to 12 per cent of male clients falling below the same line. Some 15 per cent of clients with the women-only, women’s household credit (WHC) product, supporting household-based income generating activities, were poor and their rate of poverty was higher than other clients.
Region and Poverty The microfinance department in Jordan had four branch offices that were fully operating at the time the sample survey was undertaken.10 Three branch offices are located in Amman and one in Zarqa. The Amman branches are in the districts of: Wehdat, which serves the area of Wehdat refugee camp that includes the largest Palestine refugee population in Amman; Al-Balad branch office is located in the town centre and serves the Amman city centre; the Bayader branch office, which is located at the Al-Bayader neighbourhood of Amman; while the Zarqa branch serves the city of Zarqa and its neighbourhoods. As the sample survey was designed to provide representative statistics from each branch office, the branches represent appropriate proxies for data on each region.
10
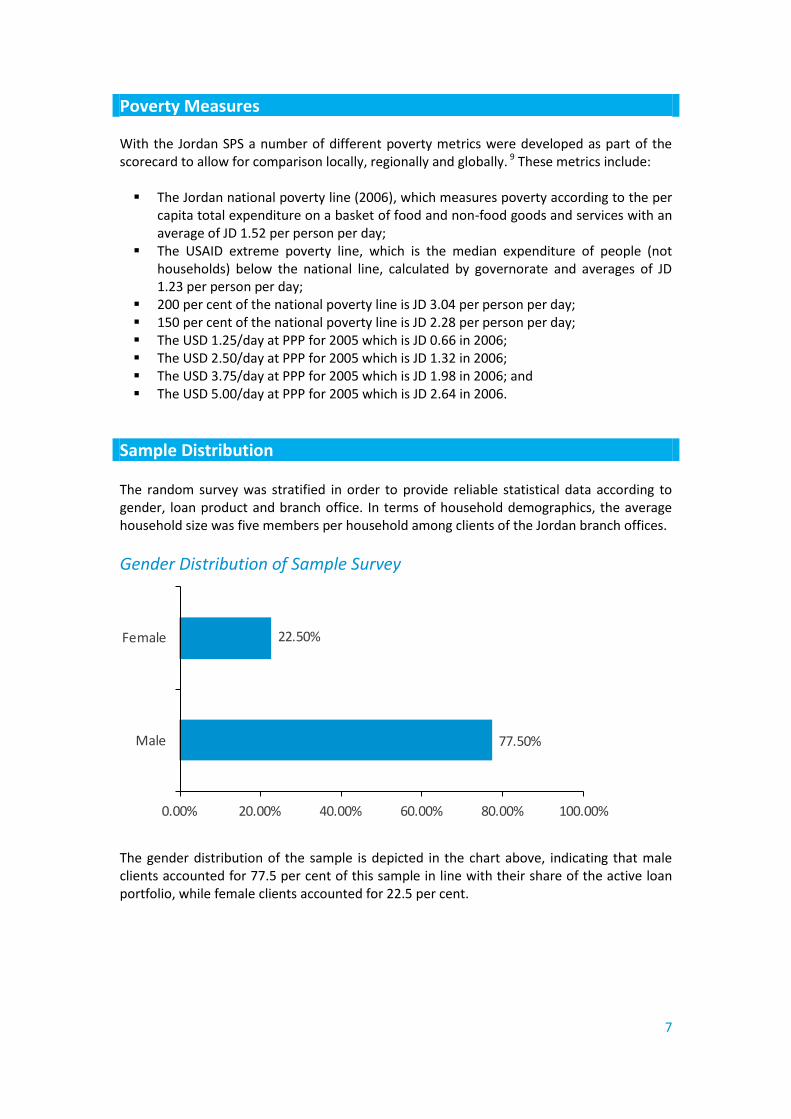
Poverty rates by branch office
Branch National poverty line USAID extreme
poverty line
Wehdat 12.7% 6.2%
Al-Balad 12.5% 6.4%
Al-Bayader 9.8% 4.8%
Zarqa 14.5% 7.4%
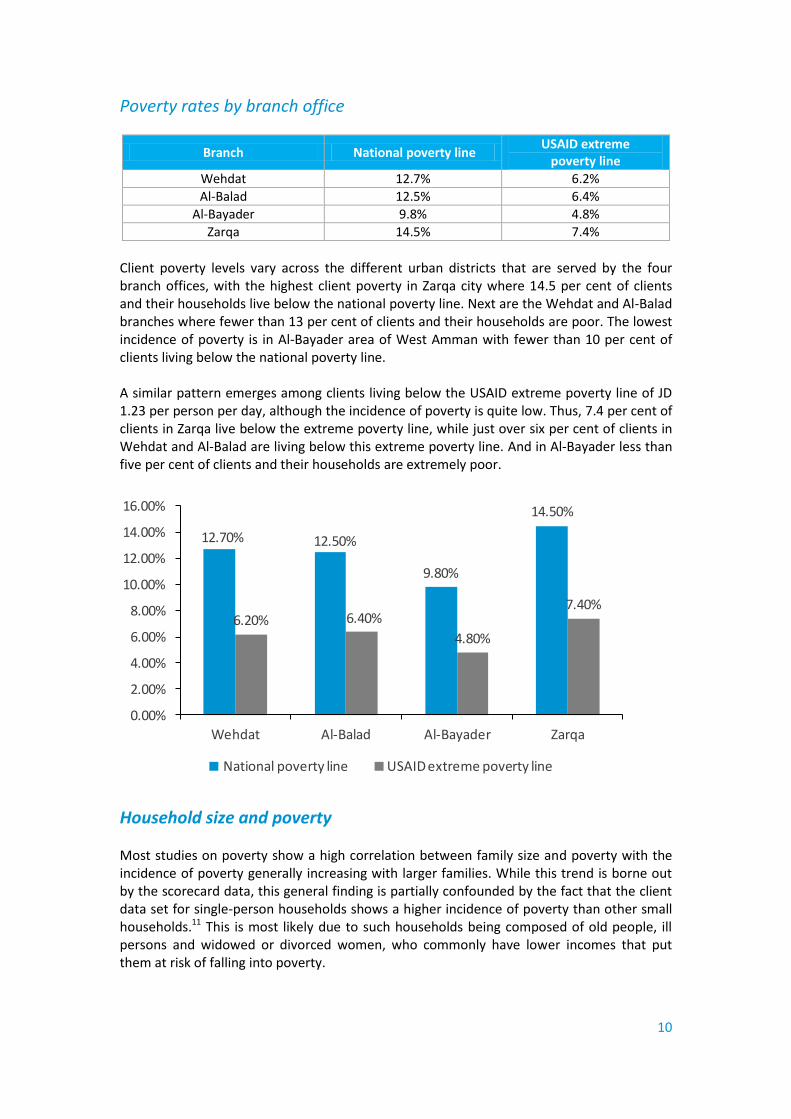
Client poverty levels vary across the different urban districts that are served by the four branch offices, with the highest client poverty in Zarqa city where 14.5 per cent of clients and their households live below the national poverty line. Next are the Wehdat and Al-Balad branches where fewer than 13 per cent of clients and their households are poor. The lowest incidence of poverty is in Al-Bayader area of West Amman with fewer than 10 per cent of clients living below the national poverty line. A similar pattern emerges among clients living below the USAID extreme poverty line of JD 1.23 per person per day, although the incidence of poverty is quite low. Thus, 7.4 per cent of clients in Zarqa live below the extreme poverty line, while just over six per cent of clients in Wehdat and Al-Balad are living below this extreme poverty line. And in Al-Bayader less than five per cent of clients and their households are extremely poor.
12.70% 12.50%
9.80%
14.50%
6.20% 6.40%
4.80%
7.40%
0.00%
2.00%
4.00%
6.00%
8.00%
10.00%
12.00%
14.00%
16.00%
Wehdat Al-Balad Al-Bayader Zarqa
National poverty line USAID extreme poverty line
Household size and poverty Most studies on poverty show a high correlation between family size and poverty with the incidence of poverty generally increasing with larger families. While this trend is borne out by the scorecard data, this general finding is partially confounded by the fact that the client data set for single-person households shows a higher incidence of poverty than other small households.11 This is most likely due to such households being composed of old people, ill persons and widowed or divorced women, who commonly have lower incomes that put them at risk of falling into poverty.

11
Client households composed of 2-3 members have the lowest rate of poverty, with less than five per cent of such client households, in all areas, likely to be poor. The poverty range in households of 4-5 persons was also relatively low with the highest rate being nine per cent among both Wehdat and Zarqa households. This was followed by Al-Balad with a poverty rate of 8.1 per cent, and finally Al-Bayader clients with just 3.9 per cent from 4-5 person households falling below the national poverty line. In client households of 6-7 persons, the highest rate of poverty was in Zarqa with a poverty rate of 16 per cent, and the lowest rate of poverty was in Al-Bayader at 13.1 per cent. In 8-9 person households, the incidence of poverty increases very significantly, with 37.5 per cent of client households in Zarqa living in poverty, 28 per cent in Al-Bayader, 27.7 per cent in Al-Balad, and 27.4 per cent in Wehdat. But this increases even more significantly in households with ten or more persons, where the highest rate of poverty for such households was in Zarqa were 41.9 per cent households lived below the national poverty line on an income of JD 1.52 per person per day or less. The lowest rate of poverty in such large households was in Al-Bayader where 21.3 per cent of client households lived below the national poverty line.
National poverty rates by household size and branch office
Household size (No. of persons)
Jordan branch offices
Wehdat Al-Balad Al-Bayader Zarqa
1 0.0% - 7.8% 23.1%
2-3 2.6% 4.4% 0.9% 3.7%
4-5 9.0% 8.1% 3.9% 9.0%
6-7 14.3% 15.6% 13.1% 16.0%
8-9 27.4% 27.7% 28.0% 37.5%
10+ 38.7% 30.7% 21.3% 41.9%
Thus, the incidence of poverty, while significant, is relatively lower among clients from the Al-Bayader area of Amman. The incidence of poverty among clients in Wehdat and Al-Balad are similar, while client poverty in Zarqa is relatively higher than the Amman branch offices.
USAID extreme poverty rates by household size and branch office
Household size (No .of persons)
Jordan branch offices
Wehdat Al-Balad Al-Bayader Zarqa
1 0.0% - 3.2% 13.7%
2-3 1.0% 2.5% 0.2% 1.4%
4-5 3.8% 3.3% 1.5% 3.5%
6-7 6.8% 7.9% 6.9% 7.6%
8-9 14.2% 16.9% 14.3% 25.3%
10+ 22.9% 18.5% 11.0% 24.8%
The majority of client households served by the four branch offices in Jordan live above the USAID extreme poverty line, with poorer clients more likely to be served by the Zarqa branch office. In the case of 2-3 person households, less than three per cent live below the extreme poverty line of JD 1.23 per person per day. However, the rate of clients living below the extreme poverty line for Jordan rises within households with more family members. In the case of 6-7 person households, the percentage of clients living below the USAID extreme
12
poverty line increases to 6.8 per cent at the Wehdat branch, 7.9 per cent at Al-Balad, 6.9 per cent at Al-Bayader, and 7.6 per cent at Zarqa. In 8-9 person households, the incidence of extreme poverty further increased reaching up to 25.3 per cent in Zarqa, 16.9 per cent in Al-Balad, 14.3 per cent at Al-Bayader area of Amman, and 14.2 per cent in and around the Wehdat refugee camp.
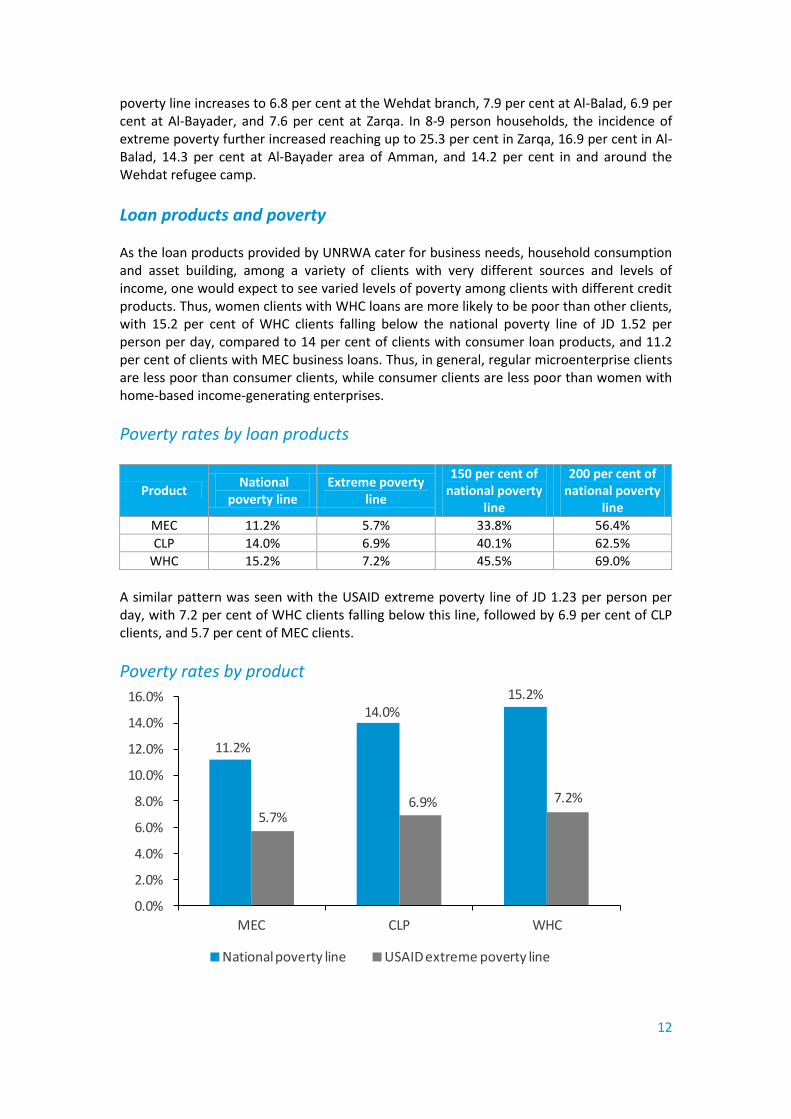
Loan products and poverty As the loan products provided by UNRWA cater for business needs, household consumption and asset building, among a variety of clients with very different sources and levels of income, one would expect to see varied levels of poverty among clients with different credit products. Thus, women clients with WHC loans are more likely to be poor than other clients, with 15.2 per cent of WHC clients falling below the national poverty line of JD 1.52 per person per day, compared to 14 per cent of clients with consumer loan products, and 11.2 per cent of clients with MEC business loans. Thus, in general, regular microenterprise clients are less poor than consumer clients, while consumer clients are less poor than women with home-based income-generating enterprises.
Poverty rates by loan products
Product National
poverty line Extreme poverty
line
150 per cent of national poverty
line
200 per cent of national poverty
line
MEC 11.2% 5.7% 33.8% 56.4%
CLP 14.0% 6.9% 40.1% 62.5%
WHC 15.2% 7.2% 45.5% 69.0%
A similar pattern was seen with the USAID extreme poverty line of JD 1.23 per person per day, with 7.2 per cent of WHC clients falling below this line, followed by 6.9 per cent of CLP clients, and 5.7 per cent of MEC clients.
Poverty rates by product
11.2%
14.0%15.2%
5.7%6.9% 7.2%
0.0%
2.0%
4.0%
6.0%
8.0%
10.0%
12.0%
14.0%
16.0%
MEC CLP WHC
National poverty line USAID extreme poverty line
13
Moreover, there is a higher preponderance of low-income households among clients with WHC loans than among clients with other loans. Thus, 45.5 per cent of WHC clients live on resources of no more than one-and-a-half times the per capita daily income of the national poverty line, compared to 40.1 per cent of consumer loan clients and 33.8 per cent of microenterprise loan clients. Additionally, a significant majority of WHC and CLP clients are from low-income households, with 69 per cent of WHC clients living on resources of less than double the national poverty line of JD 3.04 per person per day. Furthermore, 62.5 per cent of CLP clients and 56.4 per cent of MEC clients live in low-income households where they live on no more than double the national poverty line. These households can easily fall into poverty through unemployment, ill health and other family crises.
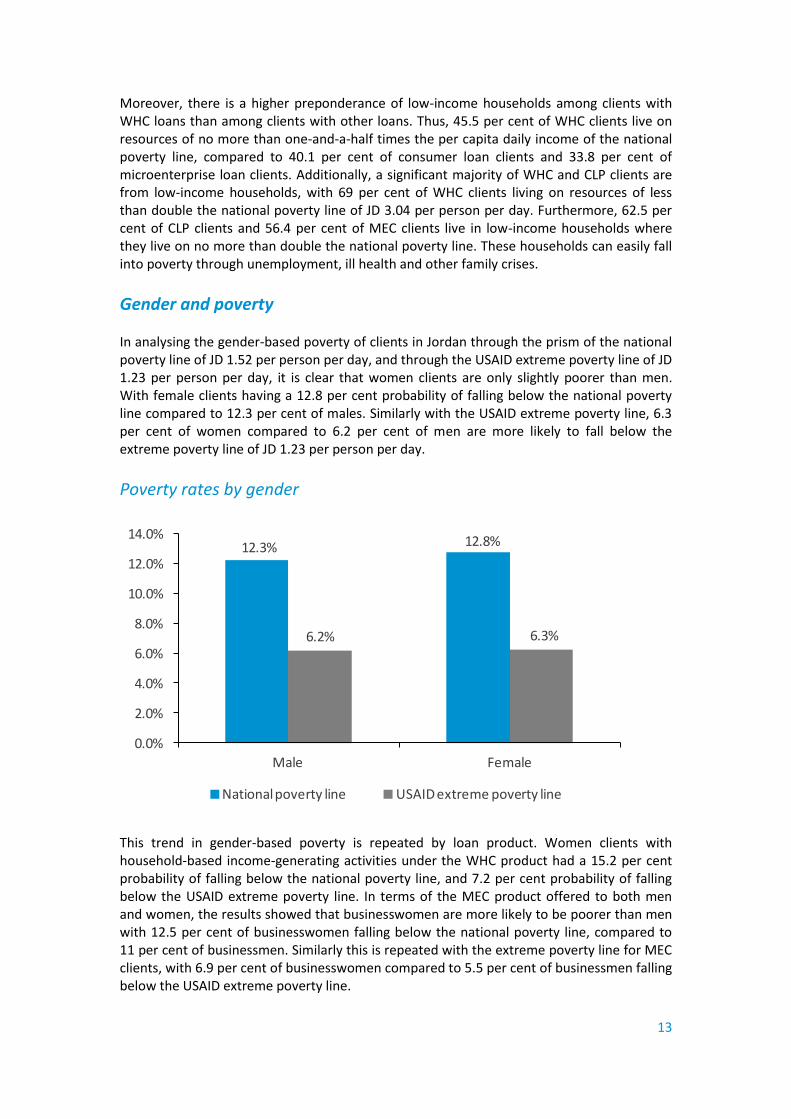
Gender and poverty In analysing the gender-based poverty of clients in Jordan through the prism of the national poverty line of JD 1.52 per person per day, and through the USAID extreme poverty line of JD 1.23 per person per day, it is clear that women clients are only slightly poorer than men. With female clients having a 12.8 per cent probability of falling below the national poverty line compared to 12.3 per cent of males. Similarly with the USAID extreme poverty line, 6.3 per cent of women compared to 6.2 per cent of men are more likely to fall below the extreme poverty line of JD 1.23 per person per day.
Poverty rates by gender
12.3% 12.8%
6.2% 6.3%
0.0%
2.0%
4.0%
6.0%
8.0%
10.0%
12.0%
14.0%
Male Female
National poverty line USAID extreme poverty line
This trend in gender-based poverty is repeated by loan product. Women clients with household-based income-generating activities under the WHC product had a 15.2 per cent probability of falling below the national poverty line, and 7.2 per cent probability of falling below the USAID extreme poverty line. In terms of the MEC product offered to both men and women, the results showed that businesswomen are more likely to be poorer than men with 12.5 per cent of businesswomen falling below the national poverty line, compared to 11 per cent of businessmen. Similarly this is repeated with the extreme poverty line for MEC clients, with 6.9 per cent of businesswomen compared to 5.5 per cent of businessmen falling below the USAID extreme poverty line.
14
National and extreme poverty rates by products and gender
Loan product National poverty line USAID extreme poverty line
Male Female Male Female
MEC 11.0% 12.5% 5.5% 6.9%
CLP 14.9% 10.5% 7.5% 4.8%
WHC - 15.2% - 7.2%
Moreover, male clients and their households who receive the consumer loan product (CLP) are more likely to be poor than female clients. Thus, 14.9 per cent of men compared to 10.5 per cent of women clients with CLP loans falling below the Jordanian national poverty line of JD 1.52 per person per day. This pattern is repeated for the poorest clients, where 7.5 per cent of male CLP clients compared to 4.8 per cent of women clients and their households fall below the USAID extreme poverty line of JD 1.23 per person per day.
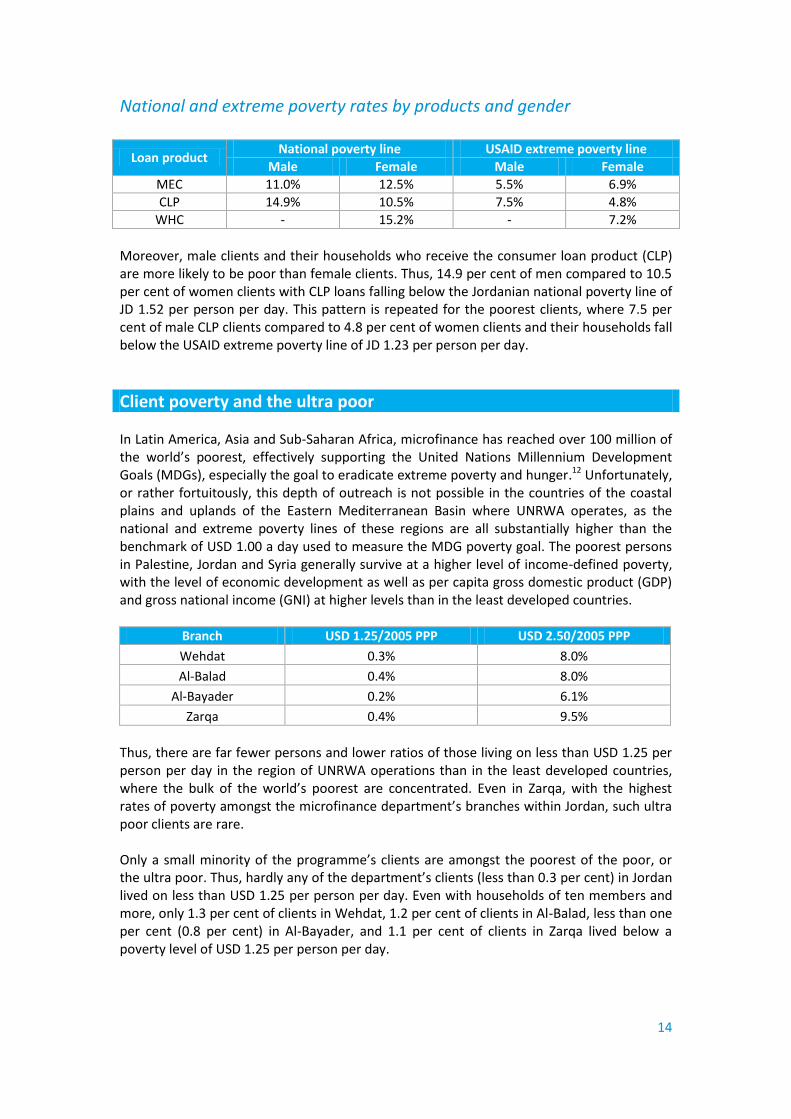
Client poverty and the ultra poor In Latin America, Asia and Sub-Saharan Africa, microfinance has reached over 100 million of the world’s poorest, effectively supporting the United Nations Millennium Development Goals (MDGs), especially the goal to eradicate extreme poverty and hunger.12 Unfortunately, or rather fortuitously, this depth of outreach is not possible in the countries of the coastal plains and uplands of the Eastern Mediterranean Basin where UNRWA operates, as the national and extreme poverty lines of these regions are all substantially higher than the benchmark of USD 1.00 a day used to measure the MDG poverty goal. The poorest persons in Palestine, Jordan and Syria generally survive at a higher level of income-defined poverty, with the level of economic development as well as per capita gross domestic product (GDP) and gross national income (GNI) at higher levels than in the least developed countries.
Branch USD 1.25/2005 PPP USD 2.50/2005 PPP
Wehdat 0.3% 8.0%
Al-Balad 0.4% 8.0%
Al-Bayader 0.2% 6.1%
Zarqa 0.4% 9.5%
Thus, there are far fewer persons and lower ratios of those living on less than USD 1.25 per person per day in the region of UNRWA operations than in the least developed countries, where the bulk of the world’s poorest are concentrated. Even in Zarqa, with the highest rates of poverty amongst the microfinance department’s branches within Jordan, such ultra poor clients are rare. Only a small minority of the programme’s clients are amongst the poorest of the poor, or the ultra poor. Thus, hardly any of the department’s clients (less than 0.3 per cent) in Jordan lived on less than USD 1.25 per person per day. Even with households of ten members and more, only 1.3 per cent of clients in Wehdat, 1.2 per cent of clients in Al-Balad, less than one per cent (0.8 per cent) in Al-Bayader, and 1.1 per cent of clients in Zarqa lived below a poverty level of USD 1.25 per person per day.
15
Household size (No. of persons)
Jordan branch offices Percentage of clients living on less than USD 1.25 per person/day
Wehdat Al-Balad Al-Bayader Zarqa
1 0.0% - 0.0% 0.7%
2-3 0.1% 0.1% 0.0% 0.1%
4-5 0.2% 0.1% 0.0% 0.1%
6-7 0.3% 0.1% 0.2% 0.3%
8-9 0.7% 2.3% 1.0% 2.9%
10+ 1.3% 1.2% 0.8% 1.1%
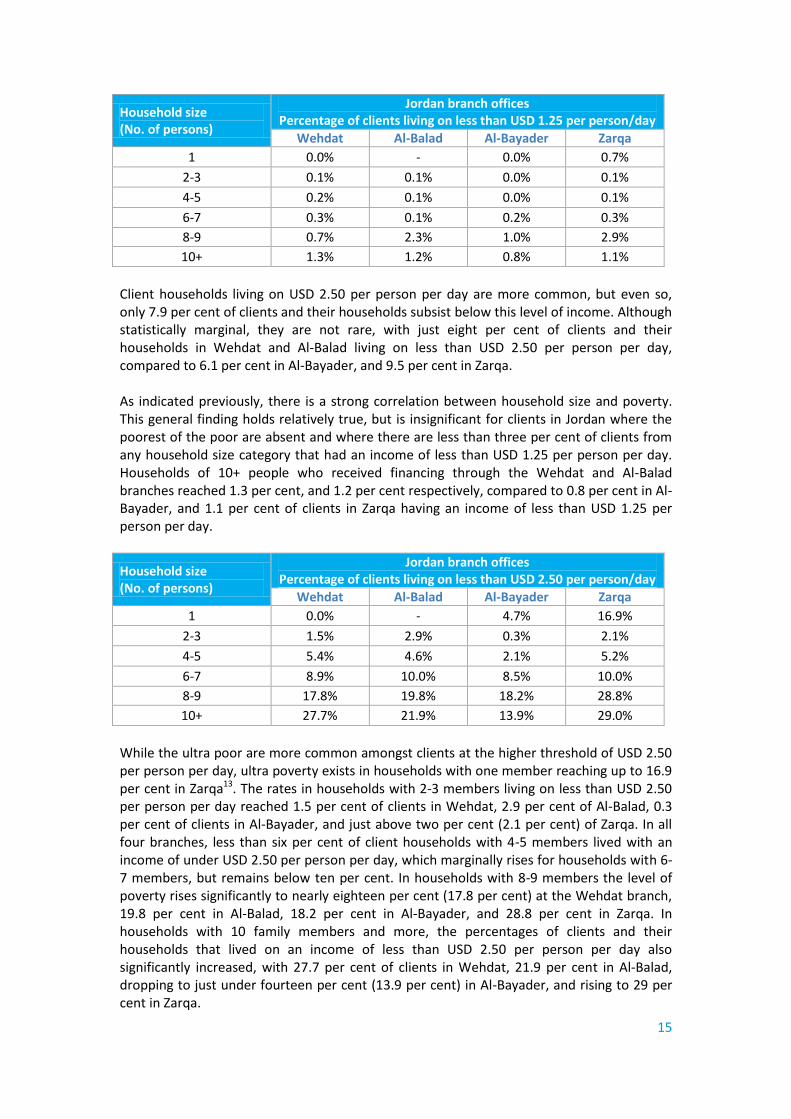
Client households living on USD 2.50 per person per day are more common, but even so, only 7.9 per cent of clients and their households subsist below this level of income. Although statistically marginal, they are not rare, with just eight per cent of clients and their households in Wehdat and Al-Balad living on less than USD 2.50 per person per day, compared to 6.1 per cent in Al-Bayader, and 9.5 per cent in Zarqa. As indicated previously, there is a strong correlation between household size and poverty. This general finding holds relatively true, but is insignificant for clients in Jordan where the poorest of the poor are absent and where there are less than three per cent of clients from any household size category that had an income of less than USD 1.25 per person per day. Households of 10+ people who received financing through the Wehdat and Al-Balad branches reached 1.3 per cent, and 1.2 per cent respectively, compared to 0.8 per cent in Al-Bayader, and 1.1 per cent of clients in Zarqa having an income of less than USD 1.25 per person per day.
Household size (No. of persons)
Jordan branch offices Percentage of clients living on less than USD 2.50 per person/day
Wehdat Al-Balad Al-Bayader Zarqa
1 0.0% - 4.7% 16.9%
2-3 1.5% 2.9% 0.3% 2.1%
4-5 5.4% 4.6% 2.1% 5.2%
6-7 8.9% 10.0% 8.5% 10.0%
8-9 17.8% 19.8% 18.2% 28.8%
10+ 27.7% 21.9% 13.9% 29.0%
While the ultra poor are more common amongst clients at the higher threshold of USD 2.50 per person per day, ultra poverty exists in households with one member reaching up to 16.9 per cent in Zarqa13. The rates in households with 2-3 members living on less than USD 2.50 per person per day reached 1.5 per cent of clients in Wehdat, 2.9 per cent of Al-Balad, 0.3 per cent of clients in Al-Bayader, and just above two per cent (2.1 per cent) of Zarqa. In all four branches, less than six per cent of client households with 4-5 members lived with an income of under USD 2.50 per person per day, which marginally rises for households with 6-7 members, but remains below ten per cent. In households with 8-9 members the level of poverty rises significantly to nearly eighteen per cent (17.8 per cent) at the Wehdat branch, 19.8 per cent in Al-Balad, 18.2 per cent in Al-Bayader, and 28.8 per cent in Zarqa. In households with 10 family members and more, the percentages of clients and their households that lived on an income of less than USD 2.50 per person per day also significantly increased, with 27.7 per cent of clients in Wehdat, 21.9 per cent in Al-Balad, dropping to just under fourteen per cent (13.9 per cent) in Al-Bayader, and rising to 29 per cent in Zarqa.
16
Poverty and low income While the majority of UNRWA’s microfinance client households in Jordan live above the national poverty line of JD 1.52 per person per day, most live on relatively low incomes that leave them susceptible to descent into poverty in the advent of economic shocks or instability that could affect their business, employment or households. A very fine line separates poor from low-income persons, such that many families ― especially those nearest to the margins ― may move in and out of poverty over time, often over very short timeframes, due to cyclical changes in business and household income and expenditure flows. Such changes may be structural, such as loss of employment or long-term contraction of business markets, or seasonal. Most business income is subject to seasonal variation due to changing demand for products and services at different times of the year. For example, demand for goods in the clothing sector peaks at the start of spring/summer and autumn/winter seasons when order books are more likely to be full and staff fully deployed. Income is highest at this time, but tapers off between seasons as orders decline and extra staff is shed. Similarly, in low-income households, household budgets are often tightened by an increase in expenditures at the start of the school year, as children have to be clothed and equipped to return to school. Low-income households are regularly financially stressed during the winter as fuel and heating costs account for more of the family budget, which may also be pinched by increased healthcare costs expended to deal with regular bouts of winter illness affecting various members of the family. In worse case situations, low-income households are especially financially stressed when the serious or long-term illness of a family member incurs significant medical care and costs, which may cause the family to have to balance psychologically draining and emotionally charged choices between the care of a loved-one and the well-being of the family, which can very easily result in the family falling into hardship. Thus, although low-income clients and households are not poor, in Jordan, they are unlikely to have sufficient savings and resources to buffer them from income shocks, or business and family emergencies. Low-income households remain close to the economic margins with livelihoods and ways of living that are often very similar to the poor. As the most common category of clients in Jordan, they are the most important target segment for the outreach of UNRWA’s microfinance products. The Jordan scorecard has used the factors of one-and-a-half and double the national poverty line to determine the potential scale of low-income clients and households. Thus, just under 60 per cent of clients in Jordan and their households (59.4 per cent) have incomes of less than 200 per cent of the national poverty line and live on an income of less than JD 3.04 per person per day, while 36.8 per cent of all clients and their households have incomes of less than 150 per cent of the national poverty line where they live on an income of less than JD 2.28 per person per day.
17
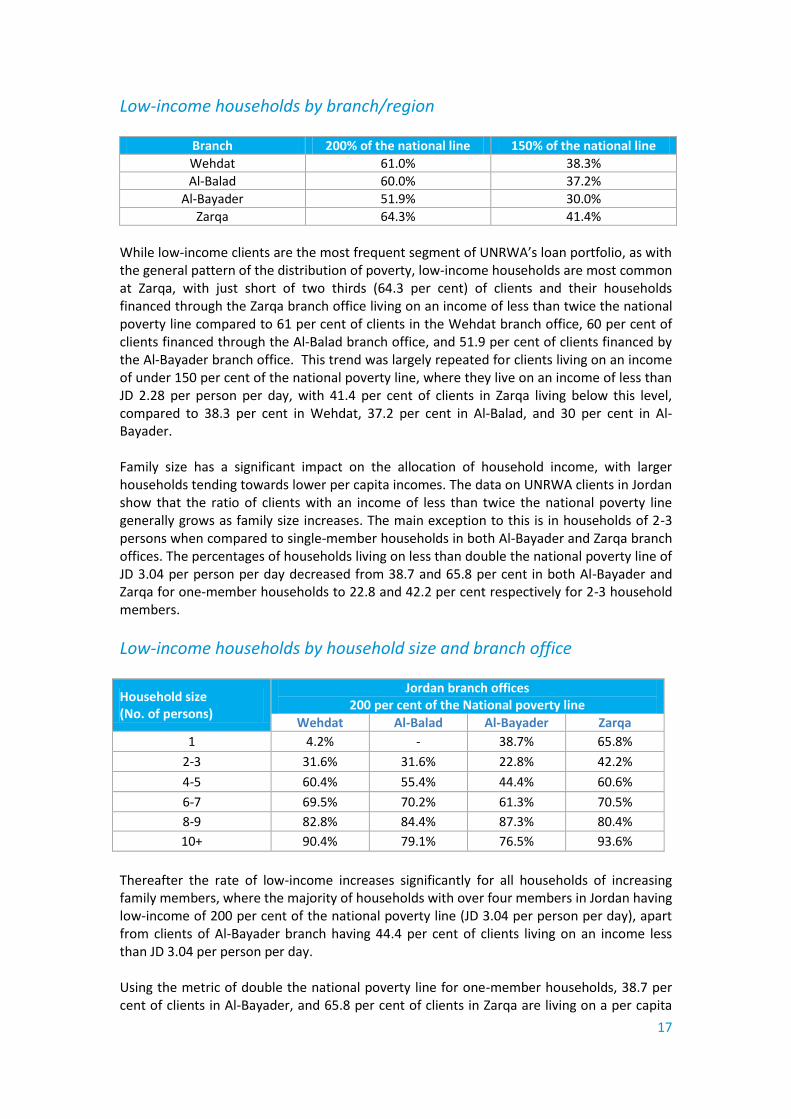
Low-income households by branch/region
Branch 200% of the national line 150% of the national line
Wehdat 61.0% 38.3%
Al-Balad 60.0% 37.2%
Al-Bayader 51.9% 30.0%
Zarqa 64.3% 41.4%
While low-income clients are the most frequent segment of UNRWA’s loan portfolio, as with the general pattern of the distribution of poverty, low-income households are most common at Zarqa, with just short of two thirds (64.3 per cent) of clients and their households financed through the Zarqa branch office living on an income of less than twice the national poverty line compared to 61 per cent of clients in the Wehdat branch office, 60 per cent of clients financed through the Al-Balad branch office, and 51.9 per cent of clients financed by the Al-Bayader branch office. This trend was largely repeated for clients living on an income of under 150 per cent of the national poverty line, where they live on an income of less than JD 2.28 per person per day, with 41.4 per cent of clients in Zarqa living below this level, compared to 38.3 per cent in Wehdat, 37.2 per cent in Al-Balad, and 30 per cent in Al-Bayader. Family size has a significant impact on the allocation of household income, with larger households tending towards lower per capita incomes. The data on UNRWA clients in Jordan show that the ratio of clients with an income of less than twice the national poverty line generally grows as family size increases. The main exception to this is in households of 2-3 persons when compared to single-member households in both Al-Bayader and Zarqa branch offices. The percentages of households living on less than double the national poverty line of JD 3.04 per person per day decreased from 38.7 and 65.8 per cent in both Al-Bayader and Zarqa for one-member households to 22.8 and 42.2 per cent respectively for 2-3 household members.
Low-income households by household size and branch office
Household size (No. of persons)
Jordan branch offices 200 per cent of the National poverty line
Wehdat Al-Balad Al-Bayader Zarqa
1 4.2% - 38.7% 65.8%
2-3 31.6% 31.6% 22.8% 42.2%
4-5 60.4% 55.4% 44.4% 60.6%
6-7 69.5% 70.2% 61.3% 70.5%
8-9 82.8% 84.4% 87.3% 80.4%
10+ 90.4% 79.1% 76.5% 93.6%
Thereafter the rate of low-income increases significantly for all households of increasing family members, where the majority of households with over four members in Jordan having low-income of 200 per cent of the national poverty line (JD 3.04 per person per day), apart from clients of Al-Bayader branch having 44.4 per cent of clients living on an income less than JD 3.04 per person per day. Using the metric of double the national poverty line for one-member households, 38.7 per cent of clients in Al-Bayader, and 65.8 per cent of clients in Zarqa are living on a per capita
18
income of JD 3.04 per person per day. Low-income increases with household size, the rate of clients with low-income ranges from 22.8 per cent in Al-Bayader to 42.2 per cent in Zarqa for clients in 2-3 person households living on this level of household income. Beyond this household size, the majority of clients fall into the low-income category, with low-income clients particularly concentrated in Zarqa, followed by Wehdat, then Al-Balad, and lastly Al-Bayader.
Household size (No. of persons)
Jordan branch offices 150 per cent of the National poverty line
Wehdat Al-Balad Al-Bayader Zarqa
1 0.7% - 24.0% 47.9%
2-3 13.2% 13.7% 7.2% 18.9%
4-5 34.7% 31.6% 20.3% 35.5%
6-7 44.3% 45.2% 37.2% 47.1%
8-9 63.7% 63.2% 66.9% 65.1%
10+ 75.3% 60.4% 53.5% 77.2%
Low-income clients in Jordan living below 150 per cent of the national poverty line of JD 2.28 per person per day range from 7.2 per cent for households with 2-3 members in Al-Bayader to 18.9 per cent for clients in Zarqa. Again, the category of low-income increases with household size; ranging from 20.3 to 35.5 per cent of clients from households of 4-5 family members. More low-income households live on less than JD 2.28 per person per day in Wehdat and Zarqa, branches than in Al-Balad and Al-Bayader.
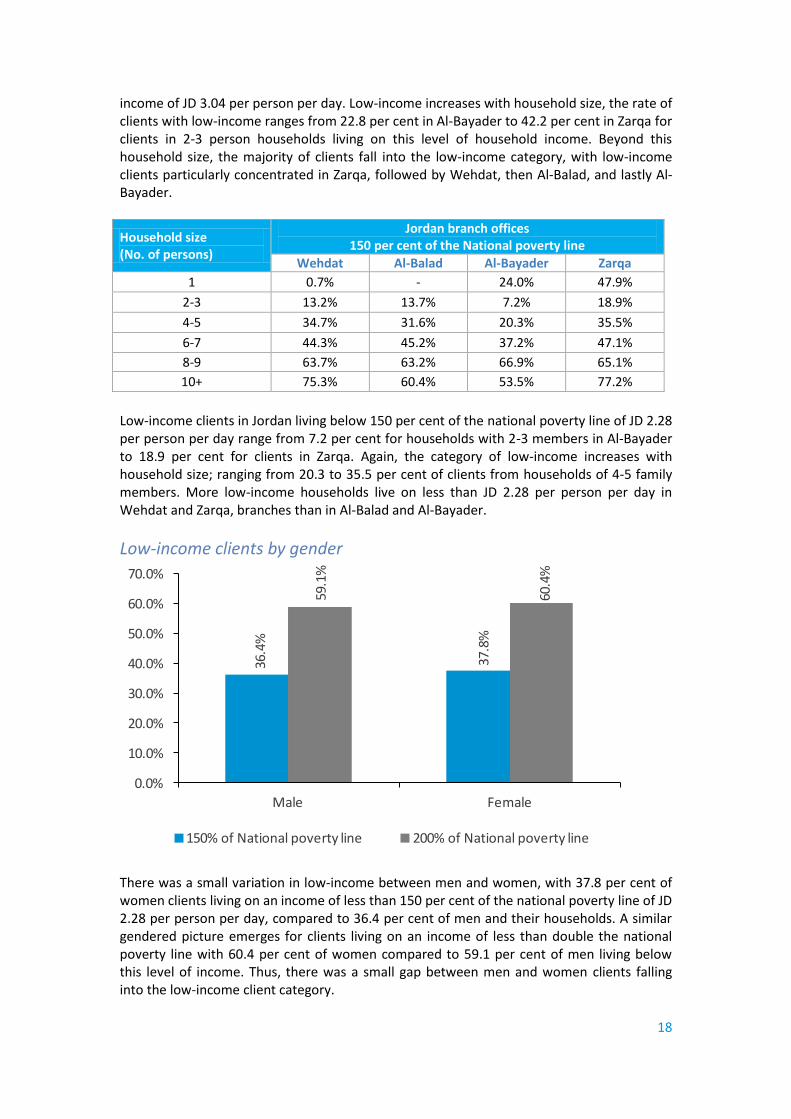
Low-income clients by gender
36.4
%
37.8
%
59.1
%
60.4
%
0.0%
10.0%
20.0%
30.0%
40.0%
50.0%
60.0%
70.0%
Male Female
150% of National poverty line 200% of National poverty line
There was a small variation in low-income between men and women, with 37.8 per cent of women clients living on an income of less than 150 per cent of the national poverty line of JD 2.28 per person per day, compared to 36.4 per cent of men and their households. A similar gendered picture emerges for clients living on an income of less than double the national poverty line with 60.4 per cent of women compared to 59.1 per cent of men living below this level of income. Thus, there was a small gap between men and women clients falling into the low-income client category.
19
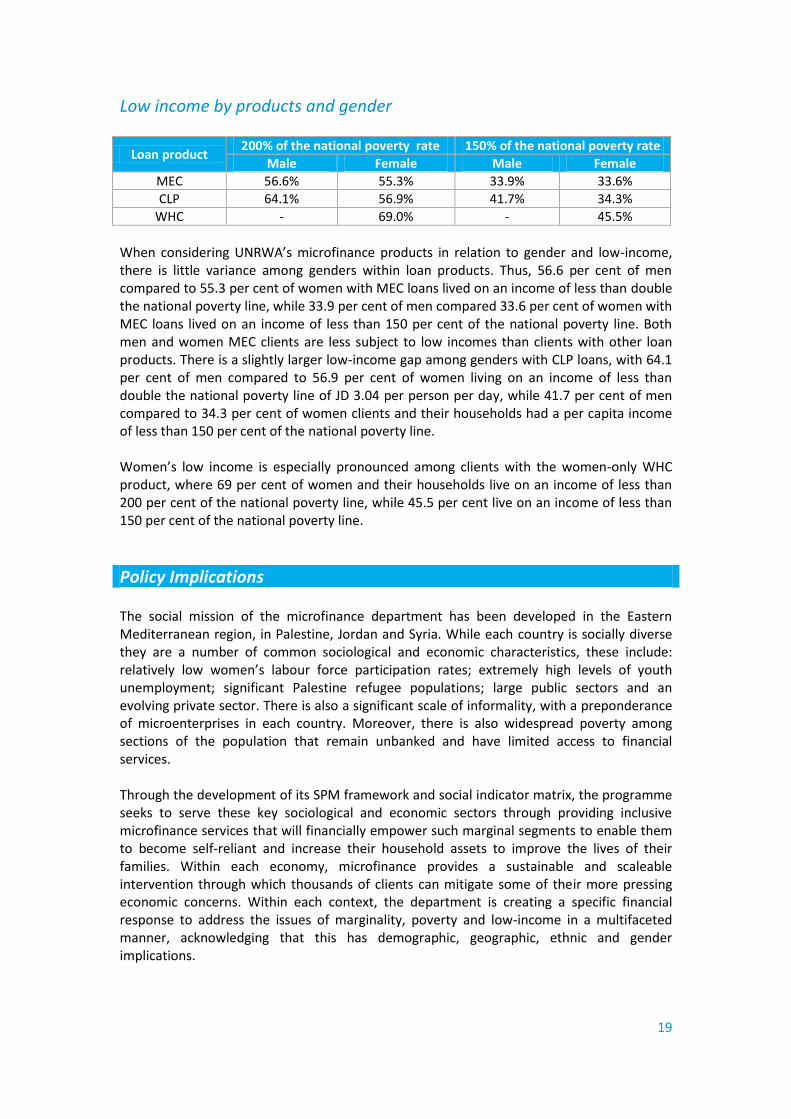
Low income by products and gender
Loan product 200% of the national poverty rate 150% of the national poverty rate
Male Female Male Female
MEC 56.6% 55.3% 33.9% 33.6%
CLP 64.1% 56.9% 41.7% 34.3%
WHC - 69.0% - 45.5%
When considering UNRWA’s microfinance products in relation to gender and low-income, there is little variance among genders within loan products. Thus, 56.6 per cent of men compared to 55.3 per cent of women with MEC loans lived on an income of less than double the national poverty line, while 33.9 per cent of men compared 33.6 per cent of women with MEC loans lived on an income of less than 150 per cent of the national poverty line. Both men and women MEC clients are less subject to low incomes than clients with other loan products. There is a slightly larger low-income gap among genders with CLP loans, with 64.1 per cent of men compared to 56.9 per cent of women living on an income of less than double the national poverty line of JD 3.04 per person per day, while 41.7 per cent of men compared to 34.3 per cent of women clients and their households had a per capita income of less than 150 per cent of the national poverty line. Women’s low income is especially pronounced among clients with the women-only WHC product, where 69 per cent of women and their households live on an income of less than 200 per cent of the national poverty line, while 45.5 per cent live on an income of less than 150 per cent of the national poverty line.
Policy Implications The social mission of the microfinance department has been developed in the Eastern Mediterranean region, in Palestine, Jordan and Syria. While each country is socially diverse they are a number of common sociological and economic characteristics, these include: relatively low women’s labour force participation rates; extremely high levels of youth unemployment; significant Palestine refugee populations; large public sectors and an evolving private sector. There is also a significant scale of informality, with a preponderance of microenterprises in each country. Moreover, there is also widespread poverty among sections of the population that remain unbanked and have limited access to financial services. Through the development of its SPM framework and social indicator matrix, the programme seeks to serve these key sociological and economic sectors through providing inclusive microfinance services that will financially empower such marginal segments to enable them to become self-reliant and increase their household assets to improve the lives of their families. Within each economy, microfinance provides a sustainable and scaleable intervention through which thousands of clients can mitigate some of their more pressing economic concerns. Within each context, the department is creating a specific financial response to address the issues of marginality, poverty and low-income in a multifaceted manner, acknowledging that this has demographic, geographic, ethnic and gender implications.
20
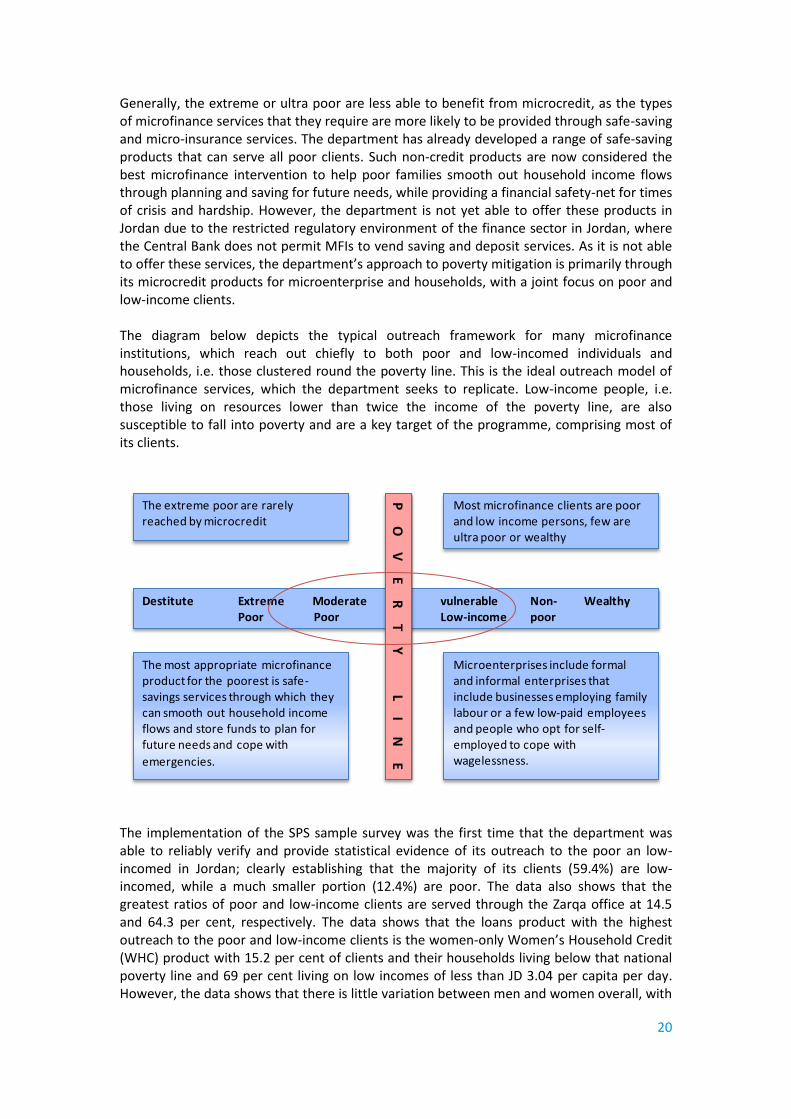
Generally, the extreme or ultra poor are less able to benefit from microcredit, as the types of microfinance services that they require are more likely to be provided through safe-saving and micro-insurance services. The department has already developed a range of safe-saving products that can serve all poor clients. Such non-credit products are now considered the best microfinance intervention to help poor families smooth out household income flows through planning and saving for future needs, while providing a financial safety-net for times of crisis and hardship. However, the department is not yet able to offer these products in Jordan due to the restricted regulatory environment of the finance sector in Jordan, where the Central Bank does not permit MFIs to vend saving and deposit services. As it is not able to offer these services, the department’s approach to poverty mitigation is primarily through its microcredit products for microenterprise and households, with a joint focus on poor and low-income clients. The diagram below depicts the typical outreach framework for many microfinance institutions, which reach out chiefly to both poor and low-incomed individuals and households, i.e. those clustered round the poverty line. This is the ideal outreach model of microfinance services, which the department seeks to replicate. Low-income people, i.e. those living on resources lower than twice the income of the poverty line, are also susceptible to fall into poverty and are a key target of the programme, comprising most of its clients.
The extreme poor are rarely reached by microcredit
Microenterprises include formal and informal enterprises that include businesses employing family labour or a few low-paid employees and people who opt for self-employed to cope with wagelessness.
The most appropriate microfinance product for the poorest is safe-savings services through which they can smooth out household income flows and store funds to plan for future needs and cope with
emergencies.
Most microfinance clients are poor and low income persons, few are ultra poor or wealthy
Destitute Extreme Moderate vulnerable Non- WealthyPoor Poor Low-income poor
PO
VE
RT
YL
IN
E
The implementation of the SPS sample survey was the first time that the department was able to reliably verify and provide statistical evidence of its outreach to the poor an low-incomed in Jordan; clearly establishing that the majority of its clients (59.4%) are low-incomed, while a much smaller portion (12.4%) are poor. The data also shows that the greatest ratios of poor and low-income clients are served through the Zarqa office at 14.5 and 64.3 per cent, respectively. The data shows that the loans product with the highest outreach to the poor and low-income clients is the women-only Women’s Household Credit (WHC) product with 15.2 per cent of clients and their households living below that national poverty line and 69 per cent living on low incomes of less than JD 3.04 per capita per day. However, the data shows that there is little variation between men and women overall, with
21
12.8 per cent of women compared to 12.3 per cent of men clients and their households being poor, while 59.1 per cent of men as opposed to 60.4 per cent of women clients live on low-incomes. From the strategic planning and policy perspective, it must be noted that poverty mitigation is only one aspect of the social performance framework of the department, and only one of a number of indicators used to judge the success of its social performance management (SPM) and its mission as a social enterprise. As a result of this study, for the first time, the department was able to produce poverty and low-income rates to complement the other social indictors and ratios of outreach to social targets in Jordan. Thus, in Jordan, in 2011, the department financed 7,654 loans valued at USD 9.05 million. Business loans accounted for 71 per cent of all loans, while 78 per cent of these loans financed the needs of informal enterprises. Palestine refugees received 78 percent of all loans financed, while women received 30 per cent and youth 20 per cent of loans. As there is significant overlap between each indicator, the department is achieving significant breadth of outreach as well as reaching deep into marginal socio-economic segments. However, as this is the first phase in the utilisation of the SPS methodology it initially focused only on the poverty and low-income of clients across branch office, loan product, gender and household size variables and did not provide specific ratios on poverty and low-income of enterprises, informals, refugee or youth. In future, the SPS will used to provide a broader and deeper variable focus on all of the SPM social indicators used to further improve SMP monitoring and evaluation. To further improve the utilisation of the SPS on an ongoing basis and to track the poverty and low-income of clients temporally, the SPS has been integrated into a new microfinance banking software that the programme is currently in the process of rolling out. This new approach means that the programme will no longer have to resort to sample surveys, but will produce data on every client on a quasi-census basis. Each time a client applies for a new or repeat loan, a SPS questionnaire will be completed which will statistically determine if they are poor or low-incomed when measured against the national poverty line. Moreover, as well a developing better SPM capacity, the addition of SPS enumeration to the programme’s microfinance banking database has the potential to enhance both the operational and financial management of the programme. The new information will enable management to link and correlate loan decision-making with poverty and low-income through credit scoring, while enhancing risk-assessment by correlating financial ratios with poverty and low-income to determine variations in credit and financial risk among certain categories of clients, e.g. by disaggregating portfolio-at-risk by client poverty and low-income, etc. Thus, as the programme continues to work with the poverty scorecard in Jordan, the information provided through the routine collection of data will afford a resource through which the department will be able to broaden outreach to the poor by developing new loan products and improving existing products that may be better suited to the needs of poor clients, while at the same time reducing the risk involved in financing poorer clients.
22
Endnotes 1 This compares with the 13.3 per cent of clients that were found to be poor in Jordan in the 2008 Household
Income and Expenditure Survey.
2 The Social Performance Management Unit prepares a comprehensive social performance indicator report
every quarter based on the data contained in its loan management information system. This information is retrievable for the programme as a whole, each field office, each branch office, each loan product, and by each loan officer. Although produced every quarter, the information can also be retrieved on a monthly basis.
3 For more information of the various tools and approaches that have been developed for the microfinance
sector, see, http://www.sptf.info/.
4 For more information on the PPItm
, see, http://www.progressoutofpoverty.org.
5 With this simple tool the department will be able to determine the poverty level of clients and trace this over
time, but it is important to recognise that this will not enable it to attribute causality to its microfinance interventions, as there is no one-to-one correspondence between credit and poverty. The movement into and/or out of poverty is multidimensional. Thus, while some clients may move out of poverty because of the economic opportunities that credit enables them to realise, others will progress out of poverty because of favourable market or business opportunities, access to new employment for household members, or other reasons. Alternatively, over-indebtedness might lead some client households to fall below the poverty line. Attribution or causality requires studies of a more complex nature that the SPS can provide, such as impact assessment studies. But these are much more costly to implement.
6 The full version of SPS was developed by Mark Schriener, “A Simple Scorecard for Jordan”, (21 October 2010)
and can be found on http://www.microfinance.com/#Jordan.
7 In this case, one question on mobile phone ownership has been excluded due to the rapid changes in mobile
phone use in Jordan.
8 The MEC loans finances working capital loans to microenterprises, the CLP loan provides consumer loans to
individual to purchase household assets and pay for family service and the WHC product is offered to women with household-based income-generating activities.
9 Mark Schriener, “A Simple Scorecard for Jordan”, (21 October 2010), p. 6,
http://www.microfinance.com/#Jordan.
10 This has now grown to five branch offices, with three in Amman, one in Zarqa, and one in Irbid. The Irbid
branch opened in the second half of 2011.
11 This could be seen amongst clients of both the Al-Bayader and Zarqa branch offices with 7.8 and 23.1 per cent
of one-person households falling below the national poverty line.
12 The Microcredit Summit goal of providing micro loans to 100 million poor people was achieved in 2005, while
by 2007 it reached the objective of financing 100 million loans to persons living on less than USD 1.00 a day. By the end of 2007, some 3,352 microfinance institutions from 137 countries that were affiliated with the Microcredit Summit Campaign had provided loans to 155 million clients. Some 107 million of these clients survived on USD 1.00 a day or less, with women accounting for almost 83 per cent of the poorer borrowers. Despite the remarkable success of the campaign, this represented less than ten per cent of the number of poor people who could use credit. In 2009, the campaign recalibrated its goal, setting a new target to reach 175 million of the world’s poorest families with credit for self-employment and other business and financial services, and to raise 100 million families above the US one-dollar-a-day threshold as the UN Millennium Development Goals conclude in 2015. See, Sam Daley-Harris, “State of the Microcredit Summit Campaign Report 2009”, Microcredit Summit Campaign, 2009.
13 In the sample for Jordan, there were only six clients interviewed who were living alone, out of which four
were from Zarqa.