
UTC Energy Management Guidebook
26
UTC Energy Management Guidebook A systematic approach to formulating and implementing an effective energy management plan. UTC Energy Management Guidebook
Transcript of UTC Energy Management Guidebook

UTC Energy Management Guidebook
A systematic approach to formulating and implementing an effective energy management plan.
UTC Energy Management Guidebook

Rising energy costs and global environmental concerns affect our business every day. Our response is to develop ever cleaner and more efficient solutions both for ourselves and for our customers. Conserving resources and minimizing adverse impacts create competitive advantage in an environ-mentally conscious marketplace.
Every United Technologies (UTC) facility worldwide must take an active leadership role in reducing energy consumption, thereby reducing greenhouse gas emissions. Worldwide climate change is an environmental concern facing all of us. How society tackles this challenge will determine the quality of life for future generations.
UTC is pleased to provide you with this Supplier Energy Management Guidebook. The Guidebook will provide you with a systematic approach to formulating and implementing an effective energy management plan. The Guidebook offers standard work processes developed by UTC facilities managers, along with standard practices adopted from the ANSI MSE 2005 Standard for Energy Management.
After you have implemented these practices, your site will have taken significant steps in reducing your energy use, cost and impact on the environment.
Introduction
A systematic approach to formulating and implementing an effective energy management plan
Carrier
Hamilton SundStrand
otiS
Pratt & WHitney
SikorSky
utC Fire & SeCurity
utC PoWer
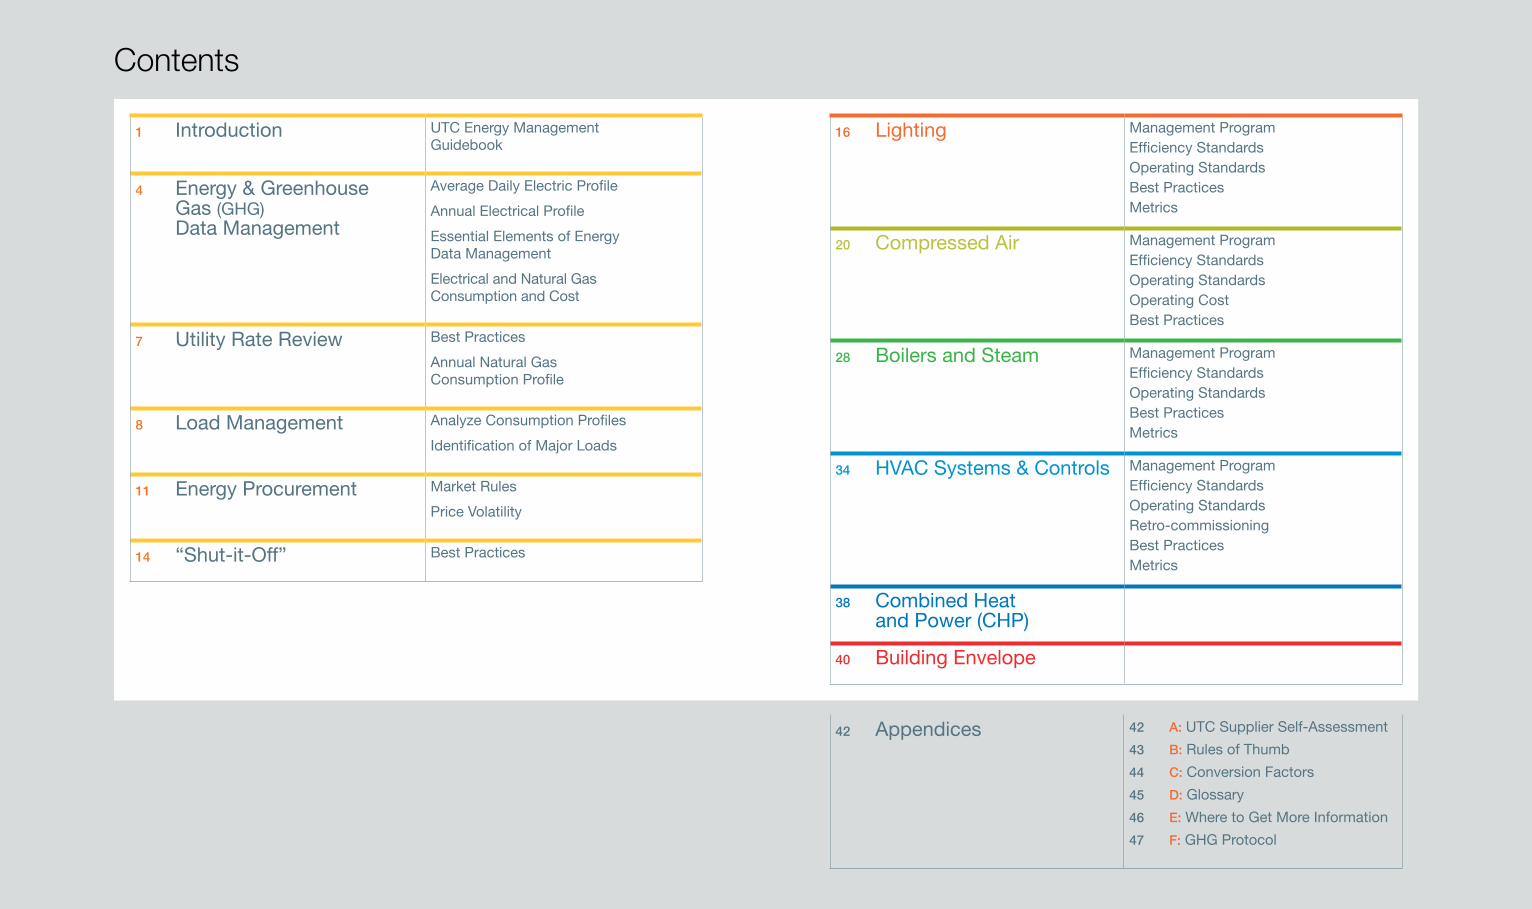
Contents
1 introduction utC energy management Guidebook
4 energy & Greenhouse Gas (GHG) data management
average daily electric Profile
annual electrical Profile
essential elements of energy data management
electrical and natural Gas Consumption and Cost
7 utility rate review Best Practices
annual natural Gas Consumption Profile
8 load management analyze Consumption Profiles
identification of major loads
11 energy Procurement market rules
Price Volatility
14 “Shut-it-off” Best Practices
42 appendices 42 A: utC Supplier Self-assessment
43 B: rules of thumb
44 C: Conversion Factors
45 D: Glossary
46 E: Where to Get more information
47 F: GHG Protocol
16 lighting management Programefficiency Standardsoperating StandardsBest Practicesmetrics
20 Compressed air management Programefficiency Standardsoperating Standardsoperating CostBest Practices
28 Boilers and Steam management Programefficiency Standardsoperating StandardsBest Practicesmetrics
34 HVaC Systems & Controls management Programefficiency Standardsoperating Standardsretro-commissioningBest Practicesmetrics
38 Combined Heat and Power (CHP)
40 Building envelope

4 / 5
Information from sources such as utility bills, utility meters, energy sub-meters, published utility tariffs, energy supply contracts and external market updates will be used for four main purposes:
1. To establish a baseline by answering the questions:
“How much energy do I currently use?”
“When do I use that energy?”
“How much is that energy costing me?”
2. Establish a benchmark of optimal “Energy Intensity” in kWh/sq. ft. or mmbtu/unit of production.
3. To establish the site’s GHG inventory (see Appendix F), the summation of all GHG emissions generated by operating the business including energy consump-tion and direct process emissions con-verted into carbon dioxide emissions equivalent (CO2e).
4. To evaluate the ongoing effectiveness of the energy management program to enable quick diagnosis of the root cause of any problem and timely implementation of effective corrective measures.
Consumption history should be recorded and displayed
annual electrical Profile
1.6
kWh (in thousands) Peak kW (in thousands)
JAN FEB MAR APR MAY JUN JUL AUG SEP OCT NOV DEC
87
350
262
175
612
437
525
.2
.8
.6
.4
1.4
1.0
1.2
� kWh � Peak kW
700
average daily electric Profile
250
750
500
1,250
1,500
1,000
kW
Time (Hour) 2 4 6 8 10 12 14 16 18 20 2422
� Peak Day � Average Weekday � Average Weekend
the first and most important step in an energy and GHG management program is data management
Energy & Greenhouse Gas (GHG) Data Management
Collect 24 months of all utility consumption data
Energy Data Management (continued) 6 / 7
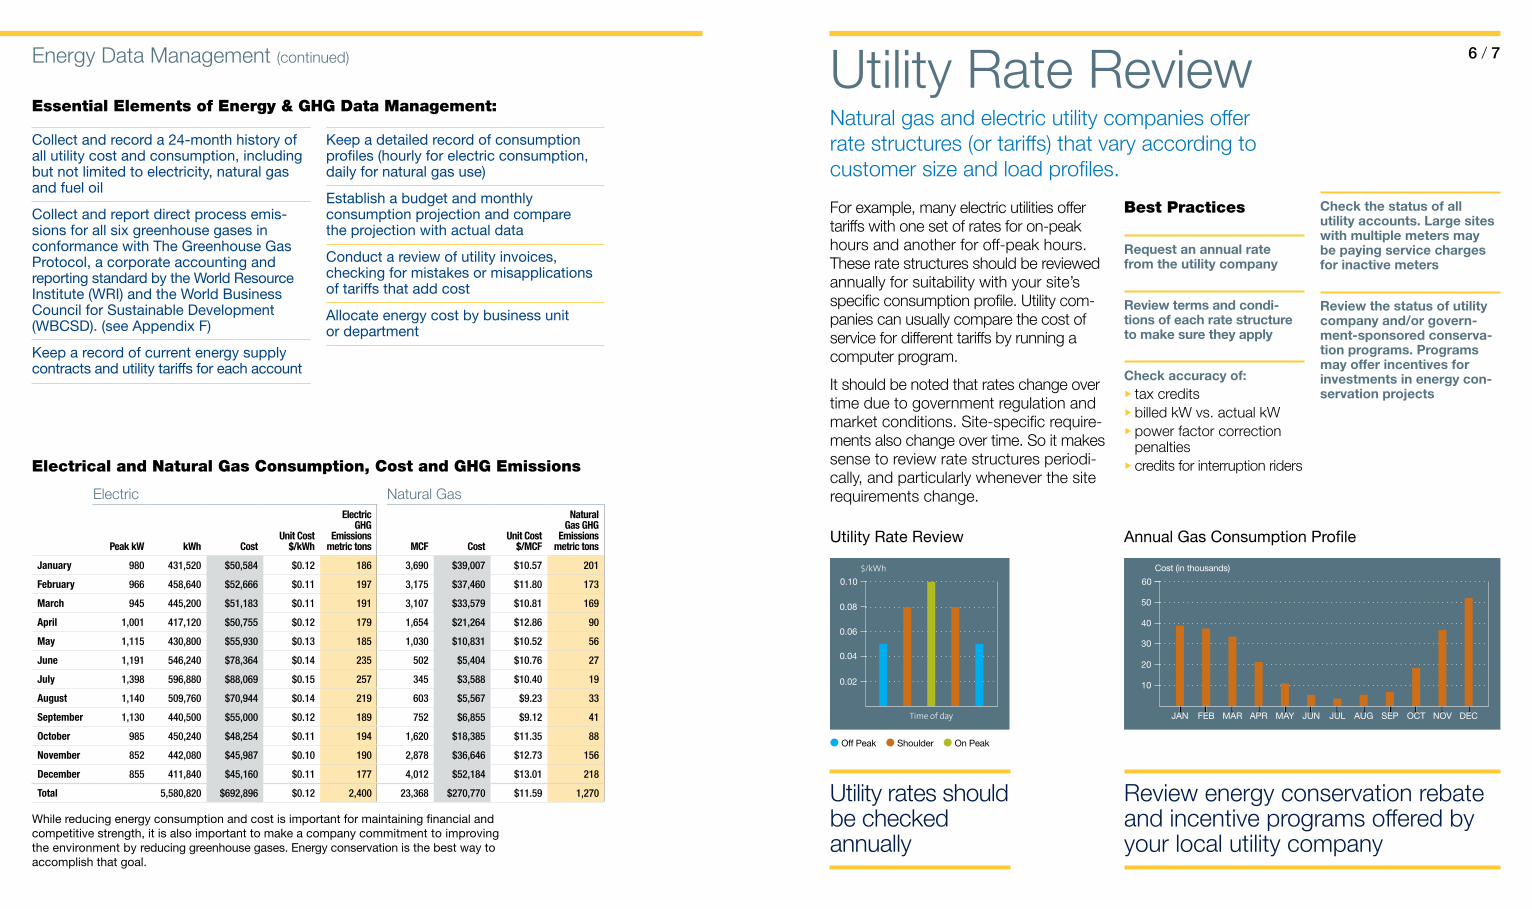
For example, many electric utilities offer tariffs with one set of rates for on-peak hours and another for off-peak hours. These rate structures should be reviewed annually for suitability with your site’s specific consumption profile. Utility com-panies can usually compare the cost of service for different tariffs by running a computer program.
It should be noted that rates change over time due to government regulation and market conditions. Site-specific require-ments also change over time. So it makes sense to review rate structures periodi-cally, and particularly whenever the site requirements change.
Best Practices
Request an annual rate from the utility company
Review terms and condi-tions of each rate structure to make sure they apply
Check accuracy of:▶ tax credits▶ billed kW vs. actual kW▶ power factor correction
penalties▶ credits for interruption riders
Check the status of all utility accounts. Large sites with multiple meters may be paying service charges for inactive meters
Review the status of utility company and/or govern-ment-sponsored conserva-tion programs. Programs may offer incentives for investments in energy con-servation projects
Utility rates should be checked annually
Review energy conservation rebate and incentive programs offered by your local utility company
Natural gas and electric utility companies offer rate structures (or tariffs) that vary according to customer size and load profiles.
Utility Rate Review
utility rate review
0.02
0.04
0.08
0.10
0.06
$/kWh
Time of day
� Off Peak � Shoulder � On Peak
annual Gas Consumption Profile
Cost (in thousands)
JAN FEB MAR APR MAY JUN JUL AUG SEP OCT NOV DEC
10
40
50
20
30
60
Collect and record a 24-month history of all utility cost and consumption, including but not limited to electricity, natural gas and fuel oil
Collect and report direct process emis-sions for all six greenhouse gases in conformance with the Greenhouse Gas Protocol, a corporate accounting and reporting standard by the World resource institute (Wri) and the World Business Council for Sustainable development (WBCSd). (see appendix F)
keep a record of current energy supply contracts and utility tariffs for each account
keep a detailed record of consumption profiles (hourly for electric consumption, daily for natural gas use)
establish a budget and monthly consumption projection and compare the projection with actual data
Conduct a review of utility invoices, checking for mistakes or misapplications of tariffs that add cost
allocate energy cost by business unit or department
Essential Elements of Energy & GHG Data Management:
While reducing energy consumption and cost is important for maintaining financial and competitive strength, it is also important to make a company commitment to improving the environment by reducing greenhouse gases. energy conservation is the best way to accomplish that goal.
Electrical and Natural Gas Consumption, Cost and GHG Emissions
Electric Natural Gas
Peak kW kWh Cost Unit Cost
$/kWh
Electric GHG
Emissions metric tons MCF Cost
Unit Cost $/MCF
Natural Gas GHG
Emissions metric tons
January 980 431,520 $50,584 $0.12 186 3,690 $39,007 $10.57 201
February 966 458,640 $52,666 $0.11 197 3,175 $37,460 $11.80 173
March 945 445,200 $51,183 $0.11 191 3,107 $33,579 $10.81 169
April 1,001 417,120 $50,755 $0.12 179 1,654 $21,264 $12.86 90
May 1,115 430,800 $55,930 $0.13 185 1,030 $10,831 $10.52 56
June 1,191 546,240 $78,364 $0.14 235 502 $5,404 $10.76 27
July 1,398 596,880 $88,069 $0.15 257 345 $3,588 $10.40 19
August 1,140 509,760 $70,944 $0.14 219 603 $5,567 $9.23 33
September 1,130 440,500 $55,000 $0.12 189 752 $6,855 $9.12 41
October 985 450,240 $48,254 $0.11 194 1,620 $18,385 $11.35 88
November 852 442,080 $45,987 $0.10 190 2,878 $36,646 $12.73 156
December 855 411,840 $45,160 $0.11 177 4,012 $52,184 $13.01 218
Total 5,580,820 $692,896 $0.12 2,400 23,368 $270,770 $11.59 1,270
8 / 9
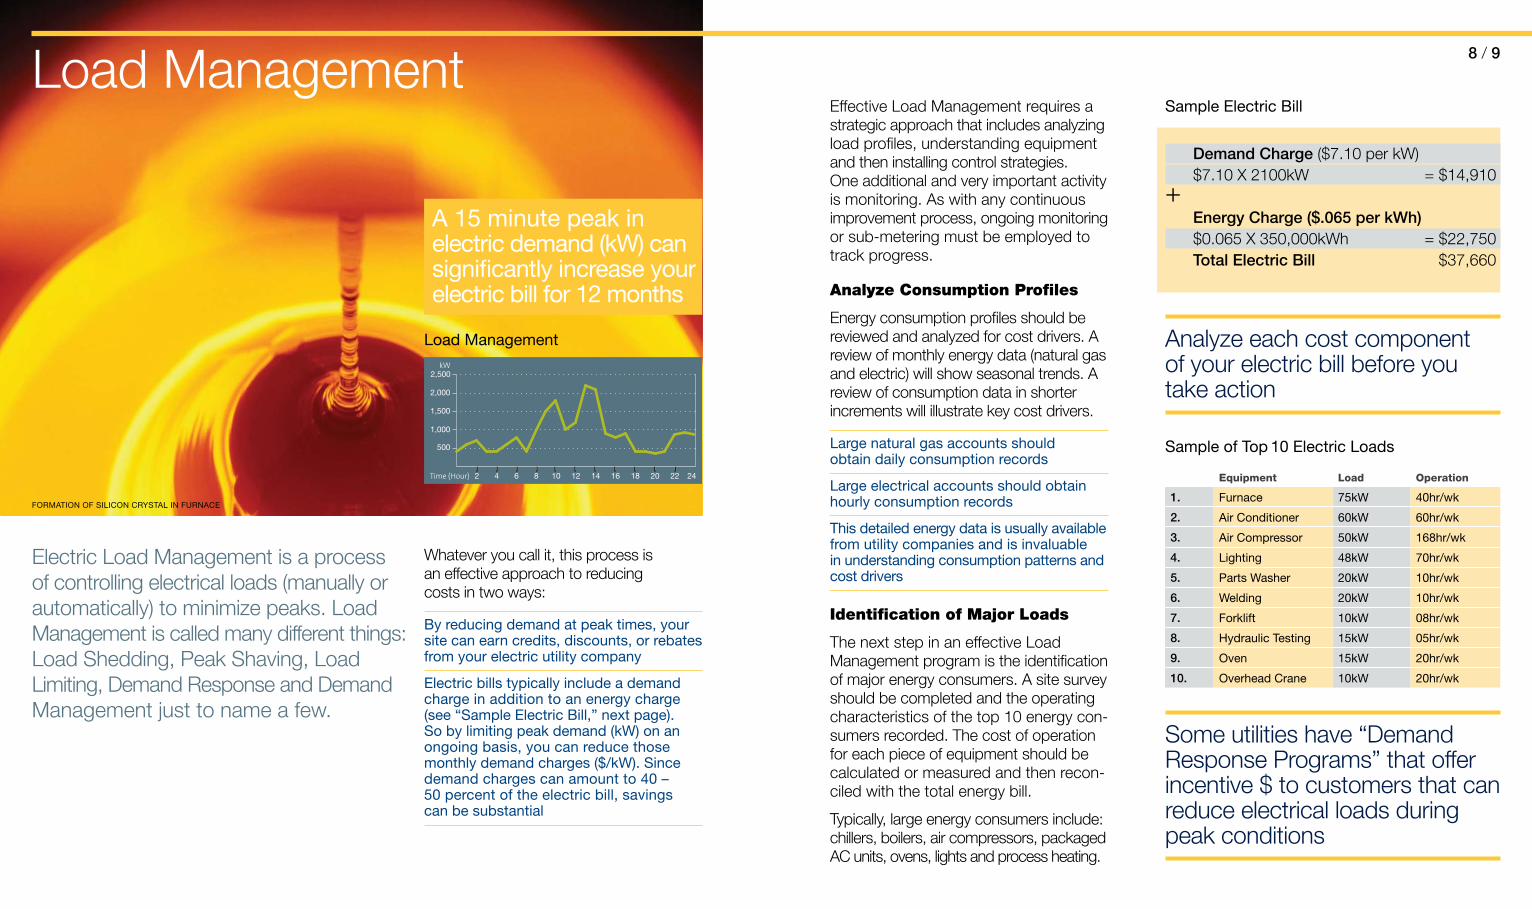
Effective Load Management requires a strategic approach that includes analyzing load profiles, understanding equipment and then installing control strategies. One additional and very important activity is monitoring. As with any continuous improvement process, ongoing monitoring or sub-metering must be employed to track progress.
Analyze Consumption Profiles
Energy consumption profiles should be reviewed and analyzed for cost drivers. A review of monthly energy data (natural gas and electric) will show seasonal trends. A review of consumption data in shorter increments will illustrate key cost drivers.
large natural gas accounts should obtain daily consumption records
large electrical accounts should obtain hourly consumption records
this detailed energy data is usually available from utility companies and is invaluable in understanding consumption patterns and cost drivers
Identification of Major Loads
The next step in an effective Load Management program is the identification of major energy consumers. A site survey should be completed and the operating characteristics of the top 10 energy con-sumers recorded. The cost of operation for each piece of equipment should be calculated or measured and then recon-ciled with the total energy bill.
Typically, large energy consumers include: chillers, boilers, air compressors, packaged AC units, ovens, lights and process heating.
Demand Charge ($7.10 per kW) $7.10 X 2100kW = $14,910+ Energy Charge ($.065 per kWh) $0.065 X 350,000kWh = $22,750 Total Electric Bill $37,660
Sample electric Bill
Analyze each cost component of your electric bill before you take action
Some utilities have “Demand Response Programs” that offer incentive $ to customers that can reduce electrical loads during peak conditions
Whatever you call it, this process is an effective approach to reducing costs in two ways:
By reducing demand at peak times, your site can earn credits, discounts, or rebates from your electric utility company
electric bills typically include a demand charge in addition to an energy charge (see “Sample electric Bill,” next page). So by limiting peak demand (kW) on an ongoing basis, you can reduce those monthly demand charges ($/kW). Since demand charges can amount to 40 – 50 percent of the electric bill, savings can be substantial
Electric Load Management is a process of controlling electrical loads (manually or automatically) to minimize peaks. Load Management is called many different things: Load Shedding, Peak Shaving, Load Limiting, Demand Response and Demand Management just to name a few.
a 15 minute peak in electric demand (kW) can significantly increase your electric bill for 12 months
1,000
500
2,000
2,500
1,500
kW
Time (Hour) 2 4 6 8 10 12 14 16 18 20 2422
load management
Load Management
Sample of top 10 electric loads
Equipment Load Operation
1. Furnace 75kW 40hr/wk
2. air Conditioner 60kW 60hr/wk
3. air Compressor 50kW 168hr/wk
4. lighting 48kW 70hr/wk
5. Parts Washer 20kW 10hr/wk
6. Welding 20kW 10hr/wk
7. Forklift 10kW 08hr/wk
8. Hydraulic testing 15kW 05hr/wk
9. oven 15kW 20hr/wk
10. overhead Crane 10kW 20hr/wk
Formation oF SiliCon CryStal in FurnaCe

Control
Once you have a thorough understanding of the consumption profiles and have identified the equipment loads, you should develop a control strategy to limit peaks and manage cost.
Control strategies can be as simple as turning off equipment when a new peak is about to be set. Many sites employ a more complex control strategy utilizing an Energy Management System (EMS) to monitor and automatically shed equipment when the demand (kW) hits a programmed limit.
Sub-metering
You can’t control what you don’t measure. Sub metering will give you the ability to better measure and, therefore, better manage energy use. A well designed sub metering system will show exactly where and when energy is being used. The data will support and improve budgeting and cost allocation. It will also validate savings from energy conservation efforts.
Inexpensive portable equipment metering and monitoring devices can be used in lieu of fixed submetering.
What Sub-metering Will enable you to do
assign energy costs to specific departments
identify opportunities for potential energy efficiency improvements
determine equipment and system efficiency
Quickly recognize performance problems in processes and equipment
uncover the causes of energy waste that may otherwise go undiscovered under a traditional metering and billing system
Provide information necessary to develop effective rFPs (requests for Proposal) or the competitive energy market
Validate the accuracy of utility bills
Load Management (continued)
typical electric Consumption Breakdown
19% Production
10% Heat treat
16% Lighting
13% Environmental Labs
9% Compressed Air
7% Fans
10% Chiller
9% Paint Line
7% Heating
Energy Procurement 10 / 11
To develop and implement an effective energy procurement strategy, you first have to under-stand how the market works.
World energy markets are extremely volatile and require constant monitoring
Generation tranSmiSSion loCal diStriBution
ConSumPtion
electric Supply Chain
Deregulated markets allow the end user to choose competitive suppliers of electric power and natural gas.
In order to execute a successful pro-curement project we need to address two main areas of importance:
market rules
Price volatility
oFFSHore natural GaS and oil PlatForm

12 / 13
Market Rules
Energy markets around the world are in various stages of deregulation. In some regions natural gas markets are deregu-lated (open competitive markets) while electric markets remain regulated monopolies. In other regions the reverse is true.
The rules for participating in the deregulated com-petitive market vary by location. For example, in some locations, only large customers can participate in the open market. In others every-one can participate (large industrials, small com-mercial and residential customers). In some markets, once you leave
Energy procurement (continued)
Market rules vary by location and frequently change
Commodity ProduCtion
interState tranSPort
loCal diStriBution
ConSumPtion
natural Gas Supply Chain
Price Volatility
Market volatility is the norm. Consequently, you could pay significantly higher prices if procurement projects are not man-aged. Energy suppliers in competitive markets offer a variety of products. For example, in electric power markets suppliers offer:
real-time pricing supply contractWith this option energy prices float or vary with real-time markets. This is sometimes referred to as index pricing
Fixed Price supply contractA flat fixed price contract, this option provides budget certainity
Block and index supply contractA combination of fixed and floating pricing, this option provides some budget certainty while allowing the end user to make adjustments to real-time price signals
layered supply contract▶ Customized layered
supply contracts to match facility needs
Supplier selection is critical. End users should work with suppliers that offer pricing options that fit their consumption profile and will provide market price transparency. A site-specific consumption profile and local market conditions will dictate which product is best for your site.
the local utility and take service from a competi-tive supplier, you cannot switch back to the utility company for service. Therefore, you must strive to clearly under-stand the market rules.
In all cases, only a portion of the total cost is deregu-lated or competitive. In electric markets, the generation component is competitive, while the transmission and distribu-tion charges remain regulated and are billed by the local distribution company. In natural gas markets, the natural gas and interstate pipeline charges are competitive, while the local distribution remains regulated.
$$$
Usage MW
Time of day
OFF-PEAK ON-PEAK OFF-PEAK
$ $$ $
$ $ $
time-of-day electric rates
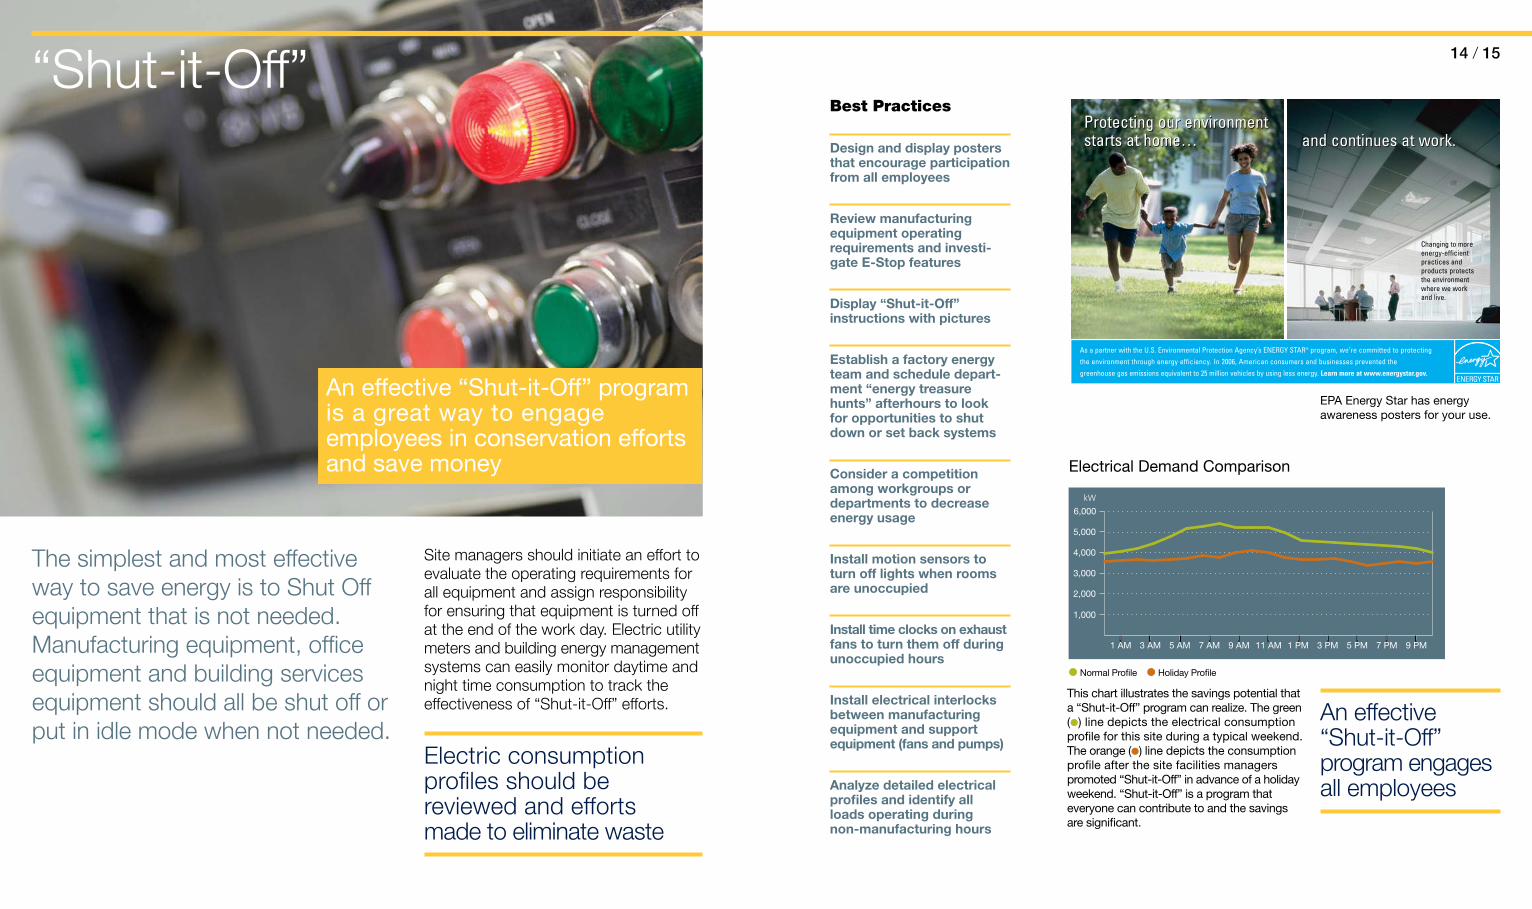
The simplest and most effective way to save energy is to Shut Off equipment that is not needed. Manufacturing equipment, office equipment and building services equipment should all be shut off or put in idle mode when not needed.
an effective “Shut-it-off” program is a great way to engage employees in conservation efforts and save money
“Shut-it-Off” 14 / 15
Site managers should initiate an effort to evaluate the operating requirements for all equipment and assign responsibility for ensuring that equipment is turned off at the end of the work day. Electric utility meters and building energy management systems can easily monitor daytime and night time consumption to track the effectiveness of “Shut-it-Off” efforts.
Electric consumption profiles should be reviewed and efforts made to eliminate waste
An effective “Shut-it-Off” program engages all employees
Best Practices
Design and display posters that encourage participation from all employees
Review manufacturing equipment operating requirements and investi-gate E-Stop features
Display “Shut-it-Off” instructions with pictures
Establish a factory energy team and schedule depart-ment “energy treasure hunts” afterhours to look for opportunities to shut down or set back systems
Consider a competition among workgroups or departments to decrease energy usage
Install motion sensors to turn off lights when rooms are unoccupied
Install time clocks on exhaust fans to turn them off during unoccupied hours
Install electrical interlocks between manufacturing equipment and support equipment (fans and pumps)
Analyze detailed electrical profiles and identify all loads operating during non-manufacturing hours
this chart illustrates the savings potential that a “Shut-it-off” program can realize. the green (●) line depicts the electrical consumption profile for this site during a typical weekend. the orange (●) line depicts the consumption profile after the site facilities managers promoted “Shut-it-off” in advance of a holiday weekend. “Shut-it-off” is a program that everyone can contribute to and the savings are significant.
1,000
3,000
2,000
5,000
6,000
4,000
kW
1 AM 3 AM 5 AM 7 AM 9 AM 11 AM 1 PM 3 PM 5 PM 7 PM 9 PM
� Normal Profile � Holiday Profile
electrical demand Comparison
Protecting our environmentstarts at home…Protecting our environment starts at home…
Changing to more energy-efficient practices and products protects the environment where we work and live.
and continues at work.and continues at work.
As a partner with the U.S. Environmental Protection Agency’s ENERGY STAR® program, we’re committed to protecting
the environment through energy efficiency. In 2006, American consumers and businesses prevented the
greenhouse gas emissions equivalent to 25 million vehicles by using less energy. Learn more at www.energystar.gov.
ePa energy Star has energy awareness posters for your use.
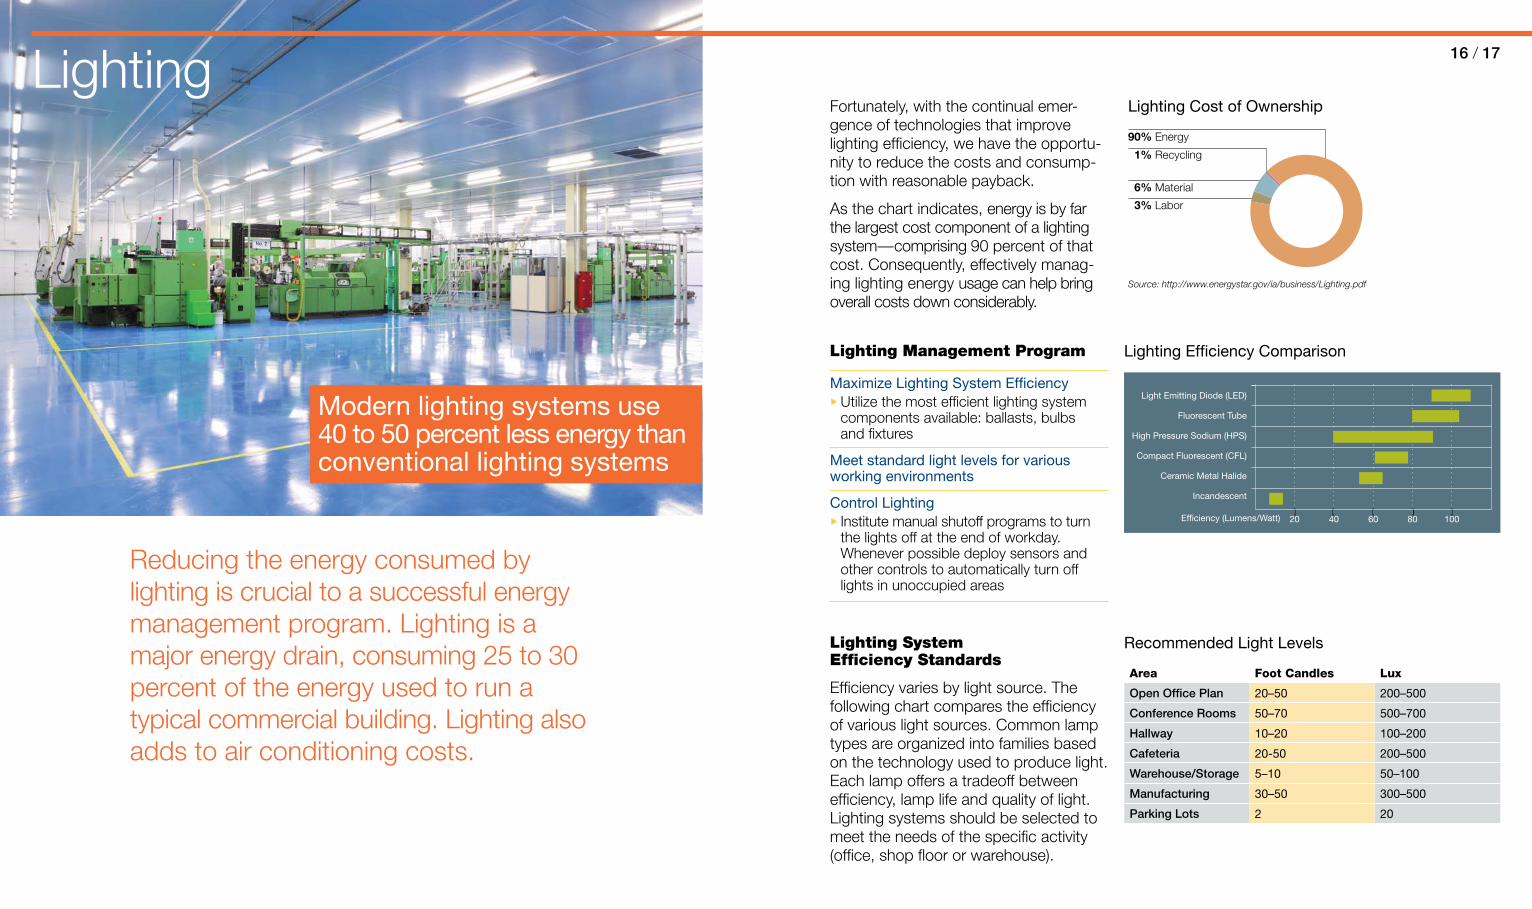
16 / 17Lighting
Reducing the energy consumed by lighting is crucial to a successful energy management program. Lighting is a major energy drain, consuming 25 to 30 percent of the energy used to run a typical commercial building. Lighting also adds to air conditioning costs.
modern lighting systems use 40 to 50 percent less energy than conventional lighting systems
lighting Cost of ownership
6% Material
90% Energy
1% Recycling
3% Labor
Source: http://www.energystar.gov/ia/business/Lighting.pdf
Lighting Management Program
maximize lighting System efficiency▶ Utilize the most efficient lighting system
components available: ballasts, bulbs and fixtures
meet standard light levels for various working environments
Control lighting▶ Institute manual shutoff programs to turn
the lights off at the end of workday. Whenever possible deploy sensors and other controls to automatically turn off lights in unoccupied areas
Fortunately, with the continual emer-gence of technologies that improve lighting efficiency, we have the opportu-nity to reduce the costs and consump-tion with reasonable payback.
As the chart indicates, energy is by far the largest cost component of a lighting system—comprising 90 percent of that cost. Consequently, effectively manag-ing lighting energy usage can help bring overall costs down considerably.
recommended light levels
Area Foot Candles Lux
Open Office Plan 20–50 200–500
Conference Rooms 50–70 500–700
Hallway 10–20 100–200
Cafeteria 20-50 200–500
Warehouse/Storage 5–10 50–100
Manufacturing 30–50 300–500
Parking Lots 2 20
lighting efficiency Comparison
Efficiency (Lumens/Watt) 20 40 60 80 100
Light Emitting Diode (LED)
Fluorescent Tube
High Pressure Sodium (HPS)
Compact Fluorescent (CFL)
Ceramic Metal Halide
Incandescent
Lighting System Efficiency Standards
Efficiency varies by light source. The following chart compares the efficiency of various light sources. Common lamp types are organized into families based on the technology used to produce light. Each lamp offers a tradeoff between efficiency, lamp life and quality of light. Lighting systems should be selected to meet the needs of the specific activity (office, shop floor or warehouse).

18 / 19
Best Practices
The following are proven cost and energy savings best practices that can provide significant sav-ings. Each item should be reviewed and evaluated for implementation.
Install automated controls such as time clocks, motion sensors, occupancy sen-sors and building automa-tion systems
Review all new lighting designs for maximum efficiency
Appoint “cell leaders” responsible for turning off shop floor lights after each shift
Sample Factory Floor Lighting System:
250 fixtures
2 x 4 fixture 4 lamps/fixture standard bulb, standard ballast
6 a.m. to 10 p.m. mon – Fri (16 hrs/day, 80 hrs/wk)
7 a.m. to 2 p.m. Sat (7 hrs/wk)
0.085 $/kWh average cost per kWh
Metrics
The following is a checklist of action-items you can implement to document and measure your prog-ress in reducing energy costs and consumption associated with lighting. These procedures should be followed on a regular basis, not just when an energy audit is scheduled.
document connected light-ing load (watts per square foot) and foot candle levels for each area (office, shop floor and warehouse)
review the Best Practice list for applicable energy efficiency improvements and develop a plan for implementation
Control the operating hours of the lighting system manually or automatically
Lighting (continued)
Use task lights to minimize the need for overhead lighting while still providing adequate light levels for specific tasks and activities
Install bi-level lighting in a warehouse▶ Warehouse lighting can
often be lowered during hours of low traffic. Motion sensors can be used to return lights to full bright-ness whenever someone enters the space
Use bi-level lighting controls to accommodate areas with natural light▶ In areas with natural light,
use electric lighting only where necessary. Install independent lighting control systems for these areas
Re-circuit shop floor lights to turn off lights in areas that do not work 2nd or 3rd shifts
Replace all incandescent lights with compact fluores-cent lamps
Instruct housekeeping staff to shut off lights immediately after cleaning an area
Consider LED fixtures for various applications including exit signs and exterior lighting
Use photo cell and time clock controls on exterior lighting
Operating Cost Calculator:
Operating cost = (Number of fixtures) x (kW/fixture) x (hrs/year) x (cost/kWh)
250 fixtures x [188 watts/fix./1000watts/kW] x 87hrs/wk x 52wk/yr x $0.085/kWh = $ 18,073 per year
example

Compressed air systems are integral to the operations of most industrial facilities—providing power for tools, equipment, and a broad range of processes—so much so that compressed air is considered industry’s fourth utility after electricity, gas and water.
a 100 HP air compressor costs up to $60,000 per year to operate. up to 50 percent is wasted (doe)
Compressed Air 20 / 21
Compressed air systems also consume a lot of electricity—as much as 25 percent of what an entire facility consumes. The cost of the electricity to run a compressed air system is the largest portion of total system cost—82 percent.
Fortunately, there are numerous opportunities for reducing waste and increasing the efficiency of the compressed air
systems at your site. The diagram below highlights some of the components of a typical compressed air system where these opportunities exist. Fixing system leaks, avoiding inappropriate uses of compressed air, eliminat-ing excessive pressure settings, using state of the art controls and maintaining the systems for peak performance can collectively save 20 to 50 percent.
total Cost of ownership
9% Maintenance
82% Electricity
9% Equipment and Installation
Source: U.S. Department of Energy
Compressed air System
add real-time monitoring capabilities to manage and control your compressed air system.
22 / 23
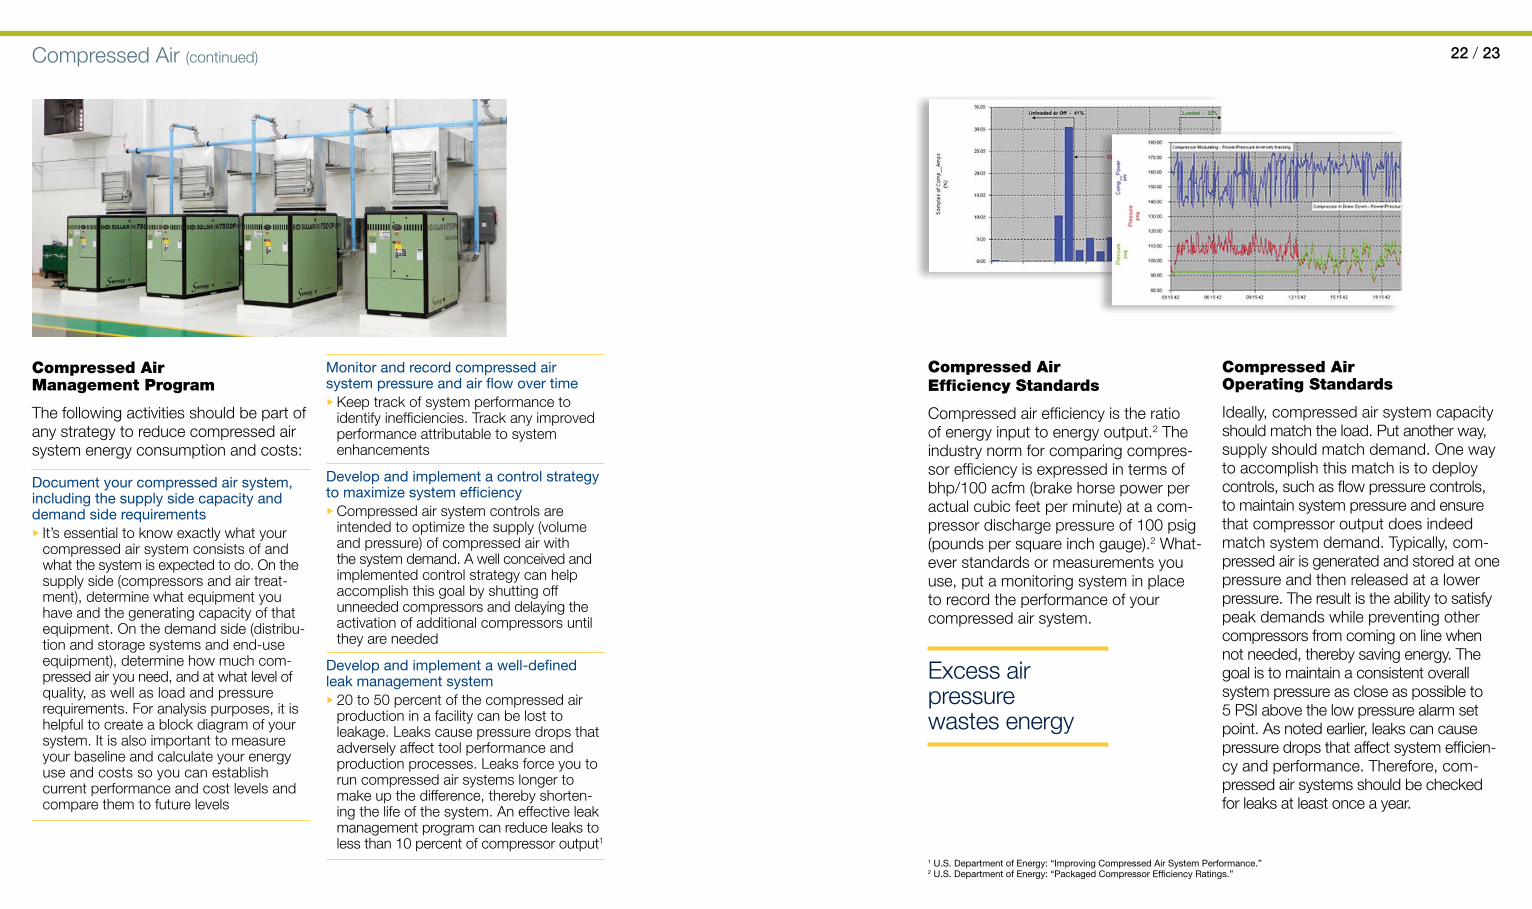
Compressed Air Management Program
The following activities should be part of any strategy to reduce compressed air system energy consumption and costs:
document your compressed air system, including the supply side capacity and demand side requirements▶ It’s essential to know exactly what your
compressed air system consists of and what the system is expected to do. On the supply side (compressors and air treat-ment), determine what equipment you have and the generating capacity of that equipment. On the demand side (distribu-tion and storage systems and end-use equipment), determine how much com-pressed air you need, and at what level of quality, as well as load and pressure requirements. For analysis purposes, it is helpful to create a block diagram of your system. It is also important to measure your baseline and calculate your energy use and costs so you can establish current performance and cost levels and compare them to future levels
monitor and record compressed air system pressure and air flow over time▶ Keep track of system performance to
identify inefficiencies. Track any improved performance attributable to system enhancements
develop and implement a control strategy to maximize system efficiency▶ Compressed air system controls are
intended to optimize the supply (volume and pressure) of compressed air with the system demand. A well conceived and implemented control strategy can help accomplish this goal by shutting off unneeded compressors and delaying the activation of additional compressors until they are needed
develop and implement a well-defined leak management system▶ 20 to 50 percent of the compressed air
production in a facility can be lost to leakage. Leaks cause pressure drops that adversely affect tool performance and production processes. Leaks force you to run compressed air systems longer to make up the difference, thereby shorten-ing the life of the system. An effective leak management program can reduce leaks to less than 10 percent of compressor output1
Compressed Air Efficiency Standards
Compressed air efficiency is the ratio of energy input to energy output.2 The industry norm for comparing compres-sor efficiency is expressed in terms of bhp/100 acfm (brake horse power per actual cubic feet per minute) at a com-pressor discharge pressure of 100 psig (pounds per square inch gauge).2 What-ever standards or measurements you use, put a monitoring system in place to record the performance of your compressed air system.
Compressed Air Operating Standards
Ideally, compressed air system capacity should match the load. Put another way, supply should match demand. One way to accomplish this match is to deploy controls, such as flow pressure controls, to maintain system pressure and ensure that compressor output does indeed match system demand. Typically, com-pressed air is generated and stored at one pressure and then released at a lower pressure. The result is the ability to satisfy peak demands while preventing other compressors from coming on line when not needed, thereby saving energy. The goal is to maintain a consistent overall system pressure as close as possible to 5 PSI above the low pressure alarm set point. As noted earlier, leaks can cause pressure drops that affect system efficien-cy and performance. Therefore, com-pressed air systems should be checked for leaks at least once a year.
Excess air pressure wastes energy
1 u.S. department of energy: “improving Compressed air System Performance.”2 u.S. department of energy: “Packaged Compressor efficiency ratings.”
Compressed Air (continued)
24 / 25
Compressed Air Cost Calculator quick rule of thumb: $1.25/day/hp
1 u.S. department of energy: “determine the Cost of Compressed air for your Plant.”2 u.S. department of energy: “improving Compressed air System Performance.”
Compressed Air Operating Cost
The operating cost of a compressed air system is much more than the cost of the equipment. It can take 7 to 8 hp of electricity to produce 1 hp of air force. The annual energy cost of running a compressed air system is affected by several variables, including the horsepower (hp) of the compressor, motor efficiency, electric utility rates ($/kWh) and the hours of operation. See formula below to calculate operating cost.
Operating cost ($) = (hp) x (0.746) x (electric rate) x (hours)
Motor efficiency
Another variable is the percentage of time that the system runs at a given operating level and the percentage of time it runs fully loaded.1 Accordingly, the following formula can be used:
Operating cost ($) = (hp) x (0.746) x (electric rate) x (hours) x (% time) x (% full load)
Motor efficiency
Here’s an example: Let’s say you have a 200 hp compressor that requires 215 bhp. The system operates 6,800 hours a year, running fully loaded 85 percent of the time with a motor efficiency of 95 per-cent, and the rest of the time at 25 percent of full load with a motor efficiency of 90 percent. For the purpose of this example, let’s say that the electrical rate is $0.08/ kWh.1 Here’s how to calculate the costs:
Operating cost when fully loaded (85% of the time)
(215 bhp) x (0.746) x ($0.08/kWh) x (6,800 hrs) x (0.85) x (1.0) = $78,067
0.95
PLUS
Operating cost when partially loaded (15% of the time)
(215 bhp) x (0.746HP/KW) x ($0.08/kWh) x (6,800 hrs) x (0.15) x (0.25) = $3,635
0.90
Annual energy cost: $78,067 + $3,635 = $81,702.
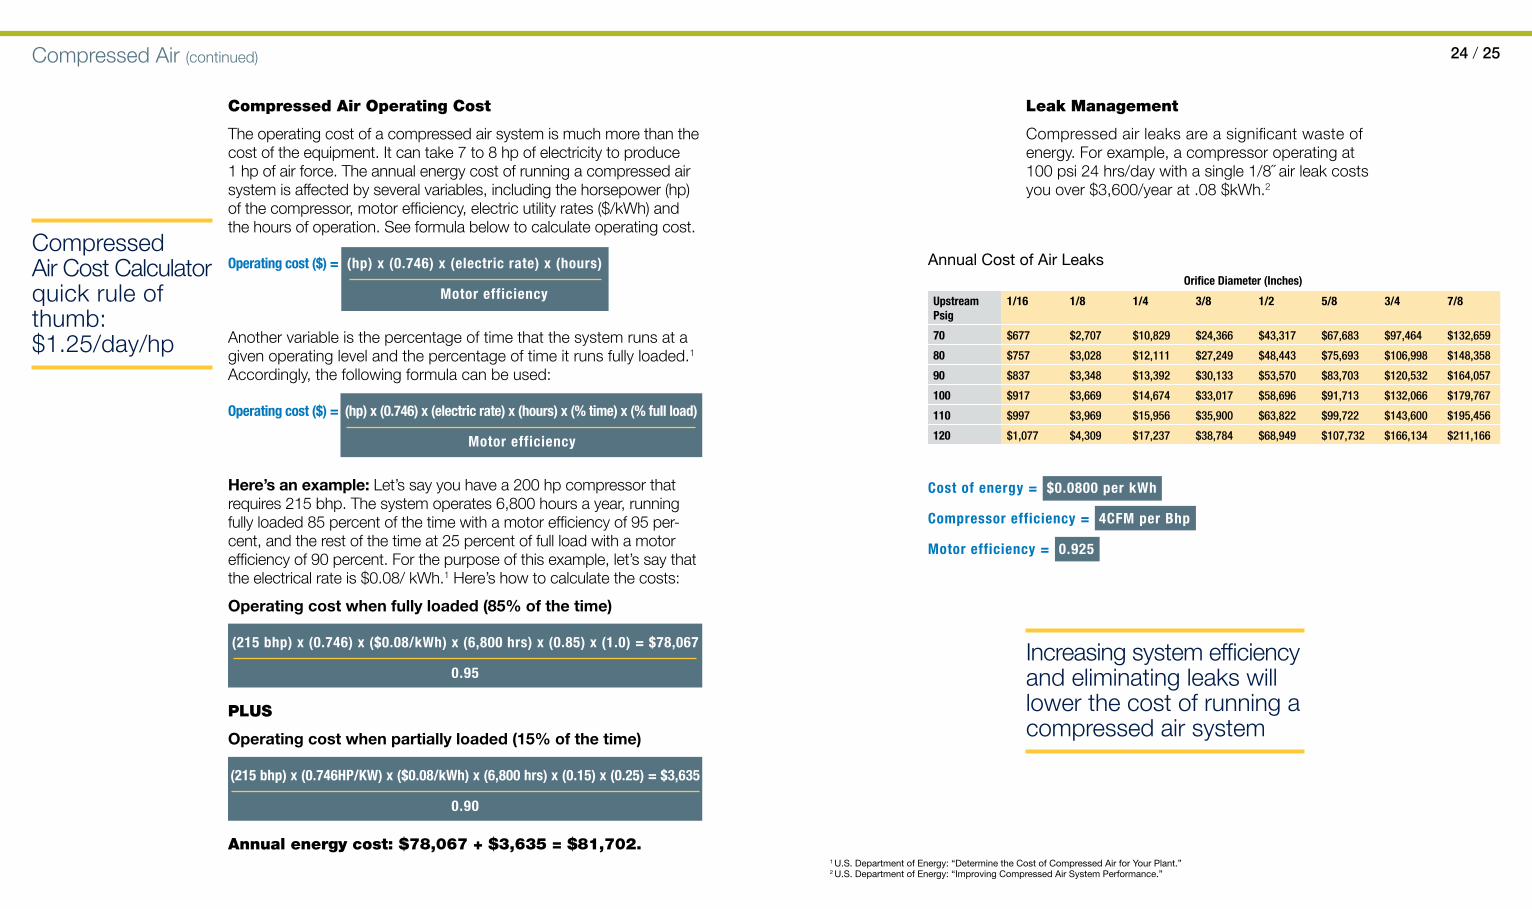
Leak Management
Compressed air leaks are a significant waste of energy. For example, a compressor operating at 100 psi 24 hrs/day with a single 1/8˝ air leak costs you over $3,600/year at .08 $kWh.2
Increasing system efficiency and eliminating leaks will lower the cost of running a compressed air system
annual Cost of air leaks Orifice Diameter (Inches)
Upstream Psig
1/16 1/8 1/4 3/8 1/2 5/8 3/4 7/8
70 $677 $2,707 $10,829 $24,366 $43,317 $67,683 $97,464 $132,659
80 $757 $3,028 $12,111 $27,249 $48,443 $75,693 $106,998 $148,358
90 $837 $3,348 $13,392 $30,133 $53,570 $83,703 $120,532 $164,057
100 $917 $3,669 $14,674 $33,017 $58,696 $91,713 $132,066 $179,767
110 $997 $3,969 $15,956 $35,900 $63,822 $99,722 $143,600 $195,456
120 $1,077 $4,309 $17,237 $38,784 $68,949 $107,732 $166,134 $211,166
Cost of energy = $0.0800 per kWh
Compressor efficiency = 4CFM per Bhp
Motor efficiency = 0.925
Compressed Air (continued)
26 / 27
Create a block diagram of your compressed air system▶ If you periodically add on to
your system, it is possible that you are building addi-tional inefficiencies into the system every time you add a component or sub-system
Measure the baseline use of air and calculate your current energy consumption and cost▶ Measure and track energy
consumption, pressure, flow and temperature
Work with a compressed air specialist to establish an effective compressor control strategy▶ Since 1965, Sullair (a UTC
company) has been recognized around the world as an innovator and leader in rotary screw compression technology. Sullair offers air system solutions to help com-pressed air users reduce energy cost and improve productivity by analyzing, managing and controlling compressed air systems
Eliminate inappropriate uses of compressed air▶ Compressed air is one of
the most expensive sources of energy in an industrial facility. Com-pressed air is appropriate for some applications and processes, but is not a cost efficient source of power for others. Inappro-priate uses for com-pressed air include such processes as cooling, vacuuming, drying, mixing and atomizing. NOTE: For processes requiring a delivery pressure of 25 PSI or less, you are better off using a blower, rather than compressed air
Use filters with the lowest pressure drop available that is able to deliver the re-quired quality of air▶ Filters are necessary
throughout a system to ensure that clean air reaches the end-use application. Inefficient or dirty filters clog the sys-tem and cause pressure drops, while forcing the system to consume more energy to compensate for those pressure drops. Using the right psi filter and inspecting regularly can help reduce this form of inefficiency
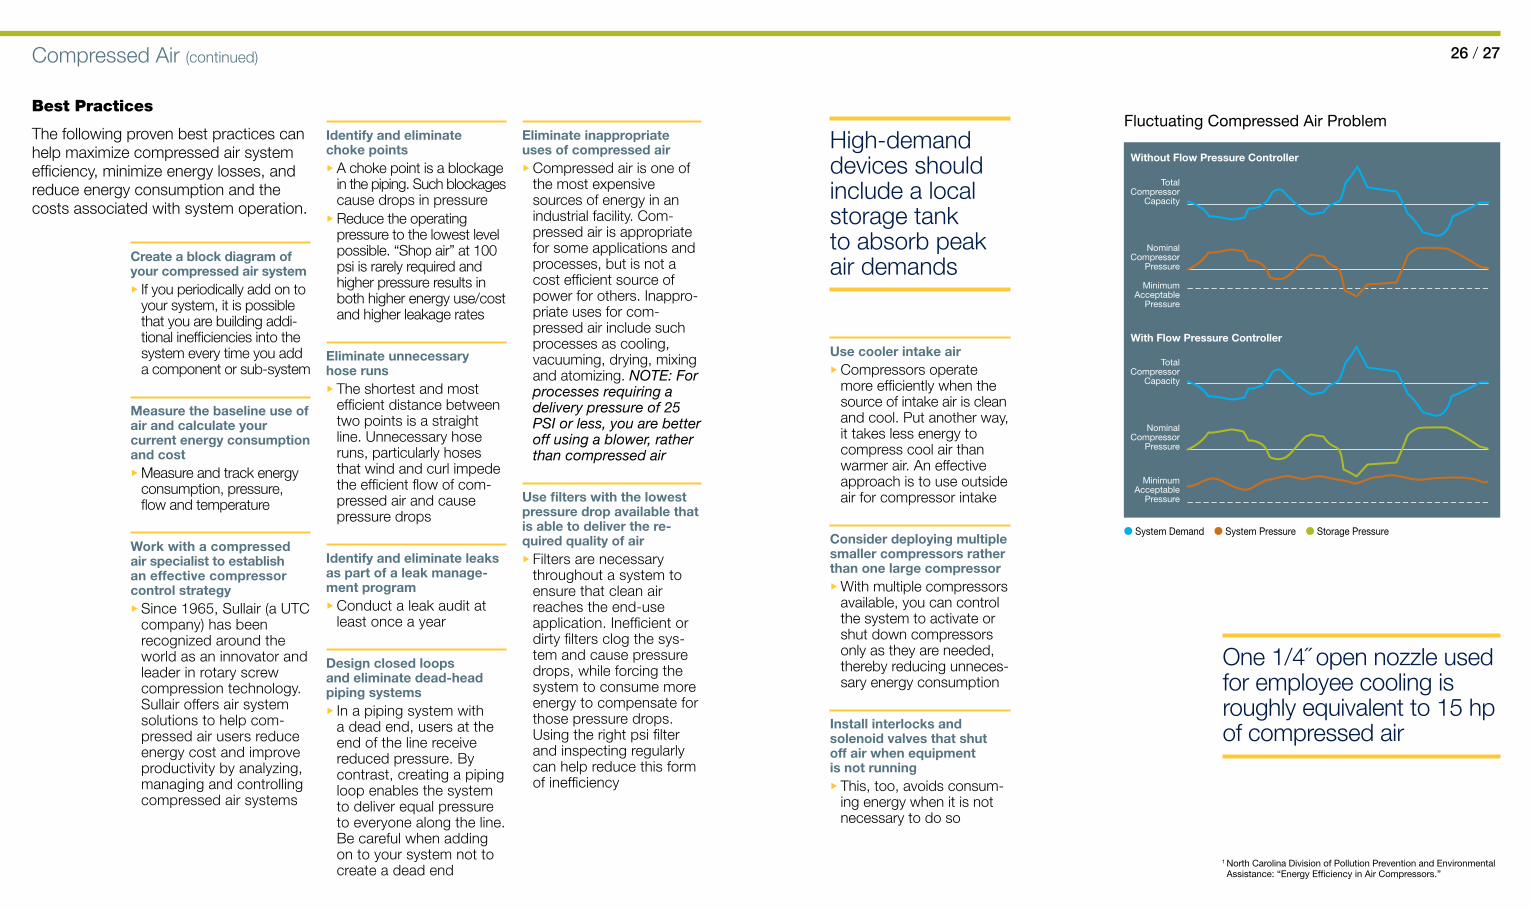
High-demand devices should include a local storage tank to absorb peak air demands
One 1/4˝ open nozzle used for employee cooling is roughly equivalent to 15 hp of compressed air
1 north Carolina division of Pollution Prevention and environmental assistance: “energy efficiency in air Compressors.”
Best Practices
The following proven best practices can help maximize compressed air system efficiency, minimize energy losses, and reduce energy consumption and the costs associated with system operation.
Compressed Air (continued)
Identify and eliminate choke points▶ A choke point is a blockage
in the piping. Such blockages cause drops in pressure
▶ Reduce the operating pressure to the lowest level possible. “Shop air” at 100 psi is rarely required and higher pressure results in both higher energy use/cost and higher leakage rates
Eliminate unnecessary hose runs▶ The shortest and most
efficient distance between two points is a straight line. Unnecessary hose runs, particularly hoses that wind and curl impede the efficient flow of com-pressed air and cause pressure drops
Identify and eliminate leaks as part of a leak manage-ment program▶ Conduct a leak audit at
least once a year
Design closed loops and eliminate dead-head piping systems▶ In a piping system with
a dead end, users at the end of the line receive reduced pressure. By contrast, creating a piping loop enables the system to deliver equal pressure to everyone along the line. Be careful when adding on to your system not to create a dead end
Use cooler intake air▶ Compressors operate
more efficiently when the source of intake air is clean and cool. Put another way, it takes less energy to compress cool air than warmer air. An effective approach is to use outside air for compressor intake
Consider deploying multiple smaller compressors rather than one large compressor▶ With multiple compressors
available, you can control the system to activate or shut down compressors only as they are needed, thereby reducing unneces-sary energy consumption
Install interlocks and solenoid valves that shut off air when equipment is not running▶ This, too, avoids consum-
ing energy when it is not necessary to do so
Fluctuating Compressed air Problem
� System Demand � System Pressure � Storage Pressure
Without Flow Pressure Controller
With Flow Pressure Controller
TotalCompressor
Capacity
TotalCompressor
Capacity
NominalCompressor
Pressure
MinimumAcceptable
Pressure
NominalCompressor
Pressure
MinimumAcceptable
Pressure
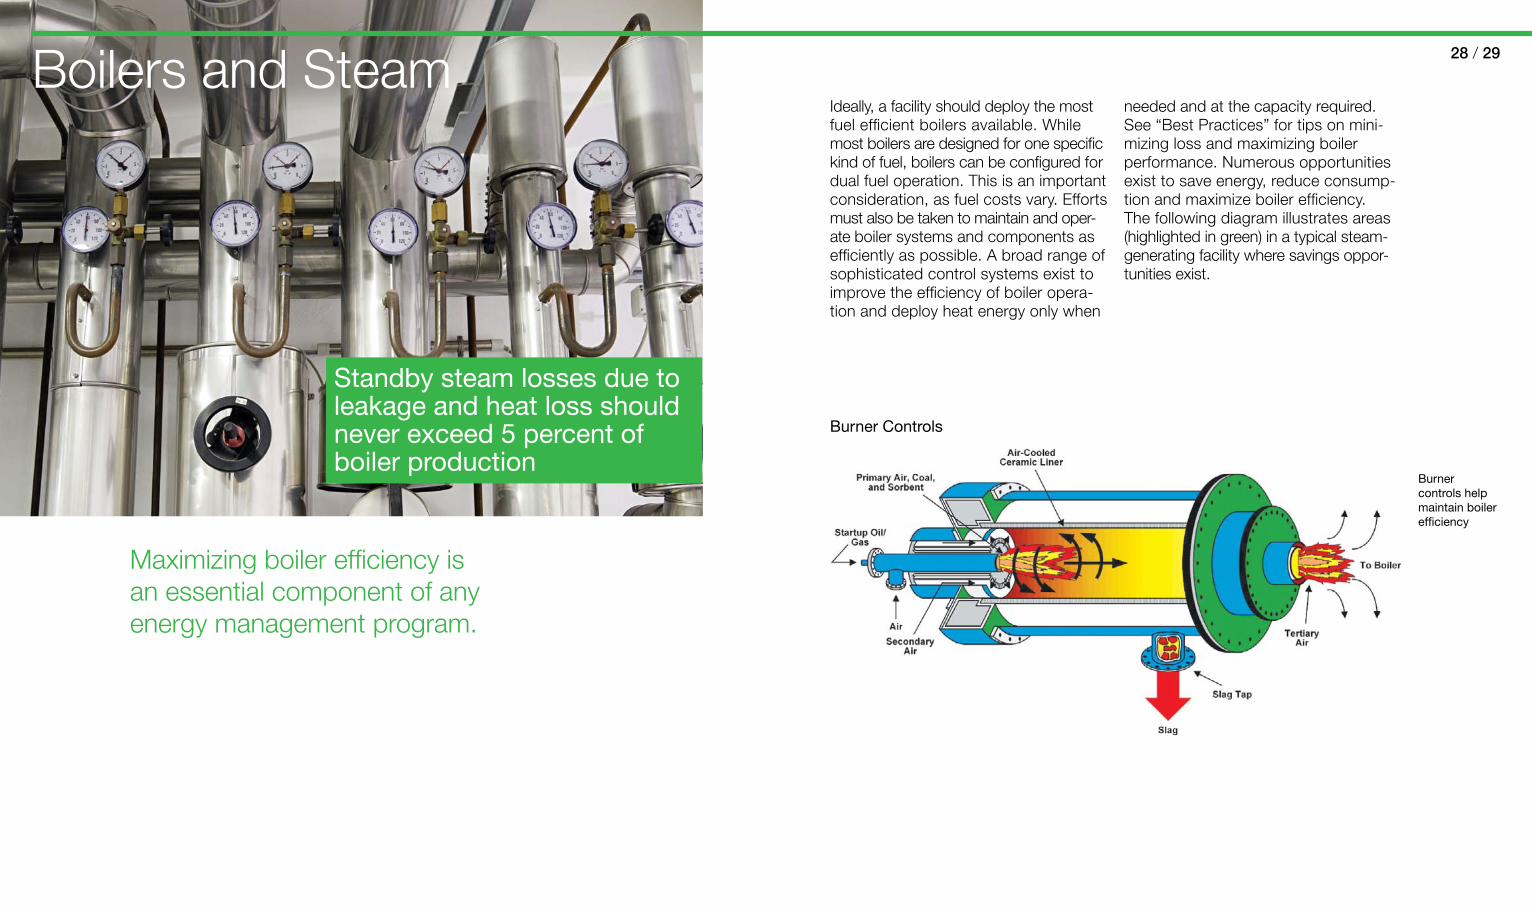
Maximizing boiler efficiency is an essential component of any energy management program.
Standby steam losses due to leakage and heat loss should never exceed 5 percent of boiler production
Boilers and Steam 28 / 29
Ideally, a facility should deploy the most fuel efficient boilers available. While most boilers are designed for one specific kind of fuel, boilers can be configured for dual fuel operation. This is an important consideration, as fuel costs vary. Efforts must also be taken to maintain and oper-ate boiler systems and components as efficiently as possible. A broad range of sophisticated control systems exist to improve the efficiency of boiler opera-tion and deploy heat energy only when
needed and at the capacity required. See “Best Practices” for tips on mini-mizing loss and maximizing boiler performance. Numerous opportunities exist to save energy, reduce consump-tion and maximize boiler efficiency. The following diagram illustrates areas (highlighted in green) in a typical steam-generating facility where savings oppor-tunities exist.
Burner controls help maintain boiler efficiency
Burner Controls
30 / 31
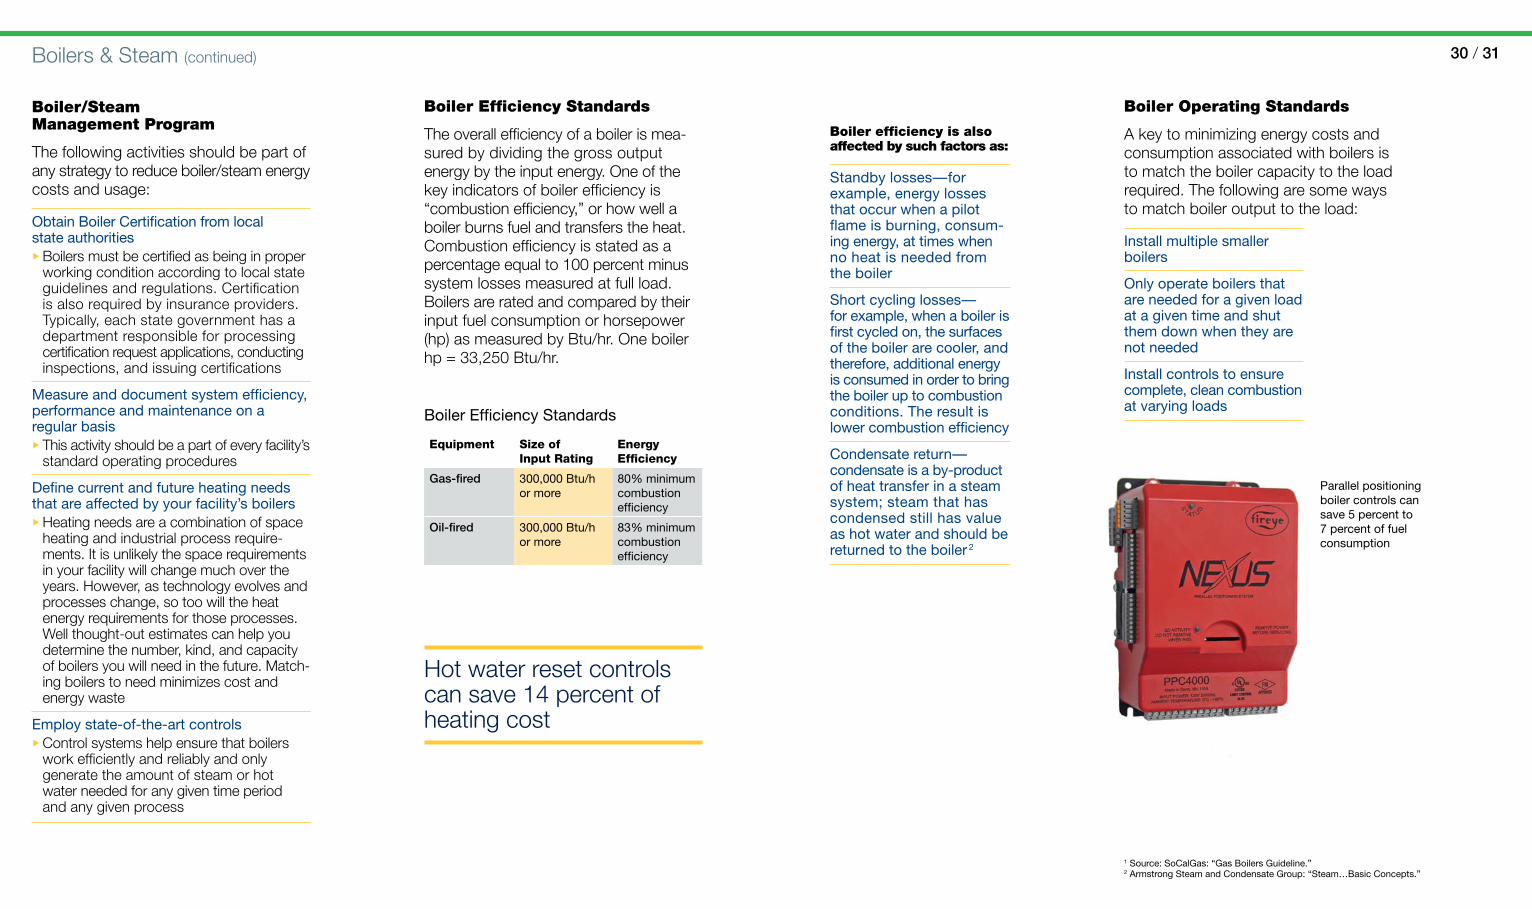
Parallel positioning boiler controls can save 5 percent to 7 percent of fuel consumption
Hot water reset controls can save 14 percent of heating cost
1 Source: SoCalGas: “Gas Boilers Guideline.”2 armstrong Steam and Condensate Group: “Steam…Basic Concepts.”
Boiler/Steam Management Program
The following activities should be part of any strategy to reduce boiler/steam energy costs and usage:
obtain Boiler Certification from local state authorities▶ Boilers must be certified as being in proper
working condition according to local state guidelines and regulations. Certification is also required by insurance providers. Typically, each state government has a department responsible for processing certification request applications, conducting inspections, and issuing certifications
measure and document system efficiency, performance and maintenance on a regular basis▶ This activity should be a part of every facility’s
standard operating procedures
define current and future heating needs that are affected by your facility’s boilers▶ Heating needs are a combination of space
heating and industrial process require-ments. It is unlikely the space requirements in your facility will change much over the years. However, as technology evolves and processes change, so too will the heat energy requirements for those processes. Well thought-out estimates can help you determine the number, kind, and capacity of boilers you will need in the future. Match-ing boilers to need minimizes cost and energy waste
employ state-of-the-art controls▶ Control systems help ensure that boilers
work efficiently and reliably and only generate the amount of steam or hot water needed for any given time period and any given process
Boiler efficiency Standards
Equipment Size of Input Rating
Energy Efficiency
Gas-fired 300,000 Btu/h or more
80% minimum combustion efficiency
Oil-fired 300,000 Btu/h or more
83% minimum combustion efficiency
Boiler efficiency is also affected by such factors as:
Standby losses—for example, energy losses that occur when a pilot flame is burning, consum-ing energy, at times when no heat is needed from the boiler
Short cycling losses— for example, when a boiler is first cycled on, the surfaces of the boiler are cooler, and therefore, additional energy is consumed in order to bring the boiler up to combustion conditions. the result is lower combustion efficiency
Condensate return— condensate is a by-product of heat transfer in a steam system; steam that has condensed still has value as hot water and should be returned to the boiler 2
Boiler Operating Standards
A key to minimizing energy costs and consumption associated with boilers is to match the boiler capacity to the load required. The following are some ways to match boiler output to the load:
install multiple smaller boilers
only operate boilers that are needed for a given load at a given time and shut them down when they are not needed
install controls to ensure complete, clean combustion at varying loads
Boiler Efficiency Standards
The overall efficiency of a boiler is mea-sured by dividing the gross output energy by the input energy. One of the key indicators of boiler efficiency is “combustion efficiency,” or how well a boiler burns fuel and transfers the heat. Combustion efficiency is stated as a percentage equal to 100 percent minus system losses measured at full load. Boilers are rated and compared by their input fuel consumption or horsepower (hp) as measured by Btu/hr. One boiler hp = 33,250 Btu/hr.
Boilers & Steam (continued)

32 / 33
1 u.S. department of energy: “energy tips – Steam.”
System maintenance impacts system efficiency. Poorly maintained boilers are far less efficient than well maintained boilers
Metrics
The following is a checklist of action-items you can implement to document and measure your progress in reducing energy costs and consumption associ-ated with boilers. These procedures should be followed on a regular basis, not just when energy audits are scheduled.
track monthly energy consumption and cost data
Provide maintenance history
measure and monitor winter peak load and summer base load Btus per square foot
monitor combustion efficiency
Boilers must be monitored regularly
Steam traps require maintenance for efficient operation
Best Practices
The following proven best practices can help maxi-mize boiler efficiency, minimize heat/energy losses, and reduce energy consumption and the costs associated with boilers.
Burn alternate fuels to take advantage of fluctuating fuel costs▶ Fuel markets are volatile,
and costs change all the time. Be aware of which fuels are most cost effec-tive at any point in time and be prepared to take advantage of potential fuel cost savings by being able to burn alternate fuels
Shut off boilers when not needed▶ It is a costly proposition to
generate steam, heat, and hot water when they are not needed
Optimize boiler staging to maximize efficiency and avoid part-load inefficiencies▶ Operate boilers with
capacity that matches the required load
Replace larger boilers with multiple boilers▶ Use multiple boilers to
supply a common load and sequence them to match load requirements
Seasonally adjust hot water temperature setpoints▶ In parts of the country
where weather and tem-peratures change signifi-cantly from season to season, there are savings opportunities resulting from adjusting temperature setpoints according to outdoor temperatures
Use control systems to automatically control and/or interlock boilers and pump-ing systems to provide the proper amount of steam for each process▶ Control systems help
ensure a reliable, safe, efficient supply of steam. And, for processes requir-ing a continuous supply of steam, controls help ensure that the steam supply is uninterrupted
Inspect and check all automatic control systems and valves to ensure proper operation▶ When operating correctly,
control systems greatly improve the efficiency of boiler operation. Therefore it is imperative to make sure these controls, such as temperature controls and valves, are working properly
Establish and implement a steam trap program
Put excess steam to use generating power with Carrier micro-turbines
Control the flow rate of the induced draft and forced draft fans by installing variable-speed drives▶ Fans enable the flow of
steam through the system. Deploying variable fans helps adjust the flow rate to meet changing load requirements
Maximize the return of all condensate to boiler▶ An effective method of
improving power boiler plant energy efficiency is to increase the conden-sate return to the boiler1
Periodically inspect con-densate station vents for excessive plumes▶ Excessive condensate can
reduce heat transfer. It’s important that the traps and vents be designed to open in order to drain the condensate and close to retain the steam
Consider heat recovery to preheat boiler make-up water▶ To maximize efficiency and
save energy, use heat recovered from the boiler to preheat make-up water
Measure, document, and record boiler efficiency and performance on a regular basis and utilize that informa-tion to improve system efficiency▶ Only by taking frequent,
regular measurements and documenting the results can you accurately gauge boiler performance over time and spot potential inefficiencies. One helpful monitoring tactic is to install steam meters to track heating needs
As part of regular inspection and maintenance proce-dures, check, test and calibrate the devices that measure pressure, tempera-ture and flow▶ Be sure to keep logs of all
data from these devices and instruments and regularly review it to identify ineffi-ciency trends
Monitor and minimize boiler blow-down through proper water management. Install an automatic blow-down central system▶ Solids can accumulate in
a boiler and form sludge, which impedes heat transfer. Such solids can also damage pipes, steam traps and process equip-ment. These impurities must be blown down by discharging some water from the boiler to a drain. This must be done in a pre-cisely controlled manner to avoid wasting water and heat—hence the need for a properly working auto-matic blow-down system1
Inspect the entire system for leaks, defective valves and flanges, and corroded piping and components, pump seal or packing▶ Leaks, corrosion, and other
defects in a boiler/heating system waste heat and energy. A program of regular inspection is necessary to identify these deficiencies and correct them in order to prevent further losses and inefficiencies
Insulate all bare steam pipes and valves. Inspect system insulation on a regular basis and repair as needed▶ Proper insulation
prevents loss of heat, steam, and energy
Boilers & Steam (continued)
34 / 35
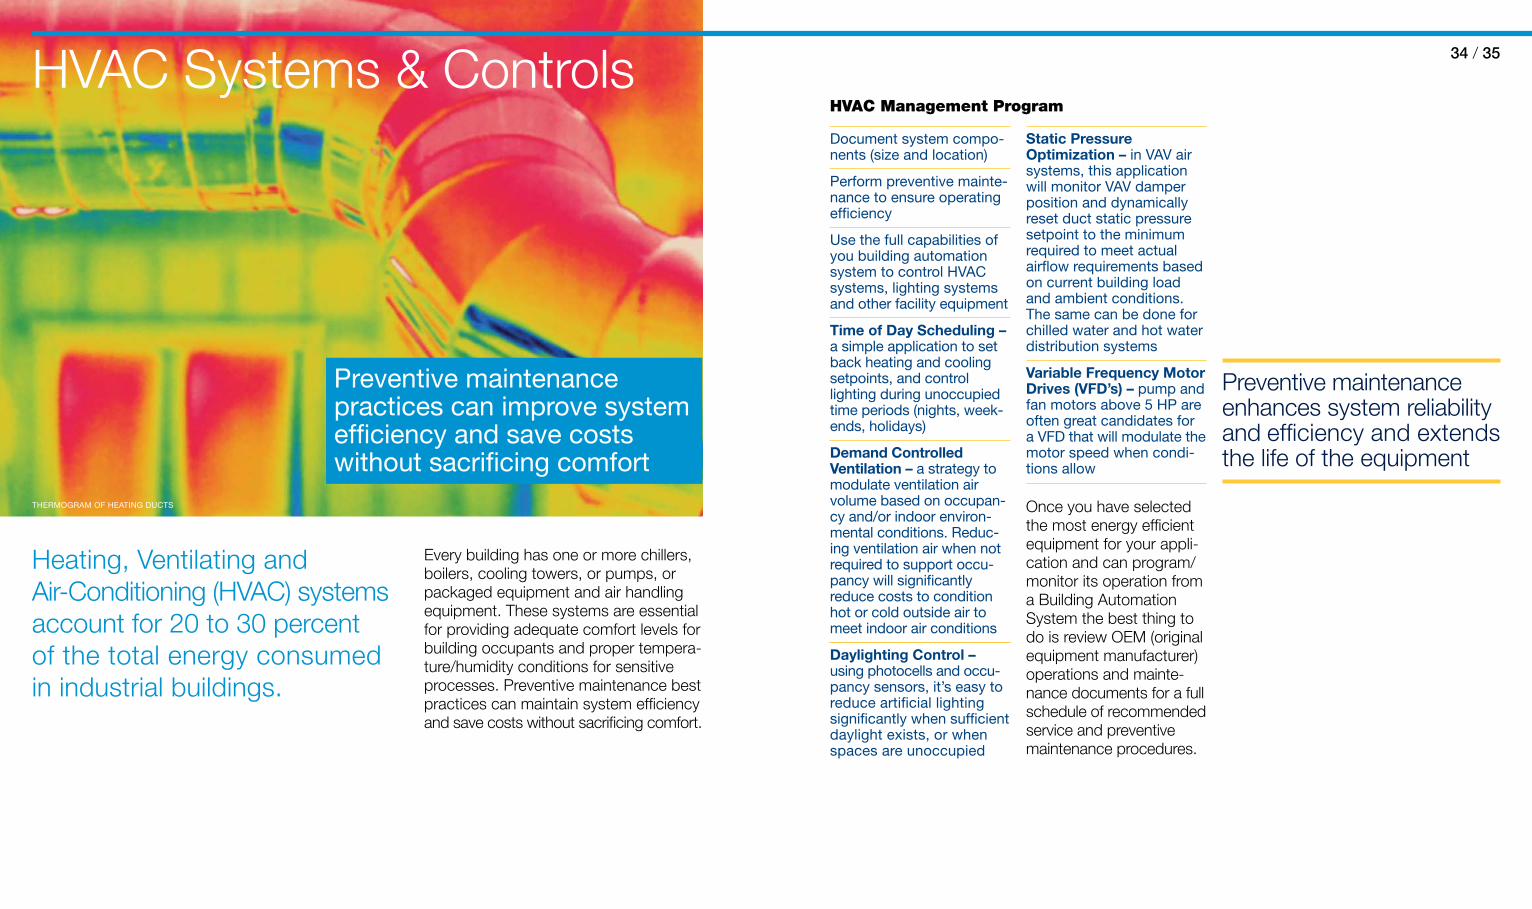
Heating, Ventilating and Air-Conditioning (HVAC) systems account for 20 to 30 percent of the total energy consumed in industrial buildings.
Preventive maintenance practices can improve system efficiency and save costs without sacrificing comfort
HVAC Systems & Controls
Every building has one or more chillers, boilers, cooling towers, or pumps, or packaged equipment and air handling equipment. These systems are essential for providing adequate comfort levels for building occupants and proper tempera-ture/humidity conditions for sensitive processes. Preventive maintenance best practices can maintain system efficiency and save costs without sacrificing comfort.
Preventive maintenance enhances system reliability and efficiency and extends the life of the equipment
tHermoGram oF HeatinG duCtS
document system compo-nents (size and location)
Perform preventive mainte-nance to ensure operating efficiency
use the full capabilities of you building automation system to control HVaC systems, lighting systems and other facility equipment
Time of Day Scheduling – a simple application to set back heating and cooling setpoints, and control lighting during unoccupied time periods (nights, week-ends, holidays)
Demand Controlled Ventilation – a strategy to modulate ventilation air volume based on occupan-cy and/or indoor environ-mental conditions. reduc-ing ventilation air when not required to support occu-pancy will significantly reduce costs to condition hot or cold outside air to meet indoor air conditions
Daylighting Control – using photocells and occu-pancy sensors, it’s easy to reduce artificial lighting significantly when sufficient daylight exists, or when spaces are unoccupied
Static Pressure Optimization – in VaV air systems, this application will monitor VaV damper position and dynamically reset duct static pressure setpoint to the minimum required to meet actual airflow requirements based on current building load and ambient conditions. the same can be done for chilled water and hot water distribution systems
Variable Frequency Motor Drives (VFD’s) – pump and fan motors above 5 HP are often great candidates for a VFd that will modulate the motor speed when condi-tions allow
Once you have selected the most energy efficient equipment for your appli-cation and can program/monitor its operation from a Building Automation System the best thing to do is review OEM (original equipment manufacturer) operations and mainte-nance documents for a full schedule of recommended service and preventive maintenance procedures.
HVAC Management Program

36 / 37
Best Practices
Establish a preventive maintenance program for all HVAC equipment
Whenever possible use cooling tower water to provide free cooling for process and air condition-ing needs
Establish a cooling tower water quality program to eliminate algae and rust
Use Free Cooling whenever possible!
The efficient, proper operation and longevity of a water cooling system depend on ensuring the quality of the water to prevent corrosion and other damage that can adversely affect system performance.1
Control cooling tower fans with variable speed controls or a two-speed motor
Chillers
Well maintained chillers can use up to 20-25 percent less energy to produce the same amount of cooling
What’s important▶ Keep a good operation log
& maintenance record▶ Regularly scheduled oper-
ating inspections▶ Annual inspections and
clean up
What to focus on▶ Keep tubes (water cooled
chillers) and coils (air cooled chillers) clean
▶ Ensure refrigerant charges are optimized (not too much, not too little)
▶ Regular inspections & cali-bration of chiller controls
Cooling Towers
What’s important▶ Keep a good operation log
& maintenance record▶ Regularly scheduled oper-
ating inspections▶ Water treatment
What to focus on▶ Keep the tower clean
to maximize heat transfer capability
▶ Ensure motor drive belts are adjusted properly
▶ Keep the fan blades clean for proper operation
▶ Proper operation of tower fan and water-level controls
▶ Good water treatment to reduce biological growth and to keep the concen-tration of suspended solids within acceptable limits
▶ Ensure spray nozzles aren’t clogged
Packaged Equipment
What’s important▶ Regularly scheduled
inspections at each seasonal start-up (cooling and heating)
What to focus on▶ Keep condenser and
evaporater coils clean for maximum heat transfer
▶ Ensure proper refrigeration charge
▶ Replace filters a minimum of four times per year to maintain proper air flow
▶ Keep drive belts maintained and properly aligned
▶ Clean, lubricate and adjust dampers for proper operation
▶ Repair air leaks in ductwork to prevent air from escaping to non-conditioned areas
Retro-commissioning restores HVAC system efficiency
1 u.S. department of energy: “Water efficiency: Cooling tower management.”
Air Handling Equipment
What’s important▶ Regularly scheduled
inspections and maintenance
What to focus on▶ Keep heating and cooling
coils clean for maximum heat transfer
▶ Check coils for leaks▶ Replace filters often
to reduce static pressure and to maintain proper air flow
▶ Keep drive belts maintained and properly aligned
▶ Clean intake plenum of dirt and debris
▶ Inspect fan; lubricate and clean as needed
Use Variable Frequency Drives (VFDs) on all large pumps, fans and towers (5 hp and above)
HVAC Systems & Controls (continued)
Replace constant-volume air-handling systems with VAV-variable air volume systems
Establish an occupancy schedule and shut off all equipment during unoccu-pied hours
Install a heat exchanger to recover heat from exhaust air
Install back-draft dampers on fans discharging to the outdoors to eliminate infiltration when fans are off
Shut off pumps when not required
Metrics
maintain an equipment inventory list
install programmable controls to maintain time and temperature set-points
maintain an HVaC mainte-nance log including a refrigerant maintenance log and details of annual inspection
Complete an HVaC audit every three years
Combined Heat and Power 38 / 39
A typical CHP application includes one of the follow-ing technologies to drive an electrical generator:
Combustion turbine
reciprocating engine
micro turbine
Fuel cell
Size in kW output is usually the determining factor in technology selection.
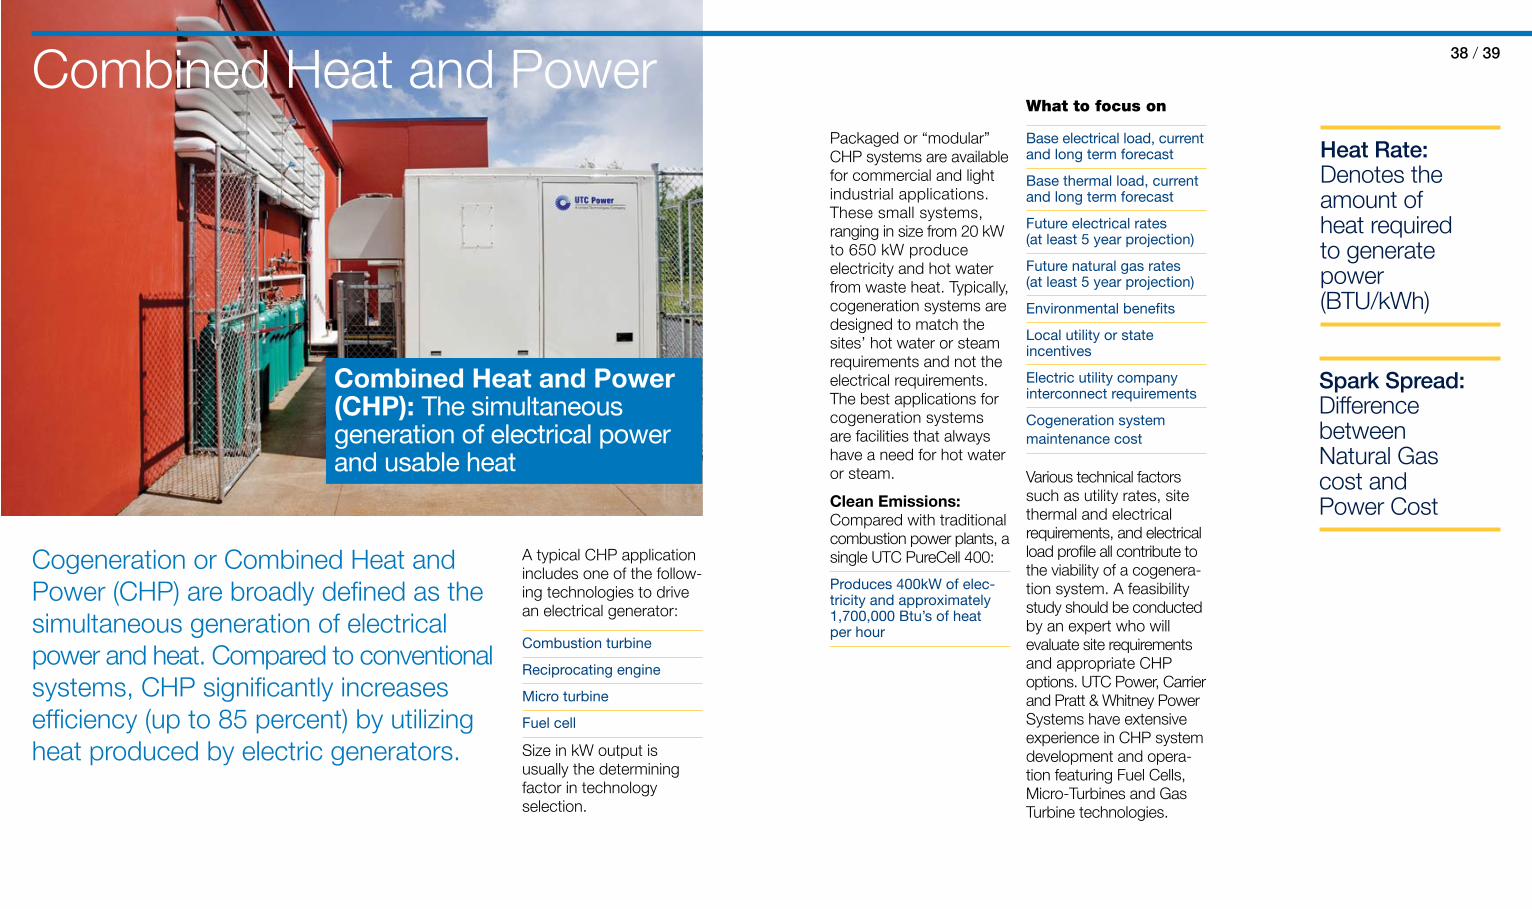
Combined Heat and Power (CHP): the simultaneous generation of electrical power and usable heat
Packaged or “modular” CHP systems are available for commercial and light industrial applications. These small systems, ranging in size from 20 kW to 650 kW produce electricity and hot water from waste heat. Typically, cogeneration systems are designed to match the sites’ hot water or steam requirements and not the electrical requirements. The best applications for cogeneration systems are facilities that always have a need for hot water or steam.
Clean Emissions: Compared with traditional combustion power plants, a single UTC PureCell 400:
Produces 400kW of elec-tricity and approximately 1,700,000 Btu’s of heat per hour
Heat Rate: Denotes the amount of heat required to generate power (BTU/kWh)
Spark Spread: Difference between Natural Gas cost and Power Cost
Cogeneration or Combined Heat and Power (CHP) are broadly defined as the simultaneous generation of electrical power and heat. Compared to conventional systems, CHP significantly increases efficiency (up to 85 percent) by utilizing heat produced by electric generators.
What to focus on
Base electrical load, current and long term forecast
Base thermal load, current and long term forecast
Future electrical rates (at least 5 year projection)
Future natural gas rates (at least 5 year projection)
environmental benefits
local utility or state incentives
electric utility company interconnect requirements
Cogeneration system maintenance cost
Various technical factors such as utility rates, site thermal and electrical requirements, and electrical load profile all contribute to the viability of a cogenera-tion system. A feasibility study should be conducted by an expert who will evaluate site requirements and appropriate CHP options. UTC Power, Carrier and Pratt & Whitney Power Systems have extensive experience in CHP system development and opera-tion featuring Fuel Cells, Micro-Turbines and Gas Turbine technologies.

Therefore, the insulating properties of the roof, doors, and windows should all be maintained to minimize energy use. The three major contributors to energy inefficiency in the building envelope are:
infiltration of hot and cold air
Solar radiation
Heat loss through windows, walls, floors and roofs
40 / 41
much of a building’s heat losses and gains occur through the roof, so there are often significantenergy-savings opportunities related to roof efficiency.
Building EnvelopeWhat to Focus On
Building envelope improvements are most cost-effective when they are conducted as part of new construction or retrofit initiatives.
upgrade insulation levels as part of other projects (e.g., new construction, re-roofing)
Check insulation for condensation and water penetration, replace as needed. insulation is ineffective once it becomes wet
insulate roof voids. the integrity of the roof should be maintained each time the roof is penetrated
maintain window and door seals to eliminate drafts
install double- or triple-glazed windows with low-emissive (low-e) glass
install double-spaced automatic doors in areas where external doors are frequently left open
install plastic secondary door curtains inside delivery doors
use thermal scans to test the integrity of building insulation
establish a roof management plan
minimize solar heat gain through the use of window film or window shades
The integrity of the building envelope has a dramatic impact on the energy required to heat and cool the building.
Best Practice: Perform a thermal scan of the roof to check for damaged insulation
Building envelope thermographic study
infrared thermographic image
Control image, wet sections marked for removal
dry
wet
42 / 43Appendix A:
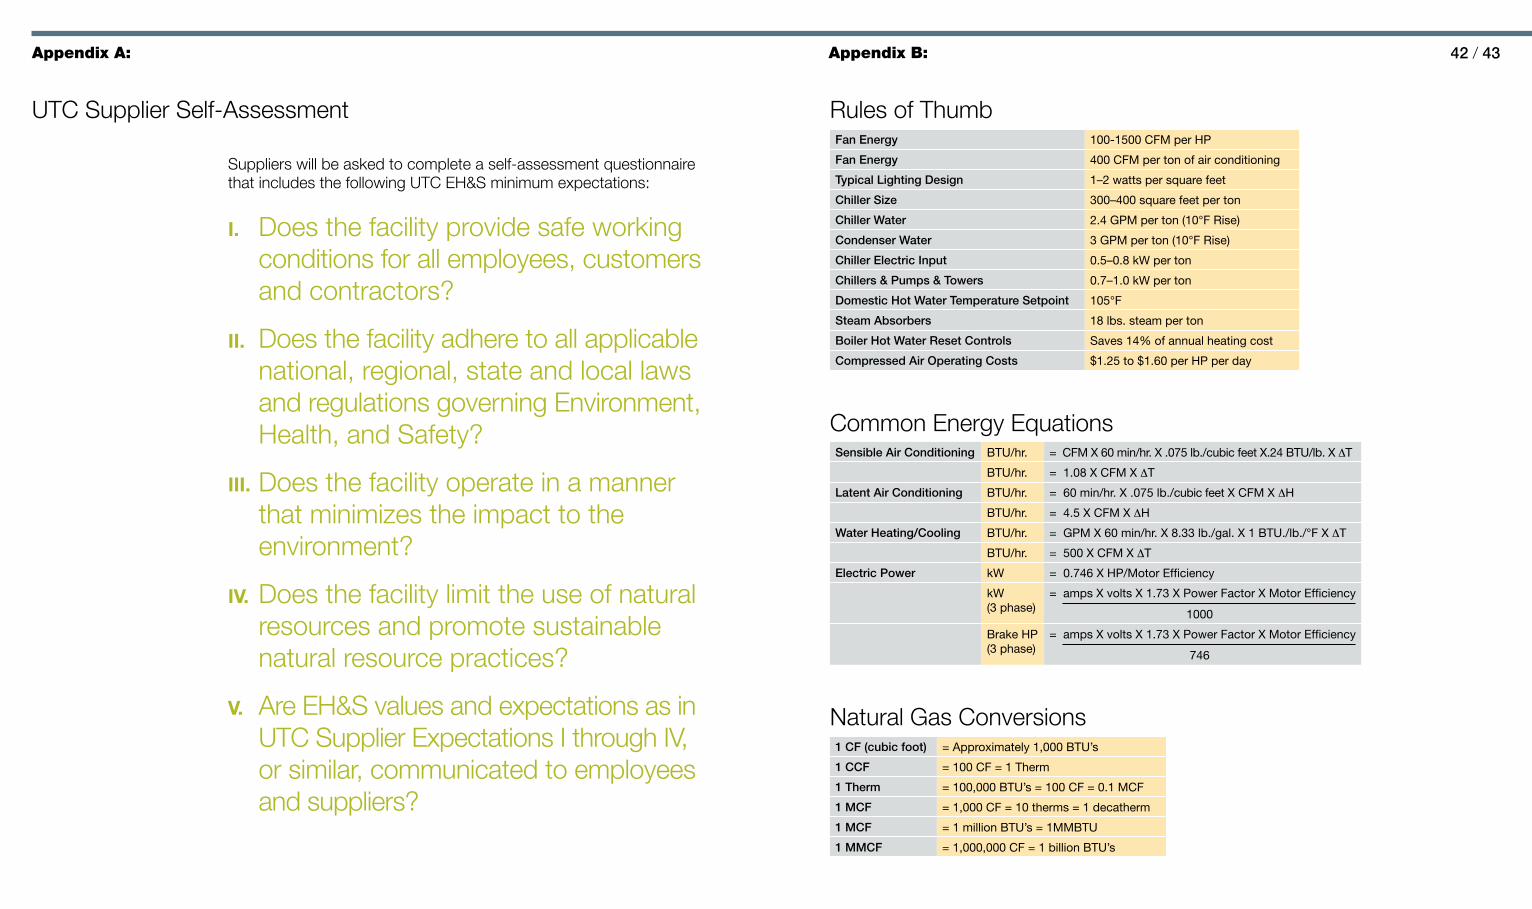
Rules of ThumbFan Energy 100-1500 CFm per HP
Fan Energy 400 CFm per ton of air conditioning
Typical Lighting Design 1–2 watts per square feet
Chiller Size 300–400 square feet per ton
Chiller Water 2.4 GPm per ton (10°F rise)
Condenser Water 3 GPm per ton (10°F rise)
Chiller Electric Input 0.5–0.8 kW per ton
Chillers & Pumps & Towers 0.7–1.0 kW per ton
Domestic Hot Water Temperature Setpoint 105°F
Steam Absorbers 18 lbs. steam per ton
Boiler Hot Water Reset Controls Saves 14% of annual heating cost
Compressed Air Operating Costs $1.25 to $1.60 per HP per day
Appendix B:
Common Energy EquationsSensible Air Conditioning Btu/hr. = CFm X 60 min/hr. X .075 lb./cubic feet X.24 Btu/lb. X ∆t
Btu/hr. = 1.08 X CFm X ∆t
Latent Air Conditioning Btu/hr. = 60 min/hr. X .075 lb./cubic feet X CFm X ∆H
Btu/hr. = 4.5 X CFm X ∆H
Water Heating/Cooling Btu/hr. = GPm X 60 min/hr. X 8.33 lb./gal. X 1 Btu./lb./°F X ∆t
Btu/hr. = 500 X CFm X ∆t
Electric Power kW = 0.746 X HP/motor efficiency
kW (3 phase)
= amps X volts X 1.73 X Power Factor X motor efficiency
1000
Brake HP (3 phase)
= amps X volts X 1.73 X Power Factor X motor efficiency
746
Natural Gas Conversions1 CF (cubic foot) = approximately 1,000 Btu’s
1 CCF = 100 CF = 1 therm
1 Therm = 100,000 Btu’s = 100 CF = 0.1 mCF
1 MCF = 1,000 CF = 10 therms = 1 decatherm
1 MCF = 1 million Btu’s = 1mmBtu
1 MMCF = 1,000,000 CF = 1 billion Btu’s
Suppliers will be asked to complete a self-assessment questionnaire that includes the following UTC EH&S minimum expectations:
I. Does the facility provide safe working conditions for all employees, customers and contractors?
II. Does the facility adhere to all applicable national, regional, state and local laws and regulations governing Environment, Health, and Safety?
III. Does the facility operate in a manner that minimizes the impact to the environment?
IV. Does the facility limit the use of natural resources and promote sustainable natural resource practices?
V. Are EH&S values and expectations as in UTC Supplier Expectations I through IV, or similar, communicated to employees and suppliers?
UTC Supplier Self-Assessment
44 / 45Appendix C:
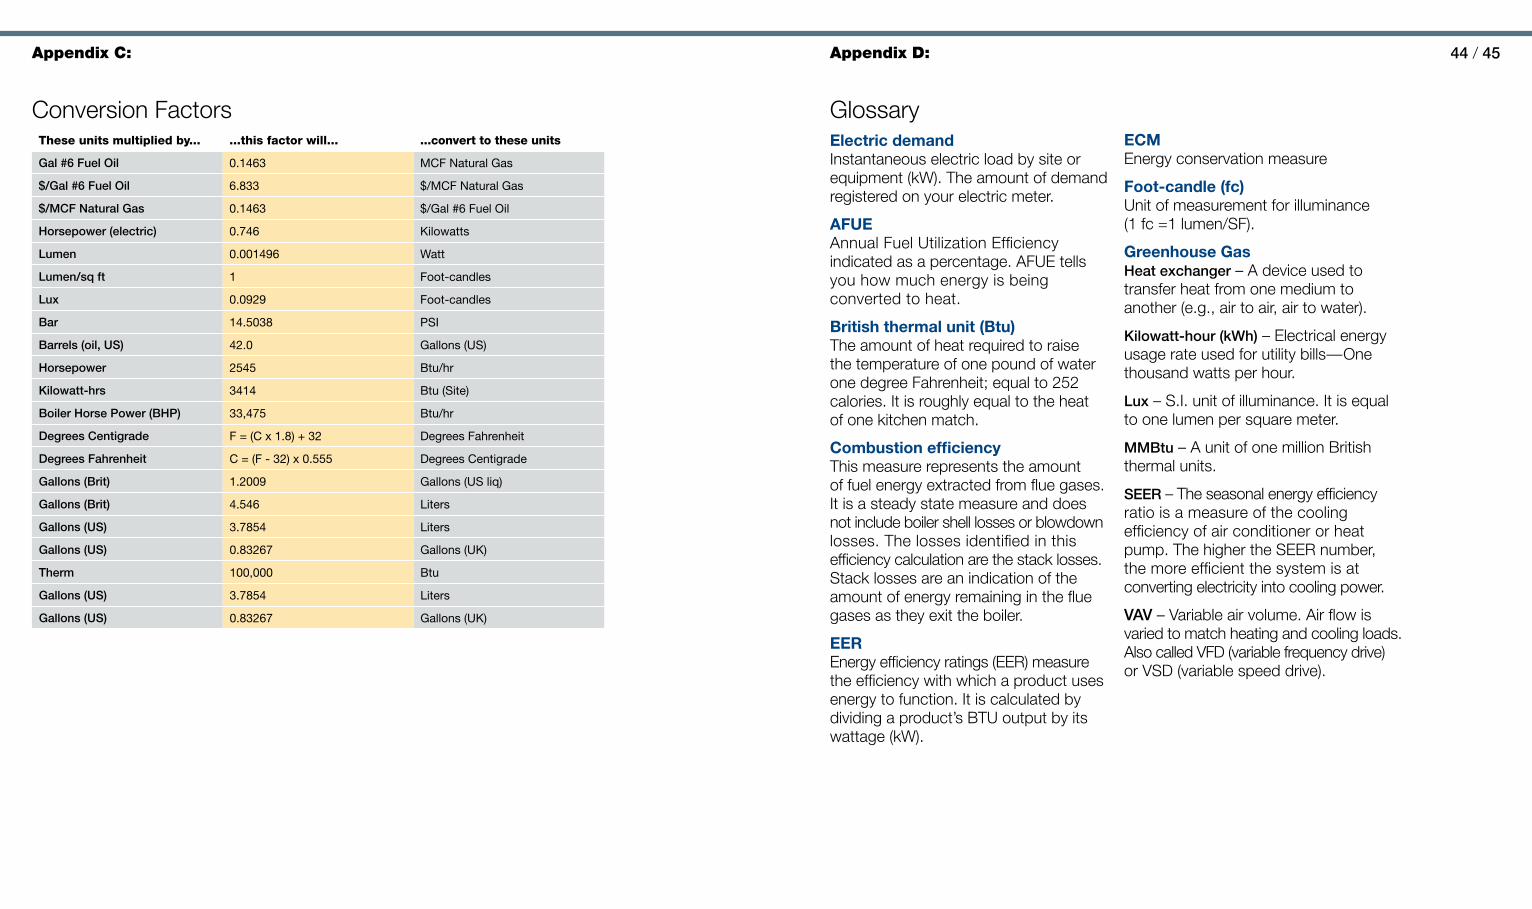
GlossaryElectric demand Instantaneous electric load by site or equipment (kW). The amount of demand registered on your electric meter.
AFUE Annual Fuel Utilization Efficiency indicated as a percentage. AFUE tells you how much energy is being converted to heat.
British thermal unit (Btu) The amount of heat required to raise the temperature of one pound of water one degree Fahrenheit; equal to 252 calories. It is roughly equal to the heat of one kitchen match.
Combustion efficiency This measure represents the amount of fuel energy extracted from flue gases. It is a steady state measure and does not include boiler shell losses or blowdown losses. The losses identified in this efficiency calculation are the stack losses. Stack losses are an indication of the amount of energy remaining in the flue gases as they exit the boiler.
EER Energy efficiency ratings (EER) measure the efficiency with which a product uses energy to function. It is calculated by dividing a product’s BTU output by its wattage (kW).
Conversion FactorsThese units multiplied by... ...this factor will... ...convert to these units
Gal #6 Fuel Oil 0.1463 mCF natural Gas
$/Gal #6 Fuel Oil 6.833 $/mCF natural Gas
$/MCF Natural Gas 0.1463 $/Gal #6 Fuel oil
Horsepower (electric) 0.746 kilowatts
Lumen 0.001496 Watt
Lumen/sq ft 1 Foot-candles
Lux 0.0929 Foot-candles
Bar 14.5038 PSi
Barrels (oil, US) 42.0 Gallons (uS)
Horsepower 2545 Btu/hr
Kilowatt-hrs 3414 Btu (Site)
Boiler Horse Power (BHP) 33,475 Btu/hr
Degrees Centigrade F = (C x 1.8) + 32 degrees Fahrenheit
Degrees Fahrenheit C = (F - 32) x 0.555 degrees Centigrade
Gallons (Brit) 1.2009 Gallons (uS liq)
Gallons (Brit) 4.546 liters
Gallons (US) 3.7854 liters
Gallons (US) 0.83267 Gallons (uk)
Therm 100,000 Btu
Gallons (US) 3.7854 liters
Gallons (US) 0.83267 Gallons (uk)
Appendix D:
ECM Energy conservation measure
Foot-candle (fc) Unit of measurement for illuminance (1 fc =1 lumen/SF).
Greenhouse GasHeat exchanger – A device used to transfer heat from one medium to another (e.g., air to air, air to water).
Kilowatt-hour (kWh) – Electrical energy usage rate used for utility bills—One thousand watts per hour.
Lux – S.I. unit of illuminance. It is equal to one lumen per square meter.
MMBtu – A unit of one million British thermal units.
SEER – The seasonal energy efficiency ratio is a measure of the cooling efficiency of air conditioner or heat pump. The higher the SEER number, the more efficient the system is at converting electricity into cooling power.
VAV – Variable air volume. Air flow is varied to match heating and cooling loads. Also called VFD (variable frequency drive) or VSD (variable speed drive).
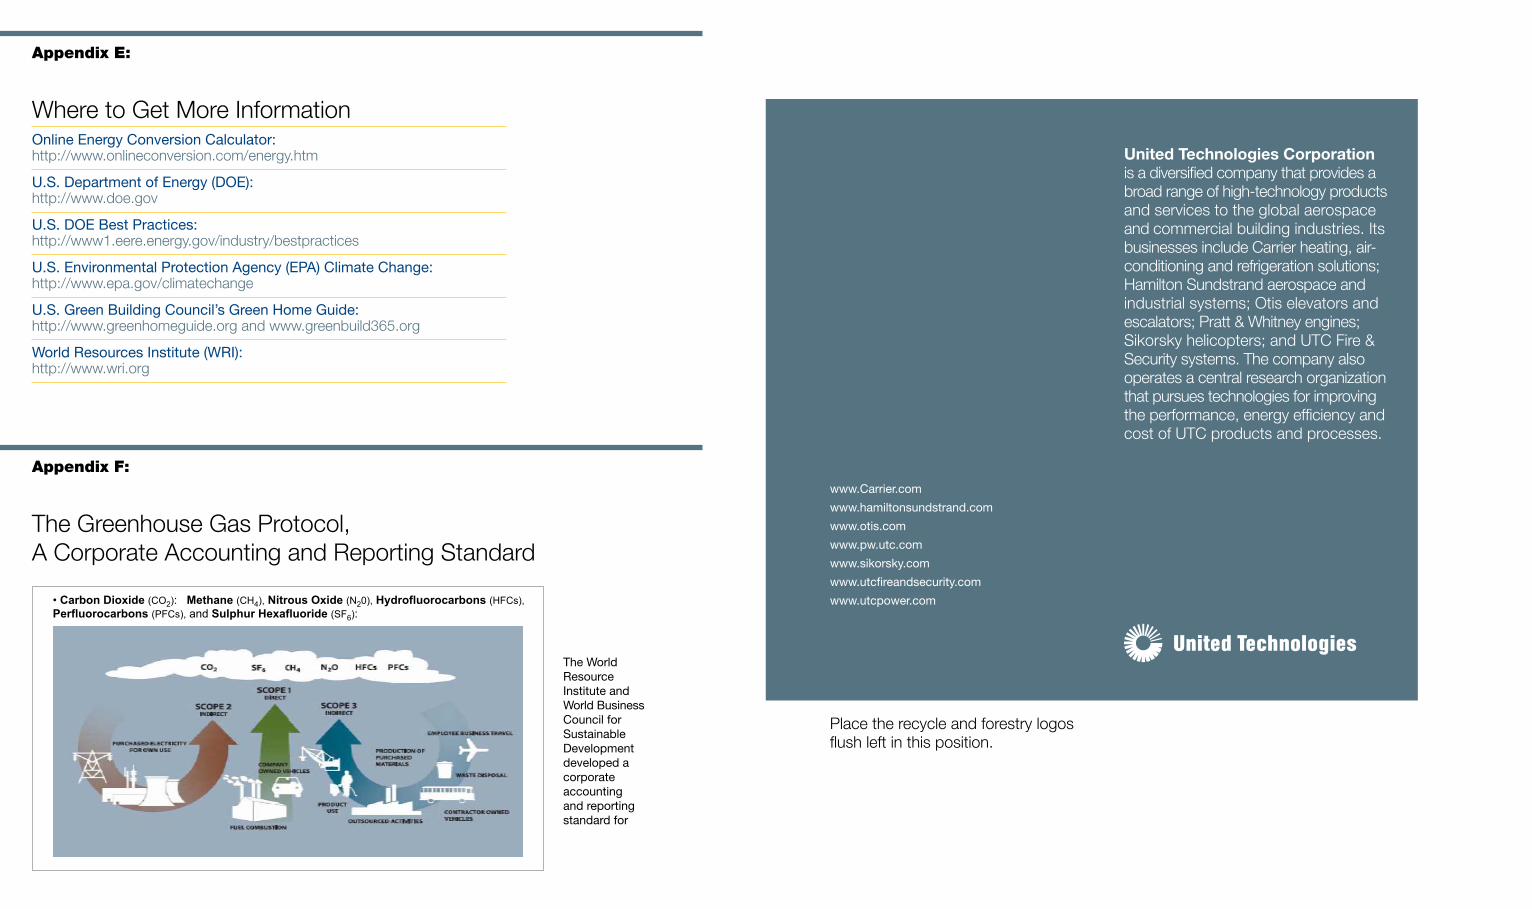
Where to Get More Informationonline energy Conversion Calculator: http://www.onlineconversion.com/energy.htm
u.S. department of energy (doe): http://www.doe.gov
u.S. doe Best Practices: http://www1.eere.energy.gov/industry/bestpractices
u.S. environmental Protection agency (ePa) Climate Change: http://www.epa.gov/climatechange
u.S. Green Building Council’s Green Home Guide: http://www.greenhomeguide.org and www.greenbuild365.org
World resources institute (Wri): http://www.wri.org
Appendix E:
Appendix F:
• Carbon Dioxide (CO2): Methane (CH4), Nitrous Oxide (N20), Hydrofluorocarbons (HFCs), Perfluorocarbons (PFCs), and Sulphur Hexafluoride (SF6):
Greenhouse Gas Protocol WRI-WBCSD
The World Resource Institute and World Business Council for Sustainable Development developed a corporate accounting and reporting standard for GHG inventory. www.wri.org
the World resource institute and World Business Council for Sustainable development developed a corporate accounting and reporting standard for
The Greenhouse Gas Protocol, A Corporate Accounting and Reporting Standard
United Technologies Corporation is a diversified company that provides a broad range of high-technology products and services to the global aerospace and commercial building industries. Its businesses include Carrier heating, air-conditioning and refrigeration solutions; Hamilton Sundstrand aerospace and industrial systems; Otis elevators and escalators; Pratt & Whitney engines; Sikorsky helicopters; and UTC Fire & Security systems. The company also operates a central research organization that pursues technologies for improving the performance, energy efficiency and cost of UTC products and processes.
www.Carrier.com
www.hamiltonsundstrand.com
www.otis.com
www.pw.utc.com
www.sikorsky.com
www.utcfireandsecurity.com
www.utcpower.com
Place the recycle and forestry logos flush left in this position.

© 2011 United Technologies Corporation. All rights reserved. Printed in the U.S.A.
united technologies BuildingHartford, Connecticut 06101u.S.a.www.utc.com
CarrierHamilton SundstrandotisPratt & WhitneySikorskyutC Fire & SecurityutC Power


